Embed Size (px)
Citation preview
BlackRock Global Funds
(BGF)
Audited Annual Report and Accounts
31 August 2009
R.C.S. Luxembourg: B.6317


Contents
Audited Annual Report and Accounts 1
Subscriptions may be made only on the basis of the current Prospectus, together with the most recent audited annual report and accounts and unaudited interim report and accounts. Copies are available
from the Investor Services Centre, the Transfer Agent, the Manager or any of the Distributors.
BGF Chairman’s Letter 2
Investment Managers’ Report 3
Board of Directors 5
Management and Administration 5
Statement of Net Assets 6
Three Year Summary of Net Asset Values 12
Statement of Operations and Changes in Net Assets 26
Statement of Changes in Shares Outstanding 36
Portfolio of Investments
Asian Dragon Fund 49
Asian Tiger Bond Fund 51
China Fund 54
Continental European Flexible Fund 56
Emerging Europe Fund 58
Emerging Markets Fund 60
Emerging Markets Bond Fund 62
Euro Bond Fund 65
Euro Corporate Bond Fund 72
Euro Reserve Fund(1) 78
Euro Short Duration Bond Fund 79
Euro-Markets Fund 86
European Fund 87
European Enhanced Equity Yield Fund 89
European Focus Fund 92
European Growth Fund 93
European Opportunities Fund 95
European Value Fund 99
Fixed Income Global Opportunities Fund 100
Global Allocation Fund 103
Global Corporate Bond Fund 114
Global Dynamic Equity Fund 122
Global Enhanced Equity Yield Fund 131
Global Equity Fund 135
Global Government Bond Fund 137
Global High Yield Bond Fund 141
Global Inflation Linked Bond Fund(1) 146
Global Opportunities Fund 148
Global SmallCap Fund 151
India Fund 154
Japan Fund 155
Japan Small & MidCap Opportunities Fund(2) 157
Japan Value Fund 159
Latin American Fund 160
Local Emerging Markets Short Duration Bond Fund 162
New Energy Fund 165
Pacific Equity Fund 167
Strategic Allocation Fund (Euro) 169
Strategic Allocation Fund (US Dollar) 174
Swiss Opportunities Fund 179
United Kingdom Fund 180
US Basic Value Fund 182
US Dollar Core Bond Fund 183
US Dollar High Yield Bond Fund 192
US Dollar Reserve Fund(2) 198
US Dollar Short Duration Bond Fund 199
US Flexible Equity Fund 203
US Focused Value Fund 205
US Government Mortgage Fund 206
US Growth Fund 208
US Small & MidCap Opportunities Fund(2) 209
US SmallCap Value Fund 212
World Bond Fund 214
World Energy Fund 220
World Financials Fund 222
World Gold Fund 224
World Healthscience Fund 226
World Income Fund 227
World Mining Fund 232
World Technology Fund 234
Notes to the Financial Statements 236
Independent Auditor’s Report 245
General Information 247
(1), (2) See Notes section.

BGF Chairman’s Letter
August 2009
2 BlackRock Global Funds (BGF)
Dear Shareholder
I am delighted to write to you with an update on the activities of BlackRock Global Funds (BGF) over the twelve months to the end
of August 2009. The performance of the Funds is covered in more detail in the separate Investment Manager’s Report. In that
report, you will see that, following a particularly difficult first six months of the BGF’s financial year which affected all markets,
BGF funds performed strongly during the global market rally which commenced in March.
Against this difficult background last August, investors moved to reduce levels of risk in their portfolios and markets entered a
precipitous decline. However, since the bottoming of the market in mid-March, there has been a sustained rally across capital
markets, albeit with volatility remaining at elevated levels. Overall, however, the MSCI World Index (a broad indicator of the
performance of global equity markets) fell 17% in US dollar terms over the twelve month period. As a result, the BGF Fund range
fell from $80 billion to $65 billion in terms of assets under management over the year. However, bond and equity markets have
both improved considerably over the last six months, with the MSCI World Index having rallied 47% in US dollar terms. This rally
has also been reflected in the fortunes of BGF funds, which have seen considerable net inflows in recent months, reversing the
trend of the first six months of the financial year.
The large majority of BGF equity funds saw declines in assets under management over the last twelve months. There were exceptions,
however, including Global Corporate Bond, Euro Short Duration Bond, China and European Funds, which saw assets increase by
862% (from $40,652,075 to $391,004,200), 407% (from $212,606,641 to $1,077,241,015), 359% (from $33,719,461 to $154,665,397) and
322% (from $566,462,364 to $2,389,659,088) respectively. Each of these funds has benefitted from large inflows, as well as from strong
performance.
Investors appeared to recover their risk appetite in the second half of the financial year and moved away from certain bond fund
offerings, particularly those including substantial weightings towards government bonds, which now offer low yields in a historical
context. Net flows into equity funds have, however, been notably positive over the second half of the period.
We continue to manage the BGF equity range actively to make sure that it meets the future needs of our clients. There were two
fund launches, two fund mergers and two fund closures over the period. Chronologically, these were:
Conservative Allocation Fund (USD) and Conservative Allocation Fund (Euro) were merged into Global Allocation Fund (23 January 2009)
Dynamic Reserve Fund was closed (26 January 2009)
Global Capital Securities Absolute Return Fund was closed (24 April 2009)
Global Inflation Linked Bond Fund was launched (19 June 2009)
Euro Reserve Fund (launched 24 July 2009) which resulted from the de-merger of the Euro Hedged portion of Reserve Fund into
this new fund. The US Dollar assets remained in the original fund (itself now renamed US Dollar Reserve Fund).
Should you have any questions on any of this material, please contact us via our website: www.blackrockinternational.com
Yours faithfully,
Nicholas Hall

Audited Annual Report and Accounts 3
Investment Managers’ Report
Performance Overview
1 Sep 2008-31 Aug 2009
A year that will be hard to forget
2008 turned out to be a year that investors would like to forget,
but instead will vividly remember. The seminal event appears
to have been Lehman Brothers’ bankruptcy declaration in
mid-September which forced markets to come to terms with
the fact that high-profile financial institutions could fail.
The confidence, liquidity and stability of the global financial
system subsequently came under severe stress as investors
stampeded from risk.
Lehmans’ collapse sparked a freeze in lending between banks
which led to a wave of bank failures and near-failures. Against
this background, governments around the world pledged
massive sums to underpin the financial system. Despite the
enormity of the sums involved, the various government
initiatives failed to calm investor nerves and the fourth quarter
of 2008 saw global financial markets firmly in the grip of panic.
Markets were dominated by two themes – deleveraging
(scaling back debt) and risk aversion. In this climate, investors
rushed to liquidate their holdings with little regard for value.
This selling into thin and falling markets appeared to heighten
market anxiety, bringing fear-driven investors to the market
and thus exacerbating downward pressure.
As the crisis continued, global monetary and fiscal policy
efforts became more aggressive. These succeeded in
preventing a widespread systemic collapse, but the effects
of the credit crisis on the real economy became severe.
Economic conditions were fragile even before the financial
crisis had reached its peak. As the pressures on banks and
other financial institutions escalated, they responded by
reducing lending and demanding higher borrowing costs,
constraining corporate and consumer access to credit and
thereby impacting their ability to spend. The end result was a
sharp and widespread slowdown in economic activity right
across the developed world and emerging markets, as firms
and individual consumers cut back spending significantly.
It seems no exaggeration to state that demand collapsed
during the fourth quarter of 2008, consequently triggering a
severe global recession. As global industrial production fell
at an almost unprecedented pace, demand for many
commodities, ranging from industrial metals to oil and gas,
slumped.
Going into 2009, global financial markets began to shift their
focus from systemic financial issues to the downside risks
to the global economy. Markets began the year with some
optimism, aided in part by further announcements of global
fiscal and monetary stimulus packages, but subsequently saw
a renewed trend towards risk aversion, as witnessed by further
sell-offs across global equity markets. Investors appeared to
be anticipating a severe global economic recession and
consequent collapse in corporate earnings.
Equity markets touched what now seem to have been their
lows for the current cycle on 6 March 2009. Risk assets
(including equities and credit) subsequently enjoyed a
remarkable rebound as business and consumer confidence
indicators started to improve and investors began to anticipate
the beginnings of a global economic recovery. The genesis
of this optimism lay in the reopening of credit markets,
aggressive reflation policies and a positive second-quarter
earnings season.
By the end of the second quarter, it had become evident that
the risks of a full-blown economic depression had eased
significantly. As emerging economies (particularly China) began
to get back on their feet, demand levels started to creep back
up and recessionary pressures to ease.
Consumption appears to be increasing and there has been a
strong bounce in business confidence, resulting in expectations
that the global economy will grow modestly in the second half
of 2009.
The impact on financial markets
The sell-off triggered by Lehmans’ collapse was
indiscriminate: nearly every asset class, including stocks,
credit-related fixed income, commodities and real estate,
declined during the period under review as a whole. Although
most global equity markets have made very strong gains
in 2009 to date, these have yet to fully offset the declines of
late 2008 and early 2009. Most global equity markets (with the
notable exception of China’s stockmarket) were about 10%-20%
lower by the end of the 12-month period under review.
Within fixed income markets, corporate bond yield spreads
over government bond yields widened to almost unprecedented
levels at the height of the financial crisis as investors
anticipated a surge in corporate defaults. When risk aversion
began to ease, investors began to move out of the safest
government bonds and into higher risk assets. Government
bond yields (which move in the opposite direction to prices)
consequently spiked during the second quarter of 2009, while
investment grade and high yield corporate bonds rallied
sharply.
Equity Fund performance
Our equity funds could not escape the indiscriminate sell-offs
of late 2008 and early 2009. Many of our funds proved more
resilient than their peers, particularly our European equity
funds, which outperformed their respective benchmarks and
many competitor funds over the 12-month period. However,
most of our equity funds had nevertheless registered negative
returns over the period as a whole. The sole exceptions were
the China Fund and the World Gold Fund, with the former
benefiting from the especially sharp rally in Chinese stocks in
the first half of 2009 and the latter from gold’s status as a ‘safe
haven’ asset during periods of financial market turbulence.

4 BlackRock Global Funds (BGF)
Investment Managers’ Report
Performance Overview
1 Sep 2008-31 Aug 2009 continued
Mixed Asset Fund performance
Our diversified Global Allocation Fund, which holds fixed income
assets and cash in addition to stocks, generated more modest
losses than the broader equity market over the 12-month
period. Nevertheless, it ended the period down by just over 5%.
Fixed Income Fund performance
By contrast with our equity funds, most of our fixed income
funds generated healthy positive returns over the 12-month
period as a whole. The exceptions were some of our funds
investing in what were perceived as riskier and less liquid
assets – notably, emerging market debt and high yield
corporate bonds. Within the fixed income space, the standout
performers were the Euro Bond Fund and the Euro Short
Duration Bond Fund, which comfortably outpaced their
benchmarks and many competitor funds.
Outlook
Given the depth and nature of the recession, and the underlying
structural headwinds such as high and rising unemployment,
continued deleveraging and governments looking to repair
fiscal positions with higher rates and spending cuts, scepticism
in the current economic recovery remains high.
Investors are likely to remain sensitive to changes in the
economic data and profit figures, and the debate about the
sustainability and unbalanced nature of the global recovery will
continue for some time.
Against this backdrop, we believe a renewed focus on asset
allocation and risk management is critical. Remaining focused
on long-term goals and sticking with a diversified approach to
maximize the risk/reward balance are strategies that we would
continue to recommend.

Audited Annual Report and Accounts 5
Board of Directors Management
and Administration continued
Chairman
Nicholas Hall (from 1 July 2009)
Independent Director
85 Briarwood Road
London SW4 9PJ
United Kingdom
Robert Fairbairn (until 1 July 2009)
Vice Chairman, Head of BlackRock Global Client Group
BlackRock Financial Management Inc
Park Avenue Plaza, 55 East 52nd Street, New York, NY 10055, USA
Directors
Donald Burke
Independent Director
16 Ivy Court
Langhorne
Pennsylvania 19047
USA
James Charrington
Managing Director, Head of Retail Business, EMEA Pacific
BlackRock Investment Management (UK) Limited
33 King William Street, London EC4R 9AS, UK
Frank P. Le Feuvre
Managing Director
BlackRock (Channel Islands) Limited
Forum House, Grenville Street, St. Helier, Jersey JE1 0BR,
Channel Islands
Emilio Novela Berlin
Independent Director
Paseo de la Castellana 40 bis – 4a Planta, 28046 Madrid, Spain
Geoffrey Radcliffe
Managing Director
BlackRock (Luxembourg) S.A.
6D route de Trèves, L-2633 Senningerberg,
Grand Duchy of Luxembourg
Jean-Claude Wolter
Avocat Honoraire
11B boulevard Joseph II, L-1840 Luxembourg
Grand Duchy of Luxembourg
Management and Administration
Management Company
BlackRock (Luxembourg) S.A.
6D route de Trèves, L-2633 Senningerberg,
Grand Duchy of Luxembourg
Investment Advisers
BlackRock Financial Management, Inc.,
Park Avenue Plaza, 55 East 52nd Street, New York, NY 10055, USA
BlackRock International, Ltd
40 Torphichen Street, Edinburgh EH3 8JB, Scotland
BlackRock Investment Management, LLC
800 Scudders Mill Road, Plainsboro, NJ 08536, USA
BlackRock Investment Management (UK) Limited
33 King William Street, London EC4R 9AS, UK
BlackRock (Hong Kong) Limited: Suites 3210-12 Tower 6,
The Gateway Tsimshatsui, Kowloon Hong-Kong, China
BlackRock Japan Co. Limited: Sapia Tower 1-7-12
Marunouchi – Chiyoda-ku Tokyo, 100-0005 Japan
Principal Distributor and Investment Manager*
BlackRock (Channel Islands) Limited
Forum House, Grenville Street, St. Helier, Jersey JE1 0BR,
Channel Islands
Investor Services
Written Enquiries: BlackRock Investment
Management (UK) Limited,
c/o BlackRock (Luxembourg) S.A.,
P.O. Box 1058, L-1010 Luxembourg,
Grand Duchy of Luxembourg
All other enquiries: Telephone: + 44 207 743 3300,
Fax: + 44 207 743 1143
Custodian
The Bank of New York Mellon (International) Ltd,
Luxembourg Branch
Aerogolf Center, 1A Hoehenhof, L-1736 Senningerberg,
Grand Duchy of Luxembourg
Fund Accountant
The Bank of New York Mellon (International) Ltd,
Luxembourg Branch
Aerogolf Center, 1A Hoehenhof, L-1736 Senningerberg,
Grand Duchy of Luxembourg
Transfer Agent and Registrar
J.P. Morgan Bank Luxembourg S.A.
6C, route de Trèves, L-2633 Senningerberg,
Grand Duchy of Luxembourg
Independent Auditor
PricewaterhouseCoopers S.à r.l.
Réviseur d’entreprises
400 route d’Esch, L-1471 Luxembourg
Grand Duchy of Luxembourg
Legal Advisers
In Luxembourg
Linklaters LLP
35, Avenue John F. Kennedy, L-1855 Luxembourg
Grand Duchy of Luxembourg
Listing Agent
J.P. Morgan Bank Luxembourg S.A.
6C, route de Trèves, L-2633 Senningerberg,
Grand Duchy of Luxembourg
Paying Agents
A list of Paying Agents is to be found on page 247.
Registered Office
Aerogolf Center, 1A Hoehenhof, L-1736 Senningerberg,
Grand Duchy of Luxembourg
*On 1 August 2009, BlackRock (Channel Islands) Limited retired as Investment Manager. From this date BlackRock (Luxembourg) S.A. has appointed
and will oversee the Investment Advisers to the Company directly.

6 BlackRock Global Funds (BGF)
Statement of Net Assets as at 31 August 2009
61,595,668,556 439,992,649 66,984,050 145,172,583 102,185,554 1,593,753,202 705,082,952 130,052,580 715,669,349 54,895,496
2,766,165,913 28,697,664 2,720,140 8,122,879 19,618,155 (4,314,858) 93,463,740 4,247,941 20,253,946 (501,395)
2(a) 64,361,834,469 468,690,313 69,704,190 153,295,462 121,803,709 1,589,438,344 798,546,692 134,300,521 735,923,295 54,394,101
2(a) 841,026,653 4,504,097 17,686,344 733,799 2,045,924 2,324,095 21,078,880 29,754,316 9,789,652 138,132
2(a) 29,208,059 – – – – – – – – –
2(a) 220,151,328 1,258,615 1,222,535 61,864 14,855 9,911,755 2,147,436 2,459,182 13,120,298 1,238,796
2(a) 559,738,022 6,557,611 – 139,141 876,915 6,948,349 15,643,166 – 677,300 186,000
2(a) 476,997,115 2,568,244 841,969 4,268,902 542,042 7,586,362 15,299,089 136,373 2,939,013 684,506
2(c) 26,210,764 – – – – 993,430 – – – 55,703
2(c) 65,299,087 – – 351,732 – 1,186,615 – – 2,396,763 41,704
2(c) 50,663,208 – 96,452 – – – – 132,464 – –
2(c) 7,264,149 – 54,161 – – – – – – 69,795
2(a,c) 1,241,596 541 – 1,946 1,060 290,119 16,803 2,905 54 2,259
66,639,634,450 483,579,421 89,605,651 158,852,846 125,284,505 1,618,679,069 852,732,066 166,785,761 764,846,375 56,810,996
152,206,729 – – – – 1,597,526 12,922,336 93,870 601,854 2,246
2(a) 21,291,992 1,248,746 98,544 – 285,933 – – 161,591 43,366 2,398
2(a) 707,740,880 6,471,917 – 1,331,756 529,357 7,353,137 18,967,620 1,191,617 204,480 99,943
2(a) 285,876,983 360,214 424,483 2,535,771 1,828,195 6,715,612 6,042,811 17,070 1,036,335 11,112
2(c) 3,140,416 – 32,067 – – – – 83,671 664 –
2(c) 19,403,015 – 196,550 – – – – 84,675 – –
2(c) 65,584,514 – – – – – – – – –
2(c) 6,009,437 – – – – – – 698,331 572,473 –
115,489,111 883,664 199,892 319,922 193,866 3,747,053 1,371,585 394,475 697,753 70,207
1,376,743,077 8,964,541 951,536 4,187,449 2,837,351 19,413,328 39,304,352 2,725,300 3,156,925 185,906
65,262,891,373 474,614,880 88,654,115 154,665,397 122,447,154 1,599,265,741 813,427,714 164,060,461 761,689,450 56,625,090
Asian Continental Emerging EuroAsian Tiger European Emerging Emerging Markets Euro Corporate
Dragon Bond China Flexible Europe Markets Bond Bond BondFund Name Note Fund Fund Fund Fund Fund Fund Fund Fund Fund
US$ US$ US$ US$ € € US$ US$ € €
Assets
Securities portfolio at cost
Unrealised appreciation/(depreciation)
Securities portfolio at market value
Cash at bank
Term deposits
Interest and dividends receivable
Receivable for investments sold
Receivable for Fund shares subscribed
Unrealised gain on:
Futures contracts
Forward foreign exchange contracts
Market value of purchased options/swaptions
Market value of swaps
Other assets
Total assets
Liabilities
Cash owed to bank
Income distribution payable
Payable for investments purchased
Payable for Fund shares redeemed
Unrealised loss on:
Futures contracts
Forward foreign exchange contracts
Market value of written options/swaptions
Market value of swaps
Other liabilities
Total liabilities
Total net assets
BlackRockGlobalFunds
Combined

Audited Annual Report and Accounts 7
The notes on pages 236 to 244 form an integral part of these financial statements.
Statement of Net Assets as at 31 August 2009 continued
210,145,874 698,745,070 1,545,745,317 1,453,417,330 19,625,630 108,619,697 156,699,735 287,732,716 209,733,162 61,391,230
(37,026) 16,815,410 102,514,095 214,006,521 (2,144,997) 13,107,196 10,757,106 19,171,600 29,672,354 (2,131,122)
2(a) 210,108,848 715,560,480 1,648,259,412 1,667,423,851 17,480,633 121,726,893 167,456,841 306,904,316 239,405,516 59,260,108
2(a) 17,773 21,612,106 2,385,310 30,636,702 1,816,295 5,919,660 1,021,707 5,039 1,919,744 2,695,041
2(a) 2,000,000 – – – – – – 17,740,000 – –
2(a) 110,240 10,321,923 418,382 3,495,092 47,125 223,748 179,469 262,413 645,716 370,799
2(a) – 333,000 21,001,759 5,690,016 – 3,156,271 10,760,200 25,311,199 3,085,682 147
2(a) 860,810 10,182,193 4,545,300 35,743,541 – 3,529,769 57,332 2,454,909 2,052,508 653,040
2(c) – – – – 164,937 – – – – 46,258
2(c) – 1,740,891 – – – – – – – 186,457
2(c) – – – – – – – – – 360
2(c) – – – – – – – – – –
2(a,c) – 53,510 321 – 28 747 9,441 22,363 8,158 586
213,097,671 759,804,103 1,676,610,484 1,742,989,202 19,509,018 134,557,088 179,484,990 352,700,239 247,117,324 63,212,796
– 412,904 – – – – – 1,769,436 – 993,684
2(a) – 8,734 18,169 – – – – – 1,756,128 –
2(a) – 2,203,340 – 65,405,099 – 11,280,080 4,652,825 21,383,930 1,221,291 2,563,852
2(a) 464,439 1,678,388 23,666,038 3,002,220 – 47,497 4,936,388 248,027 272,548 26,668
2(c) – 698,122 – – – – – – – –
2(c) – – – – 57,851 – – 27,391 – –
2(c) – – – – 272,447 – – – – –
2(c) – 286,741 – – – – – – – 229,052
109,702 662,612 2,492,716 2,298,453 46,630 187,159 268,105 673,056 383,911 110,170
574,141 5,950,841 26,176,923 70,705,772 376,928 11,514,736 9,857,318 24,101,840 3,633,878 3,923,426
212,523,530 753,853,262 1,650,433,561 1,672,283,430 19,132,090 123,042,352 169,627,672 328,598,399 243,483,446 59,289,370
(1) New Fund launched, see Note 1, for further details.
Euro Short European Fixed IncomeEuro Duration Euro- Enhanced European European European European Global
Reserve Bond Markets European Equity Yield Focus Growth Opportunities Value OpportunitiesFund Name Note Fund(1) Fund Fund Fund Fund Fund Fund Fund Fund Fund
€ € € € € € € € € US$
AssetsSecurities portfolio at cost
Unrealised appreciation/(depreciation)
Securities portfolio at market value
Cash at bank
Term deposits
Interest and dividends receivable
Receivable for investments sold
Receivable for Fund shares subscribed
Unrealised gain on:
Futures contracts
Forward foreign exchange contracts
Market value of purchased options/swaptions
Market value of swaps
Other assets
Total assets
LiabilitiesCash owed to bank
Income distribution payable
Payable for investments purchased
Payable for Fund shares redeemed
Unrealised loss on:
Futures contracts
Forward foreign exchange contracts
Market value of written options/swaptions
Market value of swaps
Other liabilities
Total liabilities
Total net assets

8 BlackRock Global Funds (BGF)
Statement of Net Assets as at 31 August 2009 continued
12,660,586,756 337,281,340 582,060,656 240,943,651 213,344,543 363,334,307 293,566,634 52,187,630 83,520,481 192,614,038
(187,616,437) 41,715,787 (29,470,679) (3,340,312) 14,558,214 20,778,150 (21,763,258) 1,386,569 11,534,260 13,761,705
2(a) 12,472,970,319 378,997,127 552,589,977 237,603,339 227,902,757 384,112,457 271,803,376 53,574,199 95,054,741 206,375,743
2(a) 35,785,358 18,079,858 1,660,408 15,972,397 1,352,875 27,716,709 7,522,985 98 3,995,481 8,574,472
2(a) – – – – – – – – – –
2(a) 45,646,842 8,005,721 987,448 645,787 365,620 3,583,024 6,151,183 257,323 168,764 197,536
2(a) 9,439,078 132,889 60,326 – 8,824,665 – 319,042 360,221 917,728 473,297
2(a) 33,067,049 2,144,807 974,038 202,410 2,062,784 1,739,839 1,484,535 1,256,307 577,104 550,333
2(c) 17,435,220 – 5,173,974 810,649 – 58,580 – – – –
2(c) 40,664,274 – 337,567 376,865 39,375 – 1,488,998 119,442 80,401 –
2(c) 45,717,400 – 2,786,476 – – 20,440 – – – –
2(c) 2,793,110 – 174,621 – – – 189,944 – – –
2(a,c) 124,701 35,208 930 1,876 – 26,858 16,638 6,571 7,467 154
12,703,643,351 407,395,610 564,745,765 255,613,323 240,548,076 417,257,907 288,976,701 55,574,161 100,801,686 216,171,535
100,117,035 – 4,712,384 – – 216,153 – 205,875 – –
2(a) 749,822 7,456,333 – – 360,113 44,428 436,471 5,039 – –
2(a) 6,655,305 – 456,040 – 9,367,803 – 133,200 739,905 2,102,875 717,943
2(a) 12,468,145 299,805 2,568,846 256,249 281,085 1,293,931 655,891 – 76,926 102,543
2(c) – 628,531 – – – – – 6,752 – –
2(c) – 6,907,771 – – – 2,312,288 – – – –
2(c) 53,230,006 – 3,255,257 2,216,453 – – – – – –
2(c) – 1,012,938 – – – 1,218,878 – – – –
22,689,168 86,032 936,443 461,056 321,365 485,233 356,149 51,593 172,828 398,509
195,909,481 16,391,410 11,928,970 2,933,758 10,330,366 5,570,911 1,581,711 1,009,164 2,352,629 1,218,995
12,507,733,870 391,004,200 552,816,795 252,679,565 230,217,710 411,686,996 287,394,990 54,564,997 98,449,057 214,952,540
(1) New Fund launched, see Note 1, for further details.
Global GlobalGlobal Global Enhanced Global Global Inflation
Global Corporate Dynamic Equity Global Government High Yield Linked Global GlobalAllocation Bond Equity Yield Equity Bond Bond Bond Opportunities SmallCap
Fund Name Note Fund Fund Fund Fund Fund Fund Fund Fund(1) Fund Fund
US$ US$ US$ US$ US$ US$ US$ US$ US$ US$
Assets
Securities portfolio at cost
Unrealised appreciation/(depreciation)
Securities portfolio at market value
Cash at bank
Term deposits
Interest and dividends receivable
Receivable for investments sold
Receivable for Fund shares subscribed
Unrealised gain on:
Futures contracts
Forward foreign exchange contracts
Market value of purchased options/swaptions
Market value of swaps
Other assets
Total assets
Liabilities
Cash owed to bank
Income distribution payable
Payable for investments purchased
Payable for Fund shares redeemed
Unrealised loss on:
Futures contracts
Forward foreign exchange contracts
Market value of written options/swaptions
Market value of swaps
Other liabilities
Total liabilities
Total net assets

Audited Annual Report and Accounts 9
The notes on pages 236 to 244 form an integral part of these financial statements.
Statement of Net Assets as at 31 August 2009 continued
594,132,971 4,160,357,588 16,991,644,310 20,014,253,758 4,142,732,798 1,048,730,122 4,452,806,841 171,698,974 16,191,332 34,218,542
17,955,908 35,988,662 1,462,384,990 (225,558,258) 717,549,335 (17,680,304) (895,648,138) 24,615,803 696,719 2,457,658
2(a) 612,088,879 4,196,346,250 18,454,029,300 19,788,695,500 4,860,282,133 1,031,049,818 3,557,158,703 196,314,777 16,888,051 36,676,200
2(a) 32,720,033 15,652,440 75,284,738 126,023,200 89,049,597 135,780,233 67,721,948 865,618 1,950,674 3,331,245
2(a) – – – – – – – – – 1,000,000
2(a) 534,900 1,849,630 21,048,988 11,992,270 13,128,857 14,077,156 2,616,082 469,445 76,131 166,722
2(a) – 78,656,632 139,572,115 651,384,431 11,449,615 – – 2,116,467 264,074 548,125
2(a) 264,229 15,155,278 38,882,197 353,024,309 21,443,006 3,207,052 115,274,209 726,088 – 83,560
2(c) – – – – – – – – 168,510 384,759
2(c) – – – – – – – – 44,722 –
2(c) – – – – – 1,757,622 – – 17,744 38,885
2(c) – – – – – 1,673,807 – – – –
2(a,c) 5,588 15 1,690,170 8 1,332 154 – 8,444 3,009 5,445
645,613,629 4,307,660,245 18,730,507,508 20,931,119,718 4,995,354,540 1,187,545,842 3,742,770,942 200,500,839 19,412,915 42,234,941
1 15,840 – – 10,063,875 6,491,402 – 1,093,187 138,643 40,616
2(a) – – – – 355,914 2,442,237 – – – –
2(a) 1,970,478 40,405,560 – 609,133,608 34,162,375 4,716,415 11,122,171 3,253,898 143,420 294,268
2(a) 1,428,557 222,391,047 116,980,234 16,422,589 51,741,255 6,103,123 13,603,385 93,458 5,098 11,426
2(c) – – – – – 595,649 – – – –
2(c) – 2,219,425 23,784,284 7,004,397 – 8,333,737 – – – 92,272
2(c) – – – – 2,304,000 – – – 25,876 56,100
2(c) – – – – – – – – 14,110 29,284
1,354,087 8,308,138 40,353,026 35,634,971 9,176,500 5,275,969 6,791,223 328,143 37,502 77,568
4,753,123 273,340,010 181,117,544 668,195,565 107,803,919 33,958,532 31,516,779 4,768,686 364,649 601,534
640,860,506 4,034,320,235 18,549,389,964 20,262,924,153 4,887,550,621 1,153,587,310 3,711,254,163 195,732,153 19,048,266 41,633,407
(2) Fund name changed, see Note 1, for further details.
Japan Local Emerging Strategic StrategicSmall & MidCap Japan Latin Markets Short New Pacific Allocation Allocation
India Japan Opportunities Value American Duration Bond Energy Equity Fund FundFund Name Note Fund Fund Fund(2) Fund Fund Fund Fund Fund (Euro) (US Dollar)
US$ ¥ ¥ ¥ US$ US$ US$ US$ € US$
Assets
Securities portfolio at cost
Unrealised appreciation/(depreciation)
Securities portfolio at market value
Cash at bank
Term deposits
Interest and dividends receivable
Receivable for investments sold
Receivable for Fund shares subscribed
Unrealised gain on:
Futures contracts
Forward foreign exchange contracts
Market value of purchased options/swaptions
Market value of swaps
Other assets
Total assets
Liabilities
Cash owed to bank
Income distribution payable
Payable for investments purchased
Payable for Fund shares redeemed
Unrealised loss on:
Futures contracts
Forward foreign exchange contracts
Market value of written options/swaptions
Market value of swaps
Other liabilities
Total liabilities
Total net assets

10 BlackRock Global Funds (BGF)
Statement of Net Assets as at 31 August 2009 continued
110,832,160 231,214,225 1,378,166,432 292,614,919 752,910,660 266,387,978 96,457,951 2,077,054,604 157,272,269 177,019,761
14,685,869 13,001,933 74,640,986 (4,320,661) (22,590,894) (166,609) (6,556,625) 104,339,123 5,313,655 463,519
2(a) 125,518,029 244,216,158 1,452,807,418 288,294,258 730,319,766 266,221,369 89,901,326 2,181,393,727 162,585,924 177,483,280
2(a) 7,360,398 6,743,893 25,202,807 899,701 18,650,252 8,927,665 1,147,093 345,013 11,947,818 745,870
2(a) – – – – – – – – – –
2(a) – 1,222,336 2,933,664 2,076,638 16,113,572 211,702 709,658 3,868,806 354,180 2,115,750
2(a) 1,388,387 359,620 – 52,797,789 1,720,494 – – 25,674,428 4,278,260 263,060,773
2(a) 51,980 364,327 5,488,851 5,047,653 6,044,582 1,371,893 189,527 16,566,049 365,303 526,464
2(c) – – – – – – 325,645 – – –
2(c) – – 444,978 – 2,636,506 – – 3,836,123 91,515 1,259
2(c) – – – 48,410 – – 12,703 – – –
2(c) – – – 960,670 426,845 – – – – 891,255
2(a,c) – 66,630 1,936 10,703 81,473 2,745 5,497 59,591 376 26,430
134,318,794 252,972,964 1,486,879,654 350,135,822 775,993,490 276,735,374 92,291,449 2,231,743,737 179,623,376 444,851,081
– – – 2,340,106 – – – 785,520 – 961,679
2(a) – 1,285,203 843,092 244,276 225,020 – 37,233 – 47 342,600
2(a) 4,601,497 609,956 – 66,610,147 2,110,500 6,999,374 – 30,162,764 – 256,671,810
2(a) 161,246 3,814,471 726,844 381,947 5,249,123 3,972,582 856,910 11,030,712 13,386,563 1,129,686
2(c) – – – 14,553 – – – – – 19,297
2(c) – – – 65,434 – 422,916 3,214 – – –
2(c) – – – – – – 3,375 – – –
2(c) – – – – – – 16,658 – – –
194,393 357,955 2,318,847 656,486 984,364 152,534 109,050 3,391,894 290,972 286,205
4,957,136 6,067,585 3,888,783 70,312,949 8,569,007 11,547,406 1,026,440 45,370,890 13,677,582 259,411,277
129,361,658 246,905,379 1,482,990,871 279,822,873 767,424,483 265,187,968 91,265,009 2,186,372,847 165,945,794 185,439,804
(2) Fund name changed, see Note 1, for further details.
US US Dollar US Dollar US Dollar US US USSwiss United Basic Core High Yield US Dollar Short Duration Flexible Focused Government
Opportunities Kingdom Value Bond Bond Reserve Bond Equity Value MortgageFund Name Note Fund Fund Fund Fund Fund Fund(2) Fund Fund Fund Fund
CHF £ US$ US$ US$ US$ US$ US$ US$ US$
Assets
Securities portfolio at cost
Unrealised appreciation/(depreciation)
Securities portfolio at market value
Cash at bank
Term deposits
Interest and dividends receivable
Receivable for investments sold
Receivable for Fund shares subscribed
Unrealised gain on:
Futures contracts
Forward foreign exchange contracts
Market value of purchased options/swaptions
Market value of swaps
Other assets
Total assets
Liabilities
Cash owed to bank
Income distribution payable
Payable for investments purchased
Payable for Fund shares redeemed
Unrealised loss on:
Futures contracts
Forward foreign exchange contracts
Market value of written options/swaptions
Market value of swaps
Other liabilities
Total liabilities
Total net assets

Audited Annual Report and Accounts 11
The notes on pages 236 to 244 form an integral part of these financial statements.
Statement of Net Assets as at 31 August 2009 continued
210,002,291 160,128,297 36,221,972 187,201,953 3,547,356,659 235,216,800 4,120,021,240 280,382,926 297,952,349 9,065,491,326 72,643,704
7,246,396 18,367,921 (2,034,751) 8,717,472 (237,811,778) 2,794,392 1,487,370,476 19,786,288 13,282,568 765,984,509 8,599,826
2(a) 217,248,687 178,496,218 34,187,221 195,919,425 3,309,544,881 238,011,192 5,607,391,716 300,169,214 311,234,917 9,831,475,835 81,243,530
2(a) 4,575,109 15,480,811 1,423,822 6,665,660 13,141,913 3,692,444 12,926,418 5,474,444 7,068,295 36,678,078 2,659,607
2(a) – – – – – – – – – – –
2(a) 244,534 111,685 20,631 2,278,894 10,733,123 393,476 2,810,523 108,394 4,479,383 6,382,798 68,113
2(a) 1,454,360 1,674,376 490,825 23,697,654 – 2,640,966 – – – – 2,147,346
2(a) 4,318,692 19,417,046 22,012 409,951 20,349,557 3,412,962 11,434,406 5,855,467 3,408,769 56,773,701 438,838
2(c) – – – – – – – – – – –
2(c) – – – – 949,013 – 2,523,379 – 1,224,612 2,214,818 –
2(c) – – – 12,040 – – – – 14,600 – –
2(c) – – – – – – – – – – –
2(a,c) 826 607 110 1,180 – 31,662 6,577 23,800 22,919 9,229 6,616
227,842,208 215,180,743 36,144,621 228,984,804 3,354,718,487 248,182,702 5,637,093,019 311,631,319 327,453,495 9,933,534,459 86,564,050
– – – 10,512 – 183,936 14 – 4,511,657 – –
2(a) – – – 11,259 449 – – – 866,358 254,148 –
2(a) 7,227,032 29,976,517 343,603 20,710,667 – 852,348 93,927 958,614 – – 2,910,502
2(a) 67,314 158,705 300,448 234,824 9,405,873 10,477,044 20,625,928 1,367,990 349,230 32,758,138 85,757
2(c) – – – 173,138 – – – – 588,207 – –
2(c) – – – 507,366 – – – – – – –
2(c) – – – – – – – – – 4,093,025 –
2(c) – – – 572,963 – – – – 983,371 – –
346,511 276,610 86,257 234,339 5,647,373 435,061 10,494,982 529,345 254,555 17,952,287 169,002
7,640,857 30,411,832 730,308 22,455,068 15,053,695 11,948,389 31,214,851 2,855,949 7,553,378 55,057,598 3,165,261
220,201,351 184,768,911 35,414,313 206,529,736 3,339,664,792 236,234,313 5,605,878,168 308,775,370 319,900,117 9,878,476,861 83,398,789
(2) Fund name changed, see Note 1, for further details.
US USUS Small & MidCap SmallCap World World World World World World World World
Growth Opportunities Value Bond Energy Financials Gold Healthscience Income Mining TechnologyFund Name Note Fund Fund(2) Fund Fund Fund Fund Fund Fund Fund Fund Fund
US$ US$ US$ US$ US$ US$ US$ US$ US$ US$ US$
Assets
Securities portfolio at cost
Unrealised appreciation/(depreciation)
Securities portfolio at market value
Cash at bank
Term deposits
Interest and dividends receivable
Receivable for investments sold
Receivable for Fund shares subscribed
Unrealised gain on:
Futures contracts
Forward foreign exchange contracts
Market value of purchased options/swaptions
Market value of swaps
Other assets
Total assets
Liabilities
Cash owed to bank
Income distribution payable
Payable for investments purchased
Payable for Fund shares redeemed
Unrealised loss on:
Futures contracts
Forward foreign exchange contracts
Market value of written options/swaptions
Market value of swaps
Other liabilities
Total liabilities
Total net assets

12 BlackRock Global Funds (BGF)
Three Year Summary of Net Asset Values
as at 31 August 2009
31 August 200731 August 200831 August 2009Currency
Asian Dragon Fund
Total net assets
Net asset value per:
A Class non-distributing share
A Class UK distributor status share
B Class non-distributing share
C Class non-distributing share
D Class non-distributing share
E Class non-distributing share
Q Class non-distributing share
Asian Tiger Bond Fund
Total net assets
Net asset value per:
A Class distributing (D) share
A Class distributing (M) share
A Class non-distributing share
B Class distributing (D) share
B Class non-distributing share
C Class distributing (D) share
C Class non-distributing share
E Class non-distributing share
Q Class distributing (D) share
Q Class non-distributing share
China Fund
Total net assets
Net asset value per:
A Class non-distributing share
A Class EUR hedged non-distributing share
A Class SGD hedged non-distributing share
A Class HKD unhedged non-distributing share
A Class UK distributor status GBP hedged share
B Class non-distributing share
B Class EUR hedged non-distributing share
B Class SGD hedged non-distributing share
C Class non-distributing share
C Class EUR hedged non-distributing share
C Class SGD hedged non-distributing share
E Class EUR hedged non-distributing share
Continental European Flexible Fund
Total net assets
Net asset value per:
A Class non-distributing share
A Class UK distributor status share
B Class non-distributing share
C Class non-distributing share
D Class non-distributing share
E Class non-distributing share
Emerging Europe Fund
Total net assets
Net asset value per:
A Class distributing (A) share
A Class non-distributing share
A Class UK distributor status share
B Class non-distributing share
C Class non-distributing share
D Class non-distributing share
E Class non-distributing share
I Class non-distributing share
J Class non-distributing share
Q Class non-distributing share
X Class non-distributing share
USD 474,614,880 435,724,999 692,746,343
USD 21.48 23.29 29.06
GBP 12.83 12.47 14.08
USD 18.85 20.65 26.03
USD 18.47 20.28 25.62
USD 21.73 22.36 –
USD 20.71 22.57 28.31
USD 19.50 21.25 26.65
USD 88,654,115 58,596,602 75,879,435
USD 10.49 10.28 10.46
USD 10.50 10.29 10.48
USD 24.61 22.86 22.16
USD 10.63 10.42 10.60
USD 22.22 20.85 20.41
USD 10.63 10.42 10.60
USD 21.83 20.53 20.15
USD 23.77 22.18 21.62
USD 10.51 10.30 10.48
USD 22.93 21.41 20.87
USD 154,665,397 33,719,460 –
USD 10.23 9.19 –
EUR 9.95 9.20 –
SGD 9.89 9.14 –
HKD 10.39 9.30 –
GBP 10.02 9.23 –
USD 10.10 9.17 –
EUR 9.83 9.18 –
SGD 9.77 9.13 –
USD 10.06 9.17 –
EUR – 9.18 –
SGD 9.74 9.12 –
EUR 9.92 – –
EUR 122,447,154 81,436,239 146,524,404
EUR 8.58 8.64 10.33
GBP 7.41 6.87 6.93
EUR 8.26 8.40 10.15
EUR 8.21 8.38 10.14
EUR 8.63 – –
EUR 8.41 8.51 10.23
EUR 1,599,265,741 2,868,755,801 5,087,893,201
EUR 67.43 – –
EUR 67.43 94.45 118.73
GBP 59.56 76.34 80.69
EUR 59.85 84.67 107.50
EUR 58.82 83.44 106.19
EUR 69.73 96.69 120.27
EUR 63.94 90.02 113.71
EUR – 94.65 –
EUR 72.28 99.14 122.04
EUR 58.66 83.35 106.26
EUR 74.12 101.70 125.13

Audited Annual Report and Accounts 13
The notes on pages 236 to 244 form an integral part of these financial statements.
(1) New Fund launched, see Note 1, for further details.
Three Year Summary of Net Asset Values
as at 31 August 2009 continued
31 August 200731 August 200831 August 2009Currency
Emerging Markets Fund
Total net assets
Net asset value per:
A Class non-distributing share
B Class non-distributing share
C Class non-distributing share
D Class non-distributing share
E Class non-distributing share
Q Class non-distributing share
Emerging Markets Bond Fund
Total net assets
Net asset value per:
A Class distributing (D) share
A Class distributing (M) share
A Class non-distributing share
A Class EUR hedged non-distributing share
B Class distributing (D) share
B Class non-distributing share
C Class distributing (D) share
C Class non-distributing share
D Class non-distributing share
E Class non-distributing share
Q Class distributing (D) share
X Class non-distributing share
X Class EUR hedged non-distributing share
Euro Bond Fund
Total net assets
Net asset value per:
A Class distributing (D) share
A Class distributing (M) share
A Class non-distributing share
B Class distributing (D) share
B Class non-distributing share
C Class distributing (D) share
C Class non-distributing share
D Class non-distributing share
E Class non-distributing share
Q Class distributing (D) share
Q Class non-distributing share
X Class non-distributing share
Euro Corporate Bond Fund
Total net assets
Net asset value per:
A Class distributing (D) share
A Class distributing (M) share
A Class non-distributing share
B Class distributing (D) share
B Class non-distributing share
C Class non-distributing share
E Class non-distributing share
X Class non-distributing share
Euro Reserve Fund(1)
Total net assets
Net asset value per:
A Class non-distributing share
B Class non-distributing share
C Class non-distributing share
D Class non-distributing share
E Class non-distributing share
Q Class non-distributing share
USD 813,427,714 900,613,671 835,803,449
USD 23.91 25.87 29.01
USD 21.67 23.68 26.82
USD 21.12 23.15 26.28
USD 24.54 26.35 –
USD 22.68 24.67 27.80
USD 20.87 22.87 25.96
USD 164,060,461 143,927,644 95,439,139
USD 7.95 8.16 8.15
USD 8.21 8.43 8.44
USD 10.46 10.05 9.55
EUR 10.52 – –
USD 7.95 8.16 8.16
USD 9.94 9.66 9.27
USD 7.95 8.16 8.15
USD 9.84 9.58 9.21
USD 10.59 10.12 –
USD 10.23 9.89 9.44
USD 7.94 8.15 8.15
USD 10.63 10.08 –
EUR 10.60 10.22 –
EUR 761,689,450 778,514,157 550,165,106
EUR 15.01 13.95 14.22
EUR 15.01 13.96 14.20
EUR 19.56 17.55 17.27
EUR 14.68 13.65 13.92
EUR 17.35 15.71 15.62
EUR 14.69 13.66 13.92
EUR 17.03 15.46 15.41
EUR 19.74 17.65 17.29
EUR 18.56 16.73 16.55
EUR 14.65 13.62 13.89
EUR 16.74 15.27 15.27
EUR 19.98 17.76 17.32
EUR 56,625,090 32,868,154 20,900,640
EUR 10.47 10.42 –
EUR 10.27 10.21 10.15
EUR 11.11 10.55 10.83
EUR 9.04 9.00 9.62
EUR 10.41 9.99 10.36
EUR 10.29 9.90 10.28
EUR 10.78 10.28 10.61
EUR 11.17 – –
EUR 212,523,530 – –
EUR 73.35 – –
EUR 73.34 – –
EUR 70.19 – –
EUR 73.41 – –
EUR 71.72 – –
EUR 73.04 – –

14 BlackRock Global Funds (BGF)
Three Year Summary of Net Asset Values
as at 31 August 2009 continued
31 August 200731 August 200831 August 2009Currency
Euro Short Duration Bond Fund
Total net assets
Net asset value per:
A Class distributing (D) share
A Class distributing (M) share
A Class non-distributing share
B Class distributing (D) share
B Class non-distributing share
C Class distributing (D) share
C Class non-distributing share
D Class non-distributing share
E Class non-distributing share
Q Class non-distributing share
X Class non-distributing share
Euro-Markets Fund
Total net assets
Net asset value per:
A Class distributing (A) share
A Class non-distributing share
B Class non-distributing share
C Class non-distributing share
D Class non-distributing share
E Class non-distributing share
Q Class non-distributing share
European Fund
Total net assets
Net asset value per:
A Class non-distributing share
B Class non-distributing share
C Class non-distributing share
D Class non-distributing share
E Class non-distributing share
I Class non-distributing share
Q Class non-distributing share
European Enhanced Equity Yield Fund
Total net assets
Net asset value per:
A Class distributing (Q) share
A Class GBP hedged distributing (Q) share
A Class USD hedged distributing (Q) share
A Class non-distributing share
A Class GBP hedged non-distributing share
A Class USD hedged non-distributing share
B Class distributing (Q) share
B Class GBP hedged distributing (Q) share
B Class USD hedged distributing (Q) share
B Class non-distributing share
B Class USD hedged non-distributing share
C Class distributing (Q) share
C Class GBP hedged distributing (Q) share
C Class USD hedged distributing (Q) share
C Class non-distributing share
C Class GBP hedged non-distributing share
C Class USD hedged non-distributing share
E Class non-distributing share
EUR 753,853,262 144,636,298 52,057,283
EUR 11.39 10.51 10.61
EUR 11.41 10.55 10.62
EUR 13.65 12.22 11.96
EUR 11.00 10.13 10.23
EUR 12.17 11.00 10.87
EUR 10.75 9.91 10.00
EUR 11.96 10.84 10.74
EUR 13.73 12.24 –
EUR 13.04 11.73 11.53
EUR – 10.77 10.71
EUR 13.67 – –
EUR 1,650,433,561 1,238,046,589 394,269,364
EUR 13.15 15.08 18.46
EUR 14.07 15.87 19.14
EUR 12.57 14.31 17.44
EUR 12.40 14.17 17.30
EUR 14.46 16.19 19.34
EUR 13.40 15.19 18.41
EUR 12.63 14.37 17.49
EUR 1,672,283,430 385,364,346 769,848,204
EUR 61.66 66.35 81.55
EUR 54.75 59.49 73.87
EUR 53.88 58.70 73.07
EUR 63.37 67.67 82.42
EUR 58.57 63.33 78.23
EUR 61.89 – –
EUR 55.12 59.84 74.22
EUR 19,132,090 26,544,072 –
EUR 6.02 7.39 –
GBP 6.02 7.39 –
USD 6.03 7.35 –
EUR 6.98 7.84 –
GBP 6.99 7.87 –
USD 7.12 7.76 –
EUR 6.02 7.37 –
GBP 6.02 7.38 –
USD 6.03 7.34 –
EUR 6.85 7.78 –
USD 6.99 7.70 –
EUR 6.02 7.37 –
GBP 6.02 7.38 –
USD 6.03 7.34 –
EUR 6.83 7.76 –
GBP 6.83 7.78 –
USD 6.96 7.68 –
EUR 6.90 7.79 –

Audited Annual Report and Accounts 15
The notes on pages 236 to 244 form an integral part of these financial statements.
Three Year Summary of Net Asset Values
as at 31 August 2009 continued
31 August 200731 August 200831 August 2009Currency
European Focus Fund
Total net assets
Net asset value per:
A Class non-distributing share
A Class UK distributor status share
B Class non-distributing share
C Class non-distributing share
D Class non-distributing share
E Class non-distributing share
European Growth Fund
Total net assets
Net asset value per:
A Class non-distributing share
B Class non-distributing share
C Class non-distributing share
D Class non-distributing share
E Class non-distributing share
European Opportunities Fund
Total net assets
Net asset value per:
A Class non-distributing share
B Class non-distributing share
C Class non-distributing share
D Class non-distributing share
E Class non-distributing share
Q Class non-distributing share
European Value Fund
Total net assets
Net asset value per:
A Class distributing (A) share
A Class non-distributing share
A Class UK distributor status share
B Class non-distributing share
C Class non-distributing share
D Class non-distributing share
E Class non-distributing share
Q Class non-distributing share
Fixed Income Global Opportunities Fund
Total net assets
Net asset value per:
A Class distributing (Q) share
A Class EUR hedged distributing (Q) share
A Class SGD hedged distributing (Q) share
A Class non-distributing share
A Class EUR hedged non-distributing share
A Class SGD hedged non-distributing share
A Class UK distributor status GBP hedged share
B Class distributing (Q) share
B Class EUR hedged distributing (Q) share
B Class non-distributing share
B Class EUR hedged non-distributing share
C Class distributing (Q) share
C Class EUR hedged distributing (Q) share
C Class non-distributing share
C Class EUR hedged non-distributing share
D Class EUR hedged non-distributing share
E Class non-distributing share
E Class EUR hedged non-distributing share
EUR 123,042,352 38,129,177 57,657,764
EUR 11.84 12.42 15.21
GBP – 9.90 10.25
EUR 11.47 12.15 15.03
EUR 11.46 12.17 15.10
EUR 11.94 – –
EUR 11.70 12.33 15.18
EUR 169,627,672 228,130,036 196,531,290
EUR 14.76 17.25 20.86
EUR 13.88 16.38 20.01
EUR 13.72 16.24 19.89
EUR 15.16 17.58 21.06
EUR 14.41 16.93 20.58
EUR 328,598,399 453,584,072 1,116,342,618
EUR 60.28 70.39 91.58
EUR 53.73 63.37 83.27
EUR 53.10 62.78 82.70
EUR 61.06 70.77 –
EUR 57.28 67.22 87.88
EUR 52.74 62.41 82.28
EUR 243,483,446 231,902,791 444,923,192
EUR 28.82 32.77 42.80
EUR 33.13 36.72 46.82
GBP 27.36 28.50 31.20
EUR 28.32 31.71 40.84
EUR 27.79 31.20 40.28
EUR 33.58 36.94 –
EUR 32.11 35.77 45.84
EUR 29.32 32.66 41.85
USD 59,289,370 172,970,917 165,660,982
USD 8.70 9.14 10.05
EUR 6.54 7.00 7.67
SGD 12.73 13.51 15.21
USD 9.91 9.67 10.16
EUR 7.48 7.40 7.75
SGD 14.52 14.33 15.41
GBP – 5.57 –
USD 8.71 9.13 10.02
EUR 6.58 7.04 7.73
USD 9.68 9.54 10.12
EUR 7.35 7.34 7.76
USD 8.65 9.12 10.02
EUR 6.50 6.97 7.64
USD 9.60 9.49 10.09
EUR – – 7.73
EUR 7.56 7.44 –
USD 9.75 9.57 10.10
EUR 7.39 7.35 7.74

16 BlackRock Global Funds (BGF)
Three Year Summary of Net Asset Values
as at 31 August 2009 continued
31 August 200731 August 200831 August 2009Currency
Global Allocation Fund
Total net assets
Net asset value per:
A Class distributing (A) share
A Class EUR hedged distributing (A) share
A Class non-distributing share
A Class CHF hedged non-distributing share
A Class EUR hedged non-distributing share
A Class GBP hedged non-distributing share
A Class SGD hedged non-distributing share
B Class non-distributing share
B Class EUR hedged non-distributing share
C Class non-distributing share
C Class EUR hedged non-distributing share
D Class non-distributing share
D Class EUR hedged non-distributing share
E Class non-distributing share
E Class EUR hedged non-distributing share
J Class non-distributing share
Q Class non-distributing share
X Class non-distributing share
X Class EUR hedged non-distributing share
Global Corporate Bond Fund
Total net assets
Net asset value per:
A Class EUR hedged distributing (A) share
A Class non-distributing share
A Class EUR hedged non-distributing share
D Class non-distributing share
D Class EUR hedged non-distributing share
E Class non-distributing share
E Class EUR hedged non-distributing share
X Class EUR hedged non-distributing share
X Class UK distributor status GBP hedged share
Global Dynamic Equity Fund
Total net assets
Net asset value per:
A Class distributing (A) share
A Class non-distributing share
A Class EUR hedged non-distributing share
B Class non-distributing share
C Class non-distributing share
C Class EUR hedged non-distributing share
D Class non-distributing share
E Class non-distributing share
Q Class non-distributing share
X Class non-distributing share
Global Enhanced Equity Yield Fund
Total net assets
Net asset value per:
A Class distributing (Q) share
A Class EUR hedged distributing (Q) share
A Class non-distributing share
A Class EUR hedged non-distributing share
A Class SGD hedged non-distributing share
B Class distributing (Q) share
B Class non-distributing share
C Class distributing (Q) share
C Class non-distributing share
C Class EUR hedged non-distributing share
D Class non-distributing share
E Class non-distributing share
E Class EUR hedged non-distributing share
USD 12,507,733,870 18,299,447,637 10,685,544,646
USD 36.02 – –
EUR 24.56 26.91 27.19
USD 36.04 38.07 38.21
CHF 8.71 9.44 –
EUR 25.72 27.98 28.10
GBP 19.68 21.27 20.99
SGD 8.88 9.63 9.92
USD 31.96 34.10 34.56
EUR 22.81 25.07 25.43
USD 31.38 33.57 34.11
EUR 22.41 24.69 25.11
USD 36.53 38.32 –
EUR 26.07 28.16 –
USD 34.74 36.90 37.21
EUR 25.82 28.24 28.50
USD 37.39 38.83 38.34
USD 33.10 35.13 35.46
USD 37.14 38.57 –
EUR 26.40 28.24 28.56
USD 391,004,200 40,652,075 –
EUR 8.30 9.15 –
USD 9.18 9.47 –
EUR 9.14 – –
USD 9.20 – –
EUR 9.17 – –
USD 9.09 9.43 –
EUR 9.09 9.50 –
EUR 9.19 – –
GBP 8.14 – –
USD 552,816,795 707,468,949 415,939,911
USD 6.87 – –
USD 10.21 11.78 12.57
EUR 7.46 8.99 –
USD 9.86 11.49 12.38
USD 9.78 11.42 12.34
EUR 7.30 8.91 –
USD 10.30 11.79 –
USD 10.03 11.63 12.47
USD 14.87 17.24 –
USD 10.63 12.05 12.63
USD 252,679,565 417,300,051 778,382,797
USD 6.37 8.37 10.44
EUR 4.91 6.49 8.07
USD 8.22 9.77 11.10
EUR 5.85 7.32 8.31
SGD 7.12 8.79 –
USD 6.36 8.35 10.42
USD 7.99 9.59 11.01
USD 6.36 8.35 10.42
USD 7.93 9.54 10.98
EUR – 7.23 –
USD 8.29 – –
USD 8.11 9.70 11.06
EUR 5.79 7.27 8.30

Audited Annual Report and Accounts 17
The notes on pages 236 to 244 form an integral part of these financial statements.
Three Year Summary of Net Asset Values
as at 31 August 2009 continued
31 August 200731 August 200831 August 2009Currency
Global Equity Fund
Total net assets
Net asset value per:
A Class distributing (A) share
A Class non-distributing share
A Class UK distributor status share
B Class non-distributing share
C Class non-distributing share
D Class non-distributing share
E Class non-distributing share
Q Class non-distributing share
Global Government Bond Fund
Total net assets
Net asset value per:
A Class distributing (D) share
A Class EUR hedged distributing (D) share
A Class distributing (M) share
A Class EUR hedged distributing (M) share
A Class non-distributing share
A Class EUR hedged non-distributing share
B Class distributing (D) share
B Class EUR hedged distributing (D) share
B Class non-distributing share
B Class EUR hedged non-distributing share
C Class distributing (D) share
C Class EUR hedged distributing (D) share
C Class distributing (M) share
C Class non-distributing share
C Class EUR hedged non-distributing share
D Class EUR hedged non-distributing share
E Class non-distributing share
E Class EUR hedged non-distributing share
Q Class distributing (D) share
Q Class EUR hedged distributing (D) share
Q Class non-distributing share
Q Class EUR hedged non-distributing share
Global High Yield Bond Fund
Total net assets
Net asset value per:
A Class distributing (D) share
A Class EUR hedged distributing (D) share
A Class distributing (M) share
A Class EUR hedged distributing (M) share
A Class non-distributing share
A Class EUR hedged non-distributing share
B Class distributing (D) share
B Class EUR hedged distributing (D) share
B Class non-distributing share
B Class EUR hedged non-distributing share
C Class distributing (D) share
C Class EUR hedged distributing (D) share
C Class distributing (M) share
C Class EUR hedged distributing (M) share
C Class non-distributing share
C Class EUR hedged non-distributing share
D Class non-distributing share
D Class GBP hedged non-distributing share
E Class non-distributing share
E Class EUR hedged non-distributing share
I Class non-distributing share
Q Class EUR hedged distributing (D) share
Q Class non-distributing share
Q Class EUR hedged non-distributing share
X Class EUR hedged non-distributing share
USD 230,217,710 187,335,357 355,795,032
USD 5.28 6.43 6.94
USD 5.30 6.44 6.96
GBP 3.22 3.52 3.44
USD 5.11 6.28 6.85
USD 5.06 6.23 6.82
USD 5.34 – –
USD 5.21 6.37 6.90
USD 5.12 6.29 6.85
USD 411,686,996 499,574,308 448,044,093
USD 17.29 16.81 17.02
EUR 16.70 16.21 16.27
USD 17.32 16.80 17.00
EUR 16.56 16.06 16.23
USD 21.68 20.54 20.12
EUR 20.61 19.51 19.05
USD 16.72 16.24 16.46
EUR 16.17 15.71 15.80
USD 19.22 18.40 18.19
EUR 18.25 17.45 17.23
USD 16.53 16.06 16.27
EUR 16.14 15.68 15.77
USD 17.30 – 16.28
USD 18.89 18.13 17.98
EUR 17.98 17.23 17.04
EUR 20.77 19.57 –
USD 20.65 19.67 19.35
EUR 19.55 18.60 18.25
USD 16.67 16.20 16.41
EUR 16.09 15.63 15.74
USD 18.56 17.86 17.81
EUR 17.62 16.94 16.85
USD 287,394,990 257,115,994 224,295,907
USD 6.54 7.49 8.03
EUR 4.82 5.63 6.00
USD 6.57 7.51 8.07
EUR 4.78 5.58 6.01
USD 12.79 13.40 13.50
EUR 9.39 10.04 10.09
USD 6.76 7.74 8.30
EUR 4.98 5.81 6.20
USD 11.58 12.26 12.47
EUR 8.50 9.18 9.31
USD 6.71 7.69 8.25
EUR 4.94 5.77 6.16
USD – – 6.09
EUR 4.81 5.65 –
USD 12.51 13.23 –
EUR 8.44 9.12 9.28
USD 12.81 13.51 13.52
GBP 9.54 10.05 –
USD 12.16 12.80 12.97
EUR 8.93 9.59 9.68
USD – 13.42 –
EUR 4.80 5.60 5.78
USD 11.17 11.87 12.12
EUR 8.20 8.89 9.05
EUR 9.84 10.38 10.28

18 BlackRock Global Funds (BGF)
(1) New Fund launched, see Note 1, for further details.(2) Fund name changed, see Note 1, for further details.
Three Year Summary of Net Asset Values
as at 31 August 2009 continued
31 August 200731 August 200831 August 2009Currency
Global Inflation Linked Bond Fund(1)
Total net assets
Net asset value per:
A Class distributing (M) share
A Class non-distributing share
A Class EUR hedged non-distributing share
C Class distributing (M) share
C Class non-distributing share
D Class non-distributing share
X Class EUR hedged non-distributing share
Global Opportunities Fund
Total net assets
Net asset value per:
A Class non-distributing share
B Class non-distributing share
C Class non-distributing share
D Class non-distributing share
E Class non-distributing share
Q Class non-distributing share
Global SmallCap Fund
Total net assets
Net asset value per:
A Class non-distributing share
B Class non-distributing share
C Class non-distributing share
D Class non-distributing share
E Class non-distributing share
Q Class non-distributing share
India Fund
Total net assets
Net asset value per:
A Class non-distributing share
A Class UK distributor status share
B Class non-distributing share
C Class non-distributing share
D Class non-distributing share
E Class non-distributing share
X Class non-distributing share
Japan Fund
Total net assets
Net asset value per:
A Class non-distributing share
A Class EUR hedged non-distributing share
B Class non-distributing share
C Class non-distributing share
D Class non-distributing share
E Class non-distributing share
Q Class non-distributing share
Japan Small & MidCap Opportunities Fund(2)
Total net assets
Net asset value per:
A Class non-distributing share
A Class EUR hedged non-distributing share
A Class UK distributor status share
B Class non-distributing share
C Class non-distributing share
D Class non-distributing share
E Class non-distributing share
Q Class non-distributing share
USD 54,564,997 – –
USD 10.28 – –
USD 10.40 – –
EUR 10.29 – –
USD 10.27 – –
USD 10.28 – –
USD 10.40 – –
EUR 10.42 – –
USD 98,449,057 134,285,684 122,281,506
USD 28.84 33.07 34.91
USD 25.78 29.85 31.83
USD 25.41 29.51 31.54
USD 28.95 – –
USD 27.44 31.62 33.55
USD 25.28 29.36 31.38
USD 214,952,540 213,734,759 225,386,885
USD 48.97 58.71 61.93
USD 43.99 53.28 56.77
USD 43.30 52.57 56.15
USD 49.38 58.77 –
USD 47.32 57.02 60.45
USD 45.51 54.83 58.14
USD 640,860,506 887,388,403 709,071,512
USD 19.31 20.22 23.90
GBP 11.96 11.14 11.91
USD 18.35 19.41 23.16
USD 18.16 19.25 23.04
USD 19.68 20.46 23.96
USD 19.00 19.99 23.75
USD 19.96 20.54 24.12
JPY 4,034,320,235 8,792,974,775 19,729,415,432
JPY 1,376 1,924 2,657
EUR 10.96 13.76 18.62
JPY 1,225 1,730 2,413
JPY 1,212 1,716 2,401
JPY 1,426 1,977 –
JPY 1,309 1,839 2,554
JPY 1,233 1,739 2,424
JPY 18,549,389,964 23,795,477,305 64,899,809,744
JPY 3,173 3,595 5,405
EUR 22.06 26.24 38.52
GBP 20.99 18.07 23.03
JPY 2,826 3,235 4,912
JPY 2,778 3,187 4,852
JPY 3,214 3,605 –
JPY 3,009 3,427 5,178
JPY 2,764 3,177 4,823

Audited Annual Report and Accounts 19
The notes on pages 236 to 244 form an integral part of these financial statements.
Three Year Summary of Net Asset Values
as at 31 August 2009 continued
31 August 200731 August 200831 August 2009Currency
Japan Value Fund
Total net assets
Net asset value per:
A Class non-distributing share
A Class EUR hedged non-distributing share
A Class UK distributor status share
B Class non-distributing share
C Class non-distributing share
D Class non-distributing share
E Class non-distributing share
E Class EUR hedged non-distributing share
Latin American Fund
Total net assets
Net asset value per:
A Class distributing (A) share
A Class non-distributing share
A Class UK distributor status share
B Class non-distributing share
C Class non-distributing share
D Class non-distributing share
E Class non-distributing share
J Class non-distributing share
Q Class non-distributing share
Local Emerging Markets Short Duration Bond Fund
Total net assets
Net asset value per:
A Class distributing (D) share
A Class distributing (M) share
A Class non-distributing share
A Class EUR hedged non-distributing share
A Class SGD hedged non-distributing share
B Class distributing (D) share
B Class non-distributing share
C Class distributing (D) share
C Class non-distributing share
D Class non-distributing share
E Class non-distributing share
Q Class distributing (D) share
Q Class non-distributing share
X Class distributing (D) share
X Class non-distributing share
New Energy Fund
Total net assets
Net asset value per:
A Class distributing (A) share
A Class non-distributing share
A Class UK distributor status share
B Class non-distributing share
C Class non-distributing share
D Class non-distributing share
D Class UK distributor status share
E Class non-distributing share
I Class non-distributing share
Q Class non-distributing share
X Class non-distributing share
JPY 20,262,924,153 58,304,757,718 119,558,962,395
JPY 824 1,106 1,465
EUR 5.61 7.97 10.36
GBP 5.45 5.56 6.24
JPY 789 1,070 1,431
JPY 779 1,059 1,420
JPY 837 1,114 –
JPY 809 1,091 1,452
EUR 5.54 7.91 10.35
USD 4,887,550,621 5,398,460,100 5,689,548,227
USD 67.26 – –
USD 67.32 79.13 75.14
GBP 40.78 42.73 36.87
USD 58.75 69.76 66.90
USD 58.24 69.32 66.65
USD 68.75 80.21 75.46
USD 64.97 76.76 73.24
USD 71.81 82.72 76.98
USD 61.31 72.25 68.77
USD 1,153,587,310 2,107,667,953 848,526,940
USD 6.39 7.05 6.66
USD 6.44 7.12 –
USD 25.12 26.30 23.31
EUR 9.27 9.87 –
SGD 9.31 9.91 –
USD 6.39 7.05 6.66
USD 24.48 25.89 23.19
USD 6.39 7.05 6.66
USD 24.32 25.78 23.15
USD 25.34 26.39 –
USD 24.80 26.09 23.25
USD 6.38 7.04 6.65
USD 24.43 25.71 22.93
USD 6.39 7.05 –
USD 6.69 – –
USD 3,711,254,163 6,340,507,977 5,624,908,260
USD 8.49 – –
USD 8.48 13.74 12.82
GBP 5.24 7.56 6.38
USD 7.84 12.85 12.11
USD 7.70 12.64 11.94
USD 8.73 14.04 12.98
GBP 5.25 – –
USD 8.14 13.26 12.44
USD 8.59 13.79 –
USD 7.64 12.54 11.85
USD 8.85 14.07 12.86

20 BlackRock Global Funds (BGF)
Three Year Summary of Net Asset Values
as at 31 August 2009 continued
31 August 200731 August 200831 August 2009Currency
Pacific Equity Fund
Total net assets
Net asset value per:
A Class non-distributing share
B Class non-distributing share
C Class non-distributing share
D Class non-distributing share
E Class non-distributing share
Q Class non-distributing share
Strategic Allocation Fund (Euro)
Total net assets
Net asset value per:
A Class non-distributing share
B Class non-distributing share
C Class non-distributing share
E Class non-distributing share
Q Class non-distributing share
Strategic Allocation Fund (US Dollar)
Total net assets
Net asset value per:
A Class non-distributing share
B Class non-distributing share
C Class non-distributing share
E Class non-distributing share
Q Class non-distributing share
Swiss Opportunities Fund
Total net assets
Net asset value per:
A Class non-distributing share
D Class non-distributing share
United Kingdom Fund
Total net assets
Net asset value per:
A Class non-distributing share
A Class UK distributor status share
B Class non-distributing share
C Class non-distributing share
D Class non-distributing share
E Class non-distributing share
Q Class non-distributing share
US Basic Value Fund
Total net assets
Net asset value per:
A Class distributing (A) share
A Class non-distributing share
A Class EUR hedged non-distributing share
A Class UK distributor status share
B Class non-distributing share
B Class EUR hedged non-distributing share
C Class non-distributing share
C Class EUR hedged non-distributing share
D Class non-distributing share
E Class non-distributing share
E Class EUR hedged non-distributing share
Q Class non-distributing share
USD 195,732,153 189,363,195 351,376,162
USD 23.29 25.34 29.43
USD 20.77 22.83 26.78
USD 20.56 22.65 26.63
USD 23.87 25.79 –
USD 22.49 24.60 28.71
USD 21.32 23.35 27.29
EUR 19,048,266 19,124,265 26,252,802
EUR 9.39 9.95 10.89
EUR 8.46 9.06 10.02
EUR 9.00 9.66 10.71
EUR 8.91 9.50 10.45
EUR 8.16 8.77 9.75
USD 41,633,407 42,678,329 52,003,081
USD 23.41 24.90 26.06
USD 20.79 22.34 23.62
USD 20.53 22.13 23.45
USD 22.22 23.76 24.99
USD 20.24 21.86 23.23
CHF 129,361,658 64,238,442 –
CHF 145.18 153.47 –
CHF 146.35 153.55 –
GBP 246,905,379 191,829,227 376,253,033
GBP 50.21 55.66 59.73
GBP 46.84 52.83 58.02
GBP 44.64 49.97 54.17
GBP 44.18 49.59 53.89
GBP 50.88 55.99 –
GBP 47.68 53.12 57.29
GBP 44.89 50.23 54.45
USD 1,482,990,871 1,165,591,190 1,964,018,871
USD 38.98 46.61 55.18
USD 39.19 46.69 55.25
EUR 28.70 35.78 42.29
GBP 23.99 25.55 27.38
USD 33.23 39.98 47.79
EUR 24.23 30.52 36.43
USD 32.69 39.43 47.24
EUR 28.48 30.10 36.02
USD 40.14 47.46 55.61
USD 37.75 45.20 53.75
EUR 25.78 32.31 38.38
USD 34.41 41.20 49.00

Audited Annual Report and Accounts 21
The notes on pages 236 to 244 form an integral part of these financial statements.
(2) Fund name changed, see Note 1, for further details.
Three Year Summary of Net Asset Values
as at 31 August 2009 continued
31 August 200731 August 200831 August 2009Currency
US Dollar Core Bond Fund
Total net assets
Net asset value per:
A Class distributing (D) share
A Class distributing (M) share
A Class non-distributing share
B Class distributing (D) share
B Class non-distributing share
C Class distributing (D) share
C Class non-distributing share
E Class non-distributing share
Q Class distributing (D) share
Q Class non-distributing share
X Class non-distributing share
US Dollar High Yield Bond Fund
Total net assets
Net asset value per:
A Class distributing (D) share
A Class distributing (M) share
A Class non-distributing share
A Class EUR hedged non-distributing share
B Class distributing (D) share
B Class non-distributing share
C Class distributing (D) share
C Class non-distributing share
E Class non-distributing share
Q Class distributing (D) share
Q Class non-distributing share
X Class non-distributing share
US Dollar Reserve Fund(2)
Total net assets
Net asset value per:
A Class non-distributing share
A Class EUR hedged non-distributing share
A Class GBP hedged non-distributing share
B Class non-distributing share
B Class EUR hedged non-distributing share
B Class GBP hedged non-distributing share
C Class non-distributing share
C Class EUR hedged non-distributing share
C Class GBP hedged non-distributing share
D Class non-distributing share
D Class EUR hedged non-distributing share
E Class non-distributing share
E Class GBP hedged non-distributing share
Q Class non-distributing share
Q Class EUR hedged non-distributing share
US Dollar Short Duration Bond Fund
Total net assets
Net asset value per:
A Class distributing (D) share
A Class distributing (M) share
A Class non-distributing share
B Class distributing (D) share
B Class non-distributing share
C Class distributing (D) share
C Class non-distributing share
E Class non-distributing share
X Class non-distributing share
USD 279,822,873 214,288,197 231,410,509
USD 15.32 15.69 16.10
USD 15.32 15.74 16.15
USD 23.16 22.67 22.27
USD 14.47 14.83 15.21
USD 20.26 20.03 19.88
USD 14.42 14.78 15.16
USD 19.88 19.70 19.61
USD 22.21 21.86 21.58
USD 14.42 14.78 15.16
USD 20.62 20.35 20.16
USD 24.26 23.51 22.87
USD 767,424,483 602,822,792 93,426,829
USD 4.82 5.40 5.78
USD 4.86 5.44 5.84
USD 17.01 17.47 17.57
EUR 116.02 121.45 –
USD 4.86 5.44 5.83
USD 15.43 16.00 16.26
USD 4.83 5.41 5.79
USD 15.00 15.59 15.88
USD 16.41 16.94 17.14
USD 4.81 5.39 5.78
USD 16.59 17.05 17.16
USD 17.29 17.51 –
USD 265,187,968 1,180,421,979 1,262,717,599
USD 150.91 155.95 153.50
EUR – 75.83 74.51
GBP 188.98 194.56 188.29
USD 151.01 156.05 153.60
EUR – 75.82 74.50
GBP 188.66 194.23 187.97
USD 150.22 155.23 152.79
EUR – 72.57 71.30
GBP 188.97 194.55 188.28
USD – 156.32 –
EUR – 76.03 –
USD 147.88 153.20 151.16
GBP 184.60 190.52 184.84
USD 150.33 155.61 153.39
EUR – 75.64 74.46
USD 91,265,009 97,864,493 177,090,103
USD 8.42 8.88 9.58
USD 8.42 8.88 9.60
USD 10.98 10.91 11.19
USD 8.43 8.88 9.58
USD 10.25 10.29 10.66
USD 8.42 8.89 9.59
USD 10.08 10.14 10.53
USD 10.53 10.52 10.83
USD 11.32 11.16 11.34

22 BlackRock Global Funds (BGF)
Three Year Summary of Net Asset Values
as at 31 August 2009 continued
31 August 200731 August 200831 August 2009Currency
US Flexible Equity Fund
Total net assets
Net asset value per:
A Class EUR hedged distributing (A) share
A Class non-distributing share
A Class EUR hedged non-distributing share
A Class UK distributor status share
B Class non-distributing share
B Class EUR hedged non-distributing share
C Class non-distributing share
C Class EUR hedged non-distributing share
D Class non-distributing share
D Class EUR hedged non-distributing share
E Class non-distributing share
E Class EUR hedged non-distributing share
Q Class non-distributing share
X Class non-distributing share
US Focused Value Fund
Total net assets
Net asset value per:
A Class distributing (A) share
A Class non-distributing share
A Class EUR hedged non-distributing share
A Class UK distributor status share
B Class non-distributing share
B Class EUR hedged non-distributing share
C Class non-distributing share
C Class EUR hedged non-distributing share
D Class non-distributing share
E Class non-distributing share
E Class EUR hedged non-distributing share
Q Class non-distributing share
US Government Mortgage Fund
Total net assets
Net asset value per:
A Class distributing (D) share
A Class distributing (M) share
A Class non-distributing share
A Class EUR hedged non-distributing share
B Class distributing (D) share
B Class non-distributing share
C Class distributing (D) share
C Class distributing (M) share
C Class non-distributing share
D Class non-distributing share
E Class non-distributing share
Q Class distributing (D) share
Q Class non-distributing share
US Growth Fund
Total net assets
Net asset value per:
A Class non-distributing share
B Class non-distributing share
C Class non-distributing share
D Class non-distributing share
E Class non-distributing share
Q Class non-distributing share
USD 2,186,372,847 3,663,877,314 6,509,701,887
EUR 9.61 – –
USD 13.19 16.60 19.16
EUR 9.60 12.68 14.59
GBP 8.12 9.09 9.50
USD 12.26 15.58 18.17
EUR 8.95 11.94 13.89
USD 12.04 15.33 17.93
EUR 8.29 11.09 12.92
USD 13.55 16.92 19.36
EUR 9.85 12.92 14.73
USD 12.79 16.17 18.77
EUR 8.98 11.92 13.79
USD 12.31 15.63 18.21
USD 13.83 17.09 19.40
USD 165,945,794 299,751,032 1,078,296,404
USD 30.52 36.30 44.58
USD 30.43 36.29 44.58
EUR 22.51 28.18 34.09
GBP 18.69 19.87 22.08
USD 27.45 33.07 41.03
EUR – – 33.71
USD 26.95 32.55 40.49
EUR 19.31 24.57 30.13
USD 30.77 36.40 –
USD 29.43 35.27 43.54
EUR 22.77 28.77 35.02
USD 28.47 34.13 42.13
USD 185,439,804 55,824,932 83,210,947
USD 9.54 9.08 9.43
USD 9.54 9.05 9.43
USD 15.02 13.73 13.62
EUR 10.19 9.29 –
USD 10.06 9.57 9.95
USD 14.23 13.14 13.16
USD 10.07 9.58 9.96
USD 9.44 8.97 9.39
USD 13.97 12.93 12.98
USD 15.04 – –
USD 14.43 13.26 13.21
USD 10.04 9.55 9.93
USD 14.37 13.28 13.31
USD 220,201,351 212,958,680 162,504,278
USD 7.40 9.55 10.91
USD 6.76 8.81 10.17
USD 6.62 8.65 10.02
USD 7.49 – –
USD 7.15 9.27 10.65
USD 7.00 9.08 10.43

Audited Annual Report and Accounts 23
The notes on pages 236 to 244 form an integral part of these financial statements.
Three Year Summary of Net Asset Values
as at 31 August 2009 continued
31 August 200731 August 200831 August 2009Currency
US Small & MidCap Opportunities Fund
Total net assets
Net asset value per:
A Class non-distributing share
B Class non-distributing share
C Class non-distributing share
D Class non-distributing share
E Class non-distributing share
Q Class non-distributing share
US SmallCap Value Fund
Total net assets
Net asset value per:
A Class non-distributing share
B Class non-distributing share
C Class non-distributing share
E Class non-distributing share
Q Class non-distributing share
World Bond Fund
Total net assets
Net asset value per:
A Class distributing (D) share
A Class distributing (M) share
A Class non-distributing share
A Class EUR hedged non-distributing share
B Class distributing (D) share
C Class distributing (D) share
D Class non-distributing share
E Class non-distributing share
X Class non-distributing share
X Class CHF hedged non-distributing share
World Energy Fund
Total net assets
Net asset value per:
A Class distributing (A) share
A Class non-distributing share
A Class EUR hedged non-distributing share
A Class SGD hedged non-distributing share
A Class UK distributor status share
B Class non-distributing share
C Class non-distributing share
C Class EUR hedged non-distributing share
D Class non-distributing share
D Class EUR hedged non-distributing share
E Class non-distributing share
E Class EUR hedged non-distributing share
I Class EUR hedged non-distributing share
Q Class non-distributing share
X Class non-distributing share
World Financials Fund
Total net assets
Net asset value per:
A Class non-distributing share
B Class non-distributing share
C Class non-distributing share
D Class non-distributing share
E Class non-distributing share
Q Class non-distributing share
USD 184,768,911 120,874,187 109,253,411
USD 93.10 110.37 110.22
USD 82.88 99.25 100.11
USD 81.64 98.00 99.09
USD 94.26 110.85 –
USD 88.40 105.31 105.68
USD 81.32 97.61 98.69
USD 35,414,313 87,430,391 101,020,923
USD 20.37 28.47 29.76
USD 18.49 26.11 27.57
USD 18.19 25.75 27.25
USD 19.66 27.62 29.02
USD 19.17 26.93 28.29
USD 206,529,736 144,956,187 23,745,789
USD 48.14 46.19 46.94
USD 48.01 46.05 46.80
USD 56.69 52.83 51.84
EUR 149.92 139.59 –
USD 49.09 47.10 47.87
USD 48.69 46.71 47.47
USD 57.23 53.10 –
USD 55.24 51.74 50.99
USD 57.58 53.12 –
CHF 10.81 10.08 –
USD 3,339,664,792 4,301,819,161 4,934,423,802
USD 20.05 – –
USD 20.08 27.39 26.21
EUR 6.44 9.28 –
SGD 6.18 8.82 –
GBP 12.30 14.92 12.91
USD 18.43 25.39 24.54
USD 18.08 24.98 24.20
EUR 6.30 9.19 –
USD 20.62 27.91 26.47
EUR 6.49 – –
USD 19.25 26.40 25.39
EUR 6.38 9.24 –
EUR 6.45 – –
USD 18.08 24.98 24.20
USD 21.81 29.16 27.35
USD 236,234,313 247,574,290 181,877,228
USD 15.46 19.72 26.65
USD 14.26 18.37 25.07
USD 14.10 18.21 24.92
USD 15.70 19.86 –
USD 14.93 19.14 25.99
USD 14.97 19.17 25.98

24 BlackRock Global Funds (BGF)
Three Year Summary of Net Asset Values
as at 31 August 2009 continued
31 August 200731 August 200831 August 2009Currency
World Gold Fund
Total net assets
Net asset value per:
A Class distributing (A) share
A Class non-distributing share
A Class EUR hedged non-distributing share
A Class SGD hedged non-distributing share
B Class non-distributing share
C Class non-distributing share
C Class EUR hedged non-distributing share
D Class non-distributing share
D Class EUR hedged non-distributing share
E Class non-distributing share
E Class EUR hedged non-distributing share
I Class non-distributing share
I Class EUR hedged non-distributing share
Q Class non-distributing share
X Class non-distributing share
World Healthscience Fund
Total net assets
Net asset value per:
A Class non-distributing share
B Class non-distributing share
C Class non-distributing share
D Class non-distributing share
E Class non-distributing share
Q Class non-distributing share
World Income Fund
Total net assets
Net asset value per:
A Class distributing (D) share
A Class distributing (M) share
A Class non-distributing share
B Class distributing (D) share
B Class non-distributing share
C Class distributing (D) share
C Class non-distributing share
D Class non-distributing share
E Class non-distributing share
J Class distributing (M) share
X Class distributing (M) share
X Class AUD hedged distributing (M) share
World Mining Fund
Total net assets
Net asset value per:
A Class distributing (A) share
A Class non-distributing share
A Class EUR hedged non-distributing share
A Class SGD hedged non-distributing share
A Class UK distributor status share
B Class non-distributing share
C Class non-distributing share
C Class EUR hedged non-distributing share
D Class non-distributing share
D Class EUR hedged non-distributing share
E Class non-distributing share
E Class EUR hedged non-distributing share
I Class EUR hedged non-distributing share
J Class non-distributing share
Q Class non-distributing share
X Class non-distributing share
USD 5,605,878,168 6,090,571,946 5,234,704,290
USD 41.52 – –
USD 41.51 40.75 38.41
EUR 7.64 8.01 –
SGD 7.98 8.16 –
USD 37.01 36.69 34.94
USD 36.47 36.24 34.59
EUR 7.45 7.92 –
USD 42.63 41.53 38.79
EUR 7.74 8.06 –
USD 39.42 38.88 36.84
EUR 7.56 7.98 –
USD 42.01 40.82 –
EUR 7.64 – –
USD 36.80 36.48 34.73
USD 44.47 42.77 39.52
USD 308,775,370 247,198,807 159,511,087
USD 13.68 14.90 14.98
USD 12.71 13.98 14.20
USD 12.42 13.70 13.95
USD 13.88 15.01 –
USD 13.14 14.38 14.53
USD 12.33 13.61 13.85
USD 319,900,117 383,746,585 318,695,060
USD 10.73 10.46 10.30
USD 10.77 10.47 –
USD 12.50 11.69 11.09
USD 10.76 10.50 10.33
USD 12.03 11.37 10.89
USD 10.77 10.50 10.34
USD 11.92 11.29 10.85
USD 12.56 11.70 –
USD 12.23 11.49 10.95
USD 10.94 10.58 10.36
USD 10.10 – –
AUD 10.11 – –
USD 9,878,476,861 12,493,475,100 11,352,004,594
USD 53.43 – –
USD 53.43 78.28 76.00
EUR 5.46 8.70 –
SGD 5.56 8.67 –
GBP 32.15 42.04 36.93
USD 47.81 70.75 69.37
USD 47.10 69.88 68.69
EUR 5.34 8.62 –
USD 54.88 79.80 76.77
EUR 5.52 8.73 –
USD 50.86 74.89 73.06
EUR 5.41 8.67 –
EUR 5.52 8.70 –
USD 54.61 78.41 –
USD 47.61 70.46 69.09
USD 57.94 83.20 79.15

Audited Annual Report and Accounts 25
The notes on pages 236 to 244 form an integral part of these financial statements.
Three Year Summary of Net Asset Values
as at 31 August 2009 continued
31 August 200731 August 200831 August 2009Currency
World Technology Fund
Total net assets
Net asset value per:
A Class non-distributing share
B Class non-distributing share
C Class non-distributing share
D Class non-distributing share
E Class non-distributing share
Q Class non-distributing share
USD 83,398,789 98,345,148 92,899,027
USD 9.84 10.90 13.09
USD 9.02 10.09 12.23
USD 8.89 9.98 12.12
USD 9.87 10.86 –
USD 9.53 10.61 12.80
USD 9.39 10.43 12.55

26 BlackRock Global Funds (BGF)
Statement of Operations and Changes in Net Assets
for the period 1 September 2008 to 31 August 2009
79,603,249,705* 435,724,999 58,596,602 33,719,460
12,494,644 64,583 4,402 7,326
481,618,750 – 3,082,205 –
5,202,303 – 146,268 –
2,808,885 – 1,105 –
906,743,916 10,273,720 – 1,246,515
28,662,256 – – –
2(b) 1,437,530,754 10,338,303 3,233,980 1,253,841
5,699,888 8,127 424 3,393
4,170,876 – – –
5 113,303,041 796,082 74,613 135,634
6 23,743,903 234,942 3,651 52,332
4 74,189,233 670,473 160,986 246,373
7 23,174,480 159,102 25,863 32,631
4 769,348,581 4,762,188 470,355 813,800
5 (6,728,825) – – –
1,006,901,177 6,630,914 735,892 1,284,163
430,629,577 3,707,389 2,498,088 (30,322)
2(a) (10,794,377,673) (126,400,120) (2,020,836) (280,469)
2(c) 94,222,143 – (189,499) –
2(c) 151,425,129 – 36,746 –
2(c) (50,318,758) – (80,421) –
2(e) (389,226,135) (228,484) 660,898 186,032
23,205,485 (1,444,064) (400,240) 233,800
(10,965,069,809) (128,072,668) (1,993,352) 139,363
2(a) (2,539,123,021) 98,116,163 3,947,120 10,834,944
2(a) (26,460,500) – – –
2(c) 42,453,853 – (8,156) –
2(c) 67,184,874 – (45,410) –
2(c) 6,286,123 – 11,593 –
2(e) 388,484,429 – (111,439) 392,940
4,888,854 50,393 (89,984) 6,421
(2,056,285,388) 98,166,556 3,703,724 11,234,305
(12,590,725,620) (26,198,723) 4,208,460 11,343,346
36,729,523,669 286,759,869 91,613,587 165,285,217
(39,002,806,006) (220,422,519) (64,641,299) (55,682,626)
(2,273,282,337) 66,337,350 26,972,288 109,602,591
13 (109,396,154) (1,248,746) (1,123,235) –
633,045,779
65,262,891,373 474,614,880 88,654,115 154,665,397
AsianAsian Tiger
Dragon Bond ChinaFund Name Note Fund Fund Fund
US$ US$ US$ US$
Net assets at the beginning of the year
Income
Bank interest
Bond interest
Swap interest
Interest from money market deposits
Dividends
Securities lending
Total income
Expenses
Bank interest
Swap interest
Administration fees
Custodian and depositary fees
Distribution fees
Luxembourg tax
Management fees
Less Administration fee subsidy
Total expenses
Net investment income/(deficit)
Net profits/(losses) realised on:
Investments
Futures contracts
Options contracts
Swaps transactions
Forward foreign exchange contracts
Foreign currencies on other transactions
Net realised gain/(loss) for the year
Net change in unrealised appreciation/(depreciation) on:
Investments
Contracts for difference
Futures contracts
Options contracts
Swaps transactions
Forward foreign exchange contracts
Foreign currencies on other transactions
Net change in unrealised gain/(loss) for the year
Increase/(Decrease) in net assets as a result of operations
Movements in share capital
Net receipts as a result of issue of shares
Net payments as a result of repurchase of shares
Increase/(Decrease) in net assets as a result of movements in share capital
Dividends paid
Foreign exchange adjustment
Net assets at the end of the year
BlackRockGlobalFunds
Combined
(1) New Fund launched, see Note 1, for further details.
* The opening balance was combined using the average foreign exchange rates for the period
(see Note 2(e)). The same net assets when converted using the average exchange rates for
the year ended 31 August 2008 reflected a figure of US$80,331,736,371.

Audited Annual Report and Accounts 27
The notes on pages 236 to 244 form an integral part of these financial statements.
81,436,239 2,868,755,801 900,613,671 143,927,644 778,514,157 32,868,154 – 144,636,298 1,238,046,589
66,932 557,730 38,056 43,921 264,376 23,699 7,422 193,604 173,721
– (3) – 10,057,919 32,239,199 1,693,312 74,456 11,713,188 –
– – – 102,633 161,455 5,641 – 22,733 –
– 1,525,958 103,727 1,083 76,427 – 14,068 4,967 –
1,924,508 36,771,398 13,835,384 – – – – – 45,979,750
121,738 1,669,438 6,127 – – – – – 5,453,971
2,113,178 40,524,521 13,983,294 10,205,556 32,741,457 1,722,652 95,946 11,934,492 51,607,442
944 255,188 19,099 4,089 85,599 866 7,405 125 57,948
– – – 47,284 797,328 25,552 – 43,258 –
198,463 3,480,028 1,399,767 118,883 1,044,695 41,302 16,516 296,513 2,966,463
71,115 5,552,928 764,062 49,944 101,142 5,782 3,221 51,199 326,148
7,670 860,420 391,945 328,922 378,965 32,736 10,989 906,286 286,651
40,194 575,313 264,984 46,010 349,744 13,901 3,610 183,422 600,135
1,168,321 27,158,454 8,281,666 834,738 4,790,109 275,031 98,894 2,200,918 16,687,259
– (2,334,873) – – – (41,815) – (407,634) –
1,486,707 35,547,458 11,121,523 1,429,870 7,547,582 353,355 140,635 3,274,087 20,924,604
626,471 4,977,063 2,861,771 8,775,686 25,193,875 1,369,297 (44,689) 8,660,405 30,682,838
(14,563,274) (1,054,633,465) (291,452,436) (8,278,446) 1,048,568 (2,774,381) 33 5,530,799 (269,776,852)
(436,178) (4,144,785) – (334,914) 13,753,548 715,813 – 1,561,103 –
– (26,781,568) – (345,068) 1,844,870 17,087 – 12,531 –
– – – (2,032,563) 6,463,563 206,417 – 2,049,875 –
45,905 (4,123,330) 1,241,128 (3,248,587) (9,048,162) (665,094) – 399,972 (99,809)
(113,703) (110,534) (3,748,529) 1,368,852 (7,502,697) 385,360 – (1,791,233) 480,189
(15,067,250) (1,089,793,682) (293,959,837) (12,870,726) 6,559,690 (2,114,798) 33 7,763,047 (269,396,472)
20,406,258 218,039,931 197,713,189 6,558,466 33,559,423 1,429,671 (37,026) 18,036,493 217,267,640
– (19,596,646) – – – – – – –
– 2,563,959 – (83,671) (1,309,418) (108,309) – (666,421) –
– – – (91,690) (1,869,130) (85,800) – (317,572) –
– – – (114,333) 1,498,149 (153,133) – (36,346) –
– 935,638 – 2,115,637 10,060,523 243,147 – 2,373,515 –
(909) (942,085) 113,715 (159,577) 378,221 6,564 – (360,341) 789
20,405,349 201,000,797 197,826,904 8,224,832 42,317,768 1,332,140 (37,026) 19,029,328 217,268,429
5,964,570 (883,815,822) (93,271,162) 4,129,792 74,071,333 586,639 (81,682) 35,452,780 (21,445,205)
76,453,935 781,528,446 523,829,637 108,403,868 606,668,551 75,150,131 223,927,146 941,618,832 1,295,442,702
(41,121,083) (1,167,202,684) (517,744,432) (90,270,704) (696,951,473) (51,957,056) (11,321,934) (367,661,657) (861,592,356)
35,332,852 (385,674,238) 6,085,205 18,133,164 (90,282,922) 23,193,075 212,605,212 573,957,175 433,850,346
(286,507) – – (2,130,139) (613,118) (22,778) – (192,991) (18,169)
122,447,154 1,599,265,741 813,427,714 164,060,461 761,689,450 56,625,090 212,523,530 753,853,262 1,650,433,561
Continental Emerging Euro Euro ShortEuropean Emerging Emerging Markets Euro Corporate Euro Duration Euro-
Flexible Europe Markets Bond Bond Bond Reserve Bond MarketsFund Fund Fund Fund Fund Fund Fund(1) Fund Fund
€ € US$ US$ € € € € €

28 BlackRock Global Funds (BGF)
Statement of Operations and Changes in Net Assets
for the period 1 September 2008 to 31 August 2009 continued
385,364,346 26,544,072 38,129,177 228,130,036
229,463 29,882 9,527 6,240
– – – –
– – – –
– – – –
25,172,315 630,938 1,559,061 3,533,998
1,558,600 – 17,216 192,035
2(b) 26,960,378 660,820 1,585,804 3,732,273
91,008 3,000 389 3,191
– – – –
5 1,786,098 43,260 126,464 311,721
6 108,721 44,722 18,130 52,439
4 285,027 65,133 18,458 138,621
7 405,582 7,770 27,423 62,797
4 9,656,170 235,568 768,676 1,824,133
5 – – – –
12,332,606 399,453 959,540 2,392,902
14,627,772 261,367 626,264 1,339,371
2(a) (76,869,899) (7,300,790) (4,315,759) (57,216,605)
2(c) – (237,667) – –
2(c) – 809,563 – –
2(c) – – – –
2(e) (871,172) 683,351 38,729 (214,371)
189,545 581,360 (118,290) 177,302
(77,551,526) (5,464,183) (4,395,320) (57,253,674)
2(a) 226,141,768 3,201,900 13,439,231 21,712,706
2(a) – – – –
2(c) – 143,571 – –
2(c) – (96,375) – –
2(c) – – – –
2(e) – (330,672) – –
(45,053) (5,725) (1,599) 10,161
226,096,715 2,912,699 13,437,632 21,722,867
163,172,961 (2,290,117) 9,668,576 (34,191,436)
1,457,364,327 3,386,823 87,962,458 113,170,056
(333,618,204) (7,572,926) (12,717,859) (137,480,984)
1,123,746,123 (4,186,103) 75,244,599 (24,310,928)
13 – (935,762) – –
1,672,283,430 19,132,090 123,042,352 169,627,672
EuropeanEnhanced European European
European Equity Yield Focus GrowthFund Name Note Fund Fund Fund Fund
€ € € €
Net assets at the beginning of the year
Income
Bank interest
Bond interest
Swap interest
Interest from money market deposits
Dividends
Securities lending
Total income
Expenses
Bank interest
Swap interest
Administration fees
Custodian and depositary fees
Distribution fees
Luxembourg tax
Management fees
Less Administration fee subsidy
Total expenses
Net investment income/(deficit)
Net profits/(losses) realised on:
Investments
Futures contracts
Options contracts
Swaps transactions
Forward foreign exchange contracts
Foreign currencies on other transactions
Net realised gain/(loss) for the year
Net change in unrealised appreciation/(depreciation) on:
Investments
Contracts for difference
Futures contracts
Options contracts
Swaps transactions
Forward foreign exchange contracts
Foreign currencies on other transactions
Net change in unrealised gain/(loss) for the year
Increase/(Decrease) in net assets as a result of operations
Movements in share capital
Net receipts as a result of issue of shares
Net payments as a result of repurchase of shares
Increase/(Decrease) in net assets as a result of movements in share capital
Dividends paid
Foreign exchange adjustment
Net assets at the end of the year

Audited Annual Report and Accounts 29
The notes on pages 236 to 244 form an integral part of these financial statements.
453,584,072 231,902,791 172,970,917 18,299,447,637 40,652,075 707,468,949 417,300,051 187,335,357 499,574,308
69,194 56,745 42,036 316,734 12,028 18,804 207,326 16,810 220,419
– – 7,083,087 141,498,564 10,487,777 1,081,795 – – 16,276,148
– – 1,290,989 – 37,664 – – – 29,278
303,344 – 715 – 195 – – – 73,967
6,938,500 8,026,544 – 143,762,000 – 8,610,511 7,938,965 3,195,133 –
145,136 723,496 – 4,296,219 – 29 204,184 127,069 195,976
7,456,174 8,806,785 8,416,827 289,873,517 10,537,664 9,711,139 8,350,475 3,339,012 16,795,788
41,544 1,158 30,602 1,281,284 8,410 46,865 63,731 15,002 236,706
– – 7,113 2,292,686 12,272 – – – 133,656
596,247 457,308 180,004 22,862,790 87,611 1,052,253 619,084 220,208 596,139
203,103 11,454 20,834 2,658,990 23,197 243,223 82,624 88,963 63,855
165,257 490,802 200,532 39,062,929 4,435 1,276,437 715,819 39,340 869,229
123,102 91,051 44,325 5,278,165 30,990 196,330 107,469 58,724 221,753
4,767,681 2,533,964 1,045,544 169,281,083 264,315 5,898,129 3,622,915 1,872,928 3,959,612
(212,916) – (151,948) – (25,434) – (274,655) – (223,843)
5,684,018 3,585,737 1,377,006 242,717,927 405,796 8,713,237 4,936,987 2,295,165 5,857,107
1,772,156 5,221,048 7,039,821 47,155,590 10,131,868 997,902 3,413,488 1,043,847 10,938,681
(128,972,799) (74,676,532) (18,251,620) (1,756,138,446) 1,746,236 (79,361,876) (108,708,678) (59,691,312) (16,525,131)
– – (1,911,974) 112,467,838 (1,862,056) (9,157,293) (4,097,717) – (2,064,670)
30,192 – 355,325 154,339,305 (34,314) 7,546,142 10,314,906 – 606,201
– – 504,543 (70,802,831) 2,906,404 (2,287,393) – – 861,065
(1,649,285) (548,469) (26,158,494) (212,706,427) 22,840,682 (2,392,123) (5,405,606) 3,094,000 (17,739,597)
1,420,680 (46,537) 7,665,889 26,730,205 3,183,623 (4,050) 840,057 662,273 17,810,586
(129,171,212) (75,271,538) (37,796,331) (1,746,110,356) 28,780,575 (85,656,593) (107,057,038) (55,935,039) (17,051,546)
55,882,846 50,477,066 3,194,716 (402,635,991) 45,590,666 (22,519,898) 25,389,852 21,831,929 29,481,296
– – – – – – – – –
– – 577,978 34,015,476 (780,561) 6,135,327 406,591 – 1,146,864
(23,550) – 11,216 73,716,994 (106,354) 3,432,852 (466,813) – (1,370,561)
– – 2,339,166 5,754,802 (359,820) 174,621 – – (770,585)
(27,391) – 7,620,543 244,383,771 (6,134,391) 2,418,867 2,301,348 (492,173) (6,327,774)
55,426 (6,005) 27,827 2,072,717 278,337 (68,999) 195,918 (7,455) 380,646
55,887,331 50,471,061 13,771,446 (42,692,231) 38,487,877 (10,427,230) 27,826,896 21,332,301 22,539,886
(71,511,725) (19,579,429) (16,985,064) (1,741,646,997) 77,400,320 (95,085,921) (75,816,654) (33,558,891) 16,427,021
70,562,988 162,151,688 32,438,249 3,022,575,169 313,135,693 332,064,760 46,685,748 133,206,530 497,300,855
(124,036,936) (129,235,476) (124,635,376) (7,071,933,425) (33,043,443) (391,630,993) (119,729,692) (56,405,173) (600,730,600)
(53,473,948) 32,916,212 (92,197,127) (4,049,358,256) 280,092,250 (59,566,233) (73,043,944) 76,801,357 (103,429,745)
– (1,756,128) (4,499,356) (708,514) (7,140,445) – (15,759,888) (360,113) (884,588)
328,598,399 243,483,446 59,289,370 12,507,733,870 391,004,200 552,816,795 252,679,565 230,217,710 411,686,996
GlobalFixed Income Global Global Enhanced Global
European European Global Global Corporate Dynamic Equity Global GovernmentOpportunities Value Opportunities Allocation Bond Equity Yield Equity Bond
Fund Fund Fund Fund Fund Fund Fund Fund Fund
€ € US$ US$ US$ US$ US$ US$ US$

30 BlackRock Global Funds (BGF)
Statement of Operations and Changes in Net Assets
for the period 1 September 2008 to 31 August 2009 continued
257,115,994 – 134,285,684 213,734,759
22,710 171 60,611 213,887
19,532,572 114,723 – –
309,581 – – –
– – – –
– – 1,713,427 2,196,046
– – – 62,907
2(b) 19,864,863 114,894 1,774,038 2,472,840
14,052 178 600 90,991
1,984 – – –
5 208,894 6,335 218,368 362,149
6 13,848 1,392 67,555 186,319
4 150,216 14,074 60,126 378,438
7 90,172 2,356 43,199 75,583
4 1,678,205 29,300 1,391,384 2,071,681
5 (41,888) – – –
2,115,483 53,635 1,781,232 3,165,161
17,749,380 61,259 (7,194) (692,321)
2(a) (34,062,122) 131,348 (38,976,584) (39,267,857)
2(c) (1,700) 97,134 101,121 –
2(c) – – – 304,021
2(c) 4,110,049 – – –
2(e) (9,508,730) 201,982 (1,135,268) (384,086)
2,197,954 (45,412) (14,056) (330,382)
(37,264,549) 385,052 (40,024,787) (39,678,304)
2(a) 14,477,772 1,386,569 18,735,780 8,071,824
2(a) – – – –
2(c) – (6,752) (203,268) –
2(c) – – – 40,035
2(c) 54,318 – – –
2(e) 6,655,830 119,442 1,363,693 –
70,232 6,240 5,101 16,946
21,258,152 1,505,499 19,901,306 8,128,805
1,742,983 1,951,810 (20,130,675) (32,241,820)
331,876,328 53,217,155 69,660,918 88,947,602
(300,371,421) (598,929) (85,366,870) (55,488,001)
31,504,907 52,618,226 (15,705,952) 33,459,601
13 (2,968,894) (5,039) – –
287,394,990 54,564,997 98,449,057 214,952,540
GlobalGlobal Inflation
High Yield Linked Global GlobalBond Bond Opportunities SmallCap
Fund Name Note Fund Fund(1) Fund Fund
US$ US$ US$ US$
Net assets at the beginning of the year
Income
Bank interest
Bond interest
Swap interest
Interest from money market deposits
Dividends
Securities lending
Total income
Expenses
Bank interest
Swap interest
Administration fees
Custodian and depositary fees
Distribution fees
Luxembourg tax
Management fees
Less Administration fee subsidy
Total expenses
Net investment income/(deficit)
Net profits/(losses) realised on:
Investments
Futures contracts
Options contracts
Swaps transactions
Forward foreign exchange contracts
Foreign currencies on other transactions
Net realised gain/(loss) for the year
Net change in unrealised appreciation/(depreciation) on:
Investments
Contracts for difference
Futures contracts
Options contracts
Swaps transactions
Forward foreign exchange contracts
Foreign currencies on other transactions
Net change in unrealised gain/(loss) for the year
Increase/(Decrease) in net assets as a result of operations
Movements in share capital
Net receipts as a result of issue of shares
Net payments as a result of repurchase of shares
Increase/(Decrease) in net assets as a result of movements in share capital
Dividends paid
Foreign exchange adjustment
Net assets at the end of the year
(1) New Fund launched, see Note 1, for further details.(2) Fund name changed, see Note 1, for further details.

Audited Annual Report and Accounts 31
The notes on pages 236 to 244 form an integral part of these financial statements.
887,388,403 8,792,974,775 23,795,477,305 58,304,757,718 5,398,460,100 2,107,667,953 6,340,507,977 189,363,195 19,124,265
36,302 12,536 239,663 197,248 132,386 793,121 2,756,198 44,050 26,765
– – – – – 77,004,974 – – 260,573
– – – – – 1,406,756 – – 373
– – – – – 1,928 – – –
14,389,558 97,353,937 280,016,668 720,296,116 87,627,006 – 38,074,122 4,594,439 158,024
– – 11,918,603 7,549,247 340,859 – 3,433,897 18,540 –
14,425,860 97,366,473 292,174,934 728,042,611 88,100,251 79,206,779 44,264,217 4,657,029 445,735
6,166 47,840 258,623 578,543 47,656 460,487 666,717 22,836 19,942
– – – – – 130,500 – – 1,919
1,514,515 10,587,856 39,166,737 66,714,650 7,875,196 1,553,837 8,202,859 380,912 23,973
900,839 2,599,299 8,265,689 8,345,784 1,476,945 1,465,199 755,608 76,739 611
733,348 9,147,820 21,304,313 38,800,620 1,403,765 4,131,364 2,926,248 421,706 48,486
224,337 1,996,460 8,969,943 10,517,969 1,424,382 486,134 1,372,633 77,995 7,391
12,726,740 67,137,933 305,080,979 405,189,161 55,177,921 9,175,262 55,580,834 2,016,677 229,850
– (2,623,089) (33,254,025) – – – – – (26,824)
16,105,945 88,894,119 349,792,259 530,146,727 67,405,865 17,402,783 69,504,899 2,996,865 305,348
(1,680,085) 8,472,354 (57,617,325) 197,895,884 20,694,386 61,803,996 (25,240,682) 1,660,164 140,387
(181,579,832) (3,546,662,398) (7,336,960,793) (26,225,983,049) (849,082,776) (256,832,591) (523,037,252) (26,964,660) (3,110,520)
(11,340) – – – – (3,256,851) – – 20,788
– – – – 3,080,991 (5,827,934) – – 72,597
– – – – – 187,238 – – 21,386
802 (1,055,227) (30,161,709) (275,051,460) (635,482) 33,600,050 (1,338,759) 248,593 (421,429)
(6,966,363) (2,971,170) (26,438,293) (3,243,263) (13,283,603) (6,813,806) (4,294,801) (917,205) (139,752)
(188,556,733) (3,550,688,795) (7,393,560,795) (26,504,277,772) (859,920,870) (238,943,894) (528,670,812) (27,633,272) (3,556,930)
97,394,084 883,382,669 3,844,683,014 9,547,307,835 50,447,015 (13,554,262) (1,817,236,409) 15,911,222 1,886,722
– – – – – – – – –
– – – – – (595,649) – – 182,827
– – – – (1,303,240) (1,722,084) – – (35,280)
– – – – – (159,715) – – (10,780)
– (172,151) (17,092,309) 60,953,720 – 30,534,496 – – 226,297
(25,687) 330 – 870 255,341 21,450 1,115,214 287 14,718
97,368,397 883,210,848 3,827,590,705 9,608,262,425 49,399,116 14,524,236 (1,816,121,195) 15,911,509 2,264,504
(92,868,421) (2,659,005,593) (3,623,587,415) (16,698,119,463) (789,827,368) (162,615,662) (2,370,032,689) (10,061,599) (1,152,039)
407,861,876 1,726,852,790 17,368,298,550 14,628,567,309 2,490,623,271 563,715,328 1,350,894,745 104,501,754 5,182,942
(561,521,352) (3,826,501,737) (18,990,798,476) (35,972,281,411) (2,211,349,468) (1,317,236,765) (1,610,115,870) (88,071,197) (4,106,902)
(153,659,476) (2,099,648,947) (1,622,499,926) (21,343,714,102) 279,273,803 (753,521,437) (259,221,125) 16,430,557 1,076,040
– – – – (355,914) (37,943,544) – – –
640,860,506 4,034,320,235 18,549,389,964 20,262,924,153 4,887,550,621 1,153,587,310 3,711,254,163 195,732,153 19,048,266
Japan Local Emerging StrategicSmall & MidCap Japan Latin Markets Short New Pacific Allocation
India Japan Opportunities Value American Duration Bond Energy Equity FundFund Fund Fund(2) Fund Fund Fund Fund Fund (Euro)
US$ ¥ ¥ ¥ US$ US$ US$ US$ €

32 BlackRock Global Funds (BGF)
Statement of Operations and Changes in Net Assets
for the period 1 September 2008 to 31 August 2009 continued
42,678,329 64,238,442 191,829,227 1,165,591,190
45,553 15,276 98,022 165,444
551,423 – – –
848 – – –
603 – – –
334,182 1,491,044 6,628,087 25,087,011
– – – 443,491
2(b) 932,609 1,506,320 6,726,109 25,695,946
36,677 6,055 40,782 74,272
4,371 – – –
5 57,782 221,338 358,465 2,719,664
6 24,141 81,725 28,174 145,315
4 47,713 – 51,885 949,222
7 15,215 52,090 80,584 556,285
4 491,918 1,247,317 2,341,088 16,167,931
5 (64,723) – (61,658) –
613,094 1,608,525 2,839,320 20,612,689
319,515 (102,205) 3,886,789 5,083,257
2(a) (8,282,718) (13,802,844) (20,915,966) (219,907,649)
2(c) 40,032 – – –
2(c) 160,105 – – 606,222
2(c) 30,867 – – –
2(e) 446,186 29,300 59,736 (2,964,233)
287,535 (101,493) (69,724) (187,730)
(7,317,993) (13,875,037) (20,925,954) (222,453,390)
2(a) 4,129,841 13,395,391 9,054,498 63,755,295
2(a) – – – –
2(c) 406,435 – – –
2(c) (74,501) – – (494,482)
2(c) (20,007) – – –
2(e) (694,597) – – 2,203,970
33,743 – (1,791) (11)
3,780,914 13,395,391 9,052,707 65,464,772
(3,217,564) (581,851) (7,986,458) (151,905,361)
12,032,930 101,083,105 132,719,516 1,184,178,776
(9,860,288) (35,378,038) (68,371,703) (714,030,642)
2,172,642 65,705,067 64,347,813 470,148,134
13 – – (1,285,203) (843,092)
41,633,407 129,361,658 246,905,379 1,482,990,871
Strategic USAllocation Swiss United Basic
Fund Opportunities Kingdom ValueFund Name Note (US Dollar) Fund Fund Fund
US$ CHF £ US$
Net assets at the beginning of the year
Income
Bank interest
Bond interest
Swap interest
Interest from money market deposits
Dividends
Securities lending
Total income
Expenses
Bank interest
Swap interest
Administration fees
Custodian and depositary fees
Distribution fees
Luxembourg tax
Management fees
Less Administration fee subsidy
Total expenses
Net investment income/(deficit)
Net profits/(losses) realised on:
Investments
Futures contracts
Options contracts
Swaps transactions
Forward foreign exchange contracts
Foreign currencies on other transactions
Net realised gain/(loss) for the year
Net change in unrealised appreciation/(depreciation) on:
Investments
Contracts for difference
Futures contracts
Options contracts
Swaps transactions
Forward foreign exchange contracts
Foreign currencies on other transactions
Net change in unrealised gain/(loss) for the year
Increase/(Decrease) in net assets as a result of operations
Movements in share capital
Net receipts as a result of issue of shares
Net payments as a result of repurchase of shares
Increase/(Decrease) in net assets as a result of movements in share capital
Dividends paid
Foreign exchange adjustment
Net assets at the end of the year
(2) Fund name changed, see Note 1, for further details.

Audited Annual Report and Accounts 33
The notes on pages 236 to 244 form an integral part of these financial statements.
214,288,197 602,822,792 1,180,421,979 97,864,493 3,663,877,314 299,751,032 55,824,932 212,958,680 120,874,187
11,335 43,471 36,449 5,444 27,949 63,772 54,713 8,607 75,365
11,636,494 52,737,766 16,727,012 5,331,562 – – 7,419,219 – –
489,593 – – 1,507 – – 583,100 – –
1,777 585 – – – – 1,647 – –
– – – – 28,865,967 3,641,595 – 1,684,110 994,578
– – – – 1,063,048 70,532 – 21,925 –
12,139,199 52,781,822 16,763,461 5,338,513 29,956,964 3,775,899 8,058,679 1,714,642 1,069,943
12,484 11,811 32,624 4,681 39,968 24,937 41,336 13,020 123
145,112 13,562 – 1,580 – – – – –
316,458 701,909 697,433 64,309 5,087,318 430,176 236,040 402,328 220,360
60,891 69,807 60,816 15,795 341,101 42,320 85,211 13,779 43,393
1,136,660 267,868 344,198 432,254 1,538,539 147,639 764,617 304,933 72,432
105,558 237,007 58,385 34,924 925,906 69,039 86,572 78,837 52,316
1,906,479 5,687,550 4,106,295 562,476 29,251,069 2,507,500 1,414,288 2,349,988 1,537,655
(102,768) (233,209) – (10,092) – – (252,671) – –
3,580,874 6,756,305 5,299,751 1,105,927 37,183,901 3,221,611 2,375,393 3,162,885 1,926,279
8,558,325 46,025,517 11,463,710 4,232,586 (7,226,937) 554,288 5,683,286 (1,448,243) (856,336)
(7,350,014) (47,194,537) (64,269,346) (9,437,864) (768,200,607) (99,651,219) 4,416,166 (50,383,009) (29,435,298)
1,668,156 – (2,930,456) 490,599 – – (496,687) – (655,724)
360 – – 74,515 – 625,791 – – 31,901
(767,822) (309,381) – 166,420 – – (51,276) – –
(287,398) (41,548,066) (57,207,937) (12,078) (29,156,510) (744,517) (13,535) (19,360) (250,898)
74,048 5,973,151 1,357,225 57,272 8,051,218 177,290 13,548 14,296 332,814
(6,662,670) (83,078,833) (123,050,514) (8,661,136) (789,305,899) (99,592,655) 3,868,216 (50,388,073) (29,977,205)
4,870,201 8,157,925 17,495,493 3,047,354 43,020,698 39,628,222 1,655,356 6,207,764 19,266,705
– – – – – – – – –
(620,104) – 928,111 99,628 – – 26,451 – (466,681)
(23,690) – – (50,573) – – – – –
86,389 246,299 – (74,408) – – 703,952 – –
(176,324) 20,411,926 22,406,906 (3,214) 20,283,884 480,821 2,375 – –
19,895 51,354 4,782 9,069 7,201 392 7,370 (1,021) (6)
4,156,367 28,867,504 40,835,292 3,027,856 63,311,783 40,109,435 2,395,504 6,206,743 18,800,018
6,052,022 (8,185,812) (70,751,512) (1,400,694) (733,221,053) (58,928,932) 11,947,006 (45,629,573) (12,033,523)
221,908,476 544,917,600 715,603,438 78,468,893 1,554,820,431 120,098,660 338,526,756 221,955,839 145,329,943
(159,574,016) (369,910,883) (1,560,064,078) (83,133,030) (2,299,103,845) (194,974,919) (217,505,558) (169,083,595) (69,401,696)
62,334,460 175,006,717 (844,460,640) (4,664,137) (744,283,414) (74,876,259) 121,021,198 52,872,244 75,928,247
(2,851,806) (2,219,214) (21,859) (534,653) – (47) (3,353,332) – –
279,822,873 767,424,483 265,187,968 91,265,009 2,186,372,847 165,945,794 185,439,804 220,201,351 184,768,911
US Dollar US Dollar US Dollar US US US USCore High Yield US Dollar Short Duration Flexible Focused Government US Small & MidCapBond Bond Reserve Bond Equity Value Mortgage Growth OpportunitiesFund Fund Fund(2) Fund Fund Fund Fund Fund Fund(2)
US$ US$ US$ US$ US$ US$ US$ US$ US$

34 BlackRock Global Funds (BGF)
Statement of Operations and Changes in Net Assets
for the period 1 September 2008 to 31 August 2009 continued
87,430,391 144,956,187 4,301,819,161 247,574,290
13,561 69,844 984,301 97,479
– 8,816,370 – –
– 15,499 – –
– 14,932 – –
460,497 – 59,350,254 3,810,744
– – 2,274,847 140,406
2(b) 474,058 8,916,645 62,609,402 4,048,629
2,853 21,191 180,141 31,312
– 64,134 – –
5 83,056 263,873 6,072,549 413,365
6 74,383 30,930 506,824 19,695
4 106,932 53,441 1,258,413 214,934
7 17,425 77,397 1,122,952 76,939
4 561,346 1,016,409 42,336,065 2,728,364
5 – – – (264,092)
845,995 1,527,375 51,476,944 3,220,517
(371,937) 7,389,270 11,132,458 828,112
2(a) (29,503,489) (1,620,120) (407,726,778) (97,468,478)
2(c) – (306,122) – –
2(c) – 114,164 – (753,873)
2(c) – 571,481 – –
2(e) 16,732 (5,492,846) (1,610,933) (152,764)
(15,252) 6,772,607 3,838,873 (689,899)
(29,502,009) 39,164 (405,498,838) (99,065,014)
2(a) 3,486,682 12,670,945 (714,856,990) 50,895,212
2(a) – – – –
2(c) – (209,863) – –
2(c) – (453,430) – –
2(c) – (383,316) – –
2(e) – (1,739,180) 2,543,906 –
20 141,912 394,080 29,244
3,486,702 10,027,068 (711,919,004) 50,924,456
(26,387,244) 17,455,502 (1,106,285,384) (47,312,446)
41,763,379 212,802,143 1,806,937,587 201,359,672
(67,392,213) (168,565,251) (1,662,806,123) (165,387,203)
(25,628,834) 44,236,892 144,131,464 35,972,469
13 – (118,845) (449) –
35,414,313 206,529,736 3,339,664,792 236,234,313
USSmallCap World World World
Value Bond Energy FinancialsFund Name Note Fund Fund Fund Fund
US$ US$ US$ US$
Net assets at the beginning of the year
Income
Bank interest
Bond interest
Swap interest
Interest from money market deposits
Dividends
Securities lending
Total income
Expenses
Bank interest
Swap interest
Administration fees
Custodian and depositary fees
Distribution fees
Luxembourg tax
Management fees
Less Administration fee subsidy
Total expenses
Net investment income/(deficit)
Net profits/(losses) realised on:
Investments
Futures contracts
Options contracts
Swaps transactions
Forward foreign exchange contracts
Foreign currencies on other transactions
Net realised gain/(loss) for the year
Net change in unrealised appreciation/(depreciation) on:
Investments
Contracts for difference
Futures contracts
Options contracts
Swaps transactions
Forward foreign exchange contracts
Foreign currencies on other transactions
Net change in unrealised gain/(loss) for the year
Increase/(Decrease) in net assets as a result of operations
Movements in share capital
Net receipts as a result of issue of shares
Net payments as a result of repurchase of shares
Increase/(Decrease) in net assets as a result of movements in share capital
Dividends paid
Foreign exchange adjustment
Net assets at the end of the year
(3) Fund merged, see Note 1, for further details.(4) Fund liquidated, see Note 1, for further details.

Audited Annual Report and Accounts 35
The notes on pages 236 to 244 form an integral part of these financial statements.
6,090,571,946 247,198,807 383,746,585 12,493,475,100 98,345,148 22,300,039 9,850,017 50,022,868 224,090,365
780,031 62,239 87,972 2,186,763 27,038 16,245 7,233 8,515 70,589
1,841,508 – 16,467,416 – – 161,121 43,236 883,961 10,635,330
– – 268,923 – – 370 124 2,282 259,940
– – – – – 285 6,269 – –
54,494,463 1,084,102 – 189,211,060 748,606 23,356 11 – –
533,093 57,204 – 1,768,669 54,352 – – – 4,187
57,649,095 1,203,545 16,824,311 193,166,492 829,996 201,377 56,873 894,758 10,970,046
185,274 20,444 14,656 983,008 2,118 – – – 93,666
– – 103,002 – – 20,704 10,041 1,432 2,242
12,096,502 475,955 315,754 16,483,947 156,032 13,367 4,511 15,556 162,506
1,629,739 39,860 80,635 2,026,766 17,169 4,441 1,539 – 15,683
1,993,397 260,428 884,984 3,170,308 172,067 29,453 20,252 1,067 30,890
2,445,225 94,628 80,067 2,951,600 31,763 2,359 1,204 6,806 23,338
83,849,131 3,350,308 1,028,014 114,732,639 1,060,661 92,334 45,041 82,278 923,979
– (87,552) (363,861) – (12,736) (37,471) (1,988) (19) (15,713)
102,199,268 4,154,071 2,143,251 140,348,268 1,427,074 125,187 80,600 107,120 1,236,591
(44,550,173) (2,950,526) 14,681,060 52,818,224 (597,078) 76,190 (23,727) 787,638 9,733,455
(272,039,731) (20,472,584) (14,091,730) (1,342,728,966) (19,195,795) (6,757,832) (997,532) (7,723,954) (148,509,676)
– – 394,448 – – 555,778 (193,529) (702,924) (8,777,062)
– – (251,284) 12,266,336 – (6,812) 1,879 31,180 549,699
– – 253,190 – – 274,987 131,880 65,439 4,052,127
(3,962,335) 92,878 802,697 (8,758,168) (63,160) (112,385) 47,399 (487,041) 6,359,481
(1,053,137) (332,595) (6,136,887) (19,387,513) 9,024 (28,229) 1,747 (139,196) 11,227,447
(277,055,203) (20,712,301) (19,029,566) (1,358,608,311) (19,249,931) (6,074,493) (1,008,156) (8,956,496) (135,097,984)
288,106,765 5,142,178 13,813,023 (2,199,877,373) 8,664,563 2,302,148 137,452 3,074,746 17,912,893
– – – – – – – – –
– – (676,183) – – (33,444) 24,169 89,176 1,204,861
– – (589,410) 761,964 – (4,264) (1,331) (13,559) (687,305)
– – (514,608) – – (83,191) (51,227) (13,682) (2,264,075)
10,602,955 – 4,021,858 9,267,346 – 105,971 (8,432) 156,258 (4,915,256)
84,136 19,370 273,324 637,731 (851) (3,056) 3,785 (329) 125,068
298,793,856 5,161,548 16,328,004 (2,189,210,332) 8,663,712 2,284,164 104,416 3,292,610 11,376,186
(22,811,520) (18,501,279) 11,979,498 (3,495,000,419) (11,183,297) (3,714,139) (927,467) (4,876,248) (113,988,343)
3,414,878,962 322,297,628 59,986,683 5,615,965,012 81,839,140 534,487 2,887,562 306,562 185,435,610
(3,876,761,220) (242,219,786) (126,201,036) (4,735,708,684) (85,602,202) (19,120,043) (11,809,963) (45,453,182) (288,243,044)
(461,882,258) 80,077,842 (66,214,353) 880,256,328 (3,763,062) (18,585,556) (8,922,401) (45,146,620) (102,807,434)
– – (9,611,613) (254,148) – (344) (149) – (7,294,588)
5,605,878,168 308,775,370 319,900,117 9,878,476,861 83,398,789 – – – –
Global CapitalConservative Conservative Securities
World World World World World Allocation Allocation Dynamic AbsoluteGold Healthscience Income Mining Technology Fund Fund Reserve ReturnFund Fund Fund Fund Fund (Euro)(3) (US Dollar)(3) Fund(4) Fund(4)
US$ US$ US$ US$ US$ € US$ US$ US$

36 BlackRock Global Funds (BGF)
Statement of Changes in Shares Outstanding
as at 31 August 2009
Shares outstanding
at the end
of the year
Shares
repurchased
Shares
issued
Shares outstanding
at the beginning
of the year
Asian Dragon Fund
A Class non-distributing share
A Class UK distributor status share
B Class non-distributing share
C Class non-distributing share
D Class non-distributing share
E Class non-distributing share
Q Class non-distributing share
Asian Tiger Bond Fund
A Class distributing (D) share
A Class distributing (M) share
A Class non-distributing share
B Class distributing (D) share
B Class non-distributing share
C Class distributing (D) share
C Class non-distributing share
E Class non-distributing share
Q Class distributing (D) share
Q Class non-distributing share
China Fund
A Class non-distributing share
A Class EUR hedged non-distributing share
A Class SGD hedged non-distributing share
A Class HKD unhedged non-distributing share
A Class UK distributor status GBP hedged share
B Class non-distributing share
B Class EUR hedged non-distributing share
B Class SGD hedged non-distributing share
C Class non-distributing share
C Class EUR hedged non-distributing share
C Class SGD hedged non-distributing share
E Class EUR hedged non-distributing share
Continental European Flexible Fund
A Class non-distributing share
A Class UK distributor status share
B Class non-distributing share
C Class non-distributing share
D Class non-distributing share
E Class non-distributing share
Emerging Europe Fund
A Class distributing (A) share
A Class non-distributing share
A Class UK distributor status share
B Class non-distributing share
C Class non-distributing share
D Class non-distributing share
E Class non-distributing share
I Class non-distributing share
J Class non-distributing share
Q Class non-distributing share
X Class non-distributing share
Emerging Markets Fund
A Class non-distributing share
B Class non-distributing share
C Class non-distributing share
D Class non-distributing share
E Class non-distributing share
Q Class non-distributing share
8,019,179 8,914,202 (10,123,700) 6,809,681
5,428,380 9,397,698 (6,324,173) 8,501,905
1,357,982 279,556 (510,816) 1,126,722
1,593,714 498,172 (827,141) 1,264,745
132,665 3,088,239 (954,169) 2,266,735
1,657,546 1,929,378 (1,738,020) 1,848,904
1,157,243 11,771 (190,074) 978,940
285,208 169,067 (143,493) 310,782
1,175,136 1,425,924 (1,539,440) 1,061,620
1,051,672 3,008,992 (1,955,724) 2,104,940
326,201 129,834 (102,635) 353,400
65,827 102,256 (61,224) 106,859
105,788 262,133 (46,836) 321,085
78,823 110,377 (105,233) 83,967
81,367 162,070 (111,249) 132,188
880,162 5,740 (236,540) 649,362
54,408 – (6,776) 47,632
926,351 9,109,520 (4,133,555) 5,902,316
33,725 937,323 (67,694) 903,354
58,353 127,091 (12,593) 172,851
5,930,571 8,415,933 (4,699,218) 9,647,286
500 71,229 (55,728) 16,001
665,076 1,424,318 (518,955) 1,570,439
1,089 555 – 1,644
13,000 – – 13,000
1,110,300 2,942,875 (975,812) 3,077,363
34,000 – (34,000) –
72,000 18,097 (25,000) 65,097
– 1,552,100 (164,452) 1,387,648
3,999,368 7,749,375 (4,217,720) 7,531,023
5,298,891 2,829,645 (2,784,237) 5,344,299
41,122 – (27,562) 13,560
16,728 8,671 (6,468) 18,931
– 1,669,870 (366,288) 1,303,582
143,347 181,380 (161,205) 163,522
– 221 – 221
26,071,499 15,799,237 (20,890,768) 20,979,968
73,449 17,949 (53,785) 37,613
321,661 41,616 (157,166) 206,111
468,686 99,443 (272,898) 295,231
337,568 214,868 (234,871) 317,565
2,352,130 1,787,956 (2,227,983) 1,912,103
24,336 24,336 (48,672) –
102,288 58,093 (58,610) 101,771
9,434 1,000 (1,688) 8,746
740,689 – (740,639) 50
30,163,013 29,238,269 (30,466,425) 28,934,857
639,577 375,664 (327,623) 687,618
937,629 701,783 (648,035) 991,377
1,612,347 1,450,608 (1,307,892) 1,755,063
1,642,730 1,364,187 (1,129,947) 1,876,970
16,807 – (4,169) 12,638

Audited Annual Report and Accounts 37
The notes on pages 236 to 244 form an integral part of these financial statements.
(1) New Fund launched, see Note 1, for further details.
Statement of Changes in Shares Outstanding
as at 31 August 2009 continued
Shares outstanding
at the end
of the year
Shares
repurchased
Shares
issued
Shares outstanding
at the beginning
of the year
Emerging Markets Bond Fund
A Class distributing (D) share
A Class distributing (M) share
A Class non-distributing share
A Class EUR hedged non-distributing share
B Class distributing (D) share
B Class non-distributing share
C Class distributing (D) share
C Class non-distributing share
D Class non-distributing share
E Class non-distributing share
Q Class distributing (D) share
X Class non-distributing share
X Class EUR hedged non-distributing share
Euro Bond Fund
A Class distributing (D) share
A Class distributing (M) share
A Class non-distributing share
B Class distributing (D) share
B Class non-distributing share
C Class distributing (D) share
C Class non-distributing share
D Class non-distributing share
E Class non-distributing share
Q Class distributing (D) share
Q Class non-distributing share
X Class non-distributing share
Euro Corporate Bond Fund
A Class distributing (D) share
A Class distributing (M) share
A Class non-distributing share
B Class distributing (D) share
B Class non-distributing share
C Class non-distributing share
D Class non-distributing share
E Class non-distributing share
X Class non-distributing share
Euro Reserve Fund(1)
A Class non-distributing share
B Class non-distributing share
C Class non-distributing share
D Class non-distributing share
E Class non-distributing share
Q Class non-distributing share
Euro Short Duration Bond Fund
A Class distributing (D) share
A Class distributing (M) share
A Class non-distributing share
B Class distributing (D) share
B Class non-distributing share
C Class distributing (D) share
C Class non-distributing share
D Class non-distributing share
E Class non-distributing share
Q Class non-distributing share
X Class non-distributing share
1,450,829 368,966 (372,674) 1,447,121
349,842 105,511 (155,982) 299,371
2,581,329 7,081,528 (8,286,971) 1,375,886
– 890,181 – 890,181
786,645 766,336 (392,838) 1,160,143
159,775 167,743 (68,233) 259,285
534,783 206,975 (139,595) 602,163
298,486 108,492 (24,491) 382,487
39,530 240,979 (47,380) 233,129
738,094 1,199,799 (950,186) 987,707
2,138,824 30,200 (638,079) 1,530,945
944,330 1,270,000 (5,713) 2,208,617
3,550,688 1,800,688 (1,800,688) 3,550,688
287,826 287,103 (252,860) 322,069
835,106 1,004,200 (1,400,110) 439,196
31,475,535 23,608,893 (25,004,923) 30,079,505
267,909 50,041 (57,134) 260,816
303,998 56,305 (247,467) 112,836
137,770 33,321 (28,740) 142,351
145,462 36,277 (32,470) 149,269
8,317,830 8,100,117 (11,037,165) 5,380,782
2,821,667 2,235,092 (2,786,946) 2,269,813
52,149 35 (7,556) 44,628
161,850 – (68,193) 93,657
44,875 7,728 (9,160) 43,443
4,228 65,735 (3,020) 66,943
3,128 11,674 (2,940) 11,862
2,807,982 4,175,593 (4,310,357) 2,673,218
5,947 6,973 (2,446) 10,474
9,008 51,927 (51,568) 9,367
26,731 – (12,000) 14,731
– 548,627 (548,627) –
268,784 1,908,892 (668,602) 1,509,074
– 849,442 – 849,442
– 2,260,597 (107,087) 2,153,510
– 38,235 (1,597) 36,638
– 107,420 (11,891) 95,529
– 15,323 – 15,323
– 691,407 (78,590) 612,817
– 1,435 – 1,435
14,417 927,493 (699,476) 242,434
283,941 173,646 (361,899) 95,688
2,816,952 19,720,721 (10,880,503) 11,657,170
28,415 50,734 (19,082) 60,067
56,044 648,198 (197,332) 506,910
24,388 142,858 – 167,246
326,275 3,703,753 (393,649) 3,636,379
3,322,647 13,575,468 (7,033,750) 9,864,365
5,249,456 30,574,831 (11,838,318) 23,985,969
13,725 – (13,725) –
– 6,622,517 – 6,622,517
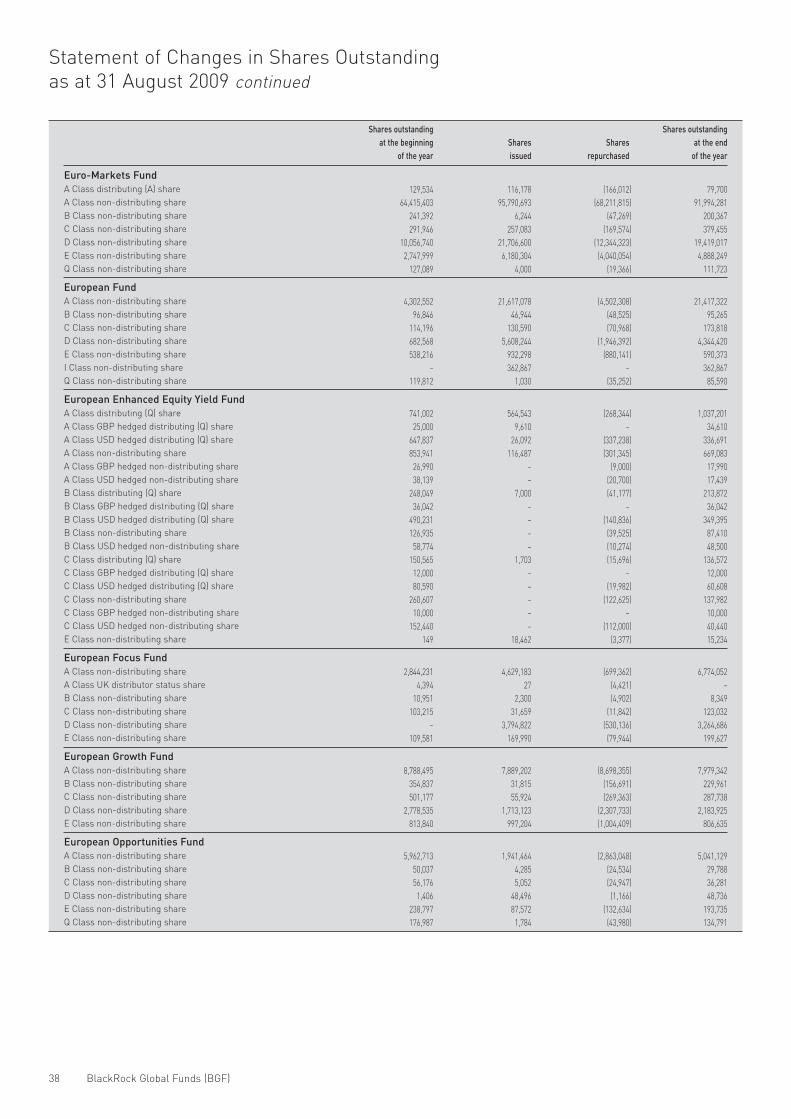
38 BlackRock Global Funds (BGF)
Statement of Changes in Shares Outstanding
as at 31 August 2009 continued
Shares outstanding
at the end
of the year
Shares
repurchased
Shares
issued
Shares outstanding
at the beginning
of the year
Euro-Markets Fund
A Class distributing (A) share
A Class non-distributing share
B Class non-distributing share
C Class non-distributing share
D Class non-distributing share
E Class non-distributing share
Q Class non-distributing share
European Fund
A Class non-distributing share
B Class non-distributing share
C Class non-distributing share
D Class non-distributing share
E Class non-distributing share
I Class non-distributing share
Q Class non-distributing share
European Enhanced Equity Yield Fund
A Class distributing (Q) share
A Class GBP hedged distributing (Q) share
A Class USD hedged distributing (Q) share
A Class non-distributing share
A Class GBP hedged non-distributing share
A Class USD hedged non-distributing share
B Class distributing (Q) share
B Class GBP hedged distributing (Q) share
B Class USD hedged distributing (Q) share
B Class non-distributing share
B Class USD hedged non-distributing share
C Class distributing (Q) share
C Class GBP hedged distributing (Q) share
C Class USD hedged distributing (Q) share
C Class non-distributing share
C Class GBP hedged non-distributing share
C Class USD hedged non-distributing share
E Class non-distributing share
European Focus Fund
A Class non-distributing share
A Class UK distributor status share
B Class non-distributing share
C Class non-distributing share
D Class non-distributing share
E Class non-distributing share
European Growth Fund
A Class non-distributing share
B Class non-distributing share
C Class non-distributing share
D Class non-distributing share
E Class non-distributing share
European Opportunities Fund
A Class non-distributing share
B Class non-distributing share
C Class non-distributing share
D Class non-distributing share
E Class non-distributing share
Q Class non-distributing share
129,534 116,178 (166,012) 79,700
64,415,403 95,790,693 (68,211,815) 91,994,281
241,392 6,244 (47,269) 200,367
291,946 257,083 (169,574) 379,455
10,056,740 21,706,600 (12,344,323) 19,419,017
2,747,999 6,180,304 (4,040,054) 4,888,249
127,089 4,000 (19,366) 111,723
4,302,552 21,617,078 (4,502,308) 21,417,322
96,846 46,944 (48,525) 95,265
114,196 130,590 (70,968) 173,818
682,568 5,608,244 (1,946,392) 4,344,420
538,216 932,298 (880,141) 590,373
– 362,867 – 362,867
119,812 1,030 (35,252) 85,590
741,002 564,543 (268,344) 1,037,201
25,000 9,610 – 34,610
647,837 26,092 (337,238) 336,691
853,941 116,487 (301,345) 669,083
26,990 – (9,000) 17,990
38,139 – (20,700) 17,439
248,049 7,000 (41,177) 213,872
36,042 – – 36,042
490,231 – (140,836) 349,395
126,935 – (39,525) 87,410
58,774 – (10,274) 48,500
150,565 1,703 (15,696) 136,572
12,000 – – 12,000
80,590 – (19,982) 60,608
260,607 – (122,625) 137,982
10,000 – – 10,000
152,440 – (112,000) 40,440
149 18,462 (3,377) 15,234
2,844,231 4,629,183 (699,362) 6,774,052
4,394 27 (4,421) –
10,951 2,300 (4,902) 8,349
103,215 31,659 (11,842) 123,032
– 3,794,822 (530,136) 3,264,686
109,581 169,990 (79,944) 199,627
8,788,495 7,889,202 (8,698,355) 7,979,342
354,837 31,815 (156,691) 229,961
501,177 55,924 (269,363) 287,738
2,778,535 1,713,123 (2,307,733) 2,183,925
813,840 997,204 (1,004,409) 806,635
5,962,713 1,941,464 (2,863,048) 5,041,129
50,037 4,285 (24,534) 29,788
56,176 5,052 (24,947) 36,281
1,406 48,496 (1,166) 48,736
238,797 87,572 (132,634) 193,735
176,987 1,784 (43,980) 134,791

Audited Annual Report and Accounts 39
The notes on pages 236 to 244 form an integral part of these financial statements.
Statement of Changes in Shares Outstanding
as at 31 August 2009 continued
Shares outstanding
at the end
of the year
Shares
repurchased
Shares
issued
Shares outstanding
at the beginning
of the year
European Value Fund
A Class distributing (A) share
A Class non-distributing share
A Class UK distributor status share
B Class non-distributing share
C Class non-distributing share
D Class non-distributing share
E Class non-distributing share
Q Class non-distributing share
Fixed Income Global Opportunities Fund
A Class distributing (Q) share
A Class EUR hedged distributing (Q) share
A Class SGD hedged distributing (Q) share
A Class non-distributing share
A Class EUR hedged non-distributing share
A Class SGD hedged non-distributing share
A Class UK distributor status GBP hedged share
B Class distributing (Q) share
B Class EUR hedged distributing (Q) share
B Class non-distributing share
B Class EUR hedged non-distributing share
C Class distributing (Q) share
C Class EUR hedged distributing (Q) share
C Class non-distributing share
D Class EUR hedged non-distributing share
E Class non-distributing share
E Class EUR hedged non-distributing share
Global Allocation Fund
A Class distributing (A) share
A Class EUR hedged distributing (A) share
A Class non-distributing share
A Class CHF hedged non-distributing share
A Class EUR hedged non-distributing share
A Class GBP hedged non-distributing share
A Class SGD hedged non-distributing share
B Class non-distributing share
B Class EUR hedged non-distributing share
C Class non-distributing share
C Class EUR hedged non-distributing share
D Class non-distributing share
D Class EUR hedged non-distributing share
E Class non-distributing share
E Class EUR hedged non-distributing share
J Class non-distributing share
Q Class non-distributing share
X Class non-distributing share
X Class EUR hedged non-distributing share
Global Corporate Bond Fund
A Class EUR hedged distributing (A) share
A Class non-distributing share
A Class EUR hedged non-distributing share
D Class non-distributing share
D Class EUR hedged non-distributing share
E Class non-distributing share
E Class EUR hedged non-distributing share
X Class EUR hedged non-distributing share
X Class UK distributor status GBP hedged share
8,445 2,932 (3,915) 7,462
3,229,096 2,717,476 (3,251,410) 2,695,162
168,642 4,759,525 (2,843,952) 2,084,215
406,599 37,474 (190,098) 253,975
402,537 78,084 (194,960) 285,661
616,326 882,957 (423,663) 1,075,620
200,757 88,096 (148,074) 140,779
1,582,643 11,386 (453,801) 1,140,228
608,001 86,464 (172,599) 521,866
177,747 14,156 (38,801) 153,102
13,000 – – 13,000
1,595,564 2,099,625 (1,388,025) 2,307,164
1,650,517 1,481,288 (2,424,852) 706,953
136,150 – – 136,150
8,593,752 5,241,174 (13,834,926) –
981,545 96,394 (326,482) 751,457
9,859 – (3,400) 6,459
347,552 16,439 (69,005) 294,986
82,369 – (11,758) 70,611
921,588 266,564 (557,124) 631,028
12,900 1,260 (12,900) 1,260
374,309 62,889 (215,351) 221,847
1,115,763 12,890 (1,128,332) 321
50,894 33,621 (53,069) 31,446
495,801 94,288 (277,244) 312,845
– 11 (5) 6
4,233,499 429,424 (1,641,610) 3,021,313
229,998,635 92,964,935 (167,813,963) 155,149,607
1,843,598 618,166 (976,897) 1,484,867
51,113,982 16,279,084 (22,226,057) 45,167,009
1,205,059 767,376 (958,576) 1,013,859
15,414,945 2,772,977 (4,568,456) 13,619,466
41,759,060 4,985,529 (15,071,815) 31,672,774
2,547,234 274,325 (996,578) 1,824,981
47,965,554 7,575,905 (18,475,455) 37,066,004
13,209,425 2,021,231 (5,440,814) 9,789,842
1,309,795 1,916,312 (1,749,219) 1,476,888
5,244,236 3,092,383 (4,869,321) 3,467,298
12,945,530 5,579,536 (7,136,207) 11,388,859
50,836,328 12,378,642 (24,049,314) 39,165,656
1,991,776 – (551,541) 1,440,235
13,108,319 75,505 (3,381,510) 9,802,314
2,347,712 – (781,034) 1,566,678
349,544 – (2,042) 347,502
2,999,958 75,559 (3,012,609) 62,908
3,635 1,994,927 (231,926) 1,766,636
– 1,620,570 (1,511,497) 109,073
– 1,532,731 (74,736) 1,457,995
– 782,710 (476,518) 306,192
8,725 83,950 (48,086) 44,589
13,039 222,219 (39,507) 195,751
– 6,796,028 (2,229,092) 4,566,936
– 41,407,139 (19,300,999) 22,106,140

40 BlackRock Global Funds (BGF)
Statement of Changes in Shares Outstanding
as at 31 August 2009 continued
Shares outstanding
at the end
of the year
Shares
repurchased
Shares
issued
Shares outstanding
at the beginning
of the year
Global Dynamic Equity Fund
A Class distributing (A) share
A Class non-distributing share
A Class EUR hedged non-distributing share
B Class non-distributing share
C Class non-distributing share
C Class EUR hedged non-distributing share
D Class non-distributing share
E Class non-distributing share
Q Class non-distributing share
X Class non-distributing share
Global Enhanced Equity Yield Fund
A Class distributing (Q) share
A Class EUR hedged distributing (Q) share
A Class non-distributing share
A Class EUR hedged non-distributing share
A Class SGD hedged non-distributing share
B Class distributing (Q) share
B Class non-distributing share
C Class distributing (Q) share
C Class non-distributing share
C Class EUR hedged non-distributing share
D Class non-distributing share
E Class non-distributing share
E Class EUR hedged non-distributing share
Global Equity Fund
A Class distributing (A) share
A Class non-distributing share
A Class UK distributor status share
B Class non-distributing share
C Class non-distributing share
D Class non-distributing share
E Class non-distributing share
Q Class non-distributing share
Global Government Bond Fund
A Class distributing (D) share
A Class EUR hedged distributing (D) share
A Class distributing (M) share
A Class EUR hedged distributing (M) share
A Class non-distributing share
A Class EUR hedged non-distributing share
B Class distributing (D) share
B Class EUR hedged distributing (D) share
B Class non-distributing share
B Class EUR hedged non-distributing share
C Class distributing (D) share
C Class EUR hedged distributing (D) share
C Class distributing (M) share
C Class non-distributing share
C Class EUR hedged non-distributing share
D Class EUR hedged non-distributing share
E Class non-distributing share
E Class EUR hedged non-distributing share
Q Class distributing (D) share
Q Class EUR hedged distributing (D) share
Q Class non-distributing share
Q Class EUR hedged non-distributing share
– 8 (7) 1
28,494,873 23,759,771 (23,858,609) 28,396,035
4,233,379 3,061,326 (5,349,440) 1,945,265
7,463,815 2,556,260 (3,185,400) 6,834,675
6,330,552 2,854,516 (2,643,890) 6,541,178
32,574 88,118 (3,874) 116,818
1,179,339 10,673,214 (8,748,427) 3,104,126
576,542 1,023,325 (444,820) 1,155,047
670,111 1,611 (171,626) 500,096
10,402,144 6 (4,884,998) 5,517,152
19,819,801 2,076,117 (6,544,100) 15,351,818
1,182,128 96,354 (177,280) 1,101,202
7,442,190 3,386,060 (3,661,670) 7,166,580
3,147,409 2,237,214 (1,887,715) 3,496,908
272,380 – (209,750) 62,630
7,356,001 522,797 (3,451,922) 4,426,876
1,991,674 92,492 (855,839) 1,228,327
3,830,617 247,640 (1,943,425) 2,134,832
2,001,757 72,412 (1,272,727) 801,442
800 – (800) –
– 73,443 (7,177) 66,266
1,036 21,815 (12,366) 10,485
24,962 38,351 (43,994) 19,319
5,011 – (133) 4,878
19,317,502 21,388,800 (11,299,874) 29,406,428
8,852,781 5,887,996 (5,967,003) 8,773,774
227,767 – (140,940) 86,827
78,814 121,052 (2,671) 197,195
– 501,188 (11,646) 489,542
314,085 5,172,751 (1,016,345) 4,470,491
341,067 – (118,890) 222,177
131,713 376,489 (261,098) 247,104
85,912 1,522 (62,612) 24,822
105,002 3,274,450 (2,636,480) 742,972
39,714 408,630 (334,367) 113,977
10,510,373 14,313,198 (18,924,377) 5,899,194
5,859,664 4,762,628 (6,081,710) 4,540,582
108,530 830,831 (473,375) 465,986
5,259 16,349 – 21,608
232,190 1,440,789 (816,901) 856,078
6,317 59,985 (1,803) 64,499
44,423 791,645 (423,987) 412,081
9,565 80,421 (17,195) 72,791
– 58,233 (37,706) 20,527
42,481 1,788,318 (870,793) 960,006
605 129,645 (44,972) 85,278
1,842,554 1,998,811 (2,401,660) 1,439,705
407,995 407,292 (462,284) 353,003
1,148,037 928,419 (1,478,600) 597,856
64,595 128 (11,269) 53,454
1,000 – – 1,000
332,074 729 (51,009) 281,794
49,451 – (2,815) 46,636

Audited Annual Report and Accounts 41
The notes on pages 236 to 244 form an integral part of these financial statements.
(1) New Fund launched, see Note 1, for further details.
Statement of Changes in Shares Outstanding
as at 31 August 2009 continued
Shares outstanding
at the end
of the year
Shares
repurchased
Shares
issued
Shares outstanding
at the beginning
of the year
Global High Yield Bond Fund
A Class distributing (D) share
A Class EUR hedged distributing (D) share
A Class distributing (M) share
A Class EUR hedged distributing (M) share
A Class non-distributing share
A Class EUR hedged non-distributing share
B Class distributing (D) share
B Class EUR hedged distributing (D) share
B Class non-distributing share
B Class EUR hedged non-distributing share
C Class distributing (D) share
C Class EUR hedged distributing (D) share
C Class EUR hedged distributing (M) share
C Class non-distributing share
C Class EUR hedged non-distributing share
D Class non-distributing share
D Class GBP hedged non-distributing share
E Class non-distributing share
E Class EUR hedged non-distributing share
I Class non-distributing share
Q Class EUR hedged distributing (D) share
Q Class non-distributing share
Q Class EUR hedged non-distributing share
X Class EUR hedged non-distributing share
Global Inflation Linked Bond Fund(1)
A Class distributing (M) share
A Class non-distributing share
A Class EUR hedged non-distributing share
C Class distributing (M) share
C Class non-distributing share
X Class EUR hedged non-distributing share
Global Opportunities Fund
A Class non-distributing share
B Class non-distributing share
C Class non-distributing share
D Class non-distributing share
E Class non-distributing share
Q Class non-distributing share
Global SmallCap Fund
A Class non-distributing share
B Class non-distributing share
C Class non-distributing share
D Class non-distributing share
E Class non-distributing share
Q Class non-distributing share
India Fund
A Class non-distributing share
A Class UK distributor status share
B Class non-distributing share
C Class non-distributing share
D Class non-distributing share
E Class non-distributing share
X Class non-distributing share
1,858,490 1,526,038 (863,115) 2,521,413
73,927 39,059 (42,896) 70,090
953,583 4,821,875 (2,642,078) 3,133,380
1,697,899 1,934,015 (1,587,640) 2,044,274
2,680,586 12,423,008 (12,526,370) 2,577,224
3,609,222 12,169,000 (9,247,503) 6,530,719
694,770 553,624 (616,596) 631,798
49,699 – (28,454) 21,245
716 145,579 – 146,295
14,188 20,797 (3,589) 31,396
173,639 611,136 (167,673) 617,102
109,761 35,043 (26,155) 118,649
120,754 50,360 (128,723) 42,391
38,205 114,062 (54,981) 97,286
64,730 31,398 (59,025) 37,103
459,171 366,693 (468,926) 356,938
29,485 144,565 (21,462) 152,588
43,106 245,771 (147,313) 141,564
1,350,791 1,129,418 (1,120,687) 1,359,522
494,020 – (494,020) –
3,417 262 – 3,679
2,037 – – 2,037
13,030 – (3,410) 9,620
5,799,611 2,388,831 (2,810,082) 5,378,360
– 784,910 (45,000) 739,910
– 1,394,559 – 1,394,559
– 252,349 – 252,349
– 322,955 – 322,955
– 894,300 (14,400) 879,900
– 1,100,000 – 1,100,000
3,655,856 2,610,051 (3,429,241) 2,836,666
33,692 8,980 (10,425) 32,247
36,030 9,802 (18,746) 27,086
– 406,500 (218,300) 188,200
316,808 179,375 (182,863) 313,320
44,888 – (1,928) 42,960
2,202,522 2,189,396 (1,382,166) 3,009,752
401,172 85,356 (171,681) 314,847
405,782 72,529 (147,809) 330,502
415,502 175,796 (49,970) 541,328
57,456 58,811 (46,993) 69,274
255,766 285 (49,477) 206,574
33,747,015 25,134,375 (32,451,369) 26,430,021
2,375,437 1,262,000 (3,572,383) 65,054
1,918,017 350,940 (566,095) 1,702,862
2,493,266 261,206 (1,174,109) 1,580,363
188,508 358,831 (160,701) 386,638
2,844,348 2,309,699 (2,458,695) 2,695,352
520,500 – – 520,500

42 BlackRock Global Funds (BGF)
(2) Fund name changed, see Note 1, for further details.
Statement of Changes in Shares Outstanding
as at 31 August 2009 continued
Shares outstanding
at the end
of the year
Shares
repurchased
Shares
issued
Shares outstanding
at the beginning
of the year
Japan Fund
A Class non-distributing share
A Class EUR hedged non-distributing share
B Class non-distributing share
C Class non-distributing share
D Class non-distributing share
E Class non-distributing share
Q Class non-distributing share
Japan Small & MidCap Opportunities Fund(2)
A Class non-distributing share
A Class EUR hedged non-distributing share
A Class UK distributor status share
B Class non-distributing share
C Class non-distributing share
D Class non-distributing share
E Class non-distributing share
Q Class non-distributing share
Japan Value Fund
A Class non-distributing share
A Class EUR hedged non-distributing share
A Class UK distributor status share
B Class non-distributing share
C Class non-distributing share
D Class non-distributing share
E Class non-distributing share
E Class EUR hedged non-distributing share
Latin American Fund
A Class distributing (A) share
A Class non-distributing share
A Class UK distributor status share
B Class non-distributing share
C Class non-distributing share
D Class non-distributing share
E Class non-distributing share
J Class non-distributing share
Q Class non-distributing share
Local Emerging Markets Short Duration Bond Fund
A Class distributing (D) share
A Class distributing (M) share
A Class non-distributing share
A Class EUR hedged non-distributing share
A Class SGD hedged non-distributing share
B Class distributing (D) share
B Class non-distributing share
C Class distributing (D) share
C Class non-distributing share
D Class non-distributing share
E Class non-distributing share
Q Class distributing (D) share
Q Class non-distributing share
X Class distributing (D) share
X Class non-distributing share
2,962,674 1,378,622 (2,245,145) 2,096,151
20,782 344,507 (318,798) 46,491
195,388 5,273 (90,508) 110,153
116,435 36,498 (31,693) 121,240
382,973 169,165 (474,682) 77,456
784,187 948,929 (1,363,903) 369,213
178,673 – (10,474) 168,199
5,312,274 6,722,310 (7,134,698) 4,899,886
35,706 468,000 (382,978) 120,728
180,383 226,734 (385,302) 21,815
348,295 12,714 (151,444) 209,565
278,965 52,339 (106,488) 224,816
5,092 114,452 (75,210) 44,334
423,982 189,914 (299,296) 314,600
129,888 400 (31,523) 98,765
40,992,429 19,809,514 (44,719,484) 16,082,459
1,025,320 321,011 (1,151,482) 194,849
2,878,444 2,505,277 (2,999,065) 2,384,656
2,065,935 37,314 (872,905) 1,230,344
3,513,726 145,506 (1,506,189) 2,153,043
1,385,950 3,379,755 (2,701,006) 2,064,699
737,021 354,133 (522,163) 568,991
164,300 231,878 (301,124) 95,054
– 2,766 (113) 2,653
61,450,176 50,827,499 (48,553,917) 63,723,758
253,348 3,117,525 (1,117,421) 2,253,452
405,511 105,501 (165,366) 345,646
970,717 294,597 (518,357) 746,957
453,953 871,884 (283,776) 1,042,061
3,765,364 2,923,566 (3,051,555) 3,637,375
997,460 153,253 (212,610) 938,103
171,212 19,056 (42,282) 147,986
41,465,448 7,008,563 (25,536,600) 22,937,411
28,858,871 8,363,443 (22,929,837) 14,292,477
21,590,391 13,805,712 (22,600,682) 12,795,421
97,357 110,556 (107,750) 100,163
4,208,682 129,936 (1,408,762) 2,929,856
13,968,700 3,218,357 (9,302,178) 7,884,879
1,737,780 294,500 (1,371,620) 660,660
19,939,640 4,050,076 (13,324,009) 10,665,707
5,362,448 1,440,844 (3,758,746) 3,044,546
316,044 2,920,709 (1,575,654) 1,661,099
414,988 343,448 (415,694) 342,742
44,341,033 559,134 (26,051,314) 18,848,853
1,330,592 – (699,570) 631,022
31,679,337 1,695,850 (8,989,111) 24,386,076
– 3,924,196 (550,000) 3,374,196

Audited Annual Report and Accounts 43
The notes on pages 236 to 244 form an integral part of these financial statements.
Statement of Changes in Shares Outstanding
as at 31 August 2009 continued
Shares outstanding
at the end
of the year
Shares
repurchased
Shares
issued
Shares outstanding
at the beginning
of the year
New Energy Fund
A Class distributing (A) share
A Class non-distributing share
A Class UK distributor status share
B Class non-distributing share
C Class non-distributing share
D Class non-distributing share
E Class non-distributing share
I Class non-distributing share
Q Class non-distributing share
X Class non-distributing share
Pacific Equity Fund
A Class non-distributing share
B Class non-distributing share
C Class non-distributing share
D Class non-distributing share
E Class non-distributing share
Q Class non-distributing share
Strategic Allocation Fund (Euro)
A Class non-distributing share
B Class non-distributing share
C Class non-distributing share
E Class non-distributing share
Q Class non-distributing share
Strategic Allocation Fund (US Dollar)
A Class non-distributing share
B Class non-distributing share
C Class non-distributing share
E Class non-distributing share
Q Class non-distributing share
Swiss Opportunities Fund
A Class non-distributing share
D Class non-distributing share
United Kingdom Fund
A Class non-distributing share
A Class UK distributor status share
B Class non-distributing share
C Class non-distributing share
D Class non-distributing share
E Class non-distributing share
Q Class non-distributing share
US Basic Value Fund
A Class distributing (A) share
A Class non-distributing share
A Class EUR hedged non-distributing share
A Class UK distributor status share
B Class non-distributing share
B Class EUR hedged non-distributing share
C Class non-distributing share
C Class EUR hedged non-distributing share
D Class non-distributing share
E Class non-distributing share
E Class EUR hedged non-distributing share
Q Class non-distributing share
– 32,312 (365) 31,947
377,958,489 186,706,317 (216,320,632) 348,344,174
8,644,155 1,762,055 (8,015,777) 2,390,433
4,242,347 376,612 (1,722,178) 2,896,781
7,516,630 2,156,192 (3,297,007) 6,375,815
1,935,333 4,568,371 (3,771,206) 2,732,498
61,171,143 22,986,222 (28,225,194) 55,932,171
292,602 60,500 – 353,102
18,151 – – 18,151
2,520,161 18,282,847 – 20,803,008
4,058,217 2,353,870 (3,041,584) 3,370,503
841,395 57,990 (232,692) 666,693
651,475 94,896 (296,127) 450,244
694,714 2,917,569 (878,551) 2,733,732
586,000 511,326 (495,404) 601,922
865,739 4,861 (151,170) 719,430
1,107,142 1,111,947 (788,143) 1,430,946
42,672 59 (13,346) 29,385
3,645 – – 3,645
500,739 151,422 (314,130) 338,031
334,201 5,890 (55,276) 284,815
1,452,721 710,407 (582,883) 1,580,245
117,653 – (42,499) 75,154
55,703 20,052 (14,000) 61,755
24,308 14,203 (17,597) 20,914
94,363 – (27,550) 66,813
405,057 858,435 (530,044) 733,448
13,503 143,187 (339) 156,351
1,916,628 2,210,754 (1,354,063) 2,773,319
1,284,479 748,085 (476,002) 1,556,562
16,073 8,117 (9,370) 14,820
13,098 2,256 (1,560) 13,794
73,666 609,432 (206,213) 476,885
218,344 58,777 (84,619) 192,502
2,404 – (1,300) 1,104
1,380,892 999,405 (37,607) 2,342,690
17,625,621 28,449,572 (18,540,349) 27,534,844
594,343 1,002,048 (795,788) 800,603
1,349,555 5,054,965 (3,860,124) 2,544,396
828,675 362,301 (306,716) 884,260
10,400 – – 10,400
574,879 153,533 (202,410) 526,002
1,079 1,931 (1,079) 1,931
672,731 1,885,550 (810,831) 1,747,450
294,228 226,412 (193,589) 327,051
347,535 567,318 (783,197) 131,656
1,601,408 7,267 (266,271) 1,342,404

44 BlackRock Global Funds (BGF)
(2) Fund name changed, see Note 1, for further details.
Statement of Changes in Shares Outstanding
as at 31 August 2009 continued
Shares outstanding
at the end
of the year
Shares
repurchased
Shares
issued
Shares outstanding
at the beginning
of the year
US Dollar Core Bond Fund
A Class distributing (D) share
A Class distributing (M) share
A Class non-distributing share
B Class distributing (D) share
B Class non-distributing share
C Class distributing (D) share
C Class non-distributing share
E Class non-distributing share
Q Class distributing (D) share
Q Class non-distributing share
X Class non-distributing share
US Dollar High Yield Bond Fund
A Class distributing (D) share
A Class distributing (M) share
A Class non-distributing share
A Class EUR hedged non-distributing share
B Class distributing (D) share
B Class non-distributing share
C Class distributing (D) share
C Class non-distributing share
E Class non-distributing share
Q Class distributing (D) share
Q Class non-distributing share
X Class non-distributing share
US Dollar Reserve Fund(2)
A Class non-distributing share
A Class EUR hedged non-distributing share
A Class GBP hedged non-distributing share
A Class UK distributor status GBP hedged share
B Class non-distributing share
B Class EUR hedged non-distributing share
B Class GBP hedged non-distributing share
C Class non-distributing share
C Class EUR hedged non-distributing share
C Class GBP hedged non-distributing share
D Class non-distributing share
D Class EUR hedged non-distributing share
E Class non-distributing share
E Class EUR hedged non-distributing share
E Class GBP hedged non-distributing share
Q Class non-distributing share
Q Class EUR hedged non-distributing share
US Dollar Short Duration Bond Fund
A Class distributing (D) share
A Class distributing (M) share
A Class non-distributing share
B Class distributing (D) share
B Class non-distributing share
C Class distributing (D) share
C Class non-distributing share
E Class non-distributing share
X Class non-distributing share
729,512 1,415,330 (817,779) 1,327,063
1,012,680 3,543,200 (2,379,898) 2,175,982
3,815,106 4,872,014 (4,267,985) 4,419,135
1,115,742 1,552,265 (665,704) 2,002,303
1,055,559 802,250 (592,335) 1,265,474
575,023 1,145,030 (520,999) 1,199,054
1,619,105 1,227,632 (1,101,950) 1,744,787
435,494 79,533 (176,842) 338,185
282,930 2,393 (66,555) 218,768
279,839 – (15,363) 264,476
125,360 125,360 (204,372) 46,348
451,160 1,186,912 (596,450) 1,041,622
2,402,590 2,451,973 (2,298,772) 2,555,791
1,515,088 32,455,607 (12,224,068) 21,746,627
2,439,849 191,809 (966,169) 1,665,489
1,156,706 958,838 (458,099) 1,657,445
218,750 186,972 (67,023) 338,699
558,235 702,890 (443,655) 817,470
525,236 156,826 (222,210) 459,852
165,898 227,823 (299,189) 94,532
1,994,106 42,727 (297,521) 1,739,312
62,645 – (14,562) 48,083
5,120,024 50,000 (1,168,907) 4,001,117
3,301,886 4,181,026 (6,200,261) 1,282,651
2,512,097 820,273 (3,332,370) –
86,940 56,082 (78,207) 64,815
9,714 115 (9,829) –
103,973 182,115 (233,989) 52,099
51,523 37,266 (88,789) –
533 237 (237) 533
43,971 51,671 (74,141) 21,501
74,978 215,566 (290,544) –
394 45 (328) 111
150,690 44 (150,734) –
44,233 27,331 (71,564) –
615,115 200,801 (598,840) 217,076
1,655,416 864,309 (2,519,725) –
27,866 10,090 (11,992) 25,964
3,914 – (184) 3,730
4,994 – (4,994) –
132,289 364,057 (135,396) 360,950
44,516 15,681 (16,515) 43,682
3,198,873 4,423,190 (4,107,794) 3,514,269
507,007 320,752 (311,914) 515,845
1,297,975 113,100 (465,743) 945,332
723,725 1,573,406 (1,888,156) 408,975
1,087,935 717,380 (712,231) 1,093,084
1,990,829 860,601 (1,240,239) 1,611,191
459,531 95,122 (217,236) 337,417

Audited Annual Report and Accounts 45
The notes on pages 236 to 244 form an integral part of these financial statements.
(2) Fund name changed, see Note 1, for further details.
Statement of Changes in Shares Outstanding
as at 31 August 2009 continued
Shares outstanding
at the end
of the year
Shares
repurchased
Shares
issued
Shares outstanding
at the beginning
of the year
US Flexible Equity Fund
A Class EUR hedged distributing (A) share
A Class non-distributing share
A Class EUR hedged non-distributing share
A Class UK distributor status share
B Class non-distributing share
B Class EUR hedged non-distributing share
C Class non-distributing share
C Class EUR hedged non-distributing share
D Class non-distributing share
D Class EUR hedged non-distributing share
E Class non-distributing share
E Class EUR hedged non-distributing share
Q Class non-distributing share
X Class non-distributing share
US Focused Value Fund
A Class distributing (A) share
A Class non-distributing share
A Class EUR hedged non-distributing share
A Class UK distributor status share
B Class non-distributing share
C Class non-distributing share
C Class EUR hedged non-distributing share
D Class non-distributing share
E Class non-distributing share
E Class EUR hedged non-distributing share
Q Class non-distributing share
US Government Mortgage Fund
A Class distributing (D) share
A Class distributing (M) share
A Class non-distributing share
A Class EUR hedged non-distributing share
B Class distributing (D) share
B Class non-distributing share
C Class distributing (D) share
C Class distributing (M) share
C Class non-distributing share
D Class non-distributing share
E Class non-distributing share
Q Class distributing (D) share
Q Class non-distributing share
US Growth Fund
A Class non-distributing share
B Class non-distributing share
C Class non-distributing share
D Class non-distributing share
E Class non-distributing share
Q Class non-distributing share
US Small & MidCap Opportunities Fund(2)
A Class non-distributing share
B Class non-distributing share
C Class non-distributing share
D Class non-distributing share
E Class non-distributing share
Q Class non-distributing share
– 46 (1) 45
161,798,628 83,839,409 (149,423,040) 96,214,997
11,021,216 37,145,743 (30,935,518) 17,231,441
5,345,527 11,812,827 (8,278,813) 8,879,541
3,774,702 1,114,203 (1,136,733) 3,752,172
34,719 4,801 (15,672) 23,848
3,360,182 1,167,690 (1,413,386) 3,114,486
176,057 156,535 (170,943) 161,649
12,401,471 14,522,995 (11,150,438) 15,774,028
4,068,338 2,558,192 (2,355,656) 4,270,874
5,268,601 3,585,434 (4,149,604) 4,704,431
6,767,939 5,089,096 (6,605,447) 5,251,588
481,435 3,144 (94,953) 389,626
4,245,374 2,122,056 (1,154,220) 5,213,210
60,797 4,497 (27,716) 37,578
7,023,882 3,622,378 (6,124,114) 4,522,146
18,852 63,773 (75,756) 6,869
722 101 (101) 722
84,280 7,765 (23,953) 68,092
64,018 15,325 (20,666) 58,677
900 – – 900
224,148 1,294,690 (1,511,272) 7,566
414,266 137,573 (197,048) 354,791
172,333 303,497 (216,771) 259,059
201,421 – (48,216) 153,205
2,135,026 2,707,733 (1,338,477) 3,504,282
230,632 7,353,634 (4,839,823) 2,744,443
732,300 10,309,582 (7,929,356) 3,112,526
2,008 5,888 – 7,896
429,579 2,774,583 (1,053,987) 2,150,175
299,563 861,224 (238,082) 922,705
386,526 3,508,985 (2,186,151) 1,709,360
11,164 144,318 (126,010) 29,472
229,846 1,997,594 (919,471) 1,307,969
– 67,671 (50,813) 16,858
94,665 394,143 (406,278) 82,530
815,453 9,798 (144,762) 680,489
30,145 – (18,440) 11,705
17,000,597 26,537,480 (23,781,768) 19,756,309
1,675,176 818,878 (460,651) 2,033,403
2,171,452 650,083 (963,759) 1,857,776
– 7,031,127 (1,290,174) 5,740,953
1,463,571 364,664 (1,447,613) 380,622
394,495 – (58,256) 336,239
967,873 1,562,025 (997,558) 1,532,340
4,160 17,288 (3,481) 17,967
23,178 13,284 (2,408) 34,054
20,959 306,337 (77,364) 249,932
70,622 154,439 (74,191) 150,870
16,489 – (4,935) 11,554

46 BlackRock Global Funds (BGF)
Statement of Changes in Shares Outstanding
as at 31 August 2009 continued
Shares outstanding
at the end
of the year
Shares
repurchased
Shares
issued
Shares outstanding
at the beginning
of the year
US SmallCap Value Fund
A Class non-distributing share
B Class non-distributing share
C Class non-distributing share
E Class non-distributing share
Q Class non-distributing share
World Bond Fund
A Class distributing (D) share
A Class distributing (M) share
A Class non-distributing share
A Class EUR hedged non-distributing share
B Class distributing (D) share
C Class distributing (D) share
D Class non-distributing share
E Class non-distributing share
X Class non-distributing share
X Class CHF hedged non-distributing share
World Energy Fund
A Class distributing (A) share
A Class non-distributing share
A Class EUR hedged non-distributing share
A Class SGD hedged non-distributing share
A Class UK distributor status share
B Class non-distributing share
C Class non-distributing share
C Class EUR hedged non-distributing share
D Class non-distributing share
D Class EUR hedged non-distributing share
E Class non-distributing share
E Class EUR hedged non-distributing share
I Class EUR hedged non-distributing share
Q Class non-distributing share
X Class non-distributing share
World Financials Fund
A Class non-distributing share
B Class non-distributing share
C Class non-distributing share
D Class non-distributing share
E Class non-distributing share
Q Class non-distributing share
World Gold Fund
A Class distributing (A) share
A Class non-distributing share
A Class EUR hedged non-distributing share
A Class SGD hedged non-distributing share
B Class non-distributing share
C Class non-distributing share
C Class EUR hedged non-distributing share
D Class non-distributing share
D Class EUR hedged non-distributing share
E Class non-distributing share
E Class EUR hedged non-distributing share
I Class non-distributing share
I Class EUR hedged non-distributing share
Q Class non-distributing share
X Class non-distributing share
2,406,403 2,006,685 (3,251,295) 1,161,793
167,581 23,706 (49,423) 141,864
87,381 67,656 (66,729) 88,308
111,987 147,275 (167,558) 91,704
341,349 – (43,256) 298,093
46,214 13,278 (26,242) 33,250
2,003 9,694 (7,924) 3,773
998,995 1,844,082 (1,477,722) 1,365,355
88,170 9,044 (7,652) 89,562
18,726 49,533 (9,250) 59,009
12,143 55,449 (7,260) 60,332
15,959 1,345,070 (811,988) 549,041
22,468 155,650 (147,863) 30,255
424,321 1,001,630 (1,108,119) 317,832
5,002,004 – – 5,002,004
– 18,131 (1,921) 16,210
121,731,715 96,324,894 (85,875,433) 132,181,176
2,082,368 11,717,407 (6,208,560) 7,591,215
21,117 1,781,642 (203,816) 1,598,943
3,948,098 1,749,498 (4,730,152) 967,444
1,314,315 616,076 (652,760) 1,277,631
2,254,243 1,849,831 (1,084,666) 3,019,408
10,291 142,154 (46,788) 105,657
3,112,726 5,379,279 (5,633,951) 2,858,054
– 1,064,716 (711,898) 352,818
6,480,718 4,841,581 (4,827,483) 6,494,816
738,335 7,312,995 (6,252,605) 1,798,725
– 1,258,389 (8,389) 1,250,000
184,821 4,552 (37,908) 151,465
16,096,674 3,080,653 (5,758,195) 13,419,132
9,396,747 13,398,481 (10,388,070) 12,407,158
300,879 209,948 (153,588) 357,239
355,653 475,454 (82,484) 748,623
1,215,407 1,107,464 (2,107,774) 215,097
808,756 1,701,358 (1,294,377) 1,215,737
555,738 – (76,370) 479,368
– 12,336 (38) 12,298
132,671,658 102,487,646 (119,823,762) 115,335,542
15,641,560 46,968,374 (45,381,195) 17,228,739
102,597 87,113 (47,398) 142,312
1,112,624 338,796 (490,366) 961,054
1,898,128 678,326 (1,024,713) 1,551,741
125,652 74,287 (106,368) 93,571
1,533,674 8,978,964 (5,724,245) 4,788,393
46,288 3,543,561 (2,478,536) 1,111,313
6,078,927 5,683,074 (6,412,894) 5,349,107
2,024,228 4,458,940 (3,241,852) 3,241,316
175,467 – – 175,467
– 949,796 – 949,796
10,779 – (2,294) 8,485
1,332,296 233,424 (321,296) 1,244,424

Audited Annual Report and Accounts 47
The notes on pages 236 to 244 form an integral part of these financial statements.
Statement of Changes in Shares Outstanding
as at 31 August 2009 continued
Shares outstanding
at the end
of the year
Shares
repurchased
Shares
issued
Shares outstanding
at the beginning
of the year
World Healthscience Fund
A Class non-distributing share
B Class non-distributing share
C Class non-distributing share
D Class non-distributing share
E Class non-distributing share
Q Class non-distributing share
World Income Fund
A Class distributing (D) share
A Class distributing (M) share
A Class non-distributing share
B Class distributing (D) share
B Class non-distributing share
C Class distributing (D) share
C Class non-distributing share
D Class non-distributing share
E Class non-distributing share
J Class distributing (M) share
X Class AUD hedged distributing (M) share
X Class distributing (M) share
World Mining Fund
A Class distributing (A) share
A Class non-distributing share
A Class EUR hedged non-distributing share
A Class SGD hedged non-distributing share
A Class UK distributor status share
B Class non-distributing share
C Class non-distributing share
C Class EUR hedged non-distributing share
D Class non-distributing share
D Class EUR hedged non-distributing share
E Class non-distributing share
E Class EUR hedged non-distributing share
I Class EUR hedged non-distributing share
J Class non-distributing share
Q Class non-distributing share
X Class non-distributing share
World Technology Fund
A Class non-distributing share
B Class non-distributing share
C Class non-distributing share
D Class non-distributing share
E Class non-distributing share
Q Class non-distributing share
13,518,177 22,636,669 (17,894,791) 18,260,055
562,916 147,852 (133,676) 577,092
697,728 327,160 (171,917) 852,971
549,730 2,215,188 (1,079,768) 1,685,150
1,358,266 1,177,926 (1,229,843) 1,306,349
40,198 5,570 (8,306) 37,462
665,141 417,369 (408,646) 673,864
2,645 220,070 (170,150) 52,565
2,008,935 1,782,333 (2,444,803) 1,346,465
1,813,156 369,407 (647,969) 1,534,594
2,016,247 213,796 (656,018) 1,574,025
1,388,277 598,305 (625,613) 1,360,969
3,360,209 285,079 (1,244,405) 2,400,883
2,079,867 118,022 (7,262) 2,190,627
91,498 107,361 (157,962) 40,897
22,063,555 1,165,700 (7,396,400) 15,832,855
– 1,166,575 – 1,166,575
– 546,256 – 546,256
– 39,488 (1,210) 38,278
139,062,506 141,504,190 (119,235,613) 161,331,083
3,322,049 24,079,898 (11,863,587) 15,538,360
1,782,037 916,790 (613,834) 2,084,993
1,497,165 4,425,388 (4,743,275) 1,179,278
927,487 314,771 (383,233) 859,025
2,247,126 1,561,761 (1,289,069) 2,519,818
151,211 191,300 (72,868) 269,643
630,243 3,110,989 (2,362,403) 1,378,829
5,877,460 1,011,903 (976,122) 5,913,241
10,129,239 8,315,905 (8,291,781) 10,153,363
1,863,798 6,199,447 (3,322,551) 4,740,694
2,202,619 – – 2,202,619
55,650 36,857 (11,119) 81,388
5,816 249 (498) 5,567
3,287,108 2,331,606 (2,058,936) 3,559,778
4,843,853 9,012,236 (9,869,522) 3,986,567
150,696 219,435 (28,795) 341,336
116,338 355,472 (64,392) 407,418
1,012,060 254,174 (267,706) 998,528
2,103,150 533,975 (478,957) 2,158,168
914,507 8,111 (171,684) 750,934

48 BlackRock Global Funds (BGF)
(3) Fund merged, see Note 1, for further details.(4) Fund liquidated, see Note 1, for further details.
Statement of Changes in Shares Outstanding
as at 31 August 2009 continued
Shares outstanding
at the end
of the year
Shares
repurchased
Shares
issued
Shares outstanding
at the beginning
of the year
Conservative Allocation Fund (Euro)(3)
A Class distributing (D) share
A Class distributing (M) share
A Class non-distributing share
B Class distributing (D) share
B Class non-distributing share
C Class non-distributing share
E Class non-distributing share
Q Class non-distributing share
Conservative Allocation Fund (US Dollar)(3)
A Class distributing (D) share
A Class distributing (M) share
A Class non-distributing share
B Class distributing (D) share
B Class non-distributing share
C Class distributing (D) share
C Class non-distributing share
E Class non-distributing share
Q Class non-distributing share
Dynamic Reserve Fund(4)
A Class non-distributing share
A Class EUR hedged non-distributing share
E Class non-distributing share
E Class EUR hedged non-distributing share
Global Capital Securities Absolute Return Fund(4)
A Class distributing (D) share
A Class EUR hedged distributing (D) share
A Class distributing (M) share
A Class EUR hedged distributing (M) share
A Class EUR hedged distributing (A) share
A Class non-distributing share
A Class EUR hedged non-distributing share
A Class UK distributor status share
A Class UK distributor status GBP hedged share
B Class distributing (D) share
C Class distributing (D) share
C Class EUR hedged non-distributing share
D Class EUR hedged non-distributing share
E Class non-distributing share
E Class EUR hedged non-distributing share
10,487 – (10,487) –
116 24 (140) –
412,077 12,149 (424,226) –
1,286 7,630 (8,916) –
3,440 – (3,440) –
66,278 – (66,278) –
2,249,824 175,900 (2,425,724) –
24,575 – (24,575) –
11,295 26 (11,321) –
1,393 1,499 (2,892) –
209,174 28,592 (237,766) –
37,136 – (37,136) –
52,749 – (52,749) –
7,781 – (7,781) –
42,939 96,905 (139,844) –
577,810 230,708 (808,518) –
154,724 – (154,724) –
4,800,000 – (4,800,000) –
148,423 – (148,423) –
7,801 12,282 (20,083) –
118,852 25,403 (144,255) –
– 680,596 (680,596) –
– 122,633 (122,633) –
– 714 (714) –
128,079 23,681 (151,760) –
11,207 49,131 (60,338) –
2,340,028 2,318,270 (4,658,298) –
3,542,636 1,786,660 (5,329,296) –
11,458,771 10,424,522 (21,883,293) –
– 122,633 (122,633) –
174,800 12,528 (187,328) –
– 11,968 (11,968) –
6,470 20,000 (26,470) –
207,750 90,000 (297,750) –
19,627 6,689 (26,316) –
363,301 91,563 (454,864) –

Audited Annual Report and Accounts 49
The notes on pages 236 to 244 form an integral part of these financial statements.
Asian Dragon Fund
FUNDS
United Kingdom
5,500,000 Institutional Cash Series Institutional
Liquidity Fund 5,500,000 1.16 ___________ ______
Total Funds 5,500,000 1.16 ___________ ______
COMMON / PREFERRED STOCKS (SHARES) & WARRANTS
Bermuda
4,006,000 Sinofert Holdings 1,814,091 0.38 ___________ ______
China
18,319,000 Bank of China 'H' 8,910,130 1.88
8,042,000 China Citic Bank 'H' 4,845,313 1.02
13,851,000 China Construction Bank 'H' 10,453,889 2.20
1,133,000 China Life Insurance 'H' 4,779,897 1.01
9,506,113 China Petroleum & Chemical 'H' 7,935,022 1.67
6,294,000 China Shanshui Cement Group 3,654,098 0.77
1,555,000 China Shenhua Energy 'H' 6,269,333 1.32
2,243,492 China Vanke 'B' 2,605,001 0.55
319,946 Focus Media Holding ADR 2,815,525 0.59
12,885,000 Industrial & Commercial Bank of
China 'H' 8,793,889 1.85
33,257 New Oriental Education & Technology
Group ADR 2,313,357 0.49
6,881,000 Shui On Land 3,808,463 0.80
135,271 Sina 4,009,432 0.85
12,173,000 Want Want China Holdings 6,470,469 1.36
763,000 Zhuzhou CSR Times Electric 'H' 1,299,390 0.28
3,395,000 Zijin Mining Group 2,838,283 0.60 ___________ ______
81,801,491 17.24 ___________ ______
Hong Kong
1,053,500 China Mobile 10,248,181 2.16
2,783,400 China Resources Power Holdings 6,794,190 1.43
8,166,000 CNOOC 10,725,019 2.26
496,700 Hang Seng Bank 7,055,412 1.49
2,228,000 Henderson Land Development 13,093,160 2.76
141,000 Hong Kong Exchanges and Clearing 2,455,804 0.52
1,348,000 Hongkong Land Holdings 5,486,360 1.15
1,993,000 Hutchison Whampoa 14,013,439 2.95
928,500 Kerry Properties 4,396,316 0.93
1,806,000 Li & Fung 5,999,788 1.26
2,916,500 Ports Design 6,675,080 1.41
58,325,000 Rexcapital Financial Holdings 4,740,632 1.00
10,918,000 Shenzhen Investment 3,929,961 0.83
7,020,000 Towngas China 2,345,729 0.49 ___________ ______
97,959,071 20.64 ___________ ______
India
176,735 ACC 2,921,149 0.61
320,338 Bharti Airtel 2,785,775 0.59
991,930 Cairn India 5,381,714 1.13
126,874 HDFC Bank 3,822,460 0.81
481,025 ICICI Bank 7,400,345 1.56
125,642 Reliance Industries 5,159,748 1.09 ___________ ______
27,471,191 5.79 ___________ ______
Indonesia
21,116,500 Perusahaan Gas Negara 7,279,745 1.53
2,822,500 United Tractors 3,780,134 0.80 ___________ ______
11,059,879 2.33 ___________ ______
Ireland
2,200,360 Morgan Stanley Asia Products
(Call Wts 21/4/2014 – Unitech) 4,837,863 1.02 ___________ ______
Jersey
394,395 JP Morgan International Derivatives
(Call Wts 13/8/2012 – Tata Steel) 3,426,976 0.72 ___________ ______
Malaysia
1,573,500 Malayan Banking 2,908,829 0.61
2,119,700 Tenaga Nasional 4,827,465 1.02 ___________ ______
7,736,294 1.63 ___________ ______
Philippines
264,894 China Banking 2,185,056 0.46 ___________ ______
Singapore
8,906,000 Ascendas India Trust (Unit) 5,151,307 1.08
3,113,000 CapitaLand 8,000,208 1.69
1,111,500 DBS Group Holdings 9,732,060 2.05
1,917,000 Indofood Agri Resources 2,204,339 0.46
976,000 United Overseas Bank 11,290,536 2.38 ___________ ______
36,378,450 7.66 ___________ ______
South Korea
197,719 Dongbu Insurance 6,015,951 1.27
43,489 GS Engineering & Construction 3,332,450 0.70
48,878 Hite Brewery 6,398,873 1.35
53,225 Hyundai Department Store 4,074,233 0.86
122,460 Hyundai Development 4,471,275 0.94
28,711 Hyundai Mobis 3,046,046 0.64
143,526 KT&G 7,734,246 1.63
112,220 LG Display 3,315,652 0.70
21,631 LG Electronics 2,476,766 0.52
25,271 NHN 3,439,883 0.72
27,001 POSCO 9,977,549 2.10
37,340 Samsung Electronics 23,051,597 4.86
12,485 Samsung Electronics (Pref) 4,913,426 1.04
379,950 Shinhan Financial Group 12,473,336 2.63
14,299 Shinsegae 5,930,725 1.25
29,366 SK Energy 2,363,106 0.50
51,897 S-Oil 2,389,365 0.50 ___________ ______
105,404,479 22.21 ___________ ______
Taiwan
5,087,154 Asustek Computer 8,098,276 1.71
3,528,000 Cathay Financial Holding 4,935,653 1.04
3,492,145 China Steel 3,172,122 0.67
10,307,000 Chinatrust Financial Holding 5,730,200 1.21
3,496,839 Chunghwa Telecom 5,991,577 1.26
1 Compal Electronics 1 0.00
3,681,000 Fubon Financial Holding 3,438,725 0.72
562,950 High Tech Computer 5,660,884 1.19
Transferable Securities Admitted to an Official Stock Exchange
Listing or Dealt in on Another Regulated Market
Holding Description Value (US$) %
Transferable Securities Admitted to an Official Stock Exchange
Listing or Dealt in on Another Regulated Market
Holding Description Value (US$) %
Portfolio of Investments 31 August 2009

50 BlackRock Global Funds (BGF)
Asian Dragon Fund continued
3,459,026 HON HAI Precision Industry 11,664,422 2.46
1 Taishin Financial Holding – 0.00
2,295,018 Taiwan Mobile 3,604,650 0.76
9,909,563 Taiwan Semiconductor Manufacturing 17,822,254 3.75 ___________ ______
70,118,764 14.77 ___________ ______
Thailand
2,598,800 Kasikornbank 5,769,166 1.22
1,027,200 Kasikornbank – NVDR 2,189,708 0.46
702,200 PTT 5,037,834 1.06 ___________ ______
12,996,708 2.74 ___________ ______
Total Common / Preferred Stocks (Shares)
& Warrants 463,190,313 97.59 ___________ ______
Total Transferable Securities Admitted
to an Official Stock Exchange Listing or
Dealt in on Another Regulated Market 468,690,313 98.75 ___________ ______
COMMON STOCKS (SHARES)
Bermuda
9,828,600 Euro-Asia Agricultural Holdings – 0.00 ___________ ______
Total Unquoted Securities – 0.00 ___________ ______
Total Portfolio 468,690,313 98.75
Other Net Assets 5,924,567 1.25 ___________ ______
Total Net Assets (US$) 474,614,880 100.00 ___________ ______
Portfolio of Investments 31 August 2009
Transferable Securities Admitted to an Official Stock Exchange
Listing or Dealt in on Another Regulated Market
Holding Description Value (US$) %
Unquoted Securities
Holding Description Value (US$) %
Sector Breakdown as at 31 August 2009
Finance 37.92
Information technology 17.28
Energy 9.53
Consumer discretionary 6.77
Consumer staples 6.05
Industrials 5.67
Materials 5.13
Telecommunication services 4.77
Utilities 4.47
Investment funds 1.16
Other net assets 1.25 __________
100.00 __________
% of net
assets

Audited Annual Report and Accounts 51
The notes on pages 236 to 244 form an integral part of these financial statements.
BONDS
Bermuda
US$264,000 AES China Generating 8.25%
26/6/2010 255,423 0.29 ___________ ______
British Virgin Islands
US$260,000 CLP Power Hong Kong Financing
6.25% 8/5/2012 278,770 0.31
US$1,350,000 CNOOC Finance 2002 5.5% 21/5/2033 1,344,612 1.52
US$300,000 Galaxy Entertainment Finance 9.875%
15/12/2012 279,000 0.31
US$1,000,000 PCCW-HKT Capital No 3 5.25%
20/7/2015 971,319 1.10 ___________ ______
2,873,701 3.24 ___________ ______
Canada
US$700,000 Sino-Forest 9.125% 17/8/2011 717,500 0.81 ___________ ______
Cayman Islands
US$1,200,000 CKWH-UT2 9.125% 31/5/2012
(Perpetual) 1,087,440 1.23
US$2,500,000 DBS Capital Funding 7.657% 15/3/2011
(Perpetual) 2,546,875 2.87
US$1,600,000 Hutchison Whampoa International
03/13 6.5% 13/2/2013 1,729,328 1.95
US$1,500,000 Hutchison Whampoa International
03/33 7.45% 24/11/2033 1,693,625 1.91
US$3,000,000 Hutchison Whampoa International
09 7.625% 9/4/2019 3,429,600 3.87
US$3,000,000 Shimao Property Holdings 8%
1/12/2016 2,632,621 2.97 ___________ ______
13,119,489 14.80 ___________ ______
Hong Kong
US$500,000 HKCG Finance 6.25% 7/8/2018 551,370 0.62 ___________ ______
India
US$1,750,000 ICICI Bank Ltd/Bahrain 6.625%
3/10/2012 1,777,946 2.01
US$750,000 Reliance Industries 10.375%
24/6/2016 904,792 1.02 ___________ ______
2,682,738 3.03 ___________ ______
Indonesia
US$700,000 Indonesia Government International
Bond 6.625% 17/2/2037 649,547 0.73
US$2,000,000 Indonesia Government International
Bond 6.75% 10/3/2014 2,103,916 2.37
US$2,750,000 Indonesia Government International
Bond 7.75% 17/1/2038 2,863,438 3.23
US$1,950,000 Indonesia Government International
Bond 8.5% 12/10/2035 2,203,500 2.49
US$200,000 Indonesia Government International
Bond '144A' 7.5% 15/1/2016 216,500 0.24
US$1,700,000 Indonesia Government International
Bond '144A' 11.625% 4/3/2019 2,295,000 2.59 ___________ ______
10,331,901 11.65 ___________ ______
Malaysia
US$1,000,000 Petronas Capital 5.25% 12/8/2019 989,700 1.12
US$450,000 Petronas Capital 7% 22/5/2012 496,379 0.56
US$200,000 Petronas Capital 7.875% 22/5/2022 243,207 0.27
US$1,250,000 Sarawak International 5.5% 3/8/2015 1,249,993 1.41
US$500,000 TM Global 5.25% 22/9/2014 514,084 0.58 ___________ ______
3,493,363 3.94 ___________ ______
Netherlands
US$1,500,000 KazMunaiGaz Finance Sub '144A'
11.75% 23/1/2015 1,629,375 1.84
US$1,750,000 Majapahit Holding 8% 7/8/2019 1,778,438 2.00 ___________ ______
3,407,813 3.84 ___________ ______
Pakistan
US$1,540,000 Pakistan Government International
Bond 6.875% 1/6/2017 1,262,800 1.43 ___________ ______
Philippines
US$1,000,000 National Power FRN 23/8/2011 1,015,613 1.14
US$1,570,000 Philippine Government International
Bond 7.75% 14/1/2031 1,717,187 1.94
US$2,140,000 Philippine Government International
Bond 8.375% 17/6/2019 2,509,150 2.83
US$1,000,000 Philippine Government International
Bond 9% 15/2/2013 1,161,250 1.31
US$390,000 Philippine Government International
Bond 9.5% 21/10/2024 485,550 0.55
US$1,420,000 Philippine Government International
Bond 9.875% 15/1/2019 1,789,157 2.02
US$330,000 Philippine Long Distance Telephone
8.35% 6/3/2017 361,551 0.41
US$545,000 Philippine Long Distance Telephone
11.375% 15/5/2012 634,925 0.71 ___________ ______
9,674,383 10.91 ___________ ______
Singapore
US$450,000 Oversea-Chinese Banking 7.75%
6/9/2011 489,662 0.55
US$600,000 Singapore Telecommunications 7.375%
1/12/2031 731,988 0.83
US$550,000 United Overseas Bank 4.5% 2/7/2013 560,608 0.63 ___________ ______
1,782,258 2.01 ___________ ______
South Korea
US$600,000 Export-Import Bank of Korea 5.25%
10/2/2014 595,980 0.67
US$3,000,000 Export-Import Bank of Korea 5.5%
17/10/2012 3,104,861 3.50
US$2,000,000 Export-Import Bank of Korea 5.875%
14/1/2015 2,045,008 2.31
US$2,000,000 Export-Import Bank of Korea 8.125%
21/1/2014 2,230,779 2.52
US$1,000,000 GS Caltex 5.5% 25/8/2014 978,065 1.10
US$500,000 Hana Funding 8.748% 17/12/2012
(Perpetual) 416,417 0.47
US$1,000,000 Industrial Bank of Korea 7.125%
23/4/2014 1,080,900 1.22
US$1,300,000 Korea Development Bank 5.3%
17/1/2013 1,307,289 1.48
US$1,500,000 Korea Southern Power 5.375%
18/4/2013 1,524,495 1.72
US$1,300,000 Republic of Korea 7.125% 16/4/2019 1,455,800 1.64
US$1,250,000 Woori Bank 7% 2/2/2015 1,316,064 1.48
US$1,000,000 Woori Bank 7.63% 14/4/2015 1,020,604 1.15 ___________ ______
17,076,262 19.26 ___________ ______
Thailand
US$250,000 PTT PCL 5.75% 1/8/2014 267,443 0.30 ___________ ______
Asian Tiger Bond Fund
Portfolio of Investments 31 August 2009
Transferable Securities Admitted to an Official Stock Exchange
Listing or Dealt in on Another Regulated Market
Holding Description Value (US$) %
Transferable Securities Admitted to an Official Stock Exchange
Listing or Dealt in on Another Regulated Market
Holding Description Value (US$) %

52 BlackRock Global Funds (BGF)
Open Forward Foreign Exchange Transactions as at 31 August 2009
Core Fund
KRW3,273,750,000 US$ 2,700,000 3/9/2009 (78,713)
US$ 2,700,000 KRW3,357,450,000 3/9/2009 11,694
RUB 76,646,900 US$ 2,460,000 4/9/2009 (54,651)
US$ 2,460,000 RUB 78,164,400 4/9/2009 7,028
US$ 5,924,619 ¥ 556,154,662 16/9/2009 (57,089)
€ 3,710,800 US$ 5,262,944 16/9/2009 39,466
€ 14,420,100 ¥ 1,943,633,504 16/9/2009 (299,631)
US$ 3,817,951 € 2,700,000 16/9/2009 (40,114)
¥ 2,504,675,820 € 18,660,000 16/9/2009 275,460 __________
Net unrealised loss (196,550)__________
Note: The net unrealised loss attributed to these transactions is included in the Statement
of Net Assets (see Note 2c).
Value date
Unrealised
profit/(loss)
US$SalesPurchases
Open Futures Contracts as at 31 August 2009
(125) 90 Day Euro $ Future March 2010 (31,020,313)__________
Total commitment (31,020,313)__________
Note: The net unrealised loss of US$32,067 attributed to this transaction is included
in the Statement of Net Assets (see Note 2c).
Value
US$
Expiration
dateContracts/Description
Number
of Contracts
Asian Tiger Bond Fund continued
Vietnam
US$250,000 Vietnam Government International
Bond 4% 12/3/2028
(Step-up coupon) 206,209 0.23 ___________ ______
Total Transferable Securities Admitted
to an Official Stock Exchange Listing or
Dealt in on Another Regulated Market 67,702,653 76.36 ___________ ______
Unquoted Securities
BONDS
Malaysia
US$250,000 Tenaga Nasional 7.5% 1/11/2025 282,673 0.32
US$350,000 Petronas Capital '144A' 7% 22/5/2012 386,652 0.43 ___________ ______
669,325 0.75 ___________ ______
Netherlands
US$1,000,000 Tjiwi Kimia Finance 0% 28/4/2027 15,000 0.02 ___________ ______
Philippines
US$1,000,000 Power Sector Assets & Liabilities
Management 7.25% 27/5/2019 1,034,887 1.17 ___________ ______
Thailand
US$250,000 Bangkok Bank (Hong Kong) 9.025%
15/3/2029 282,325 0.32 ___________ ______
Total Unquoted Securities 2,001,537 2.26 ___________ ______
Total Portfolio 69,704,190 78.62
Other Net Assets 18,949,925 21.38 ___________ ______
Total Net Assets (US$) 88,654,115 100.00 ___________ ______
Portfolio of Investments 31 August 2009
Transferable Securities Admitted to an Official Stock Exchange
Listing or Dealt in on Another Regulated Market
Holding Description Value (US$) %
Unquoted Securities
Holding Description Value (US$) %
Unrealised profit/(loss)
US$DescriptionNominal
Value
Unrealised profit/(loss)
US$DescriptionNominal
Value
US$3,000,000 Credit Default Swaps (Citibank)
(Fund provides default protection on
Indonesia (Republic of) 6.75% 10/3/2014;
and receives Fixed 1.63%) (20/3/2011) (5,095)
US$1,500,000 Credit Default Swaps (Deutsche Bank)
(Fund provides default protection on
Itraxx Asia 9 V1; and receives Fixed 6.5%)
(20/6/2013) 47,464 __________
42,369 __________
Swaps as at 31 August 2009
Note: The total market value of US$54,161 of these transactions is included in the Statement of Net Assets (see Note 2c).

Audited Annual Report and Accounts 53
The notes on pages 236 to 244 form an integral part of these financial statements.
Asian Tiger Bond Fund continued
3,010,000 OTC EUR/CHF Call Option
strike price €1.55
expiring on 5/11/2009 (9,734) 8,447 ___________ _________
Total Purchased Call Options (9,734) 8,447 ___________ _________
Note: Purchased Call Options are included in the Statement of Net Assets (see Note 2c).
Value US$
Unrealised loss US$Issuer
Number ofcontracts
subject to Call
Purchased Call Options as at 31 August 2009
7,020,000 OTC AUD/USD Put Option
strike price AUD 0.77
expiring on 5/11/2009 (20,885) 38,881
5,850,000 OTC AUD/USD Put Option
strike price AUD 0.77
expiring on 5/11/2009 (17,012) 32,401
3,010,000 OTC EUR/CHF Put Option
strike price €1.50
expiring on 5/11/2009 2,221 16,723 ___________ _________
Total Purchased Put Options (35,676) 88,005 ___________ _________
Note: Purchased Put Options are included in the Statement of Net Assets (see Note 2c).
Value US$
Unrealised profit/(loss)
US$Issuer
Number ofcontracts
subject to Put
Purchased Put Options as at 31 August 2009

54 BlackRock Global Funds (BGF)
FUNDS
United Kingdom
7,300,000 Institutional Cash Series Institutional
Liquidity Fund 7,300,000 4.72 ___________ ______
Total Funds 7,300,000 4.72 ___________ ______
COMMON STOCKS (SHARES)
Australia
24,303 BHP Billiton ADR 1,516,507 0.98 ___________ ______
Bermuda
2,504,000 Sinofert Holdings 1,133,920 0.73 ___________ ______
Cayman Islands
1,969,000 FU JI Food and Catering Services
Holdings 642,698 0.42 ___________ ______
China
21,016,000 Bank of China 'H' 10,221,916 6.61
2,896,000 Beijing Capital International Airport 'H' 1,610,337 1.04
5,845,000 China Citic Bank 'H' 3,521,618 2.28
514,000 China Coal Energy 'H' 650,539 0.42
2,773,000 China Communications Construction 'H' 3,169,746 2.05
15,432,000 China Construction Bank 'H' 11,647,132 7.53
1,727,000 China Life Insurance 'H' 7,285,863 4.71
7,320,000 China Petroleum & Chemical 'H' 6,110,212 3.95
1,245,500 China Shenhua Energy 'H' 5,021,514 3.25
6,148,000 China Telecom 3,148,946 2.04
2,139,884 China Vanke 'B' 2,484,698 1.61
4,914,000 Datang International Power Generation 2,612,001 1.69
182,599 Focus Media Holding ADR 1,606,871 1.04
1,526,000 Golden Eagle Retail Group 2,244,400 1.45
1,267,500 Great Wall Motor 'H' 1,092,359 0.71
14,332,000 Industrial & Commercial Bank
of China 'H' 9,781,453 6.32
4,840,000 PetroChina 'H' 5,345,152 3.45
288,500 Ping An Insurance Group Company
of China 'H' 2,158,811 1.39
2,113,500 Shandong Chenming Paper Holdings 'H' 1,439,717 0.93
4,528,500 Shui On Land 2,506,413 1.62
56,137 Sina 1,663,901 1.08
1,273,500 Sinotruk Hong Kong 1,477,065 0.95
5,969,000 Want Want China Holdings 3,172,778 2.05
227,758 WuXi PharmaTech Cayman ADR 2,680,712 1.73
2,108,000 Zhejiang Expressway 'H' 2,004,374 1.30
1,919,000 Zhuzhou CSR Times Electric 'H' 3,268,058 2.11
3,324,000 Zijin Mining Group 2,778,926 1.80 ___________ ______
100,705,512 65.11 ___________ ______
Hong Kong
1,381,500 China Mobile 13,438,882 8.69
1,413,800 China Resources Power Holdings 3,451,040 2.23
1,436,000 China Unicom Hong Kong 2,019,398 1.31
4,793,000 CNOOC 6,295,006 4.07
9,056,000 Franshion Properties China 2,547,029 1.65
7,189,540 GOME Electrical Appliances Holdings 1,910,774 1.24
3,260,000 Huabao International Holdings 3,377,334 2.18
1,348,500 Ports Design 3,086,352 2.00
22,350,000 Rexcapital Financial Holdings 1,816,599 1.17
5,944,000 Shenzhen Investment 2,139,557 1.38 ___________ ______
40,081,971 25.92 ___________ ______
Singapore
779,000 Yanlord Land Group 1,241,119 0.80 ___________ ______
Taiwan
67,000 High Tech Computer 673,735 0.43 ___________ ______
Total Common Stocks (Shares) 145,995,462 94.39 ___________ ______
Total Portfolio 153,295,462 99.11
Other Net Assets 1,369,935 0.89 ___________ ______
Total Net Assets (US$) 154,665,397 100.00 ___________ ______
China Fund
Portfolio of Investments 31 August 2009
Transferable Securities Admitted to an Official Stock Exchange
Listing or Dealt in on Another Regulated Market
Holding Description Value (US$) %
Transferable Securities Admitted to an Official Stock Exchange
Listing or Dealt in on Another Regulated Market
Holding Description Value (US$) %
Sector Breakdown as at 31 August 2009
Finance 35.90
Energy 15.14
Telecommunication services 12.04
Consumer discretionary 8.03
Industrials 7.45
Materials 6.62
Investment funds 4.72
Utilities 3.92
Consumer staples 2.05
Healthcare 1.73
Information technology 1.51
Other net assets 0.89 __________
100.00 __________
% of net
assets

Audited Annual Report and Accounts 55
The notes on pages 236 to 244 form an integral part of these financial statements.
China Fund continued
Open Forward Foreign Exchange Transactions as at 31 August 2009
EUR Hedged Share Class €
€ 26,995,546 US$ 38,187,636 15/9/2009 270,600 386,682
US$ 5,536,404 € 3,897,408 15/9/2009 (22,853) (32,656)__________ __________
Net unrealised profit 247,747 354,026 __________ __________
GBP Hedged Share Class £
£ 499,645 US$ 822,497 15/9/2009 (7,069) (11,476)
US$ 555,798 £ 336,731 15/9/2009 5,679 9,219 __________ __________
Net unrealised loss (1,390) (2,257)__________ __________
SGD Hedged Share Class SGD
US$ 204,876 SGD 296,440 15/9/2009 (643) (445)
SGD 2,801,651 US$ 1,940,081 15/9/2009 589 408 __________ __________
Net unrealised loss (54) (37)__________ __________
Total net unrealised profit 351,732 __________
Note: The net unrealised profit attributed to these transactions is included in the Statement
of Net Assets (see Note 2c).
Unrealised
profit/(loss)
US$ Equivalent
Unrealised
profit/(loss)Value dateSalesPurchases

56 BlackRock Global Funds (BGF)
Continental European Flexible Fund
COMMON / PREFERRED STOCKS (SHARES)
Austria
25,493 bwin Interactive Entertainment 706,411 0.57
101,254 Erste Group Bank 2,996,106 2.45
18,445 Wienerberger 300,285 0.25 ___________ ______
4,002,802 3.27 ___________ ______
Belgium
116,205 InBev 3,450,126 2.81
87,778 KBC Ancora 1,244,692 1.02
160,318 KBC Groep 4,232,395 3.46 ___________ ______
8,927,213 7.29 ___________ ______
Denmark
94,415 Danske Bank 1,756,789 1.44
27,267 Novo Nordisk 'B' 1,166,744 0.95 ___________ ______
2,923,533 2.39 ___________ ______
Finland
71,585 Kone OYJ 'B' 1,726,630 1.41
57,185 Konecranes OYJ 1,129,976 0.92
184,637 Nokian Renkaat 2,896,955 2.37
220,791 Ramirent OYJ 1,426,310 1.16 ___________ ______
7,179,871 5.86 ___________ ______
France
207,267 Beneteau 2,141,068 1.75
45,099 BNP Paribas 2,558,014 2.09
83,322 Bouygues 2,888,357 2.36
74,898 Euler Hermes 3,483,131 2.84
18,264 PPR 1,481,210 1.21
37,730 Thales 1,200,946 0.98 ___________ ______
13,752,726 11.23 ___________ ______
Germany
55,272 Bayer 2,366,747 1.92
23,010 Bilfinger Berger 986,669 0.81
116,117 E.ON 3,433,580 2.80
83,352 ElringKlinger 1,037,732 0.85
136,407 Lanxess 2,863,183 2.34
52,110 MAN 2,775,900 2.27
159,166 Sky Deutschland 533,206 0.44
48,524 ThyssenKrupp 1,142,255 0.93 ___________ ______
15,139,272 12.36 ___________ ______
Greece
357,330 EFG Eurobank Ergasias 3,494,687 2.86
119,319 Terna Energy 651,482 0.53 ___________ ______
4,146,169 3.39 ___________ ______
Ireland
634,443 Grafton Group (Unit) 2,283,995 1.87
1,019,212 Irish Life & Permanent 4,667,991 3.81 ___________ ______
6,951,986 5.68 ___________ ______
Italy
1,631,679 UniCredit 4,128,148 3.37 ___________ ______
Luxembourg
113,215 ArcelorMittal 2,834,904 2.32 ___________ ______
Netherlands
505,544 ING Groep – CVA 5,330,961 4.35
81,591 Koninklijke Vopak 3,647,118 2.98
380,220 USG People 4,239,453 3.46 ___________ ______
13,217,532 10.79 ___________ ______
Norway
138,106 StatoilHydro 2,121,608 1.73
304,406 Storebrand 1,163,786 0.95 ___________ ______
3,285,394 2.68 ___________ ______
Portugal
271,109 Jeronimo Martins SGPS 1,479,713 1.21 ___________ ______
Spain
290,700 Banco Bilbao Vizcaya Argentaria 3,604,680 2.94
226,707 Bancontander 2,433,700 1.99
32,425 Tecnicas Reunidas 1,231,826 1.01
61,072 Telefonica 1,079,448 0.88 ___________ ______
8,349,654 6.82 ___________ ______
Sweden
295,781 Atlas Copco 'A' 2,601,174 2.12 ___________ ______
Switzerland
67,036 Adecco 2,241,870 1.83
91,576 Credit Suisse Group 3,192,299 2.61
95,926 Julius Baer Holding 3,397,669 2.77
42,329 Kuehne & Nagel International 2,348,640 1.92
82,586 Nestle 2,365,170 1.93
100,618 Nobel Biocare Holding 2,121,738 1.73
30,045 Swatch Group 891,935 0.73
22,966 Swatch Group (Bearer Shares) 3,436,915 2.81
89,458 Swiss Reinsurance 2,887,382 2.36 ___________ ______
22,883,618 18.69 ___________ ______
Total Portfolio 121,803,709 99.47
Other Net Assets 643,445 0.53 ___________ ______
Total Net Assets (€) 122,447,154 100.00 ___________ ______
Portfolio of Investments 31 August 2009
Transferable Securities Admitted to an Official Stock Exchange
Listing or Dealt in on Another Regulated Market
Holding Description Value (€) %
Transferable Securities Admitted to an Official Stock Exchange
Listing or Dealt in on Another Regulated Market
Holding Description Value (€) %

Audited Annual Report and Accounts 57
The notes on pages 236 to 244 form an integral part of these financial statements.
Continental European Flexible Fund continued
Sector Breakdown as at 31 August 2009
Finance 41.31
Industrials 24.34
Consumer discretionary 10.73
Consumer staples 5.95
Materials 5.59
Healthcare 4.60
Utilities 3.33
Energy 2.74
Telecommunication services 0.88
Other net assets 0.53 __________
100.00 __________
% of net
assets

58 BlackRock Global Funds (BGF)
(*) Securities lent, see Note 11, for further details.
Emerging Europe Fund
FUNDS
United Kingdom
59,125,406 Institutional Cash Series Institutional
Liquidity Fund 59,125,406 3.70
615,000 Ukraine Opportunity Trust 882,311 0.05 ___________ ______
Total Funds 60,007,717 3.75 ___________ ______
COMMON / PREFERRED STOCKS (SHARES) & WARRANTS
Austria
753,289 Erste Group Bank 22,289,822 1.39
666,467 Raiffeisen International Bank Holding 24,419,351 1.53 ___________ ______
46,709,173 2.92 ___________ ______
Bermuda
902,139 Central European Media
Enterprises 'A' 17,721,839 1.11 ___________ ______
Cyprus
8,760,501 AFI Development GDR 12,016,498 0.75
877,861 XXI Century Investments Public 224,381 0.02 ___________ ______
12,240,879 0.77 ___________ ______
Czech Republic
2,609,734 CEZ* 95,620,871 5.98
151,804 Komercni Banka AS 20,049,887 1.25
735,249 Telefonica O2 Czech Republic AS 14,230,814 0.89 ___________ ______
129,901,572 8.12 ___________ ______
Hungary
4,656,957 Magyar Telekom Telecommunications 13,270,248 0.83
350,000 MOL Hungarian Oil and Gas NyRt 18,443,147 1.15
4,565,123 OTP Bank Nyrt* 80,364,751 5.03 ___________ ______
112,078,146 7.01 ___________ ______
Luxembourg
519,045 Evraz Group GDR* 9,862,063 0.62 ___________ ______
Malaysia
975,944 Steppe Cement 518,304 0.03 ___________ ______
Netherlands
101,493 X5 Retail Group GDR 1,375,811 0.09 ___________ ______
Poland
1,878,053 Bank Pekao 66,392,194 4.15
5,263,486 IDMSA.PL 3,418,186 0.22
6,558,661 Polski Koncern Naftowy Orlen 46,724,115 2.92
5,212,955 Powszechna Kasa Oszczednosci
Bank Polski* 45,180,699 2.83
6,727,700 Telekomunikacja Polska 26,444,363 1.65 ___________ ______
188,159,557 11.77 ___________ ______
Russian Federation
1,804,370,034 Federal Grid Co Unified Energy
System JSC 10,543,990 0.66
8,533,552 Gazprom OAO ADR 126,607,263 7.92
2,699,732 Lukoil ADR 95,601,365 5.98
1,417,525 Mechel ADR* 11,824,966 0.74
257,949 MMC Norilsk Nickel 19,135,184 1.20
6,007,964 MMC Norilsk Nickel ADR 46,670,582 2.92
2,784,594 Mobile Telesystems OJSC ADR 83,679,070 5.23
303,684 NovaTek OAO GDR 8,413,958 0.53
644,080 Polyus Gold ADR 8,924,788 0.56
17,037,503 Rosneft Oil GDR* 76,905,709 4.81
10,032,804 RusHydro ADR 23,872,295 1.49
116,882,451 Sberbank 121,306,307 7.59
3,398,165 Severstal GDR* 17,669,579 1.10
987,201 Sistema JSFC GDR 11,053,975 0.69
9,358,217 Surgutneftegaz ADR 56,322,832 3.52
1,868,934 Tatneft ADR 32,698,429 2.04
20,360 Transneft (Pref) 9,047,830 0.57
377,500 Uralkali GDR* 5,045,953 0.32
2,477,014 Vimpel-Communications ADR 26,955,772 1.68
14,698,673 VTB Bank OJSC GDR* 28,802,427 1.79 ___________ ______
821,082,274 51.34 ___________ ______
Turkey
1 Dogan Sirketler Grubu Holdings 1 0.00
2,349,902 Enka Insaat venayi 6,621,598 0.41
11,753,812 Eregli Demir ve Celik Fabrikalari TAS 32,572,668 2.04
4,956,361 Koza Davetiyeleri Imalat Ithalat ve
Ihracat 7,110,028 0.45
1 Petrol Ofisi 3 0.00
12,170,458 Tekfen Holding 23,240,657 1.45
9,900,712 Turkcell Iletisim Hizmet* 45,190,811 2.83
9,500,047 Turkiye Garanti Bankasi 24,778,294 1.55
10,482,456 Turkiye Is Bankasi 29,293,545 1.83
1 Turkiye Vakiflar Bankasi Tao 'D' 1 0.00 ___________ ______
168,807,606 10.56 ___________ ______
United Kingdom
123,000 Ukraine Opportunity Trust
(Wts 30/4/2012) 19,368 0.00 ___________ ______
United States
601,835 Central European Distribution 13,637,891 0.84 ___________ ______
Total Common / Preferred Stocks (Shares)
& Warrants 1,522,114,483 95.18 ___________ ______
Total Transferable Securities Admitted
to an Official Stock Exchange Listing or
Dealt in on Another Regulated Market 1,582,122,200 98.93 ___________ ______
Unquoted Securities
PREFERRED STOCKS (SHARES)
Russian Federation
2,825,450 Surgutneftegaz ADR (Pref) 7,316,144 0.46 ___________ ______
Total Unquoted Securities 7,316,144 0.46 ___________ ______
Total Portfolio 1,589,438,344 99.39
Other Net Assets 9,827,397 0.61 ___________ ______
Total Net Assets (€) 1,599,265,741 100.00 ___________ ______
Transferable Securities Admitted to an Official Stock Exchange
Listing or Dealt in on Another Regulated Market
Holding Description Value (€) %
Transferable Securities Admitted to an Official Stock Exchange
Listing or Dealt in on Another Regulated Market
Holding Description Value (€) %
Portfolio of Investments 31 August 2009

Audited Annual Report and Accounts 59
The notes on pages 236 to 244 form an integral part of these financial statements.
Emerging Europe Fund continued
Open Futures Contracts as at 31 August 2009
1,647 WIG 20 September 2009 8,890,434 __________
Total commitment 8,890,434 __________
Note: The net unrealised gain of €993,430 attributed to this transaction is included
in the Statement of Net Assets (see Note 2c).
Value
€
Expiration
dateContracts/Description
Number
of Contracts
Open Forward Foreign Exchange Transactions as at 31 August 2009
Core Fund
€ 18,117,388 PLN 81,340,041 18/9/2009 (1,716,254)
PLN 121,460,000 € 26,713,469 18/9/2009 2,902,869 __________
Net unrealised profit 1,186,615 __________
Note: The net unrealised profit attributed to these transactions is included in the Statement
of Net Assets (see Note 2c).
Value date
Unrealised
profit/(loss)
€SalesPurchases
Sector Breakdown as at 31 August 2009
Finance 29.93
Energy 29.90
Telecommunication services 13.80
Materials 9.53
Utilities 8.13
Investment funds 3.75
Industrials 2.31
Consumer discretionary 1.11
Consumer staples 0.93
Other net assets 0.61 __________
100.00 __________
% of net
assets
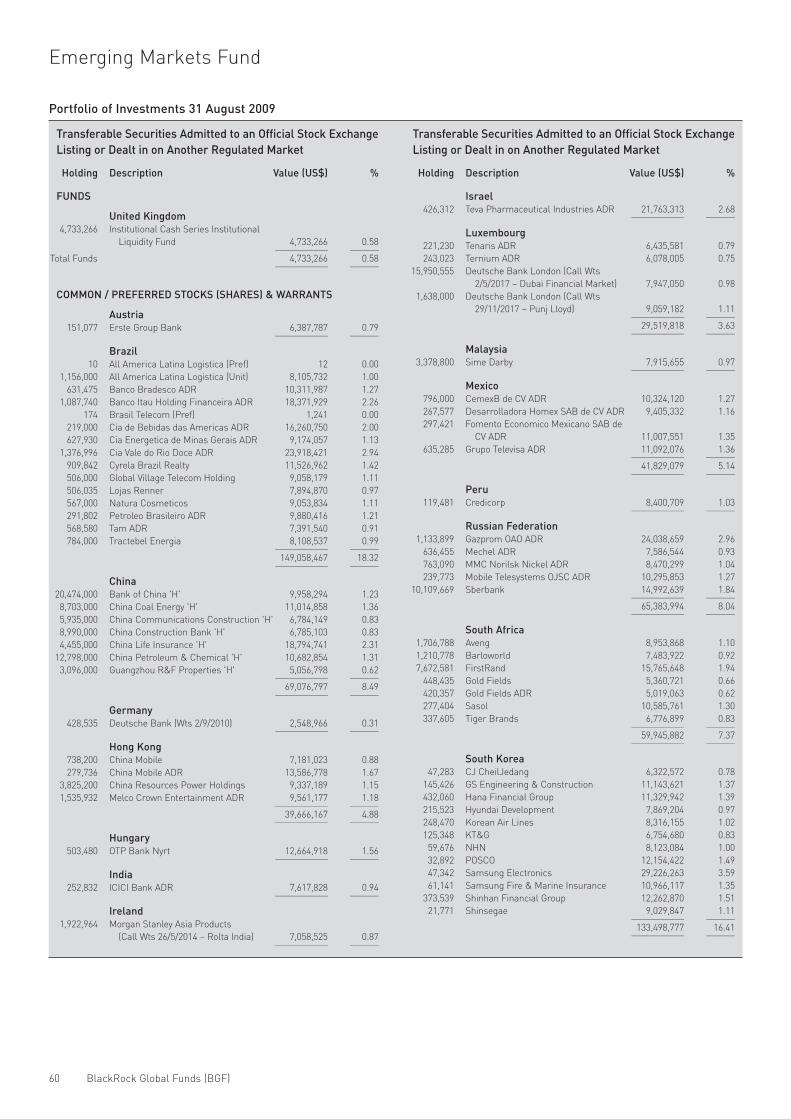
60 BlackRock Global Funds (BGF)
Emerging Markets Fund
Portfolio of Investments 31 August 2009
FUNDS
United Kingdom
4,733,266 Institutional Cash Series Institutional
Liquidity Fund 4,733,266 0.58 ___________ ______
Total Funds 4,733,266 0.58 ___________ ______
COMMON / PREFERRED STOCKS (SHARES) & WARRANTS
Austria
151,077 Erste Group Bank 6,387,787 0.79 ___________ ______
Brazil
10 All America Latina Logistica (Pref) 12 0.00
1,156,000 All America Latina Logistica (Unit) 8,105,732 1.00
631,475 Banco Bradesco ADR 10,311,987 1.27
1,087,740 Banco Itau Holding Financeira ADR 18,371,929 2.26
174 Brasil Telecom (Pref) 1,241 0.00
219,000 Cia de Bebidas das Americas ADR 16,260,750 2.00
627,930 Cia Energetica de Minas Gerais ADR 9,174,057 1.13
1,376,996 Cia Vale do Rio Doce ADR 23,918,421 2.94
909,842 Cyrela Brazil Realty 11,526,962 1.42
506,000 Global Village Telecom Holding 9,058,179 1.11
506,035 Lojas Renner 7,894,870 0.97
567,000 Natura Cosmeticos 9,053,834 1.11
291,802 Petroleo Brasileiro ADR 9,880,416 1.21
568,580 Tam ADR 7,391,540 0.91
784,000 Tractebel Energia 8,108,537 0.99 ___________ ______
149,058,467 18.32 ___________ ______
China
20,474,000 Bank of China 'H' 9,958,294 1.23
8,703,000 China Coal Energy 'H' 11,014,858 1.36
5,935,000 China Communications Construction 'H' 6,784,149 0.83
8,990,000 China Construction Bank 'H' 6,785,103 0.83
4,455,000 China Life Insurance 'H' 18,794,741 2.31
12,798,000 China Petroleum & Chemical 'H' 10,682,854 1.31
3,096,000 Guangzhou R&F Properties 'H' 5,056,798 0.62 ___________ ______
69,076,797 8.49 ___________ ______
Germany
428,535 Deutsche Bank (Wts 2/9/2010) 2,548,966 0.31 ___________ ______
Hong Kong
738,200 China Mobile 7,181,023 0.88
279,736 China Mobile ADR 13,586,778 1.67
3,825,200 China Resources Power Holdings 9,337,189 1.15
1,535,932 Melco Crown Entertainment ADR 9,561,177 1.18 ___________ ______
39,666,167 4.88 ___________ ______
Hungary
503,480 OTP Bank Nyrt 12,664,918 1.56 ___________ ______
India
252,832 ICICI Bank ADR 7,617,828 0.94 ___________ ______
Ireland
1,922,964 Morgan Stanley Asia Products
(Call Wts 26/5/2014 – Rolta India) 7,058,525 0.87 ___________ ______
Israel
426,312 Teva Pharmaceutical Industries ADR 21,763,313 2.68 ___________ ______
Luxembourg
221,230 Tenaris ADR 6,435,581 0.79
243,023 Ternium ADR 6,078,005 0.75
15,950,555 Deutsche Bank London (Call Wts
2/5/2017 – Dubai Financial Market) 7,947,050 0.98
1,638,000 Deutsche Bank London (Call Wts
29/11/2017 – Punj Lloyd) 9,059,182 1.11 ___________ ______
29,519,818 3.63 ___________ ______
Malaysia
3,378,800 Sime Darby 7,915,655 0.97 ___________ ______
Mexico
796,000 CemexB de CV ADR 10,324,120 1.27
267,577 Desarrolladora Homex SAB de CV ADR 9,405,332 1.16
297,421 Fomento Economico Mexicano SAB de
CV ADR 11,007,551 1.35
635,285 Grupo Televisa ADR 11,092,076 1.36 ___________ ______
41,829,079 5.14 ___________ ______
Peru
119,481 Credicorp 8,400,709 1.03 ___________ ______
Russian Federation
1,133,899 Gazprom OAO ADR 24,038,659 2.96
636,455 Mechel ADR 7,586,544 0.93
763,090 MMC Norilsk Nickel ADR 8,470,299 1.04
239,773 Mobile Telesystems OJSC ADR 10,295,853 1.27
10,109,669 Sberbank 14,992,639 1.84 ___________ ______
65,383,994 8.04 ___________ ______
South Africa
1,706,788 Aveng 8,953,868 1.10
1,210,778 Barloworld 7,483,922 0.92
7,672,581 FirstRand 15,765,648 1.94
448,435 Gold Fields 5,360,721 0.66
420,357 Gold Fields ADR 5,019,063 0.62
277,404 Sasol 10,585,761 1.30
337,605 Tiger Brands 6,776,899 0.83 ___________ ______
59,945,882 7.37 ___________ ______
South Korea
47,283 CJ CheilJedang 6,322,572 0.78
145,426 GS Engineering & Construction 11,143,621 1.37
432,060 Hana Financial Group 11,329,942 1.39
215,523 Hyundai Development 7,869,204 0.97
248,470 Korean Air Lines 8,316,155 1.02
125,348 KT&G 6,754,680 0.83
59,676 NHN 8,123,084 1.00
32,892 POSCO 12,154,422 1.49
47,342 Samsung Electronics 29,226,263 3.59
61,141 Samsung Fire & Marine Insurance 10,966,117 1.35
373,539 Shinhan Financial Group 12,262,870 1.51
21,771 Shinsegae 9,029,847 1.11 ___________ ______
133,498,777 16.41 ___________ ______
Transferable Securities Admitted to an Official Stock Exchange
Listing or Dealt in on Another Regulated Market
Holding Description Value (US$) %
Transferable Securities Admitted to an Official Stock Exchange
Listing or Dealt in on Another Regulated Market
Holding Description Value (US$) %

Audited Annual Report and Accounts 61
The notes on pages 236 to 244 form an integral part of these financial statements.
Emerging Markets Fund continued
Portfolio of Investments 31 August 2009
Taiwan
10,457,000 Advanced Semiconductor Engineering 7,465,543 0.92
7,156,284 Asustek Computer 11,392,139 1.40
2,830,000 Catcher Technology 7,307,886 0.90
2,305,900 Chunghwa Telecom 3,950,991 0.48
158,236 Chunghwa Telecom ADR 2,720,077 0.33
7,491,900 Far Eastern Textile 7,465,385 0.92
4,296,050 Formosa Plastics 7,726,405 0.95
2,629,164 HON HAI Precision Industry 8,865,987 1.09
7,155,439 Taiwan Semiconductor Manufacturing 12,868,987 1.58
8,616,132 Uni-President Enterprises 8,925,923 1.10
11,544,000 Yuanta Financial Holding 7,136,860 0.88 ___________ ______
85,826,183 10.55 ___________ ______
Thailand
3,653,400 Kasikornbank – NVDR 7,788,045 0.96
2,312,708 PTT Exploration & Production – NVDR 9,418,111 1.16 ___________ ______
17,206,156 2.12 ___________ ______
Turkey
3 Hurriyet Gazetecilik 3 0.00
2,025,017 Sekerbank 3,288,389 0.40
1 Turkiye Is Bankasi 4 0.00 ___________ ______
3,288,396 0.40 ___________ ______
United Kingdom
6,719,496 HSBC Bank (Call Wts 5/4/2012 – EMAAR
Properties) 6,348,122 0.78 ___________ ______
United States
52,874 Central European Distribution 1,712,060 0.21 ___________ ______
Total Common / Preferred Stocks (Shares)
& Warrants 776,717,599 95.49 ___________ ______
Total Transferable Securities Admitted
to an Official Stock Exchange Listing or
Dealt in on Another Regulated Market 781,450,865 96.07 ___________ ______
COMMON STOCKS (SHARES) & WARRANTS
South Africa
317,505 Macmed Health Care – 0.00 ___________ ______
Switzerland
4,376,119 UBS AG (London)
(Call Wts 16/6/2011 – Unitech) 9,613,760 1.18 ___________ ______
United Kingdom
8,669,285 HSBC Bank (Call Wts 6/5/2011 – Sorouh
Real Estate) 7,482,067 0.92 ___________ ______
Total Common Stocks (Shares) & Warrants 17,095,827 2.10 ___________ ______
BONDS
Brazil
BRL28,000 Vale FRN Perpetual – 0.00 ___________ ______
Total Bonds – 0.00 ___________ ______
Total Unquoted Securities 17,095,827 2.10 ___________ ______
Total Portfolio 798,546,692 98.17
Other Net Assets 14,881,022 1.83 ___________ ______
Total Net Assets (US$) 813,427,714 100.00 ___________ ______
Transferable Securities Admitted to an Official Stock Exchange
Listing or Dealt in on Another Regulated Market
Holding Description Value (US$) %
Unquoted Securities
Holding Description Value (US$) %
Sector Breakdown as at 31 August 2009
Finance 27.28
Information technology 11.35
Industrials 11.12
Materials 10.65
Energy 10.09
Consumer staples 9.32
Consumer discretionary 6.09
Telecommunication services 5.74
Utilities 3.27
Healthcare 2.68
Investment funds 0.58
Other net assets 1.83 __________
100.00 __________
% of net
assets

62 BlackRock Global Funds (BGF)
Emerging Markets Bond Fund
BONDS
Argentina
US$8,220,000 Argentina Government International
Bond 1.33% 31/12/2038
(Step-up coupon) 2,301,600 1.40
US$3,805,892 Argentina Government International
Bond 8.28% 31/12/2033 2,256,894 1.38 ___________ ______
4,558,494 2.78 ___________ ______
Brazil
US$630,000 Brazilian Government International
Bond 5.875% 15/1/2019 649,845 0.40
US$2,540,000 Brazilian Government International
Bond 6% 17/1/2017 2,632,075 1.61
US$6,550,000 Brazilian Government International
Bond 7.125% 20/1/2037 7,301,940 4.45
US$1,048,333 Brazilian Government International
Bond 8% 15/1/2018 1,200,342 0.73
US$2,925,000 Brazilian Government International
Bond 11% 17/8/2040 3,844,913 2.34 ___________ ______
15,629,115 9.53 ___________ ______
Colombia
US$795,000 Colombia Government International
Bond 7.375% 27/1/2017 878,515 0.54
US$4,110,000 Colombia Government International
Bond 7.375% 18/9/2037 4,336,050 2.64 ___________ ______
5,214,565 3.18 ___________ ______
Dominican Republic
US$1,027,398 Dominican Republic International
Bond 9.04% 23/1/2018 952,912 0.58 ___________ ______
El Salvador
US$650,000 El Salvador Government International
Bond 7.65% 15/6/2035 594,750 0.36 ___________ ______
Georgia
US$275,000 Georgia Government International
Bond 7.5% 15/4/2013 250,250 0.15 ___________ ______
Indonesia
US$1,063,000 Indonesia Government International
Bond 7.75% 17/1/2038 1,106,849 0.68
US$1,725,000 Indonesia Government International
Bond '144A' 6.625% 17/2/2037 1,608,563 0.98
US$1,730,000 Indonesia Government International
Bond '144A' 7.5% 15/1/2016 1,872,725 1.14
US$1,410,000 Indonesia Government International
Bond '144A' 7.75% 17/1/2038 1,461,113 0.89
US$1,300,000 Indonesia Government International
Bond '144A' 11.625% 4/3/2019 1,755,000 1.07
IDR3,200,000,000 Indonesia Treasury Bond 12.5%
15/3/2013 348,545 0.21 ___________ ______
8,152,795 4.97 ___________ ______
Luxembourg
US$1,100,000 Gaz Capital '144A' 8.146% 11/4/2018 1,091,750 0.66
US$1,750,000 Gaz Capital 7.288% 16/8/2037 1,438,500 0.88
US$760,000 RSHB Capital SA for OJSC Russian
Agricultural Bank '144A' 9%
11/6/2014 813,960 0.50 ___________ ______
3,344,210 2.04 ___________ ______
Malaysia
US$400,000 Petronas Capital 7.875% 22/5/2022 486,414 0.30 ___________ ______
Mexico
US$1,600,000 Mexico Government International
Bond 5.625% 15/1/2017 1,626,000 0.99
US$3,590,000 Mexico Government International
Bond 6.05% 11/1/2040 3,473,325 2.12
US$2,885,000 Mexico Government International
Bond 6.75% 27/9/2034 3,000,400 1.83
US$4,572,000 Mexico Government International
Bond 8.3% 15/8/2031 5,600,700 3.41 ___________ ______
13,700,425 8.35 ___________ ______
Netherlands
US$2,710,000 KazMunaiGaz Finance Sub '144A'
11.75% 23/1/2015 2,943,738 1.80 ___________ ______
Panama
US$1,975,000 Panama Government International
Bond 8.875% 30/9/2027 2,449,000 1.49 ___________ ______
Peru
US$1,672,000 Peruvian Government International
Bond 6.55% 14/3/2037 1,680,360 1.02
US$1,150,000 Peruvian Government International
Bond 7.35% 21/7/2025 1,275,063 0.78
US$875,000 Republic of Peru 7.125% 30/3/2019 969,063 0.59 ___________ ______
3,924,486 2.39 ___________ ______
Philippines
US$700,000 Philippine Government International
Bond 10.625% 16/3/2025 952,749 0.58
US$1,740,000 Philippine Government International
Bond 7.75% 14/1/2031 1,903,125 1.16
US$1,125,000 Philippine Government International
Bond 8.375% 15/2/2011 1,219,803 0.74
US$2,360,000 Philippine Government International
Bond 8.375% 17/6/2019 2,767,100 1.69
US$2,600,000 Philippine Government International
Bond 8.875% 17/3/2015 3,074,500 1.87
US$5,340,000 Philippine Government International
Bond 9% 15/2/2013 6,201,075 3.78 ___________ ______
16,118,352 9.82 ___________ ______
Poland
US$1,977,000 Poland Government International
Bond 6.375% 15/7/2019 2,116,379 1.29 ___________ ______
Russia
US$11,529,600 Russia Government International
Bond 7.5% 31/3/2030
(Step-up coupon) 11,832,252 7.21 ___________ ______
South Africa
ZAR18,860,000 South Africa Government
Bond 8.25% 15/9/2017 2,356,188 1.44
US$3,500,000 South Africa Government
International Bond 6.5% 2/6/2014 3,786,767 2.31
US$1,240,000 South Africa Government
International Bond 6.875%
27/5/2019 1,337,649 0.81 ___________ ______
7,480,604 4.56 ___________ ______
Transferable Securities Admitted to an Official Stock Exchange
Listing or Dealt in on Another Regulated Market
Holding Description Value (US$) %
Transferable Securities Admitted to an Official Stock Exchange
Listing or Dealt in on Another Regulated Market
Holding Description Value (US$) %
Portfolio of Investments 31 August 2009

Audited Annual Report and Accounts 63
The notes on pages 236 to 244 form an integral part of these financial statements.
Emerging Markets Bond Fund continued
Portfolio of Investments 31 August 2009
Transferable Securities Admitted to an Official Stock Exchange
Listing or Dealt in on Another Regulated Market
Holding Description Value (US$) %
Transferable Securities Admitted to an Official Stock Exchange
Listing or Dealt in on Another Regulated Market
Holding Description Value (US$) %
South Korea
US$700,000 Republic of Korea 7.125% 16/4/2019 783,892 0.48 ___________ ______
Turkey
US$2,330,000 Republic of Turkey 7.5% 14/7/2017 2,535,040 1.55
US$1,390,000 Turkey Government International
Bond 6.75% 3/4/2018 1,443,862 0.88
US$7,392,000 Turkey Government International
Bond 6.875% 17/3/2036 7,124,040 4.34
US$470,000 Turkey Government International
Bond 7.25% 15/3/2015 511,313 0.31
US$1,300,000 Turkey Government International
Bond 11.5% 23/1/2012 1,527,500 0.93
US$1,180,000 Turkey Government International
Bond 11.875% 15/1/2030 1,842,275 1.12 ___________ ______
14,984,030 9.13 ___________ ______
Ukraine
US$500,000 Ukraine Government International
Bond 6.58% 21/11/2016 413,750 0.25
US$1,310,000 Ukraine Government International
Bond '144A' 6.58% 21/11/2016 1,080,750 0.66 ___________ ______
1,494,500 0.91 ___________ ______
Uruguay
US$882,805 Uruguay Government International
Bond 7.625% 21/3/2036 907,082 0.55
US$1,373,891 Uruguay Government International
Bond 7.875% 15/1/2033 1,445,332 0.88 ___________ ______
2,352,414 1.43 ___________ ______
Venezuela
US$8,120,000 Bolivarian Republic of Venezuela
9.375% 13/1/2034 5,630,001 3.43
US$2,830,000 Petroleos de Venezuela 5.25%
12/4/2017 1,573,480 0.96
US$1,670,000 Petroleos de Venezuela 'S' 5.375%
12/4/2027 731,752 0.45
US$1,135,000 Venezuela Government International
Bond 7.65% 21/4/2025 689,513 0.42
US$4,733,000 Venezuela Government International
Bond 9.25% 15/9/2027 3,526,085 2.15
US$2,390,000 Venezuela Government International
Bond 9.25% 7/5/2028 1,661,050 1.01 ___________ ______
13,811,881 8.42 ___________ ______
Total Transferable Securities Admitted
to an Official Stock Exchange Listing or
Dealt in on Another Regulated Market 133,175,458 81.17 ___________ ______
Unquoted Securities
BONDS
Iraq
US$1,350,000 Republic of Iraq 5.8% 15/1/2028 950,063 0.58 ___________ ______
Venezuela
US$7,000 Venezuela Government International
Bond 0% 15/4/2020 175,000 0.11 ___________ ______
Total Unquoted Securities 1,125,063 0.69 ___________ ______
Total Portfolio 134,300,521 81.86
Other Net Assets 29,759,940 18.14 ___________ ______
Total Net Assets (US$) 164,060,461 100.00 ___________ ______
Unrealised loss US$Description
NominalValue
Unrealised loss US$Description
NominalValue
US$4,670,000 Credit Default Swaps (JP Morgan)
(Fund receives default protection on
France (Republic of) 4.25% 25/4/2019;
and pays Fixed 0.35%) (20/12/2018) (40,001)
US$2,320,000 Credit Default Swaps (JP Morgan)
(Fund receives default protection on
France (Republic of) 4.25% 25/4/2019;
and pays Fixed 0.4%) (20/12/2018) (29,245)
€4,660,000 Credit Default Swaps (Deutsche Bank)
(Fund receives default protection on
iTraxx Europe Sub Financials Series 11 Version 1;
and pays Fixed 3.75%) (20/6/2014) (11,677) __________
(80,923) __________
Swaps as at 31 August 2009
Note: The total market value of (US$698,331) of these transactions is included in the Statement of Net Assets (see Note 2c).

64 BlackRock Global Funds (BGF)
Emerging Markets Bond Fund continued
Open Forward Foreign Exchange Transactions as at 31 August 2009
Core Fund US$
BRL37,332,415 US$ 20,130,000 2/9/2009 (298,910) (298,910)
US$ 19,929,556 BRL37,269,158 2/9/2009 132,069 132,069
KRW3,855,750,000 US$ 3,180,000 3/9/2009 (92,706) (92,706)
US$ 3,180,000 KRW3,954,330,000 3/9/2009 13,773 13,773
RUB 163,577,150 US$ 5,250,000 4/9/2009 (116,588) (116,588)
US$ 5,250,000 RUB 166,789,700 4/9/2009 15,771 15,771
€ 2,480,000 HUF673,230,720 16/9/2009 20,629 20,629
€ 23,646,300 ¥3,186,360,639 16/9/2009 (482,314) (482,314)
€ 7,875,000 US$ 11,197,572 16/9/2009 55,120 55,120
¥ 4,201,305,100 € 31,300,000 16/9/2009 462,050 462,050
SEK44,031,966 US$ 6,200,000 16/9/2009 (24,253) (24,253)
US$ 9,498,051 € 6,726,000 16/9/2009 (112,819) (112,819)
US$ 10,703,289 ¥ 1,004,808,638 16/9/2009 (103,906) (103,906)
US$ 6,200,000 SEK45,355,976 16/9/2009 (161,447) (161,447)
MXN81,664,300 US$ 6,336,844 17/9/2009 (210,454) (210,454)
RUB 98,834,200 US$ 3,100,000 17/9/2009 (6,557) (6,557)
US$ 6,315,721 MXN81,704,180 17/9/2009 186,338 186,338
US$ 3,100,000 RUB 99,255,800 17/9/2009 (6,639) (6,639)
US$ 710,000 BRL1,338,705 2/10/2009 2,605 2,605
TRY 3,735,100 US$ 2,448,167 28/10/2009 8,394 8,394
US$ 2,506,116 ZAR20,516,000 28/10/2009 (97,389) (97,389)
US$ 293,500 IDR 2,973,155,000 4/11/2009 2,214 2,214 __________ __________
Net unrealised loss (815,019) (815,019)__________ __________
EUR Hedged Share Class €
€ 48,644,381 US$ 68,766,714 15/9/2009 519,203 741,931
US$ 2,336,276 € 1,643,111 15/9/2009 (8,109) (11,587)__________ __________
Net unrealised profit 511,094 730,344 __________ __________
Total net unrealised loss (84,675)__________
Note: The net unrealised loss attributed to these transactions is included in the Statement
of Net Assets (see Note 2c).
Unrealised
profit/(loss)
US$ Equivalent
Unrealised
profit/(loss)Value dateSalesPurchases
6,530,000 OTC EUR/CHF Call Option
strike price €1.55
expiring on 5/11/2009 (20,174) 19,268 ___________ _________
Total Purchased Call Options (20,174) 19,268 ___________ _________
Note: Purchased Call Options are included in the Statement of Net Assets (see Note 2c).
Value US$
Unrealised loss US$Issuer
Number ofcontracts
subject to Call
Purchased Call Options as at 31 August 2009
7,600,000 OTC AUD/USD Put Option
strike price AUD 0.77
expiring on 5/11/2009 (22,237) 42,469
6,530,000 OTC EUR/CHF Put Option
strike price €1.50
expiring on 5/11/2009 3,895.00 35,355
6,330,000 OTC AUD/USD Put Option
strike price AUD 0.77
expiring on 5/11/2009 (18,095) 35,372 ___________ _________
Total Purchased Put Options (36,437) 113,196 ___________ _________
Note: Purchased Put Options are included in the Statement of Net Assets (see Note 2c).
Value US$
Unrealised profit/(loss)
US$Issuer
Number ofcontracts
subject to Put
Purchased Put Options as at 31 August 2009
Open Futures Contracts as at 31 August 2009
(311) 90 Day Euro $ Future March 2010 (77,182,425)__________
Total commitment (77,182,425)__________
Note: The net unrealised loss of US$83,671 attributed to this transaction is included
in the Statement of Net Assets (see Note 2c).
Value
US$
Expiration
dateContracts/Description
Number
of Contracts
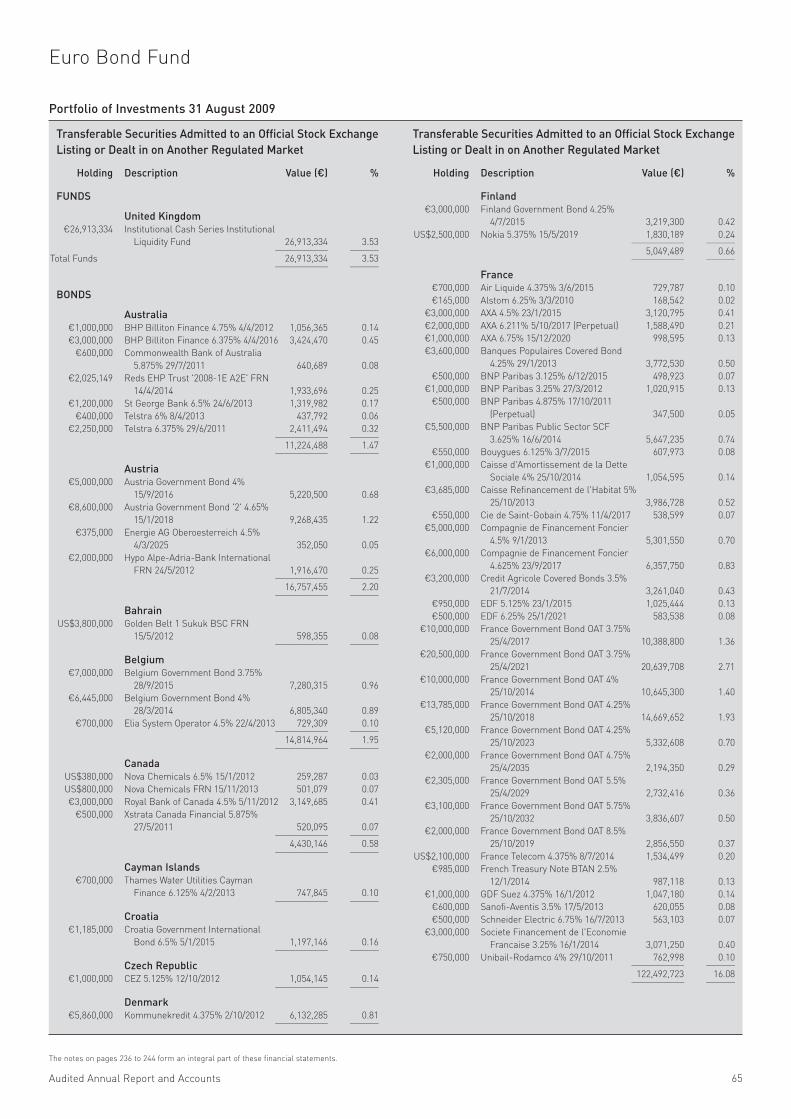
Audited Annual Report and Accounts 65
The notes on pages 236 to 244 form an integral part of these financial statements.
Euro Bond Fund
Portfolio of Investments 31 August 2009
FUNDS
United Kingdom
€26,913,334 Institutional Cash Series Institutional
Liquidity Fund 26,913,334 3.53 ___________ ______
Total Funds 26,913,334 3.53 ___________ ______
BONDS
Australia
€1,000,000 BHP Billiton Finance 4.75% 4/4/2012 1,056,365 0.14
€3,000,000 BHP Billiton Finance 6.375% 4/4/2016 3,424,470 0.45
€600,000 Commonwealth Bank of Australia
5.875% 29/7/2011 640,689 0.08
€2,025,149 Reds EHP Trust '2008-1E A2E' FRN
14/4/2014 1,933,696 0.25
€1,200,000 St George Bank 6.5% 24/6/2013 1,319,982 0.17
€400,000 Telstra 6% 8/4/2013 437,792 0.06
€2,250,000 Telstra 6.375% 29/6/2011 2,411,494 0.32 ___________ ______
11,224,488 1.47 ___________ ______
Austria
€5,000,000 Austria Government Bond 4%
15/9/2016 5,220,500 0.68
€8,600,000 Austria Government Bond '2' 4.65%
15/1/2018 9,268,435 1.22
€375,000 Energie AG Oberoesterreich 4.5%
4/3/2025 352,050 0.05
€2,000,000 Hypo Alpe-Adria-Bank International
FRN 24/5/2012 1,916,470 0.25 ___________ ______
16,757,455 2.20 ___________ ______
Bahrain
US$3,800,000 Golden Belt 1 Sukuk BSC FRN
15/5/2012 598,355 0.08 ___________ ______
Belgium
€7,000,000 Belgium Government Bond 3.75%
28/9/2015 7,280,315 0.96
€6,445,000 Belgium Government Bond 4%
28/3/2014 6,805,340 0.89
€700,000 Elia System Operator 4.5% 22/4/2013 729,309 0.10 ___________ ______
14,814,964 1.95 ___________ ______
Canada
US$380,000 Nova Chemicals 6.5% 15/1/2012 259,287 0.03
US$800,000 Nova Chemicals FRN 15/11/2013 501,079 0.07
€3,000,000 Royal Bank of Canada 4.5% 5/11/2012 3,149,685 0.41
€500,000 Xstrata Canada Financial 5.875%
27/5/2011 520,095 0.07 ___________ ______
4,430,146 0.58 ___________ ______
Cayman Islands
€700,000 Thames Water Utilities Cayman
Finance 6.125% 4/2/2013 747,845 0.10 ___________ ______
Croatia
€1,185,000 Croatia Government International
Bond 6.5% 5/1/2015 1,197,146 0.16 ___________ ______
Czech Republic
€1,000,000 CEZ 5.125% 12/10/2012 1,054,145 0.14 ___________ ______
Denmark
€5,860,000 Kommunekredit 4.375% 2/10/2012 6,132,285 0.81 ___________ ______
Finland
€3,000,000 Finland Government Bond 4.25%
4/7/2015 3,219,300 0.42
US$2,500,000 Nokia 5.375% 15/5/2019 1,830,189 0.24 ___________ ______
5,049,489 0.66 ___________ ______
France
€700,000 Air Liquide 4.375% 3/6/2015 729,787 0.10
€165,000 Alstom 6.25% 3/3/2010 168,542 0.02
€3,000,000 AXA 4.5% 23/1/2015 3,120,795 0.41
€2,000,000 AXA 6.211% 5/10/2017 (Perpetual) 1,588,490 0.21
€1,000,000 AXA 6.75% 15/12/2020 998,595 0.13
€3,600,000 Banques Populaires Covered Bond
4.25% 29/1/2013 3,772,530 0.50
€500,000 BNP Paribas 3.125% 6/12/2015 498,923 0.07
€1,000,000 BNP Paribas 3.25% 27/3/2012 1,020,915 0.13
€500,000 BNP Paribas 4.875% 17/10/2011
(Perpetual) 347,500 0.05
€5,500,000 BNP Paribas Public Sector SCF
3.625% 16/6/2014 5,647,235 0.74
€550,000 Bouygues 6.125% 3/7/2015 607,973 0.08
€1,000,000 Caisse d'Amortissement de la Dette
Sociale 4% 25/10/2014 1,054,595 0.14
€3,685,000 Caisse Refinancement de l'Habitat 5%
25/10/2013 3,986,728 0.52
€550,000 Cie de Saint-Gobain 4.75% 11/4/2017 538,599 0.07
€5,000,000 Compagnie de Financement Foncier
4.5% 9/1/2013 5,301,550 0.70
€6,000,000 Compagnie de Financement Foncier
4.625% 23/9/2017 6,357,750 0.83
€3,200,000 Credit Agricole Covered Bonds 3.5%
21/7/2014 3,261,040 0.43
€950,000 EDF 5.125% 23/1/2015 1,025,444 0.13
€500,000 EDF 6.25% 25/1/2021 583,538 0.08
€10,000,000 France Government Bond OAT 3.75%
25/4/2017 10,388,800 1.36
€20,500,000 France Government Bond OAT 3.75%
25/4/2021 20,639,708 2.71
€10,000,000 France Government Bond OAT 4%
25/10/2014 10,645,300 1.40
€13,785,000 France Government Bond OAT 4.25%
25/10/2018 14,669,652 1.93
€5,120,000 France Government Bond OAT 4.25%
25/10/2023 5,332,608 0.70
€2,000,000 France Government Bond OAT 4.75%
25/4/2035 2,194,350 0.29
€2,305,000 France Government Bond OAT 5.5%
25/4/2029 2,732,416 0.36
€3,100,000 France Government Bond OAT 5.75%
25/10/2032 3,836,607 0.50
€2,000,000 France Government Bond OAT 8.5%
25/10/2019 2,856,550 0.37
US$2,100,000 France Telecom 4.375% 8/7/2014 1,534,499 0.20
€985,000 French Treasury Note BTAN 2.5%
12/1/2014 987,118 0.13
€1,000,000 GDF Suez 4.375% 16/1/2012 1,047,180 0.14
€600,000 Sanofi-Aventis 3.5% 17/5/2013 620,055 0.08
€500,000 Schneider Electric 6.75% 16/7/2013 563,103 0.07
€3,000,000 Societe Financement de l'Economie
Francaise 3.25% 16/1/2014 3,071,250 0.40
€750,000 Unibail-Rodamco 4% 29/10/2011 762,998 0.10 ___________ ______
122,492,723 16.08 ___________ ______
Transferable Securities Admitted to an Official Stock Exchange
Listing or Dealt in on Another Regulated Market
Holding Description Value (€) %
Transferable Securities Admitted to an Official Stock Exchange
Listing or Dealt in on Another Regulated Market
Holding Description Value (€) %

66 BlackRock Global Funds (BGF)
Germany
€3,000,000 Bundesobligation '149' 3.5%
14/10/2011 3,127,200 0.41
€7,300,000 Bundesobligation '152' 3.5% 12/4/2013 7,650,729 1.01
€10,070,000 Bundesrepublik Deutschland 3.25%
4/7/2015 10,383,832 1.36
€920,000 Bundesrepublik Deutschland 3.5%
4/1/2016 958,185 0.13
€4,545,000 Bundesrepublik Deutschland 3.5%
4/7/2019 4,634,309 0.61
€6,344,945 Bundesrepublik Deutschland 3.75%
4/1/2015 6,710,097 0.88
€1,000,000 Bundesrepublik Deutschland 4%
4/1/2018 1,063,080 0.14
€1,445,000 Bundesrepublik Deutschland 4.25%
4/7/2039 1,513,753 0.20
€4,825,000 Bundesrepublik Deutschland 4.75%
4/7/2028 5,309,358 0.70
€4,500,000 Bundesrepublik Deutschland 4.75%
4/7/2034 4,965,930 0.65
€22,986,000 Bundesrepublik Deutschland 5.5%
4/1/2031 27,571,477 3.62
€7,590,000 Bundesrepublik Deutschland 5.625%
4/1/2028 9,172,022 1.20
€6,550,000 Bundesrepublik Deutschland 6.25%
4/1/2024 8,362,582 1.10
€417,000 Bundesrepublik Deutschland 6.5%
4/7/2027 551,312 0.07
€10,710,000 Bundesrepublik Deutschland '03'
3.75% 4/7/2013 11,308,154 1.49
€2,480,000 Bundesrepublik Deutschland '08'
4.25% 4/7/2018 2,684,278 0.35
€5,000,000 Commerzbank 2.75% 13/1/2012 5,098,975 0.67
€1,000,000 Deutsche Bank 3.625% 9/3/2017 946,665 0.12
€625,523 Driver One GmbH '5 A' FRN 21/2/2014 620,955 0.08
€3,600,000 Hypothekenbank in Essen 3.75%
28/9/2012 3,747,528 0.49
€1,000,000 Kreditanstalt fuer Wiederaufbau 3.5%
4/7/2015 1,028,030 0.13
€5,000,000 Kreditanstalt fuer Wiederaufbau 4.125%
4/7/2017 5,255,050 0.69
€2,000,000 Landesbank Baden-Wurttemberg 3.75%
10/3/2011 2,068,250 0.27
€1,000,000 Muenchener Rueckversicherungs 6.75%
21/6/2023 1,054,640 0.14
€3,420,000 State of Hessen 3.125% 13/5/2014 3,467,912 0.46
€1,000,000 State of Hessen Germany 5.75%
4/1/2011 1,059,110 0.14 ___________ ______
130,313,413 17.11 ___________ ______
Greece
€4,460,000 Hellenic Republic Government Bond
4.3% 20/7/2017 4,550,025 0.60
€1,000,000 Hellenic Republic Government Bond
4.5% 20/9/2037 903,995 0.12
€5,000,000 Hellenic Republic Government Bond
4.7% 20/3/2024 4,901,275 0.64
€5,480,000 Hellenic Republic Government Bond
5.5% 20/8/2014 6,005,450 0.79
€3,100,000 Hellenic Republic Government Bond
6% 19/7/2019 3,461,553 0.45 ___________ ______
19,822,298 2.60 ___________ ______
Guernsey
€960,000 ABB International Finance 6.5%
30/11/2011 1,043,002 0.13
€1,000,000 Credit Suisse Group Finance Guernsey
3.625% 23/1/2018 961,315 0.13 ___________ ______
2,004,317 0.26 ___________ ______
International
€5,100,000 European Community 3.625% 6/4/2016 5,235,890 0.69
€2,000,000 European Investment Bank 3.125%
15/10/2015 2,017,090 0.26
€2,000,000 European Investment Bank 3.125%
15/4/2014 2,034,810 0.27
€3,225,000 European Investment Bank 3.5%
15/4/2016 3,280,696 0.43
€1,000,000 European Investment Bank 3.625%
15/10/2013 1,041,805 0.14
€3,005,000 European Union 3.125% 3/4/2014 3,063,748 0.40 ___________ ______
16,674,039 2.19 ___________ ______
Ireland
€2,453,079 FCC Proudreed Properties '1 A' FRN
18/8/2017 1,527,042 0.20
€6,000,000 Ireland Government Bond 4.5%
18/4/2020 5,822,940 0.76
€1,437,051 Talisman Finance '7 H' FRN
22/4/2017 215,557 0.03 ___________ ______
7,565,539 0.99 ___________ ______
Italy
€500,000 Atlantia 5.625% 6/5/2016 541,095 0.07
€2,500,000 Banca Italease FRN 2/2/2010 2,454,369 0.32
€4,000,000 Cassa Depositi e Prestiti 3.75%
31/1/2012 4,134,860 0.54
€1,500,000 Intesa Sanpaolo 3.75% 9/6/2015 1,498,612 0.20
€1,000,000 Italy Buoni Poliennali del Tesoro 3.75%
1/2/2011 1,035,475 0.14
€5,000,000 Italy Buoni Poliennali del Tesoro
3.75% 15/12/2013 5,183,350 0.68
€3,500,000 Italy Buoni Poliennali del Tesoro 4.25%
1/8/2014 3,711,330 0.49
€32,495,000 Italy Buoni Poliennali del Tesoro 4.5%
1/8/2018 34,220,809 4.49
€12,449,000 Italy Buoni Poliennali del Tesoro 4.75%
1/2/2013 13,348,938 1.75
€15,560,000 Italy Buoni Poliennali del Tesoro 5%
1/8/2039 15,718,401 2.07
€1,500,000 UniCredit 5.25% 14/1/2014 1,606,050 0.21 ___________ ______
83,453,289 10.96 ___________ ______
Japan
€1,000,000 Bank of Tokyo-Mitsubishi UFJ 3.5%
16/12/2015 996,910 0.13
€500,000 Resona Bank 3.75% 15/4/2015 491,250 0.06
€1,500,000 Shinsei Bank 3.75% 23/2/2016 1,136,250 0.15 ___________ ______
2,624,410 0.34 ___________ ______
Jersey
€1,000,000 HSBC Capital Funding/Jersey Channel
Islands 5.3687% 24/3/2014
(Perpetual) 780,835 0.10 ___________ ______
Portfolio of Investments 31 August 2009
Transferable Securities Admitted to an Official Stock Exchange
Listing or Dealt in on Another Regulated Market
Holding Description Value (€) %
Transferable Securities Admitted to an Official Stock Exchange
Listing or Dealt in on Another Regulated Market
Holding Description Value (€) %
Euro Bond Fund continued

Audited Annual Report and Accounts 67
The notes on pages 236 to 244 form an integral part of these financial statements.
Luxembourg€4,470,000 Clariant Finance Luxembourg 4.375%
5/4/2013 4,269,141 0.56
€140,000 Fiat Finance & Trade 9% 30/7/2012 147,987 0.02
€2,500,000 ITW Finance Europe 5.25% 1/10/2014 2,595,025 0.34 ___________ ______
7,012,153 0.92 ___________ ______
Netherlands€3,600,000 ABN Amro Bank 3.75% 15/7/2014 3,684,366 0.48
€1,500,000 Achmea Hypotheekbank 4.25%
26/2/2014 1,515,960 0.20
€2,000,000 Adecco International Financial
Services 4.5% 25/4/2013 2,024,470 0.27
€900,000 Alliander Finance 4% 20/4/2012 927,320 0.12
€800,000 Allianz Finance II 4.375%
17/2/2017 (Perpetual) 629,140 0.08
€1,375,000 Allianz Finance II 6.125%
31/5/2022 1,429,546 0.19
€1,300,000 Bank Nederlandse Gemeenten 2.75%
27/1/2011 1,327,430 0.17
€1,000,000 Bank Nederlandse Gemeenten 4%
15/7/2014 1,047,125 0.14
€500,000 Daimler International Finance 5.875%
8/9/2011 526,438 0.07
€3,000,000 Deutsche Telekom International Finance
7.125% 11/7/2011 3,252,885 0.43
US$1,075,000 EDP Finance 5.375% 2/11/2012 804,142 0.11
€250,000 EDP Finance 5.5% 18/2/2014 270,849 0.04
€1,000,000 ELM for Swiss Life Insurance & Pension
Group 5.849% 12/4/2017 (Perpetual) 585,000 0.08
€370,000 Enbw International Finance 6.125%
7/7/2039 400,275 0.05
€250,000 Eureko 6% 1/11/2012 (Perpetual) 183,750 0.02
€2,723,000 Fortis Bank Nederland Holding 3.375%
19/5/2014 2,780,905 0.37
€1,000,000 ING Bank 3.5% 16/9/2020 876,975 0.11
€1,500,000 ING Verzekeringen 6.25% 21/6/2021 1,213,140 0.16
€1,675,000 Koninklijke KPN 5% 13/11/2012 1,774,654 0.23
€500,000 Koninklijke KPN 6.25% 4/2/2014 551,940 0.07
€500,000 Koninklijke KPN 7.5% 4/2/2019 602,195 0.08
€2,940,000 LeasePlan 3.25% 22/5/2014 2,982,263 0.39
€700,000 Nederlandse Gasunie 4.25% 20/6/2016 721,728 0.09
€1,000,000 Nederlandse Waterschapsbank 4%
12/3/2013 1,045,780 0.14
€950,000 Netherlands Government Bond 2.5%
15/1/2012 968,055 0.13
€7,005,000 Netherlands Government Bond 2.75%
15/1/2015 6,996,944 0.92
€7,000,000 Netherlands Government Bond 3.25%
15/7/2015 7,147,420 0.94
€585,000 Netherlands Government Bond 4.25%
15/7/2013 626,430 0.08
€1,900,000 PACCAR Financial Europe 5.125%
19/5/2011 1,914,763 0.25
€451,000 RWE Finance 5% 10/2/2015 483,256 0.06
€1,350,000 RWE Finance 5.125% 23/7/2018 1,451,513 0.19
€960,000 RWE Finance 6.5% 10/8/2021 1,135,622 0.15
€500,000 Schlumberger Finance 4.5% 25/3/2014 523,915 0.07
€2,200,000 Siemens Financieringsmaatschappij
4.125% 20/2/2013 2,253,790 0.30
€225,000 Siemens Financieringsmaatschappij
5.25% 12/12/2011 239,644 0.03
€750,000 Siemens Financieringsmaatschappij
5.25% 14/9/2066 690,000 0.09
€1,731,848 Storm '2003 A1' FRN 22/12/2045 1,700,217 0.22
€450,000 Syngenta Finance 4% 30/6/2014 465,246 0.06
€2,700,000 Urenco Finance 5.375% 22/5/2015 2,779,380 0.36
€645,000 Volkswagen International Finance
3.75% 16/11/2010 657,039 0.09
€2,200,000 Wolters Kluwer 6.375% 10/4/2018 2,434,234 0.32 ___________ ______
63,625,744 8.35 ___________ ______
Norway€1,500,000 DnB NOR Bank 4.5% 29/5/2014 1,559,370 0.20
€550,000 Statkraft AS 5.5% 2/4/2015 586,726 0.08
€1,200,000 StatoilHydro 4.375% 11/3/2015 1,260,150 0.17 ___________ ______
3,406,246 0.45 ___________ ______
Poland€500,000 Poland Government International Bond
4.2% 15/4/2020 460,705 0.06
€2,448,000 Poland Government International Bond
5.875% 3/2/2014 2,626,569 0.35
€4,065,000 Republic of Poland 5.625% 20/6/2018 4,278,697 0.56 ___________ ______
7,365,971 0.97 ___________ ______
Portugal€3,000,000 Banco Comercial Portugues 4.875%
9/5/2010 3,069,780 0.40
€550,000 Banco Santander Totta 3.75% 12/6/2012 559,892 0.08
€5,000,000 Portugal Obrigacoes do Tesouro OT
4.75% 14/6/2019 5,350,000 0.70 ___________ ______
8,979,672 1.18 ___________ ______
Slovakia€4,400,000 Slovak Republic 4.375% 21/1/2015 4,500,188 0.59 ___________ ______
Spain€1,500,000 Banco Bilbao Vizcaya Argentaria 4.5%
12/11/2015 1,486,755 0.20
€9,800,000 Bancontander 3.875% 27/5/2014 10,089,345 1.32
€6,700,000 Caja de Ahorros de Valencia Castellon
y Alicante 3% 11/5/2012 6,799,361 0.89
€1,000,000 Caja de Ahorros y Monte de Piedad de
Madrid 4.25% 25/5/2018 998,750 0.13
€800,000 La Caja de Ahorros y Pensiones de
Barcelona 3.25% 5/10/2015 781,736 0.10
€4,500,000 Santander International Debt SAU
5.125% 11/4/2011 4,702,590 0.62
€500,000 Santander Issuances S.A Unipersonal
5.435% 24/10/2017 512,488 0.07
€2,325,000 Spain Government Bond 4.2%
31/1/2037 2,226,629 0.29
€1,000,000 Spain Government Bond 4.6%
30/7/2019 1,068,800 0.14
€1,748,000 Spain Government Bond 4.9%
30/7/2040 1,878,698 0.25
€2,445,000 Spain Government Bond 5.75%
30/7/2032 2,897,081 0.38
€1,000,000 Telefonica Emisiones SAU 3.75%
2/2/2011 1,026,155 0.14
€500,000 Telefonica Emisiones SAU 5.496%
1/4/2016 544,428 0.07 ___________ ______
35,012,816 4.60 ___________ ______
Sweden€3,500,000 Svensk Exportkredit AB 3.625%
27/5/2014 3,562,825 0.47
€2,000,000 Svenska Handelsbanken AB 3%
20/8/2012 2,006,440 0.26
€275,000 Svenska Handelsbanken AB 4.875%
25/3/2014 291,424 0.04
€950,000 Vattenfall Treasury 6.75% 31/1/2019 1,118,877 0.15 ___________ ______
6,979,566 0.92 ___________ ______
Portfolio of Investments 31 August 2009
Transferable Securities Admitted to an Official Stock Exchange
Listing or Dealt in on Another Regulated Market
Holding Description Value (€) %
Transferable Securities Admitted to an Official Stock Exchange
Listing or Dealt in on Another Regulated Market
Holding Description Value (€) %
Euro Bond Fund continued

68 BlackRock Global Funds (BGF)
Switzerland
€900,000 UBS / London 5.375% 11/4/2011 927,630 0.12 ___________ ______
United Kingdom
€1,100,000 Abbey National Treasury Services 3.375%
8/6/2015 1,068,804 0.14
€575,000 Anglian Water Services Financing
4.625% 7/10/2013 595,082 0.08
€4,376,098 Arran Residential Mortgages Funding
'2006-1X A2C' FRN 12/4/2056 3,999,068 0.52
€750,000 Aviva 5.7% 29/9/2015 (Perpetual) 568,125 0.07
€2,000,000 Aviva 6.875% 22/5/2038 1,784,820 0.23
€500,000 Barclays Bank 4.875% 13/8/2019 500,025 0.07
€1,800,000 Barclays Bank 5.25% 27/5/2014 1,900,305 0.25
€500,000 Barclays Bank 5.75% 8/3/2011 518,778 0.07
€3,900,000 BAT International Finance 5.875%
12/3/2015 4,268,921 0.56
€4,600,000 Chester Asset Receivables Dealings
No 11 6.125% 15/10/2010 4,547,376 0.60
€105,000 EDF Energy 4.375% 15/12/2010 108,753 0.01
€1,313,680 EMF-UK FRN 13/3/2026 684,656 0.09
€5,000,000 Eurosail FRN 13/3/2045 2,225,274 0.29
€1,476,761 Gracechurch Mortgage Financing
'2007-1X 2A2' FRN 20/11/2056 1,464,562 0.19
€2,000,000 Holmes Financing '9 3A1' FRN
15/1/2021 1,984,130 0.26
€2,000,000 HSBC Holdings 3.625% 29/6/2020 1,870,640 0.25
€350,000 Imperial Tobacco Finance 4.375%
22/11/2013 353,887 0.05
€770,000 ITV 6% 3/10/2011 755,860 0.10
€1,350,000 Legal & General Group 4% 8/6/2025 1,031,103 0.14
€500,000 Lloyds TSB Bank 5.625% 5/3/2018 479,603 0.06
€228,000 Lloyds TSB Bank 6.25% 15/4/2014 245,369 0.03
€2,000,000 Paragon Mortgages '12X B1B' FRN
15/11/2038 471,467 0.06
€2,000,000 Paragon Mortgages '14X BB' FRN
15/9/2039 274,326 0.04
US$1,437,290 Paragon Mortgages FRN 15/5/2043 366,430 0.05
€1,750,000 Paragon Mortgages FRN 15/4/2044 560,000 0.07
€2,300,000 Permanent Financing '8 4A' FRN
10/9/2032 2,215,487 0.29
€400,000 Prudential 5.75% 19/12/2021 373,474 0.05
€500,000 Rolls-Royce 4.5% 16/3/2011 519,150 0.07
€1,925,000 Royal Bank of Scotland 6.934%
9/4/2018 1,872,294 0.25
€495,000 Scottish & Southern Energy 6.125%
29/7/2013 535,107 0.07
€800,000 Standard Chartered 4.875% 11/3/2011 829,448 0.11
€1,080,000 Tesco 5.625% 12/9/2012 1,162,404 0.15
£1,700,000 United Kingdom Gilt 4.75% 7/12/2038 2,141,894 0.28
€1,500,000 Vodafone Group 6.25% 15/1/2016 1,695,945 0.22 ___________ ______
43,972,567 5.77 ___________ ______
United States
€1,000,000 American Honda Finance 3.75%
16/3/2011 1,021,230 0.13
€1,500,000 American International Group 4.875%
15/3/2067 599,933 0.08
€1,300,000 AT&T 4.375% 15/3/2013 1,351,812 0.18
€3,500,000 BA Covered Bond Issuer 4.125%
5/4/2012 3,535,053 0.46
€3,130,000 BA Covered Bond Issuer 4.25%
5/4/2017 2,974,549 0.39
€700,000 Banca Popolare di Bergamo Capital
Trust 8.364% 15/2/2011 (Perpetual) 654,500 0.09
€2,000,000 Banca Popolare di Lodi Investors
Trust III 6.742% 30/6/2015 (Perpetual) 1,465,000 0.19
€700,000 Bank of America 4% 28/3/2018 587,279 0.08
US$2,400,000 Bank of America 6.5% 1/8/2016 1,745,218 0.23
US$565,000 Belo 6.75% 30/5/2013 345,979 0.05
€750,000 Cargill 4.5% 29/9/2014 765,364 0.10
€650,000 Cargill 6.25% 24/7/2015 708,773 0.09
US$925,000 Centex 5.125% 1/10/2013 621,450 0.08
€600,000 Citibank Credit Card Issuance Trust
5.375% 11/4/2011 587,526 0.08
US$1,522,330 Citicorp Mortgage Securities '2006-5 1A2'
6% 25/10/2036 997,612 0.13
US$7,000,000 CS First Boston Mortgage Securities
'1999-C1 C' FRN 15/9/2041 4,899,001 0.64
€850,000 Daimler North America 4.375%
16/3/2010 860,247 0.11
US$3,235,000 DR Horton 6.125% 15/1/2014 2,128,115 0.28
US$875,000 Enterprise Products Operating 4.6%
1/8/2012 634,746 0.08
US$699,166 First Union National Bank Commercial
Mortgage '1999-C4 A2' 7.39%
15/12/2031 489,120 0.06
€4,852,000 Goldman Sachs Group 3.5% 8/12/2011 5,024,489 0.66
€750,000 Goldman Sachs Group 3.75% 4/2/2013 748,114 0.10
€1,200,000 Goldman Sachs Group 5.375%
15/2/2013 1,257,468 0.17
US$1,000,000 Hewlett-Packard 2.25% 27/5/2011 712,576 0.09
€1,400,000 Hypo Real Estate International Trust I
5.864% 14/6/2017 (Perpetual) 203,000 0.03
US$3,360,000 International Paper 7.5% 15/8/2021 2,378,029 0.31
US$1,144,992 JP Morgan Mortgage Trust
'2006-S3 1A12' 6.5% 25/8/2036 595,305 0.08
US$1,657,783 JP Morgan Mortgage Trust
'2007-S1 2A22' 5.75% 25/3/2037 919,231 0.12
US$2,061,226 JP Morgan Mortgage Trust
'2007-S2 1A15' 6.75% 25/6/2037 1,164,692 0.15
€750,000 JPMorgan Chase & Co 5.25% 8/5/2013 797,813 0.11
€1,200,000 JPMorgan Chase Bank NA 4.625%
31/5/2017 1,208,136 0.16
US$2,585,000 Kinder Morgan 6.5% 1/9/2012 1,849,766 0.24
US$2,000,000 Kraft Foods 6.125% 23/8/2018 1,536,265 0.20
US$1,740,000 Ltd Brands 6.125% 1/12/2012 1,203,691 0.16
US$710,000 Masco 7.125% 15/8/2013 480,134 0.06
€1,400,000 Morgan Stanley 3.75% 1/3/2013 1,376,949 0.18
€1,000,000 Parker Hannifin 3.5% 11/11/2010 996,249 0.13
€1,400,000 Pfizer 3.625% 3/6/2013 1,440,761 0.19
US$3,900,000 Philip Morris International 5.65%
16/5/2018 2,897,614 0.38
€1,500,000 Philip Morris International 5.875%
4/9/2015 1,662,720 0.22
US$1,860,000 Pulte Homes 6.25% 15/2/2013 1,288,668 0.17
€1,400,000 Roche Holdings 4.625% 4/3/2013 1,483,251 0.20
€1,500,000 SLM Student Loan Trust '2003-10'
4.05% 17/9/2010 1,487,370 0.20
US$4,300,000 SLM Student Loan Trust '2008-5 A2'
FRN 25/10/2016 3,038,467 0.40
US$4,300,000 SLM Student Loan Trust '2008-5 A3'
FRN 25/1/2018 3,050,619 0.40
US$2,000,000 Verizon Communications 8.75%
1/11/2018 1,768,851 0.23
€1,650,000 Verizon Wireless Capital 7.625%
19/12/2011 1,834,330 0.24
€600,000 Verizon Wireless Capital 8.75%
18/12/2015 756,786 0.10
€500,000 VW Credit 5.125% 19/5/2011 520,075 0.07
Portfolio of Investments 31 August 2009
Transferable Securities Admitted to an Official Stock Exchange
Listing or Dealt in on Another Regulated Market
Holding Description Value (€) %
Transferable Securities Admitted to an Official Stock Exchange
Listing or Dealt in on Another Regulated Market
Holding Description Value (€) %
Euro Bond Fund continued

Audited Annual Report and Accounts 69
The notes on pages 236 to 244 form an integral part of these financial statements.
US$1,384,365 Wells Fargo Mortgage Backed
Securities Trust '2007-10 1A21'
6% 25/7/2037 844,590 0.11
€2,950,000 WM Covered Bond Program 4%
27/9/2016 2,756,392 0.36 ___________ ______
74,254,908 9.75 ___________ ______
Total Bonds 703,774,642 92.40 ___________ ______
Total Transferable Securities Admitted
to an Official Stock Exchange Listing or
Dealt in on Another Regulated Market 730,687,976 95.93 ___________ ______
Unquoted Securities
BONDS
Netherlands
US$1,100,000 Siemens Financieringsmaatschappij
'144A' 5.75% 17/10/2016 842,715 0.11 ___________ ______
Iceland
US$2,500,000 Glitnir Banki HF '144A' 6.375%
25/9/2012 354,289 0.05 ___________ ______
United States
US$1,400,000 BAE Systems Holdings '144A' 4.95%
1/6/2014 1,011,674 0.13 ___________ ______
United Kingdom
US$14,000,000 Eurosail '2007-3A A2B' FRN
13/6/2045 2,302,442 0.30
£3,750,000 Eurosail '2007-3A A3C' FRN
13/6/2045 724,199 0.10 ___________ ______
3,026,641 0.40 ___________ ______
Total Unquoted Securities 5,235,319 0.69 ___________ ______
Total Portfolio 735,923,295 96.62
Other Net Assets 25,766,155 3.38 ___________ ______
Total Net Assets (€) 761,689,450 100.00 ___________ ______
Portfolio of Investments 31 August 2009
Transferable Securities Admitted to an Official Stock Exchange
Listing or Dealt in on Another Regulated Market
Holding Description Value (€) %
Unquoted Securities
Holding Description Value (€) %
Euro Bond Fund continued
Open Forward Foreign Exchange Transactions as at 31 August 2009
Core Fund
¥297,557,328 US$3,076,800 3/9/2009 86,275
KRW3,889,079,000 US$3,158,771 3/9/2009 (31,345)
US$2,611,430 ¥250,175,000 3/9/2009 (55,340)
US$3,076,803 KRW3,889,079,000 3/9/2009 (26,018)
US$11,626,628 ZAR90,940,000 10/9/2009 (13,958)
US$10,319,073 €7,205,000 11/9/2009 16,616
€14,218,566 £12,100,000 17/9/2009 473,390
€11,886,801 ¥1,573,970,000 17/9/2009 39,393
€4,750,121 PLN19,627,500 17/9/2009 (36,147)
€54,019,743 US$75,000,000 17/9/2009 1,532,287
£3,000,000 €3,500,910 17/9/2009 (93,015)
HUF829,183,000 €3,032,857 17/9/2009 3,267
¥1,527,000,000 €11,463,964 17/9/2009 29,896
NOK48,195,000 €5,343,126 17/9/2009 246,485
PLN7,480,000 €1,807,445 17/9/2009 16,592
PLN46,870,439 HUF3,056,890,000 17/9/2009 236,539
US$11,795,028 €8,307,766 17/9/2009 (53,219)
SEK57,534,000 CZK140,910,613 22/10/2009 110,041
US$30,492,000 HKD236,117,851 30/10/2009 10,544
KRW10,155,793,000 ¥768,795,836 30/11/2009 (103,184)
AUD4,557,000 NZD5,575,079 1/12/2009 7,664 __________
Net unrealised profit 2,396,763 __________
Note: The net unrealised profit attributed to these transactions is included in the Statement
of Net Assets (see Note 2c).
Value date
Unrealised
profit/(loss)
€SalesPurchases
Open Futures Contracts as at 31 August 2009
(11) Euro Bund September 2009 (1,348,050)
(13) Euro Schatz September 2009 (1,407,575)
(100) Euro BOBL September 2009 (11,625,000)
(108) US Treasury 5 Year Note December 2009 (8,694,258)
(276) 3 Month Euro EURIBOR June 2010 (67,999,500)
276 3 Month Euro EURIBOR June 2011 67,174,950 __________
Total commitment (23,899,433)__________
Note: The net unrealised loss of €664 attributed to these transactions is included
in the Statement of Net Assets (see Note 2c).
Value
€
Expiration
dateContracts/Description
Number
of Contracts

70 BlackRock Global Funds (BGF)
Euro Bond Fund continued
Unrealised profit/(loss)
€DescriptionNominal
Value
Unrealised profit/(loss)
€DescriptionNominal
Value
£4,000,000 Inflation Linked Swap (Barclays)
(Fund pays floating UKRPI + 0bps;
and receives Fixed rate 3.055%) (11/10/2036) (565,701)
£4,000,000 Inflation Linked Swap (Deutsche Bank)
(Fund pays floating UKRPI + 0bps;
and receives Fixed 3.46%) (3/9/2037) (76,663)
€28,115,000 Inflation Linked Swap (Goldman Sachs)
(Fund pays Fixed 1.9292%)
and receives floating FRCPXTOB + 0bps;
(30/7/2014) 175,005
€28,115,000 Inflation Linked Swap (Goldman Sachs)
(Fund pays floating FRCPXTOB + 0bps;
and receives Fixed 2.4%) (30/7/2019) 56,759
€4,000,000 Credit Default Swaps (Citibank)
(Fund receives default protection on
Wolters Kluwer 5.125% 27/1/2014;
and pays Fixed 0.45%) (20/6/2014) (4,429)
€1,350,000 Credit Default Swaps (Citibank)
(Fund receives default protection on
Electrolux 6% 20/3/2008;
and pays Fixed 0.425%) (20/9/2012) 2,288
€5,500,000 Credit Default Swaps (Barclays)
(Fund receives default protection on
StMicroelectronics NV 0% 5/7/2013;
and pays Fixed 0.235%) (20/12/2012) 53,723
€3,500,000 Credit Default Swaps (Deutsche Bank)
(Fund receives default protection on
Pearson Plc 7% 27/10/2014;
and pays Fixed 0.56%) (20/6/2013) (21,331)
€4,470,000 Credit Default Swaps (Union Bank of Switzerland)
(Fund receives default protection on
Clariant AG 4.375% 5/4/2013;
and pays Fixed 2.45%) (20/6/2013) 28,535
€4,450,000 Credit Default Swaps (Morgan Stanley)
(Fund receives default protection on
Unilever NV 7.125% 1/11/2010;
and pays Fixed 0.33%) (20/3/2013) (18,593)
€2,000,000 Credit Default Swaps (Deutsche Bank)
(Fund receives default protection on
Goldman Sachs Group Inc 6.6% 15/1/2012;
and pays Fixed 5%) (20/12/2013) (291,910)
€2,200,000 Credit Default Swaps (Credit Suisse)
(Fund receives default protection on
Man Group Plc 3.75% 12/11/2009;
and pays Fixed 1.98%) (20/12/2013) 3,540
€1,600,000 Credit Default Swaps (Credit Suisse)
(Fund provides default protection on
Heidelberg Cement Finance BV 4.75% 9/4/2009;
and receives Fixed 6.62%) (20/12/2013) (45,644)
€2,000,000 Credit Default Swaps (Credit Suisse)
(Fund provides default protection on
SNS Bank NV 4.625% 18/2/2014;
and receives Fixed 3.5%) (20/12/2013) 83,954
€900,000 Credit Default Swaps (Credit Suisse)
(Fund receives default protection on
Portugal Telecom International Finance BV 3.75%
26/3/2012; and pays Fixed 1.65%) (20/12/2013) (36,319)
€2,200,000 Credit Default Swaps (Deutsche Bank)
(Fund receives default protection on
Portugal Telecom International Finance BV 3.75%
26/3/2012; and pays Fixed 1.6%) (20/12/2013) (84,291)
US$2,000,000 Credit Default Swaps (Goldman Sachs)
(Fund receives default protection on
Bank of America Corp 7.4% 15/1/2011;
and pays Fixed 2.8%) (20/3/2014) (21,617)
€2,000,000 Credit Default Swaps (Deutsche Bank)
(Fund receives default protection on
Adecco S.A. 0% 26/8/2013;
and pays Fixed 1.78%) (20/3/2014) (43,413)
€2,600,000 Credit Default Swaps (Deutsche Bank)
(Fund receives default protection on
Deutsche Lufthansa AG 4.625% 6/5/2013;
and pays Fixed 1.77%) (20/9/2013) 11,526
€2,600,000 Credit Default Swaps (Citibank)
(Fund receives default protection on
Tomkins Plc 8% 20/12/2011;
and pays Fixed 2.9%) (20/9/2013) (139,396)
€500,000 Credit Default Swaps (Barclays)
(Fund receives default protection on
iTraxx Europe Sub Financials 9;
and pays Fixed 1.65%) (20/6/2013) (1,752)
€900,000 Credit Default Swaps (Deutsche Bank)
(Fund receives default protection on
Fortis Bank SA/NV 1/2/2012;
and pays Fixed 1.2%) (20/9/2013) (23,672)
US$220,000 Credit Default Swaps (JP Morgan)
(Fund receives default protection on
Nova Chemicals Corp 15/11/2013;
and pays Fixed 5%) (20/6/2012) (3,472)
US$160,000 Credit Default Swaps (Citibank)
(Fund receives default protection on
Nova Chemicals Corp 15/11/2013;
and pays Fixed 5%) (20/3/2012) (3,547)
€9,000,000 Credit Default Swaps (Credit Suisse)
(Fund receives default protection on
iTraxx Europe Sub Financials 11;
and pays Fixed 1.85%) (20/6/2014) (994)
US$565,000 Credit Default Swaps (Barclays)
(Fund receives default protection on
Belo Corp. 7.75% 1/6/2027;
and pays Fixed 5%) (20/6/2013) (29,850)
€2,950,000 Credit Default Swaps (Citibank)
(Fund receives default protection on
Valeo Sa 3.75% 24/6/2013;
and pays Fixed 2.2%) (20/6/2014) 30,299
US$800,000 Credit Default Swaps (Goldman Sachs)
(Fund receives default protection on
Nova Chemicals Corp 4.5375% 15/11/2013;
and pays Fixed 5%) (20/12/2013) (34,346)
US$1,860,000 Credit Default Swaps (Royal Bank of Scotland)
(Fund receives default protection
on Pulte Homes Inc 5.25% 15/1/2014;
and pays Fixed 1%) (20/3/2013) (7,660)
US$925,000 Credit Default Swaps (Royal Bank of Scotland)
(Fund receives default protection on
Centex Corp 5.25% 15/6/2015;
and pays Fixed 1%) (20/12/2013) (26,386)
US$710,000 Credit Default Swaps (JP Morgan)
(Fund receives default protection on
Masco Corporation 6.125% 3/10/2016;
and pays Fixed 5%) (20/9/2013) (18,462)
US$1,740,000 Credit Default Swaps (Royal Bank of Scotland)
(Fund receives default protection on
Limited Brands Inc 6.9% 15/7/2017;
and pays Fixed 1%) (20/12/2012) (7,855)
US$3,235,000 Credit Default Swaps (JP Morgan)
(Fund receives default protection on
D R Horton Inc 5.375% 15/6/2012;
and pays Fixed 1%) (20/3/2014) (65,235)
Swaps as at 31 August 2009

Audited Annual Report and Accounts 71
The notes on pages 236 to 244 form an integral part of these financial statements.
Euro Bond Fund continued
Unrealised profit/(loss)
€DescriptionNominal
Value
Unrealised profit/(loss)
€DescriptionNominal
Value
US$2,585,000 Credit Default Swaps (Royal Bank of Scotland)
(Fund receives default protection on
Knight Inc 6.5% 1/9/2012;
and pays Fixed 1.3%) (20/9/2012) (2,045)
US$1,580,000 Credit Default Swaps (Goldman Sachs)
(Fund receives default protection on
Croatia (Republic of) 5% 15/4/2014;
and pays Fixed 2.2%) (20/6/2014) 5,758
CZK 70,000,000 Interest Rate Swaps (Barclays)
(Fund receives Floating CZK Interbank 6 Month;
and pays Fixed 4.16%) (18/5/2017) (76,013)
€25,000,000 Interest Rate Swaps (Royal Bank of Scotland)
(Fund receives Fixed 3.905%;
and pays Floating EUR Euribor 6 Month)
(21/2/2011) 870,650
€25,000,000 Interest Rate Swaps (Morgan Stanley)
(Fund receives Fixed 4.025%;
and pays Floating EUR Euribor 6 Month)
(20/3/2010) 391,025
CZK 77,900,000 Interest Rate Swaps (Deutsche Bank)
(Fund receives Fixed 3.98%;
and pays Floating CZK Interbank 6 Month)
(16/9/2018) 36,121
NZD 25,200,000 Interest Rate Swaps (Royal Bank of Scotland)
(Fund receives Fixed 6.885%;
and pays Floating NZD BBR FRA 3 Month)
(3/7/2019) 40,756
£16,100,000 Interest Rate Swaps (Barclays)
(Fund receives Fixed 4.6525%;
and pays Floating GBP Libor 6 Month)
(8/8/2013) 157,053
£5,150,000 Interest Rate Swaps (Barclays)
(Fund receives Floating GBP Libor 6 Month;
and pays Fixed 4.8125%) (8/8/2018) (111,667)
HUF 195,000,000 Interest Rate Swaps (Deutsche Bank)
(Fund receives Floating HUF BUBOR 6 Month;
and pays Fixed 6.81%) (13/8/2020) 216
HUF1,301,000,000 Interest Rate Swaps (JP Morgan)
(Fund receives Floating HUF BUBOR 6 Month;
and pays Fixed 6.82%) (13/8/2020) (1,701)
CHF 20,615,000 Interest Rate Swaps (Goldman Sachs)
(Fund receives Floating CHF Libor 3 Month;
and pays Fixed 0.945%) (19/8/2012) (13,354)
AUD 19,000,000 Interest Rate Swaps (Deutsche Bank)
(Fund receives Fixed 4.22%;
and pays Floating AUD BBSW 3 Month)
(11/5/2011) (116,231)
AUD 37,985,000 Interest Rate Swaps (Deutsche Bank)
(Fund receives Fixed 4.2175%;
and pays Floating AUD BBSW 3 Month)
(11/5/2011) (232,903)
AUD 37,975,000 Interest Rate Swaps (Deutsche Bank)
(Fund receives Fixed 4.24%;
and pays Floating AUD BBSW 3 Month)
(10/5/2011) (227,529)
NZD 87,000,000 Interest Rate Swaps (ANZ)
(Fund receives Fixed 4.4%;
and pays Floating NZD BBR FRA 3 Month)
(2/6/2011) (105,571) __________
(512,344) __________
Swaps as at 31 August 2009
Note: The total market value of (€572,473) of these transactions is included in the Statement of Net Assets (see Note 2c).

72 BlackRock Global Funds (BGF)
Euro Corporate Bond Fund
FUNDS
United Kingdom
€85,312 Institutional Cash Series Institutional
Liquidity Fund 85,312 0.15 ___________ ______
Total Funds 85,312 0.15 ___________ ______
BONDS
Australia
€100,000 Australia & New Zealand Banking Group
4.625% 8/11/2010 103,154 0.18
€50,000 BHP Billiton Finance 4.75% 4/4/2012 52,818 0.09
€400,000 BHP Billiton Finance 6.375% 4/4/2016 456,596 0.81
€200,000 Commonwealth Bank of Australia 5.5%
6/8/2019 207,080 0.37
€350,000 Commonwealth Bank of Australia 5.875%
29/7/2011 373,735 0.66
€150,000 National Australia Bank 3.875% 4/6/2015 148,170 0.26
€81,006 Reds EHP Trust '2008-1E A2E' FRN
14/4/2014 77,347 0.14
€450,000 St George Bank 6.5% 24/6/2013 494,993 0.87
€250,000 Telstra 3.875% 24/7/2015 249,919 0.44
€400,000 Telstra 6% 8/4/2013 437,792 0.77 ___________ ______
2,601,604 4.59 ___________ ______
Austria
€200,000 BAWAG P.S.K. Bank fuer Arbeit und
Wirtschaft und Oesterreichische
Postsparkasse 4.35% 28/5/2013 200,340 0.36
€50,000 Energie AG Oberoesterreich 4.5%
4/3/2025 46,940 0.08 ___________ ______
247,280 0.44 ___________ ______
Bahrain
US$100,000 Arab Banking FRN 4/4/2017 47,938 0.08
US$100,000 Golden Belt 1 Sukuk BSC FRN 15/5/2012 15,746 0.03 ___________ ______
63,684 0.11 ___________ ______
Belgium
€50,000 Anheuser-Busch InBev 6.57% 27/2/2014 55,010 0.10
€200,000 Anheuser-Busch InBev 7.375% 30/1/2013 224,396 0.40
€50,000 Belgacom 4.125% 23/11/2011 51,959 0.09
€100,000 Elia System Operator 4.5% 22/4/2013 104,187 0.18 ___________ ______
435,552 0.77 ___________ ______
Bermuda
£100,000 Holcim GB Finance 8.75% 24/4/2017 131,870 0.23 ___________ ______
Canada
€50,000 Bank of Nova Scotia 5.125% 14/4/2011 52,445 0.09
€500,000 Royal Bank of Canada 4.125% 26/1/2010 505,775 0.89
€150,000 Royal Bank of Canada 4.5% 5/11/2012 157,484 0.28
€150,000 Royal Bank of Canada 5.75% 25/7/2011 160,433 0.28
€100,000 Xstrata Canada Financial 5.875%
27/5/2011 104,019 0.19 ___________ ______
980,156 1.73 ___________ ______
Cayman Islands
€100,000 Mizuho Capital Investment EUR 1 5.02%
30/6/2011 (Perpetual) 84,000 0.15
€300,000 Thames Water Utilities Cayman Finance
6.125% 4/2/2013 320,505 0.56 ___________ ______
404,505 0.71 ___________ ______
Czech Republic
€150,000 CEZ 5.125% 12/10/2012 158,122 0.28 ___________ ______
Denmark
€150,000 Danske Bank 4.75% 4/6/2014 156,480 0.28 ___________ ______
Finland
€60,000 Fortum OYJ 4.625% 19/11/2010 62,122 0.11
€82,000 Fortum OYJ 5% 19/11/2013 88,109 0.16 ___________ ______
150,231 0.27 ___________ ______
France
€550,000 Air Liquide 4.375% 3/6/2015 573,404 1.01
€100,000 Autoroutes du Sud de la France 5.625%
4/7/2022 98,475 0.17
€250,000 AXA 4.5% 23/1/2015 260,066 0.46
€200,000 AXA 5.777% 6/7/2016 (Perpetual) 157,663 0.28
€150,000 AXA 6.75% 15/12/2020 149,789 0.26
€150,000 BNP Paribas 3.25% 27/3/2012 153,137 0.27
€75,000 BNP Paribas 4.875% 17/10/2011 (Perpetual) 52,125 0.09
€50,000 BNP Paribas 5% 16/12/2013 53,945 0.10
€200,000 Bouygues 4.75% 24/5/2016 205,435 0.36
€200,000 Caisse Nationale des Caisses d'Epargne
et de Prevoyance 5.25% 30/7/2014
(Perpetual) 126,833 0.22
€175,000 Cie de Saint-Gobain 4.75% 11/4/2017 171,372 0.30
€200,000 CNP Assurances 4.75% 22/12/2016
(Perpetual) 139,000 0.25
€300,000 Compagnie de Financement Foncier
3.875% 25/4/2055 236,183 0.42
€200,000 Credit Agricole 5.875% 11/6/2019 217,955 0.38
€100,000 Credit Agricole 6% 24/6/2013 111,019 0.20
€300,000 Credit Agricole Covered Bonds 3.5%
21/7/2014 305,723 0.54
€150,000 Credit Logement 4.247% 5/4/2011
(Perpetual) 125,063 0.22
€700,000 Dexia Credit Local 5.375% 21/7/2014 733,574 1.29
€250,000 EDF 4.625% 6/11/2013 265,090 0.47
€500,000 EDF 5.125% 23/1/2015 539,708 0.95
€500,000 EDF 5.625% 23/1/2013 543,510 0.96
€250,000 France Telecom 4.375% 21/2/2012 261,170 0.46
€600,000 France Telecom 5% 22/1/2014 645,300 1.14
€750,000 France Telecom 7.25% 28/1/2013 853,245 1.51
€400,000 GDF Suez 6.25% 24/1/2014 448,872 0.79
€150,000 HSBC France 4.875% 15/1/2014 159,038 0.28
€200,000 Lafarge 5.75% 27/5/2011 208,165 0.37
€50,000 Lafarge 7.625% 24/11/2016 55,635 0.10
€100,000 Natixis FRN 6/7/2017 82,133 0.15
€100,000 Pernod-Ricard 4.625% 6/12/2013 100,748 0.18
€100,000 Pernod-Ricard 7% 15/1/2015 106,840 0.19
€100,000 PPR 5.25% 29/3/2011 103,620 0.18
€150,000 Sanofi-Aventis 4.5% 18/5/2016 158,073 0.28
€50,000 Schneider Electric 5.375% 8/1/2015 53,931 0.10
€100,000 Schneider Electric 6.75% 16/7/2013 112,621 0.20
€50,000 Societe Generale 5.875% 21/12/2016 54,300 0.10
€50,000 Thales 4.375% 22/7/2011 51,984 0.09
€40,000 TPSA Eurofinance France 4.625% 5/7/2011 41,422 0.07
€135,000 Unibail-Rodamco 4% 29/10/2011 137,340 0.24
€16,000 Veolia Environnement 5.25% 24/4/2014 17,014 0.03
€175,000 Veolia Environnement 6.75% 24/4/2019 201,320 0.36 ___________ ______
9,071,840 16.02 ___________ ______
Germany
€750,000 Bayerische Landesbank 4.375% 22/1/2014 787,638 1.39
€450,000 Bundesobligation 4.25% 12/10/2012 481,248 0.85
Portfolio of Investments 31 August 2009
Transferable Securities Admitted to an Official Stock Exchange
Listing or Dealt in on Another Regulated Market
Holding Description Value (€) %
Transferable Securities Admitted to an Official Stock Exchange
Listing or Dealt in on Another Regulated Market
Holding Description Value (€) %

Audited Annual Report and Accounts 73
The notes on pages 236 to 244 form an integral part of these financial statements.
Euro Corporate Bond Fund continued
€200,000 Commerzbank 4.125% 13/9/2016 167,598 0.30
€100,000 Daimler AG 4.625% 2/9/2014 101,434 0.18
€50,000 Deutsche Bank 3.625% 9/3/2017 47,333 0.08
€175,000 Deutsche Bank FRN 16/1/2014 168,304 0.30
€155,000 EWE 5.25% 16/7/2021 160,561 0.28
€500,000 Landesbank Schleswig-Holstein Girozentrale
4.25% 11/3/2013 518,055 0.91
€100,000 Muenchener Rueckversicherungs 5.767%
12/6/2017 (Perpetual) 85,604 0.15
€100,000 Muenchener Rueckversicherungs 6.75%
21/6/2023 105,464 0.19
€100,000 Robert Bosch GmbH 3.75% 12/6/2013 102,794 0.18 ___________ ______
2,726,033 4.81 ___________ ______
Guernsey
€300,000 Credit Suisse Group Finance Guernsey
3.625% 23/1/2018 288,395 0.51 ___________ ______
Iceland
€100,000 Kaupthing Bank Hf FRN 30/6/2014 550 0.00 ___________ ______
Ireland
€1,150,000 German Postal Pensions Securitisation
2.75% 18/1/2011 1,167,572 2.06
€48,714 Talisman Finance '7 H' FRN 22/4/2017 7,306 0.01 ___________ ______
1,174,878 2.07 ___________ ______
Italy
€50,000 Assicurazioni Generali 4.875% 11/11/2014 52,825 0.09
€100,000 Atlantia 5.625% 6/5/2016 108,219 0.19
€50,000 Banca Italease FRN 2/2/2010 49,087 0.09
€150,000 ENI 5.875% 20/1/2014 166,435 0.30
€100,000 Intesa Sanpaolo 4.375% 26/6/2018 99,801 0.18
€700,000 Intesa Sanpaolo 5% 28/4/2011 731,672 1.29
€100,000 UniCredit 5.25% 14/1/2014 107,070 0.19
€100,000 UniCredit 6.7% 5/6/2018 97,888 0.17 ___________ ______
1,412,997 2.50 ___________ ______
Japan
€100,000 Bank of Tokyo-Mitsubishi UFJ 3.5%
16/12/2015 99,691 0.18
€150,000 Resona Bank 3.75% 15/4/2015 147,375 0.26
€100,000 Shinsei Bank 3.75% 23/2/2016 75,750 0.13 ___________ ______
322,816 0.57 ___________ ______
Jersey
€40,000 BAA Funding '144A' FRN 30/9/2014 39,785 0.07
€50,000 ProSecure Funding 4.668% 30/6/2016 31,167 0.06
€70,000 WPP Group 4.375% 5/12/2013 68,699 0.12
€55,000 WPP Group 6.625% 12/5/2016 56,981 0.10 ___________ ______
196,632 0.35 ___________ ______
Luxembourg
US$150,000 ArcelorMittal 6.125% 1/6/2018 101,566 0.18
€77,000 Belgelec Finance 4.25% 24/6/2010 78,571 0.14
US$100,000 Enel Finance International '144A' 6.25%
15/9/2017 76,545 0.13
€600,000 ITW Finance Europe 5.25% 1/10/2014 622,806 1.10
€50,000 JP Morgan Bank Luxembourg for Swiss Life
5% 16/11/2015 (Perpetual) 28,567 0.05
€150,000 Michelin Luxembourg SCS 8.625%
24/4/2014 174,264 0.31
€10,000 Telecom Italia Finance 7.75% 24/1/2033 11,244 0.02 ___________ ______
1,093,563 1.93 ___________ ______
Netherlands
€125,000 Adecco International Financial Services
4.5% 25/4/2013 126,529 0.22
€150,000 Alliander Finance 4% 20/4/2012 154,553 0.27
€100,000 Allianz Finance II 4.375% 17/2/2017
(Perpetual) 78,643 0.14
€750,000 Allianz Finance II 4.75% 22/7/2019 773,479 1.37
€150,000 Allianz Finance II 6.125% 31/5/2022 155,951 0.27
€600,000 BASF Finance Europe 5.125% 9/6/2015 643,911 1.14
€120,000 BMW Finance 6.125% 2/4/2012 128,550 0.23
€100,000 British American Tobacco Holdings The
Netherlands 4.375% 15/6/2011 103,791 0.18
€150,000 Coca-Cola HBC Finance 7.875% 15/1/2014 174,796 0.31
€500,000 Daimler International Finance 5.875%
8/9/2011 526,438 0.93
€65,000 Daimler International Finance 7% 21/3/2011 69,363 0.12
€250,000 Deutsche Telekom International Finance
4.375% 2/6/2014 259,260 0.46
€100,000 Deutsche Telekom International Finance
6% 20/1/2017 110,655 0.20
€150,000 Deutsche Telekom International Finance
7.125% 11/7/2011 162,644 0.29
€350,000 Deutsche Telekom International Finance
8.125% 29/5/2012 397,577 0.70
€100,000 Diageo Capital 5.5% 1/7/2013 108,343 0.19
€100,000 E.ON International Finance 5.125% 7/5/2013 107,350 0.19
€150,000 E.ON International Finance 5.5% 19/1/2016 164,153 0.29
€57,000 E.ON International Finance 6.375% 29/5/2017 65,685 0.12
€40,000 EDP Finance 4.125% 29/6/2020 38,176 0.07
€200,000 ELM BV for Elsevier Finance 6.5% 2/4/2013 220,008 0.39
€200,000 ELM for Swiss Life Insurance & Pension
Group 5.849% 12/4/2017 (Perpetual) 117,000 0.21
€50,000 Enbw International Finance 4.125% 7/7/2015 51,403 0.09
€115,000 Enbw International Finance 6.125% 7/7/2039 124,410 0.22
€150,000 Eureko BV FRN 24/6/2015 (Perpetual) 91,375 0.16
€150,000 ING Bank 3.5% 16/9/2020 131,546 0.23
€200,000 ING Bank 5.5% 4/1/2012 206,505 0.36
€200,000 ING Bank 5.875% 23/2/2011 208,539 0.37
€100,000 ING Verzekeringen 6.25% 21/6/2021 80,876 0.14
€50,000 Koninklijke DSM 5.25% 17/10/2017 53,369 0.09
€50,000 Koninklijke DSM 5.75% 17/3/2014 54,391 0.10
€545,000 Koninklijke KPN 5% 13/11/2012 577,425 1.02
€350,000 Linde Finance 4.75% 24/4/2017 361,846 0.64
€200,000 Nederlandse Gasunie 4.25% 20/6/2016 206,208 0.36
€500,000 Nederlandse Waterschapsbank 5.125%
19/4/2011 527,848 0.93
€270,000 PACCAR Financial Europe 5.125% 19/5/2011 272,098 0.48
€50,000 Portugal Telecom International Finance 6%
30/4/2013 54,013 0.10
€350,000 Rabobank Nederland 4.375% 5/5/2016 366,384 0.65
€100,000 Rabobank Nederland 5.875% 20/5/2019 108,664 0.19
€230,000 Red Electrica de Espana Finance 4.75%
18/9/2013 241,424 0.43
€200,000 RWE Finance 2.5% 16/9/2011 202,338 0.36
€441,000 RWE Finance 5.125% 23/7/2018 474,160 0.84
€100,000 RWE Finance 6.625% 31/1/2019 118,086 0.21
€100,000 Schlumberger Finance 4.5% 25/3/2014 104,783 0.18
€122,000 Shell International Finance 4.375%
14/5/2018 126,371 0.22
€300,000 Siemens Financieringsmaatschappij 5.125%
20/2/2017 322,065 0.57
€100,000 Siemens Financieringsmaatschappij 5.25%
14/9/2066 92,000 0.16
€100,000 Syngenta Finance 4% 30/6/2014 103,388 0.18
€30,000 Syngenta Finance 4.125% 22/4/2015 30,894 0.05
Transferable Securities Admitted to an Official Stock Exchange
Listing or Dealt in on Another Regulated Market
Holding Description Value (€) %
Transferable Securities Admitted to an Official Stock Exchange
Listing or Dealt in on Another Regulated Market
Holding Description Value (€) %
Portfolio of Investments 31 August 2009

74 BlackRock Global Funds (BGF)
Euro Corporate Bond Fund continued
€155,000 Urenco Finance 3.375% 7/12/2010 156,597 0.28
€550,000 Urenco Finance 5.375% 22/5/2015 566,170 1.00
€250,000 Volkswagen International Finance 3.75%
16/11/2010 254,666 0.45
€100,000 Volkswagen International Finance 5.375%
15/11/2013 106,078 0.19
€200,000 Wolters Kluwer 6.375% 10/4/2018 221,294 0.39 ___________ ______
11,284,069 19.93 ___________ ______
Norway
€300,000 DnB NOR Bank 5.875% 20/6/2013 327,405 0.58
€50,000 Statkraft AS 5.5% 2/4/2015 53,339 0.09
€50,000 Statkraft AS 6.625% 2/4/2019 56,438 0.10
€70,000 StatoilHydro 4.375% 11/3/2015 73,509 0.13
€250,000 StatoilHydro 5.625% 11/3/2021 280,131 0.50 ___________ ______
790,822 1.40 ___________ ______
Poland
€335,000 Poland Government International Bond
5.875% 3/2/2014 359,437 0.64 ___________ ______
Portugal
€100,000 Banco Comercial Portugues 5.625%
23/4/2014 106,302 0.19
€150,000 Caixa Geral de Depositos 5.125%
19/2/2014 158,872 0.28 ___________ ______
265,174 0.47 ___________ ______
Slovakia
€100,000 Slovak Republic 4.375% 21/1/2015 102,277 0.18 ___________ ______
Spain
€100,000 Banco Bilbao Vizcaya Argentaria 4.5%
12/11/2015 99,116 0.18
€200,000 Bancontander 3.875% 27/5/2014 205,905 0.36
€400,000 BBVA Senior Finance SAU 3.625% 14/5/2012 408,712 0.72
€200,000 Santander International Debt 3.375%
21/4/2011 203,857 0.36
€200,000 Santander Issuances S.A Unipersonal FRN
23/3/2017 177,254 0.31
€250,000 Telefonica Emisiones SAU 5.431%
3/2/2014 269,811 0.48
€50,000 Telefonica Emisiones SAU 5.58%
12/6/2013 54,169 0.10 ___________ ______
1,418,824 2.51 ___________ ______
Sweden
€200,000 If P&C Insurance 7.5% 30/3/2021 191,108 0.34
€400,000 Nordea Bank AB 4.5% 12/5/2014 416,306 0.74
€550,000 Svenska Handelsbanken AB 3% 20/8/2012 551,771 0.97
€50,000 Svenska Handelsbanken AB 4.875%
25/3/2014 52,986 0.09
£100,000 Svenska Handelsbanken AB 5.375%
4/9/2013 (Perpetual) 98,799 0.17
€100,000 Vattenfall Treasury 6.75% 31/1/2019 117,777 0.21
€200,000 Vattenfall Treasury AB 4.25% 19/5/2014 207,458 0.37 ___________ ______
1,636,205 2.89 ___________ ______
Switzerland
€300,000 Credit Suisse 4.75% 5/8/2019 298,646 0.53
€200,000 Credit Suisse 5.125% 30/3/2012 210,927 0.37
€150,000 Credit Suisse/London 5.125% 4/4/2011 156,810 0.28
€170,000 UBS (Jersey) 4.5% 16/9/2019 155,044 0.27
US$100,000 UBS (Stamford Branch) 5.875% 20/12/2017 69,228 0.12
€150,000 UBS AG/London 5.625% 19/5/2014 159,008 0.28 ___________ ______
1,049,663 1.85 ___________ ______
United Kingdom
€100,000 Anglian Water Services Financing 4.625%
7/10/2013 103,493 0.18
€190,000 Aviva 5.7% 29/9/2015 (Perpetual) 143,925 0.25
€100,000 Aviva 5.75% 14/11/2021 91,755 0.16
€50,000 Aviva 6.875% 22/5/2038 44,621 0.08
€100,000 Bank of Scotland 5.5% 29/10/2012 99,556 0.18
€50,000 Barclays Bank 4.875% 13/8/2019 50,003 0.09
€400,000 Barclays Bank 6% 23/1/2018 410,124 0.72
US$160,000 Barclays Bank '144A' 10.179% 12/6/2021 138,901 0.25
€430,000 BAT International Finance 5.875% 12/3/2015 470,676 0.83
€325,000 BG Energy Capital 3.375% 15/7/2013 329,308 0.58
US$100,000 BP Capital Markets 5.25% 7/11/2013 76,493 0.14
€170,000 Chester Asset Receivables Dealings No 11
6.125% 15/10/2010 168,055 0.30
€60,000 GlaxoSmithKline Capital 3.875% 6/7/2015 61,280 0.11
€100,000 GlaxoSmithKline Capital 5.625% 13/12/2017 111,413 0.20
€100,000 HSBC Bank FRN 29/3/2016 95,372 0.17
€295,000 HSBC Holdings 3.625% 29/6/2020 275,919 0.49
€250,000 HSBC Holdings 4.5% 30/4/2014 261,561 0.46
€150,000 Imperial Tobacco Finance 4.375% 22/11/2013 151,666 0.27
€95,000 Kingfisher 4.125% 23/11/2012 94,071 0.17
€150,000 Legal & General Group 4% 8/6/2025 114,567 0.20
£200,000 Legal & General Group 10% 23/7/2041 257,274 0.45
€350,000 Lehman Brothers UK Capital Funding II
3.875% 22/2/2011 (Perpetual) 490 0.00
€191,000 Lloyds TSB Bank 6.25% 15/4/2014 205,550 0.36
€350,000 National Grid Electricity Transmission 6.625%
28/1/2014 392,324 0.69
€350,000 Old Mutual 4.5% 18/1/2017 237,825 0.42
€150,000 OTE 5.375% 14/2/2011 156,471 0.28
€100,000 Prudential 5.75% 19/12/2021 93,369 0.16
€50,000 Rexam 4.375% 15/3/2013 48,944 0.09
£200,000 Rolls-Royce 6.75% 30/4/2019 250,803 0.44
€150,000 Royal Bank of Scotland Group FRN 29/9/2017
(Perpetual) 58,350 0.10
€90,000 Scottish & Southern Energy 6.125% 29/7/2013 97,292 0.17
€110,000 Severn Trent Utilities Finance 5.25%
11/3/2016 115,069 0.20
€450,000 Standard Chartered 4.875% 11/3/2011 466,565 0.82
€50,000 Standard Chartered 5.75% 30/4/2014 53,880 0.10
€100,000 Standard Chartered Bank 3.625% 3/2/2017 93,957 0.17
€550,000 Tesco 5.625% 12/9/2012 591,965 1.05
£100,000 United Kingdom Gilt 4.75% 7/12/2038 125,994 0.22
€80,000 Vodafone Group 5.125% 10/4/2015 87,296 0.15
€100,000 Vodafone Group 6.25% 15/1/2016 113,063 0.20
€100,000 Vodafone Group 6.875% 4/12/2013 114,426 0.20 ___________ ______
6,853,666 12.10 ___________ ______
Transferable Securities Admitted to an Official Stock Exchange
Listing or Dealt in on Another Regulated Market
Holding Description Value (€) %
Transferable Securities Admitted to an Official Stock Exchange
Listing or Dealt in on Another Regulated Market
Holding Description Value (€) %
Portfolio of Investments 31 August 2009

Audited Annual Report and Accounts 75
The notes on pages 236 to 244 form an integral part of these financial statements.
Euro Corporate Bond Fund continued
United States
€550,000 American Honda Finance 3.75% 16/3/2011 561,677 0.99
€550,000 AT&T 4.375% 15/3/2013 571,920 1.01
€150,000 Banca Popolare di Bergamo Capital Trust
8.364% 15/2/2011 (Perpetual) 140,250 0.25
€200,000 Banca Popolare di Lodi Investors Trust III
6.742% 30/6/2015 (Perpetual) 146,500 0.26
€50,000 Bristol-Myers Squibb 4.375% 15/11/2016 51,917 0.09
€160,000 Cargill 4.5% 29/9/2014 163,278 0.29
€100,000 Cargill 6.25% 24/7/2015 109,042 0.19
€500,000 Citibank Credit Card Issuance Trust 5.375%
11/4/2011 489,605 0.86
€205,000 Citigroup 5% 2/8/2019 179,710 0.32
US$150,000 Coca-Cola 3.625% 15/3/2014 108,254 0.19
€250,000 Deutsche Bank Capital Trust IV 5.33%
19/9/2013 (Perpetual) 173,749 0.31
US$150,000 Eli Lilly & Co 3.55% 6/3/2012 109,766 0.19
€100,000 Goldman Sachs Group 5.125% 16/10/2014 103,419 0.18
€300,000 Goldman Sachs Group 5.375% 15/2/2013 314,367 0.56
£240,000 Goldman Sachs Group 5.5% 12/10/2021 246,247 0.43
€50,000 Hypo Real Estate International Trust I
5.864% 14/6/2017 (Perpetual) 7,250 0.01
US$210,000 International Paper 7.5% 15/8/2021 148,627 0.26
€155,000 IntesaBci Capital Trust 6.988% 12/7/2011
(Perpetual) 137,640 0.24
€100,000 JPMorgan Chase & Co 4.375% 12/11/2019 97,504 0.17
€850,000 JPMorgan Chase & Co 5.25% 8/5/2013 904,188 1.60
€200,000 JPMorgan Chase Bank NA 4.625% 31/5/2017 201,356 0.36
€100,000 Lehman Brothers Holdings 5.375%
17/10/2012 16,375 0.03
€200,000 Lehman Brothers Holdings FRN 4/5/2011 32,750 0.06
€50,000 Metropolitan Life Global Funding I 4.625%
16/5/2017 44,969 0.08
€250,000 Morgan Stanley 4.375% 14/1/2011 254,290 0.45
US$300,000 Morgan Stanley 6% 13/5/2014 222,214 0.39
US$100,000 News America '144A' 5.65% 15/8/2020 71,853 0.13
€100,000 Parker Hannifin 3.5% 11/11/2010 99,625 0.18
€300,000 Pfizer 4.75% 3/6/2016 319,515 0.56
€200,000 Pfizer 5.75% 3/6/2021 213,877 0.38
€100,000 Philip Morris International 5.75% 24/3/2016 110,410 0.20
€100,000 Procter & Gamble 5.125% 24/10/2017 108,757 0.19
€300,000 Roche Holdings 6.5% 4/3/2021 357,180 0.63
€100,000 Schering-Plough 5.375% 1/10/2014 108,432 0.19
€100,000 SG Capital Trust III 5.419% 10/11/2013
(Perpetual) 69,449 0.12
€150,000 SLM 3.125% 17/9/2012 106,500 0.19
€250,000 SLM Student Loan Trust '2003-7' 3.8%
17/6/2010 248,849 0.44
US$100,000 SLM Student Loan Trust '2008-5 A2' FRN
25/10/2016 70,661 0.12
US$100,000 SLM Student Loan Trust '2008-5 A3' FRN
25/1/2018 70,944 0.13
€200,000 Toyota Motor Credit 5.25% 3/2/2012 212,668 0.38
€200,000 Verizon Wireless Capital 7.625% 19/12/2011 222,343 0.39
€150,000 Verizon Wireless Capital 8.75% 18/12/2015 189,197 0.33
€200,000 VW Credit 5.125% 19/5/2011 208,030 0.37
US$100,000 Waste Management 7.375% 11/3/2019 79,861 0.14
€250,000 WM Covered Bond Program 3.875%
27/9/2011 253,388 0.45
€100,000 Zurich Finance USA 4.5% 17/9/2014 103,783 0.18 ___________ ______
8,762,186 15.47 ___________ ______
Total Bonds 54,139,511 95.61 ___________ ______
Total Transferable Securities Admitted
to an Official Stock Exchange Listing or
Dealt in on Another Regulated Market 54,224,823 95.76 ___________ ______
Unquoted Securities
BONDS
United States
€100,000 US Bank NA / Cincinnati OH 4.375%
28/2/2017 93,707 0.17
US$100,000 Roche Holdings '144A' 5% 1/3/2014 75,571 0.13 ___________ ______
Total Unquoted Securities 169,278 0.30 ___________ ______
Total Portfolio 54,394,101 96.06
Other Net Assets 2,230,989 3.94 ___________ ______
Total Net Assets (€) 56,625,090 100.00 ___________ ______
Transferable Securities Admitted to an Official Stock Exchange
Listing or Dealt in on Another Regulated Market
Holding Description Value (€) %
Transferable Securities Admitted to an Official Stock Exchange
Listing or Dealt in on Another Regulated Market
Holding Description Value (€) %
Portfolio of Investments 31 August 2009

76 BlackRock Global Funds (BGF)
Euro Corporate Bond Fund continued
Unrealised profit/(loss)
€DescriptionNominal
Value
Unrealised profit/(loss)
€DescriptionNominal
Value
€905,000 Inflation Linked Swap (Goldman Sachs)
(Fund pays Fixed 1.9292%)
and receives floating FRCPXTOB + 0bps;
(30/7/2014) 5,633
€905,000 Inflation Linked Swap (Goldman Sachs)
(Fund pays floating FRCPXTOB + 0bps;
and receives Fixed 2.4%) (30/7/2019) 1,827
€250,000 Credit Default Swaps (Citibank)
(Fund receives default protection on
Wolters Kluwer 5.125% 27/1/2014;
and pays Fixed 0.45%) (20/6/2014) (277)
€200,000 Credit Default Swaps (Goldman Sachs)
(Fund receives default protection on
Valeo Sa 2.375% 1/1/2011;
and pays Fixed 1.95%) (20/3/2013) 2,343
€100,000 Credit Default Swaps (Deutsche Bank)
(Fund receives default protection on
Pearson Plc 7% 27/10/2014;
and pays Fixed 0.56%) (20/6/2013) (609)
€150,000 Credit Default Swaps (Morgan Stanley)
(Fund receives default protection on
Unilever NV 7.125% 1/11/2010;
and pays Fixed 0.33%) (20/3/2013) (627)
€100,000 Credit Default Swaps (Citibank)
(Fund receives default protection on
Morgan Stanley 6.6% 1/4/2012;
and pays Fixed 9.3%) (20/12/2013) (29,711)
€100,000 Credit Default Swaps (Credit Suisse)
(Fund receives default protection on
Man Group Plc 3.75% 12/11/2009;
and pays Fixed 1.98%) (20/12/2013) 161
US$21,000 Credit Default Swaps (Deutsche Bank)
(Fund receives default protection on
Abu Dhabi (Emirate of) 5.5% 2/8/2012;
and pays Fixed 1.4%) (20/10/2013) (102)
€100,000 Credit Default Swaps (Credit Suisse)
(Fund provides default protection on
Heidelberg Cement Finance BV 4.75% 9/4/2009;
and receives Fixed 6.62%) (20/12/2013) (2,853)
€100,000 Credit Default Swaps (Credit Suisse)
(Fund provides default protection on
SNS Bank NV 4.625% 18/2/2014;
and receives Fixed 3.5%) (20/12/2013) 4,198
€100,000 Credit Default Swaps (Credit Suisse)
(Fund provides default protection on
Imperial Tobacco Group Plc 6.25% 4/12/2018;
and receives Fixed 3.6%) (20/12/2013) 8,142
€100,000 Credit Default Swaps (Barclays)
(Fund receives default protection on
Svenska Cellulosa AB 4.5% 15/7/2015;
and pays Fixed 3.25%) (20/12/2013) (9,045)
€100,000 Credit Default Swaps (Barclays)
(Fund receives default protection on
Henkel AG & Co KGAA 4.25% 10/6/2013;
and pays Fixed 1.1%) (20/12/2013) (2,189)
€150,000 Credit Default Swaps (Deutsche Bank)
(Fund receives default protection on
Carrefour SA 4.375% 2/11/2016;
and pays Fixed 0.83%) (20/3/2014) (2,188)
€150,000 Credit Default Swaps (Deutsche Bank)
(Fund receives default protection on
Adecco S.A. 0% 26/8/2013;
and pays Fixed 1.78%) (20/3/2014) (3,256)
€50,000 Credit Default Swaps (Credit Suisse)
(Fund receives default protection on
Man Group Plc 3.75% 12/11/2009;
and pays Fixed 1.2%) (20/9/2013) 1,525
€100,000 Credit Default Swaps (Deutsche Bank)
(Fund receives default protection on
Deutsche Lufthansa AG 4.625% 6/5/2013;
and pays Fixed 1.77%) (20/9/2013) 443
€100,000 Credit Default Swaps (Citibank)
(Fund receives default protection on
Tomkins Plc 8% 20/12/2011;
and pays Fixed 2.9%) (20/9/2013) (5,361)
€2,000,000 Credit Default Swaps (Morgan Stanley)
(Fund provides default protection on
iTraxx Europe Sub Financials 11;
and receives Fixed 1.85%) (20/6/2014) 21,967
€1,000,000 Credit Default Swaps (Barclays)
(Fund provides default protection on
iTraxx Europe Sub Financials 11;
and receives Fixed 1.85%) (20/6/2014) 3,893
€150,000 Credit Default Swaps (Deutsche Bank)
(Fund receives default protection on
Volkswagen AG 5.375% 22/5/2018;
and pays Fixed 2.3%) (20/6/2014) (7,070)
£185,000 Interest Rate Swaps (Deutsche Bank)
(Fund receives Floating GBP Libor 6 Month;
and pays Fixed 4.6%) (8/3/2037) (18,570)
£1,100,000 Interest Rate Swaps (Barclays)
(Fund receives Fixed 4.6525%;
and pays Floating GBP Libor 6 Month) (8/8/2013) 10,730
£350,000 Interest Rate Swaps (Barclays)
(Fund receives Floating GBP Libor 6 Month;
and pays Fixed 4.8125%) (8/8/2018) (7,589)
HUF 14,000,000 Interest Rate Swaps (Deutsche Bank)
(Fund receives Floating HUF BUBOR 6 Month;
and pays Fixed 6.81%) (13/8/2020) 16
HUF 95,000,000 Interest Rate Swaps (JP Morgan)
(Fund receives Floating HUF BUBOR 6 Month;
and pays Fixed 6.82%) (13/8/2020) (124)
CHF 1,515,000 Interest Rate Swaps (Goldman Sachs)
(Fund receives Floating CHF Libor 3 Month;
and pays Fixed 0.945%) (19/8/2012) (981) __________
(29,674) __________
Swaps as at 31 August 2009
Note: The total market value of €69,795 of these transactions is included in the Statement of Net Assets (see Note 2c).

Audited Annual Report and Accounts 77
The notes on pages 236 to 244 form an integral part of these financial statements.
Euro Corporate Bond Fund continued
Open Futures Contracts as at 31 August 2009
16 Euro Bund September 2009 1,960,800
4 Euro BUXL 30 Year Bond September 2009 395,520
2 Euro BOBL September 2009 232,500
1 Euro Schatz September 2009 108,275
(3) US Treasury 10 Year Note December 2009 (245,443)
(4) US Treasury 5 Year Note December 2009 (322,010)
(20) 3 Month Euro EURIBOR June 2010 (4,927,500)
20 3 Month Euro EURIBOR June 2011 4,867,750 __________
Total commitment 2,069,892 __________
Note: The net unrealised gain of €55,703 attributed to these transactions is included
in the Statement of Net Assets (see Note 2c).
Value
€
Expiration
dateContracts/Description
Number
of Contracts
Open Forward Foreign Exchange Transactions as at 31 August 2009
Core Fund
€1,143,108 £975,022 3/9/2009 35,484
€1,354,013 US$1,950,000 3/9/2009 (10,656)
¥12,659,339 US$130,900 3/9/2009 3,671
KRW165,507,000 US$134,427 3/9/2009 (1,334)
NOK3,560,000 €407,599 3/9/2009 5,451
PLN2,604,187 HUF169,773,838 3/9/2009 12,430
US$116,336 ¥11,145,000 3/9/2009 (2,465)
US$130,939 KRW165,507,000 3/9/2009 (1,107)
US$845,085 ZAR6,610,000 10/9/2009 (1,014)
US$787,716 €550,000 11/9/2009 1,268
SEK4,110,000 CZK10,105,262 22/10/2009 6,320
US$1,937,000 HKD14,999,353 30/10/2009 670
KRW745,884,000 ¥56,463,588 30/11/2009 (7,578)
AUD335,000 NZD409,842 1/12/2009 564 __________
Net unrealised profit 41,704 __________
Note: The net unrealised profit attributed to these transactions is included in the Statement
of Net Assets (see Note 2c).
Value date
Unrealised
profit/(loss)
€SalesPurchases

78 BlackRock Global Funds (BGF)
Euro Reserve Fund(1)
(1) New Fund launched, see Note 1, for further details.
FUNDS
United Kingdom
19,868,543 Institutional Cash Series Institutional
Liquidity Fund 19,868,543 9.35 ___________ ______
Total Funds 19,868,543 9.35 ___________ ______
BONDS
Belgium
€10,000,000 Fortis Bank 0% 21/9/2009 9,997,892 4.70 ___________ ______
Netherlands
€10,000,000 Rabobank Nederland FRN 5/10/2009 10,002,850 4.70 ___________ ______
Spain
€2,250,000 Santander International Debt FRN
23/10/2009 2,253,915 1.06
€6,300,000 Santander International Debt FRN
3/6/2010 6,258,735 2.95 ___________ ______
8,512,650 4.01 ___________ ______
United Kingdom
€17,000,000 HSBC Bank FRN 3/5/2010 17,015,895 8.01
€8,500,000 Lloyds Bank 0% 3/11/2009 8,504,055 4.00
€20,000,000 Nationwide Building Society 0%
9/11/2009 20,007,202 9.41
€10,000,000 Royal Bank of Scotland FRN 8/9/2009 10,000,250 4.71 ___________ ______
55,527,402 26.13 ___________ ______
Total Bonds 84,040,794 39.54 ___________ ______
COMMERCIAL PAPER
Australia
€10,000,000 ING Bank Australia 0% 21/9/2009 9,984,351 4.70 ___________ ______
France
€10,000,000 LMA 0% 15/9/2009 9,998,665 4.70
€500,000 Societe Generale 0% 8/9/2009 499,970 0.24 ___________ ______
10,498,635 4.94 ___________ ______
Ireland
€10,000,000 Regency Assets 0% 15/9/2009 9,998,665 4.71
€10,000,000 Scaldis Capital Ireland 0% 17/9/2009 9,998,428 4.70 ___________ ______
19,997,093 9.41 ___________ ______
Jersey
€8,500,000 Amstel Euro Funding 0% 28/9/2009 8,497,381 4.00
€9,763,000 Rhein Main Securitisation 0% 21/9/2009 9,760,969 4.59 ___________ ______
18,258,350 8.59 ___________ ______
Spain
€6,000,000 Santander Commercial Paper SA
Unipersonal 0% 26/2/2010 5,968,827 2.81 ___________ ______
United Kingdom
€10,000,000 Aviva 0% 21/9/2009 9,997,919 4.70
€1,500,000 Lloyds TSB Bank 0% 3/11/2009 1,498,315 0.71 ___________ ______
11,496,234 5.41 ___________ ______
United States
€10,000,000 Alpine Securitization 0% 24/9/2009 9,997,508 4.70
€10,000,000 Erasmus Capital 0% 10/9/2009 9,999,207 4.70
€10,000,000 Mont Blanc Capital 0% 9/9/2009 9,999,306 4.71 ___________ ______
29,996,021 14.11 ___________ ______
Total Commercial Paper 106,199,511 49.97 ___________ ______
Total Portfolio 210,108,848 98.86
Other Net Assets 2,414,682 1.14 ___________ ______
Total Net Assets (€) 212,523,530 100.00 ___________ ______
Transferable Securities Admitted to an Official Stock Exchange
Listing or Dealt in on Another Regulated Market
Holding Description Value (€) %
Transferable Securities Admitted to an Official Stock Exchange
Listing or Dealt in on Another Regulated Market
Holding Description Value (€) %
Portfolio of Investments 31 August 2009

Audited Annual Report and Accounts 79
The notes on pages 236 to 244 form an integral part of these financial statements.
Euro Short Duration Bond Fund
FUNDS
United Kingdom
€29,027,027 Institutional Cash Series Institutional
Liquidity Fund 29,027,027 3.85 ___________ ______
Total Funds 29,027,027 3.85 ___________ ______
BONDS
Australia
€2,074,000 Australia & New Zealand Banking Group
4.625% 8/11/2010 2,139,404 0.28
US$540,000 Australia & New Zealand Banking Group
5.5% 24/5/2011 396,972 0.05
€1,500,000 BHP Billiton Finance 4.75% 4/4/2012 1,584,548 0.21
€600,000 BHP Billiton Finance 6.375% 4/4/2016 684,894 0.09
€550,000 Commonwealth Bank of Australia 5.875%
29/7/2011 587,298 0.08
€243,018 Reds EHP Trust '2008-1E A2E' FRN
14/4/2014 232,044 0.03
€200,000 St George Bank 6.5% 24/6/2013 219,997 0.03
€550,000 Telstra 6.375% 29/6/2011 589,476 0.08
€238,288 Torrens Trust '2006-1E A1' FRN
14/9/2037 225,394 0.03 ___________ ______
6,660,027 0.88 ___________ ______
Austria
€12,600,000 Austria Government Bond 3.8%
20/10/2013 13,238,568 1.76
€3,540,000 Austria Government Bond 5.25% 4/1/2011 3,738,417 0.50
€7,700,000 Austria Government Bond 5.5% 15/1/2010 7,843,604 1.04
€4,000,000 Hypo Alpe-Adria-Bank International FRN
24/5/2012 3,832,940 0.51
€1,325,000 Kommunalkredit Austria 2.375% 12/5/2011 1,339,277 0.18
€5,000,000 Oesterreichische Kontrollbank 3.625%
10/12/2013 5,155,075 0.68
£295,000 UniCredit Bank Austria 5.625% 12/7/2011 341,856 0.04 ___________ ______
35,489,737 4.71 ___________ ______
Bahrain
US$465,000 Golden Belt 1 Sukuk BSC FRN 15/5/2012 73,220 0.01 ___________ ______
Belgium
€500,000 Belgacom 4.125% 23/11/2011 519,585 0.07
€2,500,000 Belgium Government Bond '36' 5%
28/9/2011 2,674,549 0.35
€750,000 Elia System Operator 4.5% 22/4/2013 781,403 0.11 ___________ ______
3,975,537 0.53 ___________ ______
Canada
US$230,000 Nova Chemicals 6.5% 15/1/2012 156,937 0.02
€500,000 Royal Bank of Canada 3.875% 31/10/2011 516,760 0.07
€500,000 Royal Bank of Canada 4.5% 5/11/2012 524,948 0.07
€500,000 Xstrata Canada Financial 5.875%
27/5/2011 520,095 0.07 ___________ ______
1,718,740 0.23 ___________ ______
Cayman Islands
€900,000 Thames Water Utilities Cayman Finance
6.125% 4/2/2013 961,515 0.13 ___________ ______
Croatia
€715,000 Croatia Government International
Bond 6.5% 5/1/2015 722,328 0.10 ___________ ______
Denmark
€400,000 FIH Erhvervsbank FRN 3/11/2009 397,922 0.05 ___________ ______
Finland
€3,000,000 Finland Government Bond 3.125%
15/9/2014 3,064,379 0.41 ___________ ______
France
€3,000,000 AXA 4.5% 23/1/2015 3,120,795 0.41
€300,000 AXA 6% 18/6/2013 329,447 0.04
€2,200,000 Banques Populaires Covered Bond
4.25% 29/1/2013 2,305,435 0.31
€1,000,000 BNP Paribas 3.25% 27/3/2012 1,020,915 0.14
€500,000 BNP Paribas 5% 16/12/2013 539,448 0.07
US$3,000,000 BNP Paribas FRN 23/11/2015 2,076,778 0.28
€3,150,000 BNP Paribas Public Sector SCF 3.625%
16/6/2014 3,234,326 0.43
€150,000 Caisse Refinancement de l'Habitat
4.375% 11/10/2010 155,141 0.02
€2,135,000 Caisse Refinancement de l'Habitat
5% 25/10/2013 2,309,814 0.31
€1,852,000 Carrefour 4.375% 15/6/2011 1,931,988 0.26
€4,575,000 Compagnie de Financement Foncier
4% 25/10/2012 4,773,967 0.63
€4,150,000 Credit Agricole Covered Bonds 3.5%
21/7/2014 4,229,161 0.56
€3,025,000 Dexia Credit Local 2.625% 23/3/2011 3,073,022 0.41
€550,000 Dexia Municipal Agency 3.5%
21/9/2009 550,842 0.07
€1,200,000 EDF 5.125% 23/1/2015 1,295,298 0.17
€2,000,000 France Government Bond OAT 3.75%
25/4/2021 2,013,630 0.27
€6,000,000 France Government Bond OAT 5%
25/10/2011 6,435,060 0.85
€330,000 France Government Bond OAT 6.5%
25/4/2011 358,260 0.05
€200,000 France Telecom 3% 14/10/2010 202,873 0.03
US$2,565,000 France Telecom SA 4.375% 8/7/2014 1,874,281 0.25
€10,000,000 French Treasury Note BTAN 1.5%
12/9/2011 10,006,749 1.33
€14,900,000 French Treasury Note BTAN 3.75%
12/1/2012 15,615,573 2.07
€50,000 French Treasury Note BTAN 3.75%
12/1/2013 52,607 0.01
€1,650,000 GDF Suez 4.375% 16/1/2012 1,727,847 0.23
€300,000 GDF Suez 6.25% 24/1/2014 336,654 0.04
€500,000 HSBC France 4.875% 15/1/2014 530,128 0.07
€300,000 Reseau Ferre de France 5.25%
14/4/2010 308,039 0.04
€400,000 Sanofi-Aventis 3.5% 17/5/2013 413,370 0.05
€350,000 Schneider Electric 6.75% 16/7/2013 394,172 0.05
€3,000,000 Societe Financement de l'Economie
Francaise 3% 7/4/2014 3,032,805 0.40
€4,000,000 Societe Financement de l'Economie
Francaise 3.25% 16/1/2014 4,095,000 0.54
€1,850,000 Societe Generale 6.125% 20/8/2018 2,011,357 0.27
€1,000,000 Societe Generale Societe de Credit
Fonciere 4.75% 6/6/2013 1,069,360 0.14
€500,000 Thales 4.375% 22/7/2011 519,840 0.07
€156,000 Veolia Environnement 5.25%
24/4/2014 165,887 0.02 ___________ ______
82,109,869 10.89 ___________ ______
Transferable Securities Admitted to an Official Stock Exchange
Listing or Dealt in on Another Regulated Market
Holding Description Value (€) %
Transferable Securities Admitted to an Official Stock Exchange
Listing or Dealt in on Another Regulated Market
Holding Description Value (€) %
Portfolio of Investments 31 August 2009
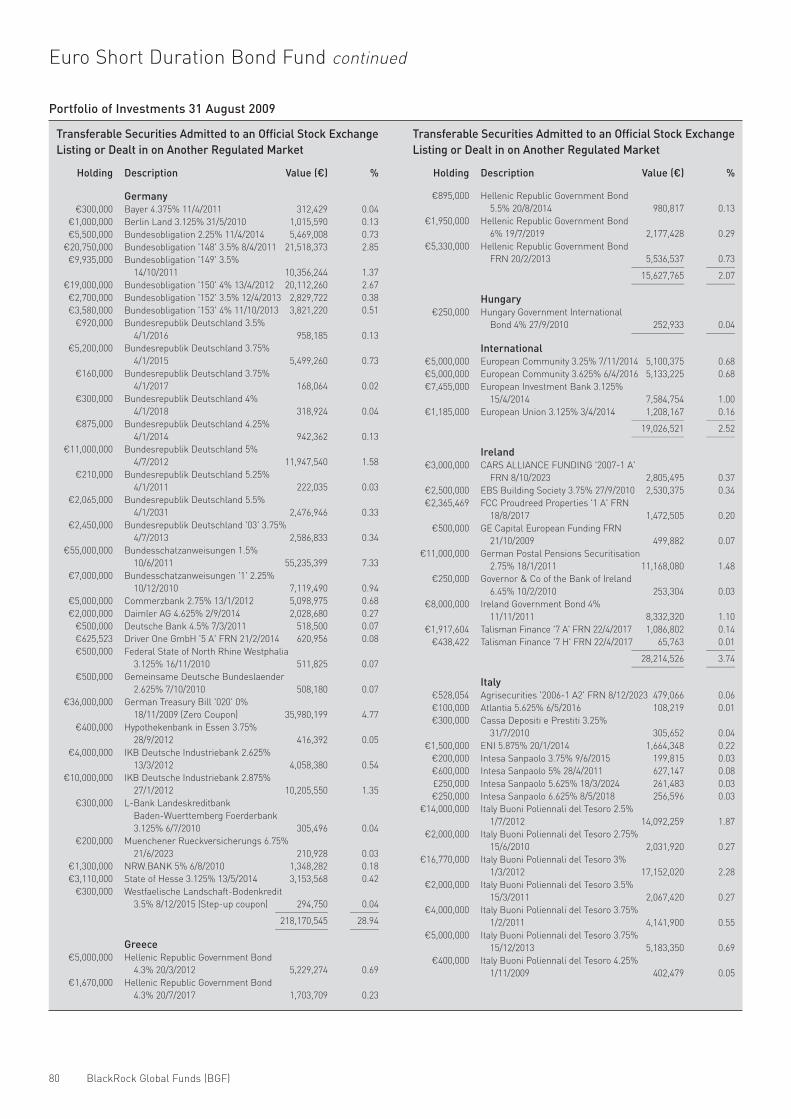
80 BlackRock Global Funds (BGF)
Euro Short Duration Bond Fund continued
Germany
€300,000 Bayer 4.375% 11/4/2011 312,429 0.04
€1,000,000 Berlin Land 3.125% 31/5/2010 1,015,590 0.13
€5,500,000 Bundesobligation 2.25% 11/4/2014 5,469,008 0.73
€20,750,000 Bundesobligation '148' 3.5% 8/4/2011 21,518,373 2.85
€9,935,000 Bundesobligation '149' 3.5%
14/10/2011 10,356,244 1.37
€19,000,000 Bundesobligation '150' 4% 13/4/2012 20,112,260 2.67
€2,700,000 Bundesobligation '152' 3.5% 12/4/2013 2,829,722 0.38
€3,580,000 Bundesobligation '153' 4% 11/10/2013 3,821,220 0.51
€920,000 Bundesrepublik Deutschland 3.5%
4/1/2016 958,185 0.13
€5,200,000 Bundesrepublik Deutschland 3.75%
4/1/2015 5,499,260 0.73
€160,000 Bundesrepublik Deutschland 3.75%
4/1/2017 168,064 0.02
€300,000 Bundesrepublik Deutschland 4%
4/1/2018 318,924 0.04
€875,000 Bundesrepublik Deutschland 4.25%
4/1/2014 942,362 0.13
€11,000,000 Bundesrepublik Deutschland 5%
4/7/2012 11,947,540 1.58
€210,000 Bundesrepublik Deutschland 5.25%
4/1/2011 222,035 0.03
€2,065,000 Bundesrepublik Deutschland 5.5%
4/1/2031 2,476,946 0.33
€2,450,000 Bundesrepublik Deutschland '03' 3.75%
4/7/2013 2,586,833 0.34
€55,000,000 Bundesschatzanweisungen 1.5%
10/6/2011 55,235,399 7.33
€7,000,000 Bundesschatzanweisungen '1' 2.25%
10/12/2010 7,119,490 0.94
€5,000,000 Commerzbank 2.75% 13/1/2012 5,098,975 0.68
€2,000,000 Daimler AG 4.625% 2/9/2014 2,028,680 0.27
€500,000 Deutsche Bank 4.5% 7/3/2011 518,500 0.07
€625,523 Driver One GmbH '5 A' FRN 21/2/2014 620,956 0.08
€500,000 Federal State of North Rhine Westphalia
3.125% 16/11/2010 511,825 0.07
€500,000 Gemeinsame Deutsche Bundeslaender
2.625% 7/10/2010 508,180 0.07
€36,000,000 German Treasury Bill '020' 0%
18/11/2009 (Zero Coupon) 35,980,199 4.77
€400,000 Hypothekenbank in Essen 3.75%
28/9/2012 416,392 0.05
€4,000,000 IKB Deutsche Industriebank 2.625%
13/3/2012 4,058,380 0.54
€10,000,000 IKB Deutsche Industriebank 2.875%
27/1/2012 10,205,550 1.35
€300,000 L-Bank Landeskreditbank
Baden-Wuerttemberg Foerderbank
3.125% 6/7/2010 305,496 0.04
€200,000 Muenchener Rueckversicherungs 6.75%
21/6/2023 210,928 0.03
€1,300,000 NRW.BANK 5% 6/8/2010 1,348,282 0.18
€3,110,000 State of Hesse 3.125% 13/5/2014 3,153,568 0.42
€300,000 Westfaelische Landschaft-Bodenkredit
3.5% 8/12/2015 (Step-up coupon) 294,750 0.04 ___________ ______
218,170,545 28.94 ___________ ______
Greece
€5,000,000 Hellenic Republic Government Bond
4.3% 20/3/2012 5,229,274 0.69
€1,670,000 Hellenic Republic Government Bond
4.3% 20/7/2017 1,703,709 0.23
€895,000 Hellenic Republic Government Bond
5.5% 20/8/2014 980,817 0.13
€1,950,000 Hellenic Republic Government Bond
6% 19/7/2019 2,177,428 0.29
€5,330,000 Hellenic Republic Government Bond
FRN 20/2/2013 5,536,537 0.73 ___________ ______
15,627,765 2.07 ___________ ______
Hungary
€250,000 Hungary Government International
Bond 4% 27/9/2010 252,933 0.04 ___________ ______
International
€5,000,000 European Community 3.25% 7/11/2014 5,100,375 0.68
€5,000,000 European Community 3.625% 6/4/2016 5,133,225 0.68
€7,455,000 European Investment Bank 3.125%
15/4/2014 7,584,754 1.00
€1,185,000 European Union 3.125% 3/4/2014 1,208,167 0.16 ___________ ______
19,026,521 2.52 ___________ ______
Ireland
€3,000,000 CARS ALLIANCE FUNDING '2007-1 A'
FRN 8/10/2023 2,805,495 0.37
€2,500,000 EBS Building Society 3.75% 27/9/2010 2,530,375 0.34
€2,365,469 FCC Proudreed Properties '1 A' FRN
18/8/2017 1,472,505 0.20
€500,000 GE Capital European Funding FRN
21/10/2009 499,882 0.07
€11,000,000 German Postal Pensions Securitisation
2.75% 18/1/2011 11,168,080 1.48
€250,000 Governor & Co of the Bank of Ireland
6.45% 10/2/2010 253,304 0.03
€8,000,000 Ireland Government Bond 4%
11/11/2011 8,332,320 1.10
€1,917,604 Talisman Finance '7 A' FRN 22/4/2017 1,086,802 0.14
€438,422 Talisman Finance '7 H' FRN 22/4/2017 65,763 0.01 ___________ ______
28,214,526 3.74 ___________ ______
Italy
€528,054 Agrisecurities '2006-1 A2' FRN 8/12/2023 479,066 0.06
€100,000 Atlantia 5.625% 6/5/2016 108,219 0.01
€300,000 Cassa Depositi e Prestiti 3.25%
31/7/2010 305,652 0.04
€1,500,000 ENI 5.875% 20/1/2014 1,664,348 0.22
€200,000 Intesa Sanpaolo 3.75% 9/6/2015 199,815 0.03
€600,000 Intesa Sanpaolo 5% 28/4/2011 627,147 0.08
£250,000 Intesa Sanpaolo 5.625% 18/3/2024 261,483 0.03
€250,000 Intesa Sanpaolo 6.625% 8/5/2018 256,596 0.03
€14,000,000 Italy Buoni Poliennali del Tesoro 2.5%
1/7/2012 14,092,259 1.87
€2,000,000 Italy Buoni Poliennali del Tesoro 2.75%
15/6/2010 2,031,920 0.27
€16,770,000 Italy Buoni Poliennali del Tesoro 3%
1/3/2012 17,152,020 2.28
€2,000,000 Italy Buoni Poliennali del Tesoro 3.5%
15/3/2011 2,067,420 0.27
€4,000,000 Italy Buoni Poliennali del Tesoro 3.75%
1/2/2011 4,141,900 0.55
€5,000,000 Italy Buoni Poliennali del Tesoro 3.75%
15/12/2013 5,183,350 0.69
€400,000 Italy Buoni Poliennali del Tesoro 4.25%
1/11/2009 402,479 0.05
Transferable Securities Admitted to an Official Stock Exchange
Listing or Dealt in on Another Regulated Market
Holding Description Value (€) %
Transferable Securities Admitted to an Official Stock Exchange
Listing or Dealt in on Another Regulated Market
Holding Description Value (€) %
Portfolio of Investments 31 August 2009

Audited Annual Report and Accounts 81
The notes on pages 236 to 244 form an integral part of these financial statements.
Euro Short Duration Bond Fund continued
€12,000,000 Italy Buoni Poliennali del Tesoro 4.25%
15/10/2012 12,659,040 1.68
€5,000,000 Italy Buoni Poliennali del Tesoro 4.5%
1/8/2010 5,168,825 0.69
€3,000,000 Italy Buoni Poliennali del Tesoro 4.75%
1/2/2013 3,216,870 0.43
€200,000 UniCredit 6.7% 5/6/2018 195,775 0.03 ___________ ______
70,214,184 9.31 ___________ ______
Japan
€500,000 Bank of Tokyo-Mitsubishi UFJ 3.5%
16/12/2015 498,455 0.07
€200,000 Shinsei Bank 3.75% 23/2/2016 151,500 0.02 ___________ ______
649,955 0.09 ___________ ______
Jersey
€200,000 BAA Funding 3.975% 15/2/2014 177,550 0.02
€1,400,000 HSBC Capital Funding/Jersey
Channel Islands 5.3687% 24/3/2014
(Perpetual) 1,093,169 0.15
€200,000 ProSecure Funding 4.668% 30/6/2016 124,667 0.02
€400,000 WPP Group 6.625% 12/5/2016 414,404 0.05 ___________ ______
1,809,790 0.24 ___________ ______
Luxembourg
€530,000 Clariant Finance Luxembourg 4.375%
5/4/2013 506,184 0.07
€145,000 Fiat Finance & Trade 9% 30/7/2012 153,272 0.02
€44,006 Volkswagen Car Lease '9 A' FRN
21/4/2012 43,387 0.00 ___________ ______
702,843 0.09 ___________ ______
Netherlands
€5,000,000 ABN Amro Bank 3.75% 15/7/2014 5,117,175 0.68
€3,300,000 Alliander Finance 4% 20/4/2012 3,400,172 0.45
€600,000 Allianz Finance II 4.375% 17/2/2017
(Perpetual) 471,855 0.06
€500,000 Daimler International Finance 5.875%
8/9/2011 526,438 0.07
€600,000 Daimler International Finance 6.875%
10/6/2011 640,794 0.09
€250,000 Deutsche Telekom International Finance
8.125% 29/5/2012 283,984 0.04
€993,000 E.ON International Finance 5.125%
7/5/2013 1,065,981 0.14
€250,000 EDP Finance 5.5% 18/2/2014 270,849 0.04
€1,000,000 ELM for Swiss Life Insurance & Pension
Group 5.849% 12/4/2017 (Perpetual) 585,000 0.08
€275,000 Enbw International Finance 6.125%
7/7/2039 297,502 0.04
€1,588,000 Fortis Bank Nederland Holding 3.375%
19/5/2014 1,621,769 0.21
€2,500,000 ING Bank 3.375% 3/3/2014 2,558,338 0.34
€1,500,000 ING Bank 5.5% 4/1/2012 1,548,788 0.21
€400,000 ING Bank 5.875% 23/2/2011 417,078 0.05
€100,000 ING Verzekeringen 3.5% 28/11/2012 100,949 0.01
€1,250,000 Koninklijke KPN 5% 13/11/2012 1,324,369 0.18
€1,720,000 LeasePlan 3.25% 22/5/2014 1,744,725 0.23
€1,000,000 Nederlandse Gasunie 6% 30/10/2013 1,116,250 0.15
€1,450,000 Nederlandse Waterschapsbank 4.25%
21/11/2013 1,528,046 0.20
€5,000,000 Nederlandse Waterschapsbank FRN
13/7/2011 5,002,770 0.66
€300,000 Netherlands Government Bond 2.5%
15/1/2012 305,702 0.04
€2,000,000 Netherlands Government Bond 5%
15/7/2012 2,168,830 0.29
€3,000,000 Netherlands Government Bond 5.5%
15/7/2010 3,125,249 0.41
€380,000 PACCAR Financial Europe 5.125%
19/5/2011 382,953 0.05
€370,000 RWE Finance 5% 10/2/2015 396,462 0.05
€500,000 RWE Finance 5.75% 20/11/2013 532,775 0.07
€370,000 RWE Finance 6.5% 10/8/2021 437,688 0.06
€875,000 Schlumberger Finance 4.5% 25/3/2014 916,851 0.12
€1,085,000 Shell International Finance 3.375%
9/2/2012 1,117,821 0.15
€2,050,000 Siemens Financieringsmaatschappij
4.125% 20/2/2013 2,100,123 0.28
€100,000 Siemens Financieringsmaatschappij
5.25% 12/12/2011 106,509 0.01
€300,000 Siemens Financieringsmaatschappij
5.75% 4/7/2011 319,578 0.04
US$600,000 Telefonica Europe 7.75% 15/9/2010 445,426 0.06
€700,000 Urenco Finance 5.375% 22/5/2015 720,580 0.10
€2,225,000 Volkswagen International Finance
3.75% 16/11/2010 2,266,530 0.30
€400,000 Wolters Kluwer 6.375% 10/4/2018 442,588 0.06 ___________ ______
45,408,497 6.02 ___________ ______
Norway
€2,000,000 DnB NOR Bank 5.875% 20/6/2013 2,182,700 0.29
€700,000 Statkraft AS 5.5% 2/4/2015 746,743 0.10
€2,000,000 StatoilHydro 4.375% 11/3/2015 2,100,250 0.28 ___________ ______
5,029,693 0.67 ___________ ______
Poland
€1,423,000 Poland Government International
Bond 5.875% 3/2/2014 1,526,801 0.20
€605,000 Republic of Poland 5.625% 20/6/2018 636,805 0.09 ___________ ______
2,163,606 0.29 ___________ ______
Portugal
€400,000 Banco Comercial Portugues 4.875%
9/5/2010 409,304 0.05
€300,000 Banco Santander Totta 3.75%
12/6/2012 305,396 0.04 ___________ ______
714,700 0.09 ___________ ______
Slovakia
€2,800,000 Slovak Republic 4.375% 21/1/2015 2,863,755 0.38 ___________ ______
Slovenia
€3,400,000 Nova Ljubljanska Banka DD Ljubljana
3.25% 23/7/2012 3,415,878 0.45 ___________ ______
Spain
€300,000 Banco Bilbao Vizcaya Argentaria 2.75%
7/6/2010 303,217 0.04
€500,000 Banco Bilbao Vizcaya Argentaria 3.5%
15/3/2011 512,615 0.07
€500,000 Banco Bilbao Vizcaya Argentaria 4.5%
12/11/2015 495,585 0.07
€6,100,000 Bancontander 3.875% 27/5/2014 6,280,103 0.83
€900,000 BBVA International Preferred 3.798%
22/9/2015 (Perpetual) 639,747 0.08
Transferable Securities Admitted to an Official Stock Exchange
Listing or Dealt in on Another Regulated Market
Holding Description Value (€) %
Transferable Securities Admitted to an Official Stock Exchange
Listing or Dealt in on Another Regulated Market
Holding Description Value (€) %
Portfolio of Investments 31 August 2009

82 BlackRock Global Funds (BGF)
Euro Short Duration Bond Fund continued
Portfolio of Investments 31 August 2009
€2,900,000 BBVA Senior Finance SAU 3.625%
14/5/2012 2,963,162 0.39
€3,800,000 Caja de Ahorros de Valencia Castellon y
Alicante 3% 11/5/2012 3,856,354 0.51
€300,000 La Caja de Ahorros y Pensiones de
Barcelona 5.25% 5/4/2011 315,419 0.04
€1,000,000 Santander International Debt 3.375%
21/4/2011 1,019,285 0.13
€1,500,000 Santander International Debt 5.125%
11/4/2011 1,567,530 0.21
€1,000,000 Santander Issuances S.A Unipersonal
5.435% 24/10/2017 1,024,975 0.14
€500,000 Santander Issuances S.A Unipersonal
FRN 23/3/2017 443,135 0.06
€5,000,000 Spain Government Bond 5.35%
31/10/2011 5,395,349 0.72
€5,750,000 Spain Government Bond 5.4%
30/7/2011 6,173,199 0.82 ___________ ______
30,989,675 4.11 ___________ ______
Sweden
€2,065,000 Svensk Exportkredit AB 3.625%
27/5/2014 2,102,067 0.28
€7,000,000 Svenska Handelsbanken AB 3%
20/8/2012 7,022,540 0.93
€400,000 Svenska Handelsbanken AB 4.875%
25/3/2014 423,890 0.05
€350,000 Vattenfall Treasury 5.75% 5/12/2013 384,288 0.05
€300,000 Vattenfall Treasury 6.75% 31/1/2019 353,330 0.05 ___________ ______
10,286,115 1.36 ___________ ______
Switzerland
€5,000,000 Credit Suisse 5.125% 30/3/2012 5,273,175 0.70 ___________ ______
United Kingdom
€450,000 Anglian Water Services Financing
4.625% 7/10/2013 465,716 0.06
€531,675 Arran Residential Mortgages Funding
'2006-1X A2C' FRN 12/4/2056 485,868 0.06
€1,500,000 Aviva 5.7% 29/9/2015 (Perpetual) 1,136,250 0.15
€580,000 Bank of Scotland 5.5% 29/10/2012 577,422 0.08
€750,000 Barclays Bank 5.75% 8/3/2011 778,166 0.10
€100,000 BP Capital Markets 4.25% 10/1/2011 103,815 0.01
€3,950,000 Chester Asset Receivables Dealings
No 11 6.125% 15/10/2010 3,904,812 0.52
€500,000 Diago Finance 6.625% 5/12/2014 568,528 0.08
€1,313,680 EMF-UK FRN 13/3/2026 684,657 0.09
€7,385,000 Eurosail FRN 13/3/2045 2,530,627 0.34
€492,254 Gracechurch Mortgage Financing
'2007-1X 2A2' FRN 20/11/2056 488,188 0.06
€1,150,000 HSBC Bank FRN 29/3/2016 1,096,783 0.15
US$3,000,000 HSBC Holdings FRN 6/10/2016 1,962,185 0.26
€200,000 Imperial Tobacco Finance 7.25%
15/9/2014 222,605 0.03
€455,000 ITV 6% 3/10/2011 446,644 0.06
€4,500,000 Lloyds TSB Bank 3.75% 17/11/2011 4,677,210 0.62
€1,000,000 Lloyds TSB Bank 4.375% 19/4/2011 1,023,135 0.14
€150,000 Lloyds TSB Bank 6.25% 15/4/2014 161,427 0.02
€1,100,000 Mound Financing '4X 3A' FRN
8/11/2032 1,052,948 0.14
€750,000 National Grid Electricity Transmission
6.625% 28/1/2014 840,694 0.11
€450,000 National Westminster Bank 6%
21/1/2010 447,077 0.06
US$1,437,291 Paragon Mortgages FRN 15/5/2043 366,430 0.05
€1,750,000 Paragon Mortgages FRN 15/4/2044 560,000 0.07
€2,000,000 Paragon Mortgages '12X B1B' FRN
15/11/2038 471,468 0.06
€2,000,000 Paragon Mortgages '14X BB' FRN
15/9/2039 274,327 0.04
€400,000 Permanent Financing '8 4A' FRN
10/9/2032 385,302 0.05
US$2,000,000 Permanent Master Issuer '2006-1 2A'
FRN 15/10/2015 1,395,188 0.19
€160,000 Prudential 5.75% 19/12/2021 149,390 0.02
€1,000,000 Royal Bank of Scotland 3.75%
14/11/2011 1,039,210 0.14
€3,500,000 Standard Chartered 4.875% 11/3/2011 3,628,835 0.48
€460,000 Tesco 5.625% 12/9/2012 495,098 0.07
£1,600,000 United Kingdom Gilt 4.75% 7/12/2038 2,015,900 0.27
£1,220,000 United Kingdom Gilt Inflation Linked
2.5% 26/7/2016 3,949,179 0.52
€225,000 Vodafone Group 6.875% 4/12/2013 257,459 0.03
US$520,000 Vodafone Group 7.75% 15/2/2010 375,492 0.05 ___________ ______
39,018,035 5.18 ___________ ______
United States
€1,300,000 American Honda Finance 3.75%
16/3/2011 1,327,599 0.18
€500,000 American International Group 4%
20/9/2011 452,500 0.06
€100,000 American International Group 4.875%
15/3/2067 39,996 0.01
€300,000 BA Covered Bond Issuer 4.125%
5/4/2012 303,005 0.04
€160,000 Banca Popolare di Bergamo Capital
Trust 8.364% 15/2/2011 (Perpetual) 149,600 0.02
€155,000 Banca Popolare di Lodi Investors Trust III
6.742% 30/6/2015 (Perpetual) 113,538 0.01
US$2,600,000 Bank of New York Mellon 4.3%
15/5/2014 1,915,589 0.25
US$315,000 Belo 6.75% 30/5/2013 192,891 0.03
€100,000 Cargill 6.25% 24/7/2015 109,042 0.01
US$1,950,000 Cellco Partnership / Verizon Wireless
Capital '144A' 3.75% 20/5/2011 1,409,897 0.19
€1,000,000 Citibank Credit Card Issuance Trust
'2004-A2 A' FRN 24/5/2013 937,377 0.12
US$304,466 Citicorp Mortgage Securities '2006-5 1A2'
6% 25/10/2036 199,522 0.03
€1,200,000 CL Capital Trust I 7.047% 26/4/2012
(Perpetual) 1,019,400 0.14
US$1,000,000 Commercial Mortgage Pass Through
Certificates '2003-LB1A A2' 4.084%
10/6/2038 688,639 0.09
US$700,000 Countrywide Alternative Loan Trust
'2005-54CB 2A4' 5.5% 25/11/2035 351,421 0.05
US$600,000 Countrywide Alternative Loan Trust
'2005-54CB 3A4' 5.5% 25/11/2035 303,084 0.04
US$298,560 Countrywide Home Loan Mortgage
Pass Through Trust '2007-10 A22'
6% 25/7/2037 158,795 0.02
€250,000 Daimler North America 4.375%
16/3/2010 253,014 0.03
US$28,880 Deutsche ALT-A Securities Inc Alternate
Loan Trust '2007-BAR1 A1' FRN
25/3/2037 20,001 0.00
US$625,000 Enterprise Products Operating 4.6%
1/8/2012 453,390 0.06
US$129,492 First Union National Bank Commercial
Mortgage '1999-C4 A2' 7.39%
15/12/2031 90,590 0.01
Transferable Securities Admitted to an Official Stock Exchange
Listing or Dealt in on Another Regulated Market
Holding Description Value (€) %
Transferable Securities Admitted to an Official Stock Exchange
Listing or Dealt in on Another Regulated Market
Holding Description Value (€) %

Audited Annual Report and Accounts 83
The notes on pages 236 to 244 form an integral part of these financial statements.
Euro Short Duration Bond Fund continued
Portfolio of Investments 31 August 2009
US$1,650,000 Ge Capital Commercial Mortgage
'2007-C1 A2' 5.417% 10/12/2049 1,121,318 0.15
€4,479,000 Goldman Sachs Group 3.5% 8/12/2011 4,638,228 0.62
€100,000 Goldman Sachs Group 5.375% 15/2/2013 104,789 0.01
€500,000 Goldman Sachs Group FRN 11/5/2011 494,255 0.07
US$1,650,000 GS Mortgage Securities Corp II
'2007-GG10 A2' 5.778% 10/8/2045 1,150,321 0.15
US$402,202 GSAA Trust '2007-5 1AV1' FRN 25/3/2047 188,973 0.03
US$697,486 GSR Mortgage Loan Trust '2007-4F 3A1'
6% 25/7/2037 401,339 0.05
US$1,000,000 Hewlett-Packard 2.25% 27/5/2011 712,576 0.09
€200,000 Hypo Real Estate International Trust I
5.864% 14/6/2017 (Perpetual) 29,000 0.00
US$400,000 Indymac IMJA Mortgage Loan Trust
'2007-A1 A4' 6% 25/8/2037 108,556 0.01
US$600,000 International Business Machines 6.5%
15/10/2013 478,441 0.06
€1,400,000 IntesaBci Capital Trust 6.988% 12/7/2011
(Perpetual) 1,243,200 0.16
US$254,443 JP Morgan Mortgage Trust
'2006-S3 1A12' 6.5% 25/8/2036 132,290 0.02
US$288,310 JP Morgan Mortgage Trust '2007-S1 2A22'
5.75% 25/3/2037 159,866 0.02
US$396,390 JP Morgan Mortgage Trust '2007-S2 1A15'
6.75% 25/6/2037 223,980 0.03
€6,500,000 JPMorgan Chase & Co 3.625%
12/12/2011 6,748,918 0.90
€1,050,000 JPMorgan Chase & Co 4.625%
31/1/2011 1,085,270 0.14
€1,050,000 JPMorgan Chase & Co 5.25% 8/5/2013 1,116,938 0.15
€1,000,000 Merrill Lynch & FRN 8/2/2010 996,038 0.13
€3,150,000 Morgan Stanley 6.5% 15/4/2011 3,302,429 0.44
€300,000 Morgan Stanley FRN 20/7/2012 283,431 0.04
€300,000 New York Life Global Funding 3.75%
19/10/2009 300,548 0.04
€950,000 Pfizer 3.625% 3/6/2013 977,659 0.13
€250,000 Philip Morris International 5.875%
4/9/2015 277,120 0.04
€4,000,000 Roche Holdings 4.625% 4/3/2013 4,237,860 0.56
€500,000 SLM Student Loan Trust '2003-10'
4.05% 17/9/2010 495,790 0.07
US$295,000 SLM Student Loan Trust '2008-5 A2'
FRN 25/10/2016 208,453 0.03
US$295,000 SLM Student Loan Trust '2008-5 A3'
FRN 25/1/2018 209,287 0.03
US$1,000,000 TIAA Seasoned Commercial Mortgage
Trust '2007-C4 A3' 6.089% 15/8/2039 723,330 0.10
US$450,000 Time Warner Cable 8.25% 14/2/2014 368,141 0.05
€1,000,000 Toyota Motor Credit 5.25% 3/2/2012 1,063,340 0.14
US$1,325,000 US Treasury Bond 2.625% 31/7/2014 935,679 0.12
€1,000,000 Verizon Wireless Capital 7.625%
19/12/2011 1,111,715 0.15
€1,200,000 VW Credit 5.125% 19/5/2011 1,248,180 0.17
US$266,224 Wells Fargo Mortgage Backed
Securities Trust '2007-10 1A21'
6% 25/7/2037 162,421 0.02
€100,000 WM Covered Bond Program 4%
27/9/2016 93,437 0.01
€500,000 Zurich Finance USA 4.875% 14/4/2012 525,050 0.07 ___________ ______
48,147,056 6.39 ___________ ______
Total Bonds 683,152,521 90.62 ___________ ______
Total Transferable Securities Admitted
to an Official Stock Exchange Listing or
Dealt in on Another Regulated Market 712,179,548 94.47 ___________ ______
Unquoted Securities
BONDS
Iceland
US$2,500,000 Glitnir Banki HF '144A' 6.375%
25/9/2012 354,289 0.05 ___________ ______
United Kingdom
US$14,000,000 Eurosail '2007-3A A2B' FRN
13/6/2045 2,302,443 0.30
£3,750,000 Eurosail '2007-3A A3C' FRN
13/6/2045 724,200 0.10 ___________ ______
3,026,643 0.40 ___________ ______
Total Unquoted Securities 3,380,932 0.45 ___________ ______
Total Portfolio 715,560,480 94.92
Other Net Assets 38,292,782 5.08 ___________ ______
Total Net Assets (€) 753,853,262 100.00 ___________ ______
Transferable Securities Admitted to an Official Stock Exchange
Listing or Dealt in on Another Regulated Market
Holding Description Value (€) %
Transferable Securities Admitted to an Official Stock Exchange
Listing or Dealt in on Another Regulated Market
Holding Description Value (€) %

84 BlackRock Global Funds (BGF)
Euro Short Duration Bond Fund continued
Unrealised profit/(loss)
€DescriptionNominal
Value
Unrealised profit/(loss)
€DescriptionNominal
Value
£750,000 Inflation Linked Swap (Barclays)
(Fund pays floating UKRPI + 0bps;
and receives Fixed rate 3.055%) (11/10/2036) (106,069)
£1,220,000 Inflation Linked Swap (Goldman Sachs)
(Fund pays UKRPI + 0bps) (26/7/2016)
and receives floating GBP Libor 6 Month + 65bps; 22,357
€22,650,000 Inflation Linked Swap (Goldman Sachs)
(Fund pays Fixed 1.9292%)
and receives floating FRCPXTOB + 0bps;
(30/7/2014) 140,987
€22,650,000 Inflation Linked Swap (Goldman Sachs)
(Fund pays floating FRCPXTOB + 0bps;
and receives Fixed 2.4%) (30/7/2019) 45,726
€500,000 Credit Default Swaps (Barclays)
(Fund receives default protection on
StMicroelectronics NV 0% 5/7/2013;
and pays Fixed 0.235%) (20/12/2012) 4,884
€850,000 Credit Default Swaps (Barclays)
(Fund receives default protection on
Wolters Kluwer 5.125% 27/1/2014;
and pays Fixed 0.92%) (20/6/2013) (16,527)
€400,000 Credit Default Swaps (Deutsche Bank)
(Fund receives default protection on
Pearson Plc 7% 27/10/2014;
and pays Fixed 0.56%) (20/6/2013) (2,438)
€530,000 Credit Default Swaps (Union Bank of Switzerland)
(Fund receives default protection on
Clariant AG 4.375% 5/4/2013;
and pays Fixed 2.45%) (20/6/2013) 3,383
€400,000 Credit Default Swaps (Morgan Stanley)
(Fund receives default protection on
Unilever NV 7.125% 1/11/2010;
and pays Fixed 0.33%) (20/3/2013) (1,671)
€500,000 Credit Default Swaps (Deutsche Bank)
(Fund receives default protection on
Goldman Sachs Group Inc 6.6% 15/1/2012;
and pays Fixed 5%) (20/12/2013) (72,977)
€550,000 Credit Default Swaps (Credit Suisse)
(Fund receives default protection on
Man Group Plc 3.75% 12/11/2009;
and pays Fixed 1.98%) (20/12/2013) 885
€150,000 Credit Default Swaps (Credit Suisse)
(Fund provides default protection on
Heidelberg Cement Finance BV 4.75% 9/4/2009;
and receives Fixed 6.62%) (20/12/2013) (4,279)
€200,000 Credit Default Swaps (Credit Suisse)
(Fund receives default protection on
Portugal Telecom International Finance BV 3.75%
26/3/2012; and pays Fixed 1.65%) (20/12/2013) (8,071)
€400,000 Credit Default Swaps (Deutsche Bank)
(Fund receives default protection on
Portugal Telecom International Finance BV 3.75%
26/3/2012; and pays Fixed 1.6%) (20/12/2013) (15,326)
€650,000 Credit Default Swaps (Barclays)
(Fund receives default protection on
Henkel AG & Co KGAA 4.25% 10/6/2013;
and pays Fixed 1.1%) (20/12/2013) (14,228)
€1,350,000 Credit Default Swaps (Deutsche Bank)
(Fund receives default protection on
Carrefour SA 4.375% 2/11/2016;
and pays Fixed 0.83%) (20/3/2014) (19,690)
€450,000 Credit Default Swaps (Deutsche Bank)
(Fund receives default protection on
Deutsche Lufthansa AG 4.625% 6/5/2013;
and pays Fixed 1.77%) (20/9/2013) 1,995
€450,000 Credit Default Swaps (Citibank)
(Fund receives default protection on
Tomkins Plc 8% 20/12/2011;
and pays Fixed 2.9%) (20/9/2013) (24,126)
US$130,000 Credit Default Swaps (JP Morgan)
(Fund receives default protection on
Nova Chemicals Corp 15/11/2013;
and pays Fixed 5%) (20/06/2012) (2,052)
US$100,000 Credit Default Swaps (Citibank)
(Fund receives default protection on
Nova Chemicals Corp 15/11/2013;
and pays Fixed 5%) (20/03/2012) (2,216)
US$315,000 Credit Default Swaps (Barclays)
(Fund receives default protection on
Belo Corp. 7.75% 01/6/2027;
and pays Fixed 5%) (20/6/2013) (16,642)
€1,700,000 Credit Default Swaps (Citibank)
(Fund receives default protection on
Valeo SA 3.75% 24/06/2013;
and pays Fixed 2.2%) (20/6/2014) 17,460
US$950,000 Credit Default Swaps (Goldman Sachs)
(Fund receives default protection on
Croatia (Republic of) 5% 15/4/2014;
and pays Fixed 2.2%) (20/6/2014) 3,462
€6,000,000 Interest Rate Swaps (Deutsche Bank)
(Fund receives Fixed 4.625%;
and pays Floating EUR Euribor 6 Month)
(14/12/2009) 52,722
NZD 15,700,000 Interest Rate Swaps (Royal Bank of Scotland)
(Fund receives Fixed 6.885%;
and pays Floating NZD BBR FRA 3 Month)
(3/7/2019) 25,392
£13,150,000 Interest Rate Swaps (Barclays)
(Fund receives Fixed 4.6525%;
and pays Floating GBP Libor 6 Month)
(8/8/2013) 128,276
£4,200,000 Interest Rate Swaps (Barclays)
(Fund receives Floating GBP Libor 6 Month;
and pays Fixed 4.8125%) (8/8/2018) (91,068)
HUF 187,000,000 Interest Rate Swaps (Deutsche Bank)
(Fund receives Floating HUF BUBOR 6 Month;
and pays Fixed 6.81%) (13/8/2020) 207
HUF 1,244,000,000 Interest Rate Swaps (JP Morgan)
(Fund receives Floating HUF BUBOR 6 Month;
and pays Fixed 6.82%) (13/8/2020) (1,626)
CHF 19,855,000 Interest Rate Swaps (Goldman Sachs)
(Fund receives Floating CHF Libor 3 Month;
and pays Fixed 0.945%) (19/8/2012) (12,861)
AUD 11,005,000 Interest Rate Swaps (Deutsche Bank)
(Fund receives Fixed 4.22%;
and pays Floating AUD BBSW 3 Month)
(11/5/2011) (67,322)
AUD 22,015,000 Interest Rate Swaps (Deutsche Bank)
(Fund receives Fixed 4.2175%;
and pays Floating AUD BBSW 3 Month)
(11/05/2011) (134,984)
AUD 22,020,000 Interest Rate Swaps (Deutsche Bank)
(Fund receives Fixed 4.24%;
and pays Floating AUD BBSW 3 Month)
(10/5/2011) (131,934)
NZD 53,000,000 Interest Rate Swaps (ANZ)
(Fund receives Fixed 4.4%;
and pays Floating NZD BBR FRA 3 Month)
(2/6/2011) (64,313) __________
(362,684) __________
Swaps as at 31 August 2009
Note: The total market value of (€286,741) of these transactions is included in the Statement of Net Assets (see Note 2c).

Audited Annual Report and Accounts 85
The notes on pages 236 to 244 form an integral part of these financial statements.
Euro Short Duration Bond Fund continued
Open Forward Foreign Exchange Transactions as at 31 August 2009
Core Fund
US$ 1,604,446 KRW 2,028,020,000 3/9/2009 (13,567)
KRW 2,028,020,000 US$ 1,647,190 3/9/2009 (16,346)
US$ 1,457,724 ¥139,650,000 3/9/2009 (30,891)
¥155,161,524 US$ 1,604,400 3/9/2009 44,988
US$ 11,188,744 ZAR 87,515,000 10/9/2009 (13,431)
US$ 9,875,088 €6,895,000 11/9/2009 15,901
€1,413,853 ¥186,770,000 17/9/2009 8,019
PLN 3,690,000 €891,641 17/9/2009 8,185
€25,676,682 £ 22,010,000 17/9/2009 674,093
€847,072 PLN 3,500,100 17/9/2009 (6,446)
€28,059,815 €39,000,000 17/9/2009 766,339
PLN 32,309,505 HUF 2,110,339,370 17/9/2009 151,655
NOK 45,865,000 €5,122,754 17/9/2009 196,627
¥145,609,000 €1,093,161 17/9/2009 2,851
US$ 4,515,000 €3,193,995 17/9/2009 (34,251)
SEK 55,374,000 CZK 136,472,848 22/10/2009 72,405
US$ 24,420,000 HKD 189,098,712 30/10/2009 8,445
KRW 9,960,573,000 ¥ 754,017,638 30/11/2009 (101,202)
AUD 4,470,000 NZD 5,468,643 1/12/2009 7,517 __________
Net unrealised profit 1,740,891 __________
Note: The net unrealised profit attributed to these transactions is included in the Statement
of Net Assets (see Note 2c).
Value date
Unrealised
profit/(loss)
€SalesPurchases
Open Futures Contracts as at 31 August 2009
307 Euro Schatz September 2009 33,240,425
45 Euro Bund September 2009 5,514,750
(680) Euro BOBL September 2009 (79,050,000)
(264) 3 Month Euro EURIBOR June 2010 (65,043,000)
264 3 Month Euro EURIBOR June 2011 64,254,300 __________
Total commitment (41,083,525)__________
Note: The net unrealised loss of €698,122 attributed to these transactions is included
in the Statement of Net Assets (see Note 2c).
Value
€
Expiration
dateContracts/Description
Number
of Contracts

86 BlackRock Global Funds (BGF)
(*) Securities lent, see Note 11, for further details.
Euro-Markets Fund
Portfolio of Investments 31 August 2009
COMMON & PREFERRED STOCKS (SHARES)
Austria
225,269 Erste Group Bank 6,665,710 0.40 ___________ ______
Belgium
1,685,610 InBev 50,045,761 3.03
1,332,886 KBC Groep 35,188,190 2.13 ___________ ______
85,233,951 5.16 ___________ ______
Cyprus
1,471,970 Bank of Cyprus Public 6,977,138 0.42 ___________ ______
Finland
905,503 Kone OYJ 'B'* 21,840,732 1.32
4,789,799 Nokia OYJ 46,029,968 2.79
1,724,407 Nokian Renkaat 27,055,946 1.64 ___________ ______
94,926,646 5.75 ___________ ______
France
889,272 BNP Paribas 50,439,508 3.06
1,221,186 Bouygues 42,332,413 2.57
873,690 EDF* 31,784,842 1.93
1,318,802 Eutelsat Communications 24,595,657 1.49
759,963 Lafarge* 45,058,206 2.73
875,258 PEUGEOT 17,719,598 1.07
539,941 PPR 43,789,215 2.65
1,326,525 Publicis Groupe 34,244,243 2.08
664,060 Renault* 20,851,484 1.26
1,040,489 Total 41,479,094 2.51
3,109,495 Vivendi 62,283,185 3.77 ___________ ______
414,577,445 25.12 ___________ ______
Germany
548,668 Allianz SE* 44,189,721 2.68
1,256,480 Bayer* 53,802,474 3.26
677,039 Beiersdorf* 24,136,440 1.46
407,871 Deutsche Bank* 19,320,849 1.17
640,673 Deutsche Boerse 33,712,213 2.04
1,816,659 Deutsche Lufthansa 20,346,581 1.23
2,613,758 E.ON* 77,288,824 4.68
2,641,877 GEA Group* 32,838,531 1.99
709,797 Henkel AG & Co (Pref) 19,491,026 1.18
800,026 Lanxess 16,792,546 1.02
772,116 MAN* 41,130,619 2.49
1,522,796 Rhoen Klinikum 23,816,529 1.45
639,550 SAP* 21,802,260 1.32
2,413,719 Sky Deutschland 8,085,959 0.49 ___________ ______
436,754,572 26.46 ___________ ______
Greece
2,537,852 EFG Eurobank Ergasias 24,820,193 1.50 ___________ ______
Ireland
2,563,970 Irish Life & Permanent 11,742,983 0.71 ___________ ______
Italy
10,971,517 Enel 44,791,218 2.71
2,608,266 ENI* 42,827,728 2.60
29,791,919 UniCredit 75,373,555 4.57 ___________ ______
162,992,501 9.88 ___________ ______
Luxembourg
1,373,944 ArcelorMittal* 34,403,558 2.09 ___________ ______
Netherlands
1,222,502 Heineken* 36,045,471 2.18
4,508,117 ING Groep – CVA 47,538,094 2.88
511,983 Koninklijke Vopak 22,885,640 1.39
6,523,231 Reed Elsevier 48,324,095 2.93
749,498 Unilever – CVA 14,540,261 0.88 ___________ ______
169,333,561 10.26 ___________ ______
Portugal
2,183,321 Galp Energia SGPS 22,182,541 1.35 ___________ ______
Spain
6,030,232 Banco Bilbao Vizcaya Argentaria 74,774,877 4.53
2,326,936 Grifols 28,586,409 1.73
4,001,219 Telefonica 70,721,546 4.29 ___________ ______
174,082,832 10.55 ___________ ______
Switzerland
169,098 Nobel Biocare Holding 3,565,781 0.22 ___________ ______
Total Portfolio 1,648,259,412 99.87
Other Net Assets 2,174,149 0.13 ___________ ______
Total Net Assets (€) 1,650,433,561 100.00 ___________ ______
Transferable Securities Admitted to an Official Stock Exchange
Listing or Dealt in on Another Regulated Market
Holding Description Value (€) %
Transferable Securities Admitted to an Official Stock Exchange
Listing or Dealt in on Another Regulated Market
Holding Description Value (€) %
Sector Breakdown as at 31 August 2009
Finance 26.09
Consumer discretionary 17.38
Industrials 10.99
Utilities 9.32
Consumer staples 8.73
Healthcare 6.66
Energy 6.46
Materials 5.84
Telecommunication services 4.29
Information technology 4.11
Other net assets 0.13 __________
100.00 __________
% of net
assets

Audited Annual Report and Accounts 87
The notes on pages 236 to 244 form an integral part of these financial statements.
(*) Securities lent, see Note 11, for further details.
European Fund
Portfolio of Investments 31 August 2009
COMMON & PREFERRED STOCKS (SHARES)
Austria
287,339 Erste Group Bank 8,502,361 0.51 ___________ ______
Belgium
1,218,877 KBC Groep 32,178,353 1.93 ___________ ______
Denmark
722,821 Danske Bank 13,449,598 0.80
573,053 Novo Nordisk 'B' 24,520,706 1.47 ___________ ______
37,970,304 2.27 ___________ ______
Finland
2,113,767 Nokia OYJ 20,313,301 1.22
1,546,773 Nokian Renkaat 24,268,868 1.45 ___________ ______
44,582,169 2.67 ___________ ______
France
422,886 BNP Paribas* 23,986,094 1.43
481,996 Bouygues 16,708,391 1.00
370,632 Compagnie Generale des Etablissements
Michelin 'B' 19,517,481 1.17
239,508 Euler Hermes 11,138,320 0.67
896,198 Eutelsat Communications 16,714,093 1.00
1,389,778 France Telecom* 24,772,793 1.48
721,495 Lafarge 42,777,439 2.56
239,035 PPR 19,385,739 1.16
297,682 Schneider Electric* 19,081,416 1.14
1,233,613 Total 49,177,982 2.94
625,845 Vinci 23,478,575 1.40 ___________ ______
266,738,323 15.95 ___________ ______
Germany
389,615 Adidas 12,826,126 0.77
368,659 Allianz SE 29,691,796 1.78
746,832 Bayer 31,979,346 1.91
783,875 Daimler* 24,645,030 1.47
1,721,872 E.ON 50,915,755 3.04
856,386 Henkel AG & Co (Pref) 23,516,360 1.41
569,773 MAN* 30,351,808 1.81
593,252 SAP 20,223,961 1.21 ___________ ______
224,150,182 13.40 ___________ ______
Ireland
1,561,510 CRH 27,248,350 1.63 ___________ ______
Italy
985,785 Saipem* 18,335,601 1.10
16,226,556 UniCredit 41,053,187 2.45 ___________ ______
59,388,788 3.55 ___________ ______
Luxembourg
1,597,414 ArcelorMittal* 39,999,247 2.39 ___________ ______
Netherlands
1,186,996 Heineken* 34,998,577 2.09
3,039,905 ING Groep – CVA 32,055,798 1.92
2,335,371 Koninklijke KPN 25,140,269 1.50
111,112 Koninklijke Vopak 4,966,706 0.30
1,002,120 Unilever – CVA* 19,441,128 1.16 ___________ ______
116,602,478 6.97 ___________ ______
Spain
2,600,843 Banco Bilbao Vizcaya Argentaria 32,250,453 1.93
1,264,640 Bancontander 13,575,910 0.81
204,158 Red Electrica 6,645,343 0.40
2,369,973 Telefonica 41,889,273 2.50 ___________ ______
94,360,979 5.64 ___________ ______
Sweden
2,730,080 Atlas Copco 'A' 24,009,023 1.44 ___________ ______
Switzerland
1,048,763 Adecco* 35,073,544 2.10
423,499 Credit Suisse Group 14,762,990 0.88
862,328 Julius Baer Holding* 30,543,389 1.83
1,354,942 Nestle 38,804,016 2.32
861,644 Nobel Biocare Holding 18,169,547 1.09
262,581 Roche Holding Genusscheine 29,277,225 1.75
175,739 Swatch Group (Bearer Shares)* 26,299,746 1.57
938,147 Swiss Reinsurance* 30,280,005 1.81
1,677,320 UBS 21,453,973 1.28 ___________ ______
244,664,435 14.63 ___________ ______
United Kingdom
5,116,057 Barclays 22,099,524 1.32
1,605,724 Berkeley Group Holdings (Unit) 17,265,130 1.03
1,935,675 BG Group 22,363,086 1.34
7,821,159 BP 47,267,331 2.83
3,799,971 Cookson Group 17,029,646 1.02
6,911,741 GKN 8,574,098 0.51
1,912,347 GlaxoSmithKline 26,134,287 1.56
3,542,645 Hammerson 16,294,977 0.97
7,353,754 HSBC Holdings 56,146,324 3.36
35,973,492 Inchcape 11,340,284 0.68
2,355,939 Land Securities Group (Reit) 16,526,441 0.99
12,990,398 Lloyds TSB Group 16,430,546 0.98
1,879,309 Prudential 11,464,386 0.69
6,089,294 Tesco 26,002,649 1.55
2,744,305 Tullow Oil 33,575,803 2.01
30,096,183 Vodafone Group 45,403,342 2.71
1,142,905 Royal Dutch Shell 'B' 21,734,213 1.30
3,341,853 Xstrata 31,376,792 1.88 ___________ ______
447,028,859 26.73 ___________ ______
Total Portfolio 1,667,423,851 99.71
Other Net Assets 4,859,579 0.29 ___________ ______
Total Net Assets (€) 1,672,283,430 100.00 ___________ ______
Transferable Securities Admitted to an Official Stock Exchange
Listing or Dealt in on Another Regulated Market
Holding Description Value (€) %
Transferable Securities Admitted to an Official Stock Exchange
Listing or Dealt in on Another Regulated Market
Holding Description Value (€) %

88 BlackRock Global Funds (BGF)
European Fund continued
Sector Breakdown as at 31 August 2009
Finance 28.34
Energy 11.52
Consumer discretionary 10.81
Industrials 10.21
Consumer staples 8.53
Materials 8.46
Telecommunication services 8.19
Healthcare 7.78
Utilities 3.44
Information technology 2.43
Other net assets 0.29 __________
100.00 __________
% of net
assets

Audited Annual Report and Accounts 89
The notes on pages 236 to 244 form an integral part of these financial statements.
European Enhanced Equity Yield Fund
Portfolio of Investments 31 August 2009
COMMON / PREFERRED STOCKS (SHARES) & WARRANTS
Austria
420 OMV 11,491 0.06
5,954 Telekom Austria 72,460 0.38
2,221 Voestalpine 49,795 0.26 ___________ ______
133,746 0.70 ___________ ______
Belgium
3,560 Anheuser-Busch InBev 14 0.00
6,080 Dexia 36,182 0.19
5,456 InBev 161,989 0.85
1,759 Mobistar 79,005 0.41 ___________ ______
277,190 1.45 ___________ ______
Denmark
1,650 Carlsberg 82,019 0.43
2,677 Novo Nordisk 'B' 114,548 0.60
1,050 Vestas Wind Systems 52,406 0.27 ___________ ______
248,973 1.30 ___________ ______
Finland
5,200 Fortum OYJ 94,172 0.49
3,100 Kesko OYJ 'B' 63,178 0.33
8,700 Nokia OYJ 83,607 0.44
3,880 Orion 'B' 46,094 0.24
7,900 Sampo 'A' 132,641 0.69
6,900 UPM-Kymmene OYJ 57,270 0.30 ___________ ______
476,962 2.49 ___________ ______
France
2,343 Accor 86,176 0.45
6,427 Air France-KLM 68,351 0.36
10,235 AXA 162,429 0.85
1,678 BNP Paribas 95,176 0.50
4,542 Cie de Saint-Gobain 141,348 0.74
1 Cie Generale de Geophysique-Veritas 15 0.00
175 Eurazeo 6,573 0.03
13,424 France Telecom 239,283 1.25
6,351 GDF Suez 186,434 0.97
905 ICADE (Reit) 58,599 0.31
4,488 Klepierre (Reit) 118,260 0.62
2,129 Lafarge 126,228 0.66
379 LVMH Moet Hennessy Louis Vuitton 25,257 0.13
4,778 M6-Metropole Television 75,516 0.39
1,496 Neopost 85,870 0.45
1,512 PPR 122,623 0.64
291 Renault 9,137 0.05
4,838 Sanofi-Aventis 230,531 1.20
1,962 Schneider Electric 125,764 0.66
68 Societe Generale 3,809 0.02
7,596 Societe Television Francaise 1 85,075 0.44
8,769 Total 349,576 1.83
957 Vallourec 101,442 0.53
4,412 Veolia Environnement 106,395 0.56
9,151 Vivendi 183,295 0.96 ___________ ______
2,793,162 14.60 ___________ ______
Germany
2,734 Allianz SE 220,196 1.15
5,873 BASF SE 213,718 1.12
1,977 Bayer 84,655 0.44
6,448 Daimler 202,725 1.06
765 Deutsche Bank 36,238 0.19
4,521 Deutsche Lufthansa 50,635 0.26
11,440 Deutsche Post 137,623 0.72
3,407 Deutsche Postbank 84,187 0.44
5,449 Deutsche Telekom 50,785 0.27
4,126 E.ON 122,006 0.64
751 K+S 26,563 0.14
1,728 MAN 92,051 0.48
1,078 Merck KGAA 68,194 0.36
1,562 RWE 100,437 0.52
2,254 RWE (Pref) 127,621 0.67
1,280 SAP 43,635 0.23
2,086 Siemens 126,641 0.66
4,385 ThyssenKrupp 103,223 0.54
105 Volkswagen 14,273 0.07
1,100 Volkswagen (Pref) 72,864 0.38 ___________ ______
1,978,270 10.34 ___________ ______
Greece
7,960 Hellenic Petroleum 58,426 0.30
1,342 OPAP 22,895 0.12
10,224 Piraeus Bank 110,930 0.58 ___________ ______
192,251 1.00 ___________ ______
Ireland
3,886 CRH 67,811 0.35 ___________ ______
Italy
2,481 A2A 3,325 0.02
14,877 Alleanza Assicurazioni 84,576 0.44
17,531 Banca Popolare di Milano 92,038 0.48
2,280 Enel 9,308 0.05
15,332 ENI 251,751 1.32
9,940 Fiat 81,309 0.42
8,752 Mediobanca 83,800 0.44
40,277 Parmalat 71,854 0.38
36,043 Saras 86,503 0.45
26,613 Terna Rete Elettrica Nazionale 68,063 0.36
14,703 UniCredit 37,199 0.19
10,977 Unione di Banche Italiane SCPA 115,589 0.60
12,606 Unione di Banche Italiane SCPA
(Call Wts 30/6/2011) 945 0.01 ___________ ______
986,260 5.16 ___________ ______
Luxembourg
640 ArcelorMittal 16,026 0.09 ___________ ______
Netherlands
1,606 Akzo Nobel 63,533 0.33
1,833 Corio (Reit) 77,774 0.41
538 Fugro – CVA 20,188 0.11
4,655 Koninklijke Boskalis Westminster 102,922 0.54
3,287 Koninklijke DSM 83,325 0.44
2,794 Koninklijke KPN 30,077 0.16
3,161 Randstad Holding 90,515 0.47
10,721 Reed Elsevier 79,421 0.41
9,104 Unilever – CVA 176,618 0.92 ___________ ______
724,373 3.79 ___________ ______
Norway
16,647 Norsk Hydro 69,052 0.36
8,550 StatoilHydro 131,347 0.69 ___________ ______
200,399 1.05 ___________ ______
Transferable Securities Admitted to an Official Stock Exchange
Listing or Dealt in on Another Regulated Market
Holding Description Value (€) %
Transferable Securities Admitted to an Official Stock Exchange
Listing or Dealt in on Another Regulated Market
Holding Description Value (€) %

90 BlackRock Global Funds (BGF)
European Enhanced Equity Yield Fund continued
Portfolio of Investments 31 August 2009
Portugal
10,097 Cimpor Cimentos de Portugal SGPS 51,799 0.27
395 Jeronimo Martins SGPS 2,156 0.01
3,537 Portugal Telecom SGPS 25,523 0.14 ___________ ______
79,478 0.42 ___________ ______
Spain
22,874 Banco Bilbao Vizcaya Argentaria 283,638 1.48
41,335 Bancontander 443,731 2.32
2,283 Fomento de Construcciones y Contratas 64,403 0.34
26,503 Iberia Lineas Aereas de Espana 45,771 0.24
3,407 Indra Sistemas 56,113 0.29
2,951 Sacyr Vallehermoso 34,394 0.18
12,378 Telefonica 218,781 1.14 ___________ ______
1,146,831 5.99 ___________ ______
Sweden
500 Hennes & Mauritz 'B' 19,360 0.10
26,660 Nordea Bank 195,466 1.02
16,708 Sandvik AB 117,252 0.62
3,124 SSAB AB 'A' 31,889 0.17
6,867 SSAB AB 'B' 63,356 0.33
12,101 Svenska Cellulosa AB 'B' 109,507 0.57
17,000 Telefonaktiebolaget LM Ericsson 'B' 113,128 0.59 ___________ ______
649,958 3.40 ___________ ______
Switzerland
2,685 ABB 36,024 0.19
6,586 Credit Suisse Group 229,585 1.20
2,921 Holcim 138,205 0.72
1,337 Kuehne & Nagel International 74,184 0.39
17,065 Nestle 488,722 2.55
3,806 Nobel Biocare Holding 80,258 0.42
7,553 Novartis 243,983 1.27
2,192 Roche Holding Genusscheine 244,403 1.28
3,597 Swiss Reinsurance 116,098 0.61
63 Syngenta 10,389 0.05
6,291 UBS 80,466 0.42
1,218 Zurich Financial Services 186,771 0.98 ___________ ______
1,929,088 10.08 ___________ ______
United Kingdom
5,023 Anglo American 115,321 0.60
11,464 Antofagasta 99,822 0.52
8,081 AstraZeneca 260,712 1.36
19,475 Aviva 89,866 0.47
1,435 BAE Systems 5,089 0.03
60,606 Barclays 261,796 1.37
8,246 BG Group 95,267 0.50
8,432 BHP Billiton‡ 155,942 0.81
84,701 BP‡ 511,892 2.68
10,759 British American Tobacco 229,044 1.20
29,584 BT Group 46,513 0.24
59,091 Cable & Wireless 99,617 0.52
1,439 Carnival 31,092 0.16
1,638 Centrica 4,687 0.02
16,903 Diageo 183,185 0.96
14,588 Drax Group 79,463 0.41
25,445 GlaxoSmithKline 347,733 1.82
25,092 Home Retail Group 88,991 0.46
83,295 HSBC Holdings 635,962 3.32
8,962 Imperial Tobacco Group 176,128 0.92
1,851 Ladbrokes 4,096 0.02
56,750 Lloyds TSB Group 71,779 0.38
6,860 National Grid 46,173 0.24
2,226 Reckitt Benckiser Group 72,145 0.38
4,213 Reed Elsevier 21,393 0.11
41,978 Rexam 127,563 0.67
3,110 Rio Tinto 85,268 0.45
69,497 RSA Insurance Group‡ 103,107 0.54
35,339 Sage Group 88,600 0.46
7,528 Scottish & Southern Energy 95,695 0.50
41,891 Segro (Reit) 171,127 0.89
5,601 Severn Trent 62,291 0.33
3,012 Standard Chartered 47,766 0.25
16,120 Tesco 68,836 0.36
2,484 Unilever 47,407 0.25
11,992 United Utilities Group 61,685 0.32
278,763 Vodafone Group‡ 420,544 2.20
13,545 Royal Dutch Shell 'A' 263,274 1.38
10,284 Royal Dutch Shell 'B' 195,567 1.02
790 Xstrata 7,417 0.04 ___________ ______
5,579,855 29.16 ___________ ______
Total Portfolio 17,480,633 91.37
Other Net Assets 1,651,457 8.63 ___________ ______
Total Net Assets (€) 19,132,090 100.00 ___________ ______
Transferable Securities Admitted to an Official Stock Exchange
Listing or Dealt in on Another Regulated Market
Holding Description Value (€) %
Transferable Securities Admitted to an Official Stock Exchange
Listing or Dealt in on Another Regulated Market
Holding Description Value (€) %
(‡) Securities given in guarantee, see Note 12, for further details.

Audited Annual Report and Accounts 91
The notes on pages 236 to 244 form an integral part of these financial statements.
European Enhanced Equity Yield Fund continued
Open Forward Foreign Exchange Transactions as at 31 August 2009
GBP Hedged Share Class £
€11,258 £9,784 15/9/2009 127 144
£707,277 €823,034 15/9/2009 (17,244) (19,589)__________ __________
Net unrealised loss (17,117) (19,445)__________ __________
USD Hedged Share Class US$
US$5,395,408 €3,814,729 15/9/2009 (55,510) (38,848)
€75,653 US$107,470 15/9/2009 632 442 __________ __________
Net unrealised loss (54,878) (38,406)__________ __________
Total net unrealised loss (57,851)__________
Note: The net unrealised loss attributed to these transactions is included in the Statement
of Net Assets (see Note 2c).
Unrealised
profit/(loss)
€ Equivalent
Unrealised
profit/(loss)Value dateSalesPurchases
Open Futures Contracts as at 31 August 2009
29 DJ Euro Stoxx 50 September 2009 804,750
11 FTSE 100 IDX September 2009 613,804
4 Swiss Market IX September 2009 163,240 __________
Total commitment 1,581,794 __________
Note: The net unrealised gain of €164,937 attributed to these transactions is included
in the Statement of Net Assets (see Note 2c).
Value
€
Expiration
dateContracts/Description
Number
of Contracts
(25) SMI Call Option
strike price CHF6,100
expiring on 18/9/2009 (6,466) (25,683)
(60) FTSE Call Option
strike price £4,850
expiring on 18/9/2009 (34,032) (91,164)
(200) DJ Euro Stoxx 50 Call Option
strike price €2,750
expiring on 18/9/2009 (60,283) (155,600)___________ _________
Total Written Call Options (100,781) (272,447)___________ _________
Note: Written Call Options are included in the Statement of Net Assets (see Note 2c).
Value €
Unrealised loss
€Issuer
Number ofcontracts
subject to Call
Written Call Options as at 31 August 2009
Sector Breakdown as at 31 August 2009
Finance 23.39
Energy 10.34
Materials 9.79
Consumer staples 9.54
Healthcare 8.99
Industrials 7.68
Telecommunication services 6.71
Consumer discretionary 6.37
Utilities 6.10
Information technology 2.46
Other net assets 8.63 __________
100.00 __________
% of net
assets

92 BlackRock Global Funds (BGF)
European Focus Fund
Portfolio of Investments 31 August 2009
COMMON / PREFERRED STOCKS (SHARES)
Belgium
123,319 KBC Groep 3,255,622 2.65 ___________ ______
Denmark
122,287 Danske Bank 2,275,406 1.85 ___________ ______
Finland
168,738 Nokian Renkaat 2,647,499 2.15 ___________ ______
France
49,752 Bouygues 1,724,653 1.40
42,605 Compagnie Generale des Etablissements
Michelin 'B' 2,243,579 1.82
32,112 Euler Hermes 1,493,369 1.21
64,419 Eutelsat Communications 1,201,414 0.98
44,197 Lafarge 2,620,440 2.13
30,703 Schneider Electric 1,968,062 1.60
120,311 Total 4,796,198 3.90
61,742 Vinci 2,316,251 1.88 ___________ ______
18,363,966 14.92 ___________ ______
Germany
45,080 Bayer 1,930,326 1.57
159,400 E.ON 4,713,458 3.83
77,985 Henkel AG & Co (Pref) 2,141,468 1.74
67,367 MAN 3,588,640 2.92 ___________ ______
12,373,892 10.06 ___________ ______
Greece
214,684 EFG Eurobank Ergasias 2,099,610 1.71 ___________ ______
Italy
102,706 Saipem 1,910,332 1.55
1,116,612 UniCredit 2,825,028 2.30 ___________ ______
4,735,360 3.85 ___________ ______
Luxembourg
97,342 ArcelorMittal 2,437,444 1.98 ___________ ______
Netherlands
122,523 Heineken 3,612,590 2.94
329,646 ING Groep – CVA 3,476,117 2.83
262,051 Koninklijke KPN 2,820,979 2.29
12,712 Koninklijke Vopak 568,226 0.46 ___________ ______
10,477,912 8.52 ___________ ______
Portugal
387,842 Jeronimo Martins SGPS 2,116,842 1.72 ___________ ______
Spain
178,974 Banco Bilbao Vizcaya Argentaria 2,219,278 1.80 ___________ ______
Sweden
313,743 Atlas Copco 'A' 2,759,136 2.24 ___________ ______
Switzerland
91,526 Adecco 3,060,883 2.49
110,479 Julius Baer Holding 3,913,132 3.18
38,615 Kuehne & Nagel International 2,142,567 1.74
90,588 Nestle 2,594,339 2.11
47,132 Nobel Biocare Holding 993,875 0.81
24,092 Swatch Group (Bearer Shares) 3,605,423 2.93
105,193 Swiss Reinsurance 3,395,251 2.76
139,002 UBS 1,777,923 1.44 ___________ ______
21,483,393 17.46 ___________ ______
United Kingdom
500,239 Barclays 2,160,852 1.76
205,402 Berkeley Group Holdings (Unit) 2,208,532 1.79
279,949 BG Group 3,234,284 2.63
456,074 BP 2,756,292 2.24
979,576 British Airways 2,131,009 1.73
1,495,592 GKN 1,855,300 1.51
196,039 GlaxoSmithKline 2,679,085 2.18
713,242 Halfords Group 2,734,570 2.22
714,136 Hammerson 3,284,786 2.67
541,812 HSBC Holdings 4,136,765 3.36
1,385,077 Lloyds TSB Group 1,751,876 1.42
287,751 Tullow Oil 3,520,553 2.86
215,957 Xstrata 2,027,629 1.65 ___________ ______
34,481,533 28.02 ___________ ______
Total Portfolio 121,726,893 98.93
Other Net Assets 1,315,459 1.07 ___________ ______
Total Net Assets (€) 123,042,352 100.00 ___________ ______
Transferable Securities Admitted to an Official Stock Exchange
Listing or Dealt in on Another Regulated Market
Holding Description Value (€) %
Transferable Securities Admitted to an Official Stock Exchange
Listing or Dealt in on Another Regulated Market
Holding Description Value (€) %
Sector Breakdown as at 31 August 2009
Finance 30.94
Industrials 16.46
Consumer discretionary 13.40
Energy 13.18
Consumer staples 8.51
Materials 5.76
Healthcare 4.56
Utilities 3.83
Telecommunication services 2.29
Other net assets 1.07 __________
100.00 __________
% of net
assets

Audited Annual Report and Accounts 93
The notes on pages 236 to 244 form an integral part of these financial statements.
European Growth Fund
COMMON STOCKS (SHARES)
Austria
25,931 Erste Group Bank 767,298 0.46 ___________ ______
Belgium
121,353 InBev 3,602,971 2.12
99,483 KBC Groep 2,626,351 1.55 ___________ ______
6,229,322 3.67 ___________ ______
British Virgin Islands
195,246 Playtech 740,810 0.44 ___________ ______
Finland
324,886 F-Secure OYJ 841,455 0.50
67,591 Kone OYJ 'B' 1,630,295 0.96
340,410 Nokia OYJ* 3,271,340 1.93
132,203 Nokian Renkaat 2,074,265 1.22 ___________ ______
7,817,355 4.61 ___________ ______
France
54,161 Bouygues 1,877,491 1.11
34,023 Euler Hermes 1,582,240 0.93
118,493 Eutelsat Communications 2,209,894 1.30
43,899 LVMH Moet Hennessy Louis Vuitton* 2,925,429 1.73
22,248 PPR 1,804,313 1.06 ___________ ______
10,399,367 6.13 ___________ ______
Germany
128,234 Bayer 5,490,980 3.24
77,373 Daimler 2,432,607 1.44
60,065 ElringKlinger 747,809 0.44
183,091 GEA Group 2,275,821 1.34
54,033 Hamburger Hafen und Logistik 1,577,223 0.93
185,666 Rhoen Klinikum 2,903,816 1.71
129,973 SAP* 4,430,780 2.61
232,111 Sky Deutschland 777,572 0.46 ___________ ______
20,636,608 12.17 ___________ ______
Greece
229,959 EFG Eurobank Ergasias 2,248,999 1.32
130,014 Terna Energy 709,876 0.42 ___________ ______
2,958,875 1.74 ___________ ______
Italy
888,820 UniCredit 2,248,715 1.33 ___________ ______
Jersey
492,513 United Business Media 2,593,818 1.53 ___________ ______
Netherlands
111,340 ASML Holding 2,138,285 1.26
99,259 Heineken 2,926,652 1.72
46,607 Koninklijke Vopak 2,083,333 1.23
147,960 New World Resources 'A' 964,794 0.57 ___________ ______
8,113,064 4.78 ___________ ______
Portugal
349,032 Jeronimo Martins SGPS 1,905,017 1.12 ___________ ______
Spain
189,070 Banco Bilbao Vizcaya Argentaria 2,344,468 1.38
103,117 General de Alquiler de Maquinaria 799,157 0.47
201,163 Grifols 2,471,287 1.46
75,180 Red Electrica 2,447,109 1.44
381,017 Telefonica 6,734,475 3.97 ___________ ______
14,796,496 8.72 ___________ ______
Sweden
191,912 Swedish Match 2,594,686 1.53 ___________ ______
Switzerland
116,822 Credit Suisse Group 4,072,364 2.40
60,545 Julius Baer Holding 2,144,485 1.26
30,742 Kuehne & Nagel International 1,705,731 1.01
302,716 Nestle 8,669,446 5.11
111,471 Novartis 3,600,820 2.12
57,869 Roche Holding Genusscheine 6,452,271 3.80
247,521 UBS 3,165,949 1.87 ___________ ______
29,811,066 17.57 ___________ ______
United Kingdom
121,342 AstraZeneca 3,914,784 2.31
269,319 Aveva Group 2,559,242 1.51
638,653 BAE Systems 2,265,042 1.33
407,003 Barclays 1,758,106 1.04
447,558 BG Group 5,170,691 3.05
523,916 Great Portland Estates (Reit) 1,577,197 0.93
347,527 Hammerson 1,598,507 0.94
290,251 HSBC Holdings 2,216,083 1.31
212,074 Imperial Tobacco Group 4,167,848 2.46
135,290 Peter Hambro Mining 1,185,714 0.70
571,069 Reed Elsevier 2,899,843 1.71
976,822 Rentokil Initial 1,215,088 0.71
163,020 Rio Tinto 4,469,578 2.63
168,008 Rotork 1,836,999 1.08
217,656 Smiths Group 1,983,003 1.17
1,010,681 Tesco 4,315,834 2.54
344,873 Tullow Oil 4,219,425 2.49
306,591 Unilever 5,851,228 3.45
281,193 Xstrata 2,640,132 1.56 ___________ ______
55,844,344 32.92 ___________ ______
Total Portfolio 167,456,841 98.72
Other Net Assets 2,170,831 1.28 ___________ ______
Total Net Assets (€) 169,627,672 100.00 ___________ ______
Transferable Securities Admitted to an Official Stock Exchange
Listing or Dealt in on Another Regulated Market
Holding Description Value (€) %
Transferable Securities Admitted to an Official Stock Exchange
Listing or Dealt in on Another Regulated Market
Holding Description Value (€) %
(*) Securities lent, see Note 11, for further details.
Portfolio of Investments 31 August 2009

94 BlackRock Global Funds (BGF)
European Growth Fund continued
Sector Breakdown as at 31 August 2009
Consumer staples 20.05
Finance 16.72
Healthcare 14.64
Consumer discretionary 10.89
Industrials 10.26
Information technology 9.33
Energy 5.54
Materials 5.46
Telecommunication services 3.97
Utilities 1.86
Other net assets 1.28 __________
100.00 __________
% of net
assets

Audited Annual Report and Accounts 95
The notes on pages 236 to 244 form an integral part of these financial statements.
European Opportunities Fund
Portfolio of Investments 31 August 2009
FUNDS
Bermuda
346,293 Oakley Capital Investments 350,116 0.11 ___________ ______
Guernsey
1,232,771 Advantage Property Income Trust 301,092 0.09
2,117,139 Puma Brandenburg 1,406,966 0.43 ___________ ______
1,708,058 0.52 ___________ ______
Isle of Man
1,153,337 Trading Emissions 1,493,618 0.45 ___________ ______
United Kingdom
85,423 Dunedin Enterprise Investment Trust 294,518 0.09
48,339 Graphite Enterprise Trust 167,485 0.05 ___________ ______
462,003 0.14 ___________ ______
Total Funds 4,013,795 1.22 ___________ ______
COMMON / PREFERRED STOCKS (SHARES) & WARRANTS
Austria
54,071 Andritz 1,723,243 0.52
80,431 Conwert Immobilien Invest SE 683,663 0.21
23,070 Voestalpine 517,229 0.16 ___________ ______
2,924,135 0.89 ___________ ______
Belgium
9,251 Colruyt 1,485,248 0.45
9,071 D'ieteren 1,934,935 0.59
31,399 EVS Broadcast Equipment 1,386,894 0.42
27,706 Groupe Bruxelles Lambert 1,678,984 0.51
3,728 KBC Ancora 52,863 0.02
21,665 Nyrstar 155,338 0.05 ___________ ______
6,694,262 2.04 ___________ ______
Bermuda
898,011 RCG Holdings (Hong Kong) 673,293 0.20 ___________ ______
British Virgin Islands
262,537 Gem Diamonds 745,605 0.23
164,822 Playtech 625,374 0.19
1,666,261 Polo Resources 88,492 0.02 ___________ ______
1,459,471 0.44 ___________ ______
Cayman Islands
135,042 Charlemagne Capital 19,559 0.01
2,507,362 Orchid Developments 1,253,280 0.38 ___________ ______
1,272,839 0.39 ___________ ______
Denmark
37,817 D/S Norden 927,211 0.28
6,029 Genmab 119,067 0.04
22,669 Novo Nordisk 'B' 969,997 0.29 ___________ ______
2,016,275 0.61 ___________ ______
Finland
33,255 Metso Oyj 577,972 0.18
227,013 Nokia OYJ 2,181,595 0.66
29,768 Nokian Renkaat 467,060 0.14
50,008 Sampo 'A' 839,634 0.26 ___________ ______
4,066,261 1.24 ___________ ______
France
6,136 Accor 225,682 0.07
169,610 Air France-KLM 1,803,802 0.55
228,944 Alcatel-Lucent 604,412 0.18
28,097 Audika 541,148 0.16
34,966 AXA 554,910 0.17
31,395 Beneteau 324,310 0.10
14,659 BNP Paribas 831,458 0.25
24,941 Bouygues 864,580 0.26
277,829 Bull 750,138 0.23
44,127 Cap Gemini 1,481,343 0.45
47,902 Carrefour 1,569,509 0.48
37,112 Cie de Saint-Gobain 1,154,924 0.35
41,969 Cie Generale de Geophysique-Veritas 624,709 0.19
38,266 Cie Generale d'Optique Essilor
International 1,445,307 0.44
32,504 CNP Assurances 2,228,149 0.68
45,772 Compagnie Generale des Etablissements
Michelin 'B' 2,410,354 0.73
98,595 Credit Agricole 1,279,270 0.39
118,029 France Telecom 2,103,867 0.64
25,157 GDF Suez 738,484 0.22
41,147 Groupe Danone 1,560,089 0.47
69,709 Hi-Media 296,960 0.09
19,337 Ipsen 661,325 0.20
31,509 IPSOS 612,220 0.19
37,936 M6-Metropole Television 599,578 0.18
49,839 Meetic 1,117,889 0.34
49,156 Nexity 1,280,514 0.39
45,294 NRJ Group 235,574 0.07
82,253 PagesJaunes Groupe 643,876 0.20
39,513 Pernod-Ricard 2,124,219 0.65
79,793 PEUGEOT 1,615,409 0.49
23,426 Pierre & Vacances 1,252,588 0.38
20,317 PPR 1,647,709 0.50
62,279 Publicis Groupe 1,607,732 0.49
38,238 Sanofi-Aventis 1,822,041 0.55
47,887 SeLoger.com 1,220,161 0.37
8,325 Sperian Protection 437,479 0.13
100,957 Suez Environnement 1,432,580 0.44
62,282 Teleperformance 1,489,163 0.45
81,296 Thales 2,587,652 0.79
6,340 Unibail-Rodamco (Reit) 874,920 0.27
38,989 Valeo 688,351 0.21
17,826 Vallourec 1,889,556 0.58
35,016 Vinci 1,313,625 0.40
35,630 Vivendi 713,669 0.22
20,499 Wendel 672,879 0.21 ___________ ______
51,934,114 15.80 ___________ ______
Germany
34,314 Adidas 1,129,617 0.34
24,846 Allianz SE 2,001,097 0.61
26,180 Axel Springer 1,595,671 0.49
43,726 Bauer 1,115,013 0.34
49,276 Bayer 2,109,998 0.64
18,913 Bertrandt 314,145 0.10
29,413 Deutsche Boerse 1,547,712 0.47
176,598 Deutsche Lufthansa 1,977,898 0.60
231,810 Deutsche Post 2,788,674 0.85
124,779 Deutsche Telekom 1,162,940 0.35
63,237 ElringKlinger 787,301 0.24
30,855 Fielmann 1,382,304 0.42
22,605 Fuchs Petrolub (Pref) 1,098,603 0.34
Transferable Securities Admitted to an Official Stock Exchange
Listing or Dealt in on Another Regulated Market
Holding Description Value (€) %
Transferable Securities Admitted to an Official Stock Exchange
Listing or Dealt in on Another Regulated Market
Holding Description Value (€) %

96 BlackRock Global Funds (BGF)
European Opportunities Fund continued
Portfolio of Investments 31 August 2009
78,688 GEA Group 978,092 0.30
46,511 Henkel AG & Co 1,087,892 0.33
23,357 Merck KGAA 1,477,564 0.45
62,167 Rheinmetall 2,093,785 0.64
10,595 Sixt 201,093 0.06
156,619 Takkt 1,401,740 0.43
10,263 Tipp24 SE 246,312 0.07
135,367 Tognum 1,444,366 0.44
37,255 Villeroy & Boch (Pref) 170,255 0.05
15,290 Wacker Chemie 1,295,828 0.39
19,149 Wincor Nixdorf 760,215 0.23 ___________ ______
30,168,115 9.18 ___________ ______
Gibraltar
1,120,260 888 Holdings 1,088,086 0.33 ___________ ______
Greece
13,103 Frigoglass SA 98,010 0.03
88,880 Hellenic Exchanges Holding Clearing
Settlement and Registry 751,925 0.23
42,726 National Bank of Greece 939,972 0.29
138,490 OPAP 2,362,639 0.72
80,720 Sarantis 343,060 0.10 ___________ ______
4,495,606 1.37 ___________ ______
Guernsey
45,774 Gottex Fund Management Holdings 369,506 0.11
449,622 St Peter Port Capital 247,724 0.08 ___________ ______
617,230 0.19 ___________ ______
Ireland
317,011 C&C Group 817,888 0.25
331,309 CPL Resources 596,356 0.18
111,428 CRH 1,944,419 0.59
2,208,746 Fyffes 1,060,198 0.32
508,469 Ryanair Holdings 1,586,423 0.49 ___________ ______
6,005,284 1.83 ___________ ______
Isle of Man
76,524 Climate Exchange 799,333 0.25 ___________ ______
Israel
1,905,621 Batm Advanced Communications 963,330 0.29
8,626 Oridion Systems 36,948 0.01 ___________ ______
1,000,278 0.30 ___________ ______
Italy
42,530 Atlantia 658,790 0.20
170,438 Azimut Holding 1,370,322 0.42
27,448 Banca Generali 191,587 0.06
29,240 Buzzi Unicem 349,710 0.11
50,190 Buzzi Unicem RSP 335,018 0.10
68,895 ENI 1,131,256 0.34
162,143 Exor (Pref) 1,115,544 0.34
347,341 Gruppo Coin 1,173,144 0.36
531,156 Impregilo 1,511,139 0.46
237,203 Landi Renzo 718,725 0.22
55,207 Luxottica Group 929,134 0.28
132,765 Mediobanca 1,271,225 0.39
572,784 Parmalat 1,021,847 0.31
44,073 Prysmian 568,982 0.17
65,673 SAES Getters 470,219 0.14
331,821 Saras 796,370 0.24
357,600 Snam Rete Gas 1,149,684 0.35
1,493,781 Telecom Italia 1,176,353 0.36
539,747 Terna Rete Elettrica Nazionale 1,380,403 0.42
33,220 Trevi Finanziaria 382,694 0.12
106,590 Unione di Banche Italiane SCPA 1,122,392 0.34 ___________ ______
18,824,538 5.73 ___________ ______
Jersey
217,169 Charter International 1,518,463 0.46
164,111 Experian 964,776 0.29
1,714,859 Henderson Group 2,513,023 0.77
308,462 United Business Media 1,624,514 0.49 ___________ ______
6,620,776 2.01 ___________ ______
Luxembourg
18,428 RTL Group 726,247 0.22
154,950 SES 2,132,112 0.65 ___________ ______
2,858,359 0.87 ___________ ______
Netherlands
145,772 Aalberts Industries 1,234,835 0.37
29,236 Advanced Metallurgical Group 315,164 0.10
66,903 ASM International 863,718 0.26
55,796 Beter BED Holding 687,407 0.21
33,216 Fugro – CVA 1,246,430 0.38
34,912 Heineken 1,029,380 0.31
19,306 Kendrion 189,585 0.06
58,345 Koninklijke Boskalis Westminster 1,290,008 0.39
50,687 Koninklijke DSM 1,284,915 0.39
69,890 Koninklijke Philips Electronics 1,109,154 0.34
52,315 Nutreco Holding 1,634,321 0.50
151,623 Reed Elsevier 1,123,223 0.34
59,183 Unit 4 Agresso 778,256 0.24
15,964 Vastned Retail (Reit) 674,479 0.20
56,491 Wolters Kluwer 780,706 0.24 ___________ ______
14,241,581 4.33 ___________ ______
Norway
518,309 ABG Sundal Collier Holding 421,572 0.12
54,725 Leroy Seafood Group 650,840 0.20
4,356,960 Marine Harvest 2,163,675 0.66
110,554 Norsk Hydro 458,580 0.14
166,760 Salmar 880,375 0.27
61,603 Schibsted 617,204 0.19
51,432 StatoilHydro 790,107 0.24
270,830 StepStone 225,624 0.07 ___________ ______
6,207,977 1.89 ___________ ______
Portugal
104,561 Brisa Auto-Estradas de Portugal 645,978 0.20 ___________ ______
Spain
26,749 Bolsas y Mercados Espanoles 656,688 0.20
73,411 Grupo Catalana Occidente 1,095,292 0.33
358,454 Iberdrola Renovables 1,141,676 0.35
121,168 Telefonica 2,141,644 0.65 ___________ ______
5,035,300 1.53 ___________ ______
Transferable Securities Admitted to an Official Stock Exchange
Listing or Dealt in on Another Regulated Market
Holding Description Value (€) %
Transferable Securities Admitted to an Official Stock Exchange
Listing or Dealt in on Another Regulated Market
Holding Description Value (€) %

Audited Annual Report and Accounts 97
The notes on pages 236 to 244 form an integral part of these financial statements.
European Opportunities Fund continued
Portfolio of Investments 31 August 2009
Sweden
85,089 Assa Abloy 'B' 950,401 0.29
73,197 Atlas Copco 'A' 643,713 0.20
49,830 Autoliv 1,131,615 0.34
212,351 BE Group 854,534 0.26
85,400 Castellum AB 557,405 0.17
51,798 HQ AB 650,750 0.20
143,878 JM 1,080,306 0.33
117,710 Kinnevik Investment AB 1,106,224 0.34
93,208 Swedish Match 1,260,190 0.38 ___________ ______
8,235,138 2.51 ___________ ______
Switzerland
24,764 Actelion 1,005,235 0.30
58,360 Adecco 1,951,720 0.59
66,299 Bank Sarasin & Cie (Call Wts
15/9/2009 – Bank Sarasin & Cie) 45,874 0.01
90,460 Bank Sarasin & Cie 'B' 2,300,966 0.70
12,913 Bucher Industries 1,048,345 0.32
208,678 Clariant 1,306,371 0.40
128,906 Compagnie Financiere Richemont 'A'
(Bearer Shares) 2,458,317 0.75
120,354 Gategroup Holding 1,982,745 0.60
2,305 Gurit Holding (Bearer Shares) 885,535 0.27
32,094 Julius Baer Holding 1,136,759 0.35
1,431 Kuoni Reisen Holding 'B' 331,460 0.10
10,094 Partners Group Holding 811,502 0.25
1,597 Schweizerhall Holding 189,428 0.06
10,306 Sonova Holding 683,889 0.21
134,007 STMicroelectronics 807,660 0.25
29,125 Sulzer 1,569,949 0.48
80,971 Swatch Group 2,403,757 0.73
15,096 Syngenta 2,489,443 0.76
4,265 Tecan Group 160,199 0.05
79,069 UBS 1,011,342 0.31
14,326 Valora Holding 2,141,087 0.65
31,673 Winterthur Technologie 772,249 0.23 ___________ ______
27,493,832 8.37 ___________ ______
United Kingdom
1,652,652 Aberdeen Asset Management 2,583,320 0.79
351,107 Aga Rangemaster Group 590,309 0.18
68,993 Air Partner 411,474 0.13
355,930 All Leisure Group 317,404 0.10
371,426 Ambrian Capital 129,747 0.04
221,093 Anglo Pacific Group 467,161 0.14
2,562,147 Anite 1,084,198 0.33
148,570 Arriva 798,983 0.24
1,537,354 Ashtead Group 1,423,344 0.43
310,487 BAE Systems 1,101,171 0.34
147,698 Berkeley Group Holdings (Unit) 1,588,084 0.48
99,056 BG Group 1,144,406 0.35
241,655 Bloomsbury Publishing 360,994 0.11
608,989 Bodycote 1,181,614 0.36
285,751 Bovis Homes Group 1,718,827 0.52
396,788 BTG 863,639 0.26
213,718 Business Post Group 694,968 0.21
158,977 Care UK 493,032 0.15
5,195 Carr's Milling Industries 26,262 0.01
408,317 Chloride Group 699,019 0.21
110,319 Clarkson 908,587 0.28
288,844 Colliers Cre 127,969 0.04
302,616 Collins Stewart 314,551 0.10
476,710 Compass Group 1,767,595 0.54
2,495 Daejan Holdings 73,721 0.02
75,922 Dana Petroleum 1,214,363 0.37
1,101,154 Dart Group 675,492 0.21
114,695 De La Rue 1,135,508 0.35
962,515 Delta 1,746,734 0.53
64,015 Diageo 693,759 0.21
569,461 Dignity 3,910,557 1.19
284,633 Drax Group 1,550,430 0.47
54,000 DTZ Holdings 59,504 0.02
270,900 Electrocomponents 515,469 0.16
634,334 F&C Asset Management 547,659 0.17
154,904 Firstgroup 667,634 0.20
391,174 French Connection Group 253,293 0.08
71,535 Go-Ahead Group 1,101,124 0.34
457,685 Grainger 1,481,801 0.45
486,087 Greggs 2,247,985 0.68
589,600 Hampson Industries 535,828 0.16
1,594,796 Hays 1,882,344 0.57
438,904 Holidaybreak 1,430,967 0.44
230,203 Hornby 397,496 0.12
107,724 HSBC Holdings 822,479 0.25
940,218 Huntsworth 728,970 0.22
160,750 ICAP 784,319 0.24
6,017,451 Inchcape 1,896,941 0.58
651,782 International Power 2,085,035 0.63
227,016 Invista Real Estate Investment
Management Holdings 130,235 0.04
659,688 Invocas Group 224,822 0.07
389,613 IP Group 239,004 0.07
783,481 K3 Business Technology Group 760,979 0.23
177,249 Keller Group 1,311,827 0.40
213,821 Laird 403,215 0.12
117,218 Land Securities Group (Reit) 822,261 0.25
2,227,911 Laura Ashley Holdings 430,254 0.13
368,630 Liontrust Asset Management 475,297 0.15
865,759 Local Shopping (Reit) 526,174 0.16
696,156 Luminar Group Holdings 1,099,258 0.33
313,963 M&C Saatchi 265,713 0.08
971,888 Marston's 1,181,349 0.36
172,469 May Gurney Integrated Services 347,767 0.11
389,710 Mouchel Group 807,947 0.25
5,087,824 Northgate 1,257,100 0.38
120,798 Polar Capital Holdings 103,606 0.03
585,504 Premier Farnell 1,097,469 0.33
63,580 Premier Oil 931,727 0.28
573,018 Prostrakan Group 999,206 0.30
165,979 PV Crystalox Solar 141,414 0.04
543,284 Rentokil Initial 675,802 0.21
422,765 RM 792,431 0.24
694,030 Robert Walters 1,178,685 0.36
939,665 RSA Insurance Group 1,394,102 0.42
192,202 Savills 786,029 0.24
160,105 Schroders 1,657,830 0.50
134,770 Schroders 1,654,997 0.50
235,527 Segro (Reit) 962,141 0.29
361,342 Severfield-Rowen 759,396 0.23
273,332 Shaftesbury (Reit) 1,176,815 0.36
847,104 Shore Capital Group 356,055 0.11
Transferable Securities Admitted to an Official Stock Exchange
Listing or Dealt in on Another Regulated Market
Holding Description Value (€) %
Transferable Securities Admitted to an Official Stock Exchange
Listing or Dealt in on Another Regulated Market
Holding Description Value (€) %

Sector Breakdown as at 31 August 2009
Industrials 22.12
Consumer discretionary 21.79
Finance 17.31
Consumer staples 7.73
Information technology 5.96
Materials 4.64
Healthcare 4.11
Energy 3.14
Utilities 2.88
Telecommunication services 2.50
Investment funds 1.22
Other net assets 6.60 __________
100.00 __________
% of net
assets
98 BlackRock Global Funds (BGF)
European Opportunities Fund continued
Portfolio of Investments 31 August 2009
93,692 Spirax-Sarco Engineering 1,038,265 0.32
393,013 Spirent Communications 369,225 0.11
445,915 ST Modwen Properties 1,239,804 0.38
682,617 Stagecoach Group 1,045,311 0.32
434,711 Standard Life 971,367 0.30
324,466 T Clarke 538,146 0.16
105,083 Tate & Lyle 480,959 0.15
704,850 Tenon Group 384,341 0.12
312,946 Topps Tiles 323,511 0.10
544,049 TUI Travel 1,484,531 0.45
163,773 Tullow Oil 2,003,717 0.61
208,174 Vitec Group 668,072 0.20
1,091,886 Vodafone Group 1,647,228 0.50
53,926 VT Group 316,408 0.10
77,202 Weir Group 567,867 0.17
374,283 WH Smith 1,875,493 0.57
786,660 William Hill 1,657,713 0.50
238,465 Wilmington Group 342,684 0.10
678,737 WM Morrison Supermarkets 2,135,795 0.65
588,107 Wolfson Microelectronics 935,325 0.29
8,316,219 Workspace Group (Reit) 2,054,771 0.63
1,417,560 YouGov 853,485 0.26 ___________ ______
97,120,995 29.56 ___________ ______
United States
29,338 Royal Caribbean Cruises 391,465 0.12 ___________ ______
Total Common / Preferred Stocks (Shares)
& Warrants 302,890,521 92.18 ___________ ______
Total Transferable Securities Admitted
to an Official Stock Exchange Listing or
Dealt in on Another Regulated Market 306,904,316 93.40 ___________ ______
Unquoted Securities
COMMON STOCKS (SHARES)
United States
132,000 Capital Development – 0.00 ___________ ______
Total Unquoted Securities – 0.00 ___________ ______
Total Portfolio 306,904,316 93.40
Other Net Assets 21,694,083 6.60 ___________ ______
Total Net Assets (€) 328,598,399 100.00 ___________ ______
Transferable Securities Admitted to an Official Stock Exchange
Listing or Dealt in on Another Regulated Market
Holding Description Value (€) %
Transferable Securities Admitted to an Official Stock Exchange
Listing or Dealt in on Another Regulated Market
Holding Description Value (€) %
Open Forward Foreign Exchange Transactions as at 31 August 2009
Core Fund
€16,647,000 £14,617,731 16/9/2009 41,735
£2,905,783 €3,370,000 16/9/2009 (69,126)__________
Net unrealised loss (27,391)__________
Note: The net unrealised loss attributed to these transactions is included in the Statement
of Net Assets (see Note 2c).
Value date
Unrealised
profit/(loss)
€SalesPurchases

Audited Annual Report and Accounts 99
The notes on pages 236 to 244 form an integral part of these financial statements.
European Value Fund
Portfolio of Investments 31 August 2009
COMMON & PREFERRED STOCKS (SHARES)
Austria
92,296 Erste Group Bank 2,731,039 1.12 ___________ ______
Belgium
128,327 KBC Groep 3,387,833 1.39 ___________ ______
Denmark
230,409 Danske Bank 4,287,242 1.76 ___________ ______
Finland
165,653 Konecranes OYJ 3,273,303 1.34 ___________ ______
France
125,403 BNP Paribas 7,112,857 2.92
1,699 Eramet 379,557 0.16
453,074 France Telecom* 8,076,044 3.32
221,876 GDF Suez 6,513,170 2.67
148,845 Sanofi-Aventis 7,092,464 2.91
79,408 Schneider Electric 5,090,053 2.09
248,116 Vivendi 4,969,763 2.04 ___________ ______
39,233,908 16.11 ___________ ______
Germany
87,636 Allianz SE 7,058,203 2.90
127,276 BASF SE 4,631,574 1.90
79,460 Bayer 3,402,477 1.40
97,104 Daimler 3,052,950 1.25
329,276 Deutsche Lufthansa 3,687,891 1.51
289,444 E.ON 8,558,859 3.52
73,714 MAN* 3,926,745 1.61
73,004 Porsche Automobil Holding SE (Pref) 3,790,368 1.56 ___________ ______
38,109,067 15.65 ___________ ______
Greece
325,696 EFG Eurobank Ergasias 3,185,307 1.31 ___________ ______
Italy
1,455,180 Enel 5,940,772 2.44
381,733 ENI 6,268,056 2.57
2,979,015 UniCredit 7,536,908 3.10 ___________ ______
19,745,736 8.11 ___________ ______
Luxembourg
184,304 ArcelorMittal 4,614,972 1.90 ___________ ______
Netherlands
167,118 European Aeronautic Defence and Space 2,414,020 0.99
96,361 Heineken 2,841,203 1.17
624,052 ING Groep – CVA 6,580,628 2.70 ___________ ______
11,835,851 4.86 ___________ ______
Norway
374,959 StatoilHydro 5,760,184 2.37 ___________ ______
Spain
682,702 Banco Bilbao Vizcaya Argentaria 8,465,505 3.48
874,947 Bancontander 9,392,556 3.86
131,619 Telefonica 2,326,366 0.95 ___________ ______
20,184,427 8.29 ___________ ______
Switzerland
58,718 Petroplus Holdings 1,018,412 0.42
134,870 Swiss Reinsurance 4,353,117 1.79
101,392 UBS 1,296,867 0.53
39,326 Zurich Financial Services 6,030,349 2.48 ___________ ______
12,698,745 5.22 ___________ ______
United Kingdom
522,470 BAE Systems 1,852,988 0.76
1,700,950 Barclays 7,347,492 3.02
2,292,838 BP 13,856,812 5.69
315,140 Cookson Group 1,412,306 0.58
462,598 GKN 573,858 0.23
1,393,171 HSBC Holdings 10,636,939 4.37
640,790 Land Securities Group (Reit) 4,495,014 1.85
3,903,528 Lloyds TSB Group 4,937,270 2.03
1,292,133 Meggitt 3,142,695 1.29
430,952 Redrow 1,210,686 0.50
674,832 Reed Elsevier 3,426,743 1.41
6,793,987 Vodafone Group 10,249,463 4.21
379,438 Royal Dutch Shell 'B' 7,215,636 2.96 ___________ ______
70,357,902 28.90 ___________ ______
Total Portfolio 239,405,516 98.33
Other Net Assets 4,077,930 1.67___________ ______
Total Net Assets (€) 243,483,446 100.00 ___________ ______
Transferable Securities Admitted to an Official Stock Exchange
Listing or Dealt in on Another Regulated Market
Holding Description Value (€) %
Transferable Securities Admitted to an Official Stock Exchange
Listing or Dealt in on Another Regulated Market
Holding Description Value (€) %
(*) Securities lent, see Note 11, for further details.
Sector Breakdown as at 31 August 2009
Finance 40.61
Energy 14.01
Industrials 10.17
Utilities 8.63
Telecommunication services 8.48
Consumer discretionary 6.99
Healthcare 4.31
Materials 3.96
Consumer staples 1.17
Other net assets 1.67 __________
100.00 __________
% of net
assets

100 BlackRock Global Funds (BGF)
Fixed Income Global Opportunities Fund
Portfolio of Investments 31 August 2009
BONDS
Canada
C$3,355,000 Canadian Government Bond 3.75%
1/6/2012 3,196,571 5.39
US$575,000 Province of Ontario Canada 4.1%
16/6/2014 603,260 1.02
US$150,000 Shaw Communications 7.25% 6/4/2011 156,188 0.26
US$185,000 TELUS 8% 1/6/2011 201,479 0.34 ___________ ______
4,157,498 7.01 ___________ ______
France
US$520,000 Societe Financement de l'Economie
Francaise '144A' 2.25% 11/6/2012 524,628 0.89
US$205,000 Societe Financement de l'Economie
Francaise '144A' 3.375% 5/5/2014 209,413 0.35 ___________ ______
734,041 1.24 ___________ ______
Japan
US$250,000 Japan Finance 2% 24/6/2011 253,026 0.43 ___________ ______
Netherlands
US$550,000 Telefonica Europe 7.75% 15/9/2010 583,437 0.98 ___________ ______
South Korea
US$545,000 Export-Import Bank of Korea 5.875%
14/1/2015 557,265 0.94 ___________ ______
Spain
US$295,000 Telefonica Emisiones SAU 5.984%
20/6/2011 314,313 0.53 ___________ ______
United Arab Emirates
US$400,000 Emirate of Abu Dhabi '144A' 6.75%
8/4/2019 440,552 0.74 ___________ ______
United Kingdom
US$600,000 Barclays Bank '144A' 5.926%
15/12/2016 (Perpetual) 420,000 0.71
US$125,000 Vodafone Group 4.15% 10/6/2014 127,929 0.22
US$755,000 Vodafone Group 7.75% 15/2/2010 779,024 1.31 ___________ ______
1,326,953 2.24 ___________ ______
United States
US$3,095,000 Accredited Mortgage Loan Trust
'2007-1 A3' FRN 25/2/2037 1,164,366 1.96
US$1,297,660 American Home Mortgage Investment
Trust '2005-1 6A' FRN 25/6/2045 801,296 1.35
US$275,000 AT&T 7.3% 15/11/2011 305,928 0.52
US$50,000 Ball 7.125% 1/9/2016 50,250 0.09
US$50,000 Ball 7.375% 1/9/2019 50,000 0.08
US$430,000 Banc of America Commercial Mortgage
'2002-2 A3' 5.118% 11/7/2043 441,271 0.74
US$500,000 Banc of America Commercial Mortgage
'2002-PB2 A4' 6.186% 11/6/2035 523,422 0.88
US$700,000 Banc of America Commercial Mortgage
'2005-4 A5A' 4.933% 10/7/2045 642,602 1.08
US$639,807 Bear Stearns Commercial Mortgage
Securities '1999-WF2 C' FRN
15/7/2031 642,516 1.08
US$469,172 Bear Stearns Commercial Mortgage
Securities '2000-WF2 A2' 7.32%
15/10/2032 483,192 0.82
US$620,000 Cellco Partnership / Verizon Wireless
Capital '144A' 3.75% 20/5/2011 640,548 1.08
US$443,951 Chase Commercial Mortgage Securities
'2000-1 A2' 7.757% 15/4/2032 450,453 0.76
US$15,000 CIT Group 4.25% 1/2/2010 9,173 0.02
US$20,000 CIT Group 4.75% 15/12/2010 12,009 0.02
US$15,000 CIT Group 5.4% 13/2/2012 8,678 0.02
US$20,000 CIT Group 5.8% 28/7/2011 11,826 0.02
US$1,235,000 Citibank NA 1.375% 10/8/2011 1,237,811 2.09
US$1,340,000 Citibank NA 'FXD' 1.875% 7/5/2012 1,342,397 2.26
US$70,000 Citigroup Commercial Mortgage Trust
'2006-C5 A4' 5.431% 15/10/2049 62,950 0.11
US$785,000 Citigroup Funding 2.25% 10/12/2012 791,886 1.34
US$545,000 Commercial Mortgage Load Trust
'2008-LS1 A4B' 6.22059% 10/12/2049 437,633 0.74
US$535,000 Commercial Mortgage Pass Through
Certificates '2004-LB3A A3' 5.09%
10/7/2037 522,759 0.88
US$798,910 Countrywide Alternative Loan Trust
'2006-6CB 1A10' 5.5% 25/5/2036 626,617 1.06
US$61,205 Countrywide Asset-Backed Certificates
'2006-14 2A1' FRN 25/2/2037 60,185 0.10
US$195,000 COX Communications '144A' 8.375%
1/3/2039 243,182 0.41
US$1,325,000 CW Capital Cobalt '2006-C1 A4' 5.223%
15/8/2048 1,062,339 1.79
US$180,000 DJO Finance 10.875% 15/11/2014 174,600 0.29
US$405,323 DLJ Commercial Mortgage
'2000-CKP1 A1B' 7.18% 10/11/2033 418,761 0.71
US$575,000 Entergy Gulf States FRN 1/12/2009 573,789 0.97
US$745,099 Fannie Mae Pool '829600' FRN 1/8/2035 771,643 1.30
US$815,000 Federal Home Loan Mortgage 2.125%
21/9/2012 820,558 1.38
US$45,862 First Union National Bank Commercial
Mortgage '1999-C4 A2' 7.39%
15/12/2031 45,845 0.08
US$504,118 Freddie Mac Non Gold Pool '1H1339'
FRN 1/7/2036 528,412 0.89
US$376,860 Freddie Mac REMICS '2989 KA' 4.5%
15/3/2019 393,277 0.66
US$415,249 Freddie Mac REMICS '3245 MB' 5.5%
15/12/2027 429,324 0.72
US$575,000 General Electric Capital 2.625%
28/12/2012 587,439 0.99
US$423,351 GMAC Commercial Mortgage Securities
'2001-C1 A2' 6.465% 15/4/2034 443,280 0.75
US$844,155 GSR Mortgage Loan Trust '2006-2F 2A2'
5.75% 25/2/2036 694,737 1.17
US$1,164,065 GSR Mortgage Loan Trust '2006-OA1 2A1'
FRN 25/8/2046 823,460 1.39
US$63,000 Harrah's Operating '144A' 10%
15/12/2018 43,785 0.07
US$876,714 Homebanc Mortgage Trust '2006-2 A1'
FRN 25/12/2036 427,621 0.72
US$236,610 Honda Auto Receivables Owner Trust
'2007-1 A3' 5.1% 18/3/2011 239,816 0.41
US$280,355 Honda Auto Receivables Owner Trust
'2007-2 A3' 5.46% 23/5/2011 285,244 0.48
US$395,000 Honda Auto Receivables Owner Trust
'2009-3 A3' 2.31% 15/5/2013 396,416 0.67
US$382,856 JP Morgan Chase Commercial Mortgage
Securities '2004-CB8 A1A' 4.158%
12/1/2039 366,868 0.62
US$1,055,000 JP Morgan Mortgage Acquisition
'2007-CH5 A3' FRN 25/6/2037 509,493 0.86
US$1,190,000 JPMorgan Chase & Co 7.9% 30/4/2018
(Perpetual) 1,141,007 1.92
Transferable Securities Admitted to an Official Stock Exchange
Listing or Dealt in on Another Regulated Market
Holding Description Value (US$) %
Transferable Securities Admitted to an Official Stock Exchange
Listing or Dealt in on Another Regulated Market
Holding Description Value (US$) %

Audited Annual Report and Accounts 101
The notes on pages 236 to 244 form an integral part of these financial statements.
Fixed Income Global Opportunities Fund continued
Portfolio of Investments 31 August 2009
US$40,000 Kraft Foods FRN 11/8/2010 40,016 0.07
US$640,000 LB-UBS Commercial Mortgage Trust
'2004-C4 A3' 5.145% 15/6/2029 650,228 1.10
US$760,000 LB-UBS Commercial Mortgage Trust
'2007-C1 A4' 5.424% 15/2/2040 576,731 0.97
US$175,000 LB-UBS Commercial Mortgage Trust
'2007-C2 A3' 5.43% 15/2/2040 134,309 0.23
US$875,000 LB-UBS Commercial Mortgage Trust
'2007-C7 A2' 5.588% 15/9/2045 872,208 1.47
US$295,000 Lincoln National 6.05% 20/4/2067 187,325 0.32
US$900,000 Merrill Lynch Mortgage Trust
'2007-C1 A2' 5.919% 12/6/2050 894,792 1.51
US$185,000 Morgan Stanley 7.3% 13/5/2019 206,526 0.35
US$765,000 Morgan Stanley Capital I '2007-IQ15 A4'
FRN 11/6/2049 652,815 1.10
US$550,000 Peco Energy Transition Trust '2001-A A1'
6.52% 31/12/2010 573,336 0.97
US$255,000 Progress Energy 7.1% 1/3/2011 271,356 0.46
US$185,000 SLM 5.4% 25/10/2011 161,193 0.27
US$1,000,000 SLM FRN 31/1/2014 542,500 0.92
US$1,240,000 SLM Student Loan Trust '2008-5 A2'
FRN 25/10/2016 1,252,031 2.11
US$1,020,000 SLM Student Loan Trust '2008-5 A3'
FRN 25/1/2018 1,034,015 1.74
US$250,000 Texas State 5.517% 1/4/2039 256,035 0.43
US$1,360,000 Time Warner FRN 13/11/2009 1,360,251 2.29
US$2,975,000 United States Treasury Note/Bond
1.125% 30/6/2011 2,986,738 5.04
US$645,000 US Treasury Bond 2.25% 31/5/2014 642,329 1.08
US$1,380,000 US Treasury Bond 2.625% 30/6/2014 1,394,016 2.35
US$3,485,000 US Treasury Bond 2.625% 31/7/2014 3,520,258 5.94
US$3,550,000 US Treasury Bond 3.125% 15/5/2019 3,451,543 5.82
US$335,000 US Treasury Bond 3.5% 15/2/2039 294,316 0.50
US$80,000 US Treasury Bond 3.625% 15/8/2019 81,256 0.14
US$2,730,000 US Treasury Bond 4.25% 15/5/2039 2,749,622 4.64
US$300,000 Verizon Communications 6.35%
1/4/2019 332,736 0.56
US$505,000 Wachovia Bank Commercial Mortgage
Trust '2005-C21 A3' FRN 15/10/2044 505,956 0.85
US$994,774 Wells Fargo Mortgage Backed Securities
Trust '2006-AR10 2A1' FRN 25/7/2036 743,829 1.25
US$280,000 XTO Energy 5% 1/8/2010 286,830 0.48 ___________ ______
49,395,760 83.31 ___________ ______
Total Transferable Securities Admitted
to an Official Stock Exchange Listing or
Dealt in on Another Regulated Market 57,762,845 97.42 ___________ ______
Unquoted Securities
BONDS
France
US$750,000 Dexia Credit Local '144A' 2.375%
23/9/2011 760,136 1.28 ___________ ______
Qatar
US$130,000 Qatar Government International Bond
'144A' 6.55% 9/4/2019 139,425 0.24 ___________ ______
United States
US$300,000 Cengage Learning Acquisitions '144A'
10.5% 15/1/2015 273,750 0.46
US$300,000 Roche Holdings '144A' 5% 1/3/2014 323,952 0.55 ___________ ______
597,702 1.01 ___________ ______
Total Unquoted Securities 1,497,263 2.53 ___________ ______
Total Portfolio 59,260,108 99.95
Other Net Assets 29,262 0.05 ___________ ______
Total Net Assets (US$) 59,289,370 100.00 ___________ ______
Transferable Securities Admitted to an Official Stock Exchange
Listing or Dealt in on Another Regulated Market
Holding Description Value (US$) %
Transferable Securities Admitted to an Official Stock Exchange
Listing or Dealt in on Another Regulated Market
Holding Description Value (US$) %
Value US$
Unrealised loss US$Description
NominalValue
US$ 3,600,000 Fund purchases a call option (expiring
30/10/2009) to enter into an Interest
Rate Swap (JP Morgan). If exercised
Fund receives 2.25% Fixed semi annually
from 3/5/2010; and pays Floating
US$ Libor 3-month -BBA quarterly
from 3/2/2010; (30/10/2009) (15,840) 360 ___________ _________
(15,840) 360 ___________ _________
Swaptions as at 31 August 2009
Note: Swaptions are included in the Statement of Net Assets (see Note 2c).

102 BlackRock Global Funds (BGF)
Fixed Income Global Opportunities Fund continued
Unrealised profit/(loss)
US$DescriptionNominal
Value
Unrealised profit/(loss)
US$DescriptionNominal
Value
ZAR 26,000,000 Interest Rate Swaps (Morgan Stanley)
(Fund receives Fixed 9.49%;
and pays Floating ZAR JIBOR 3 Month)
(7/2/2018) 181,335
ZAR 15,000,000 Interest Rate Swaps (Morgan Stanley)
(Fund receives Floating ZAR JIBOR 3 Month;
and pays Fixed 8.55%) (7/2/2038) (221,120)
ZAR 9,250,000 Interest Rate Swaps (Deutsche Bank)
(Fund receives Floating ZAR JIBOR 3 Month;
and pays Fixed 8.74%) (7/4/2038) (163,941)
ZAR 25,000,000 Interest Rate Swaps (Deutsche Bank)
(Fund receives Fixed 9.61%;
and pays Floating ZAR JIBOR 3 Month)
(7/4/2018) 202,415
US$1,900,000 Interest Rate Swaps (Citibank)
(Fund receives Floating USD Libor 3 Month;
and pays Fixed 4.685%) (28/3/2038) (186,170)
US$400,000 Interest Rate Swaps (Citibank)
(Fund receives Floating USD Libor 3 Month;
and pays Fixed 4.015%) (28/10/2038) 6,858
US$4,000,000 Interest Rate Swaps (Citibank)
(Fund receives Fixed 2.3325%;
and pays Floating USD Libor 3 Month)
(8/1/2014) (41,880)
US$3,000,000 Interest Rate Swaps (Citibank)
(Fund receives Fixed 2.215%;
and pays Floating USD Libor 3 Month)
(20/1/2016) (166,227)
US$3,300,000 Interest Rate Swaps (Morgan Stanley)
(Fund receives Fixed 1.76864%;
and pays Floating USD Libor 3 Month)
(22/6/2011) 32,693
US$5,300,000 Interest Rate Swaps (Goldman Sachs)
(Fund receives Fixed 2.7925%;
and pays Floating USD Libor 3 Month)
(23/7/2014) 7,711
US$2,400,000 Interest Rate Swaps (Morgan Stanley)
(Fund receives Floating USD Libor 3 Month;
and pays Fixed 3.35153%) (6/5/2019) 54,497
US$9,300,000 Interest Rate Swaps (Citibank)
(Fund receives Floating USD Libor 3 Month;
and pays Fixed 1.78%) (21/5/2012) 8,909
US$900,000 Interest Rate Swaps (Deutsche Bank)
(Fund receives Fixed 4.28%;
and pays Floating USD Libor 3 Month)
(29/5/2039) 25,908
US$900,000 Interest Rate Swaps (Deutsche Bank)
(Fund receives Fixed 4.3075%;
and pays Floating USD Libor 3 Month)
(1/6/2039) 29,960 __________
(229,052) __________
Swaps as at 31 August 2009
Note: The total market value of (US$229,052) of these transactions is included in the Statement of Net Assets (see Note 2c).
Open Forward Foreign Exchange Transactions as at 31 August 2009
Core Fund US$
US$903,925 €647,500 16/9/2009 (21,296) (21,296)
¥7,426,000 US$79,099 28/10/2009 794 794
US$83,574 AUD101,000 28/10/2009 (514) (514)
US$3,273,412 CAD3,554,500 28/10/2009 57,221 57,221
US$961,086 £588,000 28/10/2009 6,685 6,685 __________ __________
Net unrealised profit 42,890 42,890 __________ __________
EUR Hedged Share Class €
€9,180,468 US$12,975,968 15/9/2009 99,464 142,132
US$26,673 €18,549 15/9/2009 117 167 __________ __________
Net unrealised profit 99,581 142,299 __________ __________
SGD Hedged Share Class SGD
SGD2,139,017 US$1,480,266 15/9/2009 1,831 1,268 __________ __________
Net unrealised profit 1,831 1,268 __________ __________
Total net unrealised profit 186,457 __________
Note: The net unrealised profit attributed to these transactions is included in the Statement
of Net Assets (see Note 2c).
Unrealised
profit/(loss)
US$ Equivalent
Unrealised
profit/(loss)Value dateSalesPurchases
Open Futures Contracts as at 31 August 2009
12 Euro BOBL September 2009 1,993,340
9 Euro Bund September 2009 1,576,024
(2) 90 Day Euro $ Future September 2009 (498,375)
59 US Long Bond (CBT) December 2009 7,022,844
13 Euro Schatz December 2009 2,001,649
5 US Treasury 2 Year Note (CBT) December 2009 1,081,016
(2) 90 Day Euro $ Future December 2009 (497,675)
(40) US Treasury 5 Year Note (CBT) December 2009 (4,601,250)
(88) US Treasury 10 Year Note December 2009 (10,287,750)
(2) 90 Day Euro $ Future March 2010 (496,350)
(1) 90 Day Euro $ Future June 2010 (247,213)
(1) 90 Day Euro $ Future September 2010 (246,162)
(1) 90 Day Euro $ Future December 2010 (245,138)
(1) 90 Day Euro $ Future March 2011 (244,213)__________
Total commitment (3,689,253)__________
Note: The net unrealised gain of US$46,258 attributed to these transactions is included
in the Statement of Net Assets (see Note 2c).
Value
US$
Expiration
dateContracts/Description
Number
of Contracts

Audited Annual Report and Accounts 103
The notes on pages 236 to 244 form an integral part of these financial statements.
Global Allocation Fund
Portfolio of Investments 31 August 2009
Transferable Securities Admitted to an Official Stock Exchange
Listing or Dealt in on Another Regulated Market
Holding Description Value (US$) %
Transferable Securities Admitted to an Official Stock Exchange
Listing or Dealt in on Another Regulated Market
Holding Description Value (US$) %
FUNDS
Cayman Islands
1,898,136 Dragon Capital - Vietnam Enterprise
Investments 3,274,285 0.03
15,023,810 Vinaland 12,151,258 0.10 ___________ ______
15,425,543 0.13 ___________ ______
United States
459,600 Consumer Staples Select Sector SPDR
Fund – ETF 11,352,119 0.09
4,288,200 Financial Select Sector SPDR Fund 62,436,191 0.50
460,600 Health Care Select Sector SPDR Fund
– ETF 13,094,858 0.10
264,100 iShares Dow Jones US Telecommunications
Sector Index Fund – ETF 4,685,134 0.04
2,231,500 iShares Silver Trust – ETF 32,088,970 0.26
2,093,300 SPDR Gold Trust – ETF 194,572,235 1.55
105,900 SPDR KBW Bank ETF – ETF 2,465,352 0.02
5,985,000 Technology Select Sector SPDR Fund 119,520,449 0.96
63,200 Telecom HOLDRs Trust – ETF 1,491,519 0.01
1,145,789 Utilities Select Sector SPDR Fund – ETF 33,491,411 0.27
8,300 Vanguard Telecommunication Services
– ETF 419,149 0.00 ___________ ______
475,617,387 3.80 ___________ ______
Total Funds 491,042,930 3.93 ___________ ______
COMMON / PREFERRED STOCKS (SHARES) & WARRANTS
Australia
718,000 BHP Billiton 22,099,787 0.18
358,850 Newcrest Mining 9,007,303 0.07
1,384,042 Transurban Group 4,676,775 0.04
380,300 Woodside Petroleum 15,586,127 0.12 ___________ ______
51,369,992 0.41 ___________ ______
Austria
301,300 Telekom Austria 5,239,584 0.04 ___________ ______
Belgium
2,855,500 RHJ International 21,625,448 0.17 ___________ ______
Bermuda
17,100 Accenture 'A' 573,192 0.01
122,700 Arch Capital Group 7,901,880 0.06
7,400 Axis Capital Holdings 223,184 0.00
39,826 Bunge (Pref) 3,639,100 0.03
355,363 Endurance Specialty Holdings 12,345,311 0.10
68,700 Everest Re Group 5,751,564 0.05
10,900 Frontline 245,686 0.00
246,573 IPC Holdings 7,937,185 0.06
3,402,975 Katanga Mining 1,754,981 0.01
124,552 Nabors Industries 2,197,097 0.02
70,500 PartnerRe 5,207,835 0.04
150,000 Platinum Underwriters Holdings 5,469,000 0.04
150,500 RenaissanceRe Holdings 8,163,120 0.07 ___________ ______
61,409,135 0.49 ___________ ______
Brazil
382,800 All America Latina Logistica (Unit) 2,684,147 0.02
721,036 Cia Brasileira de Distribuicao Grupo Pao
de Acucar 'A' (Pref) 17,760,473 0.14
244,573 Cia Energetica de Minas Gerais ADR 3,573,212 0.03
694,400 Cosan 'A' 5,680,192 0.05
532,500 Cyrela Brazil Realty 6,746,344 0.05
257,700 Global Village Telecom Holding 4,613,227 0.04
1,219,700 Hypermarcas 19,502,038 0.15
322,900 MRV Engenharia e Participacoes 5,823,289 0.05
227,700 NET Servicos de Comunicacao (Pref) 2,409,421 0.02
49,305 Pa de Acucar Compania Brasileiria 1,214,475 0.01
81,900 PDG Realty Empreendimentos e
Participacoes 1,181,175 0.01
3,714,550 Petroleo Brasileiro ADR 127,728,280 1.02
1,216,100 SLC Agricola 9,334,641 0.07
163,200 Usinas Siderurgicas de Minas Gerais 'A'
(Pref) 3,857,808 0.03
908,550 Vivo Participacoes ADR 20,751,282 0.17 ___________ ______
232,860,004 1.86 ___________ ______
Canada
1,046,400 Alamos Gold 9,372,851 0.08
799,128 Barrick Gold 27,729,742 0.22
7,400 BCE 179,154 0.00
228,400 Canadian Natural Resources 13,057,628 0.10
545,200 Canadian Pacific Railway 26,474,542 0.21
1,902,600 Eldorado Gold 19,641,376 0.16
10,300 EnCana 539,617 0.01
1,436,500 Goldcorp 52,188,045 0.42
3,788,800 IAMGOLD 43,867,622 0.35
3,562,999 Kinross Gold 67,937,791 0.54
360,036 Kinross Gold (Call Wts 3/9/2013) 1,368,151 0.01
144,600 New Gold 485,379 0.00
750,000 New Gold (Wts 3/4/2012) 20,357 0.00
20,500 Nexen 405,080 0.00
271,300 Nortel Networks 21,704 0.00
421,723 Rogers Communications 11,382,304 0.09
337,100 Rogers Communications 'B' 9,107,251 0.07
1,051,800 Sino-Forest 'A' 13,437,133 0.11
215,370 Suncor Energy 6,627,208 0.05
151,400 Talisman Energy 2,403,796 0.02
41,200 Teck Cominco 'B' 1,002,396 0.01
145,000 TELUS 4,408,045 0.04
19,400 Thomson Reuters 610,518 0.01
437,100 Viterra 3,784,700 0.03
4,253,300 Yamana Gold 38,944,425 0.31 ___________ ______
354,996,815 2.84 ___________ ______
Cayman Islands
635,300 BaWang International Group Holding 228,678 0.00
25,600 Garmin 822,538 0.01
15,301,100 Tianjin Port Development Holdings 5,882,742 0.05
175,293 XL Capital 4,731,157 0.04
2,157,399 XL Capital 'A' 36,697,357 0.29 ___________ ______
48,362,472 0.39 ___________ ______
China
6,261,800 China BlueChemical 'H' 3,352,650 0.03
81,200 China Communications Services 'H' 45,466 0.00
135,933 China Life Insurance ADR 8,616,793 0.07
5,377,400 China Shenhua Energy 'H' 21,680,199 0.17
1,535,200 China South Locomotive and Rolling Stock 905,153 0.01
12,411,600 Guangshen Railway 'H' 5,396,331 0.04
1,069,600 Huaneng Power International 'H' 749,311 0.00
1,069,000 Jiangsu Expressway 'H' 844,054 0.01
609,100 Ping An Insurance Group Company of
China 'H' 4,557,823 0.04
8,014,000 Xiamen International Port 'H' 1,395,803 0.01
100 Yanzhou Coal Mining 'H' 142 0.00 ___________ ______
47,543,725 0.38 ___________ ______

104 BlackRock Global Funds (BGF)
Global Allocation Fund continued
Portfolio of Investments 31 August 2009
Cyprus
1,708,260 AFI Development GDR 3,348,190 0.03 ___________ ______
Egypt
5,015,282 Telecom Egypt 16,614,771 0.13 ___________ ______
Finland
128,383 Fortum OYJ 3,322,256 0.03 ___________ ______
France
221,000 AXA 5,011,599 0.04
13,600 AXA ADR 308,040 0.00
393,000 Cie Generale d'Optique Essilor
International 21,210,290 0.17
42,235 Compagnie Generale des Etablissements
Michelin 6,261,346 0.05
1,125,000 France Telecom* 28,654,256 0.23
20,100 Sanofi-Aventis ADR 684,807 0.01
121,700 Thales 5,535,212 0.05
424,837 Total 24,200,324 0.19
7,000 Total ADR 398,510 0.00 ___________ ______
92,264,384 0.74 ___________ ______
Germany
32,020 Allianz SE 3,685,022 0.03
142,155 Bayer 8,697,929 0.07
86,641 Bayerische Motoren Werke 3,914,026 0.03 ___________ ______
16,296,977 0.13 ___________ ______
Guernsey
26,400 Amdocs 630,168 0.01 ___________ ______
Hong Kong
9,009,409 Beijing Enterprises Holdings 44,401,800 0.35
40,240,192 Chaoda Modern Agriculture 23,881,345 0.19
833,000 Cheung Kong Holdings 9,881,836 0.08
1,662,700 Cheung Kong Infrastructure Holdings 6,049,283 0.05
1,474,300 China Mobile 14,341,617 0.12
8,220,100 Denway Motors 3,658,787 0.03
1,920,400 Hutchison Whampoa 13,502,964 0.11
7,919,800 Link REIT (Reit) 17,451,911 0.14
1,818,386 Noble Group 2,670,362 0.02
582,000 Shanghai Industrial Holdings 2,785,722 0.02
35,177,000 Tianjin Development Holdings 20,604,191 0.16
2,561,100 Wharf Holdings 11,482,125 0.09 ___________ ______
170,711,943 1.36 ___________ ______
India
2,643,591 Adani Power 5,587,681 0.05
410,400 Bharat Heavy Electricals 19,412,567 0.16
124,000 Container Corporation of India 3,009,904 0.02
780,200 Hindustan Unilever 4,153,875 0.03
137,800 Housing Development Finance 6,983,417 0.06
233,000 Larsen & Toubro 7,480,098 0.06
559,000 Reliance Industries 22,956,490 0.18
356,620 State Bank of India 12,730,217 0.10 ___________ ______
82,314,249 0.66 ___________ ______
Indonesia
27,385,635 Bumi Resources 7,878,803 0.06 ___________ ______
Ireland
235,264 Covidien 9,227,054 0.07 ___________ ______
Israel
34,600 Check Point Software Technologies 961,880 0.01
69,090 Ectel 58,727 0.00
422,935 Teva Pharmaceutical Industries ADR 21,590,916 0.17 ___________ ______
22,611,523 0.18 ___________ ______
Italy
106,500 Assicurazioni Generali 2,635,752 0.02
633,200 Intesa Sanpaolo 2,714,371 0.02 ___________ ______
5,350,123 0.04 ___________ ______
Japan
5,818,000 Aioi Insurance 28,781,847 0.23
494,300 Astellas Pharma 19,828,349 0.16
652,000 Canon 25,032,425 0.20
309,700 Coca-Cola Central Japan 4,263,225 0.03
861,856 Coca-Cola West Holdings 16,748,656 0.13
500,600 Daihatsu Motor 5,141,399 0.04
63,200 Daikin Industries 2,229,349 0.02
890,400 Daiwa House Industry 9,930,040 0.08
432,685 East Japan Railway 28,291,927 0.23
44,600 Fanuc 3,640,523 0.03
636,000 Fuji Heavy Industries 2,749,605 0.02
450,400 Fujitsu 3,032,214 0.02
735,700 Futaba Industrial 3,069,867 0.02
405,000 Hitachi Chemical 8,366,995 0.07
224,000 Hokkaido Coca-Cola Bottling 1,190,041 0.01
533,400 Honda Motor 16,836,361 0.13
932,400 HOYA 21,057,590 0.17
1,066,000 JGC 19,798,699 0.16
6,195 KDDI 35,243,911 0.28
897,000 Kinden 8,035,716 0.06
1,474,700 Kirin Holdings 21,616,563 0.17
3,441,100 Kubota 28,458,417 0.23
650,000 Kyowa Hakko Kogyo 7,899,124 0.06
1,296,800 Matsushita Electric Industrial 20,780,040 0.17
406,400 Mikuni Coca-Cola Bottling 3,430,919 0.03
2,219,600 Mitsubishi 44,995,924 0.36
254,800 Mitsubishi Tanabe Pharma 3,345,817 0.03
2,430,400 Mitsui & Co 31,678,710 0.25
540,852 Mitsui Sumitomo Insurance Group
Holdings 15,268,447 0.12
6,074,960 Mizuho Financial Group 14,895,853 0.12
281,900 Murata Manufacturing 13,339,356 0.11
265,100 NGK Insulators 6,186,665 0.05
30,000 Nintendo 8,117,438 0.06
105,800 Nippon Sheet Glass 370,929 0.00
305,000 Nippon Telegraph & Telephone 13,645,212 0.11
4,030,300 Nipponkoa Insurance 25,095,916 0.20
30,158 NTT DoCoMo 46,476,759 0.37
5,100 NTT Urban Development 5,045,975 0.04
2,650,000 Okumura 10,972,200 0.09
135,600 Rinnai 6,737,345 0.05
109,700 Rohm 7,397,096 0.06
2,311,000 Sekisui House 22,219,003 0.18
1,242,800 Seven & I Holdings 30,072,593 0.24
173,300 Shimachu 4,090,913 0.03
717,600 Shin-Etsu Chemical 42,445,556 0.34
497,700 Shionogi & Co 12,203,646 0.10
17,300 Sony ADR 461,045 0.00
10,321,200 Sumitomo Chemical 49,505,353 0.40
242,600 Sumitomo Electric Industries 3,136,046 0.03
435,300 Sumitomo Mitsui Financial Group* 18,772,415 0.15
Transferable Securities Admitted to an Official Stock Exchange
Listing or Dealt in on Another Regulated Market
Holding Description Value (US$) %
Transferable Securities Admitted to an Official Stock Exchange
Listing or Dealt in on Another Regulated Market
Holding Description Value (US$) %

Audited Annual Report and Accounts 105
The notes on pages 236 to 244 form an integral part of these financial statements.
Global Allocation Fund continued
Portfolio of Investments 31 August 2009
1,299,600 Suzuki Motor 31,027,714 0.25
290,000 Tadano 1,425,284 0.01
202,200 Takeda Pharmaceutical 8,154,541 0.07
63,100 TDK 3,671,248 0.03
88,300 Terumo 4,653,116 0.04
1,780,000 Toda 7,178,577 0.06
680,100 Toho / Tokyo 11,402,655 0.09
1,704,700 Tokio Marine Holdings 50,782,589 0.41
4,434,000 Tokyo Gas 17,786,546 0.14
607,900 Toyota Industries 16,409,410 0.13
336,700 Toyota Motor 14,447,847 0.12
3,982,600 Ube Industries 12,335,203 0.10
2,655 West Japan Railway 9,194,064 0.07 ___________ ______
970,398,808 7.76 ___________ ______
Jersey
13,900 Shire ADR 683,880 0.01 ___________ ______
Kazakhstan
1,377,600 KazMunaiGas Exploration Production
GDR* 30,307,200 0.24 ___________ ______
Luxembourg
15,173 ArcelorMittal 542,891 0.00 ___________ ______
Malaysia
488,000 British American Tobacco Malaysia 6,360,671 0.05
8,290,844 IOI 12,030,676 0.10
1,385,300 PLUS Expressways 1,329,630 0.01
2,011,952 Resorts World 1,594,014 0.01
2,239,000 Telekom Malaysia 1,983,714 0.01
3,827,450 Tenaga Nasional 8,716,744 0.07
3,741,525 TM International 3,346,799 0.03 ___________ ______
35,362,248 0.28 ___________ ______
Mexico
293,100 America Movil SAB de CV 'L' ADR 13,297,947 0.11
111,100 Fomento Economico Mexicano SAB de
CV ADR 4,111,811 0.03 ___________ ______
17,409,758 0.14 ___________ ______
Netherlands
615,505 Koninklijke KPN* 9,467,879 0.07
32,000 Koninklijke Philips Electronics 725,120 0.01
168,700 Unilever (NY Shares) 4,671,303 0.04 ___________ ______
14,864,302 0.12 ___________ ______
Norway
608,100 StatoilHydro 13,348,567 0.11 ___________ ______
Philippines
255,300 First Gen 112,490 0.00 ___________ ______
Russian Federation
995,600 Gazprom OAO ADR 21,106,720 0.17
30,563,917 Kuzbassrazrezugol 6,876,881 0.05
693,856 MMC Norilsk Nickel 7,701,802 0.06
2,923,600 Novorossiysk Commercial Sea Port GDR 33,621,400 0.27
469,400 Polyus Gold ADR 9,294,120 0.07
40,172,166 RusHydro – CLS 1,361,836 0.01
8,748,737 RusHydro ADR 29,745,706 0.24
12,282,300 Sberbank 18,214,651 0.15
632,600 Surgutneftegaz ADR 5,440,360 0.04
48,500 Uralkali GDR 926,350 0.01 ___________ ______
134,289,826 1.07 ___________ ______
Singapore
456,050 CapitaLand 1,172,019 0.01
3,736,000 Fraser and Neave 9,963,590 0.08
3,656,200 Keppel 19,273,601 0.15
3,364,840 MobileOne 3,985,738 0.03
1,695,000 Oversea-Chinese Banking 9,087,803 0.07
5,735,380 Parkway Holdings 7,906,122 0.06
150,930 Parkway Life Real Estate Investment
Trust (Reit) 110,823 0.00
2,007,600 SembCorp Marine 4,297,184 0.04
1,889,000 Singapore Press Holdings 4,789,181 0.04
9,586,050 Singapore Telecommunications 20,850,554 0.17 ___________ ______
81,436,615 0.65 ___________ ______
South Africa
37,700 Anglo Platinum 3,299,756 0.02
334,000 Gold Fields ADR 3,987,960 0.03
148,000 Impala Platinum Holdings 3,437,858 0.03
54,200 Sasol 2,068,277 0.02 ___________ ______
12,793,851 0.10 ___________ ______
South Korea
91,300 Cheil Industries 3,742,942 0.03
135,390 Korean Reinsurance 1,230,424 0.01
905,100 KT ADR 14,083,356 0.11
279,000 KT&G 15,034,590 0.12
127,200 LS 8,412,779 0.07
141,206 Meritz Fire & Marine Insurance 883,032 0.01
836,194 Paradise 2,199,453 0.02
16,740 POSCO 6,185,851 0.05
94,500 POSCO ADR 8,703,450 0.07
40,200 Samsung Electronics 24,817,198 0.20
204,100 Samsung Fine Chemicals 8,252,902 0.06
34,060 SK Telecom 4,772,600 0.04 ___________ ______
98,318,577 0.79 ___________ ______
Spain
818,100 Iberdrola Renovables 3,723,256 0.03
404,531 Telefonica 10,216,880 0.08
14,547 Telefonica ADR 1,101,208 0.01 ___________ ______
15,041,344 0.12 ___________ ______
Sweden
10,000 Autoliv 324,500 0.00 ___________ ______
Switzerland
1,029,700 ACE 53,637,073 0.43
103,763 Credit Suisse Group 5,168,583 0.04
842,700 Nestle 34,485,463 0.28
92,546 Novartis 4,271,735 0.03
40,592 Roche Holding Genusscheine 6,467,168 0.05
132,630 Transocean 10,098,448 0.08
146,304 Tyco Electronics 3,351,825 0.03
154,473 Tyco International 4,856,631 0.04
539,900 UBS 9,867,615 0.08
212,300 Weatherford International 4,231,139 0.03
35,813 Zurich Financial Services 7,847,122 0.06 ___________ ______
144,282,802 1.15 ___________ ______
Taiwan
1,658,310 Asustek Computer 2,639,875 0.02
873,000 Catcher Technology 2,254,341 0.02
3,699,956 Chunghwa Telecom 6,339,603 0.05
1,002,127 Chunghwa Telecom ADR 17,226,563 0.14
Transferable Securities Admitted to an Official Stock Exchange
Listing or Dealt in on Another Regulated Market
Holding Description Value (US$) %
Transferable Securities Admitted to an Official Stock Exchange
Listing or Dealt in on Another Regulated Market
Holding Description Value (US$) %

106 BlackRock Global Funds (BGF)
Global Allocation Fund continued
Portfolio of Investments 31 August 2009
5,915,745 Delta Electronics 15,815,340 0.13
246,850 High Tech Computer 2,482,262 0.02
2,680,075 HON HAI Precision Industry 9,037,667 0.07
173,000 MediaTek 2,512,236 0.02
7,463,266 Taiwan Cement 8,094,379 0.06
8,775,792 Taiwan Semiconductor Manufacturing 15,783,178 0.13 ___________ ______
82,185,444 0.66 ___________ ______
Thailand
4,393,400 Hana Microelectronics 2,557,756 0.02
1,407,604 PTT 10,098,655 0.08
5,222,100 Siam Commercial Bank 11,823,039 0.10 ___________ ______
24,479,450 0.20 ___________ ______
United Kingdom
12,800 AstraZeneca ADR 598,912 0.01
2,167,505 BP 18,717,901 0.15
691,700 BP ADR 35,511,878 0.28
204,122 British American Tobacco 6,209,331 0.05
201,408 Cadbury ADR 7,619,265 0.06
743,000 Diageo ADR 45,895,110 0.37
17,049,054 Guinness Peat Group 9,745,696 0.08
4,538,900 HSBC Holdings 49,217,745 0.39
170,300 HSBC Holdings ADR 9,150,219 0.07
2,012,100 Lloyds TSB Group 3,636,522 0.03
307,100 Prudential 2,676,945 0.02
194,312 Unilever 5,299,005 0.04
235,800 Unilever ADR 6,394,896 0.05
8,601,705 Vodafone Group 18,542,489 0.15
606,998 Vodafone Group ADR 13,141,507 0.11 ___________ ______
232,357,421 1.86 ___________ ______
United States
3,034,535 3Com 12,896,774 0.10
307,666 3M 21,979,659 0.18
781,803 Abbott Laboratories 35,618,945 0.28
14,700 Advance Auto Parts 621,810 0.01
856,300 Aetna† 24,584,373 0.20
10,900 Affiliated Computer Services 'A' 490,609 0.00
161,039 Alliance Resource Partners 5,314,287 0.04
197,626 Allstate 5,770,679 0.05
758,320 Altria Group 13,801,424 0.11
286,412 American Commercial Lines 5,983,147 0.05
159,600 American Water Works 3,214,344 0.03
208,500 AmerisourceBergen 4,399,350 0.04
268,300 Amgen 15,969,216 0.13
52,200 Amphenol 'A' 1,809,252 0.01
325,220 Anadarko Petroleum 17,330,974 0.14
90,900 Analog Devices 2,574,288 0.02
217,674 Apache 18,517,527 0.15
179,300 Apple† 30,079,547 0.24
17,900 Archer-Daniels-Midland 506,033 0.00
870 Ascent Media 'A' 22,115 0.00
3,751,785 AT&T 97,658,964 0.78
73,900 Autodesk 1,732,955 0.01
7,500 Avnet 196,350 0.00
245,500 Avon Products† 7,875,640 0.06
1,530,200 Bank of America† 27,053,936 0.22
1,753,316 Bank of New York Mellon 50,039,639 0.40
85,300 Baxter International 4,863,806 0.04
11,000 Biogen Idec 544,390 0.00
57,200 BMC Software 2,004,288 0.02
663,100 Boeing 32,969,332 0.26
431,500 Boston Scientific 4,923,415 0.04
5,022,039 Bristol-Myers Squibb 109,028,467 0.87
174,700 Broadcom 'A' 4,947,504 0.04
68,404 Bunge 4,615,902 0.04
695,000 Burlington Northern Santa Fe† 57,587,700 0.46
1,275,527 CA 28,482,518 0.23
50,700 Calpine 609,414 0.01
245,000 Cell Genesys 76,244 0.00
74,819 CenturyTel 2,423,387 0.02
7,400 CF Industries Holdings 601,990 0.00
1,106,618 Chevron 77,142,341 0.62
319,200 Chubb 15,583,344 0.12
889,700 Cigna† 26,130,489 0.21
2,160,100 Cisco Systems 46,766,165 0.37
1,501,792 Citigroup 7,478,924 0.06
285,200 CMS Energy 3,867,312 0.03
5,500 CNA Financial 131,780 0.00
171,108 CNX Gas 4,751,669 0.04
224,700 Coca-Cola 10,999,065 0.09
89,400 Cognizant Technology Solutions 'A' 3,103,074 0.02
2,485,761 Comcast 'A' 38,877,302 0.31
716,350 Complete Production Services† 6,461,477 0.05
61,300 Computer Sciences 3,012,282 0.02
163,300 ConAgra Foods 3,329,687 0.03
833,290 ConocoPhillips 37,498,050 0.30
1,489,200 Consol Energy† 55,696,080 0.45
163,200 Constellation Brands 'A' 2,449,632 0.02
2,356,100 Corning 35,789,159 0.29
244,100 Crown Holdings 6,100,059 0.05
425,400 CVS/Caremark 15,688,752 0.13
215,097 DaVita 11,004,363 0.09
534,800 Dell 8,332,184 0.07
305,690 Devon Energy 18,527,871 0.15
1,150 Discover Financial Services 15,560 0.00
6,500 Discovery Communications 'A' 168,480 0.00
7,600 Discovery Communications 'C' 177,764 0.00
246,000 DISH Network 'A' 4,041,780 0.03
13,100 Dover 452,474 0.00
870,400 Dow Chemical 18,591,744 0.15
105,756 Dr Pepper Snapple Group 2,816,282 0.02
442,600 eBay 9,790,356 0.08
18,000 Edison International 598,680 0.00
604,100 EI Du Pont de Nemours & Co 19,258,708 0.15
2,107,932 El Paso 19,645,926 0.16
527,200 Electronic Arts† 9,566,044 0.08
362,420 Eli Lilly & Co 12,104,828 0.10
728,300 EMC/Massachusetts 11,492,574 0.09
75,402 Endo Pharmaceuticals Holdings 1,709,740 0.01
53,500 ENSCO International 1,993,410 0.02
190,500 Entergy 15,011,400 0.12
255,600 Exelon 12,759,552 0.10
23,165 Extreme Networks 56,754 0.00
1,441,512 Exxon Mobil 100,343,650 0.80
22,774 Fairpoint Communications 15,486 0.00
18,300 Family Dollar Stores 553,758 0.00
1,312,925 Fidelity National Financial 'A' 19,693,875 0.16
77,200 Fidelity National Information Services 1,884,452 0.02
11,900 Fluor 620,942 0.01
337,500 FMC 16,162,875 0.13
110,700 Forest Laboratories 3,209,193 0.03
413,924 Foster Wheeler 11,981,568 0.10
465,672 FPL Group 26,086,945 0.21
12,555 Freeport-McMoRan Copper & Gold (Pref) 17,705,689 0.14
33,700 Gap 661,194 0.01
168,800 General Communication 'A' 1,110,704 0.01
Transferable Securities Admitted to an Official Stock Exchange
Listing or Dealt in on Another Regulated Market
Holding Description Value (US$) %
Transferable Securities Admitted to an Official Stock Exchange
Listing or Dealt in on Another Regulated Market
Holding Description Value (US$) %

Audited Annual Report and Accounts 107
The notes on pages 236 to 244 form an integral part of these financial statements.
Global Allocation Fund continued
Portfolio of Investments 31 August 2009
13,900 General Dynamics 821,212 0.01
2,192,780 General Electric 30,238,436 0.24
158,900 General Mills 9,383,045 0.08
325,700 Genzyme 17,692,024 0.14
237,800 Gilead Sciences 10,670,086 0.09
1,982,885 Global Industries 19,273,642 0.15
648,900 Golden Star Resources 1,655,639 0.01
83,900 Goldman Sachs Group 13,569,147 0.11
11,700 Goodrich 641,160 0.01
100,000 Google 'A' 45,827,000 0.37
370,200 Halliburton 8,699,700 0.07
16,537 Hanesbrands 343,308 0.00
40,500 Harris 1,399,275 0.01
234,030 Healthsouth 3,568,958 0.03
219,738 Hess 11,096,769 0.09
13,400 Hewitt Associates 'A' 480,524 0.00
304,200 Hewlett-Packard 13,512,564 0.11
159,500 HJ Heinz 6,105,660 0.05
1,629,500 Hologic 26,414,195 0.21
5,500 Honeywell International 201,960 0.00
670,200 Humana† 23,792,100 0.19
534,939 International Business Machines 62,726,947 0.50
716,700 International Game Technology 14,620,680 0.12
215,434 International Paper 4,771,863 0.04
142,757 Invitrogen 6,409,789 0.05
82,225 JDS Uniphase 563,241 0.00
1,486,420 Johnson & Johnson 89,423,027 0.72
2,142,450 JPMorgan Chase & Co† 91,525,464 0.73
300,000 KBR 6,810,000 0.05
229,800 Key Energy Services 1,633,878 0.01
113,700 King Pharmaceuticals 1,180,206 0.01
1,186,615 Kraft Foods 'A' 33,438,811 0.27
3,400 L-3 Communications Holdings 250,886 0.00
327,000 Lexmark International 'A' 6,157,410 0.05
47 Liberty Media – Capital 'A' 891 0.00
188 Liberty Media – Entertainment 'A' 5,196 0.00
9,365 Liberty Media – Interactive 'A' 87,001 0.00
180,089 Lockheed Martin 13,414,830 0.11
88,787 LSI 456,365 0.00
74,900 Macquarie Infrastructure 449,400 0.00
3,600 Manpower 186,120 0.00
796,112 Marathon Oil 24,496,366 0.20
38,700 Marsh & McLennan 907,128 0.01
562,100 Mattel 10,072,832 0.08
387,200 McDermott International 9,103,072 0.07
252,300 McDonald's 14,078,340 0.11
20,200 McGraw-Hill Companies 667,408 0.01
183,100 McKesson 10,297,544 0.08
231,900 Mead Johnson Nutrition 'A' 9,338,613 0.07
287,800 Medco Health Solutions 15,742,660 0.13
963,795 Medtronic 36,739,865 0.29
66,800 MEMC Electronic Materials 1,067,464 0.01
1,137,728 Merck & Co 36,680,351 0.29
258,634 Metlife† 9,750,502 0.08
51,100 Mettler Toledo International 4,474,827 0.04
5,315,315 Microsoft† ‡ 130,277,839 1.04
504,100 Morgan Stanley† 14,331,563 0.11
1,831,811 Motorola 13,042,494 0.10
104,500 Murphy Oil 5,957,545 0.05
727,163 Mylan† 10,609,308 0.08
8,353 Mylan (Pref) 8,083,615 0.07
485,845 National Oilwell Varco 17,616,740 0.14
77,200 National Semiconductor 1,162,632 0.01
973,601 Newmont Mining 39,226,384 0.31
873,300 News 9,440,373 0.08
18,700 Noble 654,126 0.01
5,900 Noble Energy 357,009 0.00
586,448 Northern Trust 33,972,933 0.27
11,100 Northrop Grumman 540,459 0.00
155,000 Novell 667,275 0.01
3,852 NRG Energy 5,345,613 0.04
371,886 Occidental Petroleum 27,173,710 0.22
1,241,000 Oracle 27,314,410 0.22
41,200 Pall 1,221,168 0.01
81,100 Panera Bread 'A' 4,244,182 0.03
8,400 Pepsi Bottling Group 299,796 0.00
57,000 PepsiAmericas 1,593,150 0.01
188,400 PerkinElmer 3,400,620 0.03
171,500 Perrigo 5,007,800 0.04
3,518,939 Pfizer 58,519,956 0.47
7,095 PharMerica 141,403 0.00
472,490 Philip Morris International 21,526,644 0.17
20,300 Pitney Bowes 455,532 0.00
1,277,700 Polycom† 29,719,302 0.24
249,200 PPL 7,301,560 0.06
35,100 Praxair 2,679,534 0.02
156,300 Precision Castparts 14,231,115 0.11
22,100 Pride International 566,423 0.00
181,500 Principal Financial Group 5,100,150 0.04
1,027,406 Procter & Gamble 54,565,533 0.44
422,851 Progressive 6,960,127 0.06
604,518 QUALCOMM 27,970,322 0.22
3,569,955 Qwest Communications International 13,101,735 0.10
35,159 Ralcorp Holdings 2,201,305 0.02
8,000 Reynolds American 364,560 0.00
17,700 Ross Stores 825,710 0.01
19,000 Ryder System 721,810 0.01
22,000 Safeway 420,200 0.00
1,763,200 Sara Lee 17,067,776 0.14
1,170,300 Schering-Plough 32,862,024 0.26
416,600 Schlumberger 23,421,252 0.19
1,473 Seahawk Drilling 33,894 0.00
83,100 Smith International 2,311,011 0.02
97,296 Southern 3,045,365 0.02
1,096,800 Spirit Aerosystems Holdings 'A' 16,989,432 0.14
1,397,950 Sprint Nextel 5,200,374 0.04
478,600 St Joe 15,525,784 0.12
75,000 Stone Energy 961,500 0.01
407,925 Sun Microsystems 3,801,861 0.03
4,000 Sunoco 106,600 0.00
63,928 SUPERVALU 911,613 0.01
27,900 Synopsys 591,899 0.00
65,100 Tellabs 415,331 0.00
68,700 Teradata 1,848,717 0.02
399,300 Texas Instruments 9,794,829 0.08
227,800 Thermo Fisher Scientific 10,219,108 0.08
231,646 Time Warner 6,499,987 0.05
58,128 Time Warner Cable 2,153,642 0.02
59,600 Total System Services 906,516 0.01
84,800 Transatlantic Holdings 4,136,544 0.03
589,379 Travelers 29,162,473 0.23
519,400 Unifi 1,121,904 0.01
759,969 Union Pacific 45,605,740 0.36
90,996 United Technologies 5,377,864 0.04
1,350,500 UnitedHealth Group† 37,503,385 0.30
28,400 Unum Group 637,864 0.01
11,600 URS 497,640 0.00
1,276,600 US Bancorp 28,480,946 0.23
23,800 Valero Energy 439,110 0.00
30,100 VeriSign 645,645 0.01
Transferable Securities Admitted to an Official Stock Exchange
Listing or Dealt in on Another Regulated Market
Holding Description Value (US$) %
Transferable Securities Admitted to an Official Stock Exchange
Listing or Dealt in on Another Regulated Market
Holding Description Value (US$) %

108 BlackRock Global Funds (BGF)
Global Allocation Fund continued
Portfolio of Investments 31 August 2009
2,096,100 Verizon Communications 64,455,075 0.52
922,933 Viacom 'B' 23,230,224 0.19
1,400 WABCO Holdings 26,810 0.00
1,110,525 Wal-Mart Stores 56,903,301 0.46
204,721 Waters 10,311,797 0.08
608,300 WellPoint† 32,239,900 0.26
1,855,400 Wells Fargo & Co 50,708,082 0.41
91,000 Western Digital 3,059,420 0.02
285,400 Western Union 5,268,484 0.04
205,444 Windstream 1,752,437 0.01
732,998 Wyeth 35,029,974 0.28
2,091,700 Xerox 18,093,205 0.14
23,500 Xilinx 520,995 0.00
240,900 Xto Energy 9,252,969 0.07 _____________ ______
3,429,682,991 27.42 _____________ ______
Total Common / Preferred Stocks (Shares)
& Warrants 6,592,200,581 52.70 _____________ ______
BONDS
Australia
A$32,520,000 Australia Government Bond 5.75%
15/6/2011 27,750,134 0.22 _____________ ______
Bermuda
SGD38,000,000 Celestial Nutrifoods 0% 12/6/2011 18,425,950 0.15
CNY206,700,000 Gome Electrical Appliances Holdings
0% 18/5/2014 (Zero Coupon) 28,974,723 0.23
US$18,562,000 Noble Group 8.5% 30/5/2013 19,397,290 0.15
CNY181,600,000 Pine Agritech 0% 27/7/2012 23,395,835 0.19 _____________ ______
90,193,798 0.72 _____________ ______
Brazil
BRL30,700,000 Brazil Notas do Tesouro Nacional
Serie B 6% 15/5/2017 29,910,033 0.24
BRL35,000,000 Brazil Notas do Tesouro Nacional
Serie F 10% 1/7/2010 19,030,821 0.15
BRL192,898,000 Brazil Notas do Tesouro Nacional
Serie F 10% 1/1/2017 90,972,105 0.73 _____________ ______
139,912,959 1.12 _____________ ______
British Virgin Islands
US$9,875,000 CITIC Resources Finance 2007 6.75%
15/5/2014 9,356,563 0.07
US$4,700,000 Hongkong Land CB 2005 2.75%
21/12/2012 5,666,790 0.05
US$12,525,000 Mandra Forestry Finance 12%
15/5/2013 10,008,158 0.08
US$1,000,000 Mandra Forestry Finance '144A'
12% 15/5/2013 805,000 0.01 _____________ ______
25,836,511 0.21 _____________ ______
Canada
US$11,600,000 Addax Petroleum 'AXC' 3.75%
31/5/2012 13,362,139 0.11
C$16,300,000 Canadian Government Bond 4%
1/9/2010 15,253,472 0.12
C$15,450,000 Canadian Government Bond 4%
1/6/2016 14,918,784 0.12
US$1,339,000 Sino-Forest '144A' 10.25%
28/7/2014 1,379,548 0.01 _____________ ______
44,913,943 0.36 _____________ ______
Cayman Islands
US$9,241,000 Chaoda Modern Agriculture 7.75%
8/2/2010 9,079,283 0.07
US$15,900,000 China Milk Products Group 0%
5/1/2012 (Zero Coupon) 17,410,500 0.14
US$4,250,000 Cosan Finance '144A' 7% 1/2/2017 4,016,250 0.03
US$1,167,000 DBS Capital Funding 7.657% 15/3/2011
(Perpetual) 1,188,881 0.01
CNY103,700,000 FU JI Food and Catering Services
Holdings 0% 18/10/2010
(Zero coupon) 10,778,967 0.09
US$4,644,000 Hutchison Whampoa International
03/33 5.45% 24/11/2010 4,852,745 0.04
US$5,528,000 Hutchison Whampoa International
03/33 6.25% 24/1/2014 5,988,278 0.05
US$12,410,000 Hutchison Whampoa International
09 7.625% 9/4/2019 14,187,112 0.11
US$3,700,000 Latitude CLO '2005-1X SUB' 0%
15/12/2017 37,000 0.00
US$9,200,000 Subsea 7 0% 29/6/2017 8,997,600 0.07
US$12,500,000 Subsea 7 2.8% 6/6/2011 11,550,000 0.09
US$34,354,000 Transocean 'A' 1.625% 15/12/2037 33,280,438 0.27
US$63,317,000 Transocean 'B' 1.5% 15/12/2037 59,834,565 0.48
US$10,009,000 Transocean 'C' 1.5% 15/12/2037 9,245,814 0.08
US$14,600,000 YTL Power Finance Cayman 0%
9/5/2010 (Zero coupon) 17,520,000 0.14
¥3,092,000,000 Zeus Cayman 0% 19/8/2013 31,756,305 0.25 _____________ ______
239,723,738 1.92 _____________ ______
China
HKD120,100,000 China Petroleum & Chemical 0%
24/4/2014 16,910,945 0.14 _____________ ______
France
€12,700,000 Caisse d'Amortissement de la Dette
Sociale 3.25% 25/4/2013 18,667,531 0.15
€12,500,000 Caisse d'Amortissement de la Dette
Sociale 4% 25/10/2014 18,836,612 0.15
€6,000,000 Unedic 3% 2/2/2010 8,611,313 0.07 _____________ ______
46,115,456 0.37 _____________ ______
Germany
€1,500,000 Bundesrepublik Deutschland '08'
4.25% 4/7/2018 2,319,926 0.02
€62,856,000 Bundesrepublik Deutschland 3.5%
4/7/2019 91,580,908 0.73
€79,250,000 Bundesrepublik Deutschland 4%
4/7/2016 121,011,205 0.97
€18,500,000 Bundesrepublik Deutschland 4%
4/1/2018 28,102,487 0.22
€44,900,000 Bundesrepublik Deutschland 4.25%
4/7/2017 69,434,770 0.56
€34,900,000 Bundesschatzanweisungen 4.75%
11/6/2010 51,462,533 0.41
€10,900,000 Deutsche Bundesrepublik Inflation
Linked 1.5% 15/4/2016 17,069,551 0.14
€18,760,000 Kreditanstalt fuer Wiederaufbau
0.5% 3/2/2010 26,719,367 0.21
€33,700,000 Kreditanstalt fuer Wiederaufbau
3.25% 27/6/2013 50,268,495 0.40 _____________ ______
457,969,242 3.66 _____________ ______
Transferable Securities Admitted to an Official Stock Exchange
Listing or Dealt in on Another Regulated Market
Holding Description Value (US$) %
Transferable Securities Admitted to an Official Stock Exchange
Listing or Dealt in on Another Regulated Market
Holding Description Value (US$) %

Audited Annual Report and Accounts 109
The notes on pages 236 to 244 form an integral part of these financial statements.
Global Allocation Fund continued
Portfolio of Investments 31 August 2009
India
US$4,900,000 Gujarat NRE Coke 0% 12/4/2011
(Zero coupon) 5,169,500 0.04
US$9,400,000 Housing Development Finance 0%
27/9/2010 (Zero coupon) 15,110,500 0.12
US$8,000,000 Punj Lloyd 0% 8/4/2011 (Zero coupon) 8,960,000 0.07
US$8,941,000 Ranbaxy Laboratories 0% 18/3/2011 10,020,563 0.08
US$15,210,000 Reliance Communications 0%
10/5/2011 (Zero coupon) 17,529,525 0.14
US$45,000,000 Reliance Communications 0% 1/3/2012
(Zero coupon) 47,081,250 0.38
US$8,825,000 Suzlon Energy 0% 12/6/2012 8,150,717 0.07
US$17,250,000 Suzlon Energy 0% 11/10/2012
(Zero coupon) 15,641,067 0.13
US$14,500,000 Suzlon Energy 0% 25/7/2014
(Zero coupon) 14,384,000 0.11
US$2,900,000 Tata Motors 0% 12/7/2012
(Zero coupon) 2,946,715 0.02
US$9,925,000 Tata Motors '2' 1% 27/4/2011 10,719,000 0.09
US$10,500,000 Tata Steel 1% 5/9/2012 11,291,700 0.09 _____________ ______
167,004,537 1.34 _____________ ______
International
€9,084,000 European Investment Bank 3.625%
15/10/2011 13,506,765 0.11 _____________ ______
Ireland
US$3,179,000 TransCapitalInvest for OJSC AK
Transneft 5.67% 5/3/2014 3,091,578 0.02
US$3,850,000 TransCapitalInvest for OJSC AK
Transneft 6.103% 27/6/2012 3,875,410 0.03
US$10,881,000 VIP Finance Ireland for OJSC
Vimpel Communications 8.375%
30/4/2013 10,867,399 0.09
US$37,344,000 VIP Finance Ireland for OJSC
Vimpel Communications 9.125%
30/4/2018 37,670,760 0.30 _____________ ______
55,505,147 0.44 _____________ ______
Japan
¥569,000,000 Bank of Kyoto 1.9% 30/9/2009 8,793,386 0.07
¥514,000,000 Bank of Kyoto '2' 0% 31/3/2014 5,821,917 0.05
¥2,512,900,000 Japan Government Two Year Bond '272'
0.7% 15/9/2010 27,173,426 0.22
¥2,770,500,000 Japanese Government CPI Linked
Bond 0.8% 10/9/2015 27,639,820 0.22
¥4,467,200,000 Japanese Government CPI Linked
Bond 0.8% 10/12/2015 44,354,357 0.35
¥12,332,300,000 Japanese Government CPI Linked
Bond 0.8% 10/3/2016 121,314,934 0.97
¥1,600,000,000 Japanese Government CPI Linked
Bond '16' 1.4% 10/6/2018 15,717,116 0.12
¥200,000,000 Japanese Government CPI Linked
Bond '8' 1% 10/6/2016 1,985,082 0.02
¥113,000,000 Mie Bank 1% 31/10/2011 1,177,200 0.01
¥73,000,000 Nagoya Railroad '9' 0% 30/3/2012 812,550 0.01
¥1,895,000,000 Suzuki Motor '4' 0% 29/3/2013 21,221,989 0.17 _____________ ______
276,011,777 2.21 _____________ ______
Jersey
US$25,800,000 Aldar Funding 5.767% 10/11/2011 27,767,250 0.22
US$84,890,000 Dana Gas Sukuk 7.5% 31/10/2012 75,552,100 0.60
US$24,978,000 Shire 2.75% 9/5/2014 23,498,054 0.19
US$1,349,000 SOCO Finance Jersey 4.5%
16/5/2013 1,335,959 0.01 _____________ ______
128,153,363 1.02 _____________ ______
Luxembourg
US$4,800,000 Acergy 'ACY' 2.25% 11/10/2013 4,116,000 0.03
US$5,364,000 ALROSA Finance 8.875% 17/11/2014 5,256,720 0.04
US$3,600,000 Evraz Group 8.25% 10/11/2015 3,186,328 0.03
US$7,900,000 Evraz Group 8.875% 24/4/2013 7,261,680 0.06
US$12,895,000 Evraz Group 9.5% 24/4/2018 11,535,609 0.09
¥700,000,000 Gaz Capital 2.89% 15/11/2012 6,435,227 0.05
€4,175,000 Gaz Capital 5.136% 22/3/2017 5,217,717 0.04
€3,166,000 Gaz Capital 5.364% 31/10/2014 4,322,071 0.04
€3,114,000 Gaz Capital 5.44% 2/11/2017 3,905,234 0.03
€1,670,000 Gaz Capital 5.875% 1/6/2015 2,287,499 0.02
€16,702,000 Gaz Capital 6.605% 13/2/2018 22,111,641 0.18
US$1,700,000 Gaz Capital 8.146% 11/4/2018 1,691,500 0.01
US$6,228,000 Gaz Capital 8.625% 28/4/2034 6,564,312 0.05
US$530,000 TNK-BP Finance '144A' 7.875%
13/3/2018 498,863 0.00
US$3,736,000 TNK-BP Finance 6.125% 20/3/2012 3,670,620 0.03
US$24,021,000 TNK-BP Finance 6.625% 20/3/2017 21,618,900 0.17
US$2,291,000 TNK-BP Finance 7.5% 13/3/2013 2,291,000 0.02
US$7,442,000 TNK-BP Finance 7.5% 18/7/2016 7,107,110 0.06
US$31,381,000 TNK-BP Finance 7.875% 13/3/2018 29,554,626 0.24
US$7,885,000 UBS Luxembourg for OJSC
Vimpel Communications 8.25%
23/5/2016 7,648,450 0.06 _____________ ______
156,281,107 1.25 _____________ ______
Malaysia
US$18,300,000 Cherating Capital 2% 5/7/2012 19,650,540 0.16
US$8,500,000 Feringghi Capital 0% 22/12/2009
(Zero coupon) 9,759,700 0.08
US$19,625,000 IOI Capital 0% 18/12/2011
(Zero coupon) 23,402,813 0.19
US$15,250,000 IOI Resources (Labuan) 0% 15/1/2013 14,818,425 0.12
MYR73,243,000 Johor 'P3' 1% 31/7/2012 20,382,742 0.16
MYR83,369,000 Malaysia Government Bond 3.756%
28/4/2011 24,170,255 0.19
MYR70,069,000 Malaysia Government Bond 3.869%
13/4/2010 20,120,250 0.16
US$7,900,000 Paka Capital 0% 12/3/2013 7,791,375 0.06
US$30,000,000 Rafflesia Capital 1.25% 4/10/2011 35,025,000 0.28 _____________ ______
175,121,100 1.40 _____________ ______
Netherlands
US$1,300,000 ASM International 4.25% 6/12/2011 1,343,940 0.01
€5,700,000 Heidelberg International Finance
0.875% 9/2/2012 8,805,374 0.07
US$51,100,000 KazMunaiGaz Finance Sub 9.125%
2/7/2018 49,567,000 0.40
€12,750,000 Netherlands Government Bond 3.75%
15/7/2014 19,142,474 0.15
CHF13,000,000 Pargesa Netherlands 1.75%
15/6/2014 10,824,099 0.09 _____________ ______
89,682,887 0.72 _____________ ______
New Zealand
NZD6,250,000 New Zealand Government Bond
4.5% 15/2/2016 6,134,270 0.05 _____________ ______
Transferable Securities Admitted to an Official Stock Exchange
Listing or Dealt in on Another Regulated Market
Holding Description Value (US$) %
Transferable Securities Admitted to an Official Stock Exchange
Listing or Dealt in on Another Regulated Market
Holding Description Value (US$) %

110 BlackRock Global Funds (BGF)
Global Allocation Fund continued
Portfolio of Investments 31 August 2009
Philippines
US$14,000,000 First Gen 2.5% 11/2/2013 13,720,000 0.11 _____________ ______
Poland
PLN71,360,000 Poland Government Bond 3%
24/8/2016 27,056,161 0.21 _____________ ______
Singapore
SGD35,250,000 CapitaLand 2.1% 15/11/2016 22,540,115 0.18
SGD57,500,000 CapitaLand 2.95% 20/6/2022 30,619,721 0.24
SGD42,000,000 CapitaLand 3.125% 5/3/2018 27,166,154 0.22
SGD13,200,000 Keppel Land 2.5% 23/6/2013 9,017,979 0.07
US$15,500,000 Wilmar International 0% 18/12/2012 20,508,050 0.16
SGD27,500,000 Yanlord Land Group 5.85%
13/7/2014 20,754,940 0.17 _____________ ______
130,606,959 1.04 _____________ ______
South Korea
¥1,420,000,000 Korea Electric Power 0% 23/11/2011 15,304,877 0.12
US$15,022,000 Korea Electric Power 5.125%
23/4/2034 15,079,497 0.12 _____________ ______
30,384,374 0.24 _____________ ______
Sweden
TRY9,250,000 Svensk Exportkredit AB 10.5%
30/9/2015 5,736,921 0.04 _____________ ______
Trinidad
US$5,149,000 Petroleum Company of Trinidad &
Tobago 9.75% 14/8/2019 5,586,665 0.04 _____________ ______
United Arab Emirates
US$2,452,000 Abu Dhabi National Energy 6.5%
27/10/2036 2,234,385 0.02
US$25,712,000 Nakheel Development 2 2.75%
16/1/2011 18,319,800 0.15
US$42,988,000 Nakheel Development 3.1725%
14/12/2009 40,462,455 0.32 _____________ ______
61,016,640 0.49 _____________ ______
United Kingdom
€4,624,000 Lloyds TSB Bank 13% 22/1/2019
(Perpetual) 6,276,948 0.05
£63,200,000 United Kingdom Gilt 4.25% 7/3/2011 107,864,547 0.86 _____________ ______
114,141,495 0.91 _____________ ______
United States
US$136,565,000 Advanced Micro Devices 6% 1/5/2015 92,693,494 0.74
US$544,000 Advanced Micro Devices 7.75%
1/11/2012 452,880 0.00
£437,000 AES 8.375% 1/3/2011 707,587 0.01
US$43,287,000 Amgen 0.375% 1/2/2013 42,800,021 0.34
US$8,677,000 Archer-Daniels-Midland 0.875%
15/2/2014 8,405,844 0.07
US$368,000 Cell Genesys 3.125% 1/5/2013 168,576 0.00
US$28,387,000 Chesapeake Energy 2.25% 15/12/2038 19,622,514 0.15
US$27,728,000 Chesapeake Energy 2.5% 15/5/2037 22,182,400 0.18
US$1,210,000 Crown Cork & Seal 7.5% 15/12/2096 974,050 0.01
US$4,982,000 General Cable 1% 15/10/2012 4,216,018 0.03
¥2,600,000,000 General Electric Capital FRN
15/1/2010 27,804,789 0.22
US$6,621,000 Greenbrier 2.375% 15/5/2026 4,758,844 0.04
US$1,945,000 Helix Energy Solutions Group 3.25%
15/12/2025 1,667,838 0.01
US$64,335,000 Hologic 2% 15/12/2037
(Step-up coupon) 51,870,094 0.42
US$13,873,000 Intel 2.95% 15/12/2035 12,398,994 0.10
US$4,640,000 McMoRan Exploration 5.25%
6/10/2011 4,355,800 0.04
US$3,132,000 Medtronic 1.5% 15/4/2011 3,132,000 0.03
US$31,625,000 Medtronic 1.625% 15/4/2013 31,387,813 0.25
US$4,780,000 Millipore 3.75% 1/6/2026 4,827,800 0.04
US$27,528,000 Mylan 1.25% 15/3/2012 25,566,630 0.20
US$1,000,000 Nabi Biopharmaceuticals 2.875%
15/4/2025 955,000 0.01
US$3,025,000 Nextel Communications 5.25%
15/1/2010 3,040,125 0.02
€29,200,000 Pemex Project Funding Master Trust
5.5% 24/2/2025 35,126,298 0.28
US$4,700,000 Preferred Term Securities FRN
22/10/2037 470 0.00
US$5,100,000 Preferred Term Securities XXII 0%
22/3/2037 510 0.00
US$6,700,000 Preferred Term Securities XXV FRN
22/6/2037 670 0.00
US$5,600,000 Preferred Term Securities XXVII FRN
22/12/2037 185,360 0.00
US$41,965,000 SanDisk 1% 15/5/2013 31,001,644 0.25
US$5,870,000 SonoSite 3.75% 15/7/2014 5,363,713 0.04
US$2,200,000 Tenet Healthcare 9.25% 1/2/2015 2,123,000 0.02
US$39,560,000 US Treasury Bill 0% 3/9/2009 39,559,881 0.32
US$113,105,000 US Treasury Bill 0% 10/9/2009 113,103,417 0.90
US$13,825,000 US Treasury Bill 0% 17/9/2009 13,824,530 0.11
US$52,510,000 US Treasury Bill 0% 24/9/2009 52,506,429 0.42
US$71,925,000 US Treasury Bill 0% 1/10/2009 71,919,929 0.58
US$189,000,000 US Treasury Bill 0% 8/10/2009 188,983,085 1.51
US$141,095,000 US Treasury Bill 0% 15/10/2009 141,079,691 1.13
US$23,760,000 US Treasury Bill 0% 22/10/2009 23,756,400 0.19
US$71,600,000 US Treasury Bill 0% 29/10/2009 71,587,434 0.57
US$74,667,000 US Treasury Bill 0% 5/11/2009 74,653,299 0.60
US$85,033,000 US Treasury Bill 0% 12/11/2009 85,012,294 0.68
US$152,650,000 US Treasury Bill 0% 19/11/2009 152,606,953 1.22
US$61,300,000 US Treasury Bill 0% 27/11/2009 61,280,966 0.49
US$46,390,000 US Treasury Bond 2.125% 31/1/2010 46,755,140 0.37
US$138,396,000 US Treasury Bond 2.375% 31/8/2014 138,060,822 1.10
US$38,160,000 US Treasury Bond 2.625% 29/2/2016 37,411,706 0.30
US$82,022,000 US Treasury Bond 2.75% 15/2/2019 77,429,089 0.62
US$107,040,000 US Treasury Bond 2.75% 31/7/2010 109,348,319 0.87
US$73,365,000 US Treasury Bond 2.875% 30/6/2010 74,888,184 0.60
US$49,963,000 US Treasury Bond 4.875% 31/5/2011 53,439,917 0.43
US$79,395,000 US Treasury Inflation Indexed Bonds
0.875% 15/4/2010 90,398,806 0.72
US$39,728,000 US Treasury Inflation Indexed Bonds
1.625% 15/1/2018 40,566,971 0.32
US$9,288,000 US Treasury Inflation Indexed Bonds
2% 15/4/2012 10,108,930 0.08
US$105,782,000 US Treasury Inflation Indexed Bonds
2% 15/1/2016 117,242,269 0.94
US$135,600,000 US Treasury Inflation Indexed Bonds
2.375% 15/4/2011 150,928,292 1.21
US$10,930,000 US Treasury Inflation Indexed Bonds
2.375% 15/1/2017 12,225,824 0.10
Transferable Securities Admitted to an Official Stock Exchange
Listing or Dealt in on Another Regulated Market
Holding Description Value (US$) %
Transferable Securities Admitted to an Official Stock Exchange
Listing or Dealt in on Another Regulated Market
Holding Description Value (US$) %

Audited Annual Report and Accounts 111
The notes on pages 236 to 244 form an integral part of these financial statements.
(*) Securities lent, see Note 11, for further details.(†) Securities pledged, see Note 12, for further details.(‡) Securities given in guarantee, see Note 12, for further details.
Global Allocation Fund continued
Portfolio of Investments 31 August 2009
US$54,224,000 US Treasury Inflation Indexed Bonds
2.375% 15/1/2027 59,692,321 0.48
US$148,876,000 US Treasury Inflation Indexed Bonds
2.5% 15/7/2016 167,456,901 1.34 _____________ ______
2,713,618,575 21.70 _____________ ______
Total Bonds 5,258,595,469 42.04 _____________ ______
Total Transferable Securities Admitted
to an Official Stock Exchange Listing or
Dealt in on Another Regulated Market 12,341,838,980 98.67 _____________ ______
Unquoted Securities
COMMON / PREFERRED STOCKS (SHARES) & WARRANTS
China
11,525 Mandra Forestry Finance
(Wts 15/5/2010) – 0.00
2,000 Mandra Forestry Finance
(Wts 15/5/2013) – 0.00 _____________ ______
– 0.00 _____________ ______
Germany
7,100 Bayer ADR 432,603 0.00 _____________ ______
United States
370,700 Circuit City Stores 5,190 0.00
941,300 Comverse Technology 8,283,440 0.07
31,384 El Paso (Pref) 26,998,086 0.22
3,150 El Paso '144A' 2,709,788 0.02
609 Marco Polo – 0.00
4,980 NCB Warrant Holding – 0.00 _____________ ______
37,996,504 0.31 _____________ ______
Total Common / Preferred Stocks (Shares)
& Warrants 38,429,107 0.31 _____________ ______
BONDS
Canada
C$1,325,000 Rogers Communications 7.625%
15/12/2011 1,339,060 0.01
US$28,500,000 Sino-Forest '144A' 5% 1/8/2013 28,072,500 0.23
US$375,000 Sino-Forest 5% 1/8/2013 362,655 0.00 _____________ ______
29,774,215 0.24 _____________ ______
Cayman Islands
US$3,000,000 Hutchison Whampoa International
03/33 '144A' 5.45% 24/11/2010 3,132,417 0.03 _____________ ______
Luxembourg
US$1,098,000 UBS Luxembourg for OJSC
Vimpel Communications '144A'
8.25% 23/5/2016 1,048,590 0.01 _____________ ______
Malaysia
MYR41,700,000 Berjaya Land 8% 15/8/2011 12,121,076 0.09 _____________ ______
International
BRL34,760,000 European Investment Bank '144A'
0% 21/9/2010 (Zero coupon) 16,361,495 0.13 _____________ ______
Switzerland
US$2,574,428 UBS / Jersey 0% 29/11/2010 2,533,366 0.02 _____________ ______
United States
US$6,490,000 Calpine Generating 0% 1/4/2009 486,750 0.00
US$13,741,000 Intel '144A' 3.25% 1/8/2039 14,599,813 0.12
US$1,325,000 McMoRan Exploration '144A' 5.25%
6/10/2011 1,243,844 0.01
US$712,484 Northwest Airlines 9.485% 1/4/2015 78,373 0.00
US$9,866,000 SBA Communications '144A' 4%
1/10/2014 10,470,293 0.08
US$2,400,000 Uno Restaurant 10% 15/2/2011 852,000 0.01 _____________ ______
27,731,073 0.22 _____________ ______
Total Bonds 92,702,232 0.74 _____________ ______
Total Unquoted Securities 131,131,339 1.05 _____________ ______
Total Portfolio 12,472,970,319 99.72
Other Net Assets 34,763,551 0.28 _____________ ______
Total Net Assets (US$) 12,507,733,870 100.00 _____________ ______
Transferable Securities Admitted to an Official Stock Exchange
Listing or Dealt in on Another Regulated Market
Holding Description Value (US$) %
Unquoted Securities
Holding Description Value (US$) %
Unrealised profit
US$DescriptionNominal
Value
US$13,500 Total Return Swap (BNP Paribas)
(Fund receives NDDUE15X + 0bps;
and pays 3M Libor - 85bps) (31/8/2010) 2,793,110 __________
2,793,110 __________
Swaps as at 31 August 2009
Note: The total market value of US$2,793,110 of this transaction is included in the Statement of Net Assets (see Note 2c).

112 BlackRock Global Funds (BGF)
Global Allocation Fund continuedGlobal Allocation Fund continued
Open Forward Foreign Exchange Transactions as at 31 August 2009
Core Fund US$
€27,684,800 US$38,981,306 3/9/2009 577,974 577,974
CHF4,731,502 US$4,441,557 4/9/2009 13,772 13,772
KRW9,454,336,000 US$7,571,646 4/9/2009 (1,650) (1,650)
US$7,542,952 KRW9,454,336,000 4/9/2009 (27,044) (27,044)
€81,306,486 US$115,439,639 4/9/2009 740,553 740,553
€41,927,486 ¥5,670,902,118 4/9/2009 (1,077,250) (1,077,250)
¥82,119,174 US$877,178 4/9/2009 5,979 5,979
¥10,364,511,425 €77,717,891 4/9/2009 413,510 413,510
US$11,819,015 ZAR92,094,950 10/9/2009 24,530 24,530
US$34,534,114 £21,017,786 10/9/2009 417,609 417,609
€13,752,652 US$19,735,331 10/9/2009 (83,961) (83,961)
¥1,087,403,665 US$11,537,439 10/9/2009 157,613 157,613
€14,417,250 CHF21,900,668 11/9/2009 (22,567) (22,567)
€26,600,000 US$38,089,072 11/9/2009 (79,944) (79,944)__________ __________
Net unrealised profit 1,059,124 1,059,124__________ __________
CHF Hedged Share Class CHF
CHF14,038,488 US$12,938,802 15/9/2009 298,943 281,491
US$934,012 CHF992,939 15/9/2009 (1,124) (1,058)__________ __________
Net unrealised profit 297,819 280,433 __________ __________
EUR Hedged Share Class €
US$77,357,013 €54,585,072 15/9/2009 (448,124) (640,360)
€2,685,661,339 US$3,797,196,911 15/9/2009 28,259,721 40,382,568 __________ __________
Net unrealised profit 27,811,597 39,742,208 __________ __________
GBP Hedged Share Class £
US$759,139 £463,871 15/9/2009 3,809 6,183
£20,591,356 US$33,904,632 15/9/2009 (296,140) (480,747)__________ __________
Net unrealised loss (292,331) (474,564)__________ __________
SGD Hedged Share Class SGD
SGD124,336,012 US$86,054,432 15/9/2009 91,881 63,647
US$1,594,749 SGD2,311,965 15/9/2009 (9,490) (6,574)__________ __________
Net unrealised profit 82,391 57,073 __________ __________
Total net unrealised profit 40,664,274 __________
Note: The net unrealised profit attributed to these transactions is included in the Statement
of Net Assets (see Note 2c).
Unrealised
profit/(loss)
US$ Equivalent
Unrealised
profit/(loss)Value dateSalesPurchases
Open Futures Contracts as at 31 August 2009
4,518 DJ Euro Stoxx 50 September 2009 179,149,786
564 FTSE 100 September 2009 44,969,998
100 DAX Index September 2009 19,529,727
74 Yen Denom Nikkei September 2009 4,142,281
20 S&P 500 September 2009 5,082,500
(12) 90 Day Euro $ Future September 2009 (2,990,250)
(47) S&P/TSX 60 IX September 2009 (5,537,507)
(180) Nikkei 225 (OSE) September 2009 (20,229,069)__________
Total commitment 224,117,466 __________
Note: The net unrealised gain of US$17,435,220 attributed to these transactions is included
in the Statement of Net Assets (see Note 2c).
Value
US$
Expiration
dateContracts/Description
Number
of Contracts
3,262 General Motors Corp Call Option
strike price US$50
expiring on 16/1/2010 (1,409,541) 3,262
3,080 General Motors Corp Call Option
strike price US$60
expiring on 16/1/2010 (493,515) 9,240
2,400 S&P 500 Call Option
strike price US$925
expiring on 19/12/2009 13,948,785 27,636,000
500 S&P 500 Call Option
strike price US$1,000
expiring on 19/12/2009 (1,305,765) 3,195,000
13,370,000 OTC USD/AUD Call Option
strike price US$0.78
expiring on 17/12/2009 (541,737) 217,610___________ _________
Total Purchased Call Options 10,198,227 31,061,112 ___________ _________
Note: Purchased Call Options are included in the Statement of Net Assets (see Note 2c).
Value US$
Unrealised profit/(loss)
US$Issuer
Number ofcontracts
subject to Call
Purchased Call Options as at 31 August 2009
965 S&P 500 Put Option
strike price US$875
expiring on 19/9/2009 (3,340,416) 106,150
390 S&P 500 Put Option
strike price US$900
expiring on 19/12/2009 (1,369,971) 936,000 ___________ _________
Total Purchased Put Options (4,710,387) 1,042,150 ___________ _________
Note: Purchased Put Options are included in the Statement of Net Assets (see Note 2c).
Value US$
Unrealised loss US$Issuer
Number ofcontracts
subject to Put
Purchased Put Options as at 31 August 2009
Sector Breakdown as at 31 August 2009
US government 18.20
Finance 13.36
Energy 9.77
Healthcare 8.99
Government national 8.15
Industrials 7.80
Information technology 7.58
Consumer staples 5.49
Materials 5.48
Telecommunication services 5.37
Investment funds 3.93
Consumer discretionary 3.20
Utilities 1.65
Government agency 0.46
Iron/Steel 0.25
Mining 0.04
Other net assets 0.28 __________
100.00 __________
% of net
assets

Audited Annual Report and Accounts 113
The notes on pages 236 to 244 form an integral part of these financial statements.
Global Allocation Fund continued
Value US$
Unrealised profit/(loss)
US$Issuer
Number ofcontracts
subject to Call
Value US$
Unrealised profit/(loss)
US$Issuer
Number ofcontracts
subject to Call
(665) Microsoft Corp Call Option
strike price US$15
expiring on 16/1/2010 (467,163) (636,737)
(1,260) Morgan Stanley Call Option
strike price US$33
expiring on 17/10/2009 185,206 (44,100)
(1,705) Cigna Co Call Option
strike price US$30
expiring on 16/1/2010 (218,302) (579,700)
(1,731) Com Pro Call Option
strike price US$7.5
expiring on 16/1/2010 (208,565) (376,493)
(1,793) Apple Computers Call Option
strike price US$85
expiring on 16/1/2010 (10,271,298) (14,940,172)
(2,107) Burlington Northern
and Santa Fe Corp Call Option
strike price US$80
expiring on 16/1/2010 (90,654) (1,664,530)
(2,123) Electronic Arts Call Option
strike price US$22.5
expiring on 16/1/2010 369,720 (148,610)
(2,182) Mylan Co Call Option
strike price US$15
expiring on 17/10/2009 (39,445) (152,740)
(2,190) Wellpoint Inc Call Option
strike price US$55
expiring on 19/12/2009 (247,501) (919,800)
(2,400) S&P 500 Call Option
strike price US$1,025
expiring on 19/12/2009 (6,463,214) (11,976,000)
(2,420) Humana Co Call Option
strike price US$32
expiring on 21/11/2009 (646,244) (1,306,800)
(2,455) Avon Products Inc Call Option
strike price US$22.5
expiring on 16/1/2010 (1,908,839) (2,430,450)
(2,645) Metlife Inc Call Option
strike price US$40
expiring on 19/12/2009 (272,458) (740,600)
(3,194) Polycom Inc Call Option
strike price US$20
expiring on 16/1/2010 (967,625) (1,373,420)
(3,372) Consol Energy Inc Call Option
strike price US$46
expiring on 16/1/2010 1,398,969 (657,540)
(3,474) Aetna Co Call Option
strike price US$30
expiring on 17/10/2009 (154,872) (573,210)
(3,559) Cigna Co Call Option
strike price US$25
expiring on 17/10/2009 (1,011,012) (1,815,090)
(4,411) Microsoft Corp Call Option
strike price US$17.5
expiring on 16/1/2010 (1,821,751) (3,175,920)
(5,145) JP Morgan Chase & Co Call Option
strike price US$39
expiring on 19/12/2009 (1,572,895) (3,035,550)
(5,900) United Healthcare Insurance Co
Call Option
strike price US$27
expiring on 19/12/2009 (660,855) (2,006,000)
(8,343) Microsoft Corp Call Option
strike price US$25
expiring on 17/10/2009 350,331 (609,039)
(10,677) Bank of America Corp Call Option
strike price US$15
expiring on 21/11/2009 (2,220,704) (3,630,180)___________ _________
Total Written Call Options (26,939,171) (52,792,681)___________ _________
Written Call Options as at 31 August 2009
Note: Written Call Options are included in the Statement of Net Assets (see Note 2c).
(390) S&P 500 Put Option
strike price US$800
expiring on 19/12/2009 798,480 (393,900)
(965) S&P 500 Put Option
strike price US$800
expiring on 19/9/2009 1,896,824 (43,425)___________ _________
Total Written Put Options 2,695,304 (437,325)___________ _________
Note: Written Put Options are included in the Statement of Net Assets (see Note 2c).
Value US$
Unrealised profit
US$Issuer
Number ofcontracts
subject to Put
Written Put Options as at 31 August 2009
52,750,477 DJ Euro Stoxx 50 Call/Put Option
strike price US$3,271.35
- US$3,762.05/US$3,173.21
expiring on 16/7/2010 6,831,195
57,600,000 DJ Euro Stoxx 50 Call/Put Option
strike price €3,401.60 - €3,911.84/€3,299.55
expiring on 16/7/2010 6,782,943 _________
13,614,138 _________
Note: Spread Options are included in the Statement of Net Assets (see Note 2c).
Unrealised Profit
US$Issuer
Number ofcontracts
subject to Call/Put
Spread Options as at 31 August 2009

114 BlackRock Global Funds (BGF)
Global Corporate Bond Fund
BONDS
Australia
US$245,000 Australia & New Zealand Banking Group
5.5% 24/5/2011 257,359 0.07
€700,000 BHP Billiton Finance 6.375% 4/4/2016 1,141,766 0.29
US$700,000 BHP Billiton Finance USA Ltd 5.5%
1/4/2014 760,788 0.19
A$650,000 Holcim Finance Australia Pty 8.5%
7/8/2012 553,258 0.14
£600,000 National Australia Bank 5.375%
8/12/2014 1,042,136 0.27
€650,000 National Capital Instruments FRN
29/9/2016 (Perpetual) 668,733 0.17
US$400,000 National Capital Trust II '144A' 5.486%
23/3/2015 (Perpetual) 288,319 0.07
A$1,800,000 New South Wales Treasury 5.25%
1/5/2013 1,492,352 0.38
US$950,000 Rio Tinto Finance USA 9% 1/5/2019 1,137,398 0.29
£200,000 Stockland Finance Pty 5.625%
25/10/2013 301,542 0.08 ___________ ______
7,643,651 1.95 ___________ ______
Austria
€100,000 Energie AG Oberoesterreich 4.5%
4/3/2025 134,147 0.04 ___________ ______
Bahrain
US$200,000 Golden Belt 1 Sukuk BSC FRN
15/5/2012 45,000 0.01 ___________ ______
Bermuda
£1,000,000 Holcim GB Finance 8.75% 24/4/2017 1,884,309 0.48
US$1,590,000 Ingersoll-Rand Global Holding 9.5%
15/4/2014 1,861,330 0.48
US$1,300,000 Novartis Securities Investment 5.125%
10/2/2019 1,377,486 0.35 ___________ ______
5,123,125 1.31 ___________ ______
Canada
US$700,000 Barrick Gold 6.95% 1/4/2019 812,247 0.21
C$12,765,000 Canadian Government Bond 3.75%
1/6/2012 12,162,217 3.11
C$645,000 Canadian Government Bond 5%
1/6/2037 691,248 0.18
US$800,000 Canadian Natural Resources Ltd 5.7%
15/5/2017 840,170 0.21
US$900,000 Canadian Pacific Railway 7.25%
15/5/2019 1,018,697 0.26
US$1,210,000 Husky Energy 5.9% 15/6/2014 1,305,878 0.33
US$1,200,000 Rogers Communications 6.8%
15/8/2018 1,356,364 0.35
US$250,000 Rogers Communications 8%
15/12/2012 260,313 0.06
€150,000 Xstrata Canada Financial 5.875%
27/5/2011 222,952 0.06 ___________ ______
18,670,086 4.77 ___________ ______
Cayman Islands
€336,000 MUFG Capital Finance 2 4.85%
25/7/2016 (Perpetual) 393,695 0.10 ___________ ______
Czech Republic
€550,000 CEZ 5.75% 26/5/2015 854,883 0.22 ___________ ______
Denmark
€280,000 Danica Pension Livsforsikringsaktieselskab
4.35% 6/10/2011 (Perpetual) 336,235 0.09
£413,000 Danske Bank 5.6838% 15/2/2017
(Perpetual) 434,923 0.11
US$380,000 Danske Bank 5.914% 16/6/2014
(Perpetual) 165,596 0.04 ___________ ______
936,754 0.24 ___________ ______
Finland
€625,000 Fortum OYJ 6% 20/3/2019 1,002,729 0.25
US$700,000 Nokia 5.375% 15/5/2019 732,253 0.19 ___________ ______
1,734,982 0.44 ___________ ______
France
€500,000 Air Liquide Finance 6.125% 28/11/2012 787,133 0.20
€300,000 AXA 4.5% 23/1/2015 445,936 0.12
€320,000 AXA 5.777% 6/7/2016 (Perpetual) 360,460 0.09
€2,818,000 AXA 6.211% 5/10/2017 (Perpetual) 3,198,177 0.82
€530,000 Banque Federative du Credit
Mutuel/France 4.471% 28/10/2015
(Perpetual) 481,853 0.12
€500,000 BNP Paribas 3.125% 6/12/2015 712,919 0.18
€700,000 BNP Paribas 3.25% 27/3/2012 1,021,162 0.26
€850,000 BNP Paribas 4.73% 12/4/2016
(Perpetual) 913,467 0.23
€400,000 BNP Paribas 4.875% 17/10/2011
(Perpetual) 397,239 0.10
€950,000 BNP Paribas 8.667% 11/9/2013
(Perpetual) 1,340,503 0.34
US$1,070,000 BNP Paribas FRN 23/11/2015 1,058,424 0.27
US$1,050,000 BNP Paribas FRN 27/4/2017 996,188 0.26
€671,000 Caisse Nationale des Caisses d'Epargne
et de Prevoyance 5.25% 30/7/2014
(Perpetual) 608,044 0.16
US$240,000 Caisse Nationale des Caisses d'Epargne
et de Prevoyance 6.75% 27/1/2012
(Perpetual) 165,600 0.04
€800,000 CNP Assurances 4.75% 22/12/2016
(Perpetual) 794,478 0.20
£1,100,000 Credit Agricole 7.589% 30/1/2020
(Perpetual) 1,533,241 0.39
£800,000 France Telecom 5% 12/5/2016 1,342,415 0.34
€700,000 France Telecom 7.25% 28/1/2013 1,137,935 0.29
US$470,000 France Telecom 8.5% 1/3/2031 639,042 0.16
€700,000 GDF Suez 6.875% 24/1/2019 1,211,778 0.31
€600,000 Groupe Auchan 6% 15/4/2019 973,221 0.25
€700,000 HSBC France 4.875% 15/1/2014 1,060,512 0.27
€50,000 Lafarge 6.125% 28/5/2015 74,049 0.02
€1,000,000 Lafarge 7.625% 24/11/2016 1,589,963 0.41
€900,000 Sanofi-Aventis 4.5% 18/5/2016 1,355,239 0.35
€250,000 SCOR SE 6.154% 28/7/2016 (Perpetual) 260,777 0.07
€600,000 Societe Generale 5.875% 21/12/2016 931,100 0.24
€200,000 Unibail-Rodamco 4% 29/10/2011 290,736 0.08
US$550,000 Veolia Environnement 5.25% 3/6/2013 575,228 0.15
€600,000 Veolia Environnement 5.25%
24/4/2014 911,685 0.23 ___________ ______
27,168,504 6.95 ___________ ______
Transferable Securities Admitted to an Official Stock Exchange
Listing or Dealt in on Another Regulated Market
Holding Description Value (US$) %
Transferable Securities Admitted to an Official Stock Exchange
Listing or Dealt in on Another Regulated Market
Holding Description Value (US$) %
Portfolio of Investments 31 August 2009

Audited Annual Report and Accounts 115
The notes on pages 236 to 244 form an integral part of these financial statements.
Global Corporate Bond Fund continued
Germany
€5,745,000 Bundesrepublik Deutschland 4.25%
4/7/2039 8,599,721 2.20
€60,000 Bundesrepublik Deutschland 5%
4/7/2012 93,120 0.02
€400,000 Deutsche Bank 5.125% 31/1/2013 599,814 0.15
€252,000 Deutsche Boerse 7.5% 13/6/2038 340,714 0.09
€800,000 MAN SE 5.375% 20/5/2013 1,207,109 0.31
€500,000 Muenchener Rueckversicherungs
5.767% 12/6/2017 (Perpetual) 611,605 0.16
€976,000 Muenchener Rueckversicherungs
6.75% 21/6/2023 1,470,825 0.38 ___________ ______
12,922,908 3.31 ___________ ______
Greece
€625,000 Hellenic Republic Government
Bond 6% 19/7/2019 997,233 0.26 ___________ ______
Guernsey
€150,000 Credit Suisse Group Capital Guernsey V
6.905% 7/11/2011 (Perpetual) 200,406 0.05 ___________ ______
Hong Kong
US$170,000 Standard Chartered Bank Hong Kong
4.375% 3/12/2014 169,100 0.05 ___________ ______
India
US$400,000 ICICI Bank 7.25% 31/10/2016
(Perpetual) 301,365 0.08 ___________ ______
Ireland
£124,000 Allied Irish Banks 12.5% 25/6/2019 197,056 0.05
€950,000 Allied Irish Banks 12.5% 25/6/2019 1,384,533 0.35
€100,000 GE Capital European Funding 5.75%
23/9/2011 150,408 0.04
£205,000 Lambay Capital Securities 6.25%
16/6/2015 (Perpetual) 23,294 0.01
€97,427 Talisman Finance '7 H' FRN 22/4/2017 20,883 0.00 ___________ ______
1,776,174 0.45 ___________ ______
Italy
€500,000 Assicurazioni Generali 4.875%
11/11/2014 754,829 0.19
€900,000 Atlantia 5.625% 6/5/2016 1,391,724 0.36
€350,000 Banca Italease FRN 2/2/2010 490,993 0.13
€100,000 Banco Popolare SC FRN 8/2/2017 125,030 0.03
€650,000 Edison 4.25% 22/7/2014 945,682 0.24
€800,000 Intesa Sanpaolo 5.75% 28/5/2018 1,188,579 0.30
€750,000 Intesa Sanpaolo 6.625% 8/5/2018 1,099,964 0.28
€500,000 Intesa Sanpaolo 8.047% 20/6/2018
(Perpetual) 631,106 0.16
€160,000 Italy Buoni Poliennali del Tesoro 5%
1/8/2039 230,955 0.06
€500,000 UniCredit 4.125% 27/4/2012 737,128 0.19 ___________ ______
7,595,990 1.94 ___________ ______
Japan
€1,000,000 Bank of Tokyo-Mitsubishi UFJ 3.5%
16/12/2015 1,424,502 0.36
€384,000 Shinsei Bank 3.75% 23/2/2016 415,643 0.11 ___________ ______
1,840,145 0.47 ___________ ______
Jersey
€336,000 HSBC Capital Funding / Jersey Channel
Islands 5.13% 29/3/2016 (Perpetual) 383,373 0.10
US$750,000 HSBC Capital Funding / Jersey Channel
Islands 4.61% 27/6/2013 (Perpetual) 592,650 0.15
€250,000 UBS Capital Securities (Jersey) 8.836%
11/4/2013 (Perpetual) 326,329 0.08
€125,000 WPP Group 4.375% 5/12/2013 175,295 0.05 ___________ ______
1,477,647 0.38 ___________ ______
Luxembourg
US$650,000 ArcelorMittal 6.125% 1/6/2018 628,895 0.16
US$1,125,000 Covidien International Finance SA 6%
15/10/2017 1,236,404 0.31
€1,500,000 Fiat Finance & Trade 9% 30/7/2012 2,265,655 0.58
€700,000 Michelin Luxembourg SCS 8.625%
24/4/2014 1,162,041 0.30
€115,000 Telecom Italia Finance 7.75% 24/1/2033 184,772 0.05
£185,000 UniCredit International Bank
Luxembourg 8.5925%
27/6/2018 (Perpetual) 242,493 0.06
US$540,000 UniCredit Luxembourg Finance 5.584%
13/1/2017 477,090 0.12 ___________ ______
6,197,350 1.58 ___________ ______
Mexico
US$250,000 America Movil SAB de CV 6.375%
1/3/2035 259,459 0.07 ___________ ______
Netherlands
€1,200,000 ABN Amro Bank 4.31% 10/3/2016
(Perpetual) 875,569 0.22
€500,000 Akzo Nobel 7.25% 27/3/2015 813,558 0.21
€650,000 Alliander Finance 5.5% 20/4/2016 1,009,615 0.26
€300,000 Allianz Finance II 4% 23/11/2016 437,392 0.11
€1,031,000 Allianz Finance II 4.375% 17/2/2017
(Perpetual) 1,158,572 0.30
€500,000 Allianz Finance II 4.75% 22/7/2019 736,825 0.19
€500,000 Bayer Capital 4.625% 26/9/2014 750,753 0.19
€600,000 BMW Finance 6.125% 2/4/2012 918,437 0.23
€800,000 Coca-Cola HBC Finance 7.875%
15/1/2014 1,332,100 0.34
US$1,230,000 Deutsche Telekom International
Finance BV 5.75% 23/3/2016 1,307,261 0.33
US$100,000 EDP Finance 5.375% 2/11/2012 106,889 0.03
€400,000 Enbw International Finance 4.125%
7/7/2015 587,599 0.15
€100,000 Generali Finance 5.317% 16/6/2016
(Perpetual) 115,028 0.03
€1,200,000 Generali Finance 5.479% 8/2/2017
(Perpetual) 1,385,410 0.35
€650,000 Heineken 7.125% 7/4/2014 1,040,507 0.27
€700,000 Koninklijke DSM 5.25% 17/10/2017 1,067,643 0.27
€500,000 Koninklijke DSM 5.75% 17/3/2014 777,195 0.20
€1,050,000 Koninklijke KPN 7.5% 4/2/2019 1,807,022 0.46
€150,000 Linde Finance 4.375% 24/4/2012 223,476 0.06
€400,000 Nederlandse Gasunie 5.125% 31/3/2017 619,018 0.16
€800,000 Portugal Telecom International Finance
6% 30/4/2013 1,234,887 0.32
€1,000,000 Rabobank Nederland 5.875% 20/5/2019 1,552,712 0.40
€600,000 RWE Finance 5% 10/2/2015 918,668 0.23
Transferable Securities Admitted to an Official Stock Exchange
Listing or Dealt in on Another Regulated Market
Holding Description Value (US$) %
Transferable Securities Admitted to an Official Stock Exchange
Listing or Dealt in on Another Regulated Market
Holding Description Value (US$) %
Portfolio of Investments 31 August 2009

116 BlackRock Global Funds (BGF)
Global Corporate Bond Fund continued
£450,000 RWE Finance 6.125% 6/7/2039 828,370 0.21
€275,000 Schlumberger Finance 4.5% 25/3/2014 411,747 0.11
US$1,600,000 Shell International Finance 4%
21/3/2014 1,675,932 0.43
€300,000 Siemens Financieringsmaatschappij
5.125% 20/2/2017 460,204 0.12
€100,000 Siemens Financieringsmaatschappij
5.25% 14/9/2066 131,460 0.03
US$250,000 Telefonica Europe 7.75% 15/9/2010 265,199 0.07
€50,000 Urenco Finance 5.375% 22/5/2015 73,546 0.02
€800,000 Volkswagen International Finance
3.75% 16/11/2010 1,164,470 0.30
€100,000 Wolters Kluwer 6.375% 10/4/2018 158,105 0.04 ___________ ______
25,945,169 6.64 ___________ ______
Norway
£210,000 DnB NOR Bank 4.875% 8/2/2011
(Perpetual) 302,249 0.08
€856,000 DnB NOR Bank 7.068% 19/11/2012
(Perpetual) 1,131,417 0.29
US$850,000 StatoilHydro 5.25% 15/4/2019 902,838 0.23 ___________ ______
2,336,504 0.60 ___________ ______
Poland
€1,500,000 Poland Government International
Bond 5.875% 3/2/2014 2,299,725 0.59 ___________ ______
Portugal
€700,000 Banco Comercial Portugues 5.625%
23/4/2014 1,063,272 0.27
€1,000,000 Banco Santander Totta 3.75%
12/6/2012 1,454,616 0.37 ___________ ______
2,517,888 0.64 ___________ ______
South Korea
US$200,000 Hyundai Capital Services 5.5%
23/11/2010 195,178 0.05
US$1,200,000 Woori Bank 7% 2/2/2015 1,263,422 0.32 ___________ ______
1,458,600 0.37 ___________ ______
Spain
€1,000,000 BBVA International Preferred Unipersonal
4.952% 20/9/2016 (Perpetual) 1,053,826 0.27
€350,000 BBVA Senior Finance SAU 4.875%
23/1/2014 531,076 0.14
€600,000 Santander International Debt 3.375%
21/4/2011 873,884 0.22
€1,100,000 Santander Issuances S.A Unipersonal
5.435% 24/10/2017 1,611,065 0.41
£1,000,000 Santander Issuances S.A Unipersonal
5.75% 31/1/2018 1,612,195 0.41
€100,000 Santander Issuances S.A Unipersonal
6.5% 27/7/2019 152,072 0.04
€700,000 Telefonica Emisiones SAU 5.496%
1/4/2016 1,089,119 0.28 ___________ ______
6,923,237 1.77 ___________ ______
International
€80,000 European Investment Bank 4.25%
15/10/2014 121,756 0.03 ___________ ______
Sweden
€750,000 Nordea Bank AB 4.5% 12/5/2014 1,115,375 0.29
€1,545,000 Svensk Exportkredit AB 3.625%
27/5/2014 2,247,305 0.57
€492,000 Svenska Handelsbanken AB 4.194%
16/12/2015 (Perpetual) 566,288 0.14
€600,000 Svenska Handelsbanken AB 4.875%
25/3/2014 908,556 0.23
£1,300,000 Svenska Handelsbanken AB 5.375%
4/9/2013 (Perpetual) 1,835,281 0.47
£350,000 Svenska Handelsbanken AB 5.5%
18/1/2012 (Perpetual) 497,830 0.13
£500,000 Vattenfall AB 6.125% 16/12/2019 893,565 0.23 ___________ ______
8,064,200 2.06 ___________ ______
Switzerland
US$450,000 Credit Suisse/New York NY 5% 15/5/2013 477,736 0.12
US$2,400,000 Credit Suisse/New York NY 5.5%
1/5/2014 2,579,870 0.66
€450,000 UBS (Jersey) 7.152% 21/12/2017
(Perpetual) 504,228 0.13
€1,500,000 UBS (Jersey) FRN 25/9/2018 1,973,856 0.51
US$1,600,000 UBS (Stamford Branch) 5.875%
20/12/2017 1,582,738 0.40
€650,000 UBS AG/London 5.625% 19/5/2014 984,570 0.25 ___________ ______
8,102,998 2.07 ___________ ______
United Kingdom
£50,000 Alliance & Leicester 6.25% 27/9/2010 84,817 0.02
£400,000 Amlin 6.5% 19/12/2026 507,496 0.13
€180,000 Anglian Water Services Financing
4.625% 7/10/2013 266,188 0.07
US$1,000,000 AstraZeneca 5.9% 15/9/2017 1,117,954 0.29
€2,575,000 Aviva 4.7291% 28/11/2014 (Perpetual) 2,282,775 0.58
€1,760,000 Aviva 5.7% 29/9/2015 (Perpetual) 1,905,032 0.49
€200,000 Aviva 5.75% 14/11/2021 262,219 0.07
€899,000 Aviva 6.875% 22/5/2038 1,146,387 0.29
US$219,000 Barclays Bank '144A' 7.434%
15/12/2017 (Perpetual) 180,675 0.05
€540,000 Barclays Bank 4.75% 15/3/2020
(Perpetual) 435,963 0.11
US$1,000,000 Barclays Bank 5.2% 10/7/2014 1,047,745 0.27
€1,100,000 Barclays Bank 5.25% 27/5/2014 1,659,398 0.42
US$1,400,000 Barclays Bank 5.45% 12/9/2012 1,495,764 0.38
US$320,000 Barclays Bank 8.55% 15/6/2011
(Perpetual) 288,000 0.07
€139,000 Barclays Bank FRN 30/5/2017 170,813 0.04
€750,000 BAT International Finance 5.875%
12/3/2015 1,173,064 0.30
€1,050,000 BG Energy Capital 3.375% 15/7/2013 1,520,250 0.39
£275,000 BL Superstores Finance 5.27% 4/7/2025 373,725 0.10
US$780,000 BP Capital Markets 3.125% 10/3/2012 804,061 0.21
US$500,000 BP Capital Markets 5.25% 7/11/2013 546,511 0.14
US$470,000 British Telecommunications 9.125%
15/12/2010‡ 508,634 0.13
£127,727 City Greenwich Lewisham Rail 9.375%
11/10/2020 239,557 0.06
US$800,000 Diageo Capital 7.375% 15/1/2014 922,651 0.24
€60,000 EDF Energy 4.375% 15/12/2010 88,800 0.02
£400,000 Firstgroup 8.125% 19/9/2018 754,186 0.19
Transferable Securities Admitted to an Official Stock Exchange
Listing or Dealt in on Another Regulated Market
Holding Description Value (US$) %
Transferable Securities Admitted to an Official Stock Exchange
Listing or Dealt in on Another Regulated Market
Holding Description Value (US$) %
Portfolio of Investments 31 August 2009

Audited Annual Report and Accounts 117
The notes on pages 236 to 244 form an integral part of these financial statements.
Global Corporate Bond Fund continued
€1,100,000 GlaxoSmithKline Capital 3.875%
6/7/2015 1,605,351 0.41
US$180,000 HBOS 5.375% 1/11/2013 (Perpetual) 108,900 0.03
US$134,000 HBOS 6.75% 21/5/2018 111,562 0.03
€1,030,000 HSBC Bank 4.25% 18/3/2016 1,478,945 0.38
€850,000 HSBC Holdings 4.5% 30/4/2014 1,270,748 0.32
€750,000 HSBC Holdings 6% 10/6/2019 1,135,705 0.29
€150,000 HSBC Holdings 6.25% 19/3/2018 231,913 0.06
US$375,000 HSBC Holdings 6.8% 1/6/2038 399,452 0.10
US$700,000 HSBC Holdings FRN 6/10/2016 654,220 0.17
€625,000 ICAP Group Holdings 7.5% 28/7/2014 904,059 0.23
€1,650,000 Imperial Tobacco Finance 7.25%
15/9/2014 2,624,194 0.67
£650,000 John Lewis 8.375% 8/4/2019 1,230,683 0.31
£1,100,000 Legal & General Group 10% 23/7/2041 2,021,928 0.52
€600,000 Lehman Brothers UK Capital Funding II
3.875% 22/2/2011 (Perpetual) 1,200 0.00
£170,000 Lend Lease Europe Finance 6.125%
12/10/2021 215,247 0.06
£670,000 Lloyds Banking Group 12% 2/1/2011 1,165,339 0.30
€214,000 Lloyds TSB Bank 6.25% 15/4/2014 329,083 0.08
€500,000 Lloyds TSB Bank 6.375% 17/6/2016 773,784 0.20
£50,000 Marks & Spencer 5.875% 29/5/2012 84,216 0.02
US$200,000 Northern Rock 5.6% 30/4/2014
(Perpetual) 26,000 0.01
€1,550,000 Old Mutual 4.5% 18/1/2017 1,504,971 0.39
€350,000 OTE 5.375% 14/2/2011 521,696 0.13
€910,000 Prudential 5.75% 19/12/2021 1,214,084 0.31
£48,401 Punch Taverns Finance 5.883%
15/10/2026 62,758 0.02
£170,000 Resolution 6.5864% 25/4/2016
(Perpetual) 86,925 0.02
€50,000 Rexam 4.375% 15/3/2013 69,937 0.02
£850,000 Rolls-Royce 6.75% 30/4/2019 1,523,102 0.39
£900,000 Royal Bank of Scotland 7.5% 29/4/2024 1,692,591 0.43
€2,350,000 Royal Bank of Scotland Group 7.0916%
29/9/2017 (Perpetual) 1,306,245 0.33
£48,000 Safeway 6.5% 5/8/2014 86,121 0.02
£700,000 Sceptre Funding No. 1 5.253% 9/2/2027 1,204,957 0.31
€300,000 Standard Chartered Bank 3.625%
3/2/2017 402,770 0.10
€1,650,000 Standard Chartered Bank 5.875%
26/9/2017 2,414,640 0.62
£130,000 Standard Chartered Bank 8.103%
11/5/2016 (Perpetual) 209,760 0.05
£450,000 Unilever 4% 19/12/2014 750,426 0.19
£750,000 Unilever 4.75% 16/6/2017 1,276,771 0.33
£500,000 United Kingdom Gilt 4.25% 7/9/2039 825,123 0.21
£50,000 United Kingdom Gilt 5% 7/3/2012 87,653 0.02
US$2,300,000 Vodafone Group 5% 16/12/2013 2,444,655 0.63
€1,000,000 Vodafone Group 6.875% 4/12/2013 1,635,053 0.42 ___________ ______
55,475,432 14.19 ___________ ______
United States
US$250,000 Abbott Laboratories 5.125% 1/4/2019 264,334 0.07
US$404,000 Abbott Laboratories 5.875% 15/5/2016 449,585 0.11
US$1,000,000 Altria Group 10.2% 6/2/2039 1,343,600 0.34
US$300,000 American Express 6.8% 1/9/2066 238,500 0.06
US$1,100,000 American Express 7.25% 20/5/2014 1,207,385 0.31
US$100,000 Amgen 4% 18/11/2009 100,926 0.03
US$850,000 Analog Devices 5% 1/7/2014 879,965 0.23
US$480,000 Appalachian Power 5.8% 1/10/2035 465,311 0.12
US$2,800,000 AT&T 5.8% 15/2/2019 3,011,144 0.77
US$1,000,000 AT&T 6.5% 1/9/2037‡ 1,088,420 0.28
US$450,000 BAE Systems Holdings 5.2% 15/8/2015 464,021 0.12
€200,000 Banca Popolare di Bergamo Capital
Trust 8.364% 15/2/2011 (Perpetual) 267,208 0.07
€1,000,000 Bank of America 4% 28/3/2018 1,198,819 0.31
US$1,300,000 Bank of America 6.5% 1/8/2016 1,350,793 0.35
US$3,700,000 Bank of America 7.625% 1/6/2019 4,074,904 1.04
US$500,000 Bank of America NA 5.3% 15/3/2017 461,151 0.12
US$1,300,000 Bank of New York Mellon 4.3%
15/5/2014 1,368,609 0.35
US$900,000 Bank of New York Mellon 4.5% 1/4/2013 950,548 0.24
US$600,000 Baxter International 4% 1/3/2014 622,889 0.16
US$1,000,000 Bear Stearns 6.95% 10/8/2012 1,117,059 0.29
US$1,020,000 Becton Dickinson and Co 5% 15/5/2019 1,061,710 0.27
US$1,300,000 Berkshire Hathaway Finance '144A' 4%
15/4/2012 1,353,219 0.35
€540,000 BMW US Capital 6.375% 23/7/2012 829,834 0.21
US$450,000 Boeing 5% 15/3/2014 484,238 0.12
US$1,550,000 Boeing 5.875% 15/2/2040 1,619,972 0.41
US$800,000 Bristol-Myers Squibb 5.45% 1/5/2018 870,438 0.22
US$500,000 Bunge Ltd Finance 8.5% 15/6/2019 563,025 0.14
US$300,000 Capital One Bank USA NA 5.75%
15/9/2010 307,524 0.08
US$1,330,000 Capital One Capital V 10.25% 15/8/2039 1,351,753 0.35
US$790,000 Capital One Financial 7.375% 23/5/2014 864,358 0.22
US$830,000 CareFusion '144A' 5.125% 1/8/2014 856,834 0.22
€50,000 Cargill 6.25% 24/7/2015 77,906 0.02
US$650,000 Cellco Partnership / Verizon Wireless
Capital '144A' 3.75% 20/5/2011 671,542 0.17
US$100,000 Chevron 3.45% 3/3/2012 103,864 0.03
US$420,000 Cisco Systems 5.5% 22/2/2016 461,990 0.12
€84,000 Citigroup 3.625% 30/11/2017 94,259 0.02
US$1,500,000 Citigroup 5.3% 17/10/2012 1,514,981 0.39
US$1,000,000 Citigroup 8.125% 15/7/2039 1,030,839 0.26
€800,000 CL Capital Trust I 7.047% 26/4/2012
(Perpetual) 971,092 0.25
US$150,000 Coca-Cola 3.625% 15/3/2014 154,687 0.04
US$300,000 Comcast 5.3% 15/1/2014 319,064 0.08
US$225,000 Comcast 5.9% 15/3/2016 239,675 0.06
US$600,000 Comcast 6.95% 15/8/2037 681,776 0.17
US$2,000,000 Comcast Cable Communications
Holdings 8.375% 15/3/2013 2,310,078 0.59
US$1,000,000 Comcast Cable Holdings 9.8%
1/2/2012 1,131,732 0.29
US$1,765,000 ConocoPhillips 4.6% 15/1/2015 1,875,294 0.48
US$130,000 COX Communications 5.45% 15/12/2014 138,216 0.04
US$2,900,000 COX Communications 7.125%
1/10/2012 3,213,641 0.82
€1,000,000 Credit Suisse Group Finance 3.625%
14/9/2020 1,300,365 0.33
US$210,000 CSX 6.75% 15/3/2011 223,035 0.06
US$650,000 CVS Caremark 6.6% 15/3/2019 737,342 0.19
US$1,200,000 Daimler Finance North America 6.5%
15/11/2013 1,275,999 0.33
US$100,000 Danaher 5.4% 1/3/2019 107,093 0.03
€1,500,000 Deutsche Bank Capital Trust IV 5.33%
19/9/2013 (Perpetual) 1,489,646 0.38
US$630,000 Deutsche Bank Financial 5.375%
2/3/2015 633,770 0.16
US$550,000 Devon Energy 7.95% 15/4/2032 682,950 0.17
US$920,000 Diamond Offshore Drilling 5.875%
1/5/2019 986,501 0.25
US$915,000 Duke Energy Indiana 5% 15/9/2013 955,366 0.24
US$700,000 Duke Energy Ohio 5.45% 1/4/2019 752,509 0.19
US$700,000 Eli Lilly & Co 3.55% 6/3/2012 731,952 0.19
Transferable Securities Admitted to an Official Stock Exchange
Listing or Dealt in on Another Regulated Market
Holding Description Value (US$) %
Transferable Securities Admitted to an Official Stock Exchange
Listing or Dealt in on Another Regulated Market
Holding Description Value (US$) %
Portfolio of Investments 31 August 2009

118 BlackRock Global Funds (BGF)
Global Corporate Bond Fund continued
US$440,000 Emerson Electric 5% 15/4/2019 461,385 0.12
US$480,000 Enterprise Products Operating 4.6%
1/8/2012 497,554 0.13
US$1,000,000 Enterprise Products Operating 'L' 6.3%
15/9/2017 1,074,537 0.27
US$610,000 EOG Resources 5.625% 1/6/2019 667,252 0.17
US$250,000 Fifth Third Bank 4.75% 1/2/2015 227,508 0.06
US$70,000 FleetBoston Financial 7.375% 1/12/2009 71,002 0.02
US$370,000 General Electric Capital 6% 2/2/2046 310,800 0.08
US$500,000 General Electric Capital 6.75% 15/3/2032 497,978 0.13
US$1,900,000 General Electric Capital 6.875%
10/1/2039 1,892,658 0.48
US$700,000 General Mills 5.65% 15/2/2019 756,093 0.19
US$800,000 GlaxoSmithKline Capital 4.85%
15/5/2013 855,125 0.22
US$670,000 Goldman Sachs Group 3.625% 1/8/2012 683,449 0.17
€850,000 Goldman Sachs Group 4.5% 30/1/2017 1,185,290 0.30
€1,250,000 Goldman Sachs Group 5.125%
16/10/2014 1,847,215 0.47
€2,500,000 Goldman Sachs Group 5.375%
15/2/2013 3,743,370 0.96
US$170,000 Halliburton 6.15% 15/9/2019 188,893 0.05
US$735,000 Harris 6.375% 15/6/2019 800,798 0.20
£100,000 Hartford Life Institutional Funding
5.375% 17/1/2012 155,875 0.04
US$410,000 Hewlett-Packard 2.25% 27/5/2011 417,467 0.11
US$565,000 Hewlett-Packard 2.95% 15/8/2012 577,727 0.15
US$100,000 Hewlett-Packard 4.25% 24/2/2012 105,362 0.03
US$900,000 Hewlett-Packard 5.25% 1/3/2012 970,246 0.25
US$900,000 Honeywell International 5.3% 1/3/2018 961,846 0.25
US$660,000 Hospira 6.4% 15/5/2015 718,502 0.18
US$250,000 HSBC Bank USA NA (New York) 5.875%
1/11/2034 247,652 0.06
€1,250,000 HVB Funding Trust VIII 7.055%
28/3/2012 (Perpetual) 1,211,496 0.31
€50,000 Hypo Real Estate International Trust I
5.864% 14/6/2017 (Perpetual) 10,360 0.00
US$400,000 International Business Machines
5.875% 29/11/2032 428,543 0.11
US$1,000,000 International Business Machines
7.625% 15/10/2018 1,223,593 0.31
US$1,225,000 International Paper 7.5% 15/8/2021 1,238,857 0.32
€454,000 IntesaBci Capital Trust 6.988%
12/7/2011 (Perpetual) 576,071 0.15
US$950,000 ITT 4.9% 1/5/2014 982,527 0.25
€2,000,000 JPMorgan Chase & Co 4.375%
12/11/2019 2,786,503 0.71
US$1,500,000 JPMorgan Chase & Co 4.65% 1/6/2014 1,565,233 0.40
US$1,000,000 JPMorgan Chase & Co 6.3% 23/4/2019 1,096,695 0.28
€1,000,000 JPMorgan Chase Bank NA 4.625%
31/5/2017 1,438,605 0.37
US$1,300,000 Kellogg 4.25% 6/3/2013 1,357,904 0.35
US$220,000 Kinder Morgan Energy Partners 6.85%
15/2/2020 241,438 0.06
US$1,950,000 Kraft Foods 6.125% 1/2/2018 2,130,564 0.54
US$275,000 Kraft Foods 6.125% 23/8/2018 301,839 0.08
US$1,400,000 Lincoln National 8.75% 1/7/2019 1,566,007 0.40
US$160,000 Marsh & McLennan 5.75% 15/9/2015 164,098 0.04
US$750,000 Medtronic 4.5% 15/3/2014 793,325 0.20
US$2,000,000 MetLife 6.75% 1/6/2016 2,185,466 0.56
US$120,000 MetLife 7.717% 15/2/2019 140,612 0.04
€1,700,000 Metropolitan Life Global Funding I
4.625% 16/5/2017 2,184,725 0.56
£850,000 Metropolitan Life Global Funding I
5.25% 9/1/2014 1,370,037 0.35
US$1,010,000 Microsoft 2.95% 1/6/2014 1,019,574 0.26
US$1,200,000 Midamerican Energy Holdings 5.875%
1/10/2012 1,300,356 0.33
US$150,000 Miller Brewing '144A' 5.5% 15/8/2013 157,356 0.04
US$600,000 Morgan Stanley 5.55% 27/4/2017‡ 599,164 0.15
US$6,400,000 Morgan Stanley 6% 13/5/2014 6,773,878 1.73
US$250,000 New Cingular Wireless Services
8.125% 1/5/2012‡ 284,198 0.07
US$350,000 News America '144A' 5.65% 15/8/2020 359,351 0.09
US$220,000 News America 6.4% 15/12/2035 218,178 0.06
US$240,000 News America Holdings 9.25% 1/2/2013 279,789 0.07
US$450,000 Norfolk Southern 5.9% 15/6/2019 489,011 0.13
US$430,000 Northern Trust 4.625% 1/5/2014 455,720 0.12
US$1,200,000 Occidental Petroleum 4.125% 1/6/2016 1,220,216 0.31
US$1,100,000 Oracle 3.75% 8/7/2014 1,140,223 0.29
US$1,600,000 Oracle 5.75% 15/4/2018 1,752,872 0.45
US$80,000 PACCAR 6.875% 15/2/2014 89,866 0.02
US$260,000 Pacific Gas & Electric 6.05% 1/3/2034 283,411 0.07
US$900,000 Pfizer 4.45% 15/3/2012 954,322 0.24
US$700,000 Pfizer 5.35% 15/3/2015 777,327 0.20
€700,000 Philip Morris International 4.25%
23/3/2012 1,042,832 0.27
€100,000 Philip Morris International 5.875%
4/9/2015 158,393 0.04
€700,000 Procter & Gamble 5.125% 24/10/2017 1,087,833 0.28
US$2,400,000 Progress Energy 5.625% 15/1/2016 2,537,333 0.65
US$1,000,000 Rockwell Collins 5.25% 15/7/2019 1,057,145 0.27
€800,000 Schering-Plough 5.375% 1/10/2014 1,239,517 0.32
US$1,275,000 Sempra Energy 6.5% 1/6/2016 1,400,247 0.36
€898,000 SG Capital Trust III 5.419% 10/11/2013
(Perpetual) 891,160 0.23
€150,000 SLM 3.125% 17/9/2012 152,180 0.04
US$95,000 SLM Student Loan Trust '2008-5 A2'
FRN 25/10/2016 95,923 0.02
US$95,000 SLM Student Loan Trust '2008-5 A3'
FRN 25/1/2018 96,306 0.02
US$1,400,000 State Street 4.3% 30/5/2014 1,465,023 0.37
US$1,500,000 TEPPCO Partners 7.625% 15/2/2012 1,649,517 0.42
US$375,000 Teva Pharmaceutical Finance 6.15%
1/2/2036 404,117 0.10
US$1,425,000 Texas State 5.913% 1/10/2025 1,470,002 0.38
US$820,000 Time Warner Cable 7.5% 1/4/2014 940,477 0.24
US$810,000 TJX 4.2% 15/8/2015 829,503 0.21
US$900,000 Travelers 5.9% 2/6/2019 989,346 0.25
US$200,000 UniCredito Italiano Capital Trust II '144A'
9.2% 5/10/2010 (Perpetual) 150,457 0.04
€400,000 UniCredito Italiano Capital Trust II FRN
5/10/2010 (Perpetual) 491,548 0.13
£80,000 UniCredito Italiano Capital Trust IV
5.396% 27/10/2015 (Perpetual) 81,932 0.02
US$800,000 US Bancorp 4.2% 15/5/2014 831,630 0.21
US$7,130,000 US Treasury Bond 4.25% 15/5/2039 7,181,247 1.84
US$330,000 Verizon Communications 5.85%
15/9/2035 334,242 0.09
US$2,250,000 Verizon Communications 6.35%
1/4/2019 2,495,521 0.64
US$1,300,000 Verizon Wireless Capital '144A' 5.25%
1/2/2012 1,389,174 0.36
US$500,000 Virginia Electric and Power 8.875%
15/11/2038 693,858 0.18
US$380,000 Wachovia Bank NA 5.6% 15/3/2016 384,077 0.10
Transferable Securities Admitted to an Official Stock Exchange
Listing or Dealt in on Another Regulated Market
Holding Description Value (US$) %
Transferable Securities Admitted to an Official Stock Exchange
Listing or Dealt in on Another Regulated Market
Holding Description Value (US$) %
Portfolio of Investments 31 August 2009

Audited Annual Report and Accounts 119
The notes on pages 236 to 244 form an integral part of these financial statements.
Global Corporate Bond Fund continued
US$300,000 Wal-Mart Stores 7.55% 15/2/2030‡ 388,788 0.10
US$100,000 Waste Management 7.375% 11/3/2019 114,114 0.03
US$3,650,000 Wells Fargo & Co 5.25% 23/10/2012 3,874,094 0.99
US$330,000 Wyeth 5.5% 15/2/2016 354,786 0.09
US$500,000 XTO Energy 5.9% 1/8/2012 540,303 0.14
€500,000 Zurich Finance USA 6.5% 14/10/2015 814,769 0.21 ___________ ______
156,647,528 40.06 ___________ ______
Total Transferable Securities Admitted
to an Official Stock Exchange Listing or
Dealt in on Another Regulated Market 366,335,641 93.69 ___________ ______
Unquoted Securities
BONDS
France
US$450,000 Credit Agricole SA '144A' FRN
31/5/2017 (Perpetual) 301,500 0.08
US$700,000 EDF SA '144A' 6.5% 26/1/2019 797,785 0.20
US$600,000 Societe Generale '144A' 5.75%
20/4/2016 578,256 0.15
US$100,000 Societe Generale '144A' 5.922%
5/4/2017 (Perpetual) 68,094 0.02 ___________ ______
1,745,635 0.45 ___________ ______
Luxembourg
US$1,000,000 Enel Finance International '144A'
6.25% 15/9/2017 1,093,768 0.28 ___________ ______
Netherlands
US$800,000 E.ON International Finance BV '144A'
5.8% 30/4/2018 851,541 0.21 ___________ ______
United Kingdom
US$600,000 Lloyds Banking Group 5.92%
1/10/2015 (Perpetual) 252,000 0.07
US$1,300,000 Smiths Group '144A' 7.2% 15/5/2019 1,415,524 0.36 ___________ ______
1,667,524 0.43 ___________ ______
United States
US$1,550,000 Anheuser-Busch InBev Worldwide
'144A' 5.375% 15/11/2014 1,647,321 0.42
US$720,000 BAE Systems Holdings '144A' 4.95%
1/6/2014 743,450 0.19
US$300,000 HVB Funding Trust I '144A' 8.741%
30/6/2031 216,000 0.06
€270,000 Lehman Brothers Holdings 4.75%
16/1/2014 (Defaulted) 63,658 0.02
US$450,000 Nissan Motor Acceptance '144A' 4.625%
8/3/2010 446,193 0.11
US$600,000 Pacific Life Insurance '144A' 9.25%
15/6/2039 636,078 0.16
US$1,500,000 Roche Holdings '144A' 5% 1/3/2014 1,619,762 0.42
US$100,000 Roche Holdings 7% 1/3/2039 125,234 0.03
US$400,000 Southeast Supply Header '144A' 4.85%
15/8/2014 405,347 0.10
US$660,000 Westpac Capital Trust III '144A' 5.819%
30/9/2013 (Perpetual) 514,975 0.13
US$1,000,000 ZFS Finance USA Trust II '144A' 6.45%
15/12/2065 885,000 0.23 ___________ ______
7,303,018 1.87 ___________ ______
Total Unquoted Securities 12,661,486 3.24 ___________ ______
Total Portfolio 378,997,127 96.93
Other Net Assets 12,007,073 3.07 ___________ ______
Total Net Assets (US$) 391,004,200 100.00 ___________ ______
Transferable Securities Admitted to an Official Stock Exchange
Listing or Dealt in on Another Regulated Market
Holding Description Value (US$) %
Unquoted Securities
Holding Description Value (US$) %
Portfolio of Investments 31 August 2009
(‡) Securities given in guarantee, see Note 12, for further details.

120 BlackRock Global Funds (BGF)
Global Corporate Bond Fund continued
Unrealised profit/(loss)
US$DescriptionNominal
Value
Unrealised profit/(loss)
US$DescriptionNominal
Value
€150,000 Credit Default Swaps (Barclays)
(Fund receives default protection on
Wolters Kluwer 5.125% 27/1/2014;
and pays Fixed 0.92%) (20/6/2013) (4,167)
€100,000 Credit Default Swaps (Deutsche Bank)
(Fund receives default protection on
Pearson Plc 7% 27/10/2014;
and pays Fixed 0.56%) (20/6/2013) (871)
€200,000 Credit Default Swaps (Citibank)
(Fund receives default protection on
Hannover Rueckversicherungs AG;
and pays Fixed 0.43%) (20/3/2013) (65)
€250,000 Credit Default Swaps (Morgan Stanley)
(Fund receives default protection on
Unilever NV 7.125% 1/11/2010;
and pays Fixed 0.33%) (20/3/2013) (1,493)
€100,000 Credit Default Swaps (Credit Suisse)
(Fund receives default protection on
Man Group Plc 3.75% 12/11/2009;
and pays Fixed 1.98%) (20/12/2013) 230
US$29,000 Credit Default Swaps (Deutsche Bank)
(Fund receives default protection on
Abu Dhabi (Emirate of) 5.5% 2/8/2012;
and pays Fixed 1.4%) (20/10/2013) (201)
€50,000 Credit Default Swaps (Credit Suisse)
(Fund provides default protection on
Heidelberg Cement Finance BV 4.75% 9/4/2009;
and receives Fixed 6.62%) (20/12/2013) (2,038)
€100,000 Credit Default Swaps (Deutsche Bank)
(Fund receives default protection on
ThyssenKrupp AG 4.375% 18/3/2015;
and pays Fixed 2.68%) (20/12/2013) 4,936
€150,000 Credit Default Swaps (Credit Suisse)
(Fund provides default protection on
Imperial Tobacco Group Plc 6.25% 4/12/2018;
and receives Fixed 3.6%) (20/12/2013) 17,452
US$55,100 Credit Default Swaps (Barclays)
(Fund receives default protection on
Abu Dhabi (Emirate of) 5.5% 2/8/2012;
and pays Fixed 1.8%) (20/10/2013) (1,244)
€100,000 Credit Default Swaps (Barclays)
(Fund receives default protection on
Svenska Cellulosa AB 4.5% 15/7/2015;
and pays Fixed 3.25%) (20/12/2013) (12,925)
€100,000 Credit Default Swaps (Barclays)
(Fund receives default protection on
Henkel AG & Co KGAA 4.25% 10/6/2013;
and pays Fixed 1.1%) (20/12/2013) (3,128)
€750,000 Credit Default Swaps (Citibank)
(Fund receives default protection on
Volkswagen AG 5.375% 22/5/2018;
and pays Fixed 2.85%) (20/6/2014) (76,560)
€100,000 Credit Default Swaps (Deutsche Bank)
(Fund receives default protection on
Deutsche Lufthansa AG 4.625% 6/5/2013;
and pays Fixed 1.77%) (20/9/2013) 633
€75,000 Credit Default Swaps (Barclays)
(Fund receives default protection on
JTI UK Finance Plc 4.625% 10/6/2011;
and pays Fixed 0.41%) (20/9/2013) (840)
€100,000 Credit Default Swaps (Citibank)
(Fund receives default protection on
Tomkins Plc 8% 20/12/2011;
and pays Fixed 2.9%) (20/9/2013) (7,661)
€7,150,000 Credit Default Swaps (Barclays)
(Fund receives default protection on
iTraxx Europe HiVol Series 11 Version;
and pays Fixed 3.75%) (20/6/2014) (366,994)
€2,300,000 Credit Default Swaps (Deutsche Bank)
(Fund receives default protection on
UPM Kymmene OYJ 5.625% 01/12/2014;
and pays Fixed 5%) (20/9/2014) (4,758)
€488,900 Credit Default Swaps (Credit Suisse)
(Fund receives default protection on
iTraxx Japan Series Number 10 Version 1;
and pays Fixed 9.75%) (20/6/2014) 89
US$16,740,000 Credit Default Swaps (Credit Suisse)
(Fund receives default protection on
CDX.NA.IG.11 V1;
and pays Fixed 1%) (20/6/2014) (62,043)
€11,100 Credit Default Swaps (Credit Suisse)
(Fund receives default protection on
Thomson 0%; and pays Fixed 9.75%)
(20/6/2014) 3,363
€1,000,000 Credit Default Swaps (Deutsche Bank)
(Fund provides default protection on
Arcelormittal 0%; and receives Fixed 5%)
(20/6/2014) 305,136
€750,000 Credit Default Swaps (Deutsche Bank)
(Fund receives default protection on
Volkswagen AG 5.375% 22/05/2018;
and pays Fixed 2.3%) (20/6/2014) (50,514)
€1,700,000 Credit Default Swaps (Citibank)
(Fund receives default protection on
Valeo SA 3.75% 24/6/2013;
and pays Fixed 2.1%) (20/6/2014) 35,202
€1,250,000 Credit Default Swaps (Citibank)
(Fund receives default protection on
Valeo SA 3.75% 24/6/2013;
and pays Fixed 2.2%) (20/6/2014) 18,345 __________
(210,116) __________
Swaps as at 31 August 2009
Note: The total market value of (US$1,012,938) of these transactions is included in the Statement of Net Assets (see Note 2c).

Audited Annual Report and Accounts 121
The notes on pages 236 to 244 form an integral part of these financial statements.
Global Corporate Bond Fund continued
Open Forward Foreign Exchange Transactions as at 31 August 2009
Core Fund US$
€1,035,000 £874,902 2/9/2009 58,745 58,745
US$1,477,619 £895,000 2/9/2009 24,810 24,810
€4,447,900 US$6,352,476 16/9/2009 3,187 3,187
US$159,355,665 €114,071,000 16/9/2009 (3,641,888) (3,641,888)
MXN45,730,000 US$3,532,584 18/9/2009 (102,393) (102,393)
US$3,511,357 MXN45,730,000 18/9/2009 81,167 81,167
US$4,042,509 ZAR33,814,500 18/9/2009 (281,439) (281,439)
PLN6,566,000 HUF430,250,282 25/9/2009 38,822 38,822
CAD8,592,000 US$7,834,984 28/10/2009 (60,750) (60,750)
NOK10,048,000 US$1,653,214 28/10/2009 9,942 9,942
US$2,333,876 AUD2,820,500 28/10/2009 (14,357) (14,357)
US$20,847,339 CAD22,637,500 28/10/2009 364,422 364,422
US$29,072,852 £17,787,000 28/10/2009 202,214 202,214
US$3,403,474 ¥319,527,000 28/10/2009 (34,175) (34,175)
ZAR6,000,000 US$732,925 28/10/2009 28,482 28,482
€1,035,000 £914,069 4/11/2009 (4,727) (4,727)
US$1,459,269 £895,000 4/11/2009 6,568 6,568 __________ __________
Net unrealised loss (3,321,370) (3,321,370)__________ __________
EUR Hedged Share Class €
€48,331,995 US$68,368,176 15/9/2009 485,727 694,094
US$533,250 €371,482 15/9/2009 1,704 2,435 __________ __________
Net unrealised profit 487,431 696,529 __________ __________
GBP Hedged Share Class £
£184,084,500 US$303,088,859 15/9/2009 (2,638,285) (4,282,930)__________ __________
Net unrealised loss (2,638,285) (4,282,930)__________ __________
Total net unrealised loss (6,907,771)__________
Note: The net unrealised loss attributed to these transactions is included in the Statement
of Net Assets (see Note 2c).
Unrealised
profit/(loss)
US$ Equivalent
Unrealised
profit/(loss)Value dateSalesPurchases
Open Futures Contracts as at 31 August 2009
246 Australian 3 Year Bond September 2009 55,260,749
32 Euro BOBL September 2009 5,315,572
25 Australian 10 Year Bond September 2009 15,260,988
(98) Euro Bund September 2009 (17,161,153)
220 US Long Bond (CBT) December 2009 26,186,875
43 Canadian 10 Year Bond December 2009 4,679,513
14 Long Gilt December 2009 2,695,244
(32) US Treasury 2 Year Note (CBT) December 2009 (6,918,500)
(72) US Treasury 10 Year Note December 2009 (8,417,250)
(97) Euro Schatz December 2009 (14,935,379)
(175) US Treasury 5 Year Note (CBT) December 2009 (20,130,469)__________
Total commitment 41,836,190 __________
Note: The net unrealised loss of US$628,531 attributed to these transactions is included
in the Statement of Net Assets (see Note 2c).
Value
US$
Expiration
dateContracts/Description
Number
of Contracts

122 BlackRock Global Funds (BGF)
Global Dynamic Equity Fund
FUNDS
Cayman Islands
84,954 Dragon Capital - Vietnam Enterprise
Investments 146,546 0.03
415,140 Vinaland 335,765 0.06 ___________ ______
482,311 0.09 ___________ ______
United States
22,900 Consumer Staples Select Sector SPDR
Fund – ETF 565,630 0.10
265,400 Financial Select Sector SPDR Fund 3,864,224 0.70
22,900 Health Care Select Sector SPDR Fund
– ETF 651,047 0.12
13,200 iShares Dow Jones US Telecommunications
Sector Index Fund – ETF 234,168 0.04
26,100 iShares MSCI Brazil Index Fund 1,525,806 0.28
111,000 iShares Silver Trust – ETF‡ 1,596,180 0.29
151,700 SPDR Gold Trust – ETF 14,100,515 2.55
7,200 SPDR KBW Bank ETF – ETF 167,616 0.03
256,700 Technology Select Sector SPDR Fund 5,126,299 0.93
3,300 Telecom HOLDRs Trust – ETF 77,880 0.01
70,800 Utilities Select Sector SPDR Fund – ETF 2,069,484 0.38
400 Vanguard Telecommunication Services
– ETF 20,200 0.00 ___________ ______
29,999,049 5.43 ___________ ______
Total Funds 30,481,360 5.52 ___________ ______
COMMON / PREFERRED STOCKS (SHARES) & WARRANTS
Australia
44,934 BHP Billiton 1,383,053 0.25
17,960 Newcrest Mining 450,804 0.08
82,331 Transurban Group 278,202 0.05
20,400 Woodside Petroleum 836,069 0.15 ___________ ______
2,948,128 0.53 ___________ ______
Austria
36,400 Telekom Austria 632,993 0.12 ___________ ______
Belgium
160,000 RHJ International 1,211,722 0.22 ___________ ______
Bermuda
1,100 Accenture 'A' 36,872 0.01
6,700 Arch Capital Group 431,480 0.08
400 Axis Capital Holdings 12,064 0.00
1,493 Bunge (Pref) 136,423 0.02
17,200 Endurance Specialty Holdings 597,528 0.11
4,100 Everest Re Group 343,252 0.06
500 Frontline 11,270 0.00
13,400 IPC Holdings 431,346 0.08
183,163 Katanga Mining 94,461 0.02
7,200 Nabors Industries 127,008 0.02
4,200 PartnerRe 310,254 0.06
8,400 Platinum Underwriters Holdings 306,264 0.05
8,900 RenaissanceRe Holdings 482,736 0.09 ___________ ______
3,320,958 0.60 ___________ ______
Brazil
25,000 All America Latina Logistica (Unit) 175,297 0.03
42,510 Cia Brasileira de Distribuicao Grupo Pao de
Acucar 'A' (Pref) 1,047,101 0.19
14,758 Cia Energetica de Minas Gerais ADR 215,613 0.04
43,400 Cosan 'A' 355,012 0.07
34,100 Cyrela Brazil Realty 432,019 0.08
15,800 Global Village Telecom Holding 282,844 0.05
72,500 Hypermarcas 1,159,218 0.21
19,800 MRV Engenharia e Participacoes 357,080 0.07
14,500 NET Servicos de Comunicacao (Pref) 153,432 0.03
2,834 Pa de Acucar Compania Brasileiria 69,807 0.01
5,200 PDG Realty Empreendimentos e
Participacoes 74,995 0.01
17,600 Petroleo Brasileiro ADR 709,808 0.13
217,700 Petroleo Brasileiro ADR 7,371,322 1.33
72,300 SLC Agricola 554,966 0.10
10,200 Usinas Siderurgicas de Minas Gerais 'A'
(Pref) 241,113 0.04
57,525 Vivo Participacoes ADR 1,313,870 0.24 ___________ ______
14,513,497 2.63 ___________ ______
Canada
65,000 Alamos Gold 582,220 0.11
48,100 Barrick Gold 1,669,070 0.30
700 BCE 16,942 0.00
14,600 Canadian Natural Resources 834,682 0.15
28,400 Canadian Pacific Railway 1,379,132 0.25
108,400 Eldorado Gold 1,119,061 0.20
600 EnCana 31,434 0.01
86,800 Goldcorp 3,153,444 0.57
240,800 IAMGOLD 2,788,088 0.51
210,812 Kinross Gold 4,019,694 0.73
20,048 Kinross Gold (Call Wts 3/9/2013) 76,183 0.01
9,800 New Gold 32,896 0.01
49,000 New Gold (Wts 3/4/2012) 1,330 0.00
1,200 Nexen 23,712 0.00
26,500 Rogers Communications 715,235 0.13
10,700 Rogers Communications 'B' 289,076 0.05
65,700 Sino-Forest 'A' 839,342 0.15
13,775 Suncor Energy 423,874 0.08
7,500 Talisman Energy 119,074 0.02
2,500 Teck Cominco 'B' 60,825 0.01
9,500 TELUS 288,803 0.05
1,200 Thomson Reuters 37,764 0.01
24,900 Viterra 215,601 0.04
279,100 Yamana Gold 2,555,519 0.46 ___________ ______
21,273,001 3.85 ___________ ______
Cayman Islands
37,700 BaWang International Group Holding 13,570 0.00
1,600 Garmin 51,409 0.01
580,600 Tianjin Port Development Holdings 223,221 0.04
9,396 XL Capital 253,598 0.05
117,900 XL Capital 'A' 2,005,479 0.36 ___________ ______
2,547,277 0.46 ___________ ______
China
420,000 China BlueChemical 'H' 224,874 0.04
12,500 China Communications Services 'H' 6,999 0.00
8,799 China Life Insurance ADR 557,769 0.10
358,900 China Shenhua Energy 'H' 1,446,986 0.26
270,400 China South Locomotive and Rolling Stock 159,428 0.03
926,300 Guangshen Railway 'H' 402,738 0.07
62,100 Huaneng Power International 'H' 43,504 0.01
123,300 Jiangsu Expressway 'H' 97,354 0.02
39,800 Ping An Insurance Group Company of
China 'H' 297,819 0.05
880,700 Xiamen International Port 'H' 153,392 0.03 ___________ ______
3,390,863 0.61 ___________ ______
Transferable Securities Admitted to an Official Stock Exchange
Listing or Dealt in on Another Regulated Market
Holding Description Value (US$) %
Transferable Securities Admitted to an Official Stock Exchange
Listing or Dealt in on Another Regulated Market
Holding Description Value (US$) %
Portfolio of Investments 31 August 2009

Audited Annual Report and Accounts 123
The notes on pages 236 to 244 form an integral part of these financial statements.
Global Dynamic Equity Fund continued
Cyprus100,000 AFI Development GDR 196,000 0.04 ___________ ______
Egypt297,742 Telecom Egypt 986,368 0.18 ___________ ______
Finland21,457 Fortum OYJ 555,258 0.10 ___________ ______
France14,100 AXA 319,745 0.06
1,000 AXA ADR 22,650 0.00
25,500 Cie Generale d'Optique Essilor
International 1,376,240 0.25
49,900 France Telecom 1,270,975 0.23
1,000 Sanofi-Aventis ADR 34,070 0.01
6,900 Thales 313,829 0.06
14,005 Total 797,778 0.14 ___________ ______
4,135,287 0.75 ___________ ______
Germany4,921 Allianz SE 566,333 0.10
9,139 Bayer 559,181 0.10
400 Bayer ADR 24,372 0.01
2,950 Bayerische Motoren Werke 133,267 0.02 ___________ ______
1,283,153 0.23 ___________ ______
Guernsey1,500 Amdocs 35,805 0.01 ___________ ______
Hong Kong554,258 Beijing Enterprises Holdings 2,731,595 0.49
2,410,081 Chaoda Modern Agriculture 1,430,311 0.26
47,300 Cheung Kong Holdings 561,117 0.10
158,600 Cheung Kong Infrastructure Holdings 577,023 0.10
91,700 China Mobile 892,034 0.16
339,500 Denway Motors 151,112 0.03
110,700 Hutchison Whampoa 778,368 0.14
500,600 Link REIT (Reit) 1,103,112 0.20
138,690 Noble Group 203,671 0.04
28,400 Shanghai Industrial Holdings 135,936 0.01
2,073,300 Tianjin Development Holdings 1,214,392 0.22
147,100 Wharf Holdings 659,490 0.12 ___________ ______
10,438,161 1.87 ___________ ______
India170,722 Adani Power 360,850 0.06
25,400 Bharat Heavy Electricals 1,201,460 0.22
4,800 Container Corporation of India 116,512 0.02
49,200 Hindustan Unilever 261,946 0.05
9,800 Housing Development Finance 496,644 0.09
14,136 Larsen & Toubro 453,814 0.08
34,000 Reliance Industries 1,396,280 0.25
22,600 State Bank of India 806,749 0.15 ___________ ______
5,094,255 0.92 ___________ ______
Indonesia1,720,769 Bumi Resources 495,062 0.09 ___________ ______
Ireland14,825 Covidien 581,437 0.11 ___________ ______
Israel1,800 Check Point Software Technologies 50,040 0.01
3,856 Ectel 3,278 0.00
26,130 Teva Pharmaceutical Industries ADR 1,333,942 0.24 ___________ ______
1,387,260 0.25 ___________ ______
Italy6,700 Assicurazioni Generali 165,817 0.03
40,100 Intesa Sanpaolo 171,899 0.03 ___________ ______
337,716 0.06 ___________ ______
Japan357,200 Aioi Insurance 1,767,081 0.32
29,300 Astellas Pharma 1,175,340 0.21
39,800 Canon 1,528,053 0.28
16,500 Coca-Cola Central Japan 227,133 0.04
47,277 Coca-Cola West Holdings 918,745 0.17
31,100 Daihatsu Motor 319,412 0.06
4,600 Daikin Industries 162,263 0.03
56,400 Daiwa House Industry 628,992 0.11
26,964 East Japan Railway 1,763,092 0.32
2,800 Fanuc 228,553 0.04
40,000 Fuji Heavy Industries 172,931 0.03
29,000 Fujitsu 195,236 0.03
49,100 Futaba Industrial 204,880 0.04
24,400 Hitachi Chemical 504,086 0.09
19,000 Hokkaido Coca-Cola Bottling 100,941 0.02
32,600 Honda Motor 1,028,994 0.19
60,300 HOYA 1,361,833 0.25
59,123 JGC 1,098,085 0.20
325 KDDI 1,848,954 0.33
49,000 Kinden 438,963 0.08
93,800 Kirin Holdings 1,374,947 0.25
192,200 Kubota 1,589,523 0.29
37,000 Kyowa Hakko Kogyo 449,642 0.08
83,800 Matsushita Electric Industrial 1,342,819 0.24
49,800 Mikuni Coca-Cola Bottling 420,423 0.08
135,800 Mitsubishi 2,752,949 0.50
24,100 Mitsubishi Tanabe Pharma 316,461 0.06
149,800 Mitsui & Co 1,952,547 0.35
31,088 Mitsui Sumitomo Insurance Group
Holdings 877,625 0.16
395,390 Mizuho Financial Group 969,500 0.18
17,000 Murata Manufacturing 804,431 0.15
19,400 NGK Insulators 452,740 0.08
1,600 Nintendo 432,930 0.08
5,600 Nippon Sheet Glass 19,633 0.00
19,500 Nippon Telegraph & Telephone 872,399 0.16
258,900 Nipponkoa Insurance 1,612,121 0.29
1,851 NTT DoCoMo 2,852,592 0.52
250 NTT Urban Development 247,352 0.04
167,100 Okumura* 691,870 0.12
9,600 Rinnai 476,980 0.09
6,700 Rohm 451,783 0.08
166,000 Sekisui House 1,595,999 0.29
69,400 Seven & I Holdings 1,679,303 0.30
8,800 Shimachu 207,732 0.04
42,000 Shin-Etsu Chemical 2,484,272 0.45
26,800 Shionogi & Co 657,138 0.12
900 Sony ADR 23,985 0.00
633,300 Sumitomo Chemical 3,037,606 0.55
14,600 Sumitomo Electric Industries 188,732 0.03
26,700 Sumitomo Mitsui Financial Group 1,151,444 0.21
84,300 Suzuki Motor 2,012,647 0.36
16,000 Tadano 78,636 0.01
11,900 Takeda Pharmaceutical 479,916 0.09
3,900 TDK 226,908 0.04
5,000 Terumo 263,483 0.05
122,500 Toda 494,031 0.09
47,500 Toho / Tokyo 796,392 0.14
104,600 Tokio Marine Holdings 3,116,008 0.56
292,000 Tokyo Gas 1,171,329 0.21
41,900 Toyota Industries 1,131,032 0.20
Transferable Securities Admitted to an Official Stock Exchange
Listing or Dealt in on Another Regulated Market
Holding Description Value (US$) %
Transferable Securities Admitted to an Official Stock Exchange
Listing or Dealt in on Another Regulated Market
Holding Description Value (US$) %
Portfolio of Investments 31 August 2009

124 BlackRock Global Funds (BGF)
Global Dynamic Equity Fund continued
20,700 Toyota Motor 888,240 0.16
242,800 Ube Industries 752,018 0.14
170 West Japan Railway 588,697 0.11 ___________ ______
59,660,382 10.79 ___________ ______
Jersey800 Shire ADR 39,360 0.01 ___________ ______
Kazakhstan86,500 KazMunaiGas Exploration Production
GDR 1,903,000 0.35 ___________ ______
Luxembourg930 ArcelorMittal 33,275 0.01 ___________ ______
Malaysia29,000 British American Tobacco Malaysia 377,991 0.07
419,850 IOI 609,236 0.11
60,500 PLUS Expressways 58,069 0.01
141,882 Resorts World 112,409 0.02
173,400 Telekom Malaysia 153,629 0.03
239,941 Tenaga Nasional 546,448 0.10
279,000 TM International 249,566 0.04 ___________ ______
2,107,348 0.38 ___________ ______
Mexico18,100 America Movil SAB de CV 'L' ADR 821,197 0.15
7,100 Fomento Economico Mexicano SAB de
CV ADR 262,771 0.05 ___________ ______
1,083,968 0.20 ___________ ______
Netherlands51,491 Koninklijke KPN 792,050 0.14
1,900 Koninklijke Philips Electronics 43,054 0.01
56,900 Unilever (NY Shares) 1,575,561 0.29 ___________ ______
2,410,665 0.44 ___________ ______
Norway30,200 StatoilHydro 662,928 0.12 ___________ ______
Philippines15,000 First Gen 6,609 0.00 ___________ ______
Russian Federation61,700 Gazprom OAO ADR 1,308,040 0.24
1,679,746 Kuzbassrazrezugol 377,943 0.07
53,541 MMC Norilsk Nickel 594,305 0.11
175,200 Novorossiysk Commercial Sea Port GDR 2,014,800 0.36
29,300 Polyus Gold ADR 589,516 0.11
2,187,060 RusHydro – CLS 74,141 0.01
530,293 RusHydro ADR 1,802,996 0.33
753,800 Sberbank 1,117,885 0.20
40,200 Surgutneftegaz ADR 345,720 0.06
24,800 Uralkali GDR 473,680 0.08 ___________ ______
8,699,026 1.57 ___________ ______
Singapore28,250 CapitaLand 72,601 0.01
233,000 Fraser and Neave 621,391 0.11
224,900 Keppel 1,185,557 0.22
314,610 MobileOne 372,664 0.07
111,000 Oversea-Chinese Banking 595,130 0.11
354,050 Parkway Holdings 488,052 0.09
14,731 Parkway Life Real Estate Investment Trust
(Reit) 10,816 0.00
124,000 SembCorp Marine 265,417 0.05
116,000 Singapore Press Holdings 294,095 0.05
639,375 Singapore Telecommunications 1,390,700 0.25 ___________ ______
5,296,423 0.96 ___________ ______
South Africa2,200 Anglo Platinum 192,559 0.03
19,400 Gold Fields ADR 231,636 0.04
8,800 Impala Platinum Holdings 204,413 0.04
4,400 Sasol 167,904 0.03 ___________ ______
796,512 0.14 ___________ ______
South Korea5,500 Cheil Industries 225,478 0.04
8,128 Korean Reinsurance 73,867 0.01
54,900 KT ADR 854,244 0.15
17,500 KT&G 943,030 0.17
8,800 LS 582,016 0.11
8,096 Meritz Fire & Marine Insurance 50,628 0.01
57,807 Paradise 152,051 0.03
1,200 POSCO 443,430 0.08
5,900 POSCO ADR 543,390 0.10
2,900 Samsung Electronics 1,790,295 0.32
14,100 Samsung Fine Chemicals 570,142 0.10
2,300 SK Telecom 322,284 0.06 ___________ ______
6,550,855 1.18 ___________ ______
Spain51,100 Iberdrola Renovables 232,561 0.04
61,725 Telefonica 1,558,934 0.28 ___________ ______
1,791,495 0.32 ___________ ______
Sweden400 Autoliv 12,980 0.00 ___________ ______
Switzerland50,500 ACE 2,630,545 0.48
15,946 Credit Suisse Group 794,293 0.14
49,402 Nestle 2,021,658 0.37
14,911 Novartis 688,261 0.12
6,360 Roche Holding Genusscheine 1,013,283 0.18
8,260 Transocean 628,916 0.11
6,350 Tyco Electronics 145,479 0.03
8,125 Tyco International 255,450 0.05
34,800 UBS 636,031 0.11
13,500 Weatherford International 269,055 0.05
6,037 Zurich Financial Services 1,322,790 0.24 ___________ ______
10,405,761 1.88 ___________ ______
Taiwan99,198 Asustek Computer 157,914 0.03
53,000 Catcher Technology 136,861 0.02
268,615 Chunghwa Telecom 460,252 0.08
58,971 Chunghwa Telecom ADR 1,013,711 0.18
364,344 Delta Electronics 974,049 0.18
15,450 High Tech Computer 155,361 0.03
145,475 HON HAI Precision Industry 490,566 0.09
10,000 MediaTek 145,216 0.03
529,288 Taiwan Semiconductor Manufacturing 951,919 0.17 ___________ ______
4,485,849 0.81 ___________ ______
Thailand345,800 Hana Microelectronics 201,318 0.04
83,000 PTT 595,472 0.11
326,000 Siam Commercial Bank 738,077 0.13 ___________ ______
1,534,867 0.28 ___________ ______
Transferable Securities Admitted to an Official Stock Exchange
Listing or Dealt in on Another Regulated Market
Holding Description Value (US$) %
Transferable Securities Admitted to an Official Stock Exchange
Listing or Dealt in on Another Regulated Market
Holding Description Value (US$) %
Portfolio of Investments 31 August 2009

Audited Annual Report and Accounts 125
The notes on pages 236 to 244 form an integral part of these financial statements.
Global Dynamic Equity Fund continued
United Kingdom
700 AstraZeneca ADR 32,753 0.01
160,200 BP 1,383,438 0.25
41,200 BP ADR 2,115,208 0.38
31,368 British American Tobacco 954,205 0.17
17,408 Cadbury ADR 658,545 0.12
46,700 Diageo ADR 2,884,659 0.52
720,747 Guinness Peat Group 411,998 0.07
289,800 HSBC Holdings 3,142,597 0.57
11,100 HSBC Holdings ADR 596,403 0.11
128,800 Lloyds TSB Group 232,784 0.04
19,500 Prudential 169,979 0.03
30,022 Unilever 818,718 0.15
7,800 Unilever ADR 211,536 0.04
602,311 Vodafone Group 1,298,387 0.24
40,817 Vodafone Group ADR 883,688 0.16 ___________ ______
15,794,898 2.86 ___________ ______
United States
205,500 3Com 873,375 0.16
11,400 3M 814,416 0.15
50,300 Abbott Laboratories 2,291,668 0.41
900 Advance Auto Parts 38,070 0.01
52,200 Aetna† 1,498,662 0.27
400 Affiliated Computer Services 'A' 18,004 0.00
8,800 Alliance Resource Partners 290,400 0.05
13,600 Allstate 397,120 0.07
32,600 Altria Group 593,320 0.11
21,200 American Commercial Lines 442,868 0.08
10,300 American Water Works 207,442 0.04
13,800 AmerisourceBergen 291,180 0.05
17,300 Amgen 1,029,696 0.19
2,200 Amphenol 'A' 76,252 0.01
19,750 Anadarko Petroleum 1,052,478 0.19
3,900 Analog Devices 110,448 0.02
13,100 Apache 1,114,417 0.20
11,000 Apple† 1,845,371 0.33
1,100 Archer-Daniels-Midland 31,097 0.01
70 Ascent Media 'A' 1,779 0.00
227,660 AT&T 5,925,990 1.07
3,200 Autodesk 75,040 0.01
17,900 Avnet 468,622 0.08
13,600 Avon Products† 436,288 0.08
97,600 Bank of America† 1,725,568 0.31
104,303 Bank of New York Mellon 2,976,808 0.54
4,500 Baxter International 256,590 0.05
700 Biogen Idec 34,643 0.01
2,500 BMC Software 87,600 0.02
42,800 Boeing 2,128,016 0.38
28,350 Boston Scientific 323,474 0.06
324,075 Bristol-Myers Squibb‡ 7,035,668 1.27
10,500 Broadcom 'A' 297,360 0.05
5,795 Bunge 391,047 0.07
42,900 Burlington Northern Santa Fe† 3,554,694 0.64
85,200 CA 1,902,516 0.34
3,000 Calpine 36,060 0.01
20,588 Cell Genesys 6,407 0.00
4,878 CenturyTel 157,998 0.03
500 CF Industries Holdings 40,675 0.01
64,700 Chevron 4,510,237 0.82
18,900 Chubb 922,698 0.17
55,200 Cigna† 1,621,224 0.29
92,900 Cisco Systems 2,011,285 0.36
96,169 Citigroup 478,922 0.09
13,200 CMS Energy 178,992 0.03
400 CNA Financial 9,584 0.00
9,300 CNX Gas 258,261 0.05
10,900 Coca-Cola 533,555 0.10
3,800 Cognizant Technology Solutions 'A' 131,898 0.02
166,000 Comcast 'A' 2,596,240 0.47
42,200 Complete Production Services† 380,644 0.07
3,700 Computer Sciences 181,818 0.03
47,900 Comverse Technology 421,520 0.08
7,800 ConAgra Foods 159,042 0.03
52,000 ConocoPhillips 2,340,000 0.42
84,300 Consol Energy† 3,152,820 0.57
9,200 Constellation Brands 'A' 138,092 0.02
157,400 Corning 2,390,906 0.43
13,600 Crown Holdings 339,864 0.06
27,200 CVS/Caremark 1,003,136 0.18
13,700 DaVita 700,892 0.13
23,000 Dell 358,340 0.06
18,800 Devon Energy 1,139,468 0.21
100 Discover Financial Services 1,353 0.00
400 Discovery Communications 'A' 10,368 0.00
600 Discovery Communications 'C' 14,034 0.00
18,200 DISH Network 'A' 299,026 0.05
500 Dover 17,270 0.00
67,500 Dow Chemical 1,441,800 0.26
8,456 Dr Pepper Snapple Group 225,183 0.04
26,700 eBay 590,607 0.11
1,100 Edison International 36,586 0.01
36,200 EI Du Pont de Nemours & Co 1,154,056 0.21
158,136 El Paso 1,473,828 0.27
34,100 Electronic Arts† 618,745 0.11
23,500 Eli Lilly & Co 784,900 0.14
31,400 EMC/Massachusetts 495,492 0.09
4,400 Endo Pharmaceuticals Holdings 99,770 0.02
2,500 ENSCO International 93,150 0.02
10,800 Entergy 851,040 0.15
13,600 Exelon 678,912 0.12
973 Extreme Networks 2,384 0.00
89,600 Exxon Mobil‡ 6,237,056 1.13
1,059 Fairpoint Communications 720 0.00
1,200 Family Dollar Stores 36,312 0.01
83,000 Fidelity National Financial 'A' 1,245,000 0.23
4,600 Fidelity National Information Services 112,286 0.02
800 Fluor 41,744 0.01
21,600 FMC 1,034,424 0.19
6,400 Forest Laboratories 185,536 0.03
27,012 Foster Wheeler 781,897 0.14
24,800 FPL Group 1,389,296 0.25
825 Freeport-McMoRan Copper & Gold (Pref) 1,163,456 0.21
1,500 Gap 29,430 0.01
10,200 General Communication 'A' 67,116 0.01
1,300 General Dynamics 76,804 0.01
124,260 General Electric 1,713,545 0.31
10,100 General Mills 596,405 0.11
21,000 Genzyme 1,140,720 0.21
14,900 Gilead Sciences 668,563 0.12
128,600 Global Industries 1,249,992 0.23
40,500 Golden Star Resources 103,334 0.02
5,100 Goldman Sachs Group 824,823 0.15
700 Goodrich 38,360 0.01
4,570 Google 'A'‡ 2,094,294 0.38
23,700 Halliburton 556,950 0.10
887 Hanesbrands 18,414 0.00
1,700 Harris 58,735 0.01
14,980 Healthsouth 228,445 0.04
13,750 Hess 694,375 0.13
600 Hewitt Associates 'A' 21,516 0.00
1,900 Hewlett-Packard 84,398 0.02
Portfolio of Investments 31 August 2009
Transferable Securities Admitted to an Official Stock Exchange
Listing or Dealt in on Another Regulated Market
Holding Description Value (US$) %
Transferable Securities Admitted to an Official Stock Exchange
Listing or Dealt in on Another Regulated Market
Holding Description Value (US$) %

126 BlackRock Global Funds (BGF)
Global Dynamic Equity Fund continued
8,600 HJ Heinz 329,208 0.06
106,200 Hologic 1,721,502 0.31
400 Honeywell International 14,688 0.00
41,000 Humana† 1,455,500 0.26
31,600 International Business Machines 3,705,416 0.67
40,700 International Game Technology 830,280 0.15
13,400 International Paper 296,810 0.05
9,200 Invitrogen 413,080 0.07
4,450 JDS Uniphase 30,483 0.01
92,400 Johnson & Johnson 5,558,784 1.01
135,820 JPMorgan Chase & Co† 5,802,230 1.05
18,725 KBR 425,058 0.08
13,800 Key Energy Services 98,118 0.02
6,500 King Pharmaceuticals 67,470 0.01
77,775 Kraft Foods 'A' 2,191,700 0.40
200 L-3 Communications Holdings 14,758 0.00
21,800 Lexmark International 'A' 410,494 0.07
4 Liberty Media – Capital 'A' 76 0.00
16 Liberty Media – Entertainment 'A' 442 0.00
618 Liberty Media – Interactive 'A' 5,741 0.00
9,700 Lockheed Martin 722,553 0.13
5,168 LSI 26,564 0.01
3,700 Macquarie Infrastructure 22,200 0.00
300 Manpower 15,510 0.00
48,175 Marathon Oil 1,482,345 0.27
2,300 Marsh & McLennan 53,912 0.01
82,400 Mattel 1,476,608 0.27
25,000 McDermott International 587,750 0.11
11,800 McDonald's 658,440 0.12
1,300 McGraw-Hill Companies 42,952 0.01
12,100 McKesson 680,504 0.12
15,600 Mead Johnson Nutrition 'A' 628,212 0.11
18,650 Medco Health Solutions 1,020,155 0.18
56,700 Medtronic 2,161,404 0.39
2,900 MEMC Electronic Materials 46,342 0.01
72,900 Merck & Co 2,350,296 0.43
14,700 Metlife† 554,190 0.10
3,200 Mettler Toledo International 280,224 0.05
319,500 Microsoft† 7,830,913 1.42
32,000 Morgan Stanley† 909,760 0.16
30,100 Motorola 214,312 0.04
6,200 Murphy Oil 353,462 0.06
45,024 Mylan† 656,900 0.12
334 Mylan (Pref) 323,228 0.06
31,050 National Oilwell Varco 1,125,873 0.20
4,700 National Semiconductor 70,782 0.01
59,800 Newmont Mining 2,409,342 0.44
51,900 News 561,039 0.10
900 Noble 31,482 0.01
400 Noble Energy 24,204 0.00
36,000 Northern Trust 2,085,480 0.38
700 Northrop Grumman 34,083 0.01
10,900 Novell 46,925 0.01
24,200 Occidental Petroleum 1,768,294 0.32
53,400 Oracle 1,175,334 0.21
1,900 Pall 56,316 0.01
2,100 Panera Bread 'A' 109,899 0.02
400 Pepsi Bottling Group 14,276 0.00
2,800 PepsiAmericas 78,260 0.01
12,650 PerkinElmer 228,333 0.04
11,100 Perrigo 324,120 0.06
23,000 Pfizer 382,490 0.07
358 PharMerica 7,135 0.00
25,900 Philip Morris International 1,180,004 0.21
1,200 Pitney Bowes 26,928 0.01
61,000 Polycom† 1,418,860 0.26
13,700 PPL 401,410 0.07
1,050 Praxair 80,157 0.01
10,200 Precision Castparts 928,710 0.17
1,400 Pride International 35,882 0.01
10,300 Principal Financial Group 289,430 0.05
56,200 Procter & Gamble 2,984,782 0.54
26,400 Progressive 434,544 0.08
26,000 QUALCOMM 1,202,989 0.22
172,500 Qwest Communications International 633,075 0.11
1,912 Ralcorp Holdings 119,710 0.02
300 Reynolds American 13,671 0.00
800 Ross Stores 37,320 0.01
1,200 Ryder System 45,588 0.01
1,400 Safeway 26,740 0.00
107,000 Sara Lee 1,035,760 0.19
75,000 Schering-Plough 2,106,000 0.38
24,400 Schlumberger 1,371,768 0.25
93 Seahawk Drilling 2,140 0.00
4,000 Smith International 111,240 0.02
5,800 Southern 181,540 0.03
71,600 Spirit Aerosystems Holdings 'A' 1,109,084 0.20
68,000 Sprint Nextel 252,960 0.05
30,900 St Joe 1,002,396 0.18
4,550 Stone Energy 58,331 0.01
22,025 Sun Microsystems 205,273 0.04
300 Sunoco 7,995 0.00
3,291 SUPERVALU 46,930 0.01
1,700 Synopsys 36,066 0.01
4,100 Teradata 110,331 0.02
17,200 Texas Instruments 421,916 0.08
15,200 Thermo Fisher Scientific 681,872 0.12
17,166 Time Warner 481,678 0.09
4,309 Time Warner Cable 159,648 0.03
2,600 Total System Services 39,546 0.01
5,700 Transatlantic Holdings 278,046 0.05
35,300 Travelers 1,746,644 0.32
31,800 Unifi 68,688 0.01
50,800 Union Pacific 3,048,508 0.55
4,100 United Technologies 242,310 0.04
67,900 UnitedHealth Group† 1,885,583 0.34
1,800 Unum Group 40,428 0.01
700 URS 30,030 0.01
83,200 US Bancorp 1,856,192 0.34
1,500 Valero Energy 27,675 0.01
1,900 VeriSign 40,755 0.01
130,000 Verizon Communications 3,997,500 0.72
49,000 Viacom 'B' 1,233,330 0.22
133 WABCO Holdings 2,547 0.00
69,700 Wal-Mart Stores 3,571,428 0.65
13,200 Waters 664,884 0.12
36,100 WellPoint† 1,913,300 0.35
117,800 Wells Fargo & Co 3,219,474 0.58
5,500 Western Digital 184,910 0.03
17,200 Western Union 317,512 0.06
12,510 Windstream 106,710 0.02
47,300 Wyeth 2,260,467 0.41
139,700 Xerox 1,208,405 0.22
1,200 Xilinx 26,604 0.00
15,500 Xto Energy 595,355 0.11 ___________ ______
203,074,815 36.74 ___________ ______
Total Common / Preferred Stocks (Shares)
& Warrants 401,715,217 72.67 ___________ ______
Portfolio of Investments 31 August 2009
Transferable Securities Admitted to an Official Stock Exchange
Listing or Dealt in on Another Regulated Market
Holding Description Value (US$) %
Transferable Securities Admitted to an Official Stock Exchange
Listing or Dealt in on Another Regulated Market
Holding Description Value (US$) %

Audited Annual Report and Accounts 127
The notes on pages 236 to 244 form an integral part of these financial statements.
(†) Securities pledged, see Note 12, for further details.(‡) Securities given in guarantee, see Note 12, for further details.
Global Dynamic Equity Fund continued
Portfolio of Investments 31 August 2009
BONDS
BermudaCNY11,700,000 Gome Electrical Appliances Holdings
0% 18/5/2014 (Zero Coupon) 1,640,079 0.30 ___________ ______
CanadaUS$600,000 Addax Petroleum 'AXC' 3.75%
31/5/2012 691,145 0.12 ___________ ______
Cayman IslandsUS$600,000 China Milk Products Group 0% 5/1/2012
(Zero Coupon) 657,000 0.12
US$74,000 DBS Capital Funding 7.657% 15/3/2011
(Perpetual) 74,111 0.01
US$5,600,000 FU JI Food and Catering Services
Holdings 0% 18/10/2010 (Zero coupon) 582,085 0.10
US$900,000 YTL Power Finance Cayman 0%
9/5/2010 (Zero coupon) 1,080,000 0.20 ___________ ______
2,393,196 0.43 ___________ ______
IndiaUS$300,000 Gujarat NRE Coke 0% 12/4/2011
(Zero coupon) 316,500 0.06 ___________ ______
JapanUS$17,000,000 Bank of Kyoto '2' 0% 31/3/2014 192,554 0.03 ___________ ______
JerseyUS$1,200,000 Aldar Funding 5.767% 10/11/2011 1,291,500 0.23
US$4,380,000 Dana Gas Sukuk 7.5% 31/10/2012 3,898,200 0.71 ___________ ______
5,189,700 0.94 ___________ ______
MalaysiaUS$400,000 Cherating Capital 2% 5/7/2012 429,520 0.08
US$500,000 Feringghi Capital 0% 22/12/2009
(Zero coupon) 574,100 0.10
US$1,250,000 IOI Capital 0% 18/12/2011
(Zero coupon) 1,490,625 0.27 ___________ ______
2,494,245 0.45 ___________ ______
SingaporeUS$600,000 Wilmar International 0% 18/12/2012 793,860 0.14
US$1,000,000 Yanlord Land Group 5.85% 13/7/2014 754,725 0.14 ___________ ______
1,548,585 0.28 ___________ ______
United KingdomUS$211,000 Lloyds TSB Bank 13% 22/1/2019
(Perpetual) 286,426 0.05 ___________ ______
United StatesUS$5,990,000 Advanced Micro Devices 6% 1/5/2015 4,065,713 0.74
US$23,000 Advanced Micro Devices 7.75%
1/11/2012 19,148 0.00
US$1,772,000 Amgen 0.375% 1/2/2013 1,752,065 0.32
US$31,000 Cell Genesys 3.125% 1/5/2013 14,201 0.00
US$1,226,000 Chesapeake Energy 2.25% 15/12/2038 847,473 0.15
US$1,204,000 Chesapeake Energy 2.5% 15/5/2037 963,200 0.17
US$521,000 Intel 2.95% 15/12/2035 465,644 0.08
US$202,000 Millipore 3.75% 1/6/2026 204,020 0.04
US$1,282,000 Mylan 1.25% 15/3/2012 1,190,658 0.22
US$275,000 Preferred Term Securities FRN
22/10/2037 28 0.00
US$400,000 Preferred Term Securities XXII 0%
22/3/2037 40 0.00
US$550,000 Preferred Term Securities XXV FRN
22/6/2037 55 0.00
US$200,000 Preferred Term Securities XXVII FRN
22/12/2037 6,620 0.00
US$278,000 SonoSite 3.75% 15/7/2014 254,023 0.05
US$2,995,000 US Treasury Bill 0% 3/9/2009 2,994,991 0.54
US$5,623,000 US Treasury Bill 0% 10/9/2009 5,622,921 1.02
US$315,000 US Treasury Bill 0% 17/9/2009 314,989 0.06
US$10,253,000 US Treasury Bill 0% 24/9/2009 10,252,303 1.85
US$3,605,000 US Treasury Bill 0% 1/10/2009 3,604,746 0.65
US$2,200,000 US Treasury Bill 0% 8/10/2009 2,199,803 0.40
US$3,492,000 US Treasury Bill 0% 15/10/2009 3,491,621 0.63
US$7,385,000 US Treasury Bill 0% 22/10/2009 7,383,881 1.34
US$8,940,000 US Treasury Bill 0% 29/10/2009 8,938,431 1.62
US$3,328,000 US Treasury Bill 0% 5/11/2009 3,327,389 0.60
US$13,110,000 US Treasury Bill 0% 12/11/2009 13,106,808 2.37
US$18,400,000 US Treasury Bill 0% 19/11/2009 18,394,811 3.33
US$5,374,000 US Treasury Bill 0% 27/11/2009 5,372,331 0.97
US$6,111,000 US Treasury Bond 2.75% 31/7/2010 6,242,784 1.13 ___________ ______
101,030,697 18.28 ___________ ______
Total Bonds 115,783,127 20.94 ___________ ______
Total Transferable Securities Admitted
to an Official Stock Exchange Listing or
Dealt in on Another Regulated Market 547,979,704 99.13 ___________ ______
Unquoted Securities
COMMON & PREFERRED STOCKS (SHARES)
Canada14,200 Nortel Networks 1,136 0.00 ___________ ______
United States22,400 Circuit City Stores 314 0.00
207 NRG Energy 287,264 0.05
1,349 El Paso (Pref) 1,160,476 0.21 ___________ ______
1,448,054 0.26 ___________ ______
Total Common & Preferred Stocks (Shares) 1,449,190 0.26 ___________ ______
BONDS
CanadaUS$1,438,000 Sino-Forest '144A' 5% 1/8/2013 1,416,430 0.25 ___________ ______
MalaysiaMYR2,250,000 Berjaya Land 8% 15/8/2011 654,015 0.12 ___________ ______
United StatesUS$587,000 Intel '144A' 3.25% 1/8/2039 623,688 0.11
US$440,000 SBA Communications '144A' 4%
1/10/2014 466,950 0.09 ___________ ______
1,090,638 0.20 ___________ ______
Total Bonds 3,161,083 0.57 ___________ ______
Total Unquoted Securities 4,610,273 0.83 ___________ ______
Total Portfolio 552,589,977 99.96
Other Net Assets 226,818 0.04 ___________ ______
Total Net Assets (US$) 552,816,795 100.00 ___________ ______
Transferable Securities Admitted to an Official Stock Exchange
Listing or Dealt in on Another Regulated Market
Holding Description Value (US$) %
Transferable Securities Admitted to an Official Stock Exchange
Listing or Dealt in on Another Regulated Market
Holding Description Value (US$) %

128 BlackRock Global Funds (BGF)
Global Dynamic Equity Fund continued
Unrealised profit
US$DescriptionNominal
Value
US$844 Total Return Swap (BNP Paribas)
(Fund receives NDDUE15X + 0bps;
and pays 3M Libor - 85bps) (31/8/2010) 174,621 __________
174,621 __________
Swaps as at 31 August 2009
Note: The total market value of US$174,621 of this transaction is included in the Statement of Net Assets (see Note 2c).
Open Futures Contracts as at 31 August 2009
385 DJ Euro Stoxx 50 September 2009 15,266,195
186 S&P 500 September 2009 47,267,250
78 Yen Denom Nikkei September 2009 4,366,188
65 FTSE 100 September 2009 5,182,713
36 Emini MSCI EAFE September 2009 2,670,660
30 Nikkei 225 (OSE) September 2009 3,371,511
30 MSCI Taiwan September 2009 745,200
10 S&P/TSX 60 IX September 2009 1,178,193
7 TOPIX Index September 2009 724,203
6 SPI 200 September 2009 560,934
5 DAX Index September 2009 976,486 __________
Total commitment 82,309,533 __________
Note: The net unrealised gain of US$5,173,974 attributed to these transactions is included
in the Statement of Net Assets (see Note 2c).
Value
US$
Expiration
dateContracts/Description
Number
of Contracts
Open Forward Foreign Exchange Transactions as at 31 August 2009
Core Fund US$
AUD629,255 US$520,690 8/9/2009 5,376 5,376
CAD2,592,204 US$2,360,673 8/9/2009 (15,306) (15,306)
€2,344,705 US$3,333,706 8/9/2009 16,679 16,679
£897,905 US$1,455,980 8/9/2009 1,525 1,525
HKD728,802 US$94,039 8/9/2009 (8) (8)
¥1,394,832,490 US$14,841,896 8/9/2009 159,352 159,352
MXN3,244,286 US$251,366 8/9/2009 (7,703) (7,703)
NOK1,046,121 US$172,954 8/9/2009 458 458
SEK1,293,460 US$180,261 8/9/2009 1,149 1,149
US$520,709 AUD629,255 8/9/2009 (5,357) (5,357)
US$2,844,413 CHF3,034,073 8/9/2009 (12,662) (12,662)
US$1,479,224 £897,905 8/9/2009 21,719 21,719
US$94,035 HKD728,802 8/9/2009 4 4
US$247,052 MXN3,244,286 8/9/2009 3,389 3,389
US$172,431 NOK1,046,121 8/9/2009 (981) (981)
US$181,162 SEK1,293,460 8/9/2009 (248) (248)
US$3,190,401 SGD4,619,860 8/9/2009 (9,626) (9,626)
US$144,699 ZAR1,158,440 8/9/2009 (3,717) (3,717)
ZAR1,158,440 US$147,077 8/9/2009 1,339 1,339
BRL4,413,200 US$2,382,937 9/9/2009 (41,501) (41,501)
INR3,895,503 US$79,500 9/9/2009 246 246
KRW243,290,000 US$194,975 9/9/2009 (184) (184)
MYR1,894,150 US$536,131 9/9/2009 1,584 1,584
TWD6,200,400 US$188,147 9/9/2009 280 280
US$79,965 INR3,895,503 9/9/2009 219 219
US$194,733 KRW243,290,000 9/9/2009 (58) (58)
US$535,676 MYR1,894,150 9/9/2009 (2,039) (2,039)
US$188,319 TWD6,200,400 9/9/2009 (109) (109)__________ __________
Net unrealised profit 113,820 113,820 __________ __________
EUR Hedged Share Class €
€16,000,255 US$22,631,700 15/9/2009 161,856 231,289
US$623,206 €441,418 15/9/2009 (5,278) (7,542)__________ __________
Net unrealised profit 156,578 223,747 __________ __________
Total net unrealised profit 337,567 __________
Note: The net unrealised profit attributed to these transactions is included in the Statement
of Net Assets (see Note 2c).
Unrealised
profit/(loss)
US$ Equivalent
Unrealised
profit/(loss)Value dateSalesPurchases
Sector Breakdown as at 31 August 2009
US government 16.51
Finance 12.85
Energy 10.80
Healthcare 10.56
Information technology 8.97
Industrials 8.23
Materials 7.23
Consumer staples 7.07
Telecommunication services 6.15
Investment funds 5.52
Consumer discretionary 4.30
Utilities 1.76
Mortgage securities 0.01
Other net assets 0.04 __________
100.00 __________
% of net
assets

Audited Annual Report and Accounts 129
The notes on pages 236 to 244 form an integral part of these financial statements.
Global Dynamic Equity Fund continued
219 General Motors Call Option
strike price US$50
expiring on 16/1/2010 (94,707) 219
206 General Motors Call Option
strike price US$60
expiring on 16/1/2010 (33,039) 618
155 S&P 500 Call Option
strike price US$925
expiring on 19/12/2009 900,859 1,784,825
25 S&P 500 Call Option
strike price US$1,000
expiring on 19/12/2009 (65,288) 159,750 ___________ _________
Total Purchased Call Options 707,825 1,945,412 ___________ _________
Note: Purchased Call Options are included in the Statement of Net Assets (see Note 2c).
Value US$
Unrealised profit/(loss)
US$Issuer
Number ofcontracts
subject to Call
Purchased Call Options as at 31 August 2009
58 S&P 500 Put Option
strike price US$875
expiring on 19/9/2009 (200,103) 6,380
24 S&P 500 Put Option
strike price US$900
expiring on 19/12/2009 (84,306) 57,600 ___________ _________
Total Purchased Put Options (284,409) 63,980 ___________ _________
Note: Purchased Put Options are included in the Statement of Net Assets (see Note 2c).
Value US$
Unrealised loss US$Issuer
Number ofcontracts
subject to Put
Purchased Put Options as at 31 August 2009
Value US$
Unrealised profit/(loss)
US$Issuer
Number ofcontracts
Subjectto Call
Value US$
Unrealised profit/(loss)
US$Issuer
Number ofcontracts
Subjectto Call
(80) Morgan Stanley Call Option
strike price US$33
expiring on 17/10/2009 11,759 (2,800)
(101) Cigna Call Option
strike price US$30
expiring on 16/1/2010 (12,953) (34,340)
(105) Com Pro Call Option
strike price US$7.50
expiring on 16/1/2010 (12,671) (22,838)
(110) Apple Computer Inc Call Option
strike price US$85
expiring on 16/1/2010 (630,141) (916,575)
(130) Wellpnt Call Option
strike price US$55
expiring on 19/12/2009 (14,692) (54,600)
(132) Burlington Northern
Santa Fe Call Option
strike price US$80
expiring on 16/1/2010 (5,679) (104,280)
(132) Electronic Arts Call Option
strike price US$22.50
expiring on 16/1/2010 23,067 (9,240)
(135) Mylan Call Option
strike price US$15
expiring on 17/10/2009 (2,440) (9,450)
(136) Avon Products Inc Call Option
strike price US$22.50
expiring on 16/1/2010 (105,744) (134,640)
(147) Metlife Call Option
strike price US$40
expiring on 19/12/2009 (15,142) (41,160)
(148) Humana Call Option
strike price US$32
expiring on 21/11/2009 (39,522) (79,920)
(153) Polycom Inc Call Option
strike price US$20
expiring on 16/1/2010 (46,351) (65,790)
(155) S&P 500 Call Option
strike price US$1,025
expiring on 19/12/2009 (417,416) (773,450)
(209) Aetna Call Option
strike price US$30
expiring on 17/10/2009 (9,317) (34,485)
(212) Consol Energy Inc Call Option
strike price US$46
expiring on 16/1/2010 87,954 (41,340)
(221) Cigna Call Option
strike price US$25
expiring on 17/10/2009 (62,780) (112,710)
(308) UnitedHealth Call Option
strike price US$27
expiring on 19/12/2009 (34,499) (104,720)
(336) Microsoft Call Option
strike price US$17.50
expiring on 16/1/2010 (138,769) (241,920)
(319) JP Morgan Call Option
strike price US$39
expiring on 19/12/2009 (97,524) (188,210)
(619) Bank of America Call Option
strike price US$15
expiring on 21/11/2009 (128,745) (210,460)
(623) Microsoft Call Option
strike price US$25
expiring on 17/10/2009 26,160 (45,479)___________ _________
Total Written Call Options (1,625,445) (3,228,407)___________ _________
Written Call Options as at 31 August 2009
Note: Written Call Options are included in the Statement of Net Assets (see Note 2c).

130 BlackRock Global Funds (BGF)
Global Dynamic Equity Fund continued
(24) S&P 500 Put Option
strike price US$800
expiring on 19/12/2009 49,137 (24,240)
(58) S&P 500 Put Option
strike price US$800
expiring on 19/9/2009 113,956 (2,610)___________ _________
Total Written Put Options 163,093 (26,850)___________ _________
Note: Written Put Options are included in the Statement of Net Assets (see Note 2c).
Value US$
Unrealised profit
US$Issuer
Number ofcontracts
subject to Put
Written Put Options as at 31 August 2009
2,999,826 DJ Euro Stoxx 50 Call/Put Option
strike price US$3,271.35
- US$3,762.05/US$3,173.21
expiring on 16/7/2010 388,478
3,300,000 DJ Euro Stoxx 50 Call/Put Option
strike price €3,401.60 - €3,911.84/€3,299.55
expiring on 16/7/2010 388,606 _________
777,084 _________
Note: Spread Options are included in the Statement of Net Assets (see Note 2c).
Unrealised Profit
US$Issuer
Number ofcontracts
subject to Call/Put
Spread Options as at 31 August 2009

Audited Annual Report and Accounts 131
The notes on pages 236 to 244 form an integral part of these financial statements.
Global Enhanced Equity Yield Fund
COMMON STOCKS (SHARES) & WARRANTS
Australia
107,006 AMP 569,221 0.22
17,442 ASX 482,881 0.19
12,323 BHP Billiton 379,298 0.15
109,966 Billabong International 965,747 0.38
51,242 Commonwealth Bank of Australia 1,971,513 0.78
149,834 Insurance Australia Group 448,652 0.18
38,799 Leighton Holdings 1,199,087 0.47
125,614 Metcash 449,674 0.18
331,152 Telstra 902,944 0.36
256,536 Transurban Group 866,853 0.34
66,091 Westfield Group (Reit) 699,829 0.28
59,434 Westpac Banking 1,211,452 0.48
2,936 Woodside Petroleum 120,328 0.05 ___________ ______
10,267,479 4.06 ___________ ______
Austria
53,254 Telekom Austria 926,083 0.36 ___________ ______
Belgium
34,144 Anheuser-Busch InBev 195 0.00
28,175 InBev 1,195,312 0.47 ___________ ______
1,195,507 0.47 ___________ ______
Canada
5,800 Agnico-Eagle Mines 331,076 0.13
55,686 ARC Energy Trust (Unit) 870,116 0.34
19,400 Bank of Montreal 917,472 0.36
12,200 Canadian Imperial Bank of Commerce 699,381 0.28
1 Canadian Oil Sands Trust (Unit) 25 0.00
47,278 Crescent Point Energy 1,575,859 0.62
24,500 EnCana 1,283,907 0.51
13,422 Enerplus Resources Fund (Unit) 279,308 0.11
59,800 Ivanhoe Mines 648,723 0.26
26,100 Manulife Financial 522,353 0.21
1 Penn West Energy Trust (Unit) 13 0.00
4,600 Research In Motion 332,997 0.13
42,200 Shaw Communications 'B' 701,009 0.28
44,900 Sun Life Financial* 1,301,194 0.51
11,622 TMX Group 366,772 0.15
19,200 Toronto-Dominion Bank 1,169,457 0.46 ___________ ______
10,999,662 4.35 ___________ ______
Denmark
4,300 Coloplast 'B' 330,190 0.13
5,850 Vestas Wind Systems 417,206 0.17 ___________ ______
747,396 0.30 ___________ ______
Finland
41,200 Fortum OYJ 1,066,161 0.42
1,400 Kesko OYJ 'B' 40,770 0.02
762 Nokia OYJ 10,464 0.01
36,069 Orion 'B' 612,291 0.24
25,400 Sampo 'A' 609,385 0.24 ___________ ______
2,339,071 0.93 ___________ ______
France
45,845 AXA 1,039,623 0.41
8,131 Bouygues 402,756 0.16
71,872 Credit Agricole 1,332,521 0.53
39,006 GDF Suez 1,636,140 0.65
11,321 Neopost 928,547 0.37
8,200 Schneider Electric 751,067 0.29
1 Societe Television Francaise 1 16 0.00
38,522 Total 2,194,359 0.87
4,683 Vallourec 709,312 0.28
31,981 Veolia Environnement 1,102,012 0.43
29,811 Vivendi 853,227 0.34 ___________ ______
10,949,580 4.33 ___________ ______
Germany
9,486 Allianz SE 1,091,696 0.43
35,539 BASF SE 1,847,968 0.73
28,015 Daimler 1,258,578 0.50
20,035 Deutsche Lufthansa 320,638 0.13
64,393 Deutsche Post 1,106,908 0.44
52,511 Deutsche Telekom 699,316 0.28
14,500 K+S 732,842 0.29
8,702 MAN 662,383 0.26
2,935 RWE 269,666 0.10 ___________ ______
7,989,995 3.16 ___________ ______
Greece
22,321 OPAP 544,126 0.22 ___________ ______
Hong Kong
79,315 Bank of East Asia 255,821 0.10
500 BOC Hong Kong Holdings 1,002 0.00
66,000 Hang Seng Bank 937,502 0.37
44,000 Hong Kong Exchanges and Clearing 766,350 0.30
51,500 Wing Hang Bank 465,100 0.19 ___________ ______
2,425,775 0.96 ___________ ______
Ireland
50 Covidien 1,961 0.00
3,895 CRH 97,120 0.04 ___________ ______
99,081 0.04 ___________ ______
Italy
548,518 A2A* 1,050,274 0.42
9,530 Alleanza Assicurazioni 77,416 0.03
62,984 Banca Popolare di Milano Scarl 472,494 0.19
61,855 ENI 1,451,293 0.57
38,700 Mediobanca 529,489 0.21
48,497 Terna Rete Elettrica Nazionale 177,230 0.07
36,679 Unione di Banche Italiane SCPA 551,891 0.22
36,679 Unione di Banche Italiane SCPA
(Call Wts 30/6/2011) 3,931 0.00 ___________ ______
4,314,018 1.71 ___________ ______
Japan
24,300 Astellas Pharma 974,770 0.39
15,400 Canon 591,257 0.23
49,100 Daiichi Sankyo 1,048,164 0.41
31,000 Fujitsu 208,700 0.08
20,400 Honda Motor 643,910 0.25
11,300 HOYA 255,202 0.10
163 Japan Prime Realty Investment (Reit) 390,036 0.15
8 Japan Real Estate Investment (Reit) 65,215 0.03
11,000 Kansai Electric Power 253,159 0.10
19,000 Kao 482,228 0.19
69,100 Marui Group 480,062 0.19
45,000 Matsui Securities 417,164 0.16
Portfolio of Investments 31 August 2009
Transferable Securities Admitted to an Official Stock Exchange
Listing or Dealt in on Another Regulated Market
Holding Description Value (US$) %
Transferable Securities Admitted to an Official Stock Exchange
Listing or Dealt in on Another Regulated Market
Holding Description Value (US$) %

132 BlackRock Global Funds (BGF)
Global Enhanced Equity Yield Fund continued
135,681 Mitsubishi UFJ Financial Group 866,747 0.34
364,000 Mitsui Mining & Smelting 1,041,286 0.41
15,600 Mitsui Sumitomo Insurance Group Holdings 440,394 0.17
6,000 Nintendo 1,623,488 0.64
47,429 Nippon Paper Group 1,395,046 0.55
188,000 Nippon Sheet Glass 659,117 0.26
95,700 Nomura Holdings 847,030 0.34
170 Nomura Real Estate Office Fund (Reit) 1,179,222 0.47
23,000 OJI Paper 108,587 0.04
3,218 SBI Holdings 721,917 0.29
57,700 Sega Sammy Holdings 753,324 0.30
12,400 Seven & I Holdings 300,048 0.12
67,000 Sharp 774,587 0.31
5,800 Shin-Etsu Chemical 343,066 0.14
65,000 Sompo Japan Insurance 443,889 0.18
132,000 Sumitomo Metal Industries 330,763 0.13
6,238 Sumitomo Mitsui Financial Group 269,015 0.11
14,000 T&D Holdings 420,821 0.17
25,000 Takeda Pharmaceutical 1,008,227 0.40
3,400 Terumo 179,169 0.07
9,900 Tokio Marine Holdings 294,919 0.12
44,700 Tokyo Electric Power 1,165,753 0.46
289,000 Toshiba 1,485,637 0.59
59,000 Toyota Motor 2,531,699 1.00 ___________ ______
24,993,618 9.89 ___________ ______
Netherlands
7,362 Corio (Reit) 446,350 0.17
31,754 Koninklijke Boskalis Westminster 1,003,216 0.40
3,995 Koninklijke DSM 144,711 0.06
31,261 Koninklijke KPN 480,866 0.19
51,329 Unilever – CVA 1,422,891 0.56 ___________ ______
3,498,034 1.38 ___________ ______
New Zealand
68,716 Fletcher Building 367,548 0.15 ___________ ______
Norway
48,861 StatoilHydro 1,072,561 0.42 ___________ ______
Portugal
13,517 Portugal Telecom SGPS 139,375 0.06 ___________ ______
Singapore
49,000 Singapore Exchange 283,760 0.11
351,000 Singapore Press Holdings 889,890 0.35
560,000 Singapore Technologies Engineering 1,004,699 0.40 ___________ ______
2,178,349 0.86 ___________ ______
Spain
79,028 Banco Bilbao Vizcaya Argentaria 1,400,263 0.56
107,765 Bancontander 1,653,053 0.65
71,881 Criteria Caixacorp 359,492 0.14
80,139 Telefonica 2,024,000 0.80 ___________ ______
5,436,808 2.15 ___________ ______
Sweden
23,325 Hennes & Mauritz 'B' 1,290,526 0.51
143,261 Sandvik AB 1,436,588 0.57
16,834 Volvo 'B' 145,788 0.06 ___________ ______
2,872,902 1.14 ___________ ______
Switzerland
25,077 Credit Suisse Group 1,249,121 0.50
28,710 Nestle 1,174,887 0.47
31,274 Nobel Biocare Holding 942,338 0.37
50,302 Novartis 2,321,838 0.92
3,303 Roche Holding Genusscheine 526,238 0.21
15,028 Sonova Holding 1,424,964 0.56
150 Tyco Electronics 3,437 0.00
6,257 Zurich Financial Services 1,370,995 0.54 ___________ ______
9,013,818 3.57 ___________ ______
United Kingdom
39,770 Anglo American 1,304,690 0.52
100,810 Antofagasta 1,254,299 0.50
37,150 AstraZeneca 1,712,626 0.68
14,147 Aviva 93,280 0.04
100,738 Barclays 621,796 0.25
7,515 BHP Billiton 198,595 0.08
350,280 BP 3,024,909 1.20
48,998 British American Tobacco 1,490,505 0.59
106,011 BT Group 238,162 0.09
15,251 Diageo 236,174 0.09
115,666 GlaxoSmithKline 2,258,691 0.89
206,437 HSBC Holdings 2,252,199 0.89
5,767 Imperial Tobacco Group 161,950 0.06
272,094 Ladbrokes 860,386 0.34
109,783 Lloyds TSB Group 198,414 0.08
3,393 Reckitt Benckiser Group 157,134 0.06
8,723 Rio Tinto 341,742 0.14
4,783 Scottish & Southern Energy 86,879 0.03
1,926 Severn Trent 30,607 0.01
49,539 Standard Chartered 1,122,582 0.44
122,122 United Utilities Group 897,606 0.35
631,434 Vodafone Group 1,361,167 0.54
78,860 Royal Dutch Shell 'A' 2,190,242 0.87
36,738 Royal Dutch Shell 'B' 998,289 0.40 ___________ ______
23,092,924 9.14 ___________ ______
United States
25,700 3M^ 1,836,008 0.73
23,800 Abbott Laboratories^ 1,084,328 0.43
21,700 Aflac 874,510 0.35
18,900 Air Products & Chemicals 1,416,933 0.56
71,100 Alcoa 865,287 0.34
35,200 Allstate^ 1,027,840 0.41
65,200 Altria Group^ 1,186,640 0.47
33,100 American Electric Power 1,046,622 0.41
4,400 Amgen 261,888 0.10
15,100 Apple^ 2,533,191 1.00
19,500 Associated Banc-Corp 200,265 0.08
112,390 AT&T^ 2,925,512 1.16
18,300 Autodesk^ 429,135 0.17
23,900 Automatic Data Processing^ 913,697 0.36
6,800 AvalonBay Communities 437,512 0.17
37,300 Avery Dennison 1,141,007 0.45
116,300 Bank of America^ 2,056,184 0.81
29,100 Black & Decker 1,285,347 0.51
8,000 Boston Properties (Reit) 484,400 0.19
54,300 Bristol-Myers Squibb^ 1,178,853 0.47
42,600 Cablevision Systems 956,370 0.38
33,700 Caterpillar^ 1,533,350 0.61
Portfolio of Investments 31 August 2009
Transferable Securities Admitted to an Official Stock Exchange
Listing or Dealt in on Another Regulated Market
Holding Description Value (US$) %
Transferable Securities Admitted to an Official Stock Exchange
Listing or Dealt in on Another Regulated Market
Holding Description Value (US$) %

Audited Annual Report and Accounts 133
The notes on pages 236 to 244 form an integral part of these financial statements.
Global Enhanced Equity Yield Fund continued
49,900 Centerpoint Energy 621,754 0.25
25,208 CenturyTel 816,487 0.32
34,400 Chevron^ 2,398,024 0.95
14,400 Cincinnati Financial 365,184 0.14
28,800 Cisco Systems^ 623,520 0.25
31,000 Coca-Cola^ 1,517,450 0.60
36,000 ConocoPhillips^ 1,620,000 0.64
20,100 Consolidated Edison 811,839 0.32
45,000 DIRECTV Group 1,104,300 0.44
23,500 Duke Energy 363,310 0.14
100 Duke Realty 1,151 0.00
52,000 EI Du Pont de Nemours & Co^ 1,657,760 0.66
10,900 Eli Lilly & Co 364,060 0.14
31,400 Emerson Electric^ 1,151,438 0.46
52,900 Exxon Mobil^ 3,682,369 1.46
6,600 Federal Realty Investment Trust (Reit) 407,550 0.16
5,400 First Solar^ 644,328 0.25
65,800 General Electric 907,382 0.36
660 Goldman Sachs Group 106,742 0.04
4,060 Google 'A'^ 1,860,576 0.74
3,000 HCP (Reit) 86,610 0.03
9,000 Hewlett-Packard^ 399,780 0.16
51,100 Home Depot 1,397,074 0.55
129,800 Intel^ 2,601,127 1.03
9,000 International Business Machines 1,055,340 0.42
5,819 Intuitive Surgical 1,290,218 0.51
12,500 Johnson & Johnson^ 752,000 0.30
57,000 JPMorgan Chase & Co^ 2,435,040 0.96
43,724 Kraft Foods 'A' 1,232,142 0.49
27,600 Liberty Property Trust (Reit) 900,588 0.36
29,900 Linear Technology 801,918 0.32
800 Lockheed Martin 59,592 0.02
7,600 M&T Bank 468,540 0.18
3,527 Mastercard 707,269 0.28
47,200 Mattel 845,824 0.33
24,900 McDonald's 1,389,420 0.55
53,600 MeadWestvaco 1,162,584 0.46
42,500 Merck & Co 1,370,200 0.54
32,400 Microchip Technology 856,980 0.34
133,800 Microsoft^ 3,279,425 1.30
900 Monsanto 73,863 0.03
19,200 Morgan Stanley 545,856 0.22
136,900 Motorola 974,728 0.39
53,200 New York Community Bancorp 571,368 0.23
10,400 Norfolk Southern 481,312 0.19
59,000 Old Republic International 697,380 0.28
11,800 Oracle^ 259,718 0.10
53,000 Patterson-UTI Energy 700,660 0.28
36,400 Paychex 1,023,277 0.40
24,300 PepsiCo 1,371,249 0.54
129,000 Pfizer^ 2,145,270 0.85
48,200 Philip Morris International 2,195,992 0.87
44,700 Pitney Bowes 1,003,068 0.40
48,000 Procter & Gamble^ 2,549,280 1.01
22,000 Progress Energy 867,900 0.34
6,300 Public Storage (Reit) 448,749 0.18
19,800 QUALCOMM^ 916,122 0.36
9,800 Regency Centers (Reit) 323,694 0.13
73,500 RR Donnelley & Sons 1,305,360 0.52
114,100 Sara Lee 1,104,488 0.44
27,400 Schering-Plough 769,392 0.30
18,300 Schlumberger 1,028,826 0.41
17 Smith International 473 0.00
29,300 Southern 917,090 0.36
27,900 Southwestern Energy 1,033,974 0.41
54,300 Spectra Energy 1,014,867 0.40
6,200 Staples 134,354 0.05
31,500 Starwood Hotels & Resorts Worldwide 943,425 0.37
15,600 SunPower 339,924 0.13
28,700 Sunpower 'A'* 724,675 0.29
44,400 SYSCO 1,128,204 0.45
21,600 Texas Instruments^ 529,848 0.21
22,900 United Parcel Service 1,219,654 0.48
12,200 United Technologies 721,020 0.28
33,800 Ventas (Reit) 1,322,932 0.52
63,300 Verizon Communications^ 1,946,475 0.77
15,700 Vertex Pharmaceuticals 577,917 0.23
86,500 Virgin Media 1,010,320 0.40
8,694 Vornado Realty Trust (Reit) 495,036 0.20
41,800 Wal-Mart Stores^ 2,141,832 0.85
8,000 Waste Management^ 236,001 0.09
64,700 Wells Fargo & Co^ 1,768,252 0.70
26,400 Weyerhaeuser 976,273 0.39
13,400 Whirlpool 877,701 0.35
2,600 Wyeth 124,255 0.05
40,600 Xcel Energy 803,880 0.32
50 Xto Energy 1,921 0.00 ___________ ______
112,139,629 44.38 ___________ ______
Total Portfolio 237,603,339 94.03
Other Net Assets 15,076,226 5.97 ___________ ______
Total Net Assets (US$) 252,679,565 100.00 ___________ ______
Portfolio of Investments 31 August 2009
Transferable Securities Admitted to an Official Stock Exchange
Listing or Dealt in on Another Regulated Market
Holding Description Value (US$) %
Transferable Securities Admitted to an Official Stock Exchange
Listing or Dealt in on Another Regulated Market
Holding Description Value (US$) %
(*) Securities lent, see Note 11, for further details.(̂ ) Securities pledged, see Note 12, for further details.

134 BlackRock Global Funds (BGF)
Global Enhanced Equity Yield Fund continued
Open Forward Foreign Exchange Transactions as at 31 August 2009
EUR Hedged Share Class €
€27,204,777 US$38,483,684 15/9/2009 272,646 389,606
US$1,326,034 €937,051 15/9/2009 (9,049) (12,931)__________ __________
Net unrealised profit 263,597 376,675 __________ __________
SGD Hedged Share Class SGD
SGD461,894 US$319,694 15/9/2009 324 224
US$7,619 SGD11,049 15/9/2009 (49) (34)__________ __________
Net unrealised profit 275 190 __________ __________
Total net unrealised profit 376,865 __________
Note: The net unrealised profit attributed to these transactions is included in the Statement
of Net Assets (see Note 2c).
Unrealised
profit/(loss)
US$ Equivalent
Unrealised
profit/(loss)Value dateSalesPurchases
Open Futures Contracts as at 31 August 2009
149 S&P500 E-Mini September 2009 7,569,200
67 DJ Euro Stoxx 50 September 2009 2,656,714
31 Yen Denom Nikkei September 2009 1,735,280
24 FTSE 100 September 2009 1,913,617 __________
Total commitment 13,874,811 __________
Note: The net unrealised gain of US$810,649 attributed to these transactions is included
in the Statement of Net Assets (see Note 2c).
Value
US$
Expiration
dateContracts/Description
Number
of Contracts
(50) Nikkei 225 Call Option
strike price ¥10,750
expiring on 11/9/2009 66,646 (47,051)
(50) Nikkei 225 Call Option
strike price ¥10,5000
expiring on 11/9/2009 85,693 (96,790)
(51) S&P 500 Call Option
strike price US$1,020
expiring on 19/9/2009 6,834 (92,565)
(85) SMI Call Option
strike price CHF6,100
expiring on 18/9/2009 (31,070) (124,778)
(180) FTSE 100 Call Option
strike price £4,850
expiring on 18/9/2009 (144,987) (390,797)
(192) S&P 500 Call Option
strike price US$1,035
expiring on 19/9/2009 121,792 (216,960)
(412) S&P 500 Call Option
strike price US$1,030
expiring on 19/9/2009 242,441 (558,260)
(620) DJ Euro Stoxx 50 Call Option
strike price €2,750
expiring on 18/9/2009 (265,485) (689,252)___________ _________
Total Written Call Options 81,864 (2,216,453)___________ _________
Note: Written Call Options are included in the Statement of Net Assets (see Note 2c).
Value US$
Unrealised profit/(loss)
US$Issuer
Number ofcontracts
subject to Call
Written Call Options as at 31 August 2009
Sector Breakdown as at 31 August 2009
Finance 20.56
Energy 10.51
Information technology 9.98
Industrials 9.49
Healthcare 9.19
Consumer staples 8.53
Consumer discretionary 8.50
Materials 6.76
Telecommunication services 5.33
Utilities 5.18
Other net assets 5.97 __________
100.00 __________
% of net
assets

Audited Annual Report and Accounts 135
The notes on pages 236 to 244 form an integral part of these financial statements.
Global Equity Fund
Portfolio of Investments 31 August 2009
Transferable Securities Admitted to an Official Stock Exchange
Listing or Dealt in on Another Regulated Market
Holding Description Value (US$) %
Transferable Securities Admitted to an Official Stock Exchange
Listing or Dealt in on Another Regulated Market
Holding Description Value (US$) %
FUNDS
United Kingdom
3,436,883 Institutional Cash Series Institutional
Liquidity Fund 3,436,883 1.49 ___________ ______
Total Funds 3,436,883 1.49 ___________ ______
COMMON STOCKS (SHARES) & WARRANTS
Australia
1,515,367 Qantas Airways 3,206,669 1.39 ___________ ______
Canada
69,556 Suncor Energy 2,140,326 0.93 ___________ ______
Cayman Islands
1,522,500 Shimao Property Holdings 2,266,752 0.98 ___________ ______
China
4,075,000 China Construction Bank 'H' 3,075,561 1.34 ___________ ______
Denmark
63,441 Carlsberg 4,506,170 1.96 ___________ ______
Finland
168,459 Nokia OYJ 2,313,261 1.00 ___________ ______
France
150,133 AXA 3,404,554 1.48
38,682 Sanofi-Aventis 2,633,776 1.14
43,341 Societe Generale 3,468,739 1.51 ___________ ______
9,507,069 4.13 ___________ ______
Germany
75,809 Daimler 3,405,731 1.48
89,147 E.ON 3,766,736 1.64
28,210 MAN 2,147,301 0.93 ___________ ______
9,319,768 4.05 ___________ ______
Hong Kong
2,249,000 Belle International Holdings 2,028,185 0.88
851,000 Hongkong Land Holdings 3,463,570 1.50
1,093,894 Ports Design 2,503,628 1.09 ___________ ______
7,995,383 3.47 ___________ ______
Ireland
3,211 Morgan Stanley Asia Products
(Call Wts 9/10/2009 – Suzlon Energy) 30,811 0.01 ___________ ______
Italy
1,010,847 UniCredit 3,654,374 1.59 ___________ ______
Japan
98,100 Canon 3,766,382 1.64
145,300 Makita 4,109,684 1.78
261,900 Mitsui & Co 3,413,699 1.48
39,800 Rohm 2,683,723 1.17
92,800 Sumitomo Mitsui Financial Group 4,002,022 1.74 ___________ ______
17,975,510 7.81 ___________ ______
Luxembourg
106,102 ArcelorMittal 3,796,339 1.65 ___________ ______
Mexico
89,028 Fomento Economico Mexicano SAB de
CV ADR 3,294,926 1.43 ___________ ______
Netherlands
198,439 New World Resources 'A' 1,848,946 0.80 ___________ ______
Singapore
81,500 DBS Group Holdings 713,597 0.31 ___________ ______
South Korea
8,361 POSCO 3,089,600 1.34
5,792 Samsung Electronics 3,575,652 1.56 ___________ ______
6,665,252 2.90 ___________ ______
Spain
177,968 EDP Renovaveis 1,764,853 0.77
253,582 Telefonica 6,404,496 2.78 ___________ ______
8,169,349 3.55 ___________ ______
Sweden
174,790 Sandvik AB 1,752,753 0.76 ___________ ______
Switzerland
55,139 Credit Suisse Group 2,746,552 1.19
63,459 Transocean 4,831,768 2.10 ___________ ______
7,578,320 3.29 ___________ ______
United Kingdom
765,816 Barclays 4,726,929 2.05
616,484 BP 5,323,765 2.31
206,490 British American Tobacco 6,281,365 2.73
171,472 Imperial Tobacco Group 4,815,315 2.09
110,935 Rio Tinto 4,346,116 1.89
856,936 Tesco 5,228,849 2.27
199,163 Tullow Oil 3,481,848 1.51
2,919,186 Vodafone Group 6,292,819 2.74 ___________ ______
40,497,006 17.59 ___________ ______
United States
216,490 Altria Group 3,940,118 1.71
52,861 Amgen 3,146,287 1.37
68,785 Anadarko Petroleum 3,665,553 1.59
19,621 Apple 3,291,639 1.43
250,045 Bank of America 4,420,796 1.92
117,926 Bank of New York Mellon 3,365,608 1.46
78,639 Cummins 3,516,736 1.53
221,234 Dell 3,446,826 1.50
176,826 DIRECTV Group 4,339,310 1.89
47,120 FPL Group 2,639,662 1.15
74,885 Gilead Sciences 3,360,090 1.46
16,401 Goldman Sachs Group 2,652,534 1.15
90,144 Hewlett-Packard 4,004,196 1.74
83,595 JPMorgan Chase & Co 3,571,178 1.55
52,121 Lorillard 3,757,403 1.63
140,445 Merck & Co 4,527,947 1.97

Sector Breakdown as at 31 August 2009
Finance 21.04
Consumer staples 13.82
Information technology 13.26
Healthcare 9.51
Consumer discretionary 8.83
Energy 8.44
Industrials 7.84
Materials 5.68
Telecommunication services 5.52
Utilities 3.56
Investment funds 1.49
Other net assets 1.01 __________
100.00 __________
% of net
assets
136 BlackRock Global Funds (BGF)
Global Equity Fund continued
Portfolio of Investments 31 August 2009
Transferable Securities Admitted to an Official Stock Exchange
Listing or Dealt in on Another Regulated Market
Holding Description Value (US$) %
Unquoted Securities
Holding Description Value (US$) %
210,231 Microsoft 5,152,741 2.24
404,652 Pfizer 6,729,363 2.92
156,089 Republic Services 3,999,000 1.74
125,392 SunTrust Banks 2,930,411 1.27
106,495 Time Warner Cable 3,945,640 1.71
40,559 Vertex Pharmaceuticals 1,492,977 0.65
261,466 Xerox 2,261,681 0.98 ___________ ______
84,157,696 36.56 ___________ ______
Total Common Stocks (Shares) & Warrants 224,465,838 97.50 ___________ ______
Total Transferable Securities Admitted
to an Official Stock Exchange Listing or
Dealt in on Another Regulated Market 227,902,721 98.99 ___________ ______
COMMON STOCKS (SHARES)
United States
24,000 World Access 36 0.00 ___________ ______
Total Unquoted Securities 36 0.00 ___________ ______
Total Portfolio 227,902,757 98.99
Other Net Assets 2,314,953 1.01 ___________ ______
Total Net Assets (US$) 230,217,710 100.00 ___________ ______
Open Forward Foreign Exchange Transactions as at 31 August 2009
Core Fund
US$11,632,600 £7,142,511 20/11/2009 39,375 __________
Net unrealised profit 39,375 __________
Note: The net unrealised profit attributed to this transaction is included in the Statement
of Net Assets (see Note 2c).
Value date
Unrealised
profit
US$SalesPurchases

Audited Annual Report and Accounts 137
The notes on pages 236 to 244 form an integral part of these financial statements.
Portfolio of Investments 31 August 2009
BONDS
Australia
US$2,910,000 National Australia Bank 2.55%
13/1/2012 2,966,570 0.72
A$2,810,000 New South Wales Treasury 5.25%
1/5/2013 2,329,726 0.56
A$4,660,000 Queensland Treasury 6% 14/9/2017 3,903,526 0.95 ___________ ______
9,199,822 2.23 ___________ ______
Bermuda
£1,150,000 Holcim GB Finance 8.75% 24/4/2017 2,166,955 0.53 ___________ ______
Canada
C$20,960,000 Canadian Government Bond 3.75%
1/6/2012 19,970,234 4.85
C$215,000 Canadian Government Bond 4.25%
1/6/2018 209,539 0.05
C$1,069,000 Canadian Government Bond 5%
1/6/2037 1,145,649 0.28
US$2,575,000 Export Development Canada 2.375%
19/3/2012 2,626,486 0.64
US$1,625,000 Province of Ontario Canada 4.1%
16/6/2014 1,704,866 0.41 ___________ ______
25,656,774 6.23 ___________ ______
Denmark
€7,800,000 Kingdom of Denmark 3.125%
17/3/2014 11,349,574 2.75
€1,950,000 Kommunekredit 4.375% 2/10/2012 2,915,858 0.71
DKK1,068,578 Realkredit Danmark FRN 1/10/2038 195,802 0.05 ___________ ______
14,461,234 3.51 ___________ ______
France
€650,000 Credit Agricole Covered Bonds 3.5%
21/7/2014 946,513 0.23
€11,255,000 France Government Bond OAT 3.75%
25/4/2021 16,192,066 3.93
€6,420,000 French Treasury Note BTAN 2.5%
12/1/2014 9,193,372 2.23
€400,000 GDF Suez 6.875% 24/1/2019 692,445 0.17 ___________ ______
27,024,396 6.56 ___________ ______
Germany
€1,175,000 Bundesobligation '153' 4% 11/10/2013 1,792,107 0.44
€555,000 Bundesrepublik Deutschland 3.25%
4/7/2015 817,764 0.20
€9,546,000 Bundesrepublik Deutschland 3.5%
4/7/2019 13,908,479 3.38
€215,000 Bundesrepublik Deutschland 4.25%
4/1/2014 330,868 0.08
€5,825,000 Bundesrepublik Deutschland 4.25%
4/7/2014 8,990,442 2.18
€16,506,000 Bundesrepublik Deutschland 4.25%
4/7/2039 24,707,916 6.00
€823,597 Driver One '4 A' FRN 21/4/2013 1,144,659 0.28
US$4,850,000 Kreditanstalt fuer Wiederaufbau 3.5%
10/3/2014 5,014,112 1.22
€2,750,000 Kreditanstalt fuer Wiederaufbau
3.875% 21/1/2019 4,016,070 0.98
C$3,765,000 Kreditanstalt fuer Wiederaufbau
4.375% 9/2/2016 3,495,543 0.85
C$1,350,000 Kreditanstalt fuer Wiederaufbau 4.7%
2/6/2037 1,123,298 0.27
US$2,325,000 Landeskreditbank Baden-Wuerttemberg
Foerderbank 2.5% 14/2/2011 2,367,199 0.57 ___________ ______
67,708,457 16.45 ___________ ______
Greece
€2,465,000 Hellenic Republic Government Bond
FRN 20/2/2013 3,658,769 0.89 ___________ ______
International
¥141,500,000 European Investment Bank 1.9%
26/1/2026 1,469,319 0.36
US$1,125,000 European Investment Bank 3.125%
4/6/2014 1,145,475 0.28 ___________ ______
2,614,794 0.64 ___________ ______
Ireland
€430,000 Depfa ACS Bank 4.25% 15/12/2009 617,577 0.15 ___________ ______
Italy
€7,500,000 Italy Buoni Poliennali del Tesoro
4.25% 15/10/2012 11,305,450 2.75 ___________ ______
Japan
¥416,000,000 Japan Government Fifteen Year Bond
FRN 20/3/2021 4,469,813 1.09
¥1,500,000,000 Japan Government Five Year Bond
0.9% 20/12/2012 16,407,001 3.99
¥1,303,000,000 Japan Government Ten Year Bond
1.5% 20/9/2018 14,378,753 3.49
¥270,000,000 Japan Government Ten Year Bond
1.9% 20/6/2017 3,102,684 0.75
¥665,000,000 Japan Government Thirty Year Bond
2.5% 20/9/2035 7,550,613 1.84
¥379,000,000 Japan Government Twenty Year Bond
2.1% 20/12/2027 4,120,761 1.00
¥905,500,000 Japan Government Twenty Year Bond
2.2% 20/6/2026 10,098,441 2.45
¥523,800,000 Japanese Government CPI Linked
Bond 1.2% 10/12/2017 5,162,073 1.25
¥1,550,000,000 Japanese Government CPI Linked
Bond 1.3% 10/9/2017 15,442,004 3.75 ___________ ______
80,732,143 19.61 ___________ ______
Luxembourg
€374,051 Volkswagen Car Lease '9 A' FRN
21/4/2012 526,970 0.13 ___________ ______
Netherlands
€750,000 ABN Amro Bank 3.75% 15/7/2014 1,096,803 0.27
€900,000 Fortis Bank Nederland Holding
3.375% 19/5/2014 1,313,373 0.32
€1,125,000 LeasePlan 3.25% 22/5/2014 1,630,640 0.39
€2,200,000 Storm '2007-1 A2' FRN 22/4/2049 3,054,245 0.74 ___________ ______
7,095,061 1.72 ___________ ______
Norway
US$2,700,000 DnB NOR Bank ASA FRN 1/9/2016 2,432,430 0.59
€1,775,000 DnB NOR Bank ASA FRN 18/10/2016 2,301,718 0.56 ___________ ______
4,734,148 1.15 ___________ ______
Transferable Securities Admitted to an Official Stock Exchange
Listing or Dealt in on Another Regulated Market
Holding Description Value (US$) %
Transferable Securities Admitted to an Official Stock Exchange
Listing or Dealt in on Another Regulated Market
Holding Description Value (US$) %
Global Government Bond Fund

138 BlackRock Global Funds (BGF)
Portfolio of Investments 31 August 2009
Spain
€950,000 BBVA International Preferred 3.798%
22/9/2015 (Perpetual) 964,931 0.23
€1,700,000 Caja de Ahorros de Valencia Castellon
y Alicante 3% 11/5/2012 2,465,184 0.60
€4,645,000 Spain Government Bond 3.8%
31/1/2017 6,824,360 1.66 ___________ ______
10,254,475 2.49 ___________ ______
Sweden
€2,635,000 Svensk Exportkredit AB 3.625%
27/5/2014 3,832,782 0.93
€2,400,000 Svenska Handelsbanken AB FRN
19/10/2017 3,035,020 0.74 ___________ ______
6,867,802 1.67 ___________ ______
United Kingdom
£806,000 Barclays Bank 10% 21/5/2021 1,668,327 0.40
US$950,000 Barclays Bank '144A' 5.926%
15/12/2016 (Perpetual) 665,000 0.16
€700,000 Britannia Building Society FRN
18/5/2016 585,852 0.14
€670,000 Chester Asset Receivables Dealings
No 11 6.125% 15/10/2010 946,422 0.23
£890,000 Chester Asset Receivables Dealings
No 12 6% 18/1/2011 1,431,275 0.35
£965,000 United Kingdom Gilt 4.25% 7/6/2032 1,630,034 0.40
£775,000 United Kingdom Gilt 4.25% 7/9/2039 1,278,940 0.31
£560,000 United Kingdom Gilt 4.25% 7/12/2049 934,291 0.23
£2,255,000 United Kingdom Gilt 4.5% 7/12/2042 3,900,187 0.95
£1,505,000 United Kingdom Gilt 4.75% 7/3/2020 2,685,580 0.65
£1,727,000 United Kingdom Gilt 5% 7/9/2014 3,120,440 0.76
£1,530,000 United Kingdom Gilt 5.25% 7/6/2012 2,700,885 0.65 ___________ ______
21,547,233 5.23 ___________ ______
United States
US$1,518,748 BCAP Trust '2007-AA1 1A1' FRN
25/2/2047 861,218 0.21
US$841,959 Bear Stearns Adjustable Rate Mortgage
Trust '2004-6 3A' FRN 25/9/2034 761,989 0.18
US$708,450 Bear Stearns Commercial Mortgage
Securities '2000-WF2 A2' 7.32%
15/10/2032 729,620 0.18
US$2,450,000 California State 5.95% 1/4/2016 2,522,300 0.61
US$365,000 California State 7.55% 1/4/2039 390,378 0.09
US$2,150,170 Capital Auto Receivables Asset Trust
'2007-3 A3A' 5.02% 15/9/2011 2,193,507 0.53
US$750,000 Cellco Partnership / Verizon Wireless
Capital '144A' 3.75% 20/5/2011 774,856 0.19
US$558,454 Chase Commercial Mortgage Securities
'1999-2 A2' 7.198% 15/1/2032 558,957 0.14
US$3,038,620 Citigroup Mortgage Loan Trust
'2005-2 1A4' 5.1133% 25/5/2035 2,432,557 0.59
US$1,353,397 Citigroup Mortgage Loan Trust
'2006-AR1 1A1' FRN 25/10/2035 1,073,808 0.26
US$279,873 Countrywide Alternative Loan Trust
'2006-OC8 2A1A' FRN 25/11/2036 275,924 0.07
US$1,193,983 Countrywide Asset-Backed Certificates
'2007-2 2A1' FRN 25/8/2037 1,048,036 0.25
US$2,075,000 CS First Boston Mortgage Securities
'2002-CKS4 A2' 5.183% 15/11/2036 2,137,031 0.52
US$1,431,081 Daimler Chrysler Auto Trust 4.98%
8/11/2011 1,462,023 0.35
US$309,428 Deutsche ALT-A Securities Inc Alternate
Loan Trust '2007-BAR1 A1' FRN
25/3/2037 306,211 0.07
US$348,829 Ford Credit Auto Owner Trust '2006-C A3'
5.16% 15/11/2010 350,598 0.09
US$2,243,413 Ge Capital Commercial Mortgage
'2005-C1 A2' 4.353% 10/6/2048 2,241,993 0.54
€2,799,000 Goldman Sachs Group 3.5% 8/12/2011 4,141,723 1.01
US$1,146,393 GSR Mortgage Loan Trust
'2005-AR1 4A1' FRN 25/1/2035 1,027,888 0.25
US$742,590 Home Equity Asset Trust '2007-2 2A1'
FRN 25/7/2037 682,735 0.17
US$215,428 Honda Auto Receivables Owner Trust
'2006-3 A3' 5.12% 15/10/2010 216,454 0.05
€650,000 HVB Funding Trust VIII 7.055%
28/3/2012 (Perpetual) 629,978 0.15
US$912,229 JP Morgan Mortgage Trust '2004-A5 3A1'
5.309% 25/12/2034 862,867 0.21
€1,800,000 JPMorgan Chase & Co 3.625%
12/12/2011 2,670,548 0.65
US$1,900,000 Morgan Stanley Capital I '2006-IQ12 A4'
5.332% 15/12/2043 1,678,558 0.41
US$1,475,000 New Jersey ST TPK Authority TPK
Receivables 7.414% 1/1/2040 1,792,427 0.43
US$897,815 Prudential Securities Secured Financing
'2000-C1 A2' 7.727% 17/5/2032 909,099 0.22
C$750,000 SLM 4.3% 15/12/2009 669,078 0.16
US$210,000 SLM 5.4% 25/10/2011 182,976 0.04
US$253,192 Structured Asset Investment Loan Trust
'2006-BNC3 A2' FRN 25/9/2036 249,524 0.06
US$520,000 United States Treasury Inflation Indexed
Bonds 1.75% 15/1/2028 501,177 0.12
US$600,000 US Treasury Bond 1.5% 15/7/2012 600,551 0.15
US$6,065,000 US Treasury Bond 2.625% 30/6/2014‡ 6,126,598 1.49
US$6,240,000 US Treasury Bond 2.75% 15/2/2019 5,890,584 1.43
US$1,815,000 US Treasury Bond 3.125% 30/4/2013 1,898,235 0.46
US$4,020,000 US Treasury Bond 3.125% 15/5/2019 3,908,507 0.95
US$8,125,000 US Treasury Bond 3.25% 31/7/2016 8,229,419 2.00
US$1,020,000 US Treasury Bond 3.5% 15/2/2018 1,030,320 0.25
US$1,555,000 US Treasury Bond 3.5% 15/2/2039 1,366,153 0.33
US$3,736,000 US Treasury Bond 3.625% 15/8/2019 3,794,667 0.92
US$749,000 US Treasury Bond 3.875% 15/5/2018 776,780 0.19
US$6,500,000 US Treasury Bond 4.25% 15/5/2039 6,534,658 1.59
US$665,000 US Treasury Bond 4.5% 15/2/2016 727,500 0.18
US$2,460,000 US Treasury Bond 4.5% 15/8/2039 2,576,658 0.63
US$3,375,000 US Treasury Bond 9.125% 15/5/2018 4,840,225 1.18
US$1,695,000 Wachovia Bank Commercial Mortgage
Trust '2006-C29 A4' 5.308%
15/11/2048 1,431,538 0.35
US$667,000 WaMu Mortgage Pass Through
Certificates '2006-AR10 3A2'
FRN 25/8/2046 483,451 0.12 ___________ ______
86,551,882 21.02 ___________ ______
Total Transferable Securities Admitted
to an Official Stock Exchange Listing or
Dealt in on Another Regulated Market 382,723,942 92.96 ___________ ______
Transferable Securities Admitted to an Official Stock Exchange
Listing or Dealt in on Another Regulated Market
Holding Description Value (US$) %
Transferable Securities Admitted to an Official Stock Exchange
Listing or Dealt in on Another Regulated Market
Holding Description Value (US$) %
Global Government Bond Fund continued

Audited Annual Report and Accounts 139
The notes on pages 236 to 244 form an integral part of these financial statements.
Global Government Bond Fund continued
Portfolio of Investments 31 August 2009
BONDS
United States
US$1,370,000 Dexia Credit Local '144A' 2.375%
23/9/2011 1,388,515 0.34 ___________ ______
Total Unquoted Securities 1,388,515 0.34 ___________ ______
Total Portfolio 384,112,457 93.30
Other Net Assets 27,574,539 6.70 ___________ ______
Total Net Assets (US$) 411,686,996 100.00 ___________ ______
(‡) Securities given in guarantee, see Note 12, for further details.
Unquoted Securities
Holding Description Value (US$) %
Unrealised profit/(loss)
US$DescriptionNominal
Value
Unrealised profit/(loss)
US$DescriptionNominal
Value
€1,100,000 Credit Default Swaps (Citibank)
(Fund receives default protection on
StMicroelectronics NV 0% 5/7/2013;
and pays Fixed 0.255%) (20/9/2012) 11,777
€1,700,000 Credit Default Swaps (Barclays)
(Fund provides default protection on
Imperial Tobacco Group Plc 6.25% 4/12/2018;
and receives Fixed 0.71%) (20/9/2012) (48,877)
€9,500,000 Credit Default Swaps (Barclays)
(Fund receives default protection on
iTraxx Europe HiVol Series 11 Version;
and pays Fixed 3.75%) (20/6/2014) (487,615)
€17,400,000 Interest Rate Swaps (Barclays)
(Fund receives Fixed 3.14%;
and pays Floating EUR Euribor 6 Month)
(5/5/2013) (14,023) __________
(538,738) __________
Swaps as at 31 August 2009
Note: The total market value of (US$1,218,878) of these transactions is included in the Statement of Net Assets (see Note 2c).
Value US$
Unrealised loss US$Description
NominalValue
US$ 51,100,000 Fund purchases a call option (expiring
5/11/2009) to enter into an Interest
Rate Swap (JP Morgan). If exercised
Fund receives 2.5% Fixed semi annually
from 9/5/2010; and pays Floating
US$ Libor 3-month -BBA quarterly
from 9/2/2010; (5/11/2009) (217,175) 20,440 ___________ _________
(217,175) 20,440 ___________ _________
Swaptions as at 31 August 2009
Note: Swaptions are included in the Statement of Net Assets (see Note 2c).

140 BlackRock Global Funds (BGF)
Global Government Bond Fund continued
Open Forward Foreign Exchange Transactions as at 31 August 2009
Core Fund US$
US$341,700 €245,000 15/9/2009 (8,384) (8,384)
€11,663,000 US$16,720,169 16/9/2009 (54,755) (54,755)
US$162,922,051 €116,915,500 16/9/2009 (4,140,045) (4,140,045)
MXN48,605,000 US$3,754,674 18/9/2009 (108,831) (108,831)
US$3,732,127 MXN48,605,000 18/9/2009 86,284 86,284
US$2,993,522 ZAR25,040,000 18/9/2009 (208,409) (208,409)
PLN6,895,000 HUF440,590,500 25/9/2009 99,371 99,371
CAD8,840,000 US$8,061,133 28/10/2009 (62,503) (62,503)
NOK13,886,000 US$2,284,686 28/10/2009 13,740 13,740
US$6,730,219 AUD8,133,500 28/10/2009 (41,402) (41,402)
US$35,252,839 CAD38,280,000 28/10/2009 616,238 616,238
US$26,497,697 £16,211,500 28/10/2009 184,303 184,303
US$86,947,448 ¥8,162,852,500 28/10/2009 (873,044) (873,044)
US$1,079,904 ZAR8,840,500 28/10/2009 (41,966) (41,966)__________ __________
Net unrealised loss (4,539,403) (4,539,403)__________ __________
EUR Hedged Share Class €
€144,762,362 US$204,602,856 15/9/2009 1,574,644 2,250,134
US$2,983,526 €2,104,077 15/9/2009 (16,109) (23,019)__________ __________
Net unrealised profit 1,558,535 2,227,115 __________ __________
Total net unrealised loss (2,312,288)__________
Note: The net unrealised loss attributed to these transactions is included in the Statement
of Net Assets (see Note 2c).
Unrealised
profit/(loss)
US$ Equivalent
Unrealised
profit/(loss)Value dateSalesPurchases
Open Futures Contracts as at 31 August 2009
280 Australian 3 Year Bond September 2009 62,898,414
11 Japanese 10 Year Bond (TSE) September 2009 16,458,891
4 Euro Bund September 2009 700,455
17 Long Gilt December 2009 3,272,797
(3) Euro Schatz December 2009 (461,919)
(28) Canadian 10 Year Bond December 2009 (3,047,125)
(57) US Treasury 10 Year Note December 2009 (6,663,656)
(151) US Treasury 2 Year Note (CBT) December 2009 (32,646,672)__________
Total commitment 40,511,185 __________
Note: The net unrealised gain of US$58,580 attributed to these transactions is included
in the Statement of Net Assets (see Note 2c).
Value
US$
Expiration
dateContracts/Description
Number
of Contracts

Audited Annual Report and Accounts 141
The notes on pages 236 to 244 form an integral part of these financial statements.
Global High Yield Bond Fund
Portfolio of Investments 31 August 2009
BONDS
Bermuda
US$575,000 Digicel Group '144A' 8.875% 15/1/2015 514,625 0.18
US$2,000,000 Digicel Group '144A' 9.125% 15/1/2015 1,790,000 0.62
US$240,000 Intelsat Subsidiary Holding '144A'
8.875% 15/1/2015 241,200 0.09 ___________ ______
2,545,825 0.89 ___________ ______
Canada
US$2,225,000 Angiotech Pharmaceuticals FRN
1/12/2013 1,880,125 0.65
US$525,000 Catalyst Paper 8.625% 15/6/2011 305,813 0.11
US$270,000 Connacher Oil and Gas Ltd '144A'
11.75% 15/7/2014 275,400 0.10
US$310,000 North American Energy Partners
8.75% 1/12/2011 285,200 0.10
US$800,000 Novelis '144A' 11.5% 15/2/2015 790,000 0.27
US$305,000 Teck Resources 10.25% 15/5/2016 337,025 0.12
US$2,170,000 Teck Resources 10.75% 15/5/2019 2,468,375 0.86 ___________ ______
6,341,938 2.21 ___________ ______
France
US$360,000 Cie Generale de Geophysique-Veritas
'144A' 9.5% 15/5/2016 370,800 0.13
US$600,000 Cie Generale de Geophysique-Veritas
7.5% 15/5/2015 571,500 0.20
US$1,000,000 Cie Generale de Geophysique-Veritas
7.75% 15/5/2017 950,000 0.33 ___________ ______
1,892,300 0.66 ___________ ______
Iceland
€50,000 Glitnir Banki HF 0% 27/1/2010
(Defaulted) 10,360 0.00
€80,000 Glitnir Banki HF 3% 30/6/2010
(Defaulted) 24,006 0.01
€85,000 Glitnir Banki HF 4.375% 5/2/2010
(Defaulted) 25,506 0.01 ___________ ______
59,872 0.02 ___________ ______
Ireland
€495,870 BCM Ireland Preferred Equity '144A'
11.856% 15/2/2017 255,081 0.09
US$2,250,000 Elan Finance FRN 15/11/2011 2,126,250 0.74
US$1,300,000 Smurfit Kappa Funding 7.75%
1/4/2015 1,079,000 0.37 ___________ ______
3,460,331 1.20 ___________ ______
Luxembourg
US$695,000 Evraz Group '144A' 8.875% 24/4/2013 638,531 0.22
US$450,000 Evraz Group '144A' 9.5% 24/4/2018 402,750 0.14
€75,000 Hayes Lemmerz Finance Luxembourg
8.25% 15/6/2015 3,751 0.00 ___________ ______
1,045,032 0.36 ___________ ______
Netherlands
US$705,000 Ford Capital 9.5% 1/6/2010 715,575 0.25
€2,460,000 New World Resources 7.375%
15/5/2015 2,825,291 0.98 ___________ ______
3,540,866 1.23 ___________ ______
United Kingdom
US$380,000 Anglo American Capital '144A' 9.375%
8/4/2019 434,383 0.15
€4,500,000 FCE Bank 7.125% 16/1/2012 5,835,341 2.03
£500,000 FCE Bank 7.875% 15/2/2011 760,939 0.27
US$150,000 Inmarsat Finance 0% 15/11/2012
(Step-up coupon) 156,750 0.05
€1,021,000 ISS Financing 11% 15/6/2014 1,506,601 0.52
€1,125,000 ITV 6% 3/10/2011 1,578,011 0.55
US$795,000 Vedanta Resources '144A' 9.5%
18/7/2018 749,288 0.26
€541,000 Virgin Media Finance 8.75%
15/4/2014 800,101 0.28 ___________ ______
11,821,414 4.11 ___________ ______
United States
US$1,060,000 AES Eastern Energy 9.67% 2/1/2029 911,600 0.32
US$940,000 Affinion Group 10.125% 15/10/2013 938,825 0.33
US$560,000 Affinion Group '144A' 10.125%
15/10/2013 559,300 0.19
US$1,050,000 Aleris International 10% 15/12/2016 7,875 0.00
US$1,730,000 Alliance Data Systems 1.75% 1/8/2013 1,565,650 0.54
US$400,000 American Airlines Pass Through Trust
2001-02 7.858% 1/10/2011 382,000 0.13
US$155,000 American Greetings 7.375% 1/6/2016 133,300 0.05
US$500,000 American Tower 7.125% 15/10/2012 507,500 0.18
US$1,100,000 ARAMARK FRN 1/2/2015 943,250 0.33
US$1,175,000 Arch Coal '144A' 8.75% 1/8/2016 1,177,938 0.41
US$2,010,000 Arch Western Finance 6.75% 1/7/2013 1,939,650 0.67
US$1,025,000 Ashland '144A' 9.125% 1/6/2017 1,073,688 0.37
US$795,000 Atlas Energy Operating / Atlas Energy
Finance 12.125% 1/8/2017 844,687 0.29
US$2,155,000 Atlas Energy Resources '144A' 10.75%
1/2/2018 2,187,325 0.76
US$180,000 Beazer Homes USA 4.625% 15/6/2024 149,400 0.05
US$1,145,000 Beazer Homes USA 8.375% 15/4/2012 875,925 0.30
US$940,000 Berry Plastics FRN 15/2/2015 853,050 0.30
US$600,000 Berry Plastics Holding FRN 15/9/2014 435,000 0.15
US$815,000 Bill Barrett 9.875% 15/7/2016 844,544 0.29
US$2,055,000 Biomet 10% 15/10/2017 2,168,025 0.75
US$1,715,000 Bio-Rad Laboratories '144A' 8%
15/9/2016 1,753,588 0.61
US$300,000 Bio-Rad Laboratories 6.125%
15/12/2014 285,750 0.10
US$720,000 Boyd Gaming 7.75% 15/12/2012 712,800 0.25
US$715,000 Broadview Networks Holdings
11.375% 1/9/2012 618,475 0.22
US$1,620,000 Brunswick '144A' 11.25% 1/11/2016 1,705,050 0.59
US$1,700,000 Cablevision Systems 8% 15/4/2012 1,729,750 0.60
US$2,505,000 Calpine Construction Finance '144A'
8% 1/6/2016 2,505,000 0.87
US$1,500,000 Casella Waste Systems '144A' 11%
15/7/2014 1,561,875 0.54
US$145,000 Catalent Pharma Solutions 9.5%
15/4/2015 118,175 0.04
US$680,000 CCH II Capital 10.25% 15/9/2010 759,050 0.26
US$800,000 Charter Communications 6.5%
1/10/2027 348,000 0.12
US$700,000 Chesapeake Energy 6.375% 15/6/2015 644,000 0.22
US$1,430,000 Chesapeake Energy 7.25% 15/12/2018 1,319,175 0.46
US$520,000 Cimarex Energy 7.125% 1/5/2017 483,600 0.17
Transferable Securities Admitted to an Official Stock Exchange
Listing or Dealt in on Another Regulated Market
Holding Description Value (US$) %
Transferable Securities Admitted to an Official Stock Exchange
Listing or Dealt in on Another Regulated Market
Holding Description Value (US$) %

142 BlackRock Global Funds (BGF)
Global High Yield Bond Fund continued
Portfolio of Investments 31 August 2009
US$3,910,000 Cincinnati Bell 7.25% 15/7/2013 3,812,249 1.33
US$330,000 CIT Group 4.75% 15/12/2010 198,147 0.07
US$1,880,000 CIT Group 5% 1/2/2015 1,055,633 0.37
US$235,000 CIT Group 5.2% 3/11/2010 141,197 0.05
US$235,000 CIT Group FRN 12/3/2010 145,994 0.05
US$600,000 Clearwater Paper '144A' 10.625%
15/6/2016 645,000 0.22
US$835,000 CMS Energy 8.75% 15/6/2019 887,161 0.31
US$3,095,000 Community Health Systems 8.875%
15/7/2015 3,122,081 1.09
US$980,490 Continental Airlines 7.875% 2/7/2018 642,220 0.22
US$1,000,000 Cricket Communications '144A' 7.75%
15/5/2016 965,000 0.34
US$2,615,000 Cricket Communications 9.375%
1/11/2014 2,477,713 0.86
US$470,000 Cricket Communications 10% 15/7/2015 458,249 0.16
US$1,845,000 Crown Americas LLC / Crown Americas
Capital Corp II '144A' 7.625%
15/5/2017 1,831,163 0.64
US$705,000 Crown Castle International 9% 15/1/2015 736,725 0.26
US$680,000 CSC Holdings '144A' 8.5% 15/4/2014 691,900 0.24
US$550,000 Denbury Resources 7.5% 15/12/2015 539,000 0.19
US$1,250,000 Denbury Resources 9.75% 1/3/2016 1,321,875 0.46
US$1,000,000 DISH DBS 7.75% 31/5/2015 990,000 0.34
US$2,160,000 DJO Finance 10.875% 15/11/2014 2,095,200 0.73
US$1,485,000 Dollar General 10.625% 15/7/2015 1,655,775 0.58
US$1,015,000 Dollar General 11.875% 15/7/2017 1,141,875 0.40
US$950,000 Dynegy Roseton/Danskammer Pass
Through Trust Series B 7.67%
8/11/2016 850,250 0.30
US$53,000 E*Trade Financial 12.5% 30/11/2017 53,663 0.02
US$169,000 E*Trade Financial 'A' 0% 31/8/2019 267,865 0.09
US$2,400,000 Echostar DBS 7% 1/10/2013 2,370,000 0.82
US$70,000 Edison Mission Energy 7.2% 15/5/2019 50,925 0.02
US$528,000 Edison Mission Energy 7.75% 15/6/2016 431,640 0.15
US$1,950,000 El Paso 8.25% 15/2/2016 1,979,250 0.69
US$1,007,070 Elwood Energy 8.159% 5/7/2026 883,598 0.31
US$305,000 Encore Acquisition 9.5% 1/5/2016 309,575 0.11
US$4,427,100 Energy Future Holdings 11.25%
1/11/2017 2,766,938 0.96
US$1,180,000 EXCO Resources 7.25% 15/1/2011 1,160,825 0.40
US$1,915,000 First Data '144A' 11.25% 31/3/2016 1,464,974 0.51
US$1,565,000 First Data 9.875% 24/9/2015 1,349,813 0.47
US$750,000 Forest City Enterprises 7.625% 1/6/2015 474,375 0.17
US$2,110,000 Forest Oil '144A' 8.5% 15/2/2014 2,131,100 0.74
US$2,560,000 Forest Oil 7.25% 15/6/2019 2,412,800 0.84
US$400,000 Foundation PA Coal 7.25% 1/8/2014 391,000 0.14
US$1,895,000 Freeport-McMoRan Copper & Gold
8.375% 1/4/2017 1,978,304 0.69
US$650,000 Frontier Communications 8.25%
1/5/2014 649,188 0.23
US$2,590,000 General Nutrition Centers FRN
15/3/2014 2,272,725 0.79
US$1,250,000 Geo Group 8.25% 15/7/2013 1,249,999 0.44
US$1,195,000 Georgia-Pacific '144A' 8.25% 1/5/2016 1,218,900 0.42
US$865,000 Georgia-Pacific 8.125% 15/5/2011 882,300 0.31
US$1,300,000 GMAC '144A' 6.875% 15/9/2011 1,212,250 0.42
US$900,000 GMAC '144A' 6.875% 28/8/2012 803,250 0.28
US$2,300,000 GMAC '144A' 7.25% 2/3/2011 2,187,875 0.76
US$400,000 GMAC '144A' 8% 1/11/2031 316,000 0.11
US$1,976,000 GMAC '144A' FRN 1/12/2014 1,523,990 0.53
US$2,000,000 GMAC 6.75% 1/12/2014 1,631,976 0.57
US$2,117,000 Goodyear Tire & Rubber 8.625%
1/12/2011 2,159,340 0.75
US$3,125,000 Graphic Packaging International '144A'
9.5% 15/6/2017 3,227,375 1.12
US$218,000 Graphic Packaging International 8.5%
15/8/2011 219,090 0.08
US$1,000,000 Graphic Packaging International 9.5%
15/8/2013 1,009,999 0.35
US$1,070,000 Group 1 Automotive 8.25% 15/8/2013 971,024 0.34
US$995,000 Harrah's Operating '144A' 10%
15/12/2018 691,525 0.24
US$775,000 Harrahs Operating Escrow / Harrahs
Escrow '144A' 11.25% 1/6/2017 794,375 0.28
US$1,370,000 HCA 9.125% 15/11/2014 1,387,125 0.48
US$955,000 HCA 9.25% 15/11/2016 969,325 0.34
US$1,910,000 HCP 6.7% 30/1/2018 1,766,271 0.61
US$1,155,000 Healthsouth 10.75% 15/6/2016 1,230,075 0.43
US$3,395,000 Hologic 2% 15/12/2037
(Step-up coupon) 2,737,219 0.95
US$1,090,000 Horizon Lines 4.25% 15/8/2012 798,425 0.28
US$1,810,000 Icahn Enterprises Finance 7.125%
15/2/2013 1,710,450 0.60
US$1,320,000 Icahn Enterprises Finance 8.125%
1/6/2012 1,306,800 0.45
US$3,250,000 Intelsat 9.25% 15/6/2016 3,314,999 1.15
US$530,000 International Paper 9.375% 15/5/2019 593,831 0.21
US$2,625,000 iPCS FRN 1/5/2013 2,165,625 0.75
US$1,170,000 Iron Mountain 8.375% 15/8/2021 1,171,463 0.41
US$350,000 iStar Financial 'B' 5.125% 1/4/2011 192,500 0.07
US$1,675,000 Jarden 8% 1/5/2016 1,725,250 0.60
US$98,000 KB Home 6.375% 15/8/2011 98,735 0.03
US$690,000 KB Home 9.1% 15/9/2017 707,250 0.25
US$2,600,000 L-3 Communications 5.875%
15/1/2015 2,444,000 0.85
US$240,000 Lear 8.75% 1/12/2016 129,000 0.04
US$1,300,000 Leucadia National 7.125% 15/3/2017 1,199,250 0.42
US$1,200,000 Leucadia National 8.125% 15/9/2015 1,182,000 0.41
€1,250,000 Levi Strauss & Co 8.625% 1/4/2013 1,670,047 0.58
US$275,000 Liberty Media 3.125% 30/3/2023 266,406 0.09
US$524,000 Local Insight Regatta Holdings 11%
1/12/2017 149,340 0.05
US$555,000 Lorillard Tobacco 8.125% 23/6/2019 616,384 0.21
US$110,000 Macy's Retail Holdings 5.875%
15/1/2013 104,069 0.04
US$1,500,000 Massey Energy 3.25% 1/8/2015 1,141,875 0.40
US$345,000 Massey Energy 6.875% 15/12/2013 326,025 0.11
US$500,000 Mediacom Broadband 8.5% 15/10/2015 491,250 0.17
US$2,685,000 MetroPCS Wireless 9.25% 1/11/2014 2,644,725 0.92
US$860,000 MGM Mirage '144A' 11.125%
15/11/2017 929,875 0.32
US$1,250,000 MGM Mirage '144A' 13% 15/11/2013 1,403,125 0.49
US$1,605,000 Michaels Stores 11.375% 1/11/2016 1,388,325 0.48
US$3,090,000 NewPage 10% 1/5/2012 1,691,775 0.59
US$2,830,000 Nextel Communications 'E' 6.875%
31/10/2013 2,554,075 0.89
US$130,000 Nextel Communications 'F' 5.95%
15/3/2014 110,175 0.04
US$500,000 Nielsen Finance / Nielsen Finance
11.5% 1/5/2016 498,750 0.17
US$970,000 Nielsen Finance 10% 1/8/2014 919,075 0.32
€1,100,000 Nielsen Finance 9% 1/8/2014 1,469,704 0.51
US$1,290,000 NII Holdings 2.75% 15/8/2025 1,262,588 0.44
US$1,070,000 Nortek 10% 1/12/2013 1,000,450 0.35
US$550,000 NRG Energy 7.25% 1/2/2014 536,250 0.19
US$1,955,000 NRG Energy 7.375% 1/2/2016 1,871,913 0.65
US$1,980,000 NRG Energy 8.5% 15/6/2019 1,935,450 0.67
Transferable Securities Admitted to an Official Stock Exchange
Listing or Dealt in on Another Regulated Market
Holding Description Value (US$) %
Transferable Securities Admitted to an Official Stock Exchange
Listing or Dealt in on Another Regulated Market
Holding Description Value (US$) %
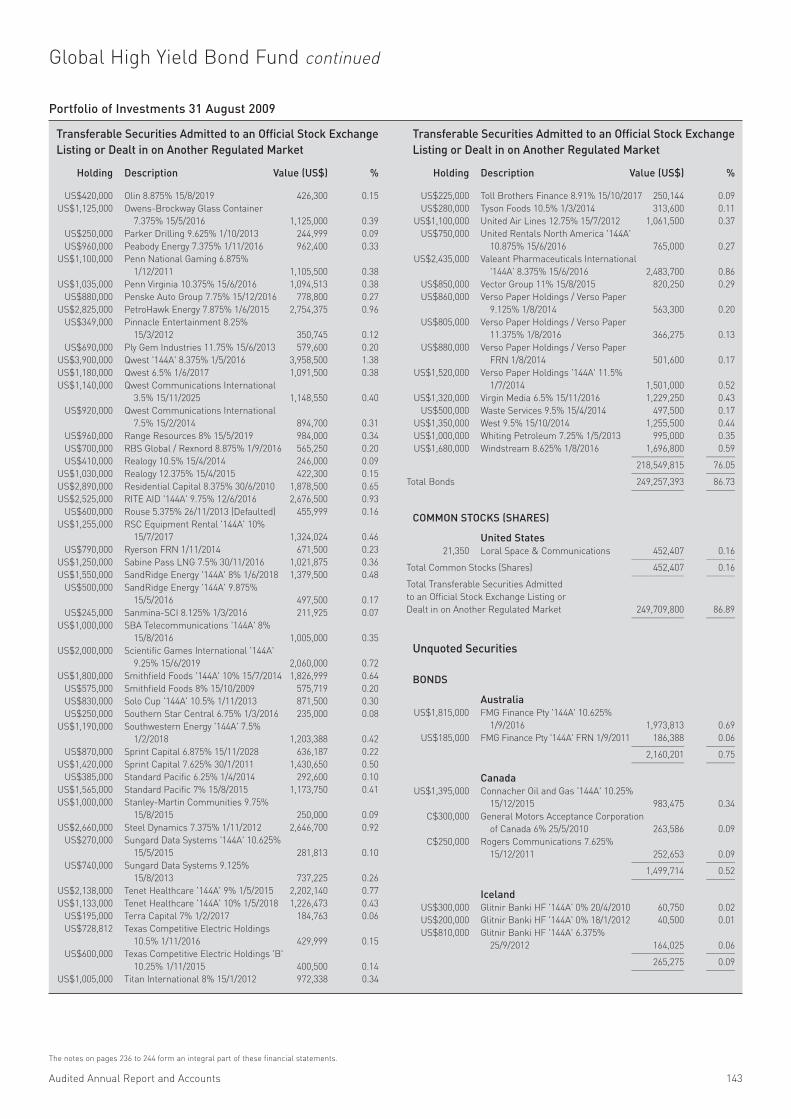
Audited Annual Report and Accounts 143
The notes on pages 236 to 244 form an integral part of these financial statements.
Global High Yield Bond Fund continued
Portfolio of Investments 31 August 2009
US$420,000 Olin 8.875% 15/8/2019 426,300 0.15
US$1,125,000 Owens-Brockway Glass Container
7.375% 15/5/2016 1,125,000 0.39
US$250,000 Parker Drilling 9.625% 1/10/2013 244,999 0.09
US$960,000 Peabody Energy 7.375% 1/11/2016 962,400 0.33
US$1,100,000 Penn National Gaming 6.875%
1/12/2011 1,105,500 0.38
US$1,035,000 Penn Virginia 10.375% 15/6/2016 1,094,513 0.38
US$880,000 Penske Auto Group 7.75% 15/12/2016 778,800 0.27
US$2,825,000 PetroHawk Energy 7.875% 1/6/2015 2,754,375 0.96
US$349,000 Pinnacle Entertainment 8.25%
15/3/2012 350,745 0.12
US$690,000 Ply Gem Industries 11.75% 15/6/2013 579,600 0.20
US$3,900,000 Qwest '144A' 8.375% 1/5/2016 3,958,500 1.38
US$1,180,000 Qwest 6.5% 1/6/2017 1,091,500 0.38
US$1,140,000 Qwest Communications International
3.5% 15/11/2025 1,148,550 0.40
US$920,000 Qwest Communications International
7.5% 15/2/2014 894,700 0.31
US$960,000 Range Resources 8% 15/5/2019 984,000 0.34
US$700,000 RBS Global / Rexnord 8.875% 1/9/2016 565,250 0.20
US$410,000 Realogy 10.5% 15/4/2014 246,000 0.09
US$1,030,000 Realogy 12.375% 15/4/2015 422,300 0.15
US$2,890,000 Residential Capital 8.375% 30/6/2010 1,878,500 0.65
US$2,525,000 RITE AID '144A' 9.75% 12/6/2016 2,676,500 0.93
US$600,000 Rouse 5.375% 26/11/2013 (Defaulted) 455,999 0.16
US$1,255,000 RSC Equipment Rental '144A' 10%
15/7/2017 1,324,024 0.46
US$790,000 Ryerson FRN 1/11/2014 671,500 0.23
US$1,250,000 Sabine Pass LNG 7.5% 30/11/2016 1,021,875 0.36
US$1,550,000 SandRidge Energy '144A' 8% 1/6/2018 1,379,500 0.48
US$500,000 SandRidge Energy '144A' 9.875%
15/5/2016 497,500 0.17
US$245,000 Sanmina-SCI 8.125% 1/3/2016 211,925 0.07
US$1,000,000 SBA Telecommunications '144A' 8%
15/8/2016 1,005,000 0.35
US$2,000,000 Scientific Games International '144A'
9.25% 15/6/2019 2,060,000 0.72
US$1,800,000 Smithfield Foods '144A' 10% 15/7/2014 1,826,999 0.64
US$575,000 Smithfield Foods 8% 15/10/2009 575,719 0.20
US$830,000 Solo Cup '144A' 10.5% 1/11/2013 871,500 0.30
US$250,000 Southern Star Central 6.75% 1/3/2016 235,000 0.08
US$1,190,000 Southwestern Energy '144A' 7.5%
1/2/2018 1,203,388 0.42
US$870,000 Sprint Capital 6.875% 15/11/2028 636,187 0.22
US$1,420,000 Sprint Capital 7.625% 30/1/2011 1,430,650 0.50
US$385,000 Standard Pacific 6.25% 1/4/2014 292,600 0.10
US$1,565,000 Standard Pacific 7% 15/8/2015 1,173,750 0.41
US$1,000,000 Stanley-Martin Communities 9.75%
15/8/2015 250,000 0.09
US$2,660,000 Steel Dynamics 7.375% 1/11/2012 2,646,700 0.92
US$270,000 Sungard Data Systems '144A' 10.625%
15/5/2015 281,813 0.10
US$740,000 Sungard Data Systems 9.125%
15/8/2013 737,225 0.26
US$2,138,000 Tenet Healthcare '144A' 9% 1/5/2015 2,202,140 0.77
US$1,133,000 Tenet Healthcare '144A' 10% 1/5/2018 1,226,473 0.43
US$195,000 Terra Capital 7% 1/2/2017 184,763 0.06
US$728,812 Texas Competitive Electric Holdings
10.5% 1/11/2016 429,999 0.15
US$600,000 Texas Competitive Electric Holdings 'B'
10.25% 1/11/2015 400,500 0.14
US$1,005,000 Titan International 8% 15/1/2012 972,338 0.34
US$225,000 Toll Brothers Finance 8.91% 15/10/2017 250,144 0.09
US$280,000 Tyson Foods 10.5% 1/3/2014 313,600 0.11
US$1,100,000 United Air Lines 12.75% 15/7/2012 1,061,500 0.37
US$750,000 United Rentals North America '144A'
10.875% 15/6/2016 765,000 0.27
US$2,435,000 Valeant Pharmaceuticals International
'144A' 8.375% 15/6/2016 2,483,700 0.86
US$850,000 Vector Group 11% 15/8/2015 820,250 0.29
US$860,000 Verso Paper Holdings / Verso Paper
9.125% 1/8/2014 563,300 0.20
US$805,000 Verso Paper Holdings / Verso Paper
11.375% 1/8/2016 366,275 0.13
US$880,000 Verso Paper Holdings / Verso Paper
FRN 1/8/2014 501,600 0.17
US$1,520,000 Verso Paper Holdings '144A' 11.5%
1/7/2014 1,501,000 0.52
US$1,320,000 Virgin Media 6.5% 15/11/2016 1,229,250 0.43
US$500,000 Waste Services 9.5% 15/4/2014 497,500 0.17
US$1,350,000 West 9.5% 15/10/2014 1,255,500 0.44
US$1,000,000 Whiting Petroleum 7.25% 1/5/2013 995,000 0.35
US$1,680,000 Windstream 8.625% 1/8/2016 1,696,800 0.59 ___________ ______
218,549,815 76.05 ___________ ______
Total Bonds 249,257,393 86.73 ___________ ______
COMMON STOCKS (SHARES)
United States
21,350 Loral Space & Communications 452,407 0.16 ___________ ______
Total Common Stocks (Shares) 452,407 0.16 ___________ ______
Total Transferable Securities Admitted
to an Official Stock Exchange Listing or
Dealt in on Another Regulated Market 249,709,800 86.89 ___________ ______
Unquoted Securities
BONDS
Australia
US$1,815,000 FMG Finance Pty '144A' 10.625%
1/9/2016 1,973,813 0.69
US$185,000 FMG Finance Pty '144A' FRN 1/9/2011 186,388 0.06 ___________ ______
2,160,201 0.75 ___________ ______
Canada
US$1,395,000 Connacher Oil and Gas '144A' 10.25%
15/12/2015 983,475 0.34
C$300,000 General Motors Acceptance Corporation
of Canada 6% 25/5/2010 263,586 0.09
C$250,000 Rogers Communications 7.625%
15/12/2011 252,653 0.09 ___________ ______
1,499,714 0.52 ___________ ______
Iceland
US$300,000 Glitnir Banki HF '144A' 0% 20/4/2010 60,750 0.02
US$200,000 Glitnir Banki HF '144A' 0% 18/1/2012 40,500 0.01
US$810,000 Glitnir Banki HF '144A' 6.375%
25/9/2012 164,025 0.06 ___________ ______
265,275 0.09 ___________ ______
Transferable Securities Admitted to an Official Stock Exchange
Listing or Dealt in on Another Regulated Market
Holding Description Value (US$) %
Transferable Securities Admitted to an Official Stock Exchange
Listing or Dealt in on Another Regulated Market
Holding Description Value (US$) %

144 BlackRock Global Funds (BGF)
Unrealised profit
US$DescriptionNominal
Value
Unrealised profit
US$DescriptionNominal
Value
US$650,000 Credit Default Swaps (Credit Suisse)
(Fund receives default protection on
Standard Pacific Corp 7% 15/8/2015;
and pays Fixed 5%) (20/9/2014) 26,777
US$320,000 Credit Default Swaps (Credit Suisse)
(Fund receives default protection on
Standard Pacific Corp 7% 15/8/2015;
and pays Fixed 5%) (20/9/2014) 11,597
US$1,150,000 Credit Default Swaps (Credit Suisse)
(Fund receives default protection on
Brunswick Corporation 7.125% 1/8/2027;
and pays Fixed 5%) (20/9/2014) 15,944 __________
54,318 __________
Swaps as at 31 August 2009
Note: The total market value of US$189,944 of these transactions is included in the Statement of Net Assets (see Note 2c).
Global High Yield Bond Fund continued
Portfolio of Investments 31 August 2009
Luxembourg
US$950,000 Wind Acquisition Finance '144A'
10.75% 1/12/2015 1,026,000 0.36 ___________ ______
Netherlands
€500,000 IFCO Systems 10% 30/6/2016 762,685 0.26 ___________ ______
Sweden
US$600,940 Corral Finans AB '144A' 4.213%
15/4/2010 464,226 0.16 ___________ ______
United States
US$990,000 Aleris International 9% 15/12/2014 9,900 0.00
US$1,601,000 Allison Transmission '144A' 11%
1/11/2015 1,464,915 0.51
US$830,000 CC Holdings GS V / Crown Castle GS III
'144A' 7.75% 1/5/2017 846,600 0.30
US$2,220,000 Cengage Learning Acquisitions '144A'
10.5% 15/1/2015 2,025,750 0.71
US$250,000 Chukchansi Economic Development
Authority '144A' FRN 15/11/2012 188,125 0.07
US$1,010,000 Drummond '144A' 7.375% 15/2/2016 893,850 0.31
US$130,000 Esco '144A' 8.625% 15/12/2013 126,750 0.04
US$140,000 Harrah's Operating '144A' 10%
15/12/2015 100,100 0.04
US$365,000 Ipalco Enterprises '144A' 7.25%
1/4/2016 355,875 0.12
US$1,650,000 MacDermid '144A' 9.5% 15/4/2017 1,394,250 0.49
US$10,000 Mashantucket Western Pequot Tribe
'144A' 8.5% 15/11/2015 1,850 0.00
US$1,315,000 Nalco '144A' 8.25% 15/5/2017 1,380,750 0.48
US$1,840,000 NSG Holdings '144A' 7.75% 15/12/2025 1,541,000 0.54
US$850,000 Rainbow National Services '144A'
8.75% 1/9/2012 864,875 0.30
US$935,000 Rainbow National Services '144A'
10.375% 1/9/2014 982,919 0.34
US$1,025,000 Sealed Air '144A' 7.875% 15/6/2017 1,074,971 0.37
US$1,500,000 Sequa '144A' 11.75% 1/12/2015 952,500 0.33
US$2,663,857 Sequa '144A' 13.5% 1/12/2015 1,584,995 0.55
US$100,000 Tropicana Entertainment / Tropicana
Finance 9.625% 15/12/2014 125 0.00
US$1,180,000 Virgin River Casino/RBG/B&BB 9%
15/1/2012 125,375 0.04
€13,830,000 WinStar Communications 12.75%
15/4/2010 – 0.00 ___________ ______
15,915,475 5.54 ___________ ______
Total Bonds 22,093,576 7.68 ___________ ______
WARRANTS
Luxembourg
24,019 Vantico Holdings
(Call Wts 14/6/2011 – Avanti) – 0.00 ___________ ______
United Kingdom
33,600 Jazztel (Wts 15/7/2010) – 0.00 ___________ ______
United States
14,085 Healthsouth (Wts 16/1/2014) – 0.00 ___________ ______
Total Warrants – 0.00 ___________ ______
Total Unquoted Securities 22,093,576 7.68 ___________ ______
Total Portfolio 271,803,376 94.57
Other Net Assets 15,591,614 5.43 ___________ ______
Total Net Assets (US$) 287,394,990 100.00 ___________ ______
Unquoted Securities
Holding Description Value (US$) %
Unquoted Securities
Holding Description Value (US$) %

Audited Annual Report and Accounts 145
The notes on pages 236 to 244 form an integral part of these financial statements.
Global High Yield Bond Fund continued
Open Forward Foreign Exchange Transactions as at 31 August 2009
Core Fund US$
€13,197,500 US$18,752,911 16/9/2009 105,171 105,171
US$34,376,757 €24,530,500 16/9/2009 (675,197) (675,197)
US$462,302 CAD502,000 28/10/2009 8,081 8,081
US$457,660 £280,000 28/10/2009 3,183 3,183 __________ __________
Net unrealised loss (558,762) (558,762)__________ __________
EUR Hedged Share Class €
€155,650,850 US$220,022,498 15/9/2009 1,671,966 2,389,205
US$25,240,222 €17,879,283 15/9/2009 (215,357) (307,741)__________ __________
Net unrealised profit 1,456,609 2,081,464 __________ __________
GBP Hedged Share Class £
£1,480,836 US$2,438,389 15/9/2009 (21,373) (34,696)
US$49,556 £29,919 15/9/2009 611 992 __________ __________
Net unrealised loss (20,762) (33,704)__________ __________
Total net unrealised profit 1,488,998 __________
Note: The net unrealised profit attributed to these transactions is included in the Statement
of Net Assets (see Note 2c).
Unrealised
profit/(loss)
US$ Equivalent
Unrealised
profit/(loss)Value dateSalesPurchases

146 BlackRock Global Funds (BGF)
Global Inflation Linked Bond Fund(1)
Portfolio of Investments 31 August 2009
FUNDS
United Kingdom
2,766,143 Institutional Cash Series Institutional
Liquidity Fund 2,766,143 5.07 ___________ ______
Total Funds 2,766,143 5.07 ___________ ______
BONDS
Canada
C$163,000 Canadian Government Bond 2%
1/12/2041 159,879 0.29
C$272,000 Canadian Government Bond 3%
1/12/2036 345,652 0.64
C$177,000 Canadian Government Bond 4%
1/12/2031 282,217 0.52
C$136,000 Canadian Government Bond 4.25%
1/12/2021 219,197 0.40
C$150,000 Canadian Government Bond 4.25%
1/12/2026 241,168 0.44 ___________ ______
1,248,113 2.29 ___________ ______
France
€708,000 France Government Bond OAT 1%
25/7/2017 1,060,133 1.94
€272,000 France Government Bond OAT 1.6%
25/7/2011 439,518 0.81
€392,000 France Government Bond OAT 1.6%
25/7/2015 635,691 1.16
€625,000 France Government Bond OAT 1.8%
25/7/2040 935,934 1.72
€495,000 France Government Bond OAT 2.5%
25/7/2013 846,951 1.55
€808,000 France Government Bond OAT 3%
25/7/2012 1,445,901 2.65
€633,000 France Government Bond OAT 3.15%
25/7/2032 1,287,044 2.36
€273,000 France Government Bond OAT 3.4%
25/7/2029 590,066 1.08 ___________ ______
7,241,238 13.27 ___________ ______
Germany
€408,000 Bundesobligation Inflation Linked 2.25%
15/4/2013 645,499 1.18
€978,000 Bundesrepublik Deutschland 3.75%
4/1/2019 1,457,859 2.67
€604,000 Deutsche Bundesrepublik Inflation
Linked 1.75% 15/4/2020 896,895 1.65 ___________ ______
3,000,253 5.50 ___________ ______
Greece
€432,000 Hellenic Republic Government Bond
2.3% 25/7/2030 571,128 1.04 ___________ ______
Italy
€272,000 Italy Buoni Poliennali Del Tesoro 1.85%
15/9/2012 422,699 0.77
€816,000 Italy Buoni Poliennali Del Tesoro 2.1%
15/9/2017 1,280,843 2.35
€378,000 Italy Buoni Poliennali Del Tesoro 2.15%
15/9/2014 631,425 1.16
€378,000 Italy Buoni Poliennali Del Tesoro 2.35%
15/9/2019 567,426 1.04
€392,000 Italy Buoni Poliennali Del Tesoro 2.6%
15/9/2023 606,291 1.11 ___________ ______
3,508,684 6.43 ___________ ______
Japan
¥251,000,000 Japanese Government CPI Linked
Bond 1.2% 10/12/2017 2,473,617 4.53 ___________ ______
Sweden
SEK2,025,000 Sweden Government Bond 3.5%
1/12/2028 436,797 0.80
SEK1,770,000 Sweden Government Bond 4%
1/12/2020 382,153 0.70 ___________ ______
818,950 1.50 ___________ ______
United Kingdom
£322,000 United Kingdom Gilt Inflation Linked
0.75% 22/11/2047 577,559 1.06
£695,000 United Kingdom Gilt Inflation Linked
1.125% 22/11/2037 1,345,571 2.47
£1,587,000 United Kingdom Gilt Inflation Linked
1.25% 22/11/2017 2,917,315 5.35
£204,000 United Kingdom Gilt Inflation Linked
1.25% 22/11/2027 389,935 0.71
£68,000 United Kingdom Gilt Inflation Linked
1.25% 22/11/2032 120,206 0.22
£126,000 United Kingdom Gilt Inflation Linked
1.25% 22/11/2055 300,035 0.55
£302,000 United Kingdom Gilt Inflation Linked
2% 26/1/2035 782,771 1.43
£419,000 United Kingdom Gilt Inflation Linked
2.5% 16/8/2013 1,727,152 3.16
£114,000 United Kingdom Gilt Inflation Linked
2.5% 26/7/2016 527,301 0.97
£200,000 United Kingdom Gilt Inflation Linked
'3MO' 1.875% 22/11/2022 374,678 0.69
£357,000 United Kingdom Gilt Inflation Linked
4.125% 22/7/2030 1,477,633 2.71 ___________ ______
10,540,156 19.32 ___________ ______
United States
US$136,000 United States Treasury Inflation Indexed
Bonds 0.625% 15/4/2013 136,860 0.25
US$185,000 United States Treasury Inflation Indexed
Bonds 1.25% 15/4/2014 188,762 0.34
US$621,000 United States Treasury Inflation Indexed
Bonds 1.375% 15/7/2018 603,516 1.11
US$763,000 United States Treasury Inflation Indexed
Bonds 1.625% 15/1/2015 861,387 1.58
US$749,000 United States Treasury Inflation Indexed
Bonds 1.75% 15/1/2028 721,888 1.32
US$544,000 United States Treasury Inflation Indexed
Bonds 1.875% 15/7/2013 651,363 1.19
US$799,000 United States Treasury Inflation Indexed
Bonds 1.875% 15/7/2019 817,257 1.50
Transferable Securities Admitted to an Official Stock Exchange
Listing or Dealt in on Another Regulated Market
Holding Description Value (US$) %
Transferable Securities Admitted to an Official Stock Exchange
Listing or Dealt in on Another Regulated Market
Holding Description Value (US$) %
(1) New Fund launched, see Note 1, for further details.

Audited Annual Report and Accounts 147
The notes on pages 236 to 244 form an integral part of these financial statements.
Portfolio of Investments 31 August 2009
US$1,452,000 United States Treasury Inflation Indexed
Bonds 2% 15/7/2014 1,697,380 3.11
US$606,000 United States Treasury Inflation Indexed
Bonds 2% 15/1/2026 642,862 1.18
US$700,000 United States Treasury Inflation Indexed
Bonds 2.125% 15/1/2019 726,114 1.33
US$1,095,000 United States Treasury Inflation Indexed
Bonds 2.375% 15/1/2025‡ 1,276,330 2.34
US$559,000 United States Treasury Inflation Indexed
Bonds 2.5% 15/1/2029 592,661 1.09
US$947,000 United States Treasury Inflation Indexed
Bonds 2.625% 15/7/2017 1,051,476 1.93
US$272,000 United States Treasury Inflation Indexed
Bonds 3% 15/7/2012 343,081 0.63
US$204,000 United States Treasury Inflation Indexed
Bonds 3.375% 15/1/2012 261,673 0.48
US$553,000 United States Treasury Inflation Indexed
Bonds 3.625% 15/4/2028 893,934 1.64
US$787,000 United States Treasury Inflation Indexed
Bonds 3.875% 15/4/2029 1,297,633 2.38
US$817,000 United States Treasury Inflation Indexed
Bonds 4.25% 15/1/2010 1,059,224 1.94
US$375,000 US Treasury Bond 3% 31/8/2016 372,832 0.68
US$292,000 US Treasury Bond 3.125% 15/5/2019 283,902 0.52
US$500,000 US Treasury Bond 4.25% 15/5/2039 502,666 0.92
US$530,000 US Treasury Inflation Indexed Bonds
1.625% 15/1/2018 541,192 0.99
US$732,000 US Treasury Inflation Indexed Bonds
1.875% 15/7/2015 822,400 1.51
US$272,000 US Treasury Inflation Indexed Bonds
2% 15/4/2012 296,041 0.54
US$2,595,000 US Treasury Inflation Indexed Bonds
2% 15/1/2014 3,090,852 5.66
US$681,000 US Treasury Inflation Indexed Bonds
2.375% 15/4/2011 757,981 1.39
US$84,000 US Treasury Inflation Indexed Bonds
2.375% 15/1/2017 93,959 0.17
US$440,000 US Treasury Inflation Indexed Bonds
2.375% 15/1/2027 484,373 0.89
US$299,000 US Treasury Inflation Indexed Bonds
2.5% 15/7/2016 336,318 0.62 ___________ ______
21,405,917 39.23 ___________ ______
50,808,056 93.11 ___________ ______
Total Portfolio 53,574,199 98.18
Other Net Assets 990,798 1.82 ___________ ______
Total Net Assets (US$) 54,564,997 100.00 ___________ ______
Transferable Securities Admitted to an Official Stock Exchange
Listing or Dealt in on Another Regulated Market
Holding Description Value (US$) %
Transferable Securities Admitted to an Official Stock Exchange
Listing or Dealt in on Another Regulated Market
Holding Description Value (US$) %
(‡) Securities given in guarantee, see Note 12, for further details.
Global Inflation Linked Bond Fund(1) continued
Open Futures Contracts as at 31 August 2009
5 Australian 3 Year Bond September 2009 1,115,227
(2) Euro Bund September 2009 (350,228)
30 US Treasury 10 Year Note December 2009 3,507,188
6 US Long Bond (CBT) December 2009 714,188
(12) US Treasury 5 Year Note (CBT) December 2009 (1,380,375)
(21) US Treasury 2 Year Note (CBT) December 2009 (4,540,266)
(9) 3 Month Euro EURIBOR June 2010 (3,168,445)
9 3 Month Euro EURIBOR June 2011 3,130,025 __________
Total commitment (972,686)__________
Note: The net unrealised loss of US$6,752 attributed to these transactions is included
in the Statement of Net Assets (see Note 2c).
Value
US$
Expiration
dateContracts/Description
Number
of Contracts
Open Forward Foreign Exchange Transactions as at 31 August 2009
Core Fund US$
€281,000 US$401,484 16/9/2009 40 40
US$13,967,719 €9,889,500 16/9/2009 (163,518) (163,518)
US$1,242,782 CAD1,349,500 28/10/2009 21,725 21,725
US$10,554,332 £6,452,000 28/10/2009 81,888 81,888
US$2,389,117 ¥224,296,500 28/10/2009 (23,989) (23,989)
US$812,257 SEK5,815,000 28/10/2009 (3,482) (3,482)__________ __________
Net unrealised loss (87,336) (87,336)__________ __________
EUR Hedged Share Class €
€14,115,189 US$19,962,615 15/9/2009 144,703 206,778 __________ __________
Net unrealised profit 144,703 206,778 __________ __________
Total net unrealised profit 119,442 __________
Note: The net unrealised profit attributed to these transactions is included in the Statement
of Net Assets (see Note 2c).
Unrealised
profit/(loss)
US$ Equivalent
Unrealised
profit/(loss)Value dateSalesPurchases

148 BlackRock Global Funds (BGF)
Global Opportunities Fund
Portfolio of Investments 31 August 2009
COMMON STOCKS (SHARES)
Australia
15,700 Woodside Petroleum 643,445 0.66 ___________ ______
Belgium
13,300 InBev 564,247 0.57 ___________ ______
Brazil
17,900 Banco Bradesco ADR 292,307 0.30
17,710 Banco Itau Holding Financeira ADR 299,122 0.30
30,300 BM&F - Bovespa 189,604 0.19 ___________ ______
781,033 0.79 ___________ ______
Canada
6,300 Canadian Natural Resources 360,130 0.37
11,000 EnCana 576,448 0.58
39,879 Kinross Gold 760,595 0.77
4,600 Research In Motion 333,038 0.34
6,700 Royal Bank of Canada 339,228 0.34
18,100 Suncor Energy 556,960 0.57
6,500 Toronto-Dominion Bank 395,910 0.40 ___________ ______
3,322,309 3.37 ___________ ______
Cayman Islands
12,500 Herbalife 379,125 0.39 ___________ ______
China
19,000 AirMedia Group ADR 136,420 0.14
355,000 China Construction Bank 'H' 267,932 0.27
255,900 China Railway Construction 'H' 378,352 0.38
25,100 Focus Media Holding ADR 220,880 0.22
396,500 Industrial & Commercial Bank of China 'H' 270,607 0.28
13,000 Noah Education Holdings ADR 58,110 0.06
14,200 Sina 420,888 0.43 ___________ ______
1,753,189 1.78 ___________ ______
Denmark
4,300 Novo Nordisk 'B' 262,914 0.27 ___________ ______
Finland
14,200 Fortum OYJ 367,463 0.37 ___________ ______
France
21,400 AXA 485,286 0.49
6,300 BNP Paribas 510,604 0.52
14,400 Cie de Saint-Gobain 640,338 0.65
13,400 France Telecom 341,304 0.35
4,700 PPR 544,660 0.55
4,600 Societe Generale 368,155 0.38
8,000 Total 455,710 0.46
1,500 Unibail-Rodamco (Reit) 295,786 0.30
15,700 Vivendi 449,353 0.46 ___________ ______
4,091,196 4.16 ___________ ______
Germany
1,800 Allianz SE 207,153 0.21
11,000 Bayerische Motoren Werke 496,927 0.50
4,500 Deutsche Boerse 338,353 0.34
8,900 MAN 677,454 0.69
7,300 RWE 670,719 0.68
4,700 Salzgitter 439,758 0.45 ___________ ______
2,830,364 2.87 ___________ ______
Hong Kong
29,600 China Mobile 287,941 0.29
220,900 China Unicom Hong Kong 310,644 0.31
145,300 New World Development 293,186 0.30
29,200 Wing Hang Bank 263,707 0.27 ___________ ______
1,155,478 1.17 ___________ ______
Indonesia
1,658,400 Bank Negara Indonesia Persero 319,176 0.32 ___________ ______
Ireland
6,100 Covidien 239,242 0.24 ___________ ______
Israel
8,100 Teva Pharmaceutical Industries ADR 413,507 0.42 ___________ ______
Italy
175,800 A2A 336,613 0.34
69,800 Intesa Sanpaolo 299,215 0.31 ___________ ______
635,828 0.65 ___________ ______
Japan
96,500 Amada 677,685 0.69
37,800 Fujitsu 254,480 0.26
13,000 Honda Motor 410,335 0.42
124,700 ITOCHU 885,111 0.90
11,400 JFE Holdings 398,451 0.40
40 Kenedix Realty Investment (Reit) 150,132 0.15
8,100 Mitsubishi Estate 134,412 0.14
38,500 Mitsubishi UFJ Financial Group 245,943 0.25
52,400 Mitsui & Co 683,000 0.69
8,200 Mitsui Fudosan 155,031 0.16
48,470 Mizuho Financial Group 118,849 0.12
50 Nippon Residential Investment (Reit) 124,751 0.13
98,700 Nippon Steel 387,433 0.39
6,500 Sumitomo Mitsui Financial Group 280,314 0.28
18,800 Toyo Suisan Kaisha 479,174 0.49
13,100 Toyota Motor 562,123 0.57
41,300 Yamato Holdings 684,003 0.70 ___________ ______
6,631,227 6.74 ___________ ______
Luxembourg
13,900 ArcelorMittal 497,343 0.51
4,700 Millicom International Cellular 327,355 0.33 ___________ ______
824,698 0.84 ___________ ______
Malaysia
95,000 Bumiputra-Commerce Holdings 268,421 0.27 ___________ ______
Mexico
13,900 Fomento Economico Mexicano SAB de
CV ADR 514,439 0.52 ___________ ______
Netherlands
4,800 Corio (Reit) 291,019 0.29
13,700 Randstad Holding 560,564 0.57 ___________ ______
851,583 0.86 ___________ ______
New Zealand
266,600 Telecom Corporation of New Zealand 498,915 0.51 ___________ ______
Norway
18,800 Yara International 515,231 0.53 ___________ ______
Transferable Securities Admitted to an Official Stock Exchange
Listing or Dealt in on Another Regulated Market
Holding Description Value (US$) %
Transferable Securities Admitted to an Official Stock Exchange
Listing or Dealt in on Another Regulated Market
Holding Description Value (US$) %

Audited Annual Report and Accounts 149
The notes on pages 236 to 244 form an integral part of these financial statements.
Global Opportunities Fund continued
Portfolio of Investments 31 August 2009
Russian Federation
12,800 Lukoil ADR 647,680 0.66
23,100 Vimpel-Communications ADR 359,205 0.36 ___________ ______
1,006,885 1.02 ___________ ______
Singapore
102,300 CapitaLand 262,904 0.27
31,000 DBS Group Holdings 271,429 0.28
207,500 Singapore Telecommunications 451,332 0.46
32,600 United Overseas Bank 377,122 0.38
120,200 Wilmar International 544,541 0.55 ___________ ______
1,907,328 1.94 ___________ ______
South Africa
21,900 Naspers 714,891 0.73 ___________ ______
South Korea
7,800 GS Engineering & Construction 597,694 0.61
1,100 Samsung Electronics 679,078 0.69 ___________ ______
1,276,772 1.30 ___________ ______
Spain
25,800 Banco Bilbao Vizcaya Argentaria 457,139 0.46
22,400 Bancontander 343,603 0.35
11,400 Inditex 615,912 0.63
20,100 Telefonica 507,648 0.51 ___________ ______
1,924,302 1.95 ___________ ______
Sweden
53,500 Nordea Bank 560,496 0.57 ___________ ______
Switzerland
4,200 Alcon 539,490 0.55
23,800 Nestle 973,958 0.99
18,200 Novartis 840,075 0.85
6,700 Roche Holding Genusscheine 1,067,453 1.08
8,700 Swiss Reinsurance 401,247 0.41
6,100 Transocean 464,454 0.47
28,200 Tyco International 886,608 0.90
9,500 UBS 173,629 0.18
1,400 Zurich Financial Services 306,759 0.31 ___________ ______
5,653,673 5.74 ___________ ______
Taiwan
369,738 Asustek Computer 588,589 0.60
403,900 Chang Hwa Commercial Bank 168,719 0.17
1,565 High Tech Computer 15,737 0.01
576,300 Mega Financial Holding 287,130 0.29
48,200 Siliconware Precision Industries ADR 302,696 0.31 ___________ ______
1,362,871 1.38 ___________ ______
Thailand
63,300 Bangkok Bank 205,664 0.21 ___________ ______
United Kingdom
62,700 Aviva 413,421 0.42
64,600 Barclays 398,738 0.41
33,500 BG Group 553,033 0.56
35,800 Eurasian Natural Resources 502,672 0.51
50,100 GlaxoSmithKline 978,338 0.99
57,000 HSBC Holdings 621,862 0.63
24,400 Imperial Tobacco Group 685,206 0.70
37,600 Kazakhmys 603,323 0.61
217,300 Legal & General Group 271,604 0.28
33,300 Persimmon 266,055 0.27
50,000 Prudential 435,843 0.44
13,500 Standard Chartered 305,918 0.31
113,100 Tesco 690,113 0.70
19,600 Unilever 534,504 0.54
20,400 Vodafone Group ADR 441,660 0.45
52,000 WPP 438,505 0.45
37,400 Xstrata 501,764 0.51 ___________ ______
8,642,559 8.78 ___________ ______
United States
4,900 Abbott Laboratories 223,244 0.23
23,400 AGCO 720,720 0.73
24,100 AK Steel Holding 492,604 0.50
42,900 Alcoa 522,093 0.53
16,400 Alpha Natural Resources 549,892 0.56
15,700 American Electric Power 496,434 0.50
16,500 Ameriprise Financial 492,360 0.50
4,000 Amgen 238,080 0.24
9,000 Anadarko Petroleum 479,610 0.49
17,900 Analog Devices 506,928 0.51
5,900 Apache 501,913 0.51
3,600 Apple 603,940 0.61
37,400 Applied Materials 493,680 0.50
4,430 AvalonBay Communities 285,026 0.29
3,400 Boston Properties (Reit) 205,870 0.21
27,600 Bristol-Myers Squibb 599,196 0.61
7,500 Bunge 506,100 0.51
46,400 CBS 489,056 0.50
18,300 Celanese 'A' 463,905 0.47
22,100 Charles Schwab 387,855 0.39
13,400 Chevron 934,114 0.95
30,800 Cisco Systems 666,820 0.68
91,100 Citigroup 453,678 0.46
15,200 CSX 647,976 0.66
13,000 Dominion Resources 429,000 0.44
22,300 Dow Chemical 476,328 0.48
44,300 eBay 979,920 1.00
7,100 Energizer Holdings 463,488 0.47
4,800 EOG Resources 342,672 0.35
4,800 Federal Realty Investment Trust (Reit) 296,400 0.30
1,700 Goldman Sachs Group 274,941 0.28
1,300 Google 'A' 595,751 0.61
20,800 Halliburton 488,800 0.50
26,600 Hartford Financial Services Group 633,080 0.64
11,900 Helmerich & Payne 393,890 0.40
3,000 Henry Schein 158,160 0.16
18,400 Hewlett-Packard 817,328 0.83
21,100 Hudson City Bancorp 275,524 0.28
30,200 Intel 605,193 0.61
6,000 International Business Machines 703,560 0.71
30,100 Invesco 618,555 0.63
7,500 JM Smucker 388,950 0.40
7,400 Johnson & Johnson 445,184 0.45
7,600 JPMorgan Chase & Co 324,672 0.33
19,300 Kla-Tencor 605,055 0.61
14,200 Kohl's 732,436 0.74
18,000 Las Vegas Sands 255,240 0.26
18,600 LaSalle Hotel Properties (Reit) 307,830 0.31
24,400 Lincoln National 610,488 0.62
9,000 Mack-Cali Realty (Reit) 288,900 0.29
24,000 Macy's 373,200 0.38
16,700 Manpower 863,390 0.88
18,700 Marathon Oil 575,399 0.58
Transferable Securities Admitted to an Official Stock Exchange
Listing or Dealt in on Another Regulated Market
Holding Description Value (US$) %
Transferable Securities Admitted to an Official Stock Exchange
Listing or Dealt in on Another Regulated Market
Holding Description Value (US$) %

150 BlackRock Global Funds (BGF)
Global Opportunities Fund continued
Portfolio of Investments 31 August 2009
7,500 Medco Health Solutions 410,250 0.42
9,900 Medtronic 377,388 0.38
8,200 Metlife 309,140 0.31
28,800 Microsoft 705,885 0.72
8,500 Morgan Stanley 241,655 0.25
14,900 Newfield Exploration 573,352 0.58
5,100 NIKE 'B' 282,948 0.29
21,500 Oracle 473,215 0.48
16,100 People's United Financial 259,693 0.26
11,900 PepsiCo 671,517 0.68
58,200 Pfizer 967,866 0.98
5,400 Piper Jaffray 263,358 0.27
13,100 PPG Industries 721,941 0.73
7,800 Prudential Financial 399,438 0.41
13,700 Public Service Enterprise Group 433,879 0.44
10,000 QUALCOMM 462,688 0.47
7,800 Ralcorp Holdings 488,358 0.50
14,600 Robert Half International 384,126 0.39
8,300 SPX 464,053 0.47
6,300 State Street 330,309 0.34
40,200 Steel Dynamics 670,134 0.68
17,600 SunTrust Banks 411,312 0.42
8,000 T Rowe Price Group 359,280 0.37
25,900 Texas Instruments 635,327 0.65
11,700 Travelers 578,916 0.59
5,900 TreeHouse Foods 219,185 0.22
9,700 Union Pacific 582,097 0.59
1,900 Unum Group 42,674 0.04
18,700 Urban Outfitters 527,340 0.54
9,600 US Bancorp 214,176 0.22
21,300 Valero Energy 392,985 0.40
32,800 Virgin Media 383,104 0.39
13,600 Wabtec 512,992 0.52
22,300 Walt Disney 590,950 0.60
4,700 WellPoint 249,100 0.25
17,300 Wells Fargo & Co 472,809 0.48
9,800 Wyeth 468,342 0.48
13,900 Xto Energy 533,900 0.54
17,000 Yum! Brands 586,160 0.60 ___________ ______
43,936,270 44.63 ___________ ______
Total Portfolio 95,054,741 96.55
Other Net Assets 3,394,316 3.45 ___________ ______
Total Net Assets (US$) 98,449,057 100.00 ___________ ______
Transferable Securities Admitted to an Official Stock Exchange
Listing or Dealt in on Another Regulated Market
Holding Description Value (US$) %
Transferable Securities Admitted to an Official Stock Exchange
Listing or Dealt in on Another Regulated Market
Holding Description Value (US$) %
Open Forward Foreign Exchange Transactions as at 31 August 2009
Core Fund
BRL 2,021,481 US$1,057,647 2/9/2009 16,170
JPY42,476,000 US$449,551 16/9/2009 7,299
US$1,613,935 €1,128,000 16/9/2009 2,122
BRL 1,990,909 US$1,057,700 2/10/2009 (5,669)
AUD 3,055,000 US$2,515,548 28/10/2009 27,920
CAD 1,426,000 US$1,306,224 28/10/2009 (15,947)
CHF 703,000 US$661,613 28/10/2009 672
DKK 1,709,000 US$325,890 28/10/2009 1,810
€3,030,000 US$4,305,660 28/10/2009 23,941
£ 592,000 US$976,052 28/10/2009 (15,159)
HKD 7,500,000 US$968,129 28/10/2009 (82)
JPY258,465,000 US$2,743,790 28/10/2009 36,919
NOK 1,084,000 US$179,685 28/10/2009 (260)
SEK 5,104,000 US$713,831 28/10/2009 2,168
US$208,551 CAD 227,000 28/10/2009 3,156
US$538,845 CHF 574,000 28/10/2009 (1,911)
US$737,921 €517,000 28/10/2009 (824)
US$314,179 £ 193,000 28/10/2009 914
US$724,942 NOK 4,387,000 28/10/2009 (1,199)
US$71,927 NZD 107,000 28/10/2009 (628)
US$728,719 SGD 1,054,000 28/10/2009 (1,011)__________
Net unrealised profit 80,401 __________
Note: The net unrealised profit attributed to these transactions is included in the Statement
of Net Assets (see Note 2c).
Value date
Unrealised
profit/(loss)
US$SalesPurchases
Sector Breakdown as at 31 August 2009
Finance 23.17
Information technology 11.63
Industrials 11.02
Energy 10.19
Consumer discretionary 8.91
Healthcare 8.60
Consumer staples 8.23
Materials 8.07
Telecommunication services 3.96
Utilities 2.77
Other net assets 3.45 __________
100.00 __________
% of net
assets

Audited Annual Report and Accounts 151
The notes on pages 236 to 244 form an integral part of these financial statements.
Global SmallCap Fund
Portfolio of Investments 31 August 2009
COMMON STOCKS (SHARES) & RIGHTS
Australia
1,080,804 CFS Retail Property Trust (Reit) 1,717,578 0.80
13,100 Cochlear 616,544 0.29
545,300 Goodman Fielder 702,380 0.32 ___________ ______
3,036,502 1.41 ___________ ______
Austria
14,800 Intercell 528,276 0.25 ___________ ______
Bermuda
16,500 Arch Capital Group 1,062,600 0.49
40,500 Golar LNG 405,405 0.19
544,500 Golden Ocean Group 592,207 0.28
44,950 Lazard 1,740,914 0.81
21,800 PartnerRe 1,610,366 0.75
12,800 RenaissanceRe Holdings 694,272 0.32 ___________ ______
6,105,764 2.84 ___________ ______
Brazil
95,600 Santos Brasil Participacoes (Unit) 634,788 0.30 ___________ ______
Canada
25,100 Agnico-Eagle Mines 1,432,206 0.67
88,300 Biovail 1,109,931 0.52
955,300 Diagnocure 1,002,620 0.47
125,200 Eldorado Gold 1,292,495 0.60
20,400 Inmet Mining 862,696 0.40
417,700 Lundin Mining 1,428,549 0.66
93,700 Magma Energy 161,076 0.07
84,100 OPTI Canada 119,463 0.06
258,700 Taseko Mines 631,228 0.29 ___________ ______
8,040,264 3.74 ___________ ______
Cayman Islands
191,450 Melco Crown Entertainment ADR 1,191,776 0.55
4,300,100 Ming Fai International Holdings 599,161 0.28 ___________ ______
1,790,937 0.83 ___________ ______
China
23,800 Duoyuan Global Water ADR 719,950 0.33
25,600 Harbin Electric 319,744 0.15
425,100 Li Ning 1,181,896 0.55
46,200 Mindray Medical International ADR 1,416,492 0.66
648,200 Parkson Retail Group 944,993 0.44
1,929,900 Shenzhen Expressway 'H' 976,027 0.45
70,800 WuXi PharmaTech Cayman ADR 833,316 0.39 ___________ ______
6,392,418 2.97 ___________ ______
Denmark
23,685 TrygVesta AS 1,511,823 0.70
11,250 Vestas Wind Systems 802,319 0.38 ___________ ______
2,314,142 1.08 ___________ ______
Finland
151,300 Ramirent OYJ 1,396,621 0.65 ___________ ______
France
24,000 Bonduelle 2,201,676 1.02
23,100 Bourbon 1,014,335 0.47
11,725 Eurofins Scientific 601,052 0.28
80,850 SCOR SE 2,100,298 0.98
60,400 UBISOFT Entertainment 1,068,476 0.50 ___________ ______
6,985,837 3.25 ___________ ______
Germany
35,500 Deutsche Euroshop 1,132,724 0.53
60,400 GEA Group 1,072,791 0.50
44,800 Gerresheimer 1,248,302 0.58
101,400 Paion 137,648 0.06
39,050 Rheinmetall 1,879,318 0.88
7,900 Salzgitter 739,167 0.34
96,600 Symrise 1,591,525 0.74
5,900 Vossloh 688,865 0.32 ___________ ______
8,490,340 3.95 ___________ ______
Hong Kong
929,500 Clear Media 408,926 0.19
1,010,000 Franshion Properties China 284,066 0.13
200,800 Melco International Development 119,946 0.06
509,200 Ports Design 1,165,421 0.54
104,800 Shanghai Industrial Holdings 501,621 0.23 ___________ ______
2,479,980 1.15 ___________ ______
India
35,800 Container Corporation of India 868,988 0.40
162,000 PTC India 313,714 0.15
170,000 Steel Authority of India 566,318 0.26
301,200 United Phosphorus 1,043,173 0.49 ___________ ______
2,792,193 1.30 ___________ ______
Indonesia
2,251,700 Perusahaan Gas Negara 776,256 0.36 ___________ ______
Ireland
76,200 Dragon Oil 476,213 0.22
75,296 Ryanair Holdings ADR 2,038,978 0.95 ___________ ______
2,515,191 1.17 ___________ ______
Israel
76,200 Frutarom Industries 587,042 0.27
60,700 Nice Systems ADR 1,673,499 0.78
81,000 Strauss Group 943,486 0.44 ___________ ______
3,204,027 1.49 ___________ ______
Italy
108,923 Credito Emiliano 668,093 0.31
33,600 DiaSorin 1,046,653 0.49
359,900 Iride 673,176 0.31
120,700 Milano Assicurazioni 390,645 0.18 ___________ ______
2,778,567 1.29 ___________ ______
Japan
21,800 Advantest 543,916 0.25
190,500 Aioi Insurance 942,410 0.44
96,300 Asics 947,621 0.44
43,500 Don Quijote 1,043,233 0.49
346,200 Fukuoka Financial Group 1,556,290 0.72
71,400 Hisaka Works 773,241 0.36
980 Jupiter Telecommunications 853,686 0.40
76,900 Koito Manufacturing 1,021,364 0.48
53,300 Komori 632,825 0.29
20,650 Makita 584,067 0.27
47,500 NGK Insulators 1,108,512 0.52
63 Nippon Building Fund (Reit) 555,573 0.26
327 Osaka Securities Exchange 1,494,596 0.69
74,800 PanaHome 474,614 0.22
6,700 Santen Pharmaceutical 225,531 0.10
46,900 Suruga Bank 459,997 0.21
Transferable Securities Admitted to an Official Stock Exchange
Listing or Dealt in on Another Regulated Market
Holding Description Value (US$) %
Transferable Securities Admitted to an Official Stock Exchange
Listing or Dealt in on Another Regulated Market
Holding Description Value (US$) %

152 BlackRock Global Funds (BGF)
Global SmallCap Fund continued
Portfolio of Investments 31 August 2009
222,500 Tokyu Land 1,043,287 0.49
30,500 Toyo Suisan Kaisha 777,383 0.36
111,000 Charter International 1,109,013 0.52 ___________ ______
16,147,159 7.51 ___________ ______
Luxembourg
4,300 Millicom International Cellular – SDR 299,122 0.14 ___________ ______
Malaysia
2,032,710 AirAsia 790,800 0.37 ___________ ______
Mexico
447,600 Embotelladoras Arca SAB de CV 1,083,298 0.51 ___________ ______
Netherlands
4,300 Core Laboratories 399,298 0.18
18,800 Fugro – CVA 1,008,058 0.47 ___________ ______
1,407,356 0.65 ___________ ______
Norway
58,000 Tandberg 1,191,437 0.55
57,700 TGS Nopec Geophysical 723,696 0.34 ___________ ______
1,915,133 0.89 ___________ ______
Philippines
1,170,226 Bank of the Philippine Islands 1,079,212 0.51 ___________ ______
Singapore
15,500 Avago Technologies 279,465 0.13
654,700 CapitaMall Trust (Reit) 739,228 0.34
1,800,000 Cityspring Infrastructure Trust
(Rights 16/9/2009) 162,093 0.08
1,800,000 Cityspring Infrastructure Trust (Unit) 760,590 0.35
380,900 Olam International 649,074 0.30
213,900 UOL Group 508,222 0.24 ___________ ______
3,098,672 1.44 ___________ ______
South Africa
6,600 Massmart Holdings 65,946 0.03 ___________ ______
South Korea
3,000 LG Household & Health Care 520,058 0.24 ___________ ______
Spain
9,800 Bolsas y Mercados Espanoles 343,783 0.16
172,400 Laboratorios Farmaceuticos Rovi 1,941,201 0.90 ___________ ______
2,284,984 1.06 ___________ ______
Sweden
19,250 Autoliv 624,663 0.29
24,500 Axfood 647,703 0.30
65,200 Swedish Match 1,259,614 0.59 ___________ ______
2,531,980 1.18 ___________ ______
Switzerland
6,000 Addex Pharmaceuticals 163,841 0.08
2,554 Rieter Holding 462,940 0.21 ___________ ______
626,781 0.29 ___________ ______
Thailand
1,258,700 Mermaid Maritime 797,795 0.37 ___________ ______
United Kingdom
330,091 Amlin 1,978,248 0.92
40,800 Antofagasta 507,642 0.24
295,900 Britvic 1,664,788 0.77
103,900 BTG 323,144 0.15
13,400 Cairn Energy 545,311 0.25
294,000 Central African Mining & Exploration 84,709 0.04
55,900 Dana Petroleum 1,277,615 0.59
176,750 easyJet 917,536 0.43
376,100 G4S 1,363,867 0.63
165,900 Game Group 441,647 0.21
196,950 Halfords Group 1,078,984 0.50
191,800 Hikma Pharmaceuticals 1,441,501 0.67
59,200 Intertek Group 1,161,805 0.54
684,000 Kesa Electricals 1,561,086 0.73
185,901 Prostrakan Group 463,207 0.22
520,300 QinetiQ 1,178,185 0.55
331,487 Rexam 1,439,381 0.67
76,000 Rightmove 660,013 0.31 ___________ ______
18,088,669 8.42 ___________ ______
United States
87,298 Advanced Energy Industries 900,915 0.42
28,000 Alexion Pharmaceuticals 1,252,160 0.58
24,600 AMB Property (Reit) 567,030 0.26
6,400 American Superconductor 205,504 0.10
36,100 Bancorpsouth 829,217 0.39
29,900 Bank of Hawaii 1,180,452 0.55
29,900 BioMarin Pharmaceutical 482,885 0.22
45,350 BJ's Restaurants 785,009 0.37
47,100 Blackboard 1,627,776 0.76
26,400 BMC Software 925,056 0.43
18,425 BorgWarner 549,249 0.26
155,450 Brook Automation 1,022,861 0.48
25,250 Burger King Holdings 454,500 0.21
145,000 Cadence Design Systems 899,725 0.42
62,600 CardioNet 440,078 0.20
46,900 Celanese 'A' 1,188,915 0.55
92,300 Ciena 1,207,284 0.56
46,000 Citrix Systems 1,630,240 0.76
95,900 Commercial Vehicle Group 429,057 0.20
46,050 comScore 660,357 0.31
42,800 Conceptus 777,676 0.36
23,100 Corporate Office Properties Trust
SBI MD (Reit) 861,399 0.40
67,050 Covanta Holding 1,191,479 0.55
47,400 Cullen/Frost Bankers 2,317,860 1.08
76,800 Delta Air Lines 553,728 0.26
12,500 Digital Realty Trust (Reit) 550,000 0.26
29,700 Digital River 1,033,560 0.48
20,300 Dresser-Rand Group 608,797 0.28
48,600 Drew Industries 967,140 0.45
179,150 DSP Group 1,479,779 0.69
66,600 Electronics for Imaging 707,958 0.33
101,900 EnergySolutions 900,796 0.42
99,900 Fidelity National Financial 'A' 1,498,500 0.70
8,700 First Financial Bankshares 431,955 0.20
22,200 Foster Wheeler 642,608 0.30
23,750 FTI Consulting 1,032,888 0.48
50,000 Guess ? 1,735,000 0.81
13,700 Home Properties (Reit) 518,408 0.24
55,550 IDEX 1,467,631 0.68
6,850 IHS 'A' 332,294 0.15
34,300 Informatica 612,598 0.28
162,050 Integrated Device Technology 1,106,802 0.52
147,100 Intersil 'A' 2,165,312 1.01
51,700 IPC The Hospitalist 1,470,865 0.68
25,500 ITC Holdings 1,183,965 0.55
73,250 j2 Global Communications 1,582,200 0.74
140,700 JDS Uniphase 963,795 0.45
Transferable Securities Admitted to an Official Stock Exchange
Listing or Dealt in on Another Regulated Market
Holding Description Value (US$) %
Transferable Securities Admitted to an Official Stock Exchange
Listing or Dealt in on Another Regulated Market
Holding Description Value (US$) %

Audited Annual Report and Accounts 153
The notes on pages 236 to 244 form an integral part of these financial statements.
Global SmallCap Fund continued
Portfolio of Investments 31 August 2009
23,800 Kinetic Concepts 750,176 0.35
32,200 K-Swiss 310,086 0.14
26,350 Landstar System 906,440 0.42
40,250 Linear Technology 1,079,505 0.50
84,600 LKQ 1,500,804 0.70
19,200 Macerich (Reit) 554,880 0.26
21,150 Marvel Entertainment 1,035,716 0.48
87,300 Maxim Integrated Products 1,626,574 0.76
127,400 Mentor Graphics 1,104,558 0.51
147,200 Merit Medical Systems 2,667,558 1.24
34,600 Monolithic Power Systems 778,500 0.36
100,000 MoSys 238,000 0.11
9,800 National Instruments 253,698 0.12
80,700 Nektar Therapeutics 656,091 0.31
18,800 Nordson 1,010,500 0.47
27,600 Northeast Utilities 660,468 0.31
217,400 ON Semiconductor 1,754,418 0.82
68,500 Packaging of America 1,383,015 0.64
73,200 People's United Financial 1,180,716 0.55
95,700 PetroHawk Energy 2,050,851 0.95
7,100 Phase Forward 90,454 0.04
52,400 Phillips-Van Heusen 1,974,956 0.92
186,400 PMC – Sierra 1,657,096 0.77
67,050 Polycom 1,559,583 0.73
3,500 priceline.com 540,050 0.25
43,700 Pride International 1,120,031 0.52
10,400 ProAssurance 554,736 0.26
14,400 Regency Centers (Reit) 475,632 0.22
56,250 Regis 905,063 0.42
2,913 Seahawk Drilling 67,028 0.03
30,100 Sepracor 545,412 0.25
25,600 Silgan Holdings 1,254,528 0.58
39,700 St Mary Land & Exploration 1,036,964 0.48
52,300 Steel Dynamics 871,841 0.41
406,150 SupportSoft 954,453 0.44
47,075 Sybase 1,634,444 0.76
50,500 Tanger Factory Outlet Centers (Reit) 1,904,860 0.89
48,100 TECO Energy 644,540 0.30
19,500 Terex 318,435 0.15
56,650 Timken 1,212,310 0.56
74,850 Urban Outfitters 2,110,770 0.98
30,700 Ventas (Reit) 1,201,598 0.56
126,400 Vishay Intertechnology 1,011,200 0.47
27,200 Volcano 385,424 0.18
12,300 Warnaco Group 469,736 0.22
9,850 Watsco 516,041 0.24
60,700 Winnebago Industries 699,870 0.33
198,200 Zoran 2,223,803 1.03 ___________ ______
95,376,675 44.37 ___________ ______
Total Portfolio 206,375,743 96.01
Other Net Assets 8,576,797 3.99 ___________ ______
Total Net Assets (US$) 214,952,540 100.00 ___________ ______
Transferable Securities Admitted to an Official Stock Exchange
Listing or Dealt in on Another Regulated Market
Holding Description Value (US$) %
Transferable Securities Admitted to an Official Stock Exchange
Listing or Dealt in on Another Regulated Market
Holding Description Value (US$) %
Sector Breakdown as at 31 August 2009
Finance 18.23
Information technology 18.23
Industrials 15.07
Consumer discretionary 13.36
Healthcare 10.52
Materials 7.85
Energy 5.40
Consumer staples 5.16
Utilities 2.05
Telecommunication services 0.14
Other net assets 3.99 __________
100.00 __________
% of net
assets

154 BlackRock Global Funds (BGF)
India Fund
Portfolio of Investments 31 August 2009
COMMON STOCKS (SHARES)
India
100,000 3M India 3,212,083 0.50
1,646,660 Adani Power 3,480,497 0.54
423,796 Aditya Birla Nuvo 8,717,653 1.36
526,723 Allied Digital Services 5,399,921 0.84
160,515 Axis Bank 2,976,225 0.47
109,831 Bajaj Auto 2,734,696 0.43
147,216 BEML 3,350,916 0.52
305,896 Bharat Electronics 8,931,284 1.39
303,541 Bharat Heavy Electricals 14,357,968 2.24
555,309 Bharat Petroleum 5,774,302 0.90
3,745,958 Bharti Airtel 32,576,208 5.08
318,070 BL Kashyap & Sons 2,494,398 0.39
515,616 Brandhouse Retails 378,594 0.06
1,529,137 Cairn India 8,296,330 1.29
514,500 Century Textile & Industries 4,862,590 0.76
1,222,618 Cipla 6,782,304 1.06
543,592 Colgate Palmolive India 6,756,349 1.05
1,410,902 Crompton Greaves 9,369,890 1.46
861,705 DCM Shriram Consolidated 1,120,702 0.17
3,128,515 Deccan Chronicle Holdings 7,644,276 1.19
1,104,157 Dishman Pharmaceuticals & Chemicals 4,868,919 0.76
808,477 Dr Reddys Laboratories 13,129,365 2.05
17,717 Educomp Solutions 1,496,301 0.23
481,500 Emami 3,951,603 0.62
1,391,873 GAIL India 9,561,374 1.49
144,644 GlaxoSmithKline Pharmaceuticals 4,245,260 0.66
416,332 Glenmark Pharmaceuticals 1,850,364 0.29
108,611 Grasim Industries 5,966,986 0.93
559,186 HDFC Bank 16,847,156 2.63
273,295 Hero Honda Motors 8,456,050 1.32
1,756,775 Hindustan Construction 3,965,111 0.62
929,952 Hindustan Petroleum 6,746,317 1.05
2,963,345 Hindustan Unilever 15,777,191 2.46
397,818 Housing Development Finance 20,160,589 3.15
461,414 HT Media 1,127,901 0.18
667,472 ICICI Bank 10,268,745 1.60
1,152,748 Indian Oil 13,646,455 2.13
321,517 Indoco Remedies 1,356,857 0.21
786,726 Infosys Technologies 34,339,595 5.36
4,759,484 ITC 22,513,109 3.51
616,788 Jindal Saw 6,918,256 1.08
35,499 Jindal Steel & Power 2,277,352 0.36
194,837 Larsen & Toubro 6,254,935 0.98
285,000 Lupin 5,925,605 0.93
236,920 Maharashtra Seamless 1,445,297 0.23
345,315 Mahindra & Mahindra 6,108,167 0.95
220,868 Mahindra Holidays & Resorts India 1,558,403 0.24
588,375 Mphasis 6,709,823 1.05
456,081 Nava Bharat Ventures 3,740,190 0.58
195,719 Nestle India 8,818,878 1.38
2,163,154 NIIT Technologies 5,608,914 0.88
874,069 Nitco Tiles 1,162,740 0.18
998,239 NTPC 4,341,546 0.68
816,424 Oil & Natural Gas 19,823,255 3.09
1,722,610 Piramal Healthcare 11,676,347 1.82
151,742 Power Finance 749,619 0.12
580,684 PTC India 1,124,499 0.18
169,268 Punjab National Bank 2,365,938 0.37
679,856 Ranbaxy Laboratories 4,565,094 0.71
632,105 Reliance Communications 3,371,226 0.53
1,221,786 Reliance Industries 50,175,167 7.83
708,385 Rural Electrification 3,222,371 0.50
5,186,572 S Kumars Nationwide 5,088,310 0.79
621,444 Sesa GOA 2,702,151 0.42
568,522 Sintex Industries (Demat) 2,799,235 0.44
676,809 State Bank of India 24,159,962 3.77
1,234,568 Sterlite Industries India ADR 16,654,322 2.60
2,892,850 TAKE Solutions 2,438,111 0.38
861,634 Tanla Solutions 1,104,727 0.17
1,178,071 Tata Consultancy Services 12,716,890 1.98
231,386 Tata Steel 2,010,558 0.31
546,914 Television Eighteen India 1,275,852 0.20
383,198 Thermax 3,702,873 0.58
666,898 Union Bank of India 2,920,282 0.46
974,461 Unitech 2,142,516 0.33
797,632 United Breweries 2,600,778 0.41
2,137,942 United Phosphorus 7,404,524 1.16
428,923 United Spirits 8,409,349 1.31
3,601,533 Voltas 11,639,975 1.82
194,102 Wipro 2,186,306 0.34
625,058 Zee Entertainment Enterprises 2,696,102 0.42 ___________ ______
Total Portfolio 612,088,879 95.51
Other Net Assets 28,771,627 4.49 ___________ ______
Total Net Assets (US$) 640,860,506 100.00 ___________ ______
Transferable Securities Admitted to an Official Stock Exchange
Listing or Dealt in on Another Regulated Market
Holding Description Value (US$) %
Transferable Securities Admitted to an Official Stock Exchange
Listing or Dealt in on Another Regulated Market
Holding Description Value (US$) %
Sector Breakdown as at 31 August 2009
Energy 16.29
Finance 13.40
Industrials 13.06
Information technology 11.00
Consumer staples 10.74
Healthcare 8.49
Materials 8.02
Consumer discretionary 6.01
Telecommunication services 5.61
Utilities 2.89
Other net assets 4.49 __________
100.00 __________
% of net
assets

Audited Annual Report and Accounts 155
The notes on pages 236 to 244 form an integral part of these financial statements.
Japan Fund
Portfolio of Investments 31 August 2009
COMMON STOCKS (SHARES)
Japan
32,000 Air Water 34,240,000 0.85
41,000 All Nippon Airways 11,767,000 0.29
38,700 Asahi Breweries 62,616,600 1.55
86,000 Asahi Diamond Industrial 60,028,000 1.49
70,000 Bank of Yokohama 36,750,000 0.91
8,400 Benesse 38,388,000 0.95
34,000 Chiba Bank 19,924,000 0.49
24,300 Culture Convenience Club 16,718,400 0.42
21,700 Daiichi Sankyo 43,074,500 1.07
47,100 DCM Japan Holdings 29,531,700 0.73
8,800 Denso 23,804,000 0.59
19,100 Doutor Nichires Holdings 26,797,300 0.66
11,300 East Japan Railway 68,704,000 1.70
95,400 EDION 75,938,400 1.88
6,700 Eisai 22,847,000 0.57
21,000 FCC 30,261,000 0.75
23,900 FUJIFILM Holdings 66,322,500 1.64
15,600 Fujimori Kogyo 22,245,600 0.55
116,000 Gunze 49,068,000 1.22
62,600 Hakuto 58,656,200 1.45
14,800 Hitachi High-Technologies 27,720,400 0.69
22,700 Hitachi Maxell 39,339,100 0.98
63,100 Honda Motor 185,198,500 4.59
10,300 IT Holdings 13,554,800 0.34
5,900 Japan Petroleum Exploration 28,674,000 0.71
292 Japan Tobacco 78,810,800 1.95
25,000 Kansai Electric Power 53,500,000 1.33
144 KDDI 76,176,000 1.89
54,000 Kubota 41,526,000 1.03
18,500 Kuraray 18,777,500 0.47
27,000 KUREHA 15,255,000 0.38
13,900 Kurita Water Industries 43,090,000 1.07
20,000 Kyorin 31,620,000 0.78
15,900 Lintec 31,020,900 0.77
8,700 Matsumotokiyoshi Holdings 20,314,500 0.50
4,100 MEIJI Holdings 15,580,000 0.39
222 Message 38,095,200 0.94
36,400 Mitsubishi 68,614,000 1.70
152,000 Mitsubishi Materials 43,168,000 1.07
30,000 Mitsubishi Tanabe Pharma 36,630,000 0.91
236,800 Mitsubishi UFJ Financial Group 140,659,200 3.49
58,900 Mitsui & Co 71,386,800 1.77
59,000 Mitsui Fudosan 103,722,000 2.57
120,000 Mitsui OSK Lines 71,400,000 1.77
299,100 Mizuho Financial Group 68,194,800 1.69
176,000 NEC 59,136,000 1.47
21,000 NGK Insulators 45,570,000 1.13
16,700 Nifco 27,688,600 0.69
19,000 Nikon 30,419,000 0.75
40,000 Nippon Express 16,640,000 0.41
52,500 Nippon Mining Holdings 24,360,000 0.60
93,000 Nippon Sheet Glass 30,318,000 0.75
135,000 Nippon Steel 49,275,000 1.22
12,900 Nippon Telegraph & Telephone 53,664,000 1.33
17,700 Nipro 35,134,500 0.87
95,800 Nomura Holdings 78,843,400 1.95
15,900 NPC 40,704,000 1.01
6,250 ORIX 44,687,500 1.11
34,000 Rengo 19,720,000 0.49
7,800 Rohm 48,906,000 1.21
77,000 Sakai Chemical Industry 35,035,000 0.87
5,000 Sanyo Denki 2,080,000 0.05
35,400 Seiko Epson 48,745,800 1.21
44,000 Sekisui House 39,336,000 0.98
84,000 Sharp 90,300,000 2.24
35,000 Shizuoka Bank 33,985,000 0.84
22,500 Softbank 46,912,500 1.16
239,600 Sojitz 47,680,400 1.18
31,300 Sony 78,719,500 1.95
18,400 Square Enix 44,068,000 1.09
48,600 Studio Alice 46,218,600 1.15
48,200 Sumitomo Electric Industries 57,936,400 1.44
25,300 Sumitomo Mitsui Financial Group 101,453,000 2.51
192,000 Taisei 39,168,000 0.97
9,300 TDK 50,313,000 1.25
26,100 Tohoku Electric Power 52,591,500 1.30
24,400 Tokio Marine Holdings 67,588,000 1.68
33,500 Tokyo Electric Power 81,237,500 2.01
41,300 Tokyo Steel Manufacturing 50,592,500 1.25
201,000 Toshiba 96,078,000 2.38
139,000 Tosoh 37,530,000 0.93
36,000 Toyota Motor 143,640,000 3.56
23,400 Ushio 40,131,000 1.00
1,419 Yahoo! Japan 44,911,350 1.11
19,100 Yamaha 22,824,500 0.57
67,000 Yokohama Rubber 32,495,000 0.81 _____________ ______
Total Portfolio 4,196,346,250 104.02
Other Net Liabilities (162,026,015) (4.02)_____________ ______
Total Net Assets (¥) 4,034,320,235 100.00 _____________ ______
Transferable Securities Admitted to an Official Stock Exchange
Listing or Dealt in on Another Regulated Market
Holding Description Value (¥) %
Transferable Securities Admitted to an Official Stock Exchange
Listing or Dealt in on Another Regulated Market
Holding Description Value (¥) %

156 BlackRock Global Funds (BGF)
Japan Fund continued
Open Forward Foreign Exchange Transactions as at 31 August 2009
EUR Hedged Share Class €
€544,932 ¥74,659,798 15/9/2009 (17,031) (2,262,873)
¥4,520,745 €33,701 15/9/2009 327 43,448 __________ __________
Net unrealised loss (16,704) (2,219,425)__________ __________
Note: The net unrealised loss attributed to these transactions is included in the Statement
of Net Assets (see Note 2c).
Unrealised
profit/(loss)
¥ Equivalent
Unrealised
profit/(loss)Value dateSalesPurchases
Sector Breakdown as at 31 August 2009
Consumer discretionary 23.80
Industrials 18.76
Finance 17.24
Information technology 14.82
Materials 9.54
Healthcare 5.14
Utilities 4.64
Consumer staples 4.39
Telecommunication services 4.38
Energy 1.31
Other net liabilities (4.02)__________
100.00 __________
% of net
assets

Audited Annual Report and Accounts 157
The notes on pages 236 to 244 form an integral part of these financial statements.
Japan Small & MidCap Opportunities Fund(1)
Portfolio of Investments 31 August 2009
COMMON STOCKS (SHARES)
Japan
453,000 77 Bank 254,586,000 1.37
222,000 Aioi Insurance 102,120,000 0.55
198,000 Air Water 211,860,000 1.14
71,500 Aisin Seiki 166,595,000 0.90
151,000 All Nippon Airways 43,337,000 0.23
86,500 AOI Electronic 138,400,000 0.75
103,700 Asahi Breweries 167,786,600 0.90
142,000 Asahi Diamond Industrial 99,116,000 0.53
444,000 Awa Bank 247,308,000 1.33
321,000 Bank of Kyoto 290,184,000 1.56
43,400 Benesse 198,338,000 1.07
493,000 Chiba Bank 288,898,000 1.56
126,800 Culture Convenience Club 87,238,400 0.47
2,548 CyberAgent 224,988,400 1.21
131,500 Dai-ichi Seiko 550,985,000 2.97
263,900 DCM Japan Holdings 165,465,300 0.89
290,000 EDION 230,840,000 1.24
190,200 Enplas 341,028,600 1.84
170,600 FCC 245,834,600 1.33
443,600 Ferrotec 505,704,000 2.73
8,600 Furuya Metal 87,720,000 0.47
208,300 GMO internet 84,778,100 0.46
19,300 Gree 159,611,000 0.86
3,609 Green Hospital Supply* 229,893,300 1.24
215,000 GS Yuasa 174,365,000 0.94
309,000 Gunze 130,707,000 0.70
70,700 Hisamitsu Pharmaceutical 253,813,000 1.37
16,400 Hogy Medical 85,608,000 0.46
70,300 IT Holdings 92,514,800 0.50
106,000 Ito En 180,942,000 0.98
943,000 Itoham Foods 307,418,000 1.66
53,000 Japan Petroleum Exploration 257,580,000 1.39
699,000 Japan Servo 353,694,000 1.91
58,000 JGC 100,166,000 0.54
62,800 Jowa Holdings 93,258,000 0.50
288,000 Kagoshima Bank 216,864,000 1.17
987,000 Kajima 257,607,000 1.39
302,000 Kanto Denka Kogyo 184,824,000 1.00
196,000 Kawasaki Kisen Kaisha 80,164,000 0.43
429,000 Kintetsu 172,887,000 0.93
223,000 Kubota 171,487,000 0.92
166,500 Kuraray 168,997,500 0.91
81,500 Kuroda Electric 106,439,000 0.57
273,100 Lintec 532,818,100 2.87
13,700 Mani 86,310,000 0.47
411,000 Marubeni 190,293,000 1.03
251,000 Marui Group 162,146,000 0.87
111,300 Megachips 233,173,500 1.26
688,000 Mitsubishi Materials 195,392,000 1.05
169,800 Mitsui High-Tec 203,760,000 1.10
86,000 NGK Insulators 186,620,000 1.01
153,900 Nichii Gakkan 165,596,400 0.89
111,000 Nikon 177,711,000 0.96
176,000 Nippon Electric Glass 170,016,000 0.92
485,000 Nippon Express 201,760,000 1.09
520,000 Nippon Sheet Glass 169,520,000 0.91
54,100 Nipro 107,388,500 0.58
164,000 Nisshinbo Holdings 178,268,000 0.96
58,200 Nitto Denko 164,124,000 0.89
144,800 Nomura Real Estate Holdings 236,024,000 1.27
127 Nomura Real Estate Office Fund (Reit) 81,915,000 0.44
258 Nomura Real Estate Residential Fund
(Reit) 110,166,000 0.59
117,000 NPC 299,520,000 1.61
152,000 Odakyu Electric Railway 127,072,000 0.69
45,750 ORIX 327,112,500 1.76
282,000 Pacific Metals 220,242,000 1.19
50,000 Pigeon 192,500,000 1.04
34,350 Point 195,451,500 1.05
2,877 Rakuten 161,687,400 0.87
389,000 Rengo 225,620,000 1.22
247,400 Saizeriya 381,243,400 2.06
11,400 Sankyo 66,804,000 0.36
77,300 Santen Pharmaceutical 241,949,000 1.30
493 Seven Bank 116,397,300 0.63
138,800 Showa Shell Sekiyu 134,774,800 0.73
8,300 Sogo Medical 18,426,000 0.10
408,100 Sojitz 81,211,900 0.44
82,100 Square Enix 196,629,500 1.06
799 Start Today 115,375,600 0.62
33,600 Stella Chemifa 147,168,000 0.79
262,400 Sumitomo Electric Industries 315,404,800 1.70
303,000 Suruga Bank 276,336,000 1.49
51,600 Sysmex 217,236,000 1.17
120,300 Tac 49,924,500 0.27
79,800 Takata 141,166,200 0.76
55,200 Tokai Rika 92,184,000 0.50
517,000 Tokai Tokyo Securities 173,712,000 0.94
186,000 Tokuyama 120,900,000 0.65
81,400 Tokyo Ohka Kogyo 179,080,000 0.97
988,000 Tokyo Rope Manufacturing 311,220,000 1.68
102,300 Tokyo Steel Manufacturing 125,317,500 0.68
100,600 Tomy 79,574,600 0.43
630,000 Tosoh 170,100,000 0.92
104,900 Toyota Auto Body 191,967,000 1.04
69,300 Ulvac 185,724,000 1.00
56,900 Unicharm Petcare 190,046,000 1.02
3,383 Works Applications 206,024,700 1.11
235,000 Yokohama Rubber 113,975,000 0.61 _____________ ______
Total Portfolio 18,454,029,300 99.49
Other Net Assets 95,360,664 0.51 _____________ ______
Total Net Assets (¥) 18,549,389,964 100.00 _____________ ______
Transferable Securities Admitted to an Official Stock Exchange
Listing or Dealt in on Another Regulated Market
Holding Description Value (¥) %
Transferable Securities Admitted to an Official Stock Exchange
Listing or Dealt in on Another Regulated Market
Holding Description Value (¥) %
(1) Fund name changed, see Note 1, for further details.(*) Securities lent, see Note 11, for further details.

158 BlackRock Global Funds (BGF)
Open Forward Foreign Exchange Transactions as at 31 August 2009
EUR Hedged Share Class €
€8,059,001 ¥1,104,829,674 15/9/2009 (257,026) (34,150,505)
¥724,307,313 €5,373,825 15/9/2009 78,019 10,366,221 __________ __________
Net unrealised loss (179,007) (23,784,284)__________ __________
Note: The net unrealised loss attributed to these transactions is included in the Statement
of Net Assets (see Note 2c).
Unrealised
profit/(loss)
¥ Equivalent
Unrealised
profit/(loss)Value dateSalesPurchases
Japan Small & MidCap Opportunities Fund(1) continued
Sector Breakdown as at 31 August 2009
Consumer discretionary 19.17
Information technology 17.03
Industrials 16.87
Materials 15.96
Finance 15.16
Healthcare 7.48
Consumer staples 5.70
Energy 2.12
Other net assets 0.51 __________
100.00 __________
% of net
assets

Audited Annual Report and Accounts 159
The notes on pages 236 to 244 form an integral part of these financial statements.
Japan Value Fund
Portfolio of Investments 31 August 2009
COMMON STOCKS (SHARES)
Japan
540,000 Amada 352,620,000 1.74
303,700 Asahi Breweries 491,386,600 2.43
424,000 Chiyoda 318,848,000 1.57
274,000 COMSYS Holdings 294,550,000 1.45
210,200 Daiichi Sankyo 417,247,000 2.06
96,100 East Japan Railway 584,288,000 2.88
180,500 FUJIFILM Holdings 500,887,500 2.47
809,000 Fujitsu 506,434,000 2.50
876,000 Gunze 370,548,000 1.83
275,500 Honda Motor 808,592,500 3.99
322,300 Isetan Mitsukoshi Holdings 331,002,100 1.63
1,193 Japan Prime Realty Investment (Reit) 265,442,500 1.31
1,853 Japan Tobacco 500,124,700 2.47
165,100 JFE Holdings 536,575,000 2.65
958 KDDI 506,782,000 2.50
188,000 Kinden 156,604,000 0.77
450,500 Konica Minolta Holdings 396,440,000 1.96
691,000 Marubeni 319,933,000 1.58
1,516,000 Mazda Motor 391,128,000 1.93
319,800 Mitsubishi 602,823,000 2.98
600,000 Mitsubishi Gas Chemical 328,200,000 1.62
1,612,700 Mitsubishi UFJ Financial Group 957,943,800 4.73
1,013,000 Mitsui Chemicals 356,576,000 1.76
512,000 Mitsui OSK Lines 304,640,000 1.50
243,900 NEC Electronics 223,168,500 1.10
838,000 Nippon Mining Holdings 388,832,000 1.92
141,800 Nippon Telegraph & Telephone 589,888,000 2.91
34,020 Nippon Television Network 399,735,000 1.97
888,800 Nissan Motor 577,720,000 2.85
692,100 Nomura Holdings 569,598,300 2.81
860,000 OJI Paper 377,540,000 1.86
65,600 Rohm 411,312,000 2.03
421,000 Sekisui House 376,374,000 1.86
244,600 Sony 615,169,000 3.04
694,000 Sumitomo Heavy Industries 326,874,000 1.61
192,700 Sumitomo Mitsui Financial Group 772,727,000 3.81
161,500 Takeda Pharmaceutical 605,625,000 2.99
67,000 TDK 362,470,000 1.79
230,000 Tokio Marine Holdings 637,100,000 3.15
278,800 Tokyo Electric Power 676,090,000 3.34
176,100 Tokyo Ohka Kogyo 387,420,000 1.91
81,100 Toyota Industries 203,561,000 1.01
172,400 Toyota Motor 687,876,000 3.39 _____________ ______
Total Portfolio 19,788,695,500 97.66
Other Net Assets 474,228,653 2.34 _____________ ______
Total Net Assets (¥) 20,262,924,153 100.00 _____________ ______
Transferable Securities Admitted to an Official Stock Exchange
Listing or Dealt in on Another Regulated Market
Holding Description Value (¥) %
Transferable Securities Admitted to an Official Stock Exchange
Listing or Dealt in on Another Regulated Market
Holding Description Value (¥) %
Open Forward Foreign Exchange Transactions as at 31 August 2009
EUR Hedged Share Class €
€1,761,550 ¥241,213,237 15/9/2009 (54,057) (7,182,440)
¥18,532,126 €138,150 15/9/2009 1,340 178,043 __________ __________
Net unrealised loss (52,717) (7,004,397)__________ __________
Note: The net unrealised loss attributed to these transactions is included in the Statement
of Net Assets (see Note 2c).
Unrealised
profit/(loss)
¥ Equivalent
Unrealised
profit/(loss)Value dateSalesPurchases
Sector Breakdown as at 31 August 2009
Consumer discretionary 23.50
Industrials 16.08
Finance 15.81
Information technology 11.85
Materials 9.80
Telecommunication services 5.41
Healthcare 5.05
Consumer staples 4.90
Utilities 3.34
Energy 1.92
Other net assets 2.34 __________
100.00 __________
% of net
assets

160 BlackRock Global Funds (BGF)
Latin American Fund
Portfolio of Investments 31 August 2009
FUNDS
United Kingdom
2,875,000 BlackRock Latin American Investment
Trust 22,914,203 0.47 ___________ ______
Total Funds 22,914,203 0.47 ___________ ______
COMMON / PREFERRED STOCKS (SHARES) & WARRANTS
Brazil
9,955,000 All America Latina Logistica (Unit) 69,803,256 1.43
3,575,000 Amil Participacoes 18,705,648 0.38
210,000 B2W Cia Global do Varejo 5,449,346 0.11
12,000,000 Banco Bradesco ADR 195,960,000 4.01
1,250,000 Banco Industrial e Comercial (Pref) 6,281,475 0.13
27,582,500 Banco Itau Holding Financeira ADR 465,868,425 9.53
5,430,000 BM&F - Bovespa 33,978,610 0.70
2,380,000 BR Malls Participacoes 23,704,932 0.48
9,550,000 Bradespar (Pref) 147,370,309 3.02
2,570,000 BRF - Brasil Foods 57,556,478 1.18
505,000 Cia Brasileira de Distribuicao Grupo Pao
de Acucar ADR 24,886,400 0.51
3,115,000 Cia de Bebidas das Americas ADR† 229,947,500 4.70
2,010,000 Cia de Concessoes Rodoviarias 33,302,123 0.68
985,000 Cia de Saneamento de Minas
Gerais-COPASA 15,644,724 0.32
300,000 Cia Energetica de Minas Gerais (Pref) 4,371,269 0.09
4,525,000 Cia Energetica de Minas Gerais ADR 66,110,250 1.35
3,240,000 Cia Energetica de Sao Paulo 'B' (Pref) 33,991,677 0.70
1,340,000 Cia Paranaense de Energia 'B' ADR 20,421,600 0.42
1,185,000 Cia Siderurgica Nacional ADR 31,177,350 0.64
23,450,000 Cia Vale do Rio Doce ADR 407,326,499 8.33
3,465,000 Companhia Brasileira de Meios de
Pagamento 29,431,486 0.60
2,447,000 CPFL Energia 42,375,229 0.87
1,600,000 Cyrela Brazil Realty 20,270,705 0.41
1,150,000 Deutsche Bank (Call Wts 11/8/2011
– Global Village Telecom Holding) 20,586,985 0.42
2,450,000 Deutsche Bank London (Call Wts
03/11/2009 – Cyrela Brazil Realty) 31,039,841 0.63
1,350,000 Diagnosticos da America 30,406,057 0.62
1,350,000 Duratex (Pref) 20,222,897 0.41
1,400,000 EDP – Energias do Brasil 20,681,856 0.42
1,345,000 Eletropaulo Metropolitana Eletricidade de
Sao Paulo 'B' (Pref) 25,306,456 0.52
1,015,000 Equatorial Energia 8,788,487 0.18
1,500,000 Global Village Telecom Holding 26,852,310 0.55
2,750,000 Hypermarcas 43,970,325 0.90
17,850,000 Investimentos Itau (Pref) 92,164,776 1.89
2,510,000 Lojas Renner 39,159,592 0.80
867,388 Lupatech 19,197,445 0.39
3,760,000 Marcopolo (Pref) 11,085,143 0.23
2,125,000 Metalfrio Solutions 6,659,957 0.14
1,100,000 MRV Engenharia e Participacoes 19,837,774 0.41
680,000 Odontoprev 11,504,794 0.24
123,000 OGX Petroleo e Gas Participacoes 67,363,441 1.38
2,295,000 PDG Realty Empreendimentos e
Participacoes 33,098,858 0.68
14,100,000 Petroleo Brasileiro ADR 477,426,000 9.77
2,795,000 Porto Seguro 25,878,535 0.53
2,920,000 Redecard 39,258,661 0.80
1,020,000 Rodobens Negocios Imobiliarios 9,752,886 0.20
2,155,000 Suzano Papel e Celulose (Pref) 20,250,493 0.41
3,640,000 Tam ADR 47,320,000 0.97
1,940,000 Tele Norte Leste Participacoes ADR 31,001,200 0.63
1,100,000 Terna Participacoes (Unit) 22,525,661 0.46
725,000 Totvs 31,194,894 0.64
2,700,000 Tractebel Energia 27,924,808 0.57
725,000 Ultrapar Participacoes (Pref) 26,442,486 0.54
500,000 Usinas Siderurgicas de Minas Gerais 11,898,946 0.24
5,950,000 Usinas Siderurgicas de Minas Gerais 'A'
(Pref) 140,649,263 2.88
1,960,000 Weg 16,450,293 0.34 ___________ ______
3,439,836,411 70.38 ___________ ______
Chile
920,000 Bancontander Chile ADR 47,600,800 0.97
9,000,000 Centros Comerciales Sudamericanos 23,545,331 0.48
930,000 Empresa Nacional de Electricidad
ADR 42,975,300 0.88 ___________ ______
114,121,431 2.33 ___________ ______
Luxembourg
1,092,000 Tenaris ADR 31,766,280 0.65
1,145,000 Ternium ADR 28,636,450 0.59 ___________ ______
60,402,730 1.24 ___________ ______
Mexico
8,700,000 America Movil SAB de CV 'L' ADR 394,719,000 8.08
6,600,000 CemexB de CV ADR 85,602,000 1.75
1,295,000 Desarrolladora Homex SAB de CV ADR 45,519,250 0.93
8,365,000 Empresas ICA SAB de CV 17,548,008 0.36
2,650,000 Fomento Economico Mexicano SAB de
CV ADR 98,076,500 2.01
9,000,000 Grupo Financiero Banorte SAB de CV 'O' 26,470,028 0.54
38,000,000 Grupo Mexico SAB de CV 'B' 57,951,900 1.18
7,205,000 Grupo Televisa ADR 125,799,300 2.57
27,500,000 Wal-Mart de Mexico SAB de CV 'V'* 97,643,788 2.00 ___________ ______
949,329,774 19.42 ___________ ______
Netherlands
750,000 Morgan Stanley
(Call Wts 5/3/2010 – Redecard) 10,128,320 0.21
410,000 Morgan Stanley
(Call Wts 9/3/2010 – Redecard) 5,512,404 0.11
625,000 Morgan Stanley
(Call Wts 8/4/2010 – Redecard) 8,403,054 0.17
4,200,000 Morgan Stanley
(Call Wts 10/6/2010 – Cyrela
Brazil Realty) 53,211,155 1.09
420,000 Morgan Stanley
(Call Wts 14/6/2010 – B2W Companhia
Global do Varejo) 10,898,805 0.22
825,000 Morgan Stanley
(Call Wts 15/6/2010 – Redecard) 11,092,032 0.23 ___________ ______
99,245,770 2.03 ___________ ______
Panama
825,000 Copa Holdings 'A' 34,707,750 0.71 ___________ ______
Transferable Securities Admitted to an Official Stock Exchange
Listing or Dealt in on Another Regulated Market
Holding Description Value (US$) %
Transferable Securities Admitted to an Official Stock Exchange
Listing or Dealt in on Another Regulated Market
Holding Description Value (US$) %

Audited Annual Report and Accounts 161
The notes on pages 236 to 244 form an integral part of these financial statements.
Latin American Fund continued
(2,400) Comphania De Bibidas Pref (ADR)
Call Option
strike price US$65
expiring on 17/10/2009 (1,303,240) (2,304,000)___________ _________
Total Written Call Options (1,303,240) (2,304,000)___________ _________
Note: Written Call Options are included in the Statement of Net Assets (see Note 2c).
Value US$
Unrealised loss US$Issuer
Number ofcontracts
subject to Call
Written Call Options as at 31 August 2009
Portfolio of Investments 31 August 2009
Peru
1,240,000 Cia de Minas Buenaventura ADR 31,297,600 0.64
1,080,000 Credicorp 75,934,800 1.55 ___________ ______
107,232,400 2.19 ___________ ______
United Kingdom
300,000 Morgan Stanley & Co International
(Call Wts 26/8/2010 – BR Malls
Participacoes) 2,988,048 0.07 ___________ ______
United States
377,000 Bunge 25,439,960 0.52 ___________ ______
Total Common / Preferred Stocks (Shares)
& Warrants 4,833,304,274 98.89 ___________ ______
BONDS
Brazil
BRL479 PDG Realty SA Empreendimentos e
Participacoes FRN 1/7/2014 4,063,656 0.08 ___________ ______
Total Bonds 4,063,656 0.08 ___________ ______
Total Portfolio 4,860,282,133 99.44
Other Net Assets 27,268,488 0.56 ___________ ______
Total Net Assets (US$) 4,887,550,621 100.00 ___________ ______
Transferable Securities Admitted to an Official Stock Exchange
Listing or Dealt in on Another Regulated Market
Holding Description Value (US$) %
Transferable Securities Admitted to an Official Stock Exchange
Listing or Dealt in on Another Regulated Market
Holding Description Value (US$) %
(*) Securities lent, see Note 11, for further details.(†) Securities pledged, see Note 12, for further details.
Sector Breakdown as at 31 August 2009
Finance 22.89
Materials 19.68
Energy 12.34
Consumer staples 12.30
Telecommunication services 9.68
Utilities 6.78
Consumer discretionary 6.74
Industrials 5.48
Information technology 2.04
Healthcare 0.86
Investment funds 0.47
Technology 0.18
Other net assets 0.56 __________
100.00 __________
% of net
assets

162 BlackRock Global Funds (BGF)
Local Emerging Markets Short Duration Bond Fund
Portfolio of Investments 31 August 2009
BONDS
Argentina
US$3,450,000 Argentina Government International
Bond 1.33% 31/12/2038
(Step-up coupon) 966,000 0.09
US$5,501,437 Argentina Government International
Bond 8.28% 31/12/2033 3,262,352 0.28 ___________ ______
4,228,352 0.37 ___________ ______
Brazil
BRL215,000,000 Brazil Letras do Tesouro Nacional
0% 1/1/2010 (Zero Coupon) 111,082,174 9.63
BRL115,000,000 Brazil Letras do Tesouro Nacional
0% 1/7/2010 (Zero Coupon) 56,879,354 4.93
BRL65,000,000 Brazil Notas do Tesouro Nacional
Serie F 10% 1/7/2010 35,342,954 3.06
US$400,000 Brazilian Government International
Bond 14.5% 15/10/2009 408,800 0.04 ___________ ______
203,713,282 17.66 ___________ ______
Czech Republic
CZK250,000,000 Czech Republic Government
Bond 2.55% 18/10/2010 14,178,483 1.23 ___________ ______
Germany
ZAR150,000,000 Kreditanstalt fuer Wiederaufbau
8.5% 16/7/2010 19,365,146 1.68 ___________ ______
Hungary
HUF4,400,000,000 Hungary Government Bond 6.75%
12/4/2010 22,916,278 1.99
HUF2,000,000,000 Hungary Government Bond 6.75%
12/10/2010 10,370,698 0.90
HUF9,750,000,000 Hungary Government Bond 8.25%
12/10/2009 51,165,441 4.43 ___________ ______
84,452,417 7.32 ___________ ______
Mexico
MXN1,270,000,000 Mexican Bonos 8% 23/12/2010 99,549,732 8.63
MXN120,000,000 Mexican Bonos 8% 19/12/2013 9,279,730 0.80
MXN962,304,000 Mexican Bonos 9% 24/12/2009 73,374,470 6.36
MXN9,846,400 Mexican Bonos 9.5% 18/12/2014 806,689 0.07
MXN145,000,000 Mexican Bonos 'M' 7.5%
21/6/2012 11,169,413 0.97 ___________ ______
194,180,034 16.83 ___________ ______
Poland
PLN87,000,000 Poland Government Bond '0412'
4.75% 25/4/2012 30,010,650 2.60
PLN188,000,000 Poland Government Bond '0511'
4.25% 24/5/2011 65,011,284 5.64
PLN160,000,000 Poland Government Bond 5.75%
24/3/2010 56,319,507 4.88
PLN90,000,000 Poland Government Bond 6%
24/11/2010 31,956,017 2.77 ___________ ______
183,297,458 15.89 ___________ ______
South Africa
ZAR128,020,000 South Africa Government Bond
8.25% 15/9/2017 15,993,591 1.39
ZAR41,000,000 South Africa Government Bond
'R154' 13% 31/8/2010 5,533,445 0.48
ZAR41,000,000 South Africa Government Bond
'R155' 13% 31/8/2011 5,780,760 0.50 ___________ ______
27,307,796 2.37 ___________ ______
Turkey
TRY30,000,000 Turkey Government Bond 0%
14/4/2010 18,937,928 1.64
TRY80,000,000 Turkey Government Bond 0%
23/6/2010 49,648,736 4.30
TRY80,000,000 Turkey Government Bond 0%
3/11/2010 47,962,826 4.16
TRY11,000,000 Turkey Government Bond 0%
2/2/2011 (Zero coupon) 6,417,470 0.56
TRY38,835,000 Turkey Government Bond 14%
19/1/2011 27,370,579 2.37 ___________ ______
150,337,539 13.03 ___________ ______
United States
US$75,000,000 US Treasury Bill 0% 17/9/2009 74,997,449 6.50
US$75,000,000 US Treasury Bill 0% 15/10/2009 74,991,862 6.50 ___________ ______
149,989,311 13.00 ___________ ______
Total Portfolio 1,031,049,818 89.38
Other Net Assets 122,537,492 10.62 ___________ ______
Total Net Assets (US$) 1,153,587,310 100.00 ___________ ______
Transferable Securities Admitted to an Official Stock Exchange
Listing or Dealt in on Another Regulated Market
Holding Description Value (US$) %
Transferable Securities Admitted to an Official Stock Exchange
Listing or Dealt in on Another Regulated Market
Holding Description Value (US$) %

Audited Annual Report and Accounts 163
The notes on pages 236 to 244 form an integral part of these financial statements.
Local Emerging Markets Short Duration Bond Fund continued
Unrealised profit/(loss)
US$DescriptionNominal
Value
Unrealised profit/(loss)
US$DescriptionNominal
Value
BRL5,450,000 Interest Rate Swaps (Citibank)
(Fund pays USD Libor 3 Month;
and receives fixed rate 13.78%) (4/1/2010) 151,048
BRL5,450,000 Interest Rate Swaps (Citibank)
(Fund pays USD Libor 3 Month;
and receives fixed rate 13.89%) (4/1/2010) 160,657
MXN1,850,000,000 Interest Rate Swaps (Citibank)
(Fund receives Floating MXN MXIBTIIE 28 Days;
and pays Fixed 8.09675%) (10/5/2010) (2,807,020)
MXN2,000,000,000 Interest Rate Swaps (HSBC)
(Fund receives Fixed 8.93%
and pays Floating MXN MXIBTIIE 28 Days;)
(16/7/2010) 4,720,665
US$15,000,000 Credit Default Swaps (HSBC)
(Fund receives default protection on
Mexico (United Mexican States) 7.5% 8/4/2033;
and pays Fixed 2.7%) (20/5/2014) (655,996)
MXN325,000,000 Interest Rate Swaps (HSBC)
(Fund receives Floating MXN MXIBTIIE 28 Days;
and pays Fixed 7.32%) (27/5/2014) 104,453 __________
1,673,807 __________
Swaps as at 31 August 2009
Note: The total market value of US$1,673,807 of these transactions is included in the Statement of Net Assets (see Note 2c).
86,580,000 OTC EUR/CHF Put Option
strike price €1.55
expiring on 5/11/2009 (267,486) 255,473 ___________ _________
Total Purchased Call Options (267,486) 255,473 ___________ _________
Note: Purchased Call Options are included in the Statement of Net Assets (see Note 2c).
Value US$
Unrealised loss US$Issuer
Number ofcontracts
subject to Call
Purchased Call Options as at 31 August 2009
100,870,000 OTC AUD/USD Put Option
strike price AUD$0.77
expiring on 5/11/2009 (295,133) 563,663
86,580,000 OTC EUR/CHF Put Option
strike price €1.50
expiring on 5/11/2009 51,637 468,758
84,060,000 OTC AUD/USD Put Option
strike price AUD$0.77
expiring on 5/11/2009 (240,297) 469,728 ___________ _________
Total Purchased Put Options (483,793) 1,502,149 ___________ _________
Note: Purchased Put Options are included in the Statement of Net Assets (see Note 2c).
Value US$
Unrealised profit/(loss)
US$Issuer
Number ofcontracts
subject to Put
Purchased Put Options as at 31 August 2009

164 BlackRock Global Funds (BGF)
Local Emerging Markets Short Duration Bond Fund continued
Open Forward Foreign Exchange Transactions as at 31 August 2009
Core Fund US$
MYR83,989,404 US$23,705,886 1/9/2009 144,472 144,472
PHP1,150,024,785 US$23,721,000 1/9/2009 (152,509) (152,509)
BRL487,925,060 US$262,978,000 2/9/2009 (3,790,765) (3,790,765)
HKD866,970,000 US$111,897,207 2/9/2009 (44,892) (44,892)
US$438,903,084 BRL827,994,025 2/9/2009 (929,791) (929,791)
KRW51,094,750,000 US$42,140,000 3/9/2009 (1,228,499) (1,228,499)
US$42,140,000 KRW52,401,090,000 3/9/2009 182,514 182,514
RUB2,155,788,250 US$69,190,000 4/9/2009 (1,536,596) (1,536,596)
US$66,280,000 RUB2,104,969,000 4/9/2009 221,416 221,416
SEK285,781,663 US$40,240,000 16/9/2009 (157,412) (157,412)
US$40,240,000 SEK294,374,915 16/9/2009 (1,047,843) (1,047,843)
US$120,284,777 €85,322,500 16/9/2009 (1,633,666) (1,633,666)
US$145,165,699 ¥13,621,151,826 16/9/2009 (1,336,259) (1,336,259)
€35,930,000 HUF9,753,701,520 16/9/2009 298,865 298,865
€94,505,000 US$134,310,212 16/9/2009 729,227 729,227
€343,849,300 ¥46,332,374,173 16/9/2009 (6,995,907) (6,995,907)
¥60,830,334,130 €453,190,000 16/9/2009 6,689,988 6,689,988
MXN1,047,280,400 US$81,265,036 17/9/2009 (2,698,909) (2,698,909)
RUB641,465,840 US$20,120,000 17/9/2009 (42,558) (42,558)
US$81,923,878 MXN1,059,817,010 17/9/2009 2,417,264 2,417,264
US$20,120,000 RUB644,202,160 17/9/2009 (43,087) (43,087)
US$186,155,100 BRL350,432,481 2/10/2009 980,448 980,448
ARS59,450,000 US$14,500,000 5/10/2009 763,310 763,310
ILS144,997,400 US$38,165,748 28/10/2009 (17,167) (17,167)
RON120,176,900 US$40,158,023 28/10/2009 (46,213) (46,213)
SGD165,516,000 US$114,739,279 28/10/2009 (145,330) (145,330)
THB 714,795,000 US$20,995,594 28/10/2009 (616) (616)
US$23,951,270 HUF4,658,110,000 28/10/2009 (230,028) (230,028)
US$79,489,677 MXN1,038,787,000 28/10/2009 1,989,401 1,989,401
US$63,514,631 PLN185,604,500 28/10/2009 (951,449) (951,449)
US$9,348,995 TRY14,263,500 28/10/2009 (32,055) (32,055)
US$3,413,790 ¥320,495,500 28/10/2009 (34,278) (34,278)
ZAR21,843,000 US$2,668,215 28/10/2009 103,688 103,688
CZK1,423,337,000 US$78,880,646 29/10/2009 1,040,064 1,040,064
RUB674,748,379 US$21,203,500 3/11/2009 (331,076) (331,076)
CLP12,743,336,750 US$23,393,000 4/11/2009 (312,490) (312,490)
CNY 153,686,250 US$22,500,000 4/11/2009 (657) (657)
COP41,383,575,200 US$20,011,400 4/11/2009 (126,254) (126,254)
INR1,011,866,850 US$20,682,000 4/11/2009 (46,013) (46,013)
MYR83,948,873 US$23,706,000 4/11/2009 68,086 68,086
PEN 50,299,486 US$16,973,000 4/11/2009 (17,394) (17,394)
PHP1,161,261,555 US$23,721,000 4/11/2009 (77,375) (77,375)
TWD705,202,155 US$21,485,000 4/11/2009 17,056 17,056__________ __________
Net unrealised loss (8,361,289) (8,361,289)__________ __________
EUR Hedged Share Class €
US$40,841 €28,850 15/9/2009 (267) (382)
€962,549 US$1,360,713 15/9/2009 10,278 14,687 __________ __________
Net unrealised profit 10,011 14,305 __________ __________
SGD Hedged Share Class SGD
SGD28,404,799 US$19,658,281 15/9/2009 22,460 15,558
US$683,201 SGD989,732 15/9/2009 (3,336) (2,311)__________ __________
Net unrealised profit 19,124 13,247 __________ __________
Total net unrealised loss (8,333,737)__________
Note: The net unrealised loss attributed to these transactions is included in the Statement
of Net Assets (see Note 2c).
Unrealised
profit/(loss)
US$ Equivalent
Unrealised
profit/(loss)Value dateSalesPurchases
Open Futures Contracts as at 31 August 2009
(2,214) 90 Day Euro $ Future March 2010 (549,459,450)__________
Total commitment (549,459,450)__________
Note: The net unrealised loss of US$595,649 attributed to this transaction is included
in the Statement of Net Assets (see Note 2c).
Value
US$
Expiration
dateContracts/Description
Number
of Contracts

Audited Annual Report and Accounts 165
The notes on pages 236 to 244 form an integral part of these financial statements.
New Energy Fund
Portfolio of Investments 31 August 2009
FUNDS
Isle of Man
1,158,000 Trading Emissions 2,142,885 0.06 ___________ ______
United Kingdom
147,327,572 Institutional Cash Series Institutional
Liquidity Fund 147,327,572 3.97 ___________ ______
Total Funds 149,470,457 4.03 ___________ ______
COMMON STOCKS (SHARES) & WARRANTS
Austria
600,000 Verbund - Oesterreichische
Elektrizitaetswirtschafts 'A' 30,273,041 0.82 ___________ ______
Belgium
11,571,429 Hansen Transmissions International 25,357,485 0.68
1,782,610 Umicore 48,218,537 1.30 ___________ ______
73,576,022 1.98 ___________ ______
Canada
56,322,148 Azure Dynamics 9,682,145 0.26
2,700,000 Ballard Power Systems 4,665,905 0.13
5,390,600 Canadian Hydro Developers 24,727,706 0.67
968,000 Dynetek Industries 315,295 0.01
6,625,000 GTO Resources 17,982,327 0.48
301,000 Potash of Saskatchewan 26,728,800 0.72
1,503,810 SunOpta 3,164,000 0.08
2,520,000 Tapango Resources 2,394,025 0.06
5,017,200 Western Geopower 930,581 0.03 ___________ ______
90,590,784 2.44 ___________ ______
China
7,000,000 China High Speed Transmission
Equipment Group 15,099,940 0.41
5,046,400 Dongfang Electric 'H' 24,610,156 0.66
1,000,000 Suntech Power Holdings ADR 14,460,000 0.39
2,100,000 Yingli Green Energy Holding ADR 22,239,000 0.60 ___________ ______
76,409,096 2.06 ___________ ______
Denmark
675,000 Novozymes 57,922,479 1.56
3,516,058 Vestas Wind Systems 250,755,631 6.76 ___________ ______
308,678,110 8.32 ___________ ______
Finland
772,000 Neste Oil OYJ 12,685,927 0.34 ___________ ______
France
662,496 EDF Energies Nouvelles 29,819,537 0.80
150,071 Sechilienne-Sidec 5,976,416 0.16 ___________ ______
35,795,953 0.96 ___________ ______
Germany
850,000 GEA Group 15,097,225 0.41
807,115 Nordex 14,669,983 0.39
98,606 REpower Systems 14,583,131 0.39
271,884 SMA Solar Technology 19,898,957 0.54
735,336 Solarworld* 15,445,794 0.42
720,000 Wacker Chemie 87,192,531 2.35 ___________ ______
166,887,621 4.50 ___________ ______
Greece
1,480,000 Terna Energy 11,546,795 0.31 ___________ ______
Hong Kong
42,070,000 China Agri-Industries Holdings 29,526,524 0.80 ___________ ______
Ireland
4,412,508 Kingspan Group 39,003,403 1.05 ___________ ______
Isle of Man
3,849,120 Climate Exchange 57,451,133 1.55 ___________ ______
Israel
293,689 Cell Kinetics 26,432 0.00 ___________ ______
Jersey
2,938,046 Camco International 1,144,604 0.03 ___________ ______
Norway
2,800,000 Renewable Energy 18,689,749 0.50 ___________ ______
Portugal
16,300,000 Energias de Portugal 69,804,180 1.88 ___________ ______
South Africa
2,110,000 Sasol 80,517,789 2.17 ___________ ______
Spain
928,000 Abengoa 23,828,853 0.64
475,352 Acciona 61,742,796 1.66
7,000,000 EDP Renovaveis 69,416,800 1.87
8,870,890 Gamesa Corporacion Tecnologica* 195,080,066 5.26
10,214,536 Iberdrola 93,558,608 2.52
50,231,667 Iberdrola Renovables 228,609,413 6.16 ___________ ______
672,236,536 18.11 ___________ ______
United Kingdom
16,119,172 Clipper Windpower 29,959,436 0.81
14,685,768 D1 Oils 1,365,956 0.04
2,267,307 Freeplay Energy 82,809 0.00
4,587,000 Johnson Matthey 105,433,204 2.84
8,789,645 SIG 20,031,979 0.54 ___________ ______
156,873,384 4.23 ___________ ______
United States
4,652,540 American Superconductor* 149,393,059 4.03
6,354,000 Archer-Daniels-Midland 179,627,580 4.84
146,844 Cell Kinetics (Call Wts 7/1/2012) 11,748 0.00
2,140,000 Covanta Holding 38,027,800 1.03
736,000 Energy Conversion Devices 8,449,280 0.23
1,782,000 ESCO Technologies 65,755,800 1.77
235,057 First Solar 28,047,001 0.76
5,160,000 FPL Group 289,063,200 7.79
1,605,300 FuelCell Energy 6,019,875 0.16
1,360,000 General Cable 47,926,400 1.29
115,000 Homeland Energy Group 400,315 0.01
1,280,000 ITC Holdings 59,430,400 1.60
2,924,892 Itron 160,020,841 4.31
3,170,000 Johnson Controls 78,837,900 2.12
1,796,000 MEMC Electronic Materials 28,700,080 0.77
1,285,000 Monsanto 105,459,950 2.84
1,531,433 Ormat Technologies 55,376,617 1.49
3,767,884 Plug Power 2,675,574 0.07
2,000,000 Quanta Services 44,360,000 1.20
Transferable Securities Admitted to an Official Stock Exchange
Listing or Dealt in on Another Regulated Market
Holding Description Value (US$) %
Transferable Securities Admitted to an Official Stock Exchange
Listing or Dealt in on Another Regulated Market
Holding Description Value (US$) %

166 BlackRock Global Funds (BGF)
(*) Securities lent, see Note 11, for further details.
New Energy Fund continued
Portfolio of Investments 31 August 2009
15,693,060 Rentech 29,659,883 0.80
1,925,000 Shaw Group 56,056,000 1.51
1,209,000 Sunpower 'A'* 30,527,250 0.82 ___________ ______
1,463,826,553 39.44 ___________ ______
Total Common Stocks (Shares) & Warrants 3,395,543,636 91.49 ___________ ______
Total Transferable Securities Admitted
to an Official Stock Exchange Listing or
Dealt in on Another Regulated Market 3,545,014,093 95.52 ___________ ______
Unquoted Securities
COMMON STOCKS (SHARES) & WARRANTS
Bermuda
2,988,167 Infinity Bio-Energy – 0.00
5,733,334 Infinity Bio-Energy (Wts 22/5/2010) – 0.00 ___________ ______
– 0.00 ___________ ______
United Kingdom
667,000 Pelamis Wave Power 10,827,077 0.29
2,704,000 Vienco 400,411 0.01 ___________ ______
11,227,488 0.30 ___________ ______
United States
5,722,012 Imperium Renewables 343,321 0.01
147,126,100 Imperium Renewables (Wts 31/12/2049) 1,471 0.00
1,853,897 Medis Technologies 556,169 0.02
5,810,659 Polyfuel – 0.00
202,008 SatCon Technology (Wts 14/8/2010) 16,161 0.00 ___________ ______
917,122 0.03 ___________ ______
Total Unquoted Securities 12,144,610 0.33 ___________ ______
Total Portfolio 3,557,158,703 95.85
Other Net Assets 154,095,460 4.15 ___________ ______
Total Net Assets (US$) 3,711,254,163 100.00 ___________ ______
Transferable Securities Admitted to an Official Stock Exchange
Listing or Dealt in on Another Regulated Market
Holding Description Value (US$) %
Unquoted Securities
Holding Description Value (US$) %
Sector Breakdown as at 31 August 2009
Electric utilities 16.72
Heavy electrical equipment 13.87
Independent power producers 12.75
Electrical components & equipment 9.83
Specialty chemicals 8.05
Agricultural products 5.64
Electronic equipment & instrument 4.31
Investment funds 4.03
Fertilizers & agricultural chemical 3.56
Construction & engineering 3.35
Industrial machinery 2.86
Auto parts & equipment 2.52
Integrated oil & gas 2.17
Specialised finance 1.55
Oil & gas refining & marketing 1.18
Environmental & facilities services 1.06
Building products 1.05
Semiconductor equipment 0.77
Trading companies & distributors 0.54
Packaged foods & meats 0.04
Other net assets 4.15 __________
100.00 __________
% of net
assets
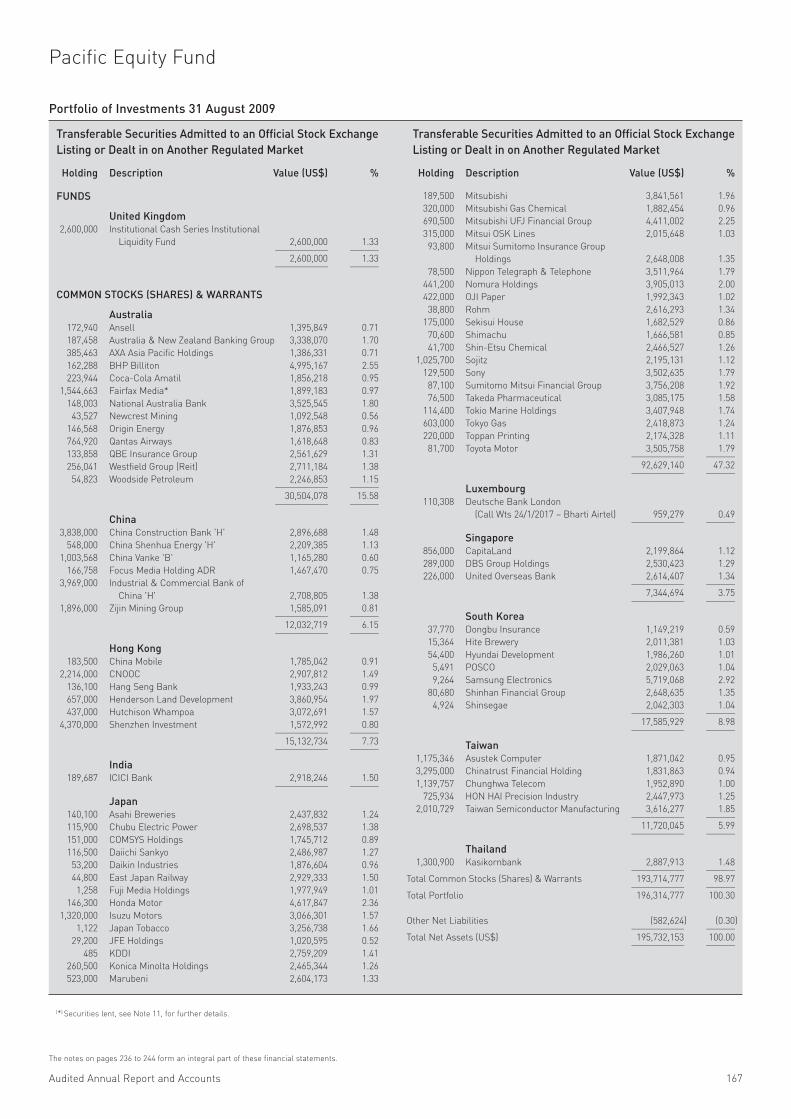
Audited Annual Report and Accounts 167
The notes on pages 236 to 244 form an integral part of these financial statements.
(*) Securities lent, see Note 11, for further details.
Pacific Equity Fund
FUNDS
United Kingdom
2,600,000 Institutional Cash Series Institutional
Liquidity Fund 2,600,000 1.33 ___________ ______
2,600,000 1.33 ___________ ______
COMMON STOCKS (SHARES) & WARRANTS
Australia
172,940 Ansell 1,395,849 0.71
187,458 Australia & New Zealand Banking Group 3,338,070 1.70
385,463 AXA Asia Pacific Holdings 1,386,331 0.71
162,288 BHP Billiton 4,995,167 2.55
223,944 Coca-Cola Amatil 1,856,218 0.95
1,544,663 Fairfax Media* 1,899,183 0.97
148,003 National Australia Bank 3,525,545 1.80
43,527 Newcrest Mining 1,092,548 0.56
146,568 Origin Energy 1,876,853 0.96
764,920 Qantas Airways 1,618,648 0.83
133,858 QBE Insurance Group 2,561,629 1.31
256,041 Westfield Group (Reit) 2,711,184 1.38
54,823 Woodside Petroleum 2,246,853 1.15 ___________ ______
30,504,078 15.58 ___________ ______
China
3,838,000 China Construction Bank 'H' 2,896,688 1.48
548,000 China Shenhua Energy 'H' 2,209,385 1.13
1,003,568 China Vanke 'B' 1,165,280 0.60
166,758 Focus Media Holding ADR 1,467,470 0.75
3,969,000 Industrial & Commercial Bank of
China 'H' 2,708,805 1.38
1,896,000 Zijin Mining Group 1,585,091 0.81 ___________ ______
12,032,719 6.15 ___________ ______
Hong Kong
183,500 China Mobile 1,785,042 0.91
2,214,000 CNOOC 2,907,812 1.49
136,100 Hang Seng Bank 1,933,243 0.99
657,000 Henderson Land Development 3,860,954 1.97
437,000 Hutchison Whampoa 3,072,691 1.57
4,370,000 Shenzhen Investment 1,572,992 0.80 ___________ ______
15,132,734 7.73 ___________ ______
India
189,687 ICICI Bank 2,918,246 1.50 ___________ ______
Japan
140,100 Asahi Breweries 2,437,832 1.24
115,900 Chubu Electric Power 2,698,537 1.38
151,000 COMSYS Holdings 1,745,712 0.89
116,500 Daiichi Sankyo 2,486,987 1.27
53,200 Daikin Industries 1,876,604 0.96
44,800 East Japan Railway 2,929,333 1.50
1,258 Fuji Media Holdings 1,977,949 1.01
146,300 Honda Motor 4,617,847 2.36
1,320,000 Isuzu Motors 3,066,301 1.57
1,122 Japan Tobacco 3,256,738 1.66
29,200 JFE Holdings 1,020,595 0.52
485 KDDI 2,759,209 1.41
260,500 Konica Minolta Holdings 2,465,344 1.26
523,000 Marubeni 2,604,173 1.33
189,500 Mitsubishi 3,841,561 1.96
320,000 Mitsubishi Gas Chemical 1,882,454 0.96
690,500 Mitsubishi UFJ Financial Group 4,411,002 2.25
315,000 Mitsui OSK Lines 2,015,648 1.03
93,800 Mitsui Sumitomo Insurance Group
Holdings 2,648,008 1.35
78,500 Nippon Telegraph & Telephone 3,511,964 1.79
441,200 Nomura Holdings 3,905,013 2.00
422,000 OJI Paper 1,992,343 1.02
38,800 Rohm 2,616,293 1.34
175,000 Sekisui House 1,682,529 0.86
70,600 Shimachu 1,666,581 0.85
41,700 Shin-Etsu Chemical 2,466,527 1.26
1,025,700 Sojitz 2,195,131 1.12
129,500 Sony 3,502,635 1.79
87,100 Sumitomo Mitsui Financial Group 3,756,208 1.92
76,500 Takeda Pharmaceutical 3,085,175 1.58
114,400 Tokio Marine Holdings 3,407,948 1.74
603,000 Tokyo Gas 2,418,873 1.24
220,000 Toppan Printing 2,174,328 1.11
81,700 Toyota Motor 3,505,758 1.79 ___________ ______
92,629,140 47.32 ___________ ______
Luxembourg
110,308 Deutsche Bank London
(Call Wts 24/1/2017 – Bharti Airtel) 959,279 0.49 ___________ ______
Singapore
856,000 CapitaLand 2,199,864 1.12
289,000 DBS Group Holdings 2,530,423 1.29
226,000 United Overseas Bank 2,614,407 1.34 ___________ ______
7,344,694 3.75 ___________ ______
South Korea
37,770 Dongbu Insurance 1,149,219 0.59
15,364 Hite Brewery 2,011,381 1.03
54,400 Hyundai Development 1,986,260 1.01
5,491 POSCO 2,029,063 1.04
9,264 Samsung Electronics 5,719,068 2.92
80,680 Shinhan Financial Group 2,648,635 1.35
4,924 Shinsegae 2,042,303 1.04 ___________ ______
17,585,929 8.98 ___________ ______
Taiwan
1,175,346 Asustek Computer 1,871,042 0.95
3,295,000 Chinatrust Financial Holding 1,831,863 0.94
1,139,757 Chunghwa Telecom 1,952,890 1.00
725,934 HON HAI Precision Industry 2,447,973 1.25
2,010,729 Taiwan Semiconductor Manufacturing 3,616,277 1.85 ___________ ______
11,720,045 5.99 ___________ ______
Thailand
1,300,900 Kasikornbank 2,887,913 1.48 ___________ ______
Total Common Stocks (Shares) & Warrants 193,714,777 98.97 ___________ ______
Total Portfolio 196,314,777 100.30
Other Net Liabilities (582,624) (0.30)___________ ______
Total Net Assets (US$) 195,732,153 100.00 ___________ ______
Transferable Securities Admitted to an Official Stock Exchange
Listing or Dealt in on Another Regulated Market
Holding Description Value (US$) %
Transferable Securities Admitted to an Official Stock Exchange
Listing or Dealt in on Another Regulated Market
Holding Description Value (US$) %
Portfolio of Investments 31 August 2009

168 BlackRock Global Funds (BGF)
Pacific Equity Fund continued
Sector Breakdown as at 31 August 2009
Finance 32.99
Industrials 13.31
Consumer discretionary 11.95
Information technology 9.57
Materials 8.72
Consumer staples 5.92
Telecommunication services 5.60
Energy 4.73
Healthcare 3.56
Utilities 2.62
Investment funds 1.33
Other net liabilities (0.30)__________
100.00 __________
% of net
assets

Audited Annual Report and Accounts 169
The notes on pages 236 to 244 form an integral part of these financial statements.
Strategic Allocation Fund (Euro)
FUNDS
Guernsey
32,492 BH Macro – EUR 508,500 2.67 ___________ ______
Jersey
33,248 ETFS Agriculture DJ-AIGCSM 145,308 0.76
1,054 ETFS Physical Platinum – ETF 90,823 0.48 ___________ ______
236,131 1.24 ___________ ______
United Kingdom
53,522 BlackRock World Mining Trust 269,044 1.41
310,993 Institutional Cash Series Institutional
Liquidity Fund 310,994 1.63 ___________ ______
580,038 3.04 ___________ ______
United States
7,500 Claymore/BNY BRIC ETF 181,554 0.95
2,150 iShares MSCI Brazil Index Fund 87,961 0.46
6,150 iShares MSCI Mexico Investable Market
Index Fund 183,951 0.97
4,376 iShares S&P Global Telecommunications
Sector Index Fund 157,900 0.83
11,535 Technology Select Sector SPDR Fund 161,209 0.85
6,500 Vanguard ETF 179,227 0.94 ___________ ______
951,802 5.00 ___________ ______
Total Funds 2,276,471 11.95 ___________ ______
BONDS
Australia
A$50,000 New South Wales Treasury 5.25%
1/5/2013 29,011 0.15
A$85,000 Queensland Treasury 6% 14/9/2017 49,829 0.26 ___________ ______
78,840 0.41 ___________ ______
Canada
C$305,000 Canadian Government Bond 3.75%
1/6/2012 203,369 1.07
C$50,000 Canadian Government Bond 3.75%
1/6/2019 32,617 0.17
C$15,000 Canadian Government Bond 5.75%
1/6/2033 12,000 0.06
US$50,000 Export Development Canada 2.375%
19/3/2012 35,691 0.19 ___________ ______
283,677 1.49 ___________ ______
Denmark
€50,000 Kingdom of Denmark 3.125% 17/3/2014 50,915 0.27
€50,000 Kommunekredit 4.375% 2/10/2012 52,323 0.28
DKK50,881 Realkredit Danmark FRN 1/10/2038 6,525 0.03 ___________ ______
109,763 0.58 ___________ ______
France
€50,000 BNP Paribas 5.431% 7/9/2017 54,071 0.28
€145,000 France Government Bond OAT 3.75%
25/4/2021 145,988 0.77
€70,000 France Government Bond OAT 4%
25/10/2038 68,653 0.36
€5,000 France Government Bond OAT 4.25%
25/10/2018 5,321 0.03 ___________ ______
274,033 1.44 ___________ ______
Germany
€50,000 Bundesobligation '153' 4% 11/10/2013 53,369 0.28
€240,000 Bundesobligation 2.25% 11/4/2014 238,648 1.25
€10,000 Bundesrepublik Deutschland 3.25%
4/7/2015 10,312 0.05
€105,000 Bundesrepublik Deutschland 3.5% 4/7/2019 107,063 0.56
€190,000 Bundesrepublik Deutschland 3.75%
4/1/2019 198,209 1.04
€185,000 Bundesrepublik Deutschland 4.25%
4/1/2014 199,242 1.05
€215,000 Bundesrepublik Deutschland 4.25%
4/7/2014 232,229 1.22
€120,000 Bundesrepublik Deutschland 4.25%
4/7/2039 125,710 0.66
€215,000 Bundesrepublik Deutschland 4.75%
4/7/2034 237,261 1.25
€60,263 Driver One '4 A' FRN 21/4/2013 58,615 0.31
US$75,000 Kreditanstalt fuer Wiederaufbau 3.5%
10/3/2014 54,263 0.28 ___________ ______
1,514,921 7.95 ___________ ______
Ireland
C$100,000 Depfa ACS Bank 4.9% 24/8/2035 44,531 0.23
€20,000 GE Capital European Funding 4.375%
30/3/2011 20,502 0.11 ___________ ______
65,033 0.34 ___________ ______
Italy
€35,000 Italy Buoni Poliennali del Tesoro 4%
1/2/2037 30,443 0.16
€10,000 Italy Buoni Poliennali del Tesoro 4.25%
15/10/2012 10,549 0.06 ___________ ______
40,992 0.22 ___________ ______
Japan
¥90,000,000 Japan Finance Corporation for Municipal
Enterprises 2% 9/5/2016 722,054 3.79
¥8,000,000 Japan Government Fifteen Year Bond
FRN 20/3/2021 60,156 0.31
¥23,300,000 Japan Government Five Year Bond 0.9%
20/12/2012 178,356 0.94
¥17,000,000 Japan Government Ten Year Bond 1.9%
20/6/2017 136,715 0.72
¥46,600,000 Japan Government Twenty Year Bond
2.1% 20/12/2027 354,582 1.86
¥14,600,000 Japanese Government CPI Linked Bond
1.2% 10/12/2017 100,694 0.53
¥25,300,000 Japanese Government CPI Linked Bond
1.3% 10/9/2017 176,395 0.93
€100,000 Resona Bank 3.75% 15/4/2015 98,250 0.51
€50,000 Sumitomo Mitsui Banking 4.375%
27/10/2014 49,931 0.26 ___________ ______
1,877,133 9.85 ___________ ______
Jersey
US$90,000 Old Mutual Capital Funding 8%
22/12/2009 (Perpetual) 46,609 0.24 ___________ ______
Netherlands Antilles
£98 Societe Generale Acceptance 0% 22/9/2011 123,875 0.65
£151 Societe Generale Acceptance 0% 20/2/2012 177,145 0.93
£20 Societe Generale Acceptance 'UKX' 0%
26/5/2015 (Zero Coupon) 247,262 1.30 ___________ ______
548,282 2.88 ___________ ______
Transferable Securities Admitted to an Official Stock Exchange
Listing or Dealt in on Another Regulated Market
Holding Description Value (€) %
Transferable Securities Admitted to an Official Stock Exchange
Listing or Dealt in on Another Regulated Market
Holding Description Value (€) %
Portfolio of Investments 31 August 2009

170 BlackRock Global Funds (BGF)
Strategic Allocation Fund (Euro) continued
Norway
€40,000 Eksportfinans 4.375% 20/9/2010 41,188 0.21 ___________ ______
Spain
€50,000 BBVA International Preferred 3.798%
22/9/2015 (Perpetual) 35,542 0.19
€80,000 Spain Government Bond 3.8% 31/1/2017 82,254 0.43 ___________ ______
117,796 0.62 ___________ ______
United Kingdom
£20,000 United Kingdom Gilt '2 1/4% 2014' 2.25%
7/3/2014 22,388 0.12
£15,000 United Kingdom Gilt 4.25% 7/6/2032 17,732 0.10
£10,000 United Kingdom Gilt 4.25% 7/12/2049 11,676 0.06
£35,000 United Kingdom Gilt 4.5% 7/12/2042 42,364 0.22
£75,000 United Kingdom Gilt 4.75% 7/9/2015 94,819 0.50
£20,000 United Kingdom Gilt 4.75% 7/12/2038 25,199 0.13
£17,000 United Kingdom Gilt 5% 7/9/2014 21,496 0.11 ___________ ______
235,674 1.24 ___________ ______
United States
€75,000 BA Covered Bond Issuer 4.25% 5/4/2017 71,275 0.37
US$22,274 Bear Stearns Adjustable Rate Mortgage Trust
'2004-6 3A' FRN 25/9/2034 14,107 0.07
US$50,000 California State 5.95% 1/4/2016 36,024 0.19
US$5,000 California State 7.55% 1/4/2039 3,742 0.02
US$39,305 Chase Commercial Mortgage Securities
'1999-2 A2' 7.198% 15/1/2032 27,531 0.15
US$91,864 Citigroup Mortgage Loan Trust '2005-2 1A4'
5.1133% 25/5/2035 51,466 0.27
US$63,540 Citigroup Mortgage Loan Trust '2006-AR1 1A1'
FRN 25/10/2035 35,281 0.19
US$20,033 Commercial Mortgage Asset Trust
'1999-C1 A3' 6.64% 17/1/2032 14,097 0.07
US$65,296 Countrywide Asset-Backed Certificates
'2007-2 2A1' FRN 25/8/2037 40,110 0.21
US$40,000 CSC Holdings 7.625% 1/4/2011 28,483 0.15
US$42,132 Fannie Mae REMICS '2005-47 HA' 4.5%
25/7/2019 30,798 0.16
US$158,825 Ge Capital Commercial Mortgage '2005-C1 A2'
4.353% 10/6/2048 111,080 0.58
US$30,697 GSR Mortgage Loan Trust '2005-AR1 4A1'
FRN 25/1/2035 19,262 0.10
€50,000 HVB Funding Trust VIII 7.055% 28/3/2012
(Perpetual) 33,914 0.18
US$23,090 JP Morgan Mortgage Acquisition
'2006-CH1 A2' FRN 25/7/2036 15,446 0.08
US$27,569 JP Morgan Mortgage Trust '2004-A5 3A1'
5.309% 25/12/2034 18,249 0.10
US$25,000 New Jersey ST TPK Authority TPK Receivables
7.414% 1/1/2040 21,261 0.11
US$35,000 SLM 5.4% 25/10/2011 21,342 0.11
US$48,504 Soundview Home Equity Loan Trust
'2007-NS1 A1' FRN 25/1/2037 29,078 0.15
US$5,000 United States Treasury Note/Bond 4.25%
15/11/2014 3,800 0.02
US$95,000 US Treasury Bond 1.5% 15/7/2012 66,545 0.35
US$95,000 US Treasury Bond 1.5% 31/12/2013 64,692 0.34
US$215,000 US Treasury Bond 2.625% 30/6/2014 151,992 0.80
US$160,000 US Treasury Bond 2.75% 15/2/2019 105,703 0.56
US$255,000 US Treasury Bond 3.125% 15/5/2019 173,507 0.91
US$5,000 US Treasury Bond 3.5% 15/2/2039 3,074 0.02
US$24,000 US Treasury Bond 3.625% 15/8/2019 17,060 0.09
US$50,000 US Treasury Bond 3.75% 15/11/2018 35,836 0.19
US$14,000 US Treasury Bond 3.875% 15/5/2018 10,161 0.05
US$30,000 US Treasury Bond 4.25% 30/9/2012 22,716 0.12
US$335,700 US Treasury Bond 4.25% 15/5/2039 236,186 1.24
US$10,000 US Treasury Bond 4.5% 15/8/2039 7,330 0.04 ___________ ______
1,521,148 7.99 ___________ ______
Total Bonds 6,755,089 35.46 ___________ ______
COMMON STOCKS (SHARES) & WARRANTS
Bermuda
4,491 Lazard 121,726 0.64 ___________ ______
China
192,000 China Construction Bank 'H' 101,412 0.53 ___________ ______
Denmark
2,561 Carlsberg 127,303 0.67 ___________ ______
Finland
20,095 Nokia OYJ 193,113 1.01 ___________ ______
France
4,004 Sanofi-Aventis 190,791 1.00
3,996 Total 159,301 0.84
9,518 Vivendi 190,646 1.00 ___________ ______
540,738 2.84 ___________ ______
Germany
3,213 BASF SE 116,921 0.61
4,579 Daimler 143,964 0.76
272 Deutsche Bank (Wts 5/10/2011) 325,580 1.71
6,535 E.ON 193,240 1.01
3,746 MAN 199,549 1.05 ___________ ______
979,254 5.14 ___________ ______
Japan
5,700 Canon 153,152 0.80
20,000 Mitsui & Co 182,437 0.96
5,100 Sumitomo Mitsui Financial Group 153,920 0.81 ___________ ______
489,509 2.57 ___________ ______
Luxembourg
6,769 ArcelorMittal 169,496 0.89 ___________ ______
Spain
8,692 Telefonica 153,631 0.81 ___________ ______
Sweden
20,253 Sandvik AB 142,130 0.75
3,576 Swedish Match 48,348 0.25 ___________ ______
190,478 1.00 ___________ ______
Switzerland
6,943 Nestle 198,840 1.05
954 Swatch Group (Bearer Shares) 142,768 0.75
947 Zurich Financial Services 145,215 0.76 ___________ ______
486,823 2.56 ___________ ______
Transferable Securities Admitted to an Official Stock Exchange
Listing or Dealt in on Another Regulated Market
Holding Description Value (€) %
Transferable Securities Admitted to an Official Stock Exchange
Listing or Dealt in on Another Regulated Market
Holding Description Value (€) %
Portfolio of Investments 31 August 2009

Audited Annual Report and Accounts 171
The notes on pages 236 to 244 form an integral part of these financial statements.
Strategic Allocation Fund (Euro) continued
United Kingdom
33,539 Barclays 144,876 0.76
10,288 British American Tobacco 219,018 1.15
5,258 Rio Tinto 144,160 0.76
32,374 Tesco 138,244 0.73
8,890 Tullow Oil 108,767 0.57
138,276 Vodafone Group 208,604 1.09 ___________ ______
963,669 5.06 ___________ ______
United States
3,542 Allergan 136,508 0.72
10,682 Altera 142,896 0.75
10,688 Altria Group 136,132 0.71
15,765 American Eagle Outfitters 149,826 0.79
3,585 Amgen 149,329 0.78
3,461 Anadarko Petroleum 129,074 0.68
12,334 Bank of America 152,609 0.80
7,904 Bank of New York Mellon 157,868 0.83
4,056 Chevron 197,873 1.04
4,765 Cummins 149,127 0.78
6,699 DIRECTV Group 115,048 0.60
4,161 Gilead Sciences 130,661 0.69
9,147 Merck & Co 206,380 1.08
12,843 Microsoft 220,293 1.16
6,378 Morgan Stanley 126,898 0.67
6,744 NYSE Euronext 131,726 0.69
14,495 Pfizer 168,695 0.88
3,792 SPX 148,372 0.78
10,121 SunTrust Banks 165,529 0.87
4,969 Time Warner Cable 128,840 0.68
3,205 Vertex Pharmaceuticals 82,563 0.43
3,530 Wyeth 118,061 0.62
15,698 Xerox 95,028 0.50 ___________ ______
3,339,336 17.53 ___________ ______
Total Common Stocks (Shares) & Warrants 7,856,488 41.25 ___________ ______
Total Transferable Securities Admitted
to an Official Stock Exchange Listing or
Dealt in on Another Regulated Market 16,888,048 88.66 ___________ ______
Unquoted Securities
COMMON STOCKS (SHARES)
United States
3,300 World Access 3 0.00 ___________ ______
Total Unquoted Securities 3 0.00 ___________ ______
Total Portfolio 16,888,051 88.66
Other Net Assets 2,160,215 11.34 ___________ ______
Total Net Assets (€) 19,048,266 100.00 ___________ ______
Transferable Securities Admitted to an Official Stock Exchange
Listing or Dealt in on Another Regulated Market
Holding Description Value (€) %
Transferable Securities Admitted to an Official Stock Exchange
Listing or Dealt in on Another Regulated Market
Holding Description Value (€) %
Portfolio of Investments 31 August 2009

172 BlackRock Global Funds (BGF)
Strategic Allocation Fund (Euro) continued
Value €
Unrealised loss
€DescriptionNominal
Value
US$ 1,000,000 Fund purchases a call option (expiring
5/11/2009) to enter into an Interest
Rate Swap (JP Morgan). If exercised
Fund receives 2.5% Fixed semi annually
from 9/5/2010; and pays Floating
US$ Libor 3-month -BBA quarterly
from 9/2/2010; (5/11/2009) (3,193) 280 ___________ _________
(3,193) 280 ___________ _________
Swaptions as at 31 August 2009
Note: Swaptions are included in the Statement of Net Assets (see Note 2c).
Unrealised profit/(loss)
€DescriptionNominal
Value
Unrealised profit/(loss)
€DescriptionNominal
Value
€50,000 Credit Default Swaps (Barclays)
(Fund provides default protection on
Imperial Tobacco Group Plc 6.25% 4/12/2018;
and receives Fixed 0.71%) (20/9/2012) (1,006)
€50,000 Credit Default Swaps (Union Bank of Switzerland)
(Fund receives default protection on
JTI UK Finance Plc 4.625% 10/6/2011;
and pays Fixed 0.41%) (20/9/2013) (392)
€150,000 Credit Default Swaps (Barclays)
(Fund receives default protection on
iTraxx Europe HiVol Series 11 Version;
and pays Fixed 3.75%) (20/6/2014) (5,153)
US$2,550 Total Return Swap (Deutsche Bank)
(Fund receives DBCMAGUE + 0bps;
and pays Fixed 0.8%) (18/8/2010) 343
€400,000 Interest Rate Swaps (Citibank)
(Fund receives Fixed 3.15%;
and pays Floating EUR Euribor 6 Month)
(5/5/2013) (151) __________
(6,359) __________
Swaps as at 31 August 2009
Note: The total market value of (€14,110) of these transactions is included in the Statement of Net Assets (see Note 2c).
Sector Breakdown as at 31 August 2009
Government national 17.27
Finance 15.33
Investment funds 11.95
Healthcare 6.20
US government 5.05
Consumer discretionary 4.58
Consumer staples 4.56
Industrials 4.47
Government agency 4.39
Information technology 4.22
Energy 3.13
Materials 2.26
Telecommunication services 1.90
Mortgage securities 1.59
Utilities 1.01
Asset backed securities 0.75
Other net assets 11.34 __________
100.00 __________
% of net
assets

Open Futures Contracts as at 31 August 2009
36 DJ Euro Stoxx 600 Travel & Leisure September 2009 180,900
23 DJ Euro Stoxx 600 Medical September 2009 167,670
20 DJ Euro Stoxx 600 Health September 2009 335,800
11 DJ Euro Stoxx 600 Utilities September 2009 182,490
6 Australian 3 Year Bond September 2009 943,248
5 Nikkei 225 (SGX) September 2009 196,248
4 SPI 200 September 2009 261,706
(4) S&P500 E-Mini September 2009 (142,206)
(4) DJ Euro Stoxx 600 Insurance September 2009 (188,080)
(13) DJ Euro Stoxx 600 Food September 2009 (168,870)
(14) NASDAQ 100 E-mini September 2009 (317,296)
(15) DJ Euro Stoxx 600 Retail September 2009 (169,950)
(102) ISE 30 October 2009 (282,786)
2 Euro Schatz December 2009 215,510
1 Long Gilt December 2009 134,730
1 US Long Bond (CBT) December 2009 83,302
(1) US Treasury 10 Year Note December 2009 (81,815)
(3) US Treasury 2 Year Note (CBT) December 2009 (453,917)
19 SX5E Dividend December 2010 179,360
38 SX5E Dividend December 2012 355,300 __________
Total commitment 1,431,344 __________
Note: The net unrealised gain of €168,510 attributed to these transactions is included
in the Statement of Net Assets (see Note 2c).
Value
€
Expiration
dateContracts/Description
Number
of Contracts
Audited Annual Report and Accounts 173
The notes on pages 236 to 244 form an integral part of these financial statements.
Strategic Allocation Fund (Euro) continued
Open Forward Foreign Exchange Transactions as at 31 August 2009
Core Fund
KRW107,657,000 US$87,441 3/9/2009 (868)
US$85,172 KRW107,657,000 3/9/2009 (721)
US$72,443 ¥6,940,000 3/9/2009 (1,535)
¥8,239,692 US$85,200 3/9/2009 2,389
AUD135,000 NZD168,165 10/9/2009 (1,077)
NOK1,576,542 €177,323 10/9/2009 5,559
NZD170,772 AUD134,987 10/9/2009 2,324
PLN428,213 HUF27,902,380 10/9/2009 2,175
PLN661,000 €145,425 10/9/2009 15,852
€146,092 HUF42,819,580 10/9/2009 (10,906)
US$374,599 ZAR2,930,000 10/9/2009 (449)
US$329,408 €230,000 11/9/2009 530
€1,343,794 US$1,876,500 16/9/2009 30,559
SEK1,851,000 CZK4,538,993 22/10/2009 3,321
CAD193,000 €125,285 28/10/2009 (3,072)
€76,372 AUD130,500 28/10/2009 336
€410,797 CAD634,500 28/10/2009 9,017
€265,334 GBP 229,000 28/10/2009 5,208
€1,707,866 ¥228,328,000 28/10/2009 (11,259)
US$950,000 HKD7,356,420 30/10/2009 329
¥40,463,317 €304,568 20/11/2009 130
KRW331,710,000 ¥25,110,522 30/11/2009 (3,371)
AUD149,000 NZD182,288 1/12/2009 251 __________
Net unrealised profit 44,722 __________
Note: The net unrealised profit attributed to these transactions is included in the Statement
of Net Assets (see Note 2c).
Value date
Unrealised
profit/(loss)
€SalesPurchases
58 CBOE SPX Call Option
strike price US$32.50
expiring on 21/10/2009 963 10,655 ___________ _________
Total Purchased Call Options 963 10,655 ___________ _________
Note: Purchased Call Options are included in the Statement of Net Assets (see Note 2c).
Value €
Unrealised profit
€Issuer
Number ofcontracts
subject to Call
Purchased Call Options as at 31 August 2009
(58) CBOE SPX Put Option
strike price US$27.50
expiring on 21/10/2009 1,831 (5,987)___________ _________
Total Written Put Options 1,831 (5,987)___________ _________
Note: Written Put Options are included in the Statement of Net Assets (see Note 2c).
Value €
Unrealised profit
€Issuer
Number ofcontracts
subject to Put
Written Put Options as at 31 August 2009
(58) CBOE SPX Call Option
strike price US$27.50
expiring on 21/10/2009 (3,315) (19,889)___________ _________
Total Written Call Options (3,315) (19,889)___________ _________
Note: Written Call Options are included in the Statement of Net Assets (see Note 2c).
Value €
Unrealised loss
€Issuer
Number ofcontracts
subject to Call
Written Call Options as at 31 August 2009
58 CBOE SPX Put Option
strike price US$22.50
expiring on 21/10/2009 (858) 1,014
25 DJS Banks Put Option
strike price €200
expiring on 18/12/2009 (10,925) 4,125
7 FTSE Put Option
strike price £3,600
expiring on 18/12/2009 (26,069) 1,670 ___________ _________
Total Purchased Put Options (37,852) 6,809 ___________ _________
Note: Purchased Put Options are included in the Statement of Net Assets (see Note 2c).
Value €
Unrealised loss
€Issuer
Number ofcontracts
subject to Put
Purchased Put Options as at 31 August 2009

174 BlackRock Global Funds (BGF)
Strategic Allocation Fund (US Dollar)
FUNDS
Guernsey
65,798 BH Macro – USD 1,029,082 2.47 ___________ ______
Jersey
51,590 ETFS Agriculture DJ-AIGCSM 322,181 0.77
1,675 ETFS Physical Platinum – ETF 206,244 0.50 ___________ ______
528,425 1.27 ___________ ______
United Kingdom
79,941 BlackRock World Mining Trust 574,208 1.38
248,213 Institutional Cash Series Institutional
Liquidity Fund 248,213 0.60 ___________ ______
822,421 1.98 ___________ ______
United States
11,500 Claymore/BNY BRIC ETF 397,785 0.96
14,000 Industrial Select Sector SPDR Fund 349,300 0.84
3,450 iShares MSCI Brazil Index Fund 201,687 0.48
8,200 iShares MSCI Mexico Investable Market
Index Fund 350,469 0.84
7,264 iShares S&P Global Telecommunications
Sector Index Fund 374,532 0.90
12,643 Technology Select Sector SPDR Fund 252,482 0.61
9,000 Vanguard ETF 354,600 0.85 ___________ ______
2,280,855 5.48 ___________ ______
Total Funds 4,660,783 11.20 ___________ ______
BONDS
Australia
A$1,000,000 Australia Government Bond '123' 5.75%
15/4/2012 853,399 2.05
A$80,000 New South Wales Treasury 5.25%
1/5/2013 66,327 0.16
A$140,000 Queensland Treasury 6% 14/9/2017 117,273 0.28 ___________ ______
1,036,999 2.49 ___________ ______
Canada
C$665,000 Canadian Government Bond 3.75%
1/6/2012 633,598 1.52
C$55,000 Canadian Government Bond 4.25%
1/6/2018 53,603 0.13
C$29,000 Canadian Government Bond 5%
1/6/2037 31,079 0.07 ___________ ______
718,280 1.72 ___________ ______
Denmark
€50,000 Kingdom of Denmark 3.125%
17/3/2014 72,754 0.17
€75,000 Kommunekredit 4.375% 2/10/2012 112,148 0.27
DKK106,590 Realkredit Danmark FRN 1/10/2038 19,531 0.05 ___________ ______
204,433 0.49 ___________ ______
France
€50,000 BNP Paribas 5.431% 7/9/2017 77,263 0.19
€290,000 France Government Bond OAT 3.75%
25/4/2021 417,210 1.00
€65,000 France Government Bond OAT 4%
25/10/2038 91,093 0.22
US$100,000 Societe Financement de l'Economie
Francaise 3.375% 5/5/2014 102,256 0.24 ___________ ______
687,822 1.65 ___________ ______
Germany
€100,000 Bundesobligation '153' 4% 11/10/2013 152,520 0.37
€335,000 Bundesobligation 2.25% 11/4/2014 475,990 1.14
€20,000 Bundesrepublik Deutschland 3.25%
4/7/2015 29,469 0.07
€225,000 Bundesrepublik Deutschland 3.5%
4/7/2019 327,824 0.79
€40,000 Bundesrepublik Deutschland 4%
4/7/2016 61,078 0.15
€255,000 Bundesrepublik Deutschland 4.25%
4/1/2014 392,425 0.94
€325,000 Bundesrepublik Deutschland 4.25%
4/7/2014 501,613 1.20
€280,000 Bundesrepublik Deutschland 4.25%
4/7/2039 419,133 1.01
€337,000 Bundesrepublik Deutschland 4.75%
4/7/2034 531,404 1.28
€114,000 Bundesschatzanweisungen 1.25%
11/3/2011 163,370 0.39
US$125,000 Kreditanstalt fuer Wiederaufbau 3.5%
10/3/2014 129,230 0.31
€50,000 Kreditanstalt fuer Wiederaufbau
3.875% 21/1/2019 73,019 0.17 ___________ ______
3,257,075 7.82 ___________ ______
Ireland
C$120,000 Depfa ACS Bank 4.9% 24/8/2035 76,358 0.18
€30,000 GE Capital European Funding 4.375%
30/3/2011 43,943 0.11 ___________ ______
120,301 0.29 ___________ ______
Italy
€15,000 Italy Buoni Poliennali del Tesoro 4%
1/2/2037 18,643 0.05
€20,000 Italy Buoni Poliennali del Tesoro 4.25%
15/10/2012 30,148 0.07 ___________ ______
48,791 0.12 ___________ ______
Japan
¥30,000,000 Japan Finance Corporation for
Municipal Enterprises 2% 9/5/2016 343,918 0.83
¥11,000,000 Japan Government Fifteen Year Bond
FRN 20/3/2021 118,192 0.28
¥36,700,000 Japan Government Five Year Bond 0.9%
20/12/2012 401,425 0.96
¥5,500,000 Japan Government Ten Year Bond 1.5%
20/9/2018 60,693 0.15
¥105,000,000 Japan Government Ten Year Bond 1.9%
20/6/2017 1,206,599 2.90
¥46,800,000 Japan Government Twenty Year Bond
2.1% 20/12/2027 508,843 1.22
¥40,000,000 Japan Government Twenty Year Bond
2.2% 20/6/2026 446,093 1.07
¥20,000,000 Japanese Government CPI Linked Bond
1.2% 10/6/2017 199,154 0.48
¥21,400,000 Japanese Government CPI Linked Bond
1.2% 10/12/2017 210,898 0.51
€100,000 Resona Bank 3.75% 15/4/2015 140,391 0.34
€50,000 Sumitomo Mitsui Banking 4.375%
27/10/2014 71,347 0.17 ___________ ______
3,707,553 8.91 ___________ ______
Jersey
US$90,000 Old Mutual Capital Funding 8%
22/12/2009 (Perpetual) 66,600 0.16 ___________ ______
Transferable Securities Admitted to an Official Stock Exchange
Listing or Dealt in on Another Regulated Market
Holding Description Value (US$) %
Transferable Securities Admitted to an Official Stock Exchange
Listing or Dealt in on Another Regulated Market
Holding Description Value (US$) %
Portfolio of Investments 31 August 2009

Audited Annual Report and Accounts 175
The notes on pages 236 to 244 form an integral part of these financial statements.
Strategic Allocation Fund (US Dollar) continued
Netherlands Antilles
£151 Societe Generale Acceptance 0%
22/9/2011 272,735 0.66
£239 Societe Generale Acceptance 0%
20/2/2012 400,643 0.96
£32 Societe Generale Acceptance 'UKX' 0%
26/5/2015 (Zero Coupon) 565,307 1.36 ___________ ______
1,238,685 2.98 ___________ ______
Norway
€25,000 DnB NOR Bank 7.068% 19/11/2012
(Perpetual) 33,044 0.08
€45,000 Eksportfinans 4.375% 20/9/2010 66,210 0.16 ___________ ______
99,254 0.24 ___________ ______
Spain
€50,000 BBVA International Preferred 3.798%
22/9/2015 (Perpetual) 50,786 0.12
€50,000 Caja de Ahorros de Valencia Castellon y
Alicante 3% 11/5/2012 72,505 0.18
€125,000 Spain Government Bond 3.8%
31/1/2017 183,648 0.44 ___________ ______
306,939 0.74 ___________ ______
Sweden
€50,000 Svensk Exportkredit AB 3.625%
27/5/2014 72,728 0.17 ___________ ______
United Kingdom
€20,000 Chester Asset Receivables Dealings No 11
6.125% 15/10/2010 28,251 0.07
£30,000 Chester Asset Receivables Dealings No 12
6% 18/1/2011 48,245 0.12
£65,000 United Kingdom Gilt 4.25% 7/6/2032 109,795 0.26
£25,000 United Kingdom Gilt 4.25% 7/9/2039 41,256 0.10
£10,000 United Kingdom Gilt 4.25% 7/12/2049 16,684 0.04
£125,000 United Kingdom Gilt 4.5% 7/3/2019 218,236 0.52
£60,000 United Kingdom Gilt 4.5% 7/12/2042 103,774 0.25
£100,000 United Kingdom Gilt 4.75% 7/9/2015 180,651 0.43
£15,000 United Kingdom Gilt 4.75% 7/3/2020 26,767 0.06
£24,000 United Kingdom Gilt 5% 7/9/2014 43,365 0.11
£65,000 United Kingdom Gilt 5.25% 7/6/2012 114,743 0.28 ___________ ______
931,767 2.24 ___________ ______
United States
€100,000 BA Covered Bond Issuer 4.25% 5/4/2017 135,795 0.33
US$33,411 Bear Stearns Adjustable Rate Mortgage
Trust '2004-6 3A' FRN 25/9/2034 30,238 0.07
US$75,000 California State 5.95% 1/4/2016 77,213 0.19
US$15,000 California State 7.55% 1/4/2039 16,043 0.04
US$49,131 Chase Commercial Mortgage Securities
'1999-2 A2' 7.198% 15/1/2032 49,175 0.12
US$50,000 Citigroup Funding 2.25% 10/12/2012 50,439 0.12
US$166,540 Citigroup Mortgage Loan Trust
'2005-2 1A4' 5.1133% 25/5/2035 133,323 0.32
US$63,540 Citigroup Mortgage Loan Trust
'2006-AR1 1A1' FRN 25/10/2035 50,413 0.12
US$50,000 Comcast Cable Holdings 9.8% 1/2/2012 56,587 0.14
US$93,280 Countrywide Asset-Backed Certificates
'2007-2 2A1' FRN 25/8/2037 81,877 0.20
US$126,272 Daimler Chrysler Auto Trust 4.98%
8/11/2011 129,002 0.31
US$42,132 Fannie Mae REMICS '2005-47 HA' 4.5%
25/7/2019 44,008 0.11
US$14,387 First Union National Bank Commercial
Mortgage '1999-C4 A2' 7.39%
15/12/2031 14,382 0.03
US$30,435 Ford Credit Auto Owner Trust
'2006-C A3' 5.16% 15/11/2010 30,589 0.07
US$198,532 Ge Capital Commercial Mortgage
'2005-C1 A2' 4.353% 10/6/2048 198,406 0.48
US$45,209 GSR Mortgage Loan Trust '2005-AR1 4A1'
FRN 25/1/2035 40,535 0.10
US$33,005 Home Equity Asset Trust '2007-2 2A1'
FRN 25/7/2037 30,344 0.07
US$18,531 Honda Auto Receivables Owner Trust
'2006-3 A3' 5.12% 15/10/2010 18,620 0.04
€50,000 HVB Funding Trust VIII 7.055% 28/3/2012
(Perpetual) 48,460 0.12
US$41,353 JP Morgan Mortgage Trust '2004-A5 3A1'
5.309% 25/12/2034 39,115 0.09
US$93,102 Morgan Stanley Home Equity Loans
'2007-2 A1' FRN 25/4/2037 72,021 0.17
US$50,000 New Jersey ST TPK Authority TPK
Receivables 7.414% 1/1/2040 60,760 0.15
US$45,000 SLM 5.4% 25/10/2011 39,209 0.09
US$64,672 Soundview Home Equity Loan Trust
'2007-NS1 A1' FRN 25/1/2037 55,400 0.13
US$19,780 Structured Asset Investment Loan
Trust '2006-BNC3 A2' FRN 25/9/2036 19,494 0.05
US$20,000 United States Treasury Inflation Indexed
Bonds 1.75% 15/1/2028 19,276 0.05
US$95,000 US Treasury Bond 1.5% 15/7/2012 95,087 0.23
US$180,000 US Treasury Bond 1.5% 31/12/2013‡ 175,148 0.42
US$50,000 US Treasury Bond 2.625% 31/7/2014 50,506 0.12
US$270,000 US Treasury Bond 2.75% 15/2/2019 254,881 0.61
US$165,000 US Treasury Bond 3.125% 15/5/2019 160,424 0.38
US$75,000 US Treasury Bond 3.25% 31/7/2016 75,964 0.18
US$25,000 US Treasury Bond 3.5% 15/2/2039 21,964 0.05
US$68,000 US Treasury Bond 3.875% 15/5/2018 70,522 0.17
US$453,500 US Treasury Bond 4.25% 15/5/2039 455,918 1.09
US$70,000 US Treasury Bond 4.5% 15/8/2039 73,320 0.18 ___________ ______
2,974,458 7.14 ___________ ______
Total Bonds 15,471,685 37.16 ___________ ______
COMMON STOCKS (SHARES) & WARRANTS
Bermuda
6,447 Lazard 249,692 0.60 ___________ ______
China
283,000 China Construction Bank 'H' 213,591 0.51 ___________ ______
Denmark
3,845 Carlsberg 273,108 0.66 ___________ ______
Finland
29,441 Nokia OYJ 404,281 0.97 ___________ ______
France
5,641 Sanofi-Aventis 384,084 0.92
6,184 Total 352,264 0.85
13,758 Vivendi 393,771 0.94 ___________ ______
1,130,119 2.71 ___________ ______
Transferable Securities Admitted to an Official Stock Exchange
Listing or Dealt in on Another Regulated Market
Holding Description Value (US$) %
Transferable Securities Admitted to an Official Stock Exchange
Listing or Dealt in on Another Regulated Market
Holding Description Value (US$) %
Portfolio of Investments 31 August 2009

176 BlackRock Global Funds (BGF)
Strategic Allocation Fund (US Dollar) continued
Transferable Securities Admitted to an Official Stock Exchange
Listing or Dealt in on Another Regulated Market
Holding Description Value (US$) %
Transferable Securities Admitted to an Official Stock Exchange
Listing or Dealt in on Another Regulated Market
Holding Description Value (US$) %
(‡) Securities given in guarantee, see Note 12, for further details.
Portfolio of Investments 31 August 2009
Germany
4,612 BASF SE 239,816 0.58
6,573 Daimler 295,293 0.71
417 Deutsche Bank (Wts 5/10/2011) 713,231 1.71
9,549 E.ON 403,475 0.97
5,374 MAN 409,060 0.98 ___________ ______
2,060,875 4.95 ___________ ______
Japan
8,000 Canon 307,146 0.74
27,800 Mitsui & Co 362,355 0.87
7,900 Sumitomo Mitsui Financial Group 340,689 0.82 ___________ ______
1,010,190 2.43 ___________ ______
Luxembourg
9,908 ArcelorMittal 354,509 0.85 ___________ ______
Spain
12,727 Telefonica 321,435 0.77 ___________ ______
Sweden
29,074 Sandvik AB 291,547 0.70
5,235 Swedish Match 101,136 0.24 ___________ ______
392,683 0.94 ___________ ______
Switzerland
9,967 Nestle 407,875 0.98
1,371 Swatch Group (Bearer Shares) 293,176 0.70
1,359 Zurich Financial Services 297,776 0.72 ___________ ______
998,827 2.40 ___________ ______
United Kingdom
51,973 Barclays 320,799 0.77
15,951 British American Tobacco 485,225 1.17
7,550 Rio Tinto 295,787 0.71
48,751 Tesco 297,469 0.71
13,005 Tullow Oil 227,359 0.55
214,836 Vodafone Group 463,117 1.11 ___________ ______
2,089,756 5.02 ___________ ______
United States
5,491 Allergan 302,389 0.73
15,647 Altera 299,092 0.72
16,608 Altria Group 302,266 0.73
23,105 American Eagle Outfitters 313,766 0.75
5,247 Amgen 312,301 0.75
5,063 Anadarko Petroleum 269,807 0.65
19,182 Bank of America 339,138 0.81
11,347 Bank of New York Mellon 323,843 0.78
6,115 Chevron 426,277 1.02
6,982 Cummins 312,235 0.75
9,816 DIRECTV Group 240,885 0.58
6,452 Gilead Sciences 289,501 0.69
13,380 Merck & Co 431,371 1.04
18,425 Microsoft 451,595 1.08
9,350 Morgan Stanley 265,821 0.64
9,873 NYSE Euronext 275,555 0.66
22,440 Pfizer 373,177 0.90
5,547 SPX 310,133 0.74
14,804 SunTrust Banks 345,969 0.83
7,069 Time Warner Cable 261,906 0.63
4,972 Vertex Pharmaceuticals 183,019 0.44
4,519 Wyeth 215,963 0.52
22,962 Xerox 198,621 0.48 ___________ ______
7,044,630 16.92 ___________ ______
Total Common Stocks (Shares) & Warrants 16,543,696 39.73 ___________ ______
Total Transferable Securities Admitted
to an Official Stock Exchange Listing or
Dealt in on Another Regulated Market 36,676,164 88.09 ___________ ______
Unquoted Securities
COMMON STOCKS (SHARES)
United States
24,000 World Access 36 0.00 ___________ ______
Total Unquoted Securities 36 0.00 ___________ ______
Total Portfolio 36,676,200 88.09
Other Net Assets 4,957,207 11.91 ___________ ______
Total Net Assets (US$) 41,633,407 100.00 ___________ ______

Audited Annual Report and Accounts 177
The notes on pages 236 to 244 form an integral part of these financial statements.
Strategic Allocation Fund (US Dollar) continued
Value US$
Unrealised loss US$Description
NominalValue
US$ 1,600,000 Fund purchases a call option (expiring
5/11/2009) to enter into an Interest
Rate Swap (JP Morgan). If exercised
Fund receives 2.5% Fixed semi annually
from 9/5/2010; and pays Floating
US$ Libor 3-month -BBA quarterly
from 9/2/2010; (5/11/2009) (6,800) 640 ___________ _________
(6,800) 640 ___________ _________
Swaptions as at 31 August 2009
Note: Swaptions are included in the Statement of Net Assets (see Note 2c).
Unrealised profit/(loss)
US$DescriptionNominal
Value
Unrealised profit/(loss)
US$DescriptionNominal
Value
€50,000 Credit Default Swaps (Citibank)
(Fund receives default protection on
StMicroelectronics NV 0% 5/7/2013;
and pays Fixed 0.255%) (20/9/2012) 535
€50,000 Credit Default Swaps (Barclays)
(Fund provides default protection on
Imperial Tobacco Group Plc 6.25% 4/12/2018;
and receives Fixed 0.71%) (20/9/2012) (1,438)
€100,000 Credit Default Swaps (Citibank)
(Fund receives default protection on
Cadbury Schweppes Plc 5.125% 1/10/2013;
and pays Fixed 0.55%) (20/12/2012) (1,517)
€50,000 Credit Default Swaps (Union Bank of Switzerland)
(Fund receives default protection on
JTI UK Finance Plc 4.625% 10/6/2011;
and pays Fixed 0.41%) (20/9/2013) (560)
€250,000 Credit Default Swaps (Barclays)
(Fund receives default protection on
iTraxx Europe HiVol Series 11 Version;
and pays Fixed 3.75%) (20/6/2014) (12,832)
US$4,060 Total Return Swap (Deutsche Bank)
(Fund receives DBCMAGUE + 0bps;
and pays Fixed 0.8%) (18/8/2010) 4,750
€600,000 Interest Rate Swaps (Citibank)
(Fund receives Fixed 3.15%;
and pays Floating EUR Euribor 6 Month)
(5/5/2013) (324) __________
(11,386) __________
Swaps as at 31 August 2009
Note: The total market value of (US$29,284) of these transactions is included in the Statement of Net Assets (see Note 2c).
Sector Breakdown as at 31 August 2009
Government national 22.68
Finance 15.34
Investment funds 11.20
Healthcare 5.99
Consumer staples 4.56
Consumer discretionary 4.31
Industrials 4.14
Information technology 3.99
US government 3.86
Energy 3.07
Materials 2.21
Telecommunication services 2.02
Government agency 1.51
Mortgage securities 1.34
Utilities 0.97
Asset backed securities 0.90
Other net assets 11.91 __________
100.00 __________
% of net
assets

Open Futures Contracts as at 31 August 2009
50 DJ Euro Stoxx 600 Travel & Leisure September 2009 359,015
35 DJ Euro Stoxx 600 Medical September 2009 364,588
32 DJ Euro Stoxx 600 Health September 2009 767,729
15 DJ Euro Stoxx 600 Utilities September 2009 355,586
12 Nikkei 225 (SGX) September 2009 673,012
6 SPI 200 September 2009 560,934
1 Euro Bund September 2009 175,114
(5) DJ Euro Stoxx 600 Insurance September 2009 (335,938)
(7) S&P500 E-Mini September 2009 (355,600)
(18) DJ Euro Stoxx 600 Food September 2009 (334,109)
(23) NASDAQ 100 E-Mini September 2009 (744,855)
(23) DJ Euro Stoxx 600 Retail September 2009 (372,362)
(152) ISE 30 October 2009 (602,154)
1 Euro Schatz December 2009 153,973
1 US Treasury 5 Year Note (CBT) December 2009 115,031
1 US Treasury 10 Year Note December 2009 116,906
1 US Long Bond (CBT) December 2009 119,031
(3) US Treasury 2 Year Note (CBT) December 2009 (648,609)
33 SX5E Dividend December 2010 445,136
62 SX5E Dividend December 2012 828,343 __________
Total commitment 1,640,771 __________
Note: The net unrealised gain of US$384,759 attributed to these transactions is included
in the Statement of Net Assets (see Note 2c).
Value
US$
Expiration
dateContracts/Description
Number
of Contracts
178 BlackRock Global Funds (BGF)
Strategic Allocation Fund (US Dollar) continued
88 CBOE SPX Call Option
strike price US$32.50
expiring on 21/10/2009 2,156 23,100 ___________ _________
Total Purchased Call Options 2,156 23,100 ___________ _________
Note: Purchased Call Options are included in the Statement of Net Assets (see Note 2c).
Value US$
Unrealised profit
US$Issuer
Number ofcontracts
subject to Call
Purchased Call Options as at 31 August 2009
88 CBOE SPX Put Option
strike price US$22.50
expiring on 21/10/2009 (1,848) 2,200
39 DJS Banks Put Option
strike price €200
expiring on 18/12/2009 (23,837) 9,195
11 FTSE Put Option
strike price £3,600
expiring on 18/12/2009 (55,950) 3,750 ___________ _________
Total Purchased Put Options (81,635) 15,145 ___________ _________
Note: Purchased Put Options are included in the Statement of Net Assets (see Note 2c).
Value US$
Unrealised loss US$Issuer
Number ofcontracts
subject to Put
Purchased Put Options as at 31 August 2009
(88) CBOE SPX Call Option
strike price US$27.50
expiring on 21/10/2009 (7,304) (43,120)___________ _________
Total Written Call Options (7,304) (43,120)___________ _________
Note: Written Call Options are included in the Statement of Net Assets (see Note 2c).
Value US$
Unrealised loss US$Issuer
Number ofcontracts
subject to Call
Written Call Options as at 31 August 2009
(88) CBOE SPX Put Option
strike price US$27.50
expiring on 21/10/2009 3,916 (12,980)___________ _________
Total Written Put Options 3,916 (12,980)___________ _________
Note: Written Put Options are included in the Statement of Net Assets (see Note 2c).
Value US$
Unrealised profit
US$Issuer
Number ofcontracts
subject to Put
Written Put Options as at 31 August 2009
Open Forward Foreign Exchange Transactions as at 31 August 2009
Core Fund
KRW167,377,000 US$135,946 3/9/2009 (1,928)
US$132,419 KRW167,377,000 3/9/2009 (1,600)
US$112,474 ¥10,775,000 3/9/2009 (3,406)
¥12,804,404 US$132,400 3/9/2009 5,305
US$950,000 GBP 580,385 4/9/2009 7,894
AUD213,000 NZD265,328 10/9/2009 (2,427)
NOK2,099,704 US$332,368 10/9/2009 15,673
NOK287,000 €33,371 10/9/2009 (111)
NZD268,903 AUD212,555 10/9/2009 5,230
PLN578,327 HUF37,779,939 10/9/2009 3,694
PLN1,042,000 US$324,530 10/9/2009 38,752
US$325,807 HUF67,500,760 10/9/2009 (27,837)
US$565,734 ZAR4,425,000 10/9/2009 (970)
US$326,189 €230,685 10/9/2009 (3,441)
US$524,189 €366,000 11/9/2009 1,206
US$6,973 €5,000 15/9/2009 (171)
US$5,167,361 €3,697,500 16/9/2009 (116,044)
€118,000 US$168,800 16/9/2009 (188)
SEK2,796,000 CZK6,873,227 22/10/2009 6,218
CAD286,000 US$260,801 28/10/2009 (2,022)
US$1,062,925 AUD1,290,500 28/10/2009 (11,493)
US$1,063,377 CAD1,152,500 28/10/2009 20,569
US$19,170 DKK100,000 28/10/2009 (5)
US$922,189 GBP 563,500 28/10/2009 7,554
US$3,547,416 ¥333,076,000 28/10/2009 (36,000)
¥10,886,100 US$115,250 28/10/2009 1,869
US$1,326,000 HKD10,268,014 30/10/2009 655
¥65,578,479 €493,609 20/11/2009 300
KRW518,056,000 ¥39,216,956 30/11/2009 (7,522)
AUD233,000 NZD285,055 1/12/2009 560
US$1,000,000 GBP 611,527 4/12/2009 7,414 __________
Net unrealised loss (92,272)__________
Note: The net unrealised loss attributed to these transactions is included in the Statement
of Net Assets (see Note 2c).
Value date
Unrealised
profit/(loss)
US$SalesPurchases

Audited Annual Report and Accounts 179
The notes on pages 236 to 244 form an integral part of these financial statements.
Swiss Opportunities Fund
Portfolio of Investments 31 August 2009
COMMON STOCKS (SHARES) & WARRANTS
France
7,702 Givaudan 5,865,073 4.54 ___________ ______
Guernsey
64,551 Gottex Fund Management Holdings 790,750 0.61 ___________ ______
Israel
372,611 Oridion Systems 2,421,972 1.87 ___________ ______
Italy
14,493 Newron Pharmaceuticals 326,093 0.25 ___________ ______
Switzerland
14,259 Actelion 878,354 0.68
39,183 Adecco 1,988,537 1.54
15,204 Advanced Digital Broadcast Holdings 699,384 0.54
156,542 Ascom Holding 1,964,602 1.52
135,620 Bank Sarasin & Cie 'B' 5,234,932 4.05
105,871 Bank Sarasin & Cie (Call Wts 15/9/2009
– Bank Sarasin & Cie) 111,165 0.09
10,476 Banque Cantonale de Geneve 2,578,144 1.99
5,370 Banque Cantonale Vaudoise 2,125,177 1.64
7,454 Basilea Pharmaceutica 695,086 0.54
39,686 Bobst Group 1,702,529 1.32
29,138 Bucher Industries 3,589,802 2.78
2,142 Burckhardt Compression Holding 366,282 0.28
2,252 Carlo Gavazzi Holding 286,004 0.22
14,443 Charles Voegele Holding 'A' 587,830 0.45
377,323 Clariant 3,584,569 2.77
122,126 Compagnie Financiere Richemont 'A'
(Bearer Shares) 3,534,326 2.73
15,488 Daetwyler Holding 824,736 0.64
2,531 Dufry Group 115,161 0.09
96,932 EFG International 1,696,310 1.31
7,437 EMS-Chemie Holding 840,380 0.65
4,765 Flughafen Zuerich 1,362,790 1.05
150,829 Gategroup Holding 3,770,725 2.91
13,503 Geberit 2,214,492 1.71
3,473 Gurit Holding (Bearer Shares) 2,024,759 1.57
8,241 Helvetia Holding 2,791,639 2.16
28,314 Inficon Holding 3,176,831 2.46
17,715 Julius Baer Holding 952,181 0.74
37,719 Kudelski 893,940 0.69
1,474 Kuoni Reisen Holding 'B' 518,111 0.40
7,557 LEM Holding 2,214,201 1.71
84,211 LifeWatch 1,511,587 1.17
156,201 Logitech International 3,070,912 2.37
37,138 Lonza Group 3,906,917 3.02
189,334 Mobilezone Holding 1,382,138 1.07
33,838 Parge Holding 2,808,554 2.17
13,949 Partners Group Holding 1,701,778 1.32
31,459 PSP Swiss Property 1,843,497 1.42
27,177 Schindler Holding 1,852,113 1.43
9,611 Schweiter Technologies 3,815,567 2.95
16,125 Schweizerhall Holding 2,902,500 2.24
3,435 SGS 4,486,110 3.47
533 Sika 714,220 0.55
41,540 Sonova Holding 4,183,078 3.23
3,625 St Galler Kantonalbank 1,613,125 1.25
43,735 Sulzer 3,577,523 2.77
103,082 Swatch Group 4,643,844 3.59
569,675 Swisslog Holding 450,043 0.35
32,339 Swissquote Group Holding 1,694,564 1.31
5,639 Syngenta 1,411,160 1.09
44,296 Tecan Group 2,524,872 1.95
51,312 UBS 995,966 0.77
31,788 Uster Technologies 521,323 0.40
20,188 Valora Holding 4,578,638 3.54
1,259 Vetropack Holding 2,327,891 1.80
19,623 VZ Holding 1,373,610 1.06
73,536 Winterthur Technologie 2,720,832 2.10
149 Zehnder Group 178,800 0.14 ___________ ______
116,114,141 89.76 ___________ ______
Total Portfolio 125,518,029 97.03
Other Net Assets 3,843,629 2.97 ___________ ______
Total Net Assets (CHF) 129,361,658 100.00 ___________ ______
Transferable Securities Admitted to an Official Stock Exchange
Listing or Dealt in on Another Regulated Market
Holding Description Value (CHF) %
Transferable Securities Admitted to an Official Stock Exchange
Listing or Dealt in on Another Regulated Market
Holding Description Value (CHF) %
Sector Breakdown as at 31 August 2009
Industrials 26.06
Finance 21.89
Healthcare 14.95
Materials 12.97
Consumer discretionary 12.41
Information technology 8.75
Other net assets 2.97 __________
100.00 __________
% of net
assets

180 BlackRock Global Funds (BGF)
United Kingdom Fund
Portfolio of Investments 31 August 2009
FUNDS
Ireland
24,955 Specialist Dublin Funds I Trust Blackrock
UK Equity 3,422,343 1.38 ___________ ______
United Kingdom
4,092,550 Blackrock UK Smaller Companies Fund
– Class A 11,673,999 4.73 ___________ ______
Total Funds 15,096,342 6.11 ___________ ______
COMMON STOCK (SHARES) & WARRANTS
Bermuda
255,465 Aquarius Platinum 685,668 0.28 ___________ ______
British Virgin Islands
218,822 Playtech 730,865 0.30 ___________ ______
Jersey
181,096 Shire 1,852,612 0.75 ___________ ______
Luxembourg
1,753,989 Regus 1,808,363 0.73 ___________ ______
United Kingdom
1,133,215 3i Group 3,439,308 1.39
317,615 Admiral Group 3,395,304 1.37
262,450 Aggreko 1,742,668 0.71
456,673 AMEC 3,443,314 1.39
426,230 Amlin 1,573,641 0.64
778,694 Ashmore Group 1,861,079 0.75
383,074 AstraZeneca 10,879,302 4.41
2,932,542 Barclays 11,150,991 4.52
709,232 BG Group 7,212,889 2.92
553,365 BHP Billiton 9,008,782 3.65
2,006,484 BP 10,674,495 4.32
1,103,102 British Airways 2,112,440 0.86
396,935 British American Tobacco 7,438,562 3.01
454,728 British Sky Broadcasting Group 2,482,815 1.01
295,621 Burberry Group 1,429,328 0.58
68,977 Cairn Energy 1,729,253 0.70
673,205 Compass Group 2,197,341 0.89
93,020 Cookson Group 366,964 0.15
41,208 CSR 194,750 0.08
139,744 Dana Petroleum 1,967,596 0.80
120,324 Derwent London (Reit) 1,383,726 0.56
365,488 Enterprise Inns 607,076 0.25
592,229 GlaxoSmithKline 7,124,515 2.88
337,058 Grainger 960,615 0.39
523,206 Great Portland Estates (Reit) 1,386,496 0.56
949,560 Hammerson 3,844,768 1.56
2,588,878 HSBC Holdings 17,399,849 7.05
230,771 ICAP 991,162 0.40
155,141 Imperial Tobacco Group 2,683,939 1.09
346,726 Inmarsat 1,806,442 0.73
8,529,968 Innovation Group 916,972 0.37
1,540,150 International Power 4,337,062 1.76
295,996 Jardine Lloyd Thompson Group 1,426,701 0.58
603,873 John Wood Group 1,803,165 0.73
143,210 Kazakhmys 1,415,631 0.57
4,207,249 Lloyds TSB Group 4,684,351 1.90
137,263 Logica 157,852 0.06
222,396 Mouchel Group 405,873 0.16
161,800 Next 2,653,520 1.07
101,974 Peter Hambro Mining 786,729 0.32
336,928 Premier Farnell 555,931 0.22
817,443 Prudential 4,389,669 1.78
183,860 Reckitt Benckiser Group 5,245,526 2.12
363,118 Rio Tinto 8,763,853 3.55
3,290,922 Royal Bank of Scotland Group 1,897,217 0.77
39,619 Soco International 520,197 0.21
443,481 SSL International 2,474,624 1.00
319,560 Standard Chartered 4,461,058 1.81
2,720,225 Taylor Wimpey 1,419,957 0.57
2,074,578 Tesco 7,798,339 3.16
390,558 TUI Travel 938,120 0.38
632,185 Tullow Oil 6,808,632 2.76
10,403,411 Vodafone Group 13,815,730 5.60
249,757 Whitbread 2,614,956 1.06
45,765 William Hill 84,894 0.03
834,656 Royal Dutch Shell 'B' 13,972,141 5.66
429,423 Xstrata 3,549,181 1.44 ___________ ______
220,387,291 89.26 ___________ ______
United States
82,300 Lorillard 3,655,017 1.48 ___________ ______
Total Common Stock (Shares) & Warrants 229,119,816 92.80 ___________ ______
Total Transferable Securities Admitted
to an Official Stock Exchange Listing or
Dealt in on Another Regulated Market 244,216,158 98.91 ___________ ______
Unquoted Securities
WARRANTS
United Kingdom
487,982 PuriCore (Wts) – 0.00 ___________ ______
Total Unquoted Securities – 0.00 ___________ ______
Total Portfolio 244,216,158 98.91
Other Net Assets 2,689,221 1.09 ___________ ______
Total Net Assets (£) 246,905,379 100.00 ___________ ______
Transferable Securities Admitted to an Official Stock Exchange
Listing or Dealt in on Another Regulated Market
Holding Description Value (£) %
Transferable Securities Admitted to an Official Stock Exchange
Listing or Dealt in on Another Regulated Market
Holding Description Value (£) %

Audited Annual Report and Accounts 181
The notes on pages 236 to 244 form an integral part of these financial statements.
United Kingdom Fund continued
Sector Breakdown as at 31 August 2009
Finance 26.03
Energy 19.49
Consumer staples 10.86
Materials 9.81
Healthcare 9.04
Telecommunication services 6.33
Investment funds 6.11
Consumer discretionary 5.84
Industrials 2.61
Utilities 1.76
Information technology 1.03
Other net assets 1.09 __________
100.00 __________
% of net
assets

182 BlackRock Global Funds (BGF)
US Basic Value Fund
COMMON STOCKS (SHARES)
Ireland
513,900 Covidien 20,155,158 1.36 _____________ ______
Netherlands
1,509,100 Unilever (NY Shares) 41,786,979 2.82 _____________ ______
Switzerland
291,500 ACE 15,184,235 1.02
632,500 Tyco International 19,885,800 1.34 _____________ ______
35,070,035 2.36 _____________ ______
United States
570,400 Alcoa 6,941,768 0.47
427,100 Anadarko Petroleum 22,760,159 1.53
679,300 Analog Devices 19,237,776 1.30
904,180 AT&T 23,535,805 1.59
1,616,800 Bank of America 28,585,024 1.93
781,700 Bank of New York Mellon 22,309,718 1.50
144,000 Baxter International 8,210,880 0.55
648,700 BJ Services 10,703,550 0.72
2,693,300 Bristol-Myers Squibb 58,471,543 3.94
253,400 CBS 2,670,836 0.18
344,800 Chevron 24,036,008 1.62
87,800 Clorox 5,145,958 0.35
235,100 Deere & Co 10,175,128 0.69
530,500 Dominion Resources 17,506,500 1.18
823,409 EI Du Pont de Nemours & Co 26,250,279 1.77
488,800 Eli Lilly & Co 16,325,920 1.10
671,800 Exxon Mobil 46,763,998 3.15
79,400 Gap 1,557,828 0.10
609,300 General Mills 35,979,165 2.43
1,560,600 Halliburton 36,674,100 2.47
990,700 Hewlett-Packard 44,006,894 2.97
569,900 Honeywell International 20,926,728 1.41
1,414,000 Intel 28,335,853 1.91
257,200 International Business Machines 30,159,272 2.03
1,357,100 JPMorgan Chase & Co 57,975,312 3.91
658,900 Kimberly-Clark 39,474,699 2.66
1,485,114 Kraft Foods 'A' 41,850,513 2.82
421,400 Kroger 9,114,882 0.61
9,050,000 LSI 46,517,000 3.14
807,300 Ltd Brands 11,996,478 0.81
1,034,800 Maxim Integrated Products 19,280,394 1.30
598,000 Metlife 22,544,600 1.52
4,022,900 Micron Technology 29,568,315 1.99
848,000 Morgan Stanley 24,108,640 1.63
272,600 Noble 9,535,548 0.64
240,300 Northrop Grumman 11,700,207 0.79
122,600 Nucor 5,503,514 0.37
411,400 Peabody Energy 13,440,438 0.91
1,418,100 Pfizer 23,583,003 1.59
225,900 Prudential Financial 11,568,339 0.78
10,010,200 Qwest Communications International 36,737,434 2.48
534,500 Raytheon 25,164,260 1.70
1,672,900 Schering-Plough 46,975,032 3.17
591,600 Southern 18,517,080 1.25
1,084,533 Time Warner 30,431,996 2.05
185,048 Time Warner Cable 6,856,028 0.46
1,290,500 Travelers 63,853,940 4.30
178,500 United States Steel 7,809,375 0.53
550,000 UnitedHealth Group 15,273,500 1.03
377,800 US Bancorp 8,428,718 0.57
977,100 Verizon Communications 30,045,825 2.03
1,447,100 Viacom 'B' 36,423,507 2.46
917,300 Walt Disney 24,308,450 1.64
257,600 Wells Fargo & Co 7,040,208 0.47
685,400 Wyeth 32,755,266 2.21
4,640,700 Xerox 40,142,055 2.71 _____________ ______
1,355,795,246 91.42 _____________ ______
Total Portfolio 1,452,807,418 97.96
Other Net Assets 30,183,453 2.04_____________ ______
Total Net Assets (US$) 1,482,990,871 100.00 _____________ ______
Transferable Securities Admitted to an Official Stock Exchange
Listing or Dealt in on Another Regulated Market
Holding Description Value (US$) %
Transferable Securities Admitted to an Official Stock Exchange
Listing or Dealt in on Another Regulated Market
Holding Description Value (US$) %
Portfolio of Investments 31 August 2009
Open Forward Foreign Exchange Transactions as at 31 August 2009
EUR Hedged Share Class €
€30,302,894 US$42,850,699 15/9/2009 314,584 449,534
US$4,592,891 €3,217,442 15/9/2009 (3,188) (4,556)__________ __________
Net unrealised profit 311,396 444,978 __________ __________
Note: The net unrealised profit attributed to these transactions is included in the Statement
of Net Assets (see Note 2c).
Unrealised
profit/(loss)
US$ Equivalent
Unrealised
profit/(loss)Value dateSalesPurchases
Sector Breakdown as at 31 August 2009
Finance 17.63
Information technology 17.35
Healthcare 14.95
Consumer staples 11.69
Energy 11.04
Consumer discretionary 7.70
Telecommunication services 6.10
Industrials 5.93
Materials 3.14
Utilities 2.43
Other net assets 2.04 __________
100.00 __________
% of net
assets

Audited Annual Report and Accounts 183
The notes on pages 236 to 244 form an integral part of these financial statements.
US Dollar Core Bond Fund
Portfolio of Investments 31 August 2009
BONDS
Canada
US$1,775,000 California State 5.45% 1/4/2015 1,817,742 0.65
US$275,000 Canadian Natural Resources 6.25%
15/3/2038 289,224 0.10
US$425,000 Kinder Morgan Finance 5.35% 5/1/2011 428,188 0.15
US$40,000 Nova Chemicals 6.5% 15/1/2012 39,000 0.01
US$1,000,000 Province of Ontario Canada 4.1%
16/6/2014 1,049,148 0.38
US$25,000 Rogers Communications 7.5%
15/3/2015 29,293 0.01
US$210,000 Shaw Communications 7.2%
15/12/2011 220,763 0.08 ___________ ______
3,873,358 1.38 ___________ ______
Denmark
US$1,105,000 Danske Bank A/S '144A' 2.5%
10/5/2012 1,112,722 0.40 ___________ ______
France
US$1,150,000 Societe Financement de l'Economie
Francaise '144A' 3.375% 5/5/2014 1,175,600 0.42 ___________ ______
Germany
€950,000 Bundesrepublik Deutschland 4%
4/1/2037 1,358,075 0.49
€400,000 Bundesrepublik Deutschland 4.25%
4/7/2039 600,651 0.21
US$1,850,000 Kreditanstalt fuer Wiederaufbau 3.5%
10/3/2014 1,912,599 0.68
US$190,000 Landwirtschaftliche Rentenbank 4%
2/2/2015 197,344 0.07
US$95,000 Landwirtschaftliche Rentenbank
4.125% 15/7/2013 100,406 0.04
US$210,000 Landwirtschaftliche Rentenbank
4.375% 15/1/2013 223,577 0.08
US$330,000 Landwirtschaftliche Rentenbank
5.25% 2/7/2012 359,762 0.13 ___________ ______
4,752,414 1.70 ___________ ______
International
US$295,000 Corporacion Andina de Fomento
6.875% 15/3/2012 313,974 0.11 ___________ ______
Israel
US$40,000 Israel Government AID Bond 5.5%
18/9/2033 42,292 0.01
US$75,000 Israel Government AID Bond 5.5%
26/4/2024 81,065 0.03 ___________ ______
123,357 0.04 ___________ ______
Japan
US$720,000 Japan Finance 2% 24/6/2011 728,714 0.26 ___________ ______
Netherlands
US$535,000 Deutsche Telekom International
Finance BV 8.5% 15/6/2010 563,803 0.20
US$1,025,000 Shell International Finance 4%
21/3/2014 1,073,644 0.39 ___________ ______
1,637,447 0.59 ___________ ______
Norway
US$625,000 Eksportfinans ASA 5.5% 25/5/2016 665,642 0.24 ___________ ______
Spain
US$875,000 Telefonica Emisiones 4.949%
15/1/2015 927,305 0.33 ___________ ______
Switzerland
US$700,000 UBS (Stamford Branch) 5.75%
25/4/2018 686,519 0.24
US$525,000 UBS (Stamford Branch) 5.875%
20/12/2017 519,336 0.19 ___________ ______
1,205,855 0.43 ___________ ______
United Kingdom
US$100,000 Barclays Bank '144A' 5.926%
15/12/2016 (Perpetual) 70,000 0.02
US$500,000 Barclays Bank '144A' 7.434%
15/12/2017 (Perpetual) 412,500 0.15
US$205,000 Barclays Bank '144A' 8.55%
15/6/2011 (Perpetual) 180,400 0.06
US$840,000 BP Capital Markets 3.125%
10/3/2012 865,912 0.31
US$250,000 Royal Bank of Scotland '144A'
2.625% 11/5/2012 254,218 0.09
US$1,470,000 Vodafone Group 4.15% 10/6/2014 1,504,447 0.54
US$20,000 Vodafone Group 5% 16/12/2013 21,258 0.01 ___________ ______
3,308,735 1.18 ___________ ______
United States
US$600,000 ACE Securities '2005-ASP1 M1' FRN
25/9/2035 119,934 0.04
US$663,247 ACE Securities '2006-NC3 A2A' FRN
25/12/2036 510,444 0.18
US$276,363 Aegis Asset Backed Securities Trust
'2006-1 A1' FRN 25/1/2037 267,998 0.10
US$265,000 Allstate Life Global Funding Trusts
5.375% 30/4/2013 279,561 0.10
US$82,705 American Airlines Pass Through Trust
2003-01 3.857% 9/7/2010 79,500 0.03
US$85,000 Arch Western Finance 6.75% 1/7/2013 82,025 0.03
US$189,085 Asset Backed Funding Certificates
'2006-OPT3 A3A' FRN 25/11/2036 184,474 0.07
US$875,000 AT&T 5.5% 1/2/2018 920,168 0.33
US$500,000 AT&T 6.4% 15/5/2038 536,224 0.19
US$200,000 AT&T 6.5% 1/9/2037 217,684 0.08
US$210,000 Ball 7.125% 1/9/2016 211,050 0.08
US$210,000 Ball 7.375% 1/9/2019 210,000 0.07
US$52,233 Banc of America Alternative Loan Trust
'2004-7 4A1' 5% 25/8/2019 49,205 0.02
US$1,600,000 Banc of America Commercial Mortgage
'2001-1 B' 6.674% 15/4/2036 1,613,368 0.58
US$320,000 Banc of America Commercial Mortgage
'2002-2 A3' 5.118% 11/7/2043 328,388 0.12
US$215,000 Banc of America Commercial Mortgage
'2002-PB2 A4' 6.186% 11/6/2035 225,071 0.08
US$1,405,000 Banc of America Commercial Mortgage
'2003-2 A3' FRN 11/3/2041 1,444,429 0.52
US$190,000 Banc of America Commercial Mortgage
'2004-1 A3' 4.429% 10/11/2039 194,238 0.07
US$170,000 Banc of America Commercial Mortgage
'2004-6 A3' 4.512% 10/12/2042 157,957 0.06
US$175,000 Bank of America 4.875% 15/9/2012 179,531 0.06
US$390,000 Bank of America 5.75% 1/12/2017 378,734 0.14
US$1,205,000 Bank of New York Mellon 4.3%
15/5/2014 1,268,595 0.45
Transferable Securities Admitted to an Official Stock Exchange
Listing or Dealt in on Another Regulated Market
Holding Description Value (US$) %
Transferable Securities Admitted to an Official Stock Exchange
Listing or Dealt in on Another Regulated Market
Holding Description Value (US$) %

184 BlackRock Global Funds (BGF)
US Dollar Core Bond Fund continued
Portfolio of Investments 31 August 2009
US$227,214 BCAP Trust '2007-AA1 1A1' FRN
25/2/2047 128,844 0.05
US$891,101 Bear Stearns Adjustable Rate Mortgage
Trust '2005-4 3A1' FRN 25/8/2035 746,693 0.27
US$83,541 Bear Stearns Asset Backed Securities
Trust '2005-4 A' FRN 25/1/2036 78,018 0.03
US$136,106 Bear Stearns Asset Backed Securities
Trust '2005-HE10 A2' FRN 25/11/2035 130,979 0.05
US$269,447 Bear Stearns Asset Backed Securities
Trust '2005-SD1 1A2' FRN 25/7/2027 250,198 0.09
US$228,644 Bear Stearns Asset Backed Securities
Trust '2006-HE8 1A1' FRN 25/10/2036 221,787 0.08
US$81,782 Bear Stearns Asset Backed Securities
Trust '2006-HE10 21A1' FRN
25/12/2036 73,324 0.03
US$117,120 Bear Stearns Asset Backed Securities
Trust '2007-HE1 21A1' FRN 25/1/2037 100,129 0.04
US$39,792 Bear Stearns Commercial Mortgage
Securities '1998-C1 A2' 6.44%
16/6/2030 39,773 0.01
US$35,000 Bear Stearns Commercial Mortgage
Securities '2004-PWR6 A6' 4.825%
11/11/2041 33,606 0.01
US$715,000 Bear Stearns Commercial Mortgage
Securities '2007-PW17 A4' 5.694%
11/6/2050 631,378 0.23
US$385,000 Bear Stearns FRN 19/7/2010 386,172 0.14
US$145,000 Belo 6.75% 30/5/2013 126,875 0.05
US$25,000 Belvoir Land 'A-1' 5.27% 15/12/2047 16,747 0.01
US$210,000 Board of Trustees of The Leland Stanford
Junior University 4.75% 1/5/2019 219,680 0.08
US$280,000 Boeing 6% 15/3/2019 308,277 0.11
US$300,000 Carolina Power & Light 5.3% 15/1/2019 319,869 0.11
US$33,164 Carrington Mortgage Loan Trust
'2006-NC4 A1' FRN 25/10/2036 31,624 0.01
US$654,288 Carrington Mortgage Loan Trust
'2006-NC5 A1' FRN 25/1/2037 622,982 0.22
US$186,196 Carrington Mortgage Loan Trust
'2007-RFC1 A1' FRN 25/12/2036 156,766 0.06
US$2,430,000 Cellco Partnership / Verizon Wireless
Capital '144A' 3.75% 20/5/2011 2,510,534 0.90
US$635,000 Centex 5.125% 1/10/2013 609,600 0.22
US$219,589 Chase Commercial Mortgage Securities
'2000-1 A2' 7.757% 15/4/2032 222,805 0.08
US$69,939 Chase Commercial Mortgage Securities
'2000-3 A2' 7.319% 15/10/2032 72,568 0.03
US$565,000 Chevron 3.95% 3/3/2014 591,455 0.21
US$375,000 Chicago Ill Met Wtr Reclamation Dist
GTR Chicago 5.72% 1/12/2038 397,091 0.14
US$600,000 Chubb 6.375% 29/3/2067 519,000 0.19
US$25,000 Cincinnati Bell 7.25% 15/7/2013 24,375 0.01
US$75,000 CIT Group 4.25% 1/2/2010 45,866 0.02
US$80,000 CIT Group 4.75% 15/12/2010 48,036 0.02
US$70,000 CIT Group 5.4% 13/2/2012 40,500 0.01
US$90,000 CIT Group 5.8% 28/7/2011 53,217 0.02
US$4,200,000 Citibank NA 1.375% 10/8/2011 4,209,561 1.50
US$1,890,000 Citigroup 2.125% 30/4/2012 1,909,570 0.68
US$335,000 Citigroup Commercial Mortgage Trust
'2006-C5 A4' 5.431% 15/10/2049 301,260 0.11
US$1,170,000 Citigroup Funding 2.125% 12/7/2012 1,178,559 0.42
US$312,928 Citigroup Mortgage Loan Trust
'2007-AMC3 A2A' FRN 25/3/2037 240,631 0.09
US$20,000 Citizens Communications 6.25%
15/1/2013 19,100 0.01
US$680,000 Coca-Cola Enterprises 3.75% 1/3/2012 708,698 0.25
US$4,000 Colorado Interstate Gas 6.8%
15/11/2015 4,414 0.00
US$145,000 Comcast 5.3% 15/1/2014 154,214 0.05
US$15,000 Comcast 5.85% 15/1/2010 15,275 0.01
US$345,000 Comcast 6.5% 15/1/2017 377,482 0.13
US$50,000 Comcast 6.5% 15/11/2035 53,873 0.02
US$2,700,000 Comcast Cable Communications 6.75%
30/1/2011 2,872,819 1.03
US$50,000 Comcast Cable Communications
Holdings 8.375% 15/3/2013 57,752 0.02
US$405,000 Comcast Cable Holdings 9.8% 1/2/2012 458,351 0.16
US$1,395,000 ConocoPhillips 4.6% 15/1/2015 1,482,173 0.53
US$235,000 Continental Airlines 6.563% 15/2/2012 215,965 0.08
US$12,947 Countrywide Alternative Loan Trust
'2004-18CB 2A5' FRN 25/9/2034 11,303 0.00
US$1,599,422 Countrywide Alternative Loan Trust
'2005-21CB A17' 6% 25/6/2035 1,443,553 0.52
US$34,552 Countrywide Alternative Loan Trust
'2006-OC8 2A1A' FRN 25/11/2036 34,065 0.01
US$525,442 Countrywide Alternative Loan Trust
'2006-OC9 A1' FRN 25/12/2036 480,580 0.17
US$54,901 Countrywide Alternative Loan Trust
'2006-OC10 2A1' FRN 25/11/2036 50,715 0.02
US$73,101 Countrywide Alternative Loan Trust
'2006-OC11 2A1' FRN 25/1/2037 65,461 0.02
US$50,059 Countrywide Asset-Backed Certificates
'2003-BC3 A2' FRN 25/9/2033 33,812 0.01
US$47,238 Countrywide Asset-Backed Certificates
'2004-5 A' FRN 25/10/2034 32,166 0.01
US$255,685 Countrywide Asset-Backed Certificates
'2004-13 AF4' 4.583% 25/1/2033 216,074 0.08
US$19,743 Countrywide Asset-Backed Certificates
'2006-14 2A1' FRN 25/2/2037 19,414 0.01
US$28,180 Countrywide Asset-Backed Certificates
'2006-18 2A1' FRN 25/3/2037 27,850 0.01
US$14,053 Countrywide Asset-Backed Certificates
'2006-19 2A1' FRN 25/3/2037 13,771 0.00
US$56,540 Countrywide Asset-Backed Certificates
'2006-20 2A1' FRN 25/4/2047 53,861 0.02
US$469,889 Countrywide Asset-Backed Certificates
'2006-22 2A1' FRN 25/5/2047 444,299 0.16
US$120,340 Countrywide Asset-Backed Certificates
'2006-25 2A1' FRN 25/6/2037 115,707 0.04
US$173,192 Countrywide Asset-Backed Certificates
'2007-1 2A1' FRN 25/7/2037 163,149 0.06
US$12,468 Countrywide Home Loan Mortgage
Pass Through Trust '2004-29 1A1'
FRN 25/2/2035 7,934 0.00
US$459,309 Countrywide Home Loan Mortgage
Pass Through Trust '2006-OA5 2A1'
FRN 25/4/2046 227,942 0.08
US$966,549 Countrywide Home Loan Mortgage
Pass Through Trust '2007-16 A1'
6.5% 25/10/2037 792,584 0.28
US$425,000 COX Communications '144A' 8.375%
1/3/2039 530,013 0.19
US$185,000 COX Communications 7.125% 1/10/2012 205,008 0.07
US$15,000 COX Communications 7.75% 1/11/2010 15,963 0.01
US$415,000 Credit Suisse Mortgage Capital
Certificates '2006-8 3A1' 6%
25/10/2021 275,124 0.10
US$185,000 CS First Boston Mortgage Securities
'2002-CKP1 A3' 6.439% 15/12/2035 194,975 0.07
US$215,000 CS First Boston Mortgage Securities
'2002-CKS4 A2' 5.183% 15/11/2036 221,427 0.08
US$518,196 CS First Boston Mortgage Securities
'2002-CP5 A1' 4.106% 15/12/2035 526,525 0.19
US$350,000 Daimler Chrysler Auto Trust '2006-D A4'
4.94% 8/2/2012 360,721 0.13
Transferable Securities Admitted to an Official Stock Exchange
Listing or Dealt in on Another Regulated Market
Holding Description Value (US$) %
Transferable Securities Admitted to an Official Stock Exchange
Listing or Dealt in on Another Regulated Market
Holding Description Value (US$) %

Audited Annual Report and Accounts 185
The notes on pages 236 to 244 form an integral part of these financial statements.
US Dollar Core Bond Fund continued
Portfolio of Investments 31 August 2009
US$210,000 Dallas Texasa Area Rapid Tranport
sales Tax Receivables 5.999%
1/12/2044 226,909 0.08
US$170,000 DR Horton 5.625% 15/9/2014 157,250 0.06
US$580,000 DR Horton 6.875% 1/5/2013 571,300 0.20
US$405,000 Eli Lilly & Co 3.55% 6/3/2012 423,487 0.15
US$25,000 Enterprise Products Operating 4.95%
1/6/2010 25,419 0.01
US$620,000 Expedia 7.456% 15/8/2018 632,400 0.23
US$1,100,000 Fannie Mae '4 9/09' 4% TBA 1,107,563 0.40
US$1,900,000 Fannie Mae '4 9/09' 4% TBA 1,850,125 0.66
US$600,000 Fannie Mae '4.5 9/09' 4.5% TBA 615,938 0.22
US$1,100,000 Fannie Mae '5.5 9/09' 5.5% TBA 1,156,203 0.41
US$900,000 Fannie Mae '5.5 9/09' 5.5% TBA 935,297 0.33
US$13,400,000 Fannie Mae '6 9/09' 6% TBA 14,084,660 5.03
US$2,100,000 Fannie Mae '6.5 9/09' 6.5% TBA 2,244,704 0.80
US$50,617 Fannie Mae Pool '254548' 5.5%
1/12/2032 52,944 0.02
US$5,764 Fannie Mae Pool '361040' 6% 1/6/2011 5,801 0.00
US$9,364 Fannie Mae Pool '420781' 6% 1/6/2013 9,996 0.00
US$28,400 Fannie Mae Pool '555250' 6% 1/2/2018 30,352 0.01
US$124,797 Fannie Mae Pool '626014' 5.5%
1/2/2017 133,060 0.05
US$112,737 Fannie Mae Pool '725162' 6% 1/2/2034 119,559 0.04
US$247,050 Fannie Mae Pool '725206' 5.5%
1/2/2034 258,295 0.09
US$577,837 Fannie Mae Pool '725704' 6% 1/8/2034 612,807 0.22
US$112,185 Fannie Mae Pool '725946' 5.5%
1/11/2034 117,222 0.04
US$294,077 Fannie Mae Pool '735649' 6% 1/12/2032 312,241 0.11
US$5,172,445 Fannie Mae Pool '735667' 5% 1/7/2035 5,320,597 1.90
US$59,741 Fannie Mae Pool '745412' 5.5%
1/12/2035 62,423 0.02
US$70,836 Fannie Mae Pool '764221' 5.5%
1/5/2034 74,016 0.03
US$43,253 Fannie Mae Pool '786489' 5.5%
1/7/2034 45,195 0.02
US$645,978 Fannie Mae Pool '793181' 6% 1/7/2019 688,351 0.25
US$1,027,264 Fannie Mae Pool '794412' 6% 1/9/2019 1,094,646 0.39
US$728,216 Fannie Mae Pool '801782' 6% 1/2/2037 767,280 0.27
US$568,506 Fannie Mae Pool '804967' 6% 1/1/2020 605,796 0.22
US$74,538 Fannie Mae Pool '806549' FRN 1/1/2035 75,513 0.03
US$19,918 Fannie Mae Pool '821570' 6% 1/5/2020 21,203 0.01
US$21,990 Fannie Mae Pool '821758' 6% 1/6/2020 23,408 0.01
US$45,701 Fannie Mae Pool '845490' 6% 1/6/2021 48,628 0.02
US$3,128,941 Fannie Mae Pool '888283' 5% 1/8/2034 3,220,517 1.15
US$1,429,309 Fannie Mae Pool '888340' 5% 1/8/2036 1,471,141 0.53
US$902,358 Fannie Mae Pool '888532' FRN
1/4/2037 950,003 0.34
US$1,158,503 Fannie Mae Pool '888817' 5.5%
1/8/2037 1,210,511 0.43
US$1,673,512 Fannie Mae Pool '889109' 5% 1/1/2023 1,745,630 0.62
US$5,874,194 Fannie Mae Pool '889928' 5.5%
1/9/2038 6,114,625 2.18
US$25,345 Fannie Mae Pool '900114' 6% 1/8/2036 26,736 0.01
US$6,040,226 Fannie Mae Pool '930814' 5.5%
1/2/2035 6,315,162 2.26
US$99,228 Fannie Mae Pool '931324' 4.5%
1/6/2039 99,605 0.04
US$329,203 Fannie Mae Pool '935298' 4.5%
1/7/2039 330,454 0.12
US$813,284 Fannie Mae Pool '935299' 4.5%
1/7/2039 816,374 0.29
US$768,113 Fannie Mae Pool '945869' 6% 1/8/2037 809,317 0.29
US$2,295,933 Fannie Mae Pool '952204' 6%
1/11/2037 2,419,092 0.86
US$3,339,015 Fannie Mae Pool '961556' 6% 1/2/2038 3,515,332 1.26
US$683,845 Fannie Mae Pool '970156' 6% 1/3/2038 719,955 0.26
US$2,105,299 Fannie Mae Pool '995158' 4.5%
1/12/2020 2,187,538 0.78
US$389,300 Fannie Mae Pool 'AA4088' 4.5%
1/7/2039 390,779 0.14
US$723,726 Fannie Mae Pool 'AA4089' 4.5%
1/7/2039 726,475 0.26
US$24,693 Fannie Mae Pool 'AA5308' 4.5%
1/4/2039 24,787 0.01
US$49,841 Fannie Mae Pool 'AA7071' 4.5%
1/6/2039 50,030 0.02
US$134,544 Fannie Mae Pool 'AA8165' 4.5%
1/6/2039 135,055 0.05
US$1,486,806 Fannie Mae Pool 'AA8747' 4.5%
1/7/2039 1,492,454 0.53
US$300,000 Fannie Mae Pool 'AA9120' 4.5%
1/7/2039 301,140 0.11
US$1,166,561 Fannie Mae Pool 'AA9715' 4.5%
1/7/2039 1,170,993 0.42
US$1,456,583 Fannie Mae Pool 'AC1246' 4.5%
1/8/2039 1,462,116 0.52
US$595,000 Fannie Mae Pool 'AC1579' 4.5%
1/8/2039 597,260 0.21
US$1,700,000 Fannie Mae Pool 'AC1640' 4.5%
1/9/2039 1,706,458 0.61
US$4,600,167 Fannie Mae Pool 'AD0054' 5%
1/2/2024 4,798,405 1.71
US$129,651 Fannie Mae REMICS '2006-9 DA' 5.5%
25/7/2025 133,192 0.05
US$450,000 Federal Home Loan Bank of Chicago
5.625% 13/6/2016 445,574 0.16
US$2,315,000 Federal Home Loan Banks 5.375%
15/5/2019 2,570,150 0.92
US$1,000,000 Federal Home Loan Mortgage 1.75%
15/6/2012 1,000,001 0.36
US$2,505,000 Federal Home Loan Mortgage 2.125%
21/9/2012 2,522,084 0.90
US$3,005,000 Federal Home Loan Mortgage 3%
28/7/2014 3,029,605 1.08
US$5,600,000 Federal National Mortgage Association
1.75% 10/8/2012 5,597,247 2.00
US$1,925,000 Federal National Mortgage Association
2% 9/1/2012 1,949,948 0.70
US$5,400,000 Federal National Mortgage Association
3% 16/9/2014 5,446,099 1.95
US$95,000 Federal National Mortgage Association
5.125% 2/1/2014 100,400 0.04
US$710,000 Federal National Mortgage Association
5.25% 1/8/2012 758,151 0.27
US$685,000 First Data 9.875% 24/9/2015 590,813 0.21
US$108,900 First Horizon Asset Securities
'2005-AR3 3A1' FRN 25/8/2035 97,015 0.03
US$33,272 First Union National Bank Commercial
Mortgage '1999-C4 A2' 7.39%
15/12/2031 33,260 0.01
US$134,731 First Union National Bank Commercial
Mortgage '2000-C2 A2' 7.202%
15/10/2032 139,367 0.05
US$185,000 First Union National Bank Commercial
Mortgage '2001-C4 A2' 6.223%
12/12/2033 194,066 0.07
Transferable Securities Admitted to an Official Stock Exchange
Listing or Dealt in on Another Regulated Market
Holding Description Value (US$) %
Transferable Securities Admitted to an Official Stock Exchange
Listing or Dealt in on Another Regulated Market
Holding Description Value (US$) %

186 BlackRock Global Funds (BGF)
US Dollar Core Bond Fund continued
Portfolio of Investments 31 August 2009
US$1,178,074 First Union National Bank-Bank of
America Commercial Mortgage
Trust '2001-C1 A2' 6.136%
15/3/2033 1,218,391 0.44
US$30,000 Florida Power & Light 4.95% 1/6/2035 29,424 0.01
US$300,000 Florida Power & Light 5.95% 1/2/2038 336,376 0.12
US$200,000 Florida Power 6.4% 15/6/2038 234,468 0.08
US$9,794 Ford Credit Auto Owner Trust
'2006-B A3' 5.26% 15/10/2010 9,815 0.00
US$165,000 Ford Motor Credit 9.75% 15/9/2010 166,817 0.06
US$1,200,000 Freddie Mac '5.5 9/09' 5.5% TBA 1,248,563 0.45
US$1,663,013 Freddie Mac Gold Pool 'A16228' 5%
1/11/2033 1,712,464 0.61
US$292 Freddie Mac Gold Pool 'A20431' 6%
1/1/2034 309 0.00
US$452,124 Freddie Mac Gold Pool 'A35615' 6%
1/6/2035 477,931 0.17
US$1,071,181 Freddie Mac Gold Pool 'A60686' 5.5%
1/5/2037 1,116,424 0.40
US$712,538 Freddie Mac Gold Pool 'A71578' 5.5%
1/1/2038 742,633 0.27
US$763,729 Freddie Mac Gold Pool 'G12601' 5%
1/2/2022 798,312 0.29
US$754,144 Freddie Mac Gold Pool 'G12633' 5%
1/4/2022 788,292 0.28
US$842,704 Freddie Mac Gold Pool 'G12814' 5%
1/10/2022 878,756 0.31
US$883,800 Freddie Mac Gold Pool 'G12840' 5%
1/11/2022 921,610 0.33
US$630,189 Freddie Mac Non Gold Pool '1G1288'
FRN 1/11/2036 663,707 0.24
US$986,257 Freddie Mac Non Gold Pool '1G2511'
FRN 1/5/2036 1,034,607 0.37
US$954,315 Freddie Mac Non Gold Pool '1J0309'
FRN 1/2/2037 1,007,802 0.36
US$982,113 Freddie Mac Non Gold Pool '1J1095'
FRN 1/5/2038 1,020,188 0.36
US$63,737 Freddie Mac REMICS '2825 VP' 5.5%
15/6/2015 68,172 0.02
US$64,610 Freddie Mac REMICS '2984 NA' 5.5%
15/4/2026 66,157 0.02
US$569,523 Freddie Mac REMICS '3068 VA' 5.5%
15/10/2016 599,447 0.21
US$41,299 Freddie Mac REMICS '3084 BC' 5.5%
15/12/2024 42,289 0.01
US$175,000 Ge Capital Commercial Mortgage
'2001-2 A4' 6.29% 11/8/2033 182,970 0.07
US$200,000 Ge Capital Commercial Mortgage
'2002-1A A3' 6.269% 10/12/2035 210,466 0.07
US$1,687,523 Ge Capital Commercial Mortgage
'2005-C1 A2' 4.353% 10/6/2048 1,686,455 0.60
US$870,000 General Electric Capital 2.125%
21/12/2012 873,940 0.31
US$1,850,000 General Electric Capital 2.625%
28/12/2012 1,890,020 0.68
US$1,185,000 General Electric Capital 5%
15/11/2011‡ 1,241,722 0.44
US$30,000 General Electric Capital 5% 10/4/2012 31,035 0.01
US$40,000 General Electric Capital 5.875%
15/2/2012 42,543 0.01
US$400,000 General Electric Capital 6.15% 7/8/2037 367,883 0.13
US$775,000 General Electric Capital 6.375%
15/11/2067 626,753 0.22
US$5,400,000 Ginnie Mae '5 9/09' 5% TBA 5,544,283 1.98
US$2,200,000 Ginnie Mae '6 9/09' 6% TBA 2,315,157 0.83
US$575,000 GlaxoSmithKline Capital 4.85%
15/5/2013 614,621 0.22
US$178,430 GMAC Commercial Mortgage
Securities '2000-C1 A2' 7.724%
15/3/2033 179,914 0.06
US$1,290,000 GMAC Commercial Mortgage Securities
'2001-C1 B' 6.67% 15/4/2034 1,305,826 0.47
US$1,100,000 GMAC Commercial Mortgage Securities
'2004-C3 AAB' 4.702% 10/12/2041 1,099,627 0.39
US$60,000 Goldman Sachs Capital II 5.793%
1/6/2012 (Perpetual) 44,100 0.02
US$1,065,000 Goldman Sachs Group 3.625%
1/8/2012 1,086,378 0.39
US$2,025,468 Government National Mortgage
Association '2009-26 SC' FRN
16/1/2038 203,748 0.07
US$1,985,000 Greenwich Capital Commercial Funding
'2007-GG9 A2' 5.381% 10/3/2039 1,963,351 0.70
US$1,350,000 GS Mortgage Securities II '2004-GG2 A5'
5.279% 10/8/2038 1,325,167 0.47
US$950,000 GS Mortgage Securities II '2006-GG6 A2'
5.506% 10/4/2038 954,749 0.34
US$615,858 GSR Mortgage Loan Trust '2005-AR4 6A1'
FRN 25/7/2035 549,273 0.20
US$91,075 Harborview Mortgage Loan Trust
'2005-10 2A1A' FRN 19/11/2035 46,569 0.02
US$1,084,817 Harborview Mortgage Loan Trust
'2006-11 A1A' FRN 19/12/2036 572,959 0.20
US$50,315 Harley-Davidson Motorcycle Trust
'2006-2 A2' 5.35% 15/3/2013 51,895 0.02
US$170,520 Harley-Davidson Motorcycle Trust
'2007-1 A3' 5.22% 15/3/2012 172,727 0.06
US$155,000 Harrah's Operating '144A' 10%
15/12/2018 107,725 0.04
US$575,000 Historic TW 9.125% 15/1/2013 669,749 0.24
US$1,540,000 Honda Auto Receivables Owner
Trust '2009-2 A3' 2.79% 15/1/2013 1,561,457 0.56
US$490,000 Honeywell International 3.875%
15/2/2014 508,052 0.18
US$130,000 Icahn Enterprises Finance 7.125%
15/2/2013 122,850 0.04
US$10,000 Icahn Enterprises Finance 8.125%
1/6/2012 9,900 0.00
US$54,789 Impac Secured Assets CMN Owner Trust
'2004-3 1A4' FRN 25/11/2034 27,527 0.01
US$30,469 Indymac Index Mortgage Loan Trust
'2006-AR27 1A1' FRN 25/10/2036 29,210 0.01
US$188,649 Indymac Index Mortgage Loan Trust
'2006-AR41 A3' FRN 25/2/2037 89,945 0.03
US$43,223 Indymac Residential Asset Backed Trust
'2006-E 2A1' FRN 25/4/2037 41,754 0.01
US$55,640 Irwin Home Equity '2005-C 1A1' FRN
25/4/2030 52,035 0.02
US$220,000 iStar Financial 5.65% 15/9/2011 121,000 0.04
US$825,000 JP Morgan Chase Capital XXV 6.8%
1/10/2037 777,471 0.28
US$210,000 JP Morgan Chase Commercial
Mortgage Securities '2001-C1 A3'
5.857% 12/10/2035 220,453 0.08
US$1,375,000 JP Morgan Chase Commercial
Mortgage Securities '2001-CIB2 A3'
6.429% 15/4/2035 1,407,379 0.50
US$345,000 JP Morgan Chase Commercial
Mortgage Securities '2006-LDP8 A4'
5.399% 15/5/2045 286,282 0.10
Transferable Securities Admitted to an Official Stock Exchange
Listing or Dealt in on Another Regulated Market
Holding Description Value (US$) %
Transferable Securities Admitted to an Official Stock Exchange
Listing or Dealt in on Another Regulated Market
Holding Description Value (US$) %
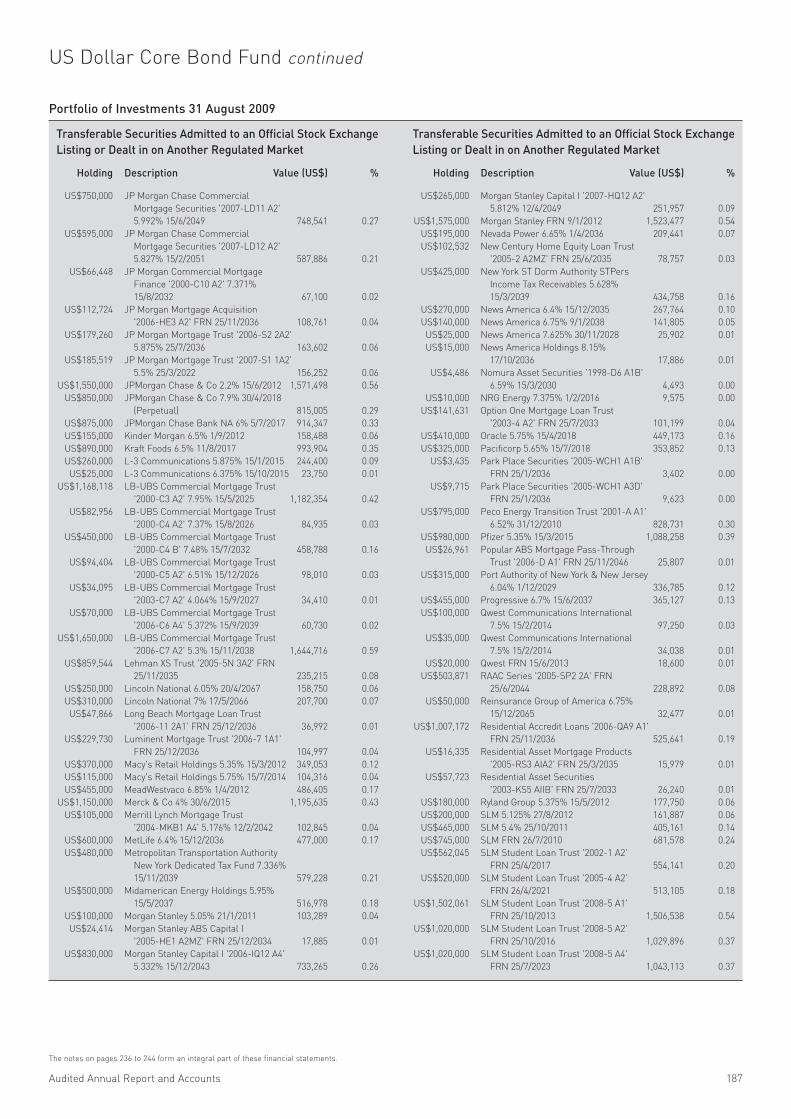
Audited Annual Report and Accounts 187
The notes on pages 236 to 244 form an integral part of these financial statements.
US Dollar Core Bond Fund continued
Portfolio of Investments 31 August 2009
US$750,000 JP Morgan Chase Commercial
Mortgage Securities '2007-LD11 A2'
5.992% 15/6/2049 748,541 0.27
US$595,000 JP Morgan Chase Commercial
Mortgage Securities '2007-LD12 A2'
5.827% 15/2/2051 587,886 0.21
US$66,448 JP Morgan Commercial Mortgage
Finance '2000-C10 A2' 7.371%
15/8/2032 67,100 0.02
US$112,724 JP Morgan Mortgage Acquisition
'2006-HE3 A2' FRN 25/11/2036 108,761 0.04
US$179,260 JP Morgan Mortgage Trust '2006-S2 2A2'
5.875% 25/7/2036 163,602 0.06
US$185,519 JP Morgan Mortgage Trust '2007-S1 1A2'
5.5% 25/3/2022 156,252 0.06
US$1,550,000 JPMorgan Chase & Co 2.2% 15/6/2012 1,571,498 0.56
US$850,000 JPMorgan Chase & Co 7.9% 30/4/2018
(Perpetual) 815,005 0.29
US$875,000 JPMorgan Chase Bank NA 6% 5/7/2017 914,347 0.33
US$155,000 Kinder Morgan 6.5% 1/9/2012 158,488 0.06
US$890,000 Kraft Foods 6.5% 11/8/2017 993,904 0.35
US$260,000 L-3 Communications 5.875% 15/1/2015 244,400 0.09
US$25,000 L-3 Communications 6.375% 15/10/2015 23,750 0.01
US$1,168,118 LB-UBS Commercial Mortgage Trust
'2000-C3 A2' 7.95% 15/5/2025 1,182,354 0.42
US$82,956 LB-UBS Commercial Mortgage Trust
'2000-C4 A2' 7.37% 15/8/2026 84,935 0.03
US$450,000 LB-UBS Commercial Mortgage Trust
'2000-C4 B' 7.48% 15/7/2032 458,788 0.16
US$94,404 LB-UBS Commercial Mortgage Trust
'2000-C5 A2' 6.51% 15/12/2026 98,010 0.03
US$34,095 LB-UBS Commercial Mortgage Trust
'2003-C7 A2' 4.064% 15/9/2027 34,410 0.01
US$70,000 LB-UBS Commercial Mortgage Trust
'2006-C6 A4' 5.372% 15/9/2039 60,730 0.02
US$1,650,000 LB-UBS Commercial Mortgage Trust
'2006-C7 A2' 5.3% 15/11/2038 1,644,716 0.59
US$859,544 Lehman XS Trust '2005-5N 3A2' FRN
25/11/2035 235,215 0.08
US$250,000 Lincoln National 6.05% 20/4/2067 158,750 0.06
US$310,000 Lincoln National 7% 17/5/2066 207,700 0.07
US$47,866 Long Beach Mortgage Loan Trust
'2006-11 2A1' FRN 25/12/2036 36,992 0.01
US$229,730 Luminent Mortgage Trust '2006-7 1A1'
FRN 25/12/2036 104,997 0.04
US$370,000 Macy's Retail Holdings 5.35% 15/3/2012 349,053 0.12
US$115,000 Macy's Retail Holdings 5.75% 15/7/2014 104,316 0.04
US$455,000 MeadWestvaco 6.85% 1/4/2012 486,405 0.17
US$1,150,000 Merck & Co 4% 30/6/2015 1,195,635 0.43
US$105,000 Merrill Lynch Mortgage Trust
'2004-MKB1 A4' 5.176% 12/2/2042 102,845 0.04
US$600,000 MetLife 6.4% 15/12/2036 477,000 0.17
US$480,000 Metropolitan Transportation Authority
New York Dedicated Tax Fund 7.336%
15/11/2039 579,228 0.21
US$500,000 Midamerican Energy Holdings 5.95%
15/5/2037 516,978 0.18
US$100,000 Morgan Stanley 5.05% 21/1/2011 103,289 0.04
US$24,414 Morgan Stanley ABS Capital I
'2005-HE1 A2MZ' FRN 25/12/2034 17,885 0.01
US$830,000 Morgan Stanley Capital I '2006-IQ12 A4'
5.332% 15/12/2043 733,265 0.26
US$265,000 Morgan Stanley Capital I '2007-HQ12 A2'
5.812% 12/4/2049 251,957 0.09
US$1,575,000 Morgan Stanley FRN 9/1/2012 1,523,477 0.54
US$195,000 Nevada Power 6.65% 1/4/2036 209,441 0.07
US$102,532 New Century Home Equity Loan Trust
'2005-2 A2MZ' FRN 25/6/2035 78,757 0.03
US$425,000 New York ST Dorm Authority STPers
Income Tax Receivables 5.628%
15/3/2039 434,758 0.16
US$270,000 News America 6.4% 15/12/2035 267,764 0.10
US$140,000 News America 6.75% 9/1/2038 141,805 0.05
US$25,000 News America 7.625% 30/11/2028 25,902 0.01
US$15,000 News America Holdings 8.15%
17/10/2036 17,886 0.01
US$4,486 Nomura Asset Securities '1998-D6 A1B'
6.59% 15/3/2030 4,493 0.00
US$10,000 NRG Energy 7.375% 1/2/2016 9,575 0.00
US$141,631 Option One Mortgage Loan Trust
'2003-4 A2' FRN 25/7/2033 101,199 0.04
US$410,000 Oracle 5.75% 15/4/2018 449,173 0.16
US$325,000 Pacificorp 5.65% 15/7/2018 353,852 0.13
US$3,435 Park Place Securities '2005-WCH1 A1B'
FRN 25/1/2036 3,402 0.00
US$9,715 Park Place Securities '2005-WCH1 A3D'
FRN 25/1/2036 9,623 0.00
US$795,000 Peco Energy Transition Trust '2001-A A1'
6.52% 31/12/2010 828,731 0.30
US$980,000 Pfizer 5.35% 15/3/2015 1,088,258 0.39
US$26,961 Popular ABS Mortgage Pass-Through
Trust '2006-D A1' FRN 25/11/2046 25,807 0.01
US$315,000 Port Authority of New York & New Jersey
6.04% 1/12/2029 336,785 0.12
US$455,000 Progressive 6.7% 15/6/2037 365,127 0.13
US$100,000 Qwest Communications International
7.5% 15/2/2014 97,250 0.03
US$35,000 Qwest Communications International
7.5% 15/2/2014 34,038 0.01
US$20,000 Qwest FRN 15/6/2013 18,600 0.01
US$503,871 RAAC Series '2005-SP2 2A' FRN
25/6/2044 228,892 0.08
US$50,000 Reinsurance Group of America 6.75%
15/12/2065 32,477 0.01
US$1,007,172 Residential Accredit Loans '2006-QA9 A1'
FRN 25/11/2036 525,641 0.19
US$16,335 Residential Asset Mortgage Products
'2005-RS3 AIA2' FRN 25/3/2035 15,979 0.01
US$57,723 Residential Asset Securities
'2003-KS5 AIIB' FRN 25/7/2033 26,240 0.01
US$180,000 Ryland Group 5.375% 15/5/2012 177,750 0.06
US$200,000 SLM 5.125% 27/8/2012 161,887 0.06
US$465,000 SLM 5.4% 25/10/2011 405,161 0.14
US$745,000 SLM FRN 26/7/2010 681,578 0.24
US$562,045 SLM Student Loan Trust '2002-1 A2'
FRN 25/4/2017 554,141 0.20
US$520,000 SLM Student Loan Trust '2005-4 A2'
FRN 26/4/2021 513,105 0.18
US$1,502,061 SLM Student Loan Trust '2008-5 A1'
FRN 25/10/2013 1,506,538 0.54
US$1,020,000 SLM Student Loan Trust '2008-5 A2'
FRN 25/10/2016 1,029,896 0.37
US$1,020,000 SLM Student Loan Trust '2008-5 A4'
FRN 25/7/2023 1,043,113 0.37
Transferable Securities Admitted to an Official Stock Exchange
Listing or Dealt in on Another Regulated Market
Holding Description Value (US$) %
Transferable Securities Admitted to an Official Stock Exchange
Listing or Dealt in on Another Regulated Market
Holding Description Value (US$) %

188 BlackRock Global Funds (BGF)
US Dollar Core Bond Fund continued
Portfolio of Investments 31 August 2009
US$990,894 Soundview Home Equity Loan Trust
'2005-OPT3 A4' FRN 25/11/2035 823,667 0.29
US$1,935,268 Structured Adjustable Rate Mortgage
Loan Trust '2007-3 2A1' 5.732%
25/4/2037 1,331,041 0.48
US$841,793 Structured Asset Investment Loan Trust
'2003-BC6 M1' FRN 25/7/2033 549,229 0.20
US$680,521 Structured Asset Investment Loan Trust
'2003-BC7 M1' FRN 25/7/2033 419,969 0.15
US$58,213 Structured Asset Investment Loan Trust
'2004-8 M4' FRN 25/9/2034 27,539 0.01
US$104,410 Structured Asset Securities
'2004-23XS 2A1' FRN 25/1/2035 63,586 0.02
US$41,244 Structured Asset Securities
'2005-GEL2 A' FRN 25/4/2035 35,392 0.01
US$394,342 Structured Asset Securities
'2006-BC3 A2' FRN 25/10/2036 368,173 0.13
US$92,618 Structured Asset Securities
'2006-BC6 A2' FRN 25/1/2037 84,256 0.03
US$129,193 Structured Asset Securities
'2007-BC1 A2' FRN 25/2/2037 120,074 0.04
US$50,000 TCI Communications 8.75% 1/8/2015 59,815 0.02
US$85,000 Tennessee Gas Pipeline 7% 15/10/2028 89,467 0.03
US$375,000 Texas Competitive Electric Holdings 'B'
10.25% 1/11/2015 250,313 0.09
US$1,000,000 Texas State 5.517% 1/4/2039 1,024,140 0.37
US$440,000 Time Warner 6.875% 1/5/2012 480,821 0.17
US$55,000 Time Warner 7.57% 1/2/2024 57,997 0.02
US$15,000 Time Warner 7.625% 15/4/2031 16,509 0.01
US$265,000 Time Warner Cable 5.85% 1/5/2017 278,177 0.10
US$75,000 Time Warner Cable 6.55% 1/5/2037 79,123 0.03
US$485,000 Travelers 6.25% 15/3/2037 412,841 0.15
US$485,000 Tyson Foods 10.5% 1/3/2014 543,200 0.19
US$1,140,000 US Treasury Bond 1% 31/8/2011 1,139,466 0.41
US$195,000 US Treasury Bond 1.75% 15/8/2012 196,210 0.07
US$1,600,000 US Treasury Bond 2.375% 31/8/2014 1,594,500 0.57
US$19,170,000 US Treasury Bond 3.25% 31/7/2016 19,393,150 6.93
US$3,725,000 US Treasury Bond 3.5% 15/2/2039 3,282,946 1.17
US$18,490,000 US Treasury Bond 3.625% 15/8/2019 18,771,684 6.71
US$2,140,000 US Treasury Bond 4.5% 15/8/2039 2,247,835 0.80
US$4,800,000 US Treasury Strip Principal 0%
15/8/2020 3,065,541 1.10
US$1,775,000 USAA Auto Owner Trust '2006-4 A4'
4.98% 15/10/2012 1,837,455 0.66
US$200,000 USB Capital IX 6.189% 15/4/2011
(Perpetual) 146,000 0.05
US$750,000 Verizon Communications 6.35%
1/4/2019 831,840 0.30
US$1,150,000 Verizon Communications 8.75%
1/11/2018 1,453,336 0.52
US$50,000 Verizon Virginia 4.625% 15/3/2013 51,502 0.02
US$595,000 Viacom 5.75% 30/4/2011 630,252 0.23
US$1,300,000 Wachovia Bank Commercial Mortgage
Trust '2005-C20 A6A' 5.11%
15/7/2042 1,289,507 0.46
US$970,000 Wachovia Bank Commercial Mortgage
Trust '2006-C28 A4' 5.572%
15/10/2048 823,411 0.29
US$325,000 Wachovia Bank NA 6.6% 15/1/2038 337,666 0.12
US$1,384,887 WaMu Mortgage Pass Through
Certificates '2003-S7 A1' 4.5%
25/8/2018 1,366,879 0.49
US$389,827 WaMu Mortgage Pass Through
Certificates '2006-AR11 1A' FRN
25/9/2046 174,036 0.06
US$2,023,048 WaMu Mortgage Pass Through
Certificates '2006-AR18 1A1' FRN
25/1/2037 1,421,341 0.51
US$474,789 WaMu Mortgage Pass Through
Certificates '2007-OA4 1A' FRN
25/5/2047 197,675 0.07
US$411,118 Washington Mutual Alternative Mortgage
Pass-Through Certificates
'2007-OC1 A1' FRN 25/1/2047 185,569 0.07
US$520,596 Wells Fargo Mortgage Backed Securities
Trust '2005-AR15 2A1' FRN 25/9/2035 467,776 0.17
US$585,950 Wells Fargo Mortgage Backed Securities
Trust '2006-AR12 2A1' FRN 25/9/2036 444,814 0.16
US$2,344,308 Wells Fargo Mortgage Backed Securities
Trust '2006-AR15 A1' FRN
25/10/2036 1,735,529 0.62
US$400,000 Wendy's International 6.25%
15/11/2011 401,000 0.14
US$20,000 Windstream 8.125% 1/8/2013 20,100 0.01
US$160,000 Wyeth 6% 15/2/2036 174,506 0.06
US$120,000 Xcel Energy 6.5% 1/7/2036 129,050 0.05
US$100,000 XTO Energy 6.75% 1/8/2037 109,588 0.04 ___________ ______
290,508,998 103.82 ___________ ______
Total Bonds 310,334,121 110.90 ___________ ______
FUND MORTGAGE BACKED SECURITIES
United States
(US$1,100,000) Fannie Mae '4.5 9/09' 4.5% TBA (1,102,406) (0.39)
(US$8,500,000) Fannie Mae '5 9/09' 5% TBA (8,805,393) (3.15)
(US$12,700,000) Fannie Mae '6 10/09' 6% TBA (13,301,269) (4.75)
(US$2,200,000) Fannie Mae '6 9/09' 6% TBA (2,335,094) (0.83)
(US$3,400,000) Freddie Mac '5 9/09' 5% TBA (3,512,157) (1.26)
(US$400,000) Freddie Mac '6 9/09' 6% TBA (420,813) (0.15)___________ ______
Total Fund Mortgage Backed Securities (29,477,132) (10.53)___________ ______
Total Transferable Securities Admitted
to an Official Stock Exchange Listing or
Dealt in on Another Regulated Market 280,856,989 100.37 ___________ ______
Unquoted Securities
BONDS
France
US$890,000 Dexia Credit Local '144A' 2.375%
23/9/2011 902,028 0.33 ___________ ______
Netherlands
US$1,400,000 LeasePlan '144A' 3% 7/5/2012 1,430,406 0.51 ___________ ______
United States
US$25,000 Atlantic Marine Corps Communities
'144A' 5.343% 1/12/2050 16,982 0.01
US$30,000 BAE Systems Holdings '144A' 5.2%
15/8/2015 30,935 0.01
US$475,000 Lehman Brothers Holdings 6.5%
19/7/2017 48 0.00
US$20,000 Lehman Brothers Holdings Capital
Trust V 5.857% 31/5/2012 (Perpetual) 2 0.00
US$1,125,000 Metropolitan Life Global Funding I
'144A' 5.125% 10/4/2013 1,155,491 0.41
Transferable Securities Admitted to an Official Stock Exchange
Listing or Dealt in on Another Regulated Market
Holding Description Value (US$) %
Transferable Securities Admitted to an Official Stock Exchange
Listing or Dealt in on Another Regulated Market
Holding Description Value (US$) %

Audited Annual Report and Accounts 189
The notes on pages 236 to 244 form an integral part of these financial statements.
(‡) Securities given in guarantee, see Note 12, for further details.
US Dollar Core Bond Fund continued
Portfolio of Investments 31 August 2009
US$600,000 Metropolitan Life Global Funding I
'144A' 5.125% 10/6/2014 624,062 0.22
US$140,000 Motiva Enterprises '144A' 5.2%
15/9/2012 144,203 0.05
US$340,000 Rainbow National Services '144A'
10.375% 1/9/2014 357,425 0.13
US$850,000 Roche Holdings '144A' 5% 1/3/2014 917,865 0.33
US$195,000 Roche Holdings '144A' FRN 25/2/2011 197,928 0.07
US$1,385,000 First Union National Bank Commercial
Mortgage '1999-C4 D' 7.936%
15/12/2031 1,381,985 0.49
US$350,000 Impac Secured Assets CMN Owner
Trust '2004-3 M1' FRN 25/11/2034 54,307 0.02
US$230,692 Morgan Stanley ABS Capital
I '2006-HE8 A2A' FRN 25/10/2036 219,649 0.08
US$3,942 TIAA Retail Commercial Trust
'2001-C1A A4' 6.68% 19/6/2031 3,953 0.00 ___________ ______
5,104,835 1.82 ___________ ______
Total Unquoted Securities 7,437,269 2.66 ___________ ______
Total Portfolio 288,294,258 103.03
Other Net Liabilities (8,471,385) (3.03)___________ ______
Total Net Assets (US$) 279,822,873 100.00 ___________ ______
Unquoted Securities
Holding Description Value (US$) %
Unquoted Securities
Holding Description Value (US$) %
Open Forward Foreign Exchange Transactions as at 31 August 2009
Core Fund
US$2,538,046 €1,822,000 16/9/2009 (65,434)__________
Net unrealised loss (65,434)__________
Note: The net unrealised loss attributed to this transaction is included in the Statement
of Net Assets (see Note 2c).
Value date
Unrealised
loss
US$SalesPurchases
Open Futures Contracts as at 31 August 2009
94 US Treasury 5 Year Note (CBT) December 2009 10,801,187
(21) US Treasury 10 Year Note December 2009 (2,451,094)
(31) US Long Bond (CBT) December 2009 (3,691,906)
(116) US Treasury 2 Year Note (CBT) December 2009 (25,066,875)__________
Total commitment (20,408,688)__________
Note: The net unrealised loss of US$14,553 attributed to these transactions is included
in the Statement of Net Assets (see Note 2c).
Value
US$
Expiration
dateContracts/Description
Number
of Contracts
Value US$
Unrealised loss US$Description
NominalValue
US$ 10,300,000 Fund purchases a call option (expiring
17/12/2009) to enter into an Interest
Rate Swap (Morgan Stanley). If exercised
Fund receives 2.75% Fixed semi annually
from 21/6/2010; and pays Floating
US$ Libor 3-month -BBA quarterly
from 21/3/2010; (17/12/2009) (23,690) 48,410 ___________ _________
(23,690) 48,410 ___________ _________
Swaptions as at 31 August 2009
Note: Swaptions are included in the Statement of Net Assets (see Note 2c).

190 BlackRock Global Funds (BGF)
US Dollar Core Bond Fund continued
Unrealised profit/(loss)
US$DescriptionNominal
Value
Unrealised profit/(loss)
US$DescriptionNominal
Value
US$1,050,000 Interest Rate Swaps (JP Morgan)
(Fund receives Floating USD Libor 3 Month;
and pays Fixed 4.2425%) (15/8/2020) (26,497)
US$3,445,000 Interest Rate Swaps (JP Morgan)
(Fund receives Floating USD Libor 3 Month;
and pays Fixed 4.4192%) (15/8/2020) (126,939)
US$580,000 Credit Default Swaps (JP Morgan)
(Fund receives default protection on
DR Horton Inc 5.375% 15/6/2012;
and pays Fixed 5.04%) (20/6/2013) (62,294)
US$400,000 Credit Default Swaps (JP Morgan)
(Fund receives default protection on
Wendy's International Inc 6.2% 15/6/2014;
and pays Fixed 2.9%) (20/12/2011) (10,990)
US$105,000 Credit Default Swaps (Citibank)
(Fund receives default protection on
Expedia Inc 7.456% 15/8/2018;
and pays Fixed 5%) (20/9/2013) (13,349)
US$315,000 Credit Default Swaps (Citibank)
(Fund receives default protection on
Expedia Inc 7.456% 15/8/2018;
and pays Fixed 5%) (20/9/2013) (40,048)
US$290,000 Credit Default Swaps (JP Morgan)
(Fund receives default protection on
Centex Corp 5.25% 15/6/2015;
and pays Fixed 6.92%) (20/12/2010) (24,904)
US$200,000 Credit Default Swaps (Barclays)
(Fund receives default protection on
Expedia Inc 7.456% 15/8/2018;
and pays Fixed 5.18%) (20/9/2013) (26,785)
US$245,000 Credit Default Swaps (Barclays)
(Fund receives default protection on
Tyson Foods Inc 1/4/2016;
and pays Fixed 4.1%) (20/3/2014) (21,572)
US$180,000 Credit Default Swaps (JP Morgan)
(Fund receives default protection on
Ryland Group, Inc. 5.375% 15/1/2015;
and pays Fixed 4.51%) (20/6/2012) (12,606)
US$240,000 Credit Default Swaps (Barclays)
(Fund receives default protection on
Tyson Foods Inc 1/4/2016;
and pays Fixed 4.22%) (20/3/2014) (22,322)
US$170,000 Credit Default Swaps (JP Morgan)
(Fund receives default protection on
D R Horton Inc 5.375% 15/6/2012;
and pays Fixed 5.07%) (20/9/2014) (23,273)
US$425,000 Credit Default Swaps (Credit Suisse)
(Fund receives default protection on
Knight Inc 6.5% 1/9/2012;
and pays Fixed 1.8%) (20/1/2011) (3,006)
US$170,000 Credit Default Swaps (Barclays)
(Fund receives default protection on
First Data Corp 9.875% 24/9/2015;
and pays Fixed 5%) (20/12/2015) (22,849)
US$180,000 Credit Default Swaps (JP Morgan)
(Fund receives default protection on
First Data Corp 9.875% 24/9/2015;
and pays Fixed 5%) (20/12/2015) (24,193)
US$145,000 Credit Default Swaps (Credit Suisse)
(Fund receives default protection on
First Data Corp 9.875% 24/9/2015;
and pays Fixed 5%) (20/12/2015) (19,505)
US$190,000 Credit Default Swaps (Barclays)
(Fund receives default protection on
First Data Corp 9.875% 24/9/2015;
and pays Fixed 5%) (20/12/2015) (25,558)
US$110,000 Credit Default Swaps (Morgan Stanley)
(Fund receives default protection on
iStar Financials Inc. 5.95% 15/10/2013;
and pays Fixed 5%) (20/9/2011) 17,961
US$110,000 Credit Default Swaps (Morgan Stanley)
(Fund receives default protection on
iStar Financials Inc. 5.95% 15/10/2013;
and pays Fixed 5%) (20/09/2011) 18,454
US$40,000 Credit Default Swaps (Citibank)
(Fund receives default protection on
Nova Chemicals Corp 15/11/2013;
and pays Fixed 5%) (20/3/2012) (1,268)
US$635,000 Credit Default Swaps (Deutsche Bank)
(Fund receives default protection on
Centex Corp 5.25% 15/6/2015;
and pays Fixed 4.37%) (20/12/2013) (94,845)
US$95,000 Credit Default Swaps (Morgan Stanley)
(Fund receives default protection on
Macys Retail Holdings Inc 7.45% 15/7/2017;
and pays Fixed 8%) (20/6/2012) (11,572)
US$455,000 Credit Default Swaps (Deutsche Bank)
(Fund receives default protection on
MeadWestvaco Corp 7.95% 15/2/2031;
and pays Fixed 1.2%) (20/06/2012) (5,898)
US$275,000 Credit Default Swaps (Morgan Stanley)
(Fund receives default protection on
Macys Retail Holdings Inc 7.45% 15/7/2017;
and pays Fixed 7.5%) (20/06/2012) (29,931)
US$145,000 Credit Default Swaps (Barclays)
(Fund receives default protection on
Belo Corp. 7.75% 01/6/2027;
and pays Fixed 5%) (20/6/2013) (9,577)
US$115,000 Credit Default Swaps (Morgan Stanley)
(Fund receives default protection on
Macys Retail Holdings Inc 7.45% 15/7/2017;
and pays Fixed 1%) (20/9/2014) 5,204
US$155,000 Credit Default Swaps (Morgan Stanley)
(Fund receives default protection on
Knight Inc 6.5% 1/9/2012;
and pays Fixed 1%) (20/9/2012) (562)
US$800,000 Interest Rate Swaps (Deutsche Bank)
(Fund receives Fixed 5.409%;
and pays Floating USD Libor 3 Month)
(30/4/2027) 146,469
US$2,300,000 Interest Rate Swaps (Bank of America)
(Fund receives Fixed 4.948%;
and pays Floating USD Libor 3 Month)
(12/12/2011) 233,618
US$7,200,000 Interest Rate Swaps (Deutsche Bank)
(Fund receives Floating USD Libor 3 Month;
and pays Fixed 5.762%) (16/7/2017) (1,193,551)
US$9,900,000 Interest Rate Swaps (Citibank)
(Fund receives Fixed 5.272%;
and pays Floating USD Libor 3 Month)
(6/8/2012) 942,777
US$10,000,000 Interest Rate Swaps (Credit Suisse)
(Fund receives Fixed 5.065%;
and pays Floating USD Libor 3 Month)
(28/8/2012) 904,360
US$7,800,000 Interest Rate Swaps (Barclays)
(Fund receives Fixed 2.895%;
and pays Floating USD Libor 3 Month)
(17/9/2010) 180,500
US$3,800,000 Interest Rate Swaps (Citibank)
(Fund receives Floating USD Libor 3 Month;
and pays Fixed 2.5313%) (16/3/2014) 17,841
Swaps as at 31 August 2009

Audited Annual Report and Accounts 191
The notes on pages 236 to 244 form an integral part of these financial statements.
US Dollar Core Bond Fund continued
Unrealised profit/(loss)
US$DescriptionNominal
Value
Unrealised profit/(loss)
US$DescriptionNominal
Value
US$3,440,000 Interest Rate Swaps (Deutsche Bank)
(Fund receives Floating USD Libor 3 Month;
and pays Fixed 2.247%) (19/12/2012) (12,363)
US$8,000,000 Interest Rate Swaps (Goldman Sachs)
(Fund receives Fixed 1.54408%;
and pays Floating USD Libor 3 Month)
(6/8/2011) 36,192
US$2,900,000 Interest Rate Swaps (JP Morgan)
(Fund receives Fixed 3.2575%;
and pays Floating USD Libor 3 Month) (12/8/2014) 65,473
US$3,000,000 Interest Rate Swaps (Deutsche Bank)
(Fund receives Floating USD Libor 3 Month;
and pays Fixed 2.8525%) (20/8/2014) (10,242)
US$10,000,000 Interest Rate Swaps (Credit Suisse)
(Fund receives Floating USD Libor 3 Month;
and pays Fixed 2.90214%) (20/8/2014) (57,440)
US$6,700,000 Interest Rate Swaps (Morgan Stanley)
(Fund receives Fixed 1.4275%;
and pays Floating USD Libor 3 Month)
(24/8/2011) 12,114
US$6,500,000 Interest Rate Swaps (Deutsche Bank)
(Fund receives Fixed 3.68345%;
and pays Floating USD Libor 3 Month
(25/8/2019) 22,133
US$2,900,000 Interest Rate Swaps (Morgan Stanley)
(Fund receives Fixed 3.72915%;
and pays Floating USD Libor 3 Month)
(18/8/2019) 21,347
US$1,200,000 Interest Rate Swaps (Morgan Stanley)
(Fund receives Floating USD Libor 3 Month;
and pays Fixed 4.12542%) (28/8/2039) (8,069)
US$4,100,000 Interest Rate Swaps (Deutsche Bank)
(Fund receives Floating USD Libor 3 Month;
and pays Fixed 2.275%) (6/4/2014) 69,479 __________
751,914 __________
Swaps as at 31 August 2009
Note: The total market value of US$960,670 of these transactions is included in the Statement of Net Assets (see Note 2c).

192 BlackRock Global Funds (BGF)
BONDS
Bermuda
US$2,430,000 Digicel Group '144A' 8.875% 15/1/2015 2,174,850 0.29
US$4,053,000 Digicel Group '144A' 9.125% 15/1/2015 3,627,435 0.47
US$780,000 Intelsat Subsidiary Holding '144A'
8.875% 15/1/2015 783,900 0.10
US$970,000 Intelsat Subsidiary Holding 8.5%
15/1/2013 979,700 0.13
US$470,000 Intelsat Subsidiary Holding 8.875%
15/1/2015 473,525 0.06 ___________ ______
8,039,410 1.05 ___________ ______
Canada
US$4,985,000 Angiotech Pharmaceuticals FRN
1/12/2013 4,212,325 0.55
US$3,465,000 Cascades 7.25% 15/2/2013 3,291,750 0.43
US$565,000 Catalyst Paper 7.375% 1/3/2014 226,000 0.03
US$220,000 Catalyst Paper 8.625% 15/6/2011 128,150 0.02
US$2,065,000 Kinder Morgan Finance 5.35%
5/1/2011 2,080,488 0.27
US$1,055,000 North American Energy Partners
8.75% 1/12/2011 970,600 0.13
US$2,560,000 Novelis '144A' 11.5% 15/2/2015 2,528,000 0.33
US$500,000 Novelis 7.25% 15/2/2015 407,500 0.05
US$1,900,000 OPTI Canada 7.875% 15/12/2014 1,220,750 0.16
US$3,470,000 OPTI Canada 8.25% 15/12/2014 2,264,175 0.29
US$390,000 Russel Metals 6.375% 1/3/2014 343,200 0.04
US$1,055,000 Teck Resources 10.25% 15/5/2016 1,165,774 0.15
US$5,075,000 Teck Resources 10.75% 15/5/2019 5,798,187 0.76 ___________ ______
24,636,899 3.21 ___________ ______
Cayman Islands
US$2,160,000 Transocean 'A' 1.625% 15/12/2037 2,092,499 0.27 ___________ ______
Denmark
US$2,175,000 Nordic Telephone Holdings ApS '144A'
8.875% 1/5/2016 2,218,500 0.29 ___________ ______
France
US$1,515,000 Cie Generale de Geophysique-Veritas
'144A' 9.5% 15/5/2016 1,560,450 0.20
US$200,000 Cie Generale de Geophysique-Veritas
7.5% 15/5/2015 190,500 0.03
US$2,730,000 Cie Generale de Geophysique-Veritas
7.75% 15/5/2017 2,593,500 0.34
€124,000 Crown European Holdings 6.25%
1/9/2011 178,072 0.02 ___________ ______
4,522,522 0.59 ___________ ______
Iceland
€150,000 Glitnir Banki HF 0% 27/1/2010
(Defaulted) 31,079 0.00
€140,000 Glitnir Banki HF 3% 30/6/2010
(Defaulted) 42,010 0.01
€160,000 Glitnir Banki HF 4.375% 5/2/2010
(Defaulted) 48,012 0.01 ___________ ______
121,101 0.02 ___________ ______
Ireland
€215,723 BCM Ireland Preferred Equity '144A'
11.856% 15/2/2017 110,970 0.01
US$240,000 Elan Finance 8.875% 1/12/2013 231,600 0.03 ___________ ______
342,570 0.04 ___________ ______
Luxembourg
US$1,290,000 Evraz Group '144A' 8.875% 24/4/2013 1,185,188 0.15
US$860,000 Evraz Group '144A' 9.5% 24/4/2018 769,700 0.10
US$640,000 Orascom Telecom Finance '144A'
7.875% 8/2/2014 579,200 0.08 ___________ ______
2,534,088 0.33 ___________ ______
Marshall Island
US$317,000 Navios Maritime Holdings 9.5%
15/12/2014 279,753 0.03 ___________ ______
Netherlands
US$1,599,000 Ford Capital 9.5% 1/6/2010 1,622,985 0.21 ___________ ______
Sweden
US$176,904 Corral Finans AB '144A' 4.213%
15/4/2010 136,658 0.02 ___________ ______
United Kingdom
US$1,115,000 Anglo American Capital '144A' 9.375%
8/4/2019 1,274,570 0.17
€6,000,000 FCE Bank 7.125% 16/1/2012 7,780,454 1.01
€2,900,000 FCE Bank 7.125% 15/1/2013 3,667,316 0.48
€615,000 FCE Bank FRN 30/9/2009 873,292 0.11
US$435,000 Inmarsat Finance 0% 15/11/2012
(Step-up coupon) 454,575 0.06
US$250,000 Inmarsat Finance 7.625% 30/6/2012 250,000 0.03
US$1,605,000 Vedanta Resources '144A' 9.5%
18/7/2018 1,512,712 0.20
US$750,000 Virgin Media Finance 8.75%
15/4/2014 765,938 0.10
US$600,000 Virgin Media Finance 9.125%
15/8/2016 610,500 0.08 ___________ ______
17,189,357 2.24 ___________ ______
United States
US$815,000 Accuride 8.5% 1/2/2015 158,925 0.02
US$541,982 AES Eastern Energy 9% 2/1/2017 520,303 0.07
US$2,220,000 AES Eastern Energy 9.67% 2/1/2029 1,909,200 0.25
US$1,580,390 AES Ironwood 8.857% 30/11/2025 1,418,400 0.18
US$329,420 AES Red Oak 8.54% 30/11/2019 304,714 0.04
US$560,000 AES Red Oak 9.2% 30/11/2029 502,600 0.07
US$3,135,000 Affinion Group 10.125% 15/10/2013 3,131,081 0.41
US$1,155,000 Affinion Group '144A' 10.125%
15/10/2013 1,153,556 0.15
US$1,725,000 Aleris International 10% 15/12/2016 12,938 0.00
US$3,870,000 Alliance Data Systems 1.75% 1/8/2013 3,502,350 0.46
US$860,000 Altria Group 10.2% 6/2/2039 1,155,496 0.15
US$415,000 American Airlines Pass Through Trust
1999 7.324% 15/10/2009 408,775 0.05
US$810,000 American Pacific 9% 1/2/2015 735,075 0.10
US$185,000 American Tower 7.125% 15/10/2012 187,775 0.02
US$1,065,000 Ames True Temper FRN 15/1/2012 942,525 0.12
US$1,645,000 AMR HoldCo / EmCare HoldCo 10%
15/2/2015 1,727,250 0.23
US$1,000,000 ARAMARK FRN 1/2/2015 857,500 0.11
US$3,225,000 Arch Coal '144A' 8.75% 1/8/2016 3,233,063 0.42
US$4,670,000 Arch Western Finance 6.75% 1/7/2013 4,506,550 0.59
US$1,460,000 Asbury Automotive Group 7.625%
15/3/2017 1,204,500 0.16
US$1,405,000 Atlas Energy Operating / Atlas Energy
Finance 12.125% 1/8/2017 1,492,813 0.19
US$3,315,000 Atlas Energy Resources '144A' 10.75%
1/2/2018 3,364,725 0.44
US Dollar High Yield Bond Fund
Portfolio of Investments 31 August 2009
Transferable Securities Admitted to an Official Stock Exchange
Listing or Dealt in on Another Regulated Market
Holding Description Value (US$) %
Transferable Securities Admitted to an Official Stock Exchange
Listing or Dealt in on Another Regulated Market
Holding Description Value (US$) %

Audited Annual Report and Accounts 193
The notes on pages 236 to 244 form an integral part of these financial statements.
US$1,685,000 Atlas Pipeline Partners 8.75%
15/6/2018 1,373,275 0.18
US$1,490,000 Axcan Intermediate Holdings 12.75%
1/3/2016 1,564,500 0.20
US$190,000 Ball 6.625% 15/3/2018 180,975 0.02
US$1,600,000 Ball 7.125% 1/9/2016 1,608,000 0.21
US$1,600,000 Ball 7.375% 1/9/2019 1,600,000 0.21
US$470,000 Beazer Homes USA 4.625% 15/6/2024 390,100 0.05
US$645,000 Beazer Homes USA 8.125% 15/6/2016 396,675 0.05
US$3,080,000 Beazer Homes USA 8.375% 15/4/2012 2,356,200 0.31
US$275,000 Berry Petroleum 8.25% 1/11/2016 245,438 0.03
US$1,325,000 Berry Plastics FRN 15/2/2015 1,202,438 0.16
US$1,350,000 Berry Plastics Holding 8.875%
15/9/2014 1,194,750 0.16
US$565,000 Berry Plastics Holding FRN 15/9/2014 409,625 0.05
US$760,000 Bill Barrett 9.875% 15/7/2016 787,550 0.10
US$3,535,000 Biomet 10% 15/10/2017 3,729,425 0.49
US$4,110,000 Bio-Rad Laboratories '144A' 8%
15/9/2016 4,202,475 0.55
US$300,000 Bio-Rad Laboratories 6.125%
15/12/2014 285,750 0.04
US$390,000 Bio-Rad Laboratories 7.5% 15/8/2013 391,950 0.05
US$642,226 BMS Holdings '144A' 9.95438%
15/2/2012 19,267 0.00
US$505,000 Boise Cascade 7.125% 15/10/2014 340,875 0.04
US$2,025,000 Boyd Gaming 7.75% 15/12/2012 2,004,750 0.26
US$2,345,000 Broadview Networks Holdings 11.375%
1/9/2012 2,028,425 0.26
US$4,135,000 Brunswick '144A' 11.25% 1/11/2016 4,352,088 0.57
US$5,280,000 Cablevision Systems 8% 15/4/2012 5,372,400 0.70
US$267,000 California Steel Industries 6.125%
15/3/2014 244,305 0.03
US$4,335,000 Calpine Construction Finance '144A'
8% 1/6/2016 4,335,000 0.56
US$1,210,000 Catalent Pharma Solutions 9.5%
15/4/2015 986,150 0.13
US$1,135,000 CCH II / CCH II Capital 'B' 10.25%
15/9/2010 1,266,944 0.17
US$2,395,000 CCH II Capital 10.25% 15/9/2010 2,673,419 0.35
US$2,300,000 Charter Communications Operating
LLC / Charter Communications
Operating Capital '144A' 10.375%
30/4/2014 2,340,250 0.30
US$1,875,000 Chesapeake Energy 2.25% 15/12/2038 1,296,094 0.17
US$645,000 Chesapeake Energy 6.375% 15/6/2015 593,400 0.08
US$770,000 Chesapeake Energy 6.625% 15/1/2016 708,400 0.09
US$200,000 Chesapeake Energy 6.875% 15/11/2020 173,000 0.02
US$3,625,000 Chesapeake Energy 7.25% 15/12/2018 3,344,063 0.44
US$4,750,000 Chesapeake Energy 9.5% 15/2/2015 4,880,625 0.64
US$1,320,000 Cimarex Energy 7.125% 1/5/2017 1,227,600 0.16
US$8,590,000 Cincinnati Bell 7.25% 15/7/2013 8,375,250 1.09
US$600,000 CIT Group 4.75% 15/12/2010 360,269 0.05
US$3,245,000 CIT Group 5% 1/2/2015 1,822,090 0.24
US$365,000 CIT Group 5.2% 3/11/2010 219,306 0.03
US$420,000 CIT Group FRN 12/3/2010 260,925 0.03
US$615,000 Citizens Communications 6.25%
15/1/2013 587,325 0.08
US$1,100,000 Clear Channel Communications 5%
15/3/2012 544,500 0.07
US$270,000 Clear Channel Communications 5.75%
15/1/2013 103,950 0.01
US$4,765,000 Clear Channel Communications 11%
1/8/2016 1,191,250 0.16
US$1,215,000 Clearwater Paper '144A' 10.625%
15/6/2016 1,306,125 0.17
US$64,000 CMP Susquehanna 9.875% 15/5/2010 1,280 0.00
US$7,460,000 Community Health Systems 8.875%
15/7/2015 7,525,275 0.98
US$59,584 Continental Airlines 6.795% 2/8/2018 44,092 0.01
US$1,450,021 Continental Airlines 7.875% 2/7/2018 949,764 0.12
US$550,000 CPG International I 10.5% 1/7/2013 398,750 0.05
US$500,000 CPM Holdings '144A' 10.625% 1/9/2014 507,500 0.07
US$3,290,000 Cricket Communications 10%
15/7/2015 3,207,750 0.42
US$1,200,000 Cricket Communications '144A' 7.75%
15/5/2016 1,158,000 0.15
US$6,070,000 Cricket Communications 9.375%
1/11/2014 5,751,325 0.75
US$5,870,000 Crown Americas LLC / Crown Americas
Capital Corp II '144A' 7.625%
15/5/2017 5,825,975 0.76
US$1,550,000 Crown Castle International 9%
15/1/2015 1,619,750 0.21
US$2,560,000 CSC Holdings '144A' 8.5% 15/4/2014 2,604,800 0.34
US$135,000 CSC Holdings 7.625% 1/4/2011 137,363 0.02
US$385,000 Denbury Resources 7.5% 1/4/2013 384,038 0.05
US$1,200,000 Denbury Resources 7.5% 15/12/2015 1,176,000 0.15
US$3,270,000 Denbury Resources 9.75% 1/3/2016 3,458,025 0.45
US$1,140,000 DI Finance/DynCorp International 9.5%
15/2/2013 1,152,825 0.15
US$6,365,000 DJO Finance 10.875% 15/11/2014 6,174,050 0.80
US$2,720,000 Dollar General 10.625% 15/7/2015 3,032,800 0.40
US$1,850,000 Dollar General 11.875% 15/7/2017 2,081,250 0.27
US$850,000 Domtar 5.375% 1/12/2013 791,563 0.10
US$29,000 Domtar 7.875% 15/10/2011 29,943 0.00
US$515,000 Duane Reade '144A' 11.75% 1/8/2015 522,725 0.07
US$615,000 Dynegy Holdings 8.375% 1/5/2016 499,688 0.07
US$2,825,000 Dynegy Roseton/Danskammer Pass
Through Trust Series B 7.67%
8/11/2016 2,528,375 0.33
US$25,000 E*Trade Financial 12.5% 30/11/2017 25,313 0.00
US$79,000 E*Trade Financial 'A' 0% 31/8/2019 125,215 0.02
US$390,000 Echostar DBS 6.625% 1/10/2014 371,475 0.05
US$8,234,000 Echostar DBS 7% 1/10/2013 8,131,075 1.06
US$255,000 Edison Mission Energy 7.2% 15/5/2019 185,513 0.02
US$6,030,000 El Paso 8.25% 15/2/2016 6,120,450 0.80
US$1,601,241 Elwood Energy 8.159% 5/7/2026 1,404,921 0.18
US$1,295,000 Encore Acquisition 6% 15/7/2015 1,116,938 0.15
US$10,290,500 Energy Future Holdings 11.25%
1/11/2017 6,431,563 0.84
US$850,000 Erscrew Adelphia FRN 31/12/2049 23,375 0.00
US$2,590,000 EXCO Resources 7.25% 15/1/2011 2,547,913 0.33
US$6,325,000 First Data '144A' 11.25% 31/3/2016 4,838,625 0.63
US$3,790,000 First Data 9.875% 24/9/2015 3,268,875 0.43
US$400,000 Ford Motor Credit 5.7% 15/1/2010 398,548 0.05
US$1,830,000 Ford Motor Credit 7.8% 1/6/2012 1,694,700 0.22
US$2,730,000 Ford Motor Credit 8% 15/12/2016 2,409,871 0.31
US$2,000,000 Ford Motor Credit FRN 15/1/2010 1,982,500 0.26
US$1,770,000 Ford Motor Credit FRN 13/1/2012 1,489,013 0.19
US$300,000 Forest City Enterprises 7.625%
1/6/2015 189,750 0.02
US$4,275,000 Forest Oil '144A' 8.5% 15/2/2014 4,317,750 0.56
US$6,980,000 Forest Oil 7.25% 15/6/2019 6,578,650 0.86
US$700,000 Foundation PA Coal 7.25% 1/8/2014 684,250 0.09
US$2,020,000 Freeport-McMoRan Copper & Gold
8.375% 1/4/2017 2,108,799 0.27
US$770,000 Frontier Communications 8.25%
1/5/2014 769,038 0.10
US$685,000 FTI Consulting 7.75% 1/10/2016 671,300 0.09
US$1,995,000 Gaylord Entertainment 8% 15/11/2013 1,850,363 0.24
US$3,055,000 General Nutrition Centers FRN
15/3/2014 2,680,763 0.35
US Dollar High Yield Bond Fund continued
Portfolio of Investments 31 August 2009
Transferable Securities Admitted to an Official Stock Exchange
Listing or Dealt in on Another Regulated Market
Holding Description Value (US$) %
Transferable Securities Admitted to an Official Stock Exchange
Listing or Dealt in on Another Regulated Market
Holding Description Value (US$) %

194 BlackRock Global Funds (BGF)
US$1,680,000 General Nutrition Centers 10.75%
15/3/2015 1,596,000 0.21
US$250,000 Geo Group 8.25% 15/7/2013 250,000 0.03
US$4,980,000 Georgia-Pacific '144A' 8.25% 1/5/2016 5,079,600 0.66
US$585,000 Georgia-Pacific 7.7% 15/6/2015 573,300 0.07
US$1,915,000 Georgia-Pacific 8.125% 15/5/2011 1,953,300 0.25
US$4,030,000 GMAC '144A' 6.75% 1/12/2014 3,385,200 0.44
US$1,083,000 GMAC '144A' 6.875% 28/8/2012 966,578 0.13
US$4,300,000 GMAC '144A' 7.25% 2/3/2011 4,090,375 0.53
US$6,750,000 GMAC '144A' 8% 1/11/2031 5,332,500 0.69
US$6,263,000 GMAC '144A' FRN 1/12/2014 4,830,339 0.63
US$3,000,000 GMAC 6.75% 1/12/2014 2,447,964 0.32
US$1,990,000 Goodyear Tire & Rubber 7.857%
15/8/2011 1,990,000 0.26
US$5,570,000 Goodyear Tire & Rubber 8.625%
1/12/2011 5,681,400 0.74
US$7,440,000 Graphic Packaging International '144A'
9.5% 15/6/2017 7,663,200 1.00
US$647,000 Graphic Packaging International 8.5%
15/8/2011 650,235 0.08
US$455,000 Graphic Packaging International 9.5%
15/8/2013 459,550 0.06
US$810,000 Greif '144A' 7.75% 1/8/2019 801,900 0.10
US$540,000 Group 1 Automotive 2.25% 15/6/2036
(Step-up coupon) 388,125 0.05
US$2,000,000 Group 1 Automotive 8.25% 15/8/2013 1,815,000 0.24
US$370,000 Harland Clarke Holdings 9.5%
15/5/2015 316,350 0.04
US$310,000 Harland Clarke Holdings FRN 15/5/2015 223,200 0.03
US$3,355,000 Harrah's Operating '144A' 10%
15/12/2018 2,331,725 0.31
US$3,605,000 Harrah's Operating Escrow / Harrahs
Escrow '144A' 11.25% 1/6/2017 3,695,125 0.48
US$2,670,000 HCA 9.125% 15/11/2014 2,703,375 0.35
US$1,840,000 HCA 9.25% 15/11/2016 1,867,600 0.24
US$2,005,000 HCP 5.65% 15/12/2013 1,928,392 0.25
US$800,000 HCP 6% 30/1/2017 728,866 0.09
US$1,465,000 HCP 6.3% 15/9/2016 1,370,513 0.18
US$4,400,000 Healthsouth 10.75% 15/6/2016 4,686,000 0.61
US$7,810,000 Hologic 2% 15/12/2037
(Step-up coupon) 6,296,813 0.82
US$273,130 Homer City Funding 8.734% 1/10/2026 255,376 0.03
US$2,980,000 Horizon Lines 4.25% 15/8/2012 2,182,850 0.28
US$1,120,000 Hornbeck Offshore Services 6.125%
1/12/2014 1,026,200 0.13
US$3,885,000 Icahn Enterprises Finance 7.125%
15/2/2013 3,671,325 0.48
US$1,920,000 Icahn Enterprises Finance 8.125%
1/6/2012 1,900,800 0.25
US$695,000 Icahn Enterprises FRN 15/8/2013 538,625 0.07
US$1,920,000 Innophos 8.875% 15/8/2014 1,874,400 0.24
US$785,000 Intelsat 6.875% 15/1/2028 588,750 0.08
US$1,750,000 Intelsat 9.25% 15/8/2014 1,785,000 0.23
US$1,720,000 Intelsat 9.25% 15/6/2016 1,754,400 0.23
US$3,260,000 International Paper 7.5% 15/8/2021 3,296,875 0.43
US$1,825,000 International Paper 9.375% 15/5/2019 2,044,796 0.27
US$650,000 Ipalco Enterprises 8.625% 14/11/2011 666,250 0.09
US$4,500,000 iPCS FRN 1/5/2013 3,712,500 0.48
US$2,745,000 Iron Mountain 8.375% 15/8/2021 2,748,431 0.36
US$730,000 iStar Financial 'B' 5.125% 1/4/2011 401,500 0.05
US$915,000 Jabil Circuit 7.75% 15/7/2016 904,706 0.12
US$400,000 Jabil Circuit 8.25% 15/3/2018 397,000 0.05
US$4,600,000 Jarden 8% 1/5/2016 4,738,000 0.62
US$146,000 KB Home 6.375% 15/8/2011 147,095 0.02
US$1,450,000 KB Home 9.1% 15/9/2017 1,486,250 0.19
US$8,245,000 L-3 Communications 5.875%
15/1/2015 7,750,300 1.01
US$285,000 L-3 Communications 6.375%
15/10/2015 270,750 0.04
US$295,000 Lear 5.75% 1/8/2014 157,088 0.02
US$880,000 Lear 8.75% 1/12/2016 473,000 0.06
US$1,580,000 Lear 'B' 8.5% 1/12/2013 849,250 0.11
US$3,100,000 Leucadia National 7.125% 15/3/2017 2,859,750 0.37
US$1,975,000 Leucadia National 8.125% 15/9/2015 1,945,375 0.25
€3,350,000 Levi Strauss & Co 8.625% 1/4/2013 4,475,726 0.58
US$200,000 Liberty Media 3.125% 30/3/2023 193,750 0.02
US$1,197,000 Local Insight Regatta Holdings 11%
1/12/2017 341,145 0.04
US$1,000,000 Lorillard Tobacco 8.125% 23/6/2019 1,110,602 0.14
US$1,690,000 Macy's Retail Holdings 5.875%
15/1/2013 1,598,872 0.21
US$3,965,000 Massey Energy 3.25% 1/8/2015 3,018,356 0.39
US$625,000 Massey Energy 6.875% 15/12/2013 590,625 0.08
US$1,980,000 Mediacom Broadband 8.5% 15/10/2015 1,945,350 0.25
US$8,185,000 MetroPCS Wireless 9.25% 1/11/2014 8,062,225 1.05
US$2,360,000 MGM Mirage '144A' 11.125%
15/11/2017 2,551,750 0.33
US$3,390,000 MGM Mirage '144A' 13% 15/11/2013 3,805,275 0.50
US$1,410,000 Michaels Stores 11.375% 1/11/2016 1,219,650 0.16
US$965,000 Mobile Services Group / Mobile Storage
Group 9.75% 1/8/2014 969,825 0.13
US$3,150,000 Nalco '144A' 8.25% 15/5/2017 3,307,500 0.43
US$625,000 Network Communications 10.75%
1/12/2013 129,688 0.02
US$395,000 Newfield Exploration 6.625% 1/9/2014 383,150 0.05
US$670,000 Newfield Exploration 6.625% 15/4/2016 646,550 0.08
US$475,000 Newfield Exploration 7.125% 15/5/2018 466,688 0.06
US$8,645,000 NewPage 10% 1/5/2012 4,733,138 0.62
US$8,740,000 Nextel Communications 'E' 6.875%
31/10/2013 7,887,850 1.03
US$260,000 Nextel Communications 'F' 5.95%
15/3/2014 220,350 0.03
US$200,000 Nielsen Finance 0% 1/8/2011
(Step-up Coupon) 142,000 0.02
€300,000 Nielsen Finance 9% 1/8/2014 400,828 0.05
US$4,165,000 Nielsen Finance 10% 1/8/2014 3,946,338 0.51
US$1,500,000 Nielsen Finance 11.625% 1/2/2014 1,503,750 0.20
US$3,920,000 NII Holdings 2.75% 15/8/2025 3,836,700 0.50
US$2,590,000 Nortek 10% 1/12/2013 2,421,650 0.32
US$525,000 NRG Energy 7.25% 1/2/2014 511,875 0.07
US$12,097,000 NRG Energy 7.375% 1/2/2016 11,582,878 1.51
US$1,880,000 NRG Energy 8.5% 15/6/2019 1,837,700 0.24
US$1,065,000 Olin 8.875% 15/8/2019 1,080,975 0.14
US$155,000 Overseas Shipholding Group 7.5%
15/2/2024 123,613 0.02
US$755,000 Overseas Shipholding Group 8.75%
1/12/2013 724,800 0.09
€554,000 Owens Brockway Glass Container
6.75% 1/12/2014 775,788 0.10
US$500,000 Owens Brockway Glass Container
8.25% 15/5/2013 508,750 0.07
US$2,845,000 Owens-Brockway Glass Container
7.375% 15/5/2016 2,845,000 0.37
US$2,510,000 Peabody Energy 7.375% 1/11/2016 2,516,275 0.33
US$1,385,000 Peninsula Gaming '144A' 8.375%
15/8/2015 1,360,763 0.18
US$1,280,000 Penn National Gaming '144A' 8.75%
15/8/2019 1,273,600 0.17
US$2,130,000 Penn National Gaming 6.875%
1/12/2011 2,140,650 0.28
US$890,000 Penn Virginia 10.375% 15/6/2016 941,175 0.12
US$1,335,000 Penske Auto Group 7.75% 15/12/2016 1,181,474 0.15
US$1,655,000 PetroHawk Energy '144A' 10.5%
1/8/2014 1,770,850 0.23
US Dollar High Yield Bond Fund continued
Portfolio of Investments 31 August 2009
Transferable Securities Admitted to an Official Stock Exchange
Listing or Dealt in on Another Regulated Market
Holding Description Value (US$) %
Transferable Securities Admitted to an Official Stock Exchange
Listing or Dealt in on Another Regulated Market
Holding Description Value (US$) %

Audited Annual Report and Accounts 195
The notes on pages 236 to 244 form an integral part of these financial statements.
US$4,245,000 PetroHawk Energy 7.875% 1/6/2015 4,138,875 0.54
US$614,000 Pinnacle Entertainment 8.25%
15/3/2012 617,070 0.08
US$1,930,000 Ply Gem Industries 11.75% 15/6/2013 1,621,200 0.21
US$2,135,000 Pregis 12.375% 15/10/2013 1,932,175 0.25
US$870,000 Quiksilver 6.875% 15/4/2015 556,800 0.07
US$3,210,000 Qwest '144A' 8.375% 1/5/2016 3,258,150 0.42
US$2,120,000 Qwest 6.5% 1/6/2017 1,961,000 0.26
US$500,000 Qwest 7.5% 15/6/2023 427,499 0.06
US$2,555,000 Qwest Communications International
3.5% 15/11/2025 2,574,163 0.34
US$9,240,000 Qwest Communications International
7.5% 15/2/2014 8,985,900 1.17
US$2,780,000 Qwest FRN 15/6/2013 2,585,400 0.34
US$1,370,000 Range Resources 7.375% 15/7/2013 1,366,575 0.18
US$3,075,000 Range Resources 8% 15/5/2019 3,151,875 0.41
US$445,000 RBS Global / Rexnord 8.875% 1/9/2016 359,338 0.05
US$720,000 Realogy 10.5% 15/4/2014 432,000 0.06
US$1,499,000 Realogy 12.375% 15/4/2015 614,590 0.08
US$1,855,000 Regal Cinemas '144A' 8.625%
15/7/2019 1,892,100 0.25
US$4,120,000 Residential Capital 8.375% 30/6/2010 2,678,000 0.35
US$6,720,000 RITE AID '144A' 9.75% 12/6/2016 7,123,200 0.93
US$1,105,000 Rock-Tenn 5.625% 15/3/2013 1,033,175 0.13
US$805,000 Ryerson 12% 1/11/2015 756,700 0.10
US$605,000 Ryerson FRN 1/11/2014 514,250 0.07
US$230,000 Sabine Pass LNG 7.5% 30/11/2016 188,025 0.02
US$1,190,000 Sally Holdings 9.25% 15/11/2014 1,234,625 0.16
US$2,460,000 SandRidge Energy '144A' 8% 1/6/2018 2,189,400 0.29
US$1,800,000 SandRidge Energy '144A' 9.875%
15/5/2016 1,791,000 0.23
US$130,000 SandRidge Energy 8.625% 1/4/2015 122,850 0.02
US$515,000 Sanmina-SCI 8.125% 1/3/2016 445,475 0.06
US$1,700,000 SBA Telecommunications '144A'
8% 15/8/2016 1,708,500 0.22
US$870,000 Scientific Games 0.75% 1/12/2024 858,038 0.11
US$3,310,000 Scientific Games International '144A'
9.25% 15/6/2019 3,409,300 0.44
US$2,085,000 Sealed Air '144A' 7.875% 15/6/2017 2,186,648 0.28
US$4,350,000 Smithfield Foods '144A' 10% 15/7/2014 4,415,250 0.58
US$320,000 Snoqualmie Entertainment Authority
'144A' FRN 1/2/2014 158,400 0.02
US$1,170,000 Solo Cup '144A' 10.5% 1/11/2013 1,228,500 0.16
US$870,000 Southern Star Central '144A' 6.75%
1/3/2016 817,800 0.11
US$250,000 Southern Star Central 6.75% 1/3/2016 235,000 0.03
US$2,405,000 Southwestern Energy '144A' 7.5%
1/2/2018 2,432,056 0.32
US$3,865,000 Sprint Capital 6.875% 15/11/2028 2,826,281 0.37
US$1,565,000 Sprint Capital 7.625% 30/1/2011 1,576,738 0.21
US$1,100,000 Sprint Nextel 8.375% 15/8/2017 1,054,625 0.14
US$1,165,000 Stanadyne 10% 15/8/2014 940,738 0.12
US$1,030,000 Standard Pacific 6.25% 1/4/2014 782,800 0.10
US$3,865,000 Standard Pacific 7% 15/8/2015 2,898,750 0.38
US$1,225,000 Stanley-Martin Communities 9.75%
15/8/2015 306,250 0.04
US$3,540,000 Steel Dynamics '144A' 8.25%
15/4/2016 3,504,600 0.46
US$3,880,000 Steel Dynamics 7.375% 1/11/2012 3,860,600 0.50
US$1,330,000 Sungard Data Systems '144A' 10.625%
15/5/2015 1,388,188 0.18
US$1,580,000 Sungard Data Systems 9.125%
15/8/2013 1,574,075 0.21
US$2,910,000 Sunstate Equipment '144A' 10.5%
1/4/2013 2,197,050 0.29
US$850,000 Swift Energy 7.125% 1/6/2017 658,750 0.09
US$1,812,184 Tenaska Alabama Partners '144A' 7%
30/6/2021 1,578,806 0.21
US$3,200,000 Tenet Healthcare '144A' 8.875%
1/7/2019 3,303,999 0.43
US$5,274,000 Tenet Healthcare '144A' 9% 1/5/2015 5,432,219 0.71
US$4,069,000 Tenet Healthcare '144A' 10% 1/5/2018 4,404,692 0.57
US$590,000 Tenneco 8.125% 15/11/2015 541,324 0.07
US$465,000 Terra Capital 7% 1/2/2017 440,587 0.06
US$8,421,875 Texas Competitive Electric Holdings
10.5% 1/11/2016 4,968,905 0.65
US$295,000 Texas Competitive Electric Holdings 'A'
10.25% 1/11/2015 196,912 0.03
US$3,720,000 Texas Competitive Electric Holdings 'B'
10.25% 1/11/2015 2,483,099 0.32
US$695,000 Texas Industries 7.25% 15/7/2013 649,824 0.08
US$2,545,000 Titan International 8% 15/1/2012 2,462,287 0.32
US$730,000 Toll Brothers Finance 8.91%
15/10/2017 811,578 0.11
US$770,000 Travelport 9.875% 1/9/2014 654,499 0.09
US$100,000 Travelport 11.875% 1/9/2016 78,999 0.01
US$1,900,000 United Air Lines 12.75% 15/7/2012 1,833,499 0.24
US$1,740,000 Universal City Development Partners
11.75% 1/4/2010 1,739,999 0.23
US$6,040,000 Valeant Pharmaceuticals International
'144A' 8.375% 15/6/2016 6,160,799 0.80
US$3,050,000 Verso Paper Holdings / Verso Paper
9.125% 1/8/2014 1,997,750 0.26
US$1,225,000 Verso Paper Holdings / Verso Paper
11.375% 1/8/2016 557,375 0.07
US$2,960,000 Verso Paper Holdings / Verso Paper
FRN 1/8/2014 1,687,200 0.22
US$1,300,000 Verso Paper Holdings '144A' 11.5%
1/7/2014 1,283,750 0.17
US$159,000 Viant Holdings '144A' 10.125%
15/7/2017 150,255 0.02
US$3,230,000 Virgin Media 6.5% 15/11/2016 3,007,938 0.39
US$2,400,000 West 9.5% 15/10/2014 2,232,000 0.29
US$3,350,000 West 11% 15/10/2016 3,115,500 0.41
US$315,000 Whiting Petroleum 7.25% 1/5/2012 315,000 0.04
US$835,000 Whiting Petroleum 7.25% 1/5/2013 830,825 0.11
US$1,455,000 Windstream 8.125% 1/8/2013 1,462,275 0.19
US$6,260,000 Windstream 8.625% 1/8/2016 6,322,600 0.82
US$2,140,000 WMG Acquisition '144A' 9.5%
15/6/2016 2,238,975 0.29 ___________ ______
597,415,218 77.85 ___________ ______
Total Bonds 661,151,560 86.15 ___________ ______
COMMON STOCKS (SHARES) & WARRANTS
Canada
25,414 Ainsworth Lumber 39,549 0.00
28,522 Ainsworth Lumber '144A' 45,286 0.01 ___________ ______
84,835 0.01 ___________ ______
United States
65,370 Curative Health Services 13,152 0.00
26 Marsico Parent Holdco (Wts 31/12/2049) 26,003 0.01
400,000 Mirant 40 0.00
40 Time Warner Cable 1,494 0.00 ___________ ______
40,689 0.01 ___________ ______
Total Common Stocks (Shares) & Warrants 125,524 0.02 ___________ ______
Total Transferable Securities Admitted
to an Official Stock Exchange Listing or
Dealt in on Another Regulated Market 661,277,084 86.17 ___________ ______
US Dollar High Yield Bond Fund continued
Portfolio of Investments 31 August 2009
Transferable Securities Admitted to an Official Stock Exchange
Listing or Dealt in on Another Regulated Market
Holding Description Value (US$) %
Transferable Securities Admitted to an Official Stock Exchange
Listing or Dealt in on Another Regulated Market
Holding Description Value (US$) %

196 BlackRock Global Funds (BGF)
BONDS
Australia
US$3,675,000 FMG Finance Pty '144A' 10.625%
1/9/2016 3,996,563 0.52
US$880,000 FMG Finance Pty '144A' FRN
1/9/2011 886,600 0.12 ___________ ______
4,883,163 0.64 ___________ ______
Bermuda
US$2,380,829 ProtoStar I '144A' 18% 15/10/2012 1,309,456 0.17 ___________ ______
Canada
US$219,268 Ainsworth Lumber '144A' 11%
29/7/2015 115,116 0.02
US$2,925,000 Connacher Oil and Gas '144A' 10.25%
15/12/2015 2,062,125 0.27
US$545,000 Connacher Oil and Gas '144A' 11.75%
15/7/2014 555,900 0.07 ___________ ______
2,733,141 0.36 ___________ ______
Iceland
US$610,000 Glitnir Banki HF '144A' 0% 20/4/2010 123,525 0.02
US$350,000 Glitnir Banki HF '144A' 0% 18/1/2012 70,875 0.01
US$1,775,000 Glitnir Banki HF '144A' 6.375%
25/9/2012 359,438 0.04 ___________ ______
553,838 0.07 ___________ ______
Luxembourg
US$4,645,000 Wind Acquisition Finance '144A'
10.75% 1/12/2015 5,016,600 0.65 ___________ ______
Netherlands
US$1,220,000 Impress Holdings '144A' FRN
15/9/2013 1,130,025 0.15
US$750,000 UPC Holding '144A' 9.875%
15/4/2018 762,187 0.10 ___________ ______
1,892,212 0.25 ___________ ______
United States
US$700,000 AES '144A' 8.75% 15/5/2013 712,250 0.09
US$2,130,000 Aleris International 9% 15/12/2014 21,300 0.00
US$2,200,000 Alliant Holdings I '144A' 11% 1/5/2015 2,018,500 0.26
US$5,913,000 Allison Transmission '144A' 11%
1/11/2015 5,410,395 0.71
US$1,345,000 CC Holdings GS V / Crown Castle GS III
'144A' 7.75% 1/5/2017 1,371,900 0.18
US$1,755,000 CCO Holdings Capital 8.75%
15/11/2013 1,776,938 0.23
US$8,790,000 Cengage Learning Acquisitions '144A'
10.5% 15/1/2015 8,020,874 1.05
US$1,710,000 Charter Communications 6.5%
1/10/2027 743,850 0.10
US$1,440,000 Charter Communications Operating
LLC / Charter Communications
Operating Capital '144A' 10%
30/4/2012 1,458,000 0.19
US$855,000 CII Carbon '144A' 11.125% 15/11/2015 784,463 0.10
US$2,870,000 Drummond '144A' 7.375% 15/2/2016 2,539,950 0.33
US$2,120,000 Esco '144A' 8.625% 15/12/2013 2,067,000 0.27
US$360,000 Esco '144A' FRN 15/12/2013 323,100 0.04
US$844,000 FiberTower '144A' 9% 15/11/2012 448,375 0.06
US$393,025 FPL Energy National Wind '144A'
6.125% 25/3/2019 366,472 0.05
US$934,000 Greektown Holdings '144A' 10.75%
1/12/2013 205,480 0.03
US$685,000 Ipalco Enterprises '144A' 7.25% 1/4/2016 667,875 0.09
US$3,793,991 iPayment Investors '144A' 11.625%
15/7/2014 948,498 0.12
US$1,496,000 Lazydays RV Center 11.75% 15/5/2012 14,960 0.00
US$4,640,000 MacDermid '144A' 9.5% 15/4/2017 3,920,800 0.51
US$1,503,000 Marsico Parent '144A' 10.625%
15/1/2016 638,775 0.08
US$625,890 Marsico Parent Holdco '144A' 12.5%
15/7/2016 153,343 0.02
US$429,815 Marsico Parent Superholdco '144A'
14.5% 15/1/2018 113,901 0.01
US$35,000 Mashantucket Western Pequot Tribe
'144A' 8.5% 15/11/2015 6,475 0.00
US$2,930,000 NSG Holdings '144A' 7.75% 15/12/2025 2,453,875 0.32
US$95,000 Park-Ohio Industries 8.375% 15/11/2014 60,444 0.01
US$2,843,000 Rainbow National Services '144A'
8.75% 1/9/2012 2,892,753 0.38
US$1,819,000 Rainbow National Services '144A'
10.375% 1/9/2014 1,912,224 0.25
US$1,270,000 Rouse 5.375% 26/11/2013 (Defaulted) 965,200 0.13
US$2,865,000 RSC Equipment Rental '144A' 10%
15/7/2017 3,022,575 0.39
US$3,630,000 Sequa '144A' 11.75% 1/12/2015 2,305,050 0.30
US$4,602,215 Sequa '144A' 13.5% 1/12/2015 2,738,318 0.36
US$75,000 Shingle Springs Tribal Gaming
Authority '144A' 9.375% 15/6/2015 53,625 0.01
US$240,000 Southern Energy Homes 7.9% 15/7/2009 – 0.00
US$115,000 Tropicana Entertainment / Tropicana
Finance 9.625% 15/12/2014 144 0.00
US$1,100,000 US Investigations Services '144A' 10.5%
1/11/2015 915,750 0.12
US$140,000 USI Holdings '144A' FRN 15/11/2014 108,849 0.01
US$2,370,000 Virgin River Casino/RBG/B&BB 9%
15/1/2012 251,813 0.03
US$328,000 Waterford Gaming '144A' 8.625%
15/9/2014 201,720 0.03 ___________ ______
52,615,814 6.86 ___________ ______
Total Bonds 69,004,224 9.00 ___________ ______
COMMON STOCKS (SHARES) & WARRANTS
United States
830,312 Adelphia Recovery Trust 12,455 0.00
17,056 CMP Susquehanna Radio Holdings
(Wts 26/3/2019) – 0.00
14,926 CMP Susquehanna Radio Holdings 'A' – 0.00
215,000 Eagle-Picher Industries – 0.00
100 Marsico Parent Superholdco '144A' 26,000 0.00
290,000 Mirant Corporation Escrowed 3 0.00 ___________ ______
Total Common Stocks (Shares) & Warrants 38,458 0.00 ___________ ______
Total Unquoted Securities 69,042,682 9.00 ___________ ______
Total Portfolio 730,319,766 95.17
Other Net Assets 37,104,717 4.83 ___________ ______
Total Net Assets (US$) 767,424,483 100.00 ___________ ______
US Dollar High Yield Bond Fund continued
Portfolio of Investments 31 August 2009
Unquoted Securities
Holding Description Value (US$) %
Unquoted Securities
Holding Description Value (US$) %

Audited Annual Report and Accounts 197
The notes on pages 236 to 244 form an integral part of these financial statements.
US Dollar High Yield Bond Fund continued
Open Forward Foreign Exchange Transactions as at 31 August 2009
Core Fund US$
US$18,495,414 €13,207,000 16/9/2009 (376,242) (376,242)__________ __________
Net unrealised loss (376,242) (376,242)__________ __________
EUR Hedged Share Class €
€195,135,279 US$275,787,871 15/9/2009 2,129,978 3,043,695
US$3,245,036 €2,292,639 15/9/2009 (21,657) (30,947)__________ __________
Net unrealised profit 2,108,321 3,012,748 __________ __________
Total net unrealised profit 2,636,506 __________
Note: The net unrealised profit attributed to these transactions is included in the Statement
of Net Assets (see Note 2c).
Unrealised
profit/(loss)
US$ Equivalent
Unrealised
profit/(loss)Value dateSalesPurchases
Unrealised profit
US$DescriptionNominal
Value
Unrealised profit
US$DescriptionNominal
Value
US$1,325,000 Credit Default Swaps (Credit Suisse)
(Fund receives default protection on
Standard Pacific Corp 7% 15/8/2015;
and pays Fixed 5%) (20/9/2014) 54,584
US$660,000 Credit Default Swaps (Credit Suisse)
(Fund receives default protection on
Standard Pacific Corp 7% 15/8/2015;
and pays Fixed 5%) (20/9/2014) 23,919
US$2,950,000 Credit Default Swaps (Credit Suisse)
(Fund receives default protection on
Brunswick Corporation 7.125% 1/8/2027;
and pays Fixed 5%) (20/9/2014) 40,901 __________
119,404 __________
Swaps as at 31 August 2009
Note: The total market value of US$426,845 of these transactions is included in the Statement of Net Assets (see Note 2c).

198 BlackRock Global Funds (BGF)
US Dollar Reserve Fund(1)
Open Forward Foreign Exchange Transactions as at 31 August 2009
GBP Hedged Share Class £
£18,674,702 US$30,758,549 15/9/2009 (274,598) (445,776)
US$2,451,703 £1,496,329 15/9/2009 14,082 22,860 __________ __________
Net unrealised loss (260,516) (422,916)__________ __________
Note: The net unrealised loss attributed to these transactions is included in the Statement
of Net Assets (see Note 2c).
Unrealised
profit/(loss)
US$ Equivalent
Unrealised
profit/(loss)Value dateSalesPurchases
BONDS
Spain
US$8,000,000 Banco Bilbao Vizcaya Argentaria 0%
29/10/2009 7,996,526 3.02
US$5,000,000 Banco Bilbao Vizcaya Argentaria 0%
16/11/2009 4,996,646 1.88 ___________ ______
12,993,172 4.90 ___________ ______
United States
US$4,000,000 Federal Home Loan Bank Discount
Notes 0% 6/8/2010 (Zero Coupon) 3,985,455 1.50
US$3,300,000 Federal Home Loan Banks '1' FRN
13/10/2009 3,301,275 1.25
US$5,000,000 Federal Home Loan Banks 5%
11/12/2009 5,064,680 1.91
US$15,000,000 Federal Home Loan Banks FRN
5/2/2010 15,032,549 5.67
US$10,000,000 Federal Home Loan Mortgage 2.68%
16/11/2009 10,049,610 3.79
US$5,000,000 Federal National Mortgage Association
FRN 5/8/2010 5,006,628 1.89
US$4,385,000 Freddie Mac Discount Notes 'RB' 0%
1/7/2010 (Zero Coupon) 4,372,227 1.65
US$250,000 HSBC Bank USA NA (New York) FRN
14/12/2009 249,753 0.09
US$6,790,000 ING USA Global Funding Trust FRN
9/10/2009 6,783,648 2.56
US$7,800,000 US Treasury Bill 0% 10/9/2009 7,799,891 2.94
US$4,000,000 US Treasury Bill 0% 29/7/2010 3,986,352 1.50 ___________ ______
65,632,068 24.75 ___________ ______
Total Bonds 78,625,240 29.65 ___________ ______
COMMERCIAL PAPER
Australia
US$5,000,000 Westpac Banking 0% 8/2/20010 4,984,566 1.88 ___________ ______
Jersey
US$12,219,000 Scaldis Capital 0% 10/9/2009 12,218,238 4.60 ___________ ______
Norway
US$3,000,000 DnB NOR Bank 0% 20/11/2009 2,997,835 1.13 ___________ ______
United States
US$7,000,000 Antalis US Funding 0% 15/9/2009 6,999,296 2.64
US$4,999,000 Barton Capital 0% 19/10/2009 4,997,191 1.88
US$12,000,000 Cancara Asset Securitisation 0%
14/9/2009 11,998,911 4.53
US$2,228,000 Citigroup Funding 0% 1/9/2009 2,228,000 0.84
US$13,000,000 Clipper Receivables 0% 14/9/2009 12,998,820 4.90
US$13,000,000 Danske 0% 5/10/2009 12,996,789 4.90
US$4,000,000 Federal Home Loan Bank Discount
Notes 0% 7/12/2009 3,998,640 1.51
US$9,494,000 Gemini Securitization 0% 3/9/2009 9,493,876 3.58
US$2,008,000 Gemini Securitization 0% 9/9/2009 2,007,886 0.76
US$12,000,000 JPMorgan Chase & Co 0% 3/9/2009 11,999,843 4.53
US$10,000,000 NetJets 0% 4/9/2009 9,999,802 3.77
US$3,000,000 Old Line Funding 0% 17/9/2009 2,999,663 1.13
US$13,000,000 Park Avenue Receivables 0%
16/9/2009 12,998,634 4.90
US$13,000,000 Regency Markets No. 1 0% 21/9/2009 12,998,163 4.90
US$7,987,000 Societe Generale North America 0%
4/9/2009 7,986,842 3.01
US$13,000,000 Thunder Bay Funding 0% 14/9/2009 12,998,820 4.90
US$5,219,000 Tulip Funding 0% 4/9/2009 5,218,892 1.97 ___________ ______
144,920,068 54.65 ___________ ______
Total Commercial Paper 165,120,707 62.26 ___________ ______
Total Transferable Securities Admitted
to an Official Stock Exchange Listing or
Dealt in on Another Regulated Market 243,745,947 91.91 ___________ ______
Unquoted Securities
BONDS
Netherlands
US$7,000,000 Rabobank Nederland '144A' FRN
7/4/2011 6,998,555 2.64 ___________ ______
Norway
US$9,500,000 DnB NOR Bank ASA '144A' FRN
13/10/2009 9,476,720 3.58 ___________ ______
Sweden
US$6,000,000 Nordea Bank 'EXL1' FRN 23/10/2009 6,000,147 2.26 ___________ ______
Total Unquoted Securities 22,475,422 8.48 ___________ ______
Total Portfolio 266,221,369 100.39
Other Net Liabilities (1,033,401) (0.39)___________ ______
Total Net Assets (US$) 265,187,968 100.00 ___________ ______
Portfolio of Investments 31 August 2009
Transferable Securities Admitted to an Official Stock Exchange
Listing or Dealt in on Another Regulated Market
Holding Description Value (US$) %
Transferable Securities Admitted to an Official Stock Exchange
Listing or Dealt in on Another Regulated Market
Holding Description Value (US$) %
(1) Fund name changed, see Note 1, for further details.

Audited Annual Report and Accounts 199
The notes on pages 236 to 244 form an integral part of these financial statements.
US Dollar Short Duration Bond Fund
BONDS
Australia
US$990,000 Macquarie Bank '144A' 4.1%
17/12/2013 1,030,850 1.13 ___________ ______
Bermuda
US$320,000 Ingersoll-Rand Global Holding 9.5%
15/4/2014 374,607 0.41 ___________ ______
Canada
US$485,000 California State 5.65% 1/4/2039 496,475 0.54
US$425,000 Conoco Funding 6.35% 15/10/2011 465,792 0.51
US$425,000 Export Development Canada 2.375%
19/3/2012 433,054 0.48
US$725,000 Province of Ontario Canada 4.1%
16/6/2014 760,633 0.83
US$425,000 Province of Ontario Canada FRN
22/5/2012 429,919 0.47
US$195,000 Rogers Communications 7.25%
15/12/2012 220,666 0.24
US$340,000 TELUS 8% 1/6/2011 370,286 0.41 ___________ ______
3,176,825 3.48 ___________ ______
Denmark
US$165,000 FIH Erhvervsbank '144A' 2.45%
17/8/2012 166,123 0.18 ___________ ______
France
US$755,000 BNP Paribas FRN 11/6/2012 764,245 0.84
US$300,000 France Telecom SA 4.375% 8/7/2014 313,239 0.34
US$410,000 Societe Financement de l'Economie
Francaise '144A' 2.25% 11/6/2012 413,649 0.45
US$500,000 Societe Financement de l'Economie
Francaise 2.375% 26/3/2012 507,125 0.56 ___________ ______
1,998,258 2.19 ___________ ______
Germany
US$1,490,000 Kreditanstalt fuer Wiederaufbau
3.5% 10/3/2014 1,540,418 1.69
US$370,000 Landwirtschaftliche Rentenbank
4.125% 15/7/2013 391,054 0.43 ___________ ______
1,931,472 2.12 ___________ ______
International
US$375,000 Asian Development Bank/Pasig 2.75%
21/5/2014 377,040 0.41
US$285,000 European Investment Bank 3.125%
4/6/2014 290,415 0.32 ___________ ______
667,455 0.73 ___________ ______
Netherlands
US$125,000 Koninklijke KPN 8% 1/10/2010 133,038 0.15 ___________ ______
Norway
US$750,000 Eksportfinans ASA 5% 14/2/2012 800,535 0.88
US$375,000 StatoilHydro 3.875% 15/4/2014 387,246 0.42 ___________ ______
1,187,781 1.30 ___________ ______
Spain
US$615,000 Telefonica Emisiones SAU 5.984%
20/6/2011 655,263 0.72 ___________ ______
Sweden
US$225,000 Svenska Handelsbanken '144A' 4.875%
10/6/2014 235,354 0.26 ___________ ______
Switzerland
US$200,000 Credit Suisse/New York NY 5.5%
1/5/2014 214,989 0.23 ___________ ______
United Kingdom
US$380,000 Barclays Bank 5.45% 12/9/2012 405,993 0.44
US$640,000 BP Capital Markets 3.125% 10/3/2012 659,743 0.72
US$175,000 BP Capital Markets 5.25% 7/11/2013 191,279 0.21
US$615,000 Lloyds TSB Bank '144A' 2.8%
2/4/2012 629,022 0.69
US$275,000 Royal Bank of Scotland '144A' 2.625%
11/5/2012 279,639 0.31 ___________ ______
2,165,676 2.37 ___________ ______
United States
US$166,575 Aegis Asset Backed Securities Trust
'2006-1 A1' FRN 25/1/2037 161,533 0.18
US$1,275,000 AEP Texas Central Transition Funding
4.98% 1/7/2013 1,355,939 1.49
US$315,000 Altria Group 7.75% 6/2/2014 356,547 0.39
US$82,705 American Airlines Pass Through Trust
2003-01 3.857% 9/7/2010 79,500 0.09
US$400,000 American Electric Power 5.375%
15/3/2010 409,332 0.45
US$3,840 Asset Backed Funding Certificates
'2006-OPT2 A3A' FRN 25/10/2036 3,796 0.00
US$425,000 AT&T 4.85% 15/2/2014 454,610 0.50
US$265,000 AT&T Mobility 6.5% 15/12/2011 291,195 0.32
US$225,000 AvalonBay Communities 6.125%
1/11/2012 238,014 0.26
US$253,151 Banc of America Mortgage Securities
'2003-J 2A1' FRN 25/11/2033 232,348 0.25
US$345,000 Bank of America 4.875% 15/9/2012 353,932 0.39
US$395,000 BB&T 3.85% 27/7/2012 404,165 0.44
US$144,239 Bear Stearns Alt-A Trust '2004-13 A1'
FRN 25/11/2034 90,569 0.10
US$910,000 Bear Stearns Commercial Mortgage
Securities '2001-TOP2 A2' 6.48%
15/2/2035 948,152 1.04
US$170,000 Bear Stearns Companies 4.5%
28/10/2010 176,659 0.19
US$125,000 Board of Trustees of The Leland
Stanford Junior University 3.625%
1/5/2014 127,471 0.14
US$175,000 Boeing 5.125% 15/2/2013 187,814 0.21
US$195,000 Bottling Group 6.95% 15/3/2014 228,023 0.25
US$200,000 Burlington Northern Santa Fe 6.75%
15/7/2011 216,247 0.24
US$280,000 Capital One Financial 5.7% 15/9/2011 289,394 0.32
US$520,000 CareFusion '144A' 4.125% 1/8/2012 529,343 0.58
US$1,225,000 Cellco Partnership / Verizon Wireless
Capital '144A' 3.75% 20/5/2011 1,265,598 1.39
US$1,077,165 CenterPoint Energy Transition Bond
4.97% 1/8/2014 1,124,749 1.23
US$365,000 Citigroup Funding 2.25% 10/12/2012 368,202 0.40
US$470,000 Comcast Cable Communications 6.75%
30/1/2011 500,083 0.55
US$719,243 Countrywide Home Loan Mortgage
Pass Through Trust '2005-HYB8 2A1'
FRN 20/12/2035 439,886 0.48
US$344,000 COX Communications 7.75% 1/11/2010 366,074 0.40
US$175,000 Credit Suisse USA 6.125% 15/11/2011 188,256 0.21
US$237,245 CS First Boston Mortgage Securities
'2001-CF2 A4' 6.505% 15/2/2034 246,168 0.27
US$5,405,310 CS First Boston Mortgage Securities
'2003-CPN1 ASP' FRN 15/3/2035 38,545 0.04
Transferable Securities Admitted to an Official Stock Exchange
Listing or Dealt in on Another Regulated Market
Holding Description Value (US$) %
Transferable Securities Admitted to an Official Stock Exchange
Listing or Dealt in on Another Regulated Market
Holding Description Value (US$) %
Portfolio of Investments 31 August 2009

200 BlackRock Global Funds (BGF)
US Dollar Short Duration Bond Fund continued
US$565,000 CSX 6.3% 15/3/2012 604,381 0.66
US$300,000 CSX 6.75% 15/3/2011 318,622 0.35
US$400,000 CVS Caremark 5.75% 15/8/2011 429,752 0.47
US$325,000 CVS Caremark FRN 1/6/2010 324,456 0.36
US$955,000 Daimler Chrysler Auto Trust '2007-A A4'
5.28% 8/3/2013 994,284 1.09
US$50,905 Deutsche ALT-A Securities Inc Alternate
Loan Trust '2006-AR3 A3' FRN
25/8/2036 50,080 0.06
US$815,000 Duke Energy Ohio 5.7% 15/9/2012 889,264 0.97
US$335,000 Eli Lilly & Co 3.55% 6/3/2012 350,291 0.38
US$290,000 Enterprise Products Operating 4.95%
1/6/2010 294,859 0.32
US$250,000 Enterprise Products Operating 'C'
6.375% 1/2/2013 271,300 0.30
US$55,796 Fannie Mae Pool '629099' FRN 1/4/2032 57,034 0.06
US$1 Fannie Mae Pool '889851' 5.5% 1/3/2020 1 0.00
US$1,673,652 Fannie Mae Pool '890083' 5%
1/12/2021 1,769,835 1.94
US$1 Fannie Mae REMICS '2003-67 GL' 3%
25/1/2025 1 0.00
US$784,477 Fannie Mae REMICS '2005-68 PC' 5.5%
25/7/2035 835,206 0.92
US$561,102 Fannie Mae REMICS '2006-25 TA' 6%
25/11/2029 579,731 0.64
US$664,172 Fannie Mae-Aces '2006-M2 A1A' 4.855%
25/8/2016 696,804 0.76
US$670,000 Federal Home Loan Mortgage 1.75%
15/6/2012 670,000 0.73
US$1,000,000 Federal Home Loan Mortgage 2.125%
21/9/2012 1,006,820 1.10
US$2,500,000 Federal Home Loan Mortgage 4.625%
25/10/2012 2,705,890 2.96
US$545,000 Federal National Mortgage Association
2% 11/2/2011 548,212 0.60
US$975,000 Federal National Mortgage Association
5.25% 1/8/2012 1,041,123 1.14
US$230,000 Federal National Mortgage Association
6.25% 1/2/2011‡ 243,782 0.27
US$811,562 First Union National Bank-Bank of
America Commercial Mortgage Trust
'2001-C1 A2' 6.136% 15/3/2033 839,336 0.92
US$175,000 Florida Power 6.65% 15/7/2011 190,022 0.21
US$1,275,000 Ford Credit Auto Owner Trust
'2006-C A4A' 5.15% 15/2/2012 1,316,655 1.44
US$350,000 Ford Credit Auto Owner Trust
'2009-A A3A' 3.96% 15/5/2013 361,475 0.40
US$695,000 Ford Credit Auto Owner Trust
'2009-B A3' 2.79% 15/8/2013 707,390 0.78
US$145,000 FPL Group Capital 5.625% 1/9/2011 155,832 0.17
US$363,463 Freddie Mac Non Gold Pool '1G1186'
FRN 1/9/2036 380,920 0.42
US$1,161,413 Ge Capital Commercial Mortgage
'2005-C1 A2' 4.353% 10/6/2048 1,160,678 1.27
US$525,000 General Electric Capital 2.625%
28/12/2012 536,357 0.59
US$54 Ginnie Mae I Pool '781284' 6% 15/2/2011 54 0.00
US$180,000 GlaxoSmithKline Capital 4.85%
15/5/2013 192,403 0.21
US$1,126,600 GMAC Commercial Mortgage Securities
'2000-C3 A2' 6.957% 15/9/2035 1,174,755 1.29
US$49,429,537 GMAC Commercial Mortgage Securities
'2003-C2 X2' FRN 10/5/2040 19,530 0.02
US$225,000 Goldman Sachs Group 3.625% 1/8/2012 229,517 0.25
US$200,000 Goldman Sachs Group 6% 1/5/2014 215,688 0.24
US$3,464,157 Greenwich Capital Commercial Funding
'2002-C1 XP' 2.216% 11/1/2035 18,353 0.02
US$290,300 GS Mortgage Securities II '2000-1A A'
FRN 20/3/2023 254,102 0.28
US$4,896,465 GS Mortgage Securities II '2003-C1 X2'
FRN 10/1/2040 20,939 0.02
US$216,459 GS Mortgage Securities II '2004-C1 A2'
4.319% 10/10/2028 219,007 0.24
US$83,092 GSAA Trust '2004-10 AF2' 4.22%
25/8/2034 80,331 0.09
US$234,965 GSAMP Trust '2005-AHL A3' FRN
25/4/2035 225,006 0.25
US$137,445 GSR Mortgage Loan Trust
'2004-9 3A1' 4.6972% 25/8/2034 124,325 0.14
US$1,690,212 GSR Mortgage Loan Trust
'2005-AR1 2A1' 4.916% 25/1/2035 1,315,325 1.44
US$1,085,000 Hewlett-Packard 2.25% 27/5/2011 1,104,761 1.21
US$915,502 Homebanc Mortgage Trust '2005-3 A1'
FRN 25/7/2035 678,011 0.74
US$685,000 Honda Auto Receivables Owner Trust
'2009-2 A3' 2.79% 15/1/2013 694,544 0.76
US$410,000 HSBC Bank USA NA 4.625% 1/4/2014 418,666 0.46
US$170,000 HSBC Finance 6.75% 15/5/2011 179,384 0.20
US$605,000 JP Morgan Chase Commercial
Mortgage Securities '2001-CIB3 A3'
6.465% 15/11/2035 617,180 0.68
US$1,016,857 JP Morgan Chase Commercial
Mortgage Securities '2004-CB9 A2'
FRN 12/6/2041 989,705 1.08
US$782,996 JP Morgan Mortgage Acquisition
'2007-CH5 A2' FRN 25/6/2037 675,995 0.74
US$853,358 JP Morgan Mortgage Trust
'2007-A1 2A1' FRN 25/7/2035 799,758 0.88
US$125,000 JPMorgan Chase & Co 4.75% 1/5/2013 132,161 0.14
US$250,000 JPMorgan Chase & Co 5.6% 1/6/2011 264,040 0.29
US$275,000 Kraft Foods 5.625% 11/8/2010 283,731 0.31
US$325,000 Kraft Foods 6% 11/2/2013 353,139 0.39
US$1,227,741 LB-UBS Commercial Mortgage Trust
'2000-C4 A2' 7.37% 15/8/2026 1,257,044 1.38
US$6,387,858 LB-UBS Commercial Mortgage Trust
'2002-C4 XCP' FRN 15/10/2035 3,612 0.00
US$9,195,106 LB-UBS Commercial Mortgage Trust
'2003-C5 XCP' FRN 15/4/2037 49,471 0.05
US$100,463 Mastr Asset Backed Securities Trust
'2007-HE1 A1' FRN 25/5/2037 83,884 0.09
US$165,000 Midamerican Energy Holdings 5.875%
1/10/2012 178,799 0.20
US$180,000 Midamerican Funding 6.75% 1/3/2011 191,591 0.21
US$155,000 Morgan Stanley 6% 13/5/2014 164,055 0.18
US$278,858 Morgan Stanley ABS Capital I
'2007-HE2 A2A' FRN 25/1/2037 239,932 0.26
US$612,629 Morgan Stanley ABS Capital I
'2007-HE6 A1' FRN 25/5/2037 467,389 0.51
US$3,200,000 National Collegiate Student Loan Trust
'2005-2 AIO' 7.73% 25/3/2012 132,128 0.15
US$7,156,970 National Collegiate Student Loan Trust
'2005-GT1 AIO' 6.75% 25/12/2009 318,708 0.35
US$100,000 New York Life Global Funding '144A'
4.65% 9/5/2013 103,393 0.11
US$120,000 News America 6.75% 9/1/2038 121,547 0.13
US$275,000 North Fork Bancorporation 5.875%
15/8/2012 265,889 0.29
US$350,000 Novartis Capital 4.125% 10/2/2014 367,583 0.40
US$340,000 Peco Energy Transition Trust
'2001-A A1' 6.52% 31/12/2010 354,426 0.39
US$205,000 Pfizer 4.45% 15/3/2012 217,373 0.24
US$650,000 Philip Morris International 4.875%
16/5/2013 690,819 0.76
Transferable Securities Admitted to an Official Stock Exchange
Listing or Dealt in on Another Regulated Market
Holding Description Value (US$) %
Transferable Securities Admitted to an Official Stock Exchange
Listing or Dealt in on Another Regulated Market
Holding Description Value (US$) %
Portfolio of Investments 31 August 2009

Audited Annual Report and Accounts 201
The notes on pages 236 to 244 form an integral part of these financial statements.
US Dollar Short Duration Bond Fund continued
US$1,783,001 PNC Mortgage Acceptance
'2000-C2 A2' 7.3% 12/10/2033 1,847,509 2.02
US$250,000 PNC Mortgage Acceptance
'2001-C1 A2' 6.36% 12/3/2034 255,875 0.28
US$106,783 Popular ABS Mortgage Pass-Through
Trust '2005-1 AF3' 4.142% 25/5/2035 102,701 0.11
US$55,000 Qwest 6.5% 1/6/2017 50,875 0.06
US$55,000 Qwest FRN 15/6/2013 51,150 0.06
US$1,563,768 Residential Asset Mortgage Products
'2003-RZ3 A6' 3.4% 25/3/2033
(Step-up coupon) 1,203,476 1.32
US$506,771 Residential Asset Securitization Trust
'2005-A5 A12' FRN 25/5/2035 321,424 0.35
US$271,330 Securitized Asset Backed Receivables
Trust '2007-NC2 A2A' FRN 25/1/2037 236,016 0.26
US$1,445,000 SLM Student Loan Trust '2008-5 A2'
FRN 25/10/2016 1,459,020 1.60
US$1,450,000 SLM Student Loan Trust '2008-5 A3'
FRN 25/1/2018 1,469,924 1.61
US$1,110,919 Soundview Home Equity Loan Trust
'2003-2 A2' FRN 25/11/2033 839,484 0.92
US$373,395 Soundview Home Equity Loan Trust
'2007-OPT3 2A1' FRN 25/8/2037 348,753 0.38
US$215,000 Sovereign Bancorp FRN 23/3/2010 213,133 0.23
US$1,289,196 Suntrust Adjustable Rate Mortgage Loan
Trust '2007-2 3A3' FRN 25/4/2037 870,069 0.95
US$105,000 TEPPCO Partners 6.125% 1/2/2013 112,554 0.12
US$703,034 Thornburg Mortgage Securities Trust
'2006-6 A1' FRN 25/11/2046 655,355 0.72
US$1,172,382 TIAA Seasoned Commercial Mortgage
Trust '2007-C4 A1' 5.691% 15/8/2039 1,205,706 1.32
US$100,000 Time Warner Cable 5.4% 2/7/2012 106,578 0.12
US$500,000 Time Warner Cable 6.2% 1/7/2013 540,336 0.59
US$250,000 Union Pacific 6.125% 15/1/2012 269,463 0.30
US$4,030,000 US Treasury Bond 1% 31/8/2011 4,028,110 4.41
US$695,000 USAA Auto Owner Trust '2008-1 A4'
4.5% 15/10/2013 725,021 0.79
US$250,000 Verizon Communications 5.35%
15/2/2011 262,115 0.29
US$805,000 Verizon Wireless Capital '144A' 5.25%
1/2/2012 860,219 0.94
US$125,752 Wachovia Bank Commercial Mortgage
Trust '2003-C3 A1' 4.037% 15/2/2034 127,318 0.14
US$2,525,000 WaMu Mortgage Pass Through
Certificates '2005-AR12 1A6' 4.833%
25/10/2035 1,604,295 1.76
US$64,239 Washington Mutual MSC Mortgage
Pass-Through CTFS '2002-MS1 2A1'
6.25% 25/2/2032 63,534 0.07
US$1,313,756 Wells Fargo Mortgage Backed
Securities Trust '2006-AR8 2A1'
5.240023% 25/4/2036 1,012,024 1.11
US$1,030,302 Wells Fargo Mortgage Backed Securities
Trust '2006-AR10 2A1' FRN 25/7/2036 770,394 0.84
US$315,000 XTO Energy 5% 1/8/2010 322,684 0.35 ___________ ______
70,425,705 77.17 ___________ ______
Total Transferable Securities Admitted
to an Official Stock Exchange Listing or
Dealt in on Another Regulated Market 84,363,396 92.44 ___________ ______
Unquoted Securities
BONDS
Netherlands
US$325,000 LeasePlan '144A' 3% 7/5/2012 332,059 0.37 ___________ ______
United Kingdom
US$1,100,000 Royal Bank of Scotland '144A' FRN
8/4/2011 1,098,882 1.20 ___________ ______
United States
US$515,000 Allstate Financial Global Funding '144A'
6.5% 14/6/2011 550,832 0.60
US$642,804 GCO Slims Trust '2006-1A NOTE' 5.72%
1/3/2022 514,243 0.56
US$645,000 Metropolitan Life Global Funding I
'144A' 5.125% 10/4/2013 662,481 0.73
US$525,000 Metropolitan Life Global Funding I
'144A' FRN 10/6/2011 524,351 0.57
US$490,000 Pricoa Global Funding I '144A' 5.625%
24/5/2011 495,404 0.54
US$525,000 Roche Holdings '144A' 4.5% 1/3/2012 555,899 0.61
US$340,000 Southeast Supply Header '144A' 4.85%
15/8/2014 344,545 0.38
US$96 Structured Asset Receivables Trust
'2003-2A CTFS' FRN 21/1/2009 – 0.00
US$235,000 TIAA Global Markets '144A' 4.875%
12/1/2011 242,758 0.27
US$200,000 TIAA Global Markets '144A' 5.125%
10/10/2012 216,476 0.24 ___________ ______
4,106,989 4.50 ___________ ______
Total Unquoted Securities 5,537,930 6.07 ___________ ______
Total Portfolio 89,901,326 98.51
Other Net Assets 1,363,683 1.49 ___________ ______
Total Net Assets (US$) 91,265,009 100.00 ___________ ______
Transferable Securities Admitted to an Official Stock Exchange
Listing or Dealt in on Another Regulated Market
Holding Description Value (US$) %
Transferable Securities Admitted to an Official Stock Exchange
Listing or Dealt in on Another Regulated Market
Holding Description Value (US$) %
(‡) Securities given in guarantee, see Note 12, for further details.
Portfolio of Investments 31 August 2009

202 BlackRock Global Funds (BGF)
US Dollar Short Duration Bond Fund continued
Open Forward Foreign Exchange Transactions as at 31 August 2009
Core Fund
US$137,907 €99,000 16/9/2009 (3,555)
US$49,035 £30,000 28/10/2009 341 __________
Net unrealised loss (3,214)__________
Note: The net unrealised loss attributed to these transactions is included in the Statement
of Net Assets (see Note 2c).
Value date
Unrealised
profit/(loss)
US$SalesPurchases
Value US$
Unrealised loss US$Description
NominalValue
US$ 1,600,000 Fund purchases a call option (expiring
9/11/2009) to enter into an Interest
Rate Swap (Barclays). If exercised
Fund receives 2.75% Fixed semi annually
from 12/5/2010; and pays Floating
US$ Libor 3-month -BBA quarterly
from 12/2/2010; (9/11/2009) (9,280) 2,240 ___________ _________
(9,280) 2,240 ___________ _________
Swaptions as at 31 August 2009
Note: Swaptions are included in the Statement of Net Assets (see Note 2c).
Unrealised profit/(loss)
US$DescriptionNominal
Value
Unrealised profit/(loss)
US$DescriptionNominal
Value
US$800,000 Interest Rate Swaps (Deutsche Bank)
(Fund receives Fixed 1.615%;
and pays Floating USD Libor 3 Month)
(4/3/2011) 7,530
US$4,900,000 Interest Rate Swaps (JP Morgan)
(Fund receives Fixed 1.58%;
and pays Floating USD Libor 3 Month)
(5/8/2011) 25,666
US$1,600,000 Interest Rate Swaps (Credit Suisse)
(Fund receives Floating USD Libor 3 Month;
and pays Fixed 2.403%) (23/4/2014) 19,387
AUD 1,400,000 Interest Rate Swaps (Citibank)
(Fund receives Fixed 3.95%;
and pays Floating AUD BBSW 3 Month)
(5/5/2011) (15,015)
AUD 4,195,000 Interest Rate Swaps (Citibank)
(Fund receives Fixed 4.0225%;
and pays Floating AUD BBSW 3 Month)
(6/5/2011) (42,690)
US$2,600,000 Interest Rate Swaps (Morgan Stanley)
(Fund receives Floating USD Libor 3 Month;
and pays Fixed 1.42%) (8/5/2011) (12,550)
US$1,600,000 Interest Rate Swaps (Citibank)
(Fund receives Fixed 2.4075%;
and pays Floating USD Libor 3 Month)
(20/5/2014) (20,939)
US$7,100,000 Interest Rate Swaps (Deutsche Bank)
(Fund receives Fixed 1.3385%;
and pays Floating USD Libor 3 Month)
(29/5/2011) 21,953 __________
(16,658) __________
Swaps as at 31 August 2009
Note: The total market value of (US$16,658) of these transactions is included in the Statement of Net Assets (see Note 2c).
18 EUR/USD 1 Year Mid-CRV Call Option
strike price US$98.25
expiring on 11/09/2009 508 10,463 ___________ _________
Total Purchased Call Options 508 10,463 ___________ _________
Note: Purchased Call Options are included in the Statement of Net Assets (see Note 2c).
Value US$
Unrealised profit
US$Issuer
Number ofcontracts
subject to Call
Purchased Call Options as at 31 August 2009
(18) EUR/USD 1 Year Mid-CRV Call Option
strike price US$98.25
expiring on 11/09/2009 2,420 (3,375)___________ _________
Total Written Call Options 2,420 (3,375)___________ _________
Note: Written Call Options are included in the Statement of Net Assets (see Note 2c).
Value US$
Unrealised profit
US$Issuer
Number ofcontracts
subject to Call
Written Call Options as at 31 August 2009
Open Futures Contracts as at 31 August 2009
43 90 Day Euro $ Future September 2009 10,714,256
6 Euro BOBL September 2009 997,441
10 US Treasury 10 Year Note December 2009 1,167,188
4 US Treasury 2 Year Note (CBT) December 2009 864,375
(1) US Long Bond (CBT) December 2009 (119,094)
(54) US Treasury 5 Year Note (CBT) December 2009 (6,204,937)__________
Total commitment 7,419,229 __________
Note: The net unrealised gain of US$325,645 attributed to these transactions is included
in the Statement of Net Assets (see Note 2c).
Value
US$
Expiration
dateContracts/Description
Number
of Contracts

Audited Annual Report and Accounts 203
The notes on pages 236 to 244 form an integral part of these financial statements.
COMMON STOCKS (SHARES)
Bermuda
770,000 Accenture 'A' 25,810,400 1.18
1,270,000 Nabors Industries 22,402,800 1.03
60,000 PartnerRe 4,432,200 0.20 ___________ ______
52,645,400 2.41 ___________ ______
Cayman Islands
430,000 Garmin 13,816,072 0.63
290,000 Herbalife 8,795,700 0.40 ___________ ______
22,611,772 1.03 ___________ ______
United States
530,000 Advance Auto Parts 22,419,000 1.03
1,740,000 AES 23,733,600 1.09
820,000 Aetna 23,542,200 1.08
100,000 Alliant Techsystems 7,722,000 0.35
220,000 Alpha Natural Resources 7,376,600 0.34
1,080,000 AmerisourceBergen 22,788,000 1.04
590,000 Amgen 35,116,800 1.61
550,000 Anadarko Petroleum 29,309,500 1.34
70,000 Apple 11,743,270 0.54
940,000 Archer-Daniels-Midland 26,573,800 1.22
2,120,000 AT&T 55,183,600 2.52
210,000 AutoNation* 4,004,700 0.18
640,000 Bank of America 11,315,200 0.52
760,000 BJ Services 12,540,000 0.57
520,000 BJ's Wholesale Club 16,983,200 0.78
670,000 BMC Software 23,476,800 1.07
210,000 Brinker International 3,082,800 0.14
1,140,000 CA 25,456,200 1.16
390,000 Calpine 4,687,800 0.21
330,000 CenturyTel 10,688,700 0.49
270,000 CF Industries Holdings 21,964,500 1.00
450,000 Chevron 31,369,500 1.44
530,000 Chubb 25,874,600 1.18
890,000 Cisco Systems 19,268,500 0.88
1,260,000 CMS Energy 17,085,600 0.78
70,000 Coca-Cola 3,426,500 0.16
1,020,000 Coca-Cola Enterprises 20,869,200 0.95
180,000 Community Health Systems 5,436,000 0.25
440,000 Computer Sciences 21,621,600 0.99
1,040,000 Compuware 7,373,600 0.34
520,000 ConAgra Foods 10,602,800 0.48
810,000 ConocoPhillips 36,450,000 1.67
210,000 Cooper Industries 'A' 6,717,900 0.31
260,000 Diamond Offshore Drilling 23,043,800 1.05
720,000 Edison International 23,947,200 1.10
1,910,000 El Paso 17,801,200 0.81
1,850,000 EMC/Massachusetts 29,193,000 1.34
640,000 ENSCO International 23,846,400 1.09
770,000 Exxon Mobil 53,599,700 2.45
380,000 Fiserv 18,384,400 0.84
820,000 Forest Laboratories 23,771,800 1.09
1,210,000 Gap 23,740,200 1.09
310,000 General Cable 10,924,400 0.50
820,000 General Electric 11,307,800 0.52
20,000 Goldman Sachs Group 3,234,600 0.15
410,000 Goodrich 22,468,000 1.03
10,000 Google 'A' 4,582,700 0.21
410,000 H&R Block 7,072,500 0.32
450,000 Health Net 6,862,500 0.31
630,000 Humana 22,365,000 1.02
330,000 Illinois Tool Works 13,737,900 0.63
150,000 Intel 3,005,925 0.14
370,000 International Business Machines 43,386,200 1.98
1,090,000 International Paper 24,143,500 1.10
930,000 Johnson & Johnson 55,948,800 2.56
310,000 JPMorgan Chase & Co 13,243,200 0.61
290,000 L-3 Communications Holdings 21,399,100 0.98
360,000 Lockheed Martin 26,816,400 1.23
340,000 Lorillard 24,510,600 1.12
880,000 Marathon Oil 27,077,600 1.24
420,000 McKesson 23,620,800 1.08
520,000 Medco Health Solutions 28,444,000 1.30
830,000 Microsoft 20,343,217 0.93
250,000 Millipore 16,532,500 0.76
410,000 Murphy Oil 23,374,100 1.07
210,000 Nasdaq OMX Group 4,475,100 0.20
680,000 National Oilwell Varco 24,656,800 1.13
260,000 NCR 3,460,600 0.16
240,000 NII Holdings 5,605,848 0.26
50,000 Nordstrom 1,404,000 0.06
530,000 Northrop Grumman 25,805,700 1.18
820,000 NRG Energy 22,509,000 1.03
470,000 Occidental Petroleum 34,342,900 1.57
130,000 Oshkosh 4,253,600 0.19
670,000 Pactiv 16,488,700 0.75
840,000 Patterson-UTI Energy 11,104,800 0.51
190,000 PetSmart 4,015,688 0.18
160,000 Pfizer 2,660,800 0.12
910,000 Philip Morris International 41,459,600 1.90
370,000 Pride International 9,483,100 0.43
250,000 Procter & Gamble 13,277,500 0.61
430,000 Quest Diagnostics 23,202,800 1.06
5,670,000 Qwest Communications International 20,808,900 0.95
710,000 RadioShack 10,749,400 0.49
540,000 Raytheon 25,423,200 1.16
160,000 Reynolds American 7,291,200 0.33
500,000 Ross Stores 23,325,150 1.07
860,000 Rowan 17,698,800 0.81
1,140,000 Schering-Plough 32,011,200 1.46
24,666 Seahawk Drilling 567,565 0.03
60,000 Sempra Energy 3,018,600 0.14
360,000 Sepracor 6,523,200 0.30
320,000 Sybase 11,110,400 0.51
730,000 Synopsys 15,486,950 0.71
1,710,000 Tesoro 23,974,200 1.10
170,000 Timken 3,638,000 0.17
710,000 TJX Companies 25,822,700 1.18
510,000 Travelers 25,234,800 1.15
1,000,000 UnitedHealth Group 27,770,000 1.27
1,050,000 Unum Group 23,583,000 1.08
290,000 URS 12,441,000 0.57
1,260,000 Valero Energy 23,247,000 1.06
1,030,000 VeriSign 22,093,500 1.01
1,310,000 Verizon Communications 40,282,500 1.84
70,000 Wal-Mart Stores 3,586,800 0.16
380,000 Walter Energy 19,957,600 0.91
540,000 WellPoint 28,620,000 1.31
280,000 Wells Fargo & Co 7,652,400 0.35
US Flexible Equity Fund
Portfolio of Investments 31 August 2009
Transferable Securities Admitted to an Official Stock Exchange
Listing or Dealt in on Another Regulated Market
Holding Description Value (US$) %
Transferable Securities Admitted to an Official Stock Exchange
Listing or Dealt in on Another Regulated Market
Holding Description Value (US$) %

204 BlackRock Global Funds (BGF)
(*) Securities lent, see Note 11, for further details.
690,000 Western Digital 23,197,800 1.06
1,310,000 Western Union 24,182,600 1.11
900,000 Williams 14,778,000 0.68
28,100 World Access 42 0.00
760,000 Wyeth 36,320,400 1.66 ___________ ______
2,106,136,555 96.33 ___________ ______
Total Portfolio 2,181,393,727 99.77
Other Net Assets 4,979,120 0.23 ___________ ______
Total Net Assets (US$) 2,186,372,847 100.00 ___________ ______
Transferable Securities Admitted to an Official Stock Exchange
Listing or Dealt in on Another Regulated Market
Holding Description Value (US$) %
Portfolio of Investments 31 August 2009
US Flexible Equity Fund continued
Open Forward Foreign Exchange Transactions as at 31 August 2009
EUR Hedged Share Class €
€277,311,386 US$392,278,957 15/9/2009 2,781,843 3,975,197
US$23,934,232 €16,847,276 15/9/2009 (97,324) (139,074)__________ __________
Net unrealised profit 2,684,519 3,836,123 __________ __________
Note: The net unrealised profit attributed to these transactions is included in the Statement
of Net Assets (see Note 2c).
Unrealised
profit/(loss)
US$ Equivalent
Unrealised
profit/(loss)Value dateSalesPurchases
Sector Breakdown as at 31 August 2009
Energy 21.60
Healthcare 19.28
Information technology 16.16
Industrials 9.85
Consumer staples 8.11
Telecommunication services 6.06
Finance 5.44
Consumer discretionary 5.16
Utilities 4.35
Materials 3.76
Other net assets 0.23 __________
100.00 __________
% of net
assets

Audited Annual Report and Accounts 205
The notes on pages 236 to 244 form an integral part of these financial statements.
US Focused Value Fund
COMMON STOCKS (SHARES)
Ireland
46,200 Covidien 1,811,964 1.09 ___________ ______
Netherlands
93,100 Unilever (NY Shares) 2,577,939 1.56 ___________ ______
Switzerland
97,700 ACE 5,089,193 3.07
114,300 Tyco International 3,593,592 2.16
249,800 Weatherford International 4,978,514 3.00 ___________ ______
13,661,299 8.23 ___________ ______
United States
85,800 Anadarko Petroleum 4,572,282 2.76
148,600 Analog Devices 4,208,352 2.54
311,900 Applied Materials 4,117,080 2.48
128,700 Bank of New York Mellon 3,673,098 2.21
228,200 Bristol-Myers Squibb 4,954,222 2.99
62,100 Carnival (Unit) 1,838,160 1.11
331,400 CBS 3,492,956 2.10
61,900 Chevron 4,315,049 2.60
134,500 EI Du Pont de Nemours & Co 4,287,860 2.58
180,800 Electronic Arts 3,280,616 1.98
175,900 Halliburton 4,133,650 2.49
108,000 Hewlett-Packard 4,797,360 2.89
119,700 Honeywell International 4,395,384 2.65
228,200 Invesco 4,689,510 2.83
118,600 JPMorgan Chase & Co 5,066,592 3.05
57,100 Kimberly-Clark 3,420,861 2.06
56,500 Kraft Foods 'A' 1,592,170 0.96
1,140,700 LSI 5,863,198 3.53
189,600 Maxim Integrated Products 3,532,627 2.13
161,100 Metlife 6,073,470 3.66
449,500 Micron Technology 3,303,825 1.99
138,100 Morgan Stanley 3,926,183 2.37
98,000 Noble 3,428,040 2.07
72,500 Nucor 3,254,525 1.96
101,100 Peabody Energy 3,302,937 1.99
1,434,600 Qwest Communications International 5,264,982 3.17
63,700 Raytheon 2,998,996 1.81
162,800 Schering-Plough 4,571,424 2.75
165,833 Time Warner 4,653,274 2.80
125,300 Travelers 6,199,844 3.74
78,000 UnitedHealth Group 2,166,060 1.31
154,500 Verizon Communications 4,750,875 2.86
253,809 Viacom 'B' 6,388,373 3.85
109,500 Walgreen 3,705,480 2.23
157,900 Wells Fargo & Co 4,315,407 2.60 ___________ ______
144,534,722 87.10 ___________ ______
Total Portfolio 162,585,924 97.98
Other Net Assets 3,359,870 2.02 ___________ ______
Total Net Assets (US$) 165,945,794 100.00 ___________ ______
Transferable Securities Admitted to an Official Stock Exchange
Listing or Dealt in on Another Regulated Market
Holding Description Value (US$) %
Transferable Securities Admitted to an Official Stock Exchange
Listing or Dealt in on Another Regulated Market
Holding Description Value (US$) %
Portfolio of Investments 31 August 2009
Open Forward Foreign Exchange Transactions as at 31 August 2009
EUR Hedged Share Class €
€6,499,860 US$9,192,310 15/9/2009 66,783 95,432
US$479,873 €338,572 15/9/2009 (2,741) (3,917)__________ __________
Net unrealised profit 64,042 91,515 __________ __________
Note: The net unrealised profit attributed to these transactions is included in the Statement
of Net Assets (see Note 2c).
Unrealised
profit/(loss)
US$ Equivalent
Unrealised
profit/(loss)Value dateSalesPurchases
Sector Breakdown as at 31 August 2009
Finance 23.53
Information technology 17.54
Energy 14.91
Consumer discretionary 9.86
Healthcare 8.14
Consumer staples 6.81
Industrials 6.62
Telecommunication services 6.03
Materials 4.54
Other net assets 2.02 __________
100.00 __________
% of net
assets

206 BlackRock Global Funds (BGF)
US Government Mortgage Fund
BONDS
United States
US$323,357 Countrywide Alternative Loan Trust
'2004-12CB 1A1' 5% 25/7/2019 307,779 0.17
US$418,235 Countrywide Alternative Loan Trust
'2004-24CB 2A1' 5% 25/11/2019 393,968 0.21
US$213,987 Countrywide Alternative Loan Trust
'2006-41CB 2A17' 6% 25/1/2037 168,523 0.09
US$234,313 Countrywide Alternative Loan Trust
'2006-43CB 1A7' 6% 25/2/2037 181,066 0.10
US$773,762 Countrywide Alternative Loan Trust
'2007-16CB 1A7' 6% 25/8/2037 538,334 0.29
US$536,707 Countrywide Alternative Loan Trust
'2008-2R 3A1' 6% 25/8/2037 350,154 0.19
US$386,117 Countrywide Home Loan Mortgage
Pass Through Trust '2004-HYB1 2A'
4.193419% 20/5/2034 283,768 0.15
US$353,484 CS First Boston Mortgage Securities
'2004-1 4A1' 5% 25/2/2019 350,546 0.19
US$8,200,000 Fannie Mae '4 9/09' 4% TBA 8,107,313 4.37
US$12,300,000 Fannie Mae '4.5 9/09' 4.5% TBA 12,626,719 6.81
US$900,000 Fannie Mae '5.5 9/09' 5.5% TBA 945,985 0.51
US$23,800,000 Fannie Mae '6 9/09' 6% TBA 25,016,037 13.49
US$5,400,000 Fannie Mae '6.5 9/09' 6.5% TBA 5,772,095 3.11
US$1,537,616 Fannie Mae Interest Strip '379 1' 0%
1/5/2037 (Zero Coupon) 1,346,459 0.73
US$53,153 Fannie Mae Pool '253033' 7% 1/2/2015 56,970 0.03
US$24,244 Fannie Mae Pool '323970' 7% 1/10/2014 25,986 0.01
US$3,760,620 Fannie Mae Pool '725027' 5%
1/11/2033 3,870,684 2.09
US$2,940,824 Fannie Mae Pool '725423' 5.5%
1/5/2034 3,074,683 1.66
US$3,165,213 Fannie Mae Pool '727153' 5.5%
1/9/2033 3,309,286 1.78
US$26,337,852 Fannie Mae Pool '735667' 5%
1/7/2035 27,092,235 14.61
US$2,362,890 Fannie Mae Pool '772650' 5.5%
1/3/2034 2,468,966 1.33
US$1,175,248 Fannie Mae Pool '831824' 5.5%
1/10/2021 1,239,483 0.67
US$1,475,463 Fannie Mae Pool '889109' 5% 1/1/2023 1,539,046 0.83
US$4,421,989 Fannie Mae Pool '889928' 5.5%
1/9/2038 4,602,981 2.48
US$924,755 Fannie Mae Pool '902750' 5.5%
1/11/2021 975,298 0.53
US$14,762,566 Fannie Mae Pool '923410' 6%
1/7/2037‡ 15,554,468 8.39
US$3,904,707 Fannie Mae Pool '961992' 6% 1/3/2038 4,110,895 2.22
US$238,726 Fannie Mae Pool '993353' 4.5%
1/5/2039 239,633 0.13
US$1,158,918 Fannie Mae Pool '993588' 4.5%
1/5/2039 1,163,320 0.63
US$11,038,687 Fannie Mae Pool '995670' 5.5%
1/9/2036 11,546,315 6.23
US$127,947 Fannie Mae Pool 'AA2199' 4.5%
1/3/2039 128,433 0.07
US$3,283,944 Fannie Mae Pool 'AA3453' 5%
1/3/2039 3,366,716 1.82
US$1,668,805 Fannie Mae Pool 'AA4263' 4.5%
1/4/2039 1,675,145 0.90
US$69,376 Fannie Mae Pool 'AA4348' 4.5%
1/4/2039 69,639 0.04
US$299,294 Fannie Mae Pool 'AA4585' 4.5% 1/4/2039 300,431 0.16
US$1,446,660 Fannie Mae Pool 'AA4607' 4.5%
1/4/2039 1,452,300 0.78
US$4,163,020 Fannie Mae Pool 'AA4625' 4.5%
1/5/2039 4,179,251 2.25
US$1,597,323 Fannie Mae Pool 'AA4627' 4.5%
1/5/2039 1,603,551 0.87
US$819,477 Fannie Mae Pool 'AA4666' 4.5%
1/5/2039 822,672 0.44
US$445,417 Fannie Mae Pool 'AA5577' 4.5%
1/6/2039 447,109 0.24
US$47,568 Fannie Mae Pool 'AA7545' 4.5%
1/5/2039 47,749 0.03
US$699,186 Fannie Mae Pool 'AA8390' 4.5%
1/6/2039 701,842 0.38
US$273,329 Fannie Mae Pool 'AA8396' 4.5%
1/6/2039 274,367 0.15
US$988,146 Fannie Mae Pool 'AA8634' 4.5%
1/7/2039 991,900 0.53
US$12,670,430 Fannie Mae Pool 'AD0054' 5%
1/2/2024 13,216,446 7.13
US$1,500,000 Federal Home Loan Mortgage 3%
28/7/2014 1,512,282 0.82
US$100,000 Freddie Mac '4.5 9/09' 4.5% TBA 100,094 0.05
US$12,500,000 Freddie Mac '5 9/09' 5% TBA 12,798,831 6.90
US$13,500,000 Freddie Mac '5.5 9/09' 5.5% TBA 14,046,332 7.57
US$964,434 Freddie Mac Gold Pool 'C01527' 5.5%
1/4/2033 1,009,237 0.54
US$3,105,000 Freddie Mac Gold Pool 'D98084' 5.5%
1/8/2028 3,264,131 1.76
US$670,518 Freddie Mac Gold Pool 'G12601' 5%
1/2/2022 700,880 0.38
US$662,103 Freddie Mac Gold Pool 'G12633' 5%
1/4/2022 692,083 0.37
US$626,546 Freddie Mac Gold Pool 'G12814' 5%
1/10/2022 653,350 0.35
US$658,890 Freddie Mac Gold Pool 'G12840' 5%
1/11/2022 687,078 0.37
US$4,500,000 Ginnie Mae '4.5 9/09' 4.5% TBA 4,520,533 2.44
US$15,700,000 Ginnie Mae '5 9/09' 5% TBA 16,119,488 8.69
US$7,700,000 Ginnie Mae '5.5 10/09' 5.5% TBA 7,994,768 4.31
US$6,100,000 Ginnie Mae '6 9/09' 6% TBA 6,419,298 3.46
US$1,500,000 Government National Mortgage
Association '2005-50 C' 4.658%
16/3/2037 1,487,592 0.80
US$3,786,348 Government National Mortgage
Association '2009-26 SC' FRN
16/1/2038 380,881 0.21
US$430,198 GSR Mortgage Loan Trust
'2006-OA1 2A1' FRN 25/8/2046 304,322 0.16
US$415,031 GSR Mortgage Loan Trust
'2007-3F 1A2' 5% 25/5/2037 327,281 0.18
US$377,608 JP Morgan Mortgage Trust
'2004-S2 5A1' 5.5% 25/12/2019 367,178 0.20
US$204,434 Residential Accredit Loans
'2005-QS13 1A5' 5.5% 25/9/2035 148,398 0.08
US$934,760 Residential Funding Mortgage
Securities I '2007-S2 A3' 6%
25/2/2037 852,557 0.46
US$450,000 US Treasury Bond 3.625% 15/8/2019 456,855 0.25
US$1,286,665 Wells Fargo Alternative Loan Trust
'2007-PA2 1A1' 6% 25/6/2037 929,424 0.50 ___________ ______
Total Bonds 242,309,419 130.67 ___________ ______
Transferable Securities Admitted to an Official Stock Exchange
Listing or Dealt in on Another Regulated Market
Holding Description Value (US$) %
Transferable Securities Admitted to an Official Stock Exchange
Listing or Dealt in on Another Regulated Market
Holding Description Value (US$) %
Portfolio of Investments 31 August 2009

Audited Annual Report and Accounts 207
The notes on pages 236 to 244 form an integral part of these financial statements.
US Government Mortgage Fund continued
FUND MORTGAGE BACKED SECURITIES
United States
(US$4,800,000) Fannie Mae '4.5 9/09' 4.5% TBA (4,810,500) (2.60)
(US$34,700,000) Fannie Mae '5 9/09' 5% TBA (35,661,368) (19.23)
(US$3,800,000) Fannie Mae '5.5 9/09' 5.5% TBA (3,949,032) (2.13)
(US$17,000,000) Fannie Mae '6 10/09' 6% TBA (17,804,848) (9.60)
(US$2,500,000) Freddie Mac '5 9/09' 5% TBA (2,600,391) (1.40)___________ ______
Total Fund Mortgage Backed Securities (64,826,139) (34.96)___________ ______
Total Portfolio 177,483,280 95.71
Other Net Assets 7,956,524 4.29 ___________ ______
Total Net Assets (US$) 185,439,804 100.00 ___________ ______
Transferable Securities Admitted to an Official Stock Exchange
Listing or Dealt in on Another Regulated Market
Holding Description Value (US$) %
(‡) Securities given in guarantee, see Note 12, for further details.
Portfolio of Investments 31 August 2009
Open Forward Foreign Exchange Transactions as at 31 August 2009
EUR Hedged Share Class €
€80,422 US$113,657 15/9/2009 881 1,259 __________ __________
Net unrealised profit 881 1,259 __________ __________
Note: The net unrealised profit attributed to this transaction is included in the Statement
of Net Assets (see Note 2c).
Unrealised
profit
US$ Equivalent
Unrealised
profitValue dateSalesPurchases
Unrealised profit/(loss)
US$DescriptionNominal
Value
Unrealised profit/(loss)
US$DescriptionNominal
Value
US$6,300,000 Interest Rate Swaps (Morgan Stanley)
(Fund receives Fixed 5.1646%;
and pays Floating USD Libor 3 Month)
(16/1/2012) 525,061
US$20,000,000 Interest Rate Swaps (Citibank)
(Fund receives Floating USD Libor 3 Month;
and pays Fixed 2.955%) (27/2/2010) (248,460)
US$22,900,000 Interest Rate Swaps (Citibank)
(Fund receives Fixed 2.63%;
and pays Floating USD Libor 3 Month)
(26/3/2010) 283,846
US$14,800,000 Interest Rate Swaps (Citibank)
(Fund receives Fixed 3.4275%;
and pays Floating USD Libor 3 Month)
(1/4/2013) 593,821
US$13,800,000 Interest Rate Swaps (Citibank)
(Fund receives Floating USD Libor 3 Month;
and pays Fixed 3.46%) (16/4/2013) (566,780)
US$14,900,000 Interest Rate Swaps (Union Bank of Switzerland)
(Fund receives Fixed 4.03%;
and pays Floating USD Libor 3 Month)
(16/10/2013) 903,640
US$21,900,000 Interest Rate Swaps (Union Bank of Switzerland)
(Fund receives Floating USD Libor 3 Month;
and pays Fixed 3.51%) (28/10/2013) (873,263)
US$20,000,000 Interest Rate Swaps (Morgan Stanley)
(Fund receives Fixed 2.66%;
and pays Floating USD Libor 3 Month)
(10/12/2013) 90,660
US$18,400,000 Interest Rate Swaps (JP Morgan)
(Fund receives Floating USD Libor 3 Month;
and pays Fixed 2.3425%) (8/1/2014) 182,730 __________
891,255 __________
Swaps as at 31 August 2009
Note: The total market value of US$891,255 of these transactions is included in the Statement of Net Assets (see Note 2c).
Open Futures Contracts as at 31 August 2009
13 US Treasury 10 Year Note December 2009 1,517,344
(80) US Treasury 2 Year Note (CBT) December 2009 (17,287,500)__________
Total commitment (15,770,156)__________
Note: The net unrealised loss of US$19,297 attributed to these transactions is included
in the Statement of Net Assets (see Note 2c).
Value
US$
Expiration
dateContracts/Description
Number
of Contracts

208 BlackRock Global Funds (BGF)
US Growth Fund
COMMON STOCKS (SHARES)
Brazil
49,500 Petroleo Brasileiro ADR 1,996,335 0.91 ___________ ______
Canada
35,200 Agnico-Eagle Mines 2,008,512 0.91 ___________ ______
Cayman Islands
131,500 Seagate Technology 1,792,332 0.81 ___________ ______
China
4,200 Baidu (China) ADR 1,378,566 0.63 ___________ ______
Israel
104,700 Check Point Software Technologies 2,910,660 1.32
60,000 Teva Pharmaceutical Industries ADR 3,063,012 1.39 ___________ ______
5,973,672 2.71 ___________ ______
Switzerland
26,000 Transocean 1,979,640 0.90 ___________ ______
United States
66,700 3M 4,765,048 2.16
90,400 Abbott Laboratories 4,118,624 1.87
167,100 Activision 1,948,386 0.88
40,900 Amazon.com 3,300,630 1.50
67,300 American Tower 'A' 2,146,197 0.97
81,700 Amgen 4,862,784 2.21
65,400 Apple 10,971,569 4.98
87,400 Avon Products 2,803,792 1.27
386,300 Boston Scientific 4,407,683 2.00
112,100 Broadcom 'A' 3,174,672 1.44
100,800 Carmax 1,745,856 0.79
209,900 CBS 2,212,346 1.00
62,200 Celgene 3,230,046 1.47
24,700 Cerner 1,521,026 0.69
43,400 CH Robinson Worldwide 2,432,570 1.10
307,300 Cisco Systems 6,653,045 3.02
38,900 Clorox 2,279,929 1.04
9,200 CME Group 2,634,972 1.20
109,100 Coca-Cola 5,340,445 2.43
21,300 Covance 1,134,438 0.52
69,300 Cummins 3,099,096 1.41
83,700 Danaher 5,063,013 2.30
390,000 Delta Air Lines 2,811,900 1.28
42,600 Ecolab 1,782,384 0.81
34,300 Exxon Mobil 2,387,623 1.08
28,300 Freeport-McMoRan Copper & Gold 1,794,503 0.81
31,100 Genzyme 1,689,352 0.77
18,100 Goldman Sachs Group 2,927,313 1.33
18,400 Google 'A' 8,432,168 3.83
74,800 Hewlett-Packard 3,322,616 1.51
83,600 Home Depot 2,285,624 1.04
42,600 Honeywell International 1,564,272 0.71
25,700 International Business Machines 3,013,582 1.37
61,000 JC Penney 1,850,740 0.84
55,200 JPMorgan Chase & Co 2,358,144 1.07
99,300 Kohl's 5,121,894 2.33
82,200 Lam Research 2,549,844 1.16
38,400 Las Vegas Sands 544,512 0.25
18,700 Manpower 966,790 0.44
32,200 McDonald's 1,796,760 0.82
62,000 Medco Health Solutions 3,391,400 1.54
64,900 Metlife 2,446,730 1.11
210,500 Micron Technology 1,547,175 0.70
327,500 Microsoft 8,026,992 3.65
128,400 Nvidia 1,852,825 0.84
95,500 Oracle 2,101,955 0.95
36,300 PepsiCo 2,048,409 0.93
130,300 PetroHawk Energy 2,792,329 1.27
160,700 Pfizer 2,672,441 1.21
69,400 Philip Morris International 3,161,864 1.44
264,700 PMC – Sierra 2,353,183 1.07
82,800 Procter & Gamble 4,397,508 2.00
176,300 QUALCOMM 8,157,190 3.70
31,400 Range Resources 1,540,170 0.70
49,100 Ross Stores 2,290,530 1.04
54,200 Salesforce.com 2,815,148 1.28
23,300 Schlumberger 1,309,926 0.60
56,700 Starbucks 1,080,135 0.49
24,500 Starwood Hotels & Resorts Worldwide 733,775 0.33
81,400 United Parcel Service 4,335,364 1.97
34,900 United States Steel 1,526,875 0.69
130,400 UnitedHealth Group 3,621,208 1.64
99,100 Wal-Mart Stores 5,077,884 2.31
55,700 WellPoint 2,952,100 1.34
60,100 Zimmer Holdings 2,840,326 1.29 ___________ ______
202,119,630 91.79 ___________ ______
Total Portfolio 217,248,687 98.66
Other Net Assets 2,952,664 1.34 ___________ ______
Total Net Assets (US$) 220,201,351 100.00 ___________ ______
Transferable Securities Admitted to an Official Stock Exchange
Listing or Dealt in on Another Regulated Market
Holding Description Value (US$) %
Transferable Securities Admitted to an Official Stock Exchange
Listing or Dealt in on Another Regulated Market
Holding Description Value (US$) %
Portfolio of Investments 31 August 2009
Sector Breakdown as at 31 August 2009
Information technology 33.14
Healthcare 17.94
Consumer staples 11.42
Industrials 11.37
Consumer discretionary 10.43
Energy 5.46
Finance 4.71
Materials 3.22
Telecommunication services 0.97
Other net assets 1.34 __________
100.00 __________
% of net
assets

Audited Annual Report and Accounts 209
The notes on pages 236 to 244 form an integral part of these financial statements.
US Small & MidCap Opportunities Fund(1)
COMMON STOCKS (SHARES)
Bermuda
11,600 Allied World Assurance Co Holdings 535,108 0.29
20,800 Axis Capital Holdings 627,328 0.34
53,700 Nabors Industries 947,268 0.51
9,800 RenaissanceRe Holdings 531,552 0.29 ___________ ______
2,641,256 1.43 ___________ ______
Canada
72,100 Lions Gate Entertainment 461,440 0.25 ___________ ______
Cayman Islands
24,500 Herbalife 743,085 0.40
50,200 XL Capital 'A' 853,902 0.46 ___________ ______
1,596,987 0.86 ___________ ______
Ireland
54,500 Ingersoll-Rand 1,676,965 0.91 ___________ ______
Netherlands
68,700 Qiagen 1,405,602 0.76 ___________ ______
Singapore
29,200 Avago Technologies 526,476 0.29 ___________ ______
United States
21,300 Adtran 477,546 0.26
14,700 Advent Software 562,863 0.30
46,400 AGCO 1,429,120 0.77
21,300 AGL Resources 710,355 0.38
39,000 Airgas 1,817,400 0.98
74,700 AK Steel Holding 1,526,868 0.83
30,700 Allegheny Energy 812,322 0.44
46,600 Allscripts-Misys Healthcare Solutions 694,340 0.38
34,100 Alpha Natural Resources 1,143,373 0.62
18,500 AMB Property (Reit) 426,425 0.23
57,500 American Eagle Outfitters 780,850 0.42
1,600 American States Water 53,328 0.03
31,900 American Tower 'A' 1,017,291 0.55
33,300 Ameriprise Financial 993,672 0.54
42,100 AMETEK 1,305,942 0.71
26,900 Amphenol 'A' 932,354 0.50
39,000 Analog Devices‡ 1,104,480 0.60
8,700 Apollo Group 'A'‡ 579,942 0.31
71,000 Ariba 800,880 0.43
44,300 Atlas Air Worldwide Holdings 1,093,767 0.59
32,100 Autodesk 752,745 0.41
5,892 AvalonBay Communities 379,091 0.21
34,900 Avnet 913,682 0.49
13,000 Baldor Electric 366,080 0.20
70,300 BJ Services 1,159,950 0.63
21,300 BMC Software 746,352 0.40
16,300 Boston Properties (Reit) 986,965 0.53
64,300 Brocade Communications Systems 468,104 0.25
3,400 Brookline Bankcorp 35,836 0.02
14,100 Bunge 951,468 0.51
41,300 Burger King Holdings 743,400 0.40
32,100 Cabot Oil & Gas 1,126,389 0.61
80,200 Calpine 964,004 0.52
4,400 Capitol Federal Financial 142,120 0.08
14,100 Cavium Networks 284,256 0.15
65,100 CB Richard Ellis Group 'A' 770,784 0.42
88,300 CBS 930,682 0.50
53,200 Celanese 'A' 1,348,620 0.73
9,200 Celera 60,168 0.03
10,000 Cerner 615,800 0.33
79,100 Chico's FAS 1,014,062 0.55
65,500 Ciena 856,740 0.46
16,400 Cincinnati Financial 415,904 0.23
37,600 Citrix Systems 1,332,544 0.72
54,100 CMS Energy 733,596 0.40
28,800 Comerica 762,624 0.41
27,600 Continental Resources 977,868 0.53
33,200 Cooper Companies 908,684 0.49
31,200 Coventry Health Care 674,856 0.37
11,600 CR Bard 924,636 0.50
48,600 Crown Holdings 1,214,514 0.66
27,200 CSX 1,159,536 0.63
16,400 Curtiss-Wright 532,672 0.29
9,000 DaVita 460,440 0.25
14,100 Deckers Outdoor 961,056 0.52
18,000 Dendreon 418,682 0.23
15,800 DENTSPLY International 529,300 0.29
59,400 Dick's Sporting Goods 1,328,778 0.72
28,900 Digital River 1,005,720 0.54
31,800 Domtar 1,124,448 0.61
42,100 Dow Chemical 899,256 0.49
70,300 DPL 1,737,816 0.94
18,200 Dun & Bradstreet‡ 1,323,322 0.72
14,200 Energizer Holdings 926,976 0.50
21,900 Express Scripts 1,566,945 0.85
16,400 F5 Networks 565,718 0.31
27,800 Family Dollar Stores 841,228 0.46
9,600 Federal Realty Investment Trust (Reit) 592,800 0.32
64,200 Fifth Third Bancorp 686,298 0.37
35,652 First Horizon National 476,311 0.26
43,000 First Niagara Financial Group 562,870 0.30
36,550 Flowers Foods 873,545 0.47
74,800 Ford Motor 566,984 0.31
58,800 Forest Oil 924,336 0.50
24,500 Fortune Brands 970,690 0.53
40,900 Geo Group 732,110 0.40
23,300 Global Payments 991,648 0.54
99,400 Goodyear Tire & Rubber 1,597,358 0.86
22,200 Group 1 Automotive 630,702 0.34
32,700 Guess ? 1,134,690 0.61
17,400 Hanover Insurance Group 700,176 0.38
53,800 Hartford Financial Services Group 1,280,440 0.69
11,600 Health Care REIT (Reit) 497,640 0.27
27,200 Helmerich & Payne 900,320 0.49
18,500 Henry Schein 975,320 0.53
10,900 Hill-Rom Holdings 222,796 0.12
55,600 Hospitality Properties Trust (Reit) 1,026,376 0.56
54,000 Hudson City Bancorp 705,132 0.38
15,200 Iberiabank 725,952 0.39
62,900 Iconix Brand Group 1,086,283 0.59
13,700 International Rectifier 257,149 0.14
57,600 Invesco 1,183,680 0.64
20,800 Invitrogen 933,920 0.51
6,000 ITT Educational Services 634,800 0.34
23,300 J Crew Group 789,870 0.43
79,500 Jabil Circuit 867,345 0.47
51,400 Jarden 1,218,180 0.66
14,700 JM Smucker 762,342 0.41
17,100 Jones Lang LaSalle 804,726 0.44
36,100 Juniper Networks 838,242 0.45
69,800 Kansas City Southern 1,691,254 0.92
36,400 Kirby 1,332,240 0.72
Transferable Securities Admitted to an Official Stock Exchange
Listing or Dealt in on Another Regulated Market
Holding Description Value (US$) %
Transferable Securities Admitted to an Official Stock Exchange
Listing or Dealt in on Another Regulated Market
Holding Description Value (US$) %
(1) Fund name changed, see Note 1, for further details.
Portfolio of Investments 31 August 2009

210 BlackRock Global Funds (BGF)
US Small & MidCap Opportunities Fund(1) continued
43,000 Knight Transportation 700,900 0.38
36,400 Lam Research 1,129,128 0.61
77,100 Las Vegas Sands 1,093,278 0.59
59,900 LaSalle Hotel Properties (Reit) 991,345 0.54
47,000 Liberty Media – Entertainment 'A' 1,299,080 0.70
30,100 Life Time Fitness 923,167 0.50
49,400 Lincoln National 1,235,988 0.67
11,700 Linear Technology 313,794 0.17
15,200 Lorillard 1,095,768 0.59
30,500 Mack-Cali Realty (Reit) 979,050 0.53
72,400 Macy's 1,125,820 0.61
30,500 Manpower 1,576,850 0.85
22,500 Marvel Entertainment 1,101,825 0.60
30,900 Massey Energy 844,806 0.46
20,000 McAfee 801,000 0.43
25,500 McCormick & Co 824,925 0.45
19,600 Microchip Technology 518,420 0.28
8,700 Millipore 575,331 0.31
24,000 Netlogic Microsystems 1,055,520 0.57
29,300 Newfield Exploration 1,127,464 0.61
26,200 Nordstrom 735,696 0.40
31,800 Northeast Utilities 760,974 0.41
61,100 Novellus Systems 1,171,287 0.63
21,300 NSTAR 675,849 0.37
32,100 NTELOS Holdings 521,625 0.28
71,000 NV Energy 859,810 0.47
60,000 Nvidia 865,806 0.47
28,900 PACCAR 1,042,423 0.56
77,200 Patterson-UTI Energy 1,020,584 0.55
36,100 Penske Auto Group 641,136 0.35
51,700 People's United Financial 833,921 0.45
17,600 PerkinElmer 317,680 0.17
32,100 Plexus 806,031 0.44
99,900 PMC – Sierra 888,111 0.48
43,000 Portland General Electric 845,380 0.46
10,900 priceline.com 1,681,870 0.91
35,500 Principal Financial Group 997,550 0.54
54,400 Protective Life 1,141,312 0.62
24,700 Prudential Financial 1,264,887 0.68
13,100 Ralcorp Holdings 820,191 0.44
19,700 Rayonier (Reit) 842,372 0.46
18,400 Red Hat 423,568 0.23
18,600 Reinsurance Group of America 798,126 0.43
37,400 Robert Half International 983,994 0.53
24,500 Ross Stores 1,142,932 0.62
26,800 Rovi 816,060 0.44
15,200 Royal Gold 599,184 0.32
120,700 Saks 751,961 0.41
61,900 SandRidge Energy 755,799 0.41
36,100 SBA Communications 'A' 885,894 0.48
22,800 Signature Bank (New York) 680,124 0.37
28,800 SL Green Realty (Reit) 1,033,632 0.56
46,500 Smithfield Foods 567,300 0.31
23,500 Solera Holdings 616,640 0.33
134,200 Solutia 1,568,798 0.85
20,200 SPX 1,129,382 0.61
25,300 Starent Networks 511,819 0.28
12,500 State Street 655,375 0.35
101,600 Steel Dynamics 1,693,672 0.92
18,300 Stifel Financial 1,023,885 0.55
29,400 Sunoco 783,510 0.42
39,900 SunTrust Banks 932,463 0.50
61,700 SUPERVALU 879,842 0.48
42,500 Sybase 1,475,600 0.80
40,900 Symantec 615,341 0.33
33,100 Taubman Centers (Reit) 1,055,228 0.57
52,900 TCF Financial 714,679 0.39
58,900 TD Ameritrade Holding 1,084,938 0.59
65,500 Tekelec 1,014,595 0.55
108,000 Tellabs 689,029 0.37
44,800 Tenneco 682,752 0.37
116,700 Teradyne 954,606 0.52
22,500 Texas Capital Bancshares 371,700 0.20
14,100 Thermo Fisher Scientific 632,526 0.34
22,800 Thomas & Betts 636,120 0.34
78,900 TIBCO Software 692,742 0.38
16,700 TreeHouse Foods 620,405 0.34
22,800 TRW Automotive Holdings 399,000 0.22
21,900 United States Steel 958,125 0.52
1,300 Unum Group 29,198 0.02
33,700 Urban Outfitters 950,340 0.51
16,800 VCA Antech 414,624 0.22
56,800 Vertex Pharmaceuticals 2,090,808 1.13
20,800 VF 1,457,040 0.79
75,300 Vishay Intertechnology 602,400 0.33
25,700 Wabtec 969,404 0.52
6,500 Waddell & Reed Financial 'A' 169,390 0.09
15,800 Walter Energy 829,816 0.45
28,000 Washington Real Estate Investment
Trust (Reit) 749,560 0.41
19,700 Watson Wyatt Worldwide 'A' 869,558 0.47
41,600 Western Digital 1,398,592 0.76
19,600 Whirlpool 1,283,800 0.69
14,700 Wisconsin Energy 672,084 0.36
9,300 Zimmer Holdings 439,518 0.24 ___________ ______
170,187,492 92.11 ___________ ______
Total Portfolio 178,496,218 96.61
Other Net Assets 6,272,693 3.39 ___________ ______
Total Net Assets (US$) 184,768,911 100.00 ___________ ______
Transferable Securities Admitted to an Official Stock Exchange
Listing or Dealt in on Another Regulated Market
Holding Description Value (US$) %
Transferable Securities Admitted to an Official Stock Exchange
Listing or Dealt in on Another Regulated Market
Holding Description Value (US$) %
Portfolio of Investments 31 August 2009
(‡) Securities given in guarantee, see Note 12, for further details.

Audited Annual Report and Accounts 211
The notes on pages 236 to 244 form an integral part of these financial statements.
US Small & MidCap Opportunities Fund(1) continued
Sector Breakdown as at 31 August 2009
Finance 18.57
Information technology 17.11
Consumer discretionary 17.07
Industrials 11.12
Healthcare 8.05
Materials 7.36
Energy 6.34
Consumer staples 4.90
Utilities 4.78
Telecommunication services 1.31
Other net assets 3.39 __________
100.00 __________
% of net
assets

212 BlackRock Global Funds (BGF)
US SmallCap Value Fund
FUNDS
United States
3,600 iShares Dow Jones US Real Estate Index
Fund 146,196 0.41
7,200 iShares Russell 2000 Growth Index Fund
– ETF 442,440 1.25
8,100 iShares Russell 2000 Index Fund – ETF 463,158 1.31
3,400 KBW Regional Banking – ETF 71,740 0.20 ___________ ______
Total Funds 1,123,534 3.17 ___________ ______
COMMON STOCKS (SHARES)
Bermuda
100 Allied World Assurance Company
Holdings 4,613 0.01
5,000 Aspen Insurance Holdings 125,850 0.36
6,400 IPC Holdings 206,016 0.58 ___________ ______
336,479 0.95 ___________ ______
Canada
29,100 Vitran 339,888 0.96 ___________ ______
United States
5,900 Acadia Realty Trust (Reit) 90,388 0.25
13,000 Actel 141,050 0.40
28,300 ADC Telecommunications 247,908 0.70
29,300 Affymetrix 231,177 0.65
12,300 AGCO 378,840 1.07
5,200 Albany Molecular Research 42,172 0.12
7,100 Alberto-Culver 186,659 0.53
10,800 Allete 365,364 1.03
20,500 Altra Holdings 192,700 0.54
4,300 AMB Property (Reit) 99,115 0.28
6,900 American Campus Communities (Reit) 184,299 0.52
2,700 AMERIGROUP 63,423 0.18
4,000 Ameron International 319,160 0.90
1,200 Andersons 39,660 0.11
8,400 Anixter International 295,428 0.83
4,700 Applied Industrial Technologies 97,055 0.27
7,400 Arbitron 134,828 0.38
4,400 Arch Chemicals 128,832 0.36
11,600 Atmos Energy 315,404 0.89
9,300 Avista 186,186 0.53
10,200 Bancorpsouth 234,294 0.66
6,100 Bank of Hawaii 240,828 0.68
7,900 Big Lots 201,371 0.57
61,600 Bottomline Technologies 730,576 2.06
11,700 Burger King Holdings 210,600 0.59
10,500 Cabot Oil & Gas 368,445 1.04
8,400 CARBO Ceramics 365,988 1.03
11,300 Carpenter Technology 240,238 0.68
42,600 Charming Shoppes 224,076 0.63
11,600 Childrens Place Retail Stores 352,640 1.00
5,100 CIRCOR International 131,223 0.37
7,400 Cleco 181,004 0.51
22,100 Collective Brands 345,644 0.98
11,900 Conmed 212,118 0.60
54,500 Convergys 596,230 1.68
3,200 Cooper Companies 87,584 0.25
4,900 Corporate Office Properties Trust
SBI MD (Reit) 182,721 0.52
6,600 Cullen/Frost Bankers 322,740 0.91
18,600 Curtiss-Wright 604,128 1.71
7,200 Cypress Bioscience 51,156 0.14
11,400 DexCom 89,490 0.25
9,000 Dime Community Bancshares 102,690 0.29
1,400 Dresser-Rand Group 41,986 0.12
35,500 DSP Group 293,230 0.83
12,700 DuPont Fabros Technology (Reit) 164,465 0.46
11,400 El Paso Electric 193,116 0.54
11,200 Electronics for Imaging 119,056 0.34
3,700 Emulex 35,483 0.10
6,500 EnPro Industries 140,465 0.40
1,200 Exactech 18,036 0.05
20,000 Exelixis 111,400 0.31
10,400 Ezcorp 135,408 0.38
16,300 Fidelity National Financial 'A' 244,500 0.69
14,500 Fifth Third Bancorp 155,005 0.44
2,400 First Financial 73,320 0.21
3,000 First Financial Bankshares 148,950 0.42
8,100 First Horizon National 108,216 0.31
22,600 First Midwest Bancorp/IL 228,373 0.64
8,000 Frontier Oil 102,560 0.29
48,400 Furniture Brands International 272,008 0.77
5,100 Genesco 113,373 0.32
7,700 Glacier Bancorp 113,575 0.32
7,000 H&E Equipment Services 71,400 0.20
9,400 Hain Celestial Group 150,682 0.43
9,500 Hanesbrands 197,220 0.56
3,600 Hanover Insurance Group 144,864 0.41
27,300 Harmonic 179,634 0.51
57,100 Harte-Hanks 751,436 2.12
1,600 HCC Insurance Holdings 42,000 0.12
7,000 Healthways 91,420 0.26
3,900 Heidrick & Struggles International 82,251 0.23
1,100 Highwoods Properties (Reit) 31,911 0.09
4,800 Home Properties (Reit) 181,632 0.51
20,300 Huntsman 161,588 0.46
21,500 IAC/InterActiveCorp 401,620 1.13
3,700 Iberiabank 176,712 0.50
12,000 Ingram Micro 'A' 199,800 0.56
15,000 Integrated Device Technology 102,450 0.29
23,100 Intersil 'A' 340,032 0.96
1,500 Investment Technology Group 35,700 0.10
13,000 Ixia 79,950 0.23
23,600 JDS Uniphase 161,660 0.46
4,800 Jo-Ann Stores 130,800 0.37
7,400 Jones Apparel Group 117,882 0.33
4,300 Jones Lang LaSalle 202,358 0.57
11,300 Key Energy Services 80,343 0.23
20,100 King Pharmaceuticals 208,638 0.59
8,100 Layne Christensen 211,410 0.60
12,700 LCA-Vision 68,199 0.19
44,100 Leapfrog Enterprises 172,872 0.49
31,782 Lexington Realty Trust (Reit) 153,507 0.43
3,000 Liberty Property Trust (Reit) 97,890 0.28
1,376 M&T Bank 84,830 0.24
5,800 Macerich (Reit) 167,620 0.47
3,000 Mack-Cali Realty (Reit) 96,300 0.27
10,000 Mariner Energy 123,900 0.35
11,600 Marten Transport 196,620 0.56
11,400 Medcath 102,828 0.29
11,800 Medicis Pharmaceutical 'A' 215,822 0.61
5,600 Merit Medical Systems 101,483 0.29
13,700 MetroCorp Bancshares 48,636 0.14
29,500 MFA Mortgage Investments (Reit) 230,690 0.65
9,300 MKS Instruments 171,585 0.48
3,600 Mueller Industries 87,336 0.25
10,700 National Retail Properties (Reit) 219,350 0.62
7,100 New Jersey Resources 262,629 0.74
112,200 Novell 483,021 1.36
Transferable Securities Admitted to an Official Stock Exchange
Listing or Dealt in on Another Regulated Market
Holding Description Value (US$) %
Transferable Securities Admitted to an Official Stock Exchange
Listing or Dealt in on Another Regulated Market
Holding Description Value (US$) %
Portfolio of Investments 31 August 2009

Audited Annual Report and Accounts 213
The notes on pages 236 to 244 form an integral part of these financial statements.
US SmallCap Value Fund continued
18,500 O'Charleys 138,380 0.39
17,000 OGE Energy 534,480 1.51
4,800 Oil States International 140,496 0.40
3,500 OM Group 94,220 0.27
10,700 Omega Healthcare Investors (Reit) 180,723 0.51
99,400 OraSure Technologies 259,434 0.73
7,600 Packaging of America 153,444 0.43
6,700 Parexel International 85,693 0.24
2,900 Patterson-UTI Energy 38,338 0.11
27,500 PDL BioPharma 247,775 0.70
12,200 PerkinElmer 220,210 0.62
7,300 PharMerica 145,489 0.41
5,500 Piedmont Natural Gas 134,310 0.38
7,700 Plains Exploration & Production 202,279 0.57
74,600 Playboy Enterprises 'B' 206,642 0.58
21,100 PMC – Sierra 187,579 0.53
7,000 Portland General Electric 137,620 0.39
2,800 Presidential Life 28,728 0.08
5,500 PrivateBancorp 133,155 0.38
3,100 ProAssurance 165,354 0.47
11,500 Provident Financial Services 126,040 0.36
17,500 Provident New York Bancorp 163,214 0.46
3,800 PS Business Parks (Reit) 200,716 0.57
10,100 RBC Bearings 222,494 0.63
1,100 Regal-Beloit 49,984 0.14
5,300 Republic Bancorp 'A' 113,956 0.32
20,500 Robbins & Myers 473,550 1.34
3,600 Rock-Tenn 184,824 0.52
6,700 Rockwood Holdings 132,861 0.37
6,800 S&T Bancorp 94,112 0.27
67,000 Saks 417,410 1.18
10,000 SAVVIS 175,000 0.49
17,300 Senior Housing Properties Trust (Reit) 349,979 0.99
9,700 Sepracor 175,764 0.50
7,600 Service Corporation International 53,808 0.15
31,050 Smart Balance 193,442 0.55
96,600 Smurfit-Stone Container 60,182 0.17
7,800 Solutia 91,182 0.26
1,800 South Jersey Industries 63,756 0.18
12,200 Southwest Gas 299,876 0.85
21,900 Spartech 254,916 0.72
10,200 St Joe 330,888 0.93
4,700 St Mary Land & Exploration 122,764 0.35
10,000 Superior Energy Services 180,600 0.51
5,700 Tanger Factory Outlet Centers (Reit) 215,004 0.61
3,800 Team 66,842 0.19
56,400 Tellabs 359,826 1.02
32,300 Teradyne 264,214 0.75
13,300 Texas Capital Bancshares 219,716 0.62
14,000 Thomas Weisel Partners Group 64,260 0.18
37,800 TIBCO Software 331,884 0.94
4,800 Triumph Group 206,352 0.58
8,300 UIL Holdings 216,132 0.61
8,600 United Bankshares 165,808 0.47
9,800 Urban Outfitters 276,360 0.78
6,200 URS 265,980 0.75
19,000 Valueclick 195,700 0.55
18,800 Vishay Intertechnology 150,400 0.42
50,100 Wabash National 122,244 0.34
6,000 WellCare Health Plans 145,740 0.41
8,300 WESCO International 199,366 0.56
3,300 Whiting Petroleum 160,281 0.45
3,400 Wright Medical Group 55,079 0.16
43,850 Zoran 491,997 1.39 ___________ ______
32,387,320 91.45 ___________ ______
Total Common Stocks (Shares) 33,063,687 93.36 ___________ ______
Total Portfolio 34,187,221 96.53
Other Net Assets 1,227,092 3.47 ___________ ______
Total Net Assets (US$) 35,414,313 100.00 ___________ ______
Transferable Securities Admitted to an Official Stock Exchange
Listing or Dealt in on Another Regulated Market
Holding Description Value (US$) %
Transferable Securities Admitted to an Official Stock Exchange
Listing or Dealt in on Another Regulated Market
Holding Description Value (US$) %
Portfolio of Investments 31 August 2009
Sector Breakdown as at 31 August 2009
Finance 21.55
Information technology 19.01
Industrials 12.59
Consumer discretionary 12.19
Healthcare 8.55
Utilities 8.16
Energy 5.45
Materials 4.24
Investment funds 3.17
Consumer staples 1.62
Other net assets 3.47 __________
100.00 __________
% of net
assets

214 BlackRock Global Funds (BGF)
World Bond Fund
BONDS
Australia
A$1,620,000 New South Wales Treasury 5.25%
1/5/2013 1,343,116 0.65
A$2,685,000 Queensland Treasury 6% 14/9/2017 2,249,134 1.09 ___________ ______
3,592,250 1.74 ___________ ______
Austria
€100,000 BAWAG P.S.K. Bank fuer Arbeit und
Wirtschaft und Oesterreichische
Postsparkasse 4.35% 28/5/2013 143,135 0.07 ___________ ______
Bahrain
US$300,000 Golden Belt 1 Sukuk BSC FRN
15/5/2012 67,500 0.03 ___________ ______
Bermuda
£700,000 Holcim GB Finance 8.75% 24/4/2017 1,319,016 0.64
US$500,000 Novartis Securities Investment
5.125% 10/2/2019 529,802 0.26 ___________ ______
1,848,818 0.90 ___________ ______
Canada
C$8,145,000 Canadian Government Bond 3.75%
1/6/2012 7,760,380 3.76
C$1,210,000 Canadian Government Bond 4.25%
1/6/2018 1,179,268 0.57
C$253,000 Canadian Government Bond 5%
1/6/2037 271,140 0.13
C$785,000 Canadian Government Bond 5.75%
1/6/2033 897,360 0.43
US$1,375,000 Export Development Canada 2.375%
19/3/2012 1,402,493 0.68
US$100,000 Ispat Inland ULC 9.75% 1/4/2014 104,687 0.05
US$750,000 Province of Ontario Canada 4.1%
16/6/2014 786,861 0.38
C$125,000 Shaw Communications 6.1%
16/11/2012 122,514 0.06 ___________ ______
12,524,703 6.06 ___________ ______
Cayman Islands
€400,000 MBNA Amer Euro Struc OFF 5.45%
19/4/2011 538,433 0.26 ___________ ______
Denmark
€850,000 Kingdom of Denmark 3.125%
17/3/2014 1,236,813 0.60
€75,000 Kommunekredit 4.375% 2/10/2012 112,148 0.05
DKK1,423,532 Nykredit Realkredit FRN 1/10/2038 260,843 0.13
DKK174,050 Realkredit Danmark FRN 1/10/2038 31,892 0.01 ___________ ______
1,641,696 0.79 ___________ ______
France
€800,000 AUTO ABS '2007-1 A' FRN 25/2/2019 1,047,899 0.51
£40,000 AXA 6.667% 6/7/2016 (Perpetual) 52,377 0.02
€350,000 Cie de Saint-Gobain 7.25% 16/9/2013 557,445 0.27
€90,000 CIF Euromortgage 4.5% 10/12/2013 136,679 0.07
€205,000 Compagnie de Financement Foncier
3.875% 25/4/2055 230,615 0.11
€410,000 Compagnie de Financement Foncier
4.5% 9/1/2013 621,189 0.30
€400,000 Compagnie de Financement Foncier
4.625% 23/9/2017 605,647 0.29
€350,000 Credit Agricole Covered Bonds 3.5%
21/7/2014 509,661 0.25
€775,000 France Government Bond OAT 3.75%
25/4/2017 1,150,467 0.56
€205,000 France Government Bond OAT 3.75%
25/4/2021 294,924 0.14
€1,440,000 France Government Bond OAT 4%
25/10/2038 2,018,052 0.98
€400,000 France Telecom 4.75% 21/2/2017 604,201 0.29
€150,000 GDF Suez 6.875% 24/1/2019 259,667 0.13
US$1,490,000 Societe Financement de l'Economie
Francaise 3.375% 5/5/2014 1,523,614 0.74
€60,000 Veolia Environnement 4% 12/2/2016 85,426 0.04 ___________ ______
9,697,863 4.70 ___________ ______
Germany
€1,937,000 Bundesobligation '152' 3.5% 12/4/2013 2,900,792 1.41
€1,260,000 Bundesobligation '153' 4% 11/10/2013 1,921,749 0.93
€2,361,000 Bundesrepublik Deutschland 3.5%
4/7/2019 3,439,966 1.67
€1,585,000 Bundesrepublik Deutschland 4%
4/1/2037 2,258,832 1.09
€1,575,000 Bundesrepublik Deutschland 4.25%
4/1/2014 2,423,803 1.17
€1,180,000 Bundesrepublik Deutschland 4.25%
4/7/2014 1,821,240 0.88
€2,442,000 Bundesrepublik Deutschland 4.25%
4/7/2039 3,655,442 1.77
€100,000 Bundesrepublik Deutschland 5.375%
4/1/2010 145,271 0.07
€241,053 Driver One '4 A' FRN 21/4/2013 335,022 0.16
US$2,650,000 Kreditanstalt fuer Wiederaufbau 3.5%
10/3/2014 2,739,669 1.33
€1,500,000 Kreditanstalt fuer Wiederaufbau 3.875%
21/1/2019 2,190,584 1.06
US$1,200,000 Landeskreditbank Baden-Wuerttemberg
Foerderbank 2.5% 14/2/2011 1,221,780 0.59
€700,000 Muenchener Rueckversicherungs
6.75% 21/6/2023 1,054,895 0.51 ___________ ______
26,109,045 12.64 ___________ ______
Greece
€1,375,000 Hellenic Republic Government Bond
FRN 20/2/2013 2,040,897 0.99 ___________ ______
International
¥44,100,000 European Investment Bank 1.9%
26/1/2026 457,929 0.22
US$575,000 European Investment Bank 3.125%
4/6/2014 585,465 0.29
€925,000 European Investment Bank 3.5%
15/4/2016 1,344,575 0.65 ___________ ______
2,387,969 1.16 ___________ ______
Ireland
€400,000 Cars Alliance Funding '2007-1 A'
FRN 8/10/2023 534,509 0.26
C$130,000 Depfa ACS Bank 4.9% 24/8/2035 82,721 0.04
C$145,000 Depfa ACS Bank 5.25% 31/3/2025 102,874 0.05
€80,000 GE Capital European Funding 4.375%
30/3/2011 117,183 0.06
£400,000 GE Capital UK Funding 5.125%
3/3/2015 640,530 0.31
€146,141 Talisman Finance '7 H' FRN
22/4/2017 31,323 0.01 ___________ ______
1,509,140 0.73 ___________ ______
Transferable Securities Admitted to an Official Stock Exchange
Listing or Dealt in on Another Regulated Market
Holding Description Value (US$) %
Transferable Securities Admitted to an Official Stock Exchange
Listing or Dealt in on Another Regulated Market
Holding Description Value (US$) %
Portfolio of Investments 31 August 2009

Audited Annual Report and Accounts 215
The notes on pages 236 to 244 form an integral part of these financial statements.
World Bond Fund continued
Italy
€400,000 AUTO ABS '2007-2 A' FRN 25/10/2020 544,646 0.26
€200,000 Banco Popolare SC FRN 8/2/2017 250,061 0.12
€50,000 Intesa Sanpaolo 4.375% 26/6/2018 71,303 0.03
€50,000 Italian Republic 4.5% 31/7/2014 75,741 0.04
€2,095,000 Italy Buoni Poliennali del Tesoro 4.25%
15/10/2012 3,157,989 1.53
€95,000 Mediobanca FRN 11/10/2016 126,516 0.06
€100,000 Unione di Banche Italiane SCPA FRN
7/12/2015 134,513 0.07 ___________ ______
4,360,769 2.11 ___________ ______
Japan
£100,000 East Japan Railway 4.75% 8/12/2031 161,117 0.08
£40,000 Japan Finance Corporation for Municipal
Enterprises 5.75% 9/8/2019 73,081 0.04
¥62,000,000 Japan Government Fifteen Year Bond
FRN 20/3/2021 666,174 0.32
¥65,000,000 Japan Government Five Year Bond 0.9%
20/12/2012 710,970 0.34
¥395,000,000 Japan Government Ten Year Bond 1.5%
20/9/2018 4,358,870 2.11
¥885,000,000 Japan Government Ten Year Bond 1.9%
20/6/2017 10,169,910 4.93
¥221,000,000 Japan Government Twenty Year Bond
2.1% 20/12/2027 2,402,871 1.16
¥312,500,000 Japan Government Twenty Year Bond
2.2% 20/6/2026 3,485,105 1.69
¥385,000,000 Japanese Government CPI Linked
Bond 1.2% 10/6/2017 3,833,722 1.86
¥118,100,000 Japanese Government CPI Linked
Bond 1.2% 10/12/2017 1,163,881 0.56 ___________ ______
27,025,701 13.09 ___________ ______
Jersey
£150,000 BAA Funding 5.225% 15/2/2025 182,224 0.09 ___________ ______
Luxembourg
US$300,000 Europaische Hypothekenbank
Luxembourg 4.25% 13/5/2010 299,196 0.14
€130,000 Telecom Italia Finance 7.5% 20/4/2011 201,391 0.10
€110,015 Volkswagen Car Lease '9 A' FRN
21/4/2012 154,991 0.08 ___________ ______
655,578 0.32 ___________ ______
Netherlands
€400,000 ABN Amro Bank 3.75% 15/7/2014 584,962 0.28
£45,000 ABN Amro Bank 5% 17/2/2016 (Perpetual) 45,545 0.02
€300,000 British American Tobacco Holdings
The Netherlands 4.375% 15/6/2011 444,924 0.22
€500,000 Fortis Bank Nederland Holding 3.375%
19/5/2014 729,652 0.35
€50,000 Generali Finance 5.479% 8/2/2017
(Perpetual) 57,725 0.03
€650,000 LeasePlan 3.25% 22/5/2014 942,148 0.46
£45,000 RWE Finance 6.25% 3/6/2030 85,077 0.04
€700,000 RWE Finance 6.625% 31/1/2019 1,181,146 0.57
€600,000 Storm '2007-1 A2' FRN 22/4/2049 832,976 0.40
€50,000 Syngenta Finance 4.125% 21/9/2011 74,427 0.04 ___________ ______
4,978,582 2.41 ___________ ______
Norway
€625,000 Eksportfinans 4.375% 20/9/2010 919,589 0.44 ___________ ______
Spain
€550,000 BBVA International Preferred 3.798%
22/9/2015 (Perpetual) 558,644 0.27
£100,000 BBVA Subordinated Capital SAU FRN
21/10/2015 153,803 0.08
€1,000,000 Caja de Ahorros de Valencia Castellon
y Alicante 3% 11/5/2012 1,450,108 0.70
€1,775,000 Spain Government Bond 3.8%
31/1/2017 2,607,802 1.26
€75,000 Spain Government Bond 5.75%
30/7/2032 126,984 0.06
US$75,000 Telefonica Emisiones 6.421% 20/6/2016 83,922 0.04
€450,000 Telefonica Emisiones SAU 3.75%
2/2/2011 659,831 0.32
€1,150,000 Telefonica Emisiones SAU 5.431%
3/2/2014 1,773,475 0.86 ___________ ______
7,414,569 3.59 ___________ ______
Sweden
€920,000 Svensk Exportkredit AB 3.625%
27/5/2014 1,338,201 0.65 ___________ ______
Switzerland
US$200,000 UBS (Stamford Branch) 5.875%
20/12/2017 197,842 0.09 ___________ ______
United Arab Emirates
£200,000 National Bank of Abu Dhabi 5.875%
27/2/2012 327,714 0.16 ___________ ______
United Kingdom
€100,000 Anglian Water Services Financing 4.625%
7/10/2013 147,882 0.07
£50,000 Anglian Water Services Financing 5.25%
30/10/2015 84,518 0.04
€400,000 Aviva 4.7291% 28/11/2014 (Perpetual) 354,606 0.17
£322,000 Barclays Bank 10% 21/5/2021 666,503 0.32
US$100,000 Barclays Bank '144A' 7.434%
15/12/2017 (Perpetual) 82,500 0.04
€520,000 BAT International Finance 5.875%
12/3/2015 813,325 0.39
€250,000 Britannia Building Society FRN
18/5/2016 209,233 0.10
€500,000 Hammerson 4.875% 19/6/2015 651,058 0.32
£50,000 Hammerson 5.25% 15/12/2016 74,999 0.04
€450,000 HSBC Holdings 6% 10/6/2019 681,423 0.33
£35,000 JTI UK Finance 5.75% 6/2/2013 60,985 0.03
€100,000 Lehman Brothers UK Capital Funding II
3.875% 22/2/2011 (Perpetual) 200 0.00
€125,000 Lloyds TSB Bank 6.25% 15/4/2014 192,222 0.09
US$400,000 Northern Rock '144A' 5.625% 22/6/2017 360,796 0.18
€400,000 Old Mutual 4.5% 18/1/2017 388,380 0.19
£100,000 Royal Bank of Scotland 5% 18/3/2011
(Perpetual) 112,004 0.05
£250,000 Royal Bank of Scotland 6.625%
17/9/2018 441,976 0.21
€290,000 Severn Trent Utilities Finance 5.25%
11/3/2016 433,483 0.21
€20,000 SL Finance 6.375% 12/7/2022 26,053 0.01
US$400,000 Standard Chartered 7.014% 30/7/2037
(Perpetual) 316,000 0.15
£25,000 Standard Chartered Bank 8.103%
11/5/2016 (Perpetual) 40,339 0.02
£145,000 United Kingdom Gilt 4.25% 7/6/2032 244,927 0.12
Transferable Securities Admitted to an Official Stock Exchange
Listing or Dealt in on Another Regulated Market
Holding Description Value (US$) %
Transferable Securities Admitted to an Official Stock Exchange
Listing or Dealt in on Another Regulated Market
Holding Description Value (US$) %
Portfolio of Investments 31 August 2009

216 BlackRock Global Funds (BGF)
World Bond Fund continued
£400,000 United Kingdom Gilt 4.25% 7/9/2039 660,098 0.32
£190,000 United Kingdom Gilt 4.5% 7/12/2042 328,619 0.16
£235,000 United Kingdom Gilt 4.75% 7/12/2038 423,081 0.21
£815,000 United Kingdom Gilt 5% 7/9/2014 1,472,587 0.71
£580,000 United Kingdom Gilt 5% 7/3/2018 1,063,746 0.52
£275,000 United Kingdom Gilt 5.25% 7/6/2012 485,453 0.24
US$735,000 Vodafone Group 4.15% 10/6/2014 752,224 0.36
US$35,000 Vodafone Group 5% 15/9/2015 36,290 0.02
£20,000 Zurich Finance UK 6.625% 2/10/2022
(Perpetual) 29,137 0.01 ___________ ______
11,634,647 5.63 ___________ ______
United States
US$335,000 AEP Texas Central Transition Funding
4.98% 1/7/2013 356,266 0.17
US$185,000 Aetna 6% 15/6/2016 192,688 0.09
US$150,000 AT&T 6.5% 1/9/2037 163,263 0.08
€375,000 BA Covered Bond Issuer 4.25% 5/4/2017 509,231 0.25
US$1,325,000 Banc of America Commercial Mortgage
'2007-4 A4' 5.745% 10/2/2051 1,105,099 0.54
US$58,808 Banc of America Mortgage Securities
'2004-E 1A1' FRN 25/6/2034 54,642 0.03
US$75,000 Bank of America 5.75% 1/12/2017 72,834 0.04
US$227,215 BCAP Trust '2007-AA1 1A1' FRN
25/2/2047 128,844 0.06
US$280,000 Bear Stearns 6.95% 10/8/2012 312,777 0.15
US$76,474 Bear Stearns Adjustable Rate Mortgage
Trust '2004-6 3A' FRN 25/9/2034 69,211 0.03
US$145,000 Berkshire Hathaway Finance 4.125%
15/1/2010 147,217 0.07
US$650,000 Boeing 5% 15/3/2014 699,455 0.34
US$950,000 Bottling Group 5.125% 15/1/2019 1,004,240 0.49
US$50,000 Bristol-Myers Squibb 5.875% 15/11/2036 54,764 0.03
US$215,000 California State 7.55% 1/4/2039 229,949 0.11
US$1,475,000 California State Treasury 5.45 %
1/4/2015 1,489,868 0.72
US$92,150 Capital Auto Receivables Asset Trust
'2007-3 A3A' 5.02% 15/9/2011 94,007 0.05
US$600,000 Caterpillar 7.9% 15/12/2018 727,685 0.35
US$1,150,000 Cellco Partnership / Verizon Wireless
Capital '144A' 3.75% 20/5/2011 1,188,113 0.58
US$150,668 Chase Commercial Mortgage Securities
'1999-2 A2' 7.198% 15/1/2032 150,804 0.07
US$300,000 Citigroup 5.3% 17/10/2012 302,996 0.15
US$300,000 Citigroup 6.875% 5/3/2038 271,744 0.13
US$347,485 Citimortgage Alternative Loan Trust
'2007-A8 A1' 6% 25/10/2037 237,109 0.11
US$250,000 Coca-Cola 3.625% 15/3/2014 257,811 0.12
US$75,000 Comcast 6.5% 15/11/2035 80,810 0.04
US$95,000 Comcast 6.95% 15/8/2037 107,948 0.05
US$125,000 Comcast Cable Communications
Holdings 8.375% 15/3/2013 144,380 0.07
US$110,782 Countrywide Alternative Loan Trust
'2005-20CB 3A3' 5.5% 25/7/2035 98,736 0.05
US$46,645 Countrywide Alternative Loan Trust
'2006-OC8 2A1A' FRN 25/11/2036 45,987 0.02
US$289,168 Countrywide Asset-Backed Certificates
'2007-2 2A1' FRN 25/8/2037 253,821 0.12
US$40,909 Countrywide Home Loan Mortgage
Pass Through Trust '2004-29 1A1'
FRN 25/2/2035 26,032 0.01
US$272,261 CS First Boston Mortgage Securities
'2001-CKN5 A4' 5.435% 15/9/2034 280,503 0.14
US$120,000 CS First Boston Mortgage Securities
'2002-CKS4 A2' 5.183% 15/11/2036 123,587 0.06
US$126,272 Daimler Chrysler Auto Trust 4.98%
8/11/2011 129,002 0.06
US$525,000 Denbury Resources 7.5% 1/4/2013 570,876 0.28
US$37,132 Deutsche ALT-A Securities Inc Alternate
Loan Trust '2007-BAR1 A1' FRN
25/3/2037 36,745 0.02
US$500,000 Fannie Mae '4 9/09' 4% TBA 486,875 0.24
US$700,000 Fannie Mae '5 9/09' 5% TBA 728,547 0.35
US$300,000 Fannie Mae '5.5 9/09' 5.5% TBA 315,328 0.15
US$7,300,000 Fannie Mae '6 9/09' 6% TBA 7,672,986 3.71
US$157,190 Fannie Mae Pool '384491' 5.655%
1/11/2011 166,261 0.08
US$23,847 Fannie Mae Pool '545449' 6.5% 1/2/2017 25,709 0.01
US$93,095 Fannie Mae Pool '545903' 5.5% 1/9/2017 99,259 0.05
US$12,248 Fannie Mae Pool '589084' 6.5% 1/9/2031 13,223 0.01
US$17,840 Fannie Mae Pool '657415' 5.5% 1/8/2017 19,021 0.01
US$317,472 Fannie Mae Pool '675681' 5.5% 1/3/2018 338,197 0.16
US$24,848,544 Fannie Mae Pool '735667' 5%
1/7/2035 25,560,270 12.38
US$248,236 Fannie Mae Pool '735989' 5.5%
1/2/2035 259,651 0.13
US$102,102 Fannie Mae Pool '745832' 6% 1/4/2021 109,118 0.05
US$34,166 Fannie Mae Pool '745833' 6% 1/1/2021 36,472 0.02
US$222,318 Fannie Mae Pool '783390' 6.5% 1/9/2034 239,103 0.12
US$237,358 Fannie Mae Pool '826016' FRN 1/7/2035 246,802 0.12
US$27,417 Fannie Mae Pool '885501' 5.5% 1/6/2021 28,915 0.01
US$16,272 Fannie Mae Pool '889117' 5% 1/10/2035 16,772 0.01
US$843,374 Fannie Mae REMICS '2008-13 FC' FRN
25/6/2037 823,873 0.40
US$29,226 First Union National Bank Commercial
Mortgage '1999-C4 A2' 7.39%
15/12/2031 29,215 0.01
US$310,000 First Union National Bank Commercial
Mortgage '2001-C4 A2' 6.223%
12/12/2033 325,191 0.16
US$1,815,000 Ford Credit Auto Owner Trust
'2009-A A2B' FRN 15/8/2011 1,830,169 0.89
US$92,706 Freddie Mac Gold Pool 'B19552' 5%
1/8/2020 97,281 0.05
US$14,924 Freddie Mac Gold Pool 'G01443' 6.5%
1/8/2032 16,027 0.01
US$52,301 Freddie Mac Gold Pool 'G11720' 4.5%
1/8/2020 54,589 0.03
US$251,498 Freddie Mac Gold Pool 'G11769' 5%
1/10/2020 263,908 0.13
US$104,009 Freddie Mac Gold Pool 'G11777' 5%
1/10/2020 109,141 0.05
US$333,868 Freddie Mac Gold Pool 'G12454' 5.5%
1/11/2021 351,490 0.17
US$105,289 Freddie Mac Gold Pool 'G18052' 4.5%
1/5/2020 109,303 0.05
US$415,294 Freddie Mac Gold Pool 'J03831' 5%
1/11/2021 434,099 0.21
US$300,000 Ge Capital Commercial Mortgage
'2002-1A A3' 6.269% 10/12/2035 315,700 0.15
US$370,000 Ge Capital Commercial Mortgage
'2002-3A A2' 4.996% 10/12/2037 379,059 0.18
US$75,000 General Electric Capital 5% 15/11/2011 78,590 0.04
US$425,000 General Electric Capital 6.15% 7/8/2037 390,875 0.19
NZD380,000 General Electric Capital 6.625% 4/2/2010 261,097 0.13
US$850,000 General Mills 5.65% 15/2/2019 918,113 0.44
Transferable Securities Admitted to an Official Stock Exchange
Listing or Dealt in on Another Regulated Market
Holding Description Value (US$) %
Transferable Securities Admitted to an Official Stock Exchange
Listing or Dealt in on Another Regulated Market
Holding Description Value (US$) %
Portfolio of Investments 31 August 2009

Audited Annual Report and Accounts 217
The notes on pages 236 to 244 form an integral part of these financial statements.
World Bond Fund continued
US$3,000,000 Ginnie Mae '5 9/09' 5% TBA 3,080,157 1.49
US$8,000,000 Ginnie Mae 5.5% TBA 8,338,846 4.03
US$36,217 Ginnie Mae I Pool '437096' 6.5%
15/7/2031 39,126 0.02
US$13,872 Ginnie Mae I Pool '781276' 6.5% 15/4/2031 15,011 0.01
US$505,028 GMAC Commercial Mortgage Securities
'2000-C3 A2' 6.957% 15/9/2035 526,614 0.25
€1,381,000 Goldman Sachs Group 3.5% 8/12/2011 2,043,487 0.99
US$235,000 Goldman Sachs Group 5.25%
15/10/2013 248,107 0.12
US$275,000 Goldman Sachs Group 6.25% 1/9/2017 291,935 0.14
SEK1,000,000 Goldman Sachs Group FRN 23/1/2012 134,668 0.06
US$300,000 Greenwich Capital Commercial Funding
'2005-GG3 AAB' 4.619% 10/8/2042 298,965 0.14
US$68,965 GS Mortgage Securities II '2000-1A A'
FRN 20/3/2023 60,365 0.03
US$104,370 GSR Mortgage Loan Trust '2005-AR1 4A1'
FRN 25/1/2035 93,581 0.05
US$115,514 Home Equity Asset Trust '2007-2 2A1'
FRN 25/7/2037 106,203 0.05
US$18,531 Honda Auto Receivables Owner Trust
'2006-3 A3' 5.12% 15/10/2010 18,620 0.01
€400,000 HVB Funding Trust VIII 7.055% 28/3/2012
(Perpetual) 387,679 0.19
€50,000 Hypo Real Estate International Trust I
5.864% 14/6/2017 (Perpetual) 10,360 0.01
US$10,000 Icahn Enterprises Finance 8.125%
1/6/2012 9,900 0.00
US$125,000 International Business Machines 5.7%
14/9/2017 136,558 0.07
US$400,000 International Business Machines 7.625%
15/10/2018 489,437 0.24
US$450,000 JP Morgan Chase Capital XXV 6.8%
1/10/2037 424,075 0.20
US$290,000 JP Morgan Chase Commercial
Mortgage Securities '2001-C1 A3'
5.857% 12/10/2035 304,434 0.15
US$255,000 JP Morgan Chase Commercial
Mortgage Securities '2001-CIB2 A3'
6.429% 15/4/2035 261,005 0.13
US$200,000 JP Morgan Chase Commercial
Mortgage Securities '2002-C2 A2'
5.05% 12/12/2034 204,147 0.10
US$178,704 JP Morgan Mortgage Trust '2004-A5 3A1'
5.309% 25/12/2034 169,034 0.08
US$1,250,000 JPMorgan Chase & Co 6% 15/1/2018 1,343,839 0.65
US$145,000 Kraft Foods 6.5% 11/8/2017 161,928 0.08
US$329,244 LB-UBS Commercial Mortgage Trust
'2006-C7 A1' 5.279% 15/11/2038 335,801 0.16
US$175,000 Lincoln National 7% 17/5/2066 117,250 0.06
US$500,000 Merrill Lynch Mortgage Trust
'2002-MW1 A4' 5.619% 12/7/2034 508,118 0.25
US$400,000 MetLife 5.7% 15/6/2035 398,417 0.19
US$849,000 MetLife 6.75% 1/6/2016 927,730 0.45
US$100,000 Morgan Stanley 5.05% 21/1/2011 103,289 0.05
US$30,000 Morgan Stanley 5.55% 27/4/2017 29,958 0.01
US$420,000 Morgan Stanley 6.25% 28/8/2017 433,986 0.21
US$1,500,000 Morgan Stanley Capital I '2007-IQ14 A4'
5.692% 15/4/2049 1,167,099 0.56
US$65,691 Morgan Stanley Dean Witter Capital I
'2000-LIFE A2' 7.57% 15/11/2036 66,218 0.03
US$113,791 Morgan Stanley Home Equity Loans
'2007-2 A1' FRN 25/4/2037 88,026 0.04
US$850,000 New Jersey ST TPK Authority TPK
Receivables 7.414% 1/1/2040 1,032,924 0.50
US$35,000 News America 6.2% 15/12/2034 33,946 0.02
US$625,000 News America 6.4% 15/12/2035 619,823 0.30
US$575,000 Pacificorp 6% 15/1/2039 636,035 0.31
US$1,025,000 Princeton University 4.95% 1/3/2019 1,077,729 0.52
US$90,000 Progressive 6.7% 15/6/2037 72,223 0.03
US$239,417 Prudential Securities Secured Financing
'2000-C1 A2' 7.727% 17/5/2032 242,427 0.12
US$25,000 Qwest FRN 15/6/2013 23,250 0.01
US$54,904 Salomon Brothers Mortgage
Securities VII '2000-C1 A2'
7.52% 18/12/2009 55,245 0.03
US$298,397 Salomon Brothers Mortgage
Securities VII '2000-C3 A2'
6.592% 18/12/2033 306,661 0.15
C$250,000 SLM 4.3% 15/12/2009 223,026 0.11
US$170,000 SLM 5.4% 25/10/2011 148,124 0.07
US$43,517 Structured Asset Investment Loan Trust
'2006-BNC3 A2' FRN 25/9/2036 42,887 0.02
US$40,000 TCI Communications 7.125% 15/2/2028 42,419 0.02
US$50,000 TCI Communications 7.875% 15/2/2026 57,129 0.03
US$600,000 Time Warner Cable 8.25% 14/2/2014 701,391 0.34
US$470,000 United States Treasury Inflation Indexed
Bonds 1.75% 15/1/2028 452,987 0.22
US$300,000 United Technologies 5.375% 15/12/2017 326,140 0.16
US$4,070,000 US Treasury Bond 1% 31/7/2011 4,073,816 1.97
US$400,000 US Treasury Bond 2.625% 31/7/2014 403,625 0.20
US$1,275,000 US Treasury Bond 3.25% 31/7/2016 1,291,386 0.62
US$120,000 US Treasury Bond 3.5% 15/2/2039 105,427 0.05
US$1,330,000 US Treasury Bond 4.25% 15/5/2039 1,337,092 0.65
US$220,000 US Treasury Bond 4.5% 15/8/2039 230,433 0.11
US$1,190,000 USAA Auto Owner Trust '2008-3 A3'
4.28% 15/10/2012 1,228,191 0.59
US$350,000 Verizon Communications 8.75%
1/11/2018 442,320 0.21
US$15,000 Verizon New Jersey 'A' 5.875% 17/1/2012 16,066 0.01
US$425,000 Wachovia 5.75% 1/2/2018 445,569 0.22
US$365,000 Walgreen 5.25% 15/1/2019 390,765 0.19
US$83,000 WaMu Mortgage Pass Through
Certificates '2006-AR10 3A2'
FRN 25/8/2046 60,160 0.03
US$700,000 Waste Management 7.375% 11/3/2019 798,800 0.39
US$200,000 Wells Fargo & Co 4.375% 31/1/2013 206,855 0.10
US$145,000 Wells Fargo & Co 4.875% 12/1/2011 150,461 0.07 ___________ ______
95,518,578 46.25 ___________ ______
Total Bonds 216,655,443 104.90 ___________ ______
FUND MORTGAGE BACKED SECURITIES
United States
(US$22,400,000) Fannie Mae '5 9/09' 5% TBA (22,928,506) (11.10)
(US$200,000) Fannie Mae '5.5 9/09' 5.5% TBA (207,844) (0.10)
(US$200,000) Fannie Mae '6.5 9/09' 6.5% TBA (213,781) (0.11)___________ ______
Total Fund Mortgage Backed Securities (23,350,131) (11.31)___________ ______
Total Transferable Securities Admitted
to an Official Stock Exchange Listing or
Dealt in on Another Regulated Market 193,305,312 93.59 ___________ ______
Transferable Securities Admitted to an Official Stock Exchange
Listing or Dealt in on Another Regulated Market
Holding Description Value (US$) %
Transferable Securities Admitted to an Official Stock Exchange
Listing or Dealt in on Another Regulated Market
Holding Description Value (US$) %
Portfolio of Investments 31 August 2009

218 BlackRock Global Funds (BGF)
World Bond Fund continued
BONDS
France
US$700,000 Dexia Credit Local '144A' 2.375%
23/9/2011 709,460 0.34 ___________ ______
Germany
C$200,000 Landwirtschaftliche Rentenbank
4.875% 21/2/2020 180,786 0.09 ___________ ______
Netherlands
C$110,000 Bank Nederlandse Gemeenten 5.15%
7/3/2025 92,475 0.05 ___________ ______
United States
US$450,000 BAE Systems Holdings '144A' 4.95%
1/6/2014 464,657 0.22
US$80,000 BAE Systems Holdings 4.75% 15/8/2010 81,166 0.04
US$165,000 First Union National Bank Commercial
Mortgage '1999-C4 D' 7.936%
15/12/2031 164,641 0.08
US$880,000 Nissan Auto Receivables Owner Trust
'2009-1 A3' 5% 15/9/2014 920,928 0.45 ___________ ______
1,631,392 0.79 ___________ ______
Total Unquoted Securities 2,614,113 1.27 ___________ ______
Total Portfolio 195,919,425 94.86
Other Net Assets 10,610,311 5.14 ___________ ______
Total Net Assets (US$) 206,529,736 100.00 ___________ ______
Unquoted Securities
Holding Description Value (US$) %
Unquoted Securities
Holding Description Value (US$) %
Portfolio of Investments 31 August 2009
Unrealised profit/(loss)
US$DescriptionNominal
Value
Unrealised profit/(loss)
US$DescriptionNominal
Value
€150,000 Credit Default Swaps (Citibank)
(Fund receives default protection on
StMicroelectronics NV 0% 5/7/2013;
and pays Fixed 0.255%) (20/9/2012) 1,606
€300,000 Credit Default Swaps (Barclays)
(Fund receives default protection on
StMicroelectronics 0% 5/7/2013;
and pays Fixed 0.26%) (20/9/2012) 4,321
€100,000 Credit Default Swaps (Barclays)
(Fund provides default protection on
Imperial Tobacco Group Plc 6.25% 4/12/2018;
and receives Fixed 0.71%) (20/9/2012) (2,875)
€400,000 Credit Default Swaps (Barclays)
(Fund receives default protection on
Cadbury Schweppes 5.125% 1/10/2013;
and pays Fixed 0.54%) (20/12/2012) (6,650)
€450,000 Credit Default Swaps (Credit Suisse)
(Fund receives default protection on
Man Group Plc 3.75% 12/11/2009;
and pays Fixed 1.98%) (20/12/2013) 1,034
€4,500,000 Credit Default Swaps (Barclays)
(Fund receives default protection on
iTraxx Europe HiVol Series 11 Version;
and pays Fixed 3.75%) (20/6/2014) (230,976)
€300,000 Credit Default Swaps (Barclays)
(Fund provides default protection on
Imperial Tobacco Group Plc 6.25% 4/12/2018;
and receives Fixed 0.71%) (20/9/2012) (12,453)
€10,200,000 Interest Rate Swaps (Barclays)
(Fund receives Fixed 3.14%;
and pays Floating EUR Euribor 6 Month)
(5/5/2013) (8,220) __________
(254,213) __________
Swaps as at 31 August 2009
Note: The total market value of (US$572,963) of these transactions is included in the Statement of Net Assets (see Note 2c).
Value US$
Unrealised loss US$Description
NominalValue
US$ 30,100,000 Fund purchases a call option (expiring
5/11/2009) to enter into an Interest
Rate Swap (JP Morgan). If exercised
Fund receives 2.5% Fixed semi annually
from 9/5/2010; and pays Floating
US$ Libor 3-month -BBA quarterly
from 9/2/2010; (5/11/2009) (127,925) 12,040 ___________ _________
(127,925) 12,040 ___________ _________
Swaptions as at 31 August 2009
Note: Swaptions are included in the Statement of Net Assets (see Note 2c).

Audited Annual Report and Accounts 219
The notes on pages 236 to 244 form an integral part of these financial statements.
World Bond Fund continued
Open Forward Foreign Exchange Transactions as at 31 August 2009
Core Fund US$
€ 8,397,700 US$11,902,717 16/9/2009 96,866 96,866
US$73,198,355 € 52,531,500 16/9/2009 (1,864,597) (1,864,597)
MXN24,315,000 US$1,878,302 18/9/2009 (54,443) (54,443)
US$1,867,027 MXN24,315,000 18/9/2009 43,168 43,168
US$1,514,095 ZAR12,665,000 18/9/2009 (105,411) (105,411)
PLN4,125,000 HUF263,587,500 25/9/2009 59,450 59,450
CAD4,411,000 US$4,022,360 28/10/2009 (31,188) (31,188)
NOK7,038,000 US$1,157,974 28/10/2009 6,964 6,964
US$4,103,419 AUD4,959,000 28/10/2009 (25,243) (25,243)
US$15,705,840 CAD17,054,500 28/10/2009 274,546 274,546
US$42,557 DKK222,000 28/10/2009 (11) (11)
US$11,560,819 £ 7,073,000 28/10/2009 80,411 80,411
US$29,037,633 ¥ 2,726,128,500 28/10/2009 (291,569) (291,569)
US$396,939 NZD590,500 28/10/2009 (3,465) (3,465)
US$552,015 ZAR4,519,000 28/10/2009 (21,452) (21,452)__________ __________
Net unrealised loss (1,835,974) (1,835,974)__________ __________
EUR Hedged Share Class €
€13,437,440 US$18,992,077 15/9/2009 146,169 208,873 __________ __________
Net unrealised profit 146,169 208,873 __________ __________
CHF Hedged Share Class CHF
CHF54,082,667 US$49,810,868 15/9/2009 1,189,159 1,119,735 __________ __________
Net unrealised profit 1,189,159 1,119,735 __________ __________
Total net unrealised loss (507,366)__________
Note: The net unrealised loss attributed to these transactions is included in the Statement
of Net Assets (see Note 2c).
Unrealised
profit/(loss)
US$ Equivalent
Unrealised
profit/(loss)Value dateSalesPurchases
Open Futures Contracts as at 31 August 2009
143 Australian 3 Year Bond September 2009 32,123,118
24 Euro BOBL September 2009 3,986,679
(1) Japanese 10 Year Bond (TSE) September 2009 (1,496,263)
(2) Euro Bund September 2009 (350,228)
29 US Long Bond (CBT) December 2009 3,451,906
16 US Treasury 10 Year Note December 2009 1,870,500
11 Long Gilt December 2009 2,117,692
(10) US Treasury 5 Year Note (CBT) December 2009 (1,150,313)
(75) Euro Schatz December 2009 (11,547,972)
(114) US Treasury 2 Year Note (CBT) December 2009 (24,647,156)__________
Total commitment 4,357,963 __________
Note: The net unrealised loss of US$173,138 attributed to these transactions is included
in the Statement of Net Assets (see Note 2c).
Value
US$
Expiration
dateContracts/Description
Number
of Contracts

220 BlackRock Global Funds (BGF)
World Energy Fund
FUNDS
United Kingdom
113,380,334 Institutional Cash Series Institutional
Liquidity Fund 113,380,334 3.40 _____________ ______
Total Funds 113,380,334 3.40 _____________ ______
COMMON STOCKS (SHARES)
Brazil
29,800 OGX Petroleo e Gas Participacoes 16,320,573 0.49
2,579,000 Petroleo Brasileiro ADR 87,324,940 2.61 _____________ ______
103,645,513 3.10 _____________ ______
Canada
7,232,000 Bayou Bend Petroleum 4,122,282 0.12
1,630,000 Canadian Natural Resources 93,187,100 2.79
700,000 Enbridge 25,795,932 0.77
1,120,000 EnCana 58,692,869 1.76
886,894 Niko Resources 57,213,697 1.71
2,258,600 Suncor Energy 69,499,987 2.08
2,956,774 Uex 2,862,468 0.09
9,376,450 Ur-Energy 7,804,859 0.24
1,006,650 Verenex Energy 6,739,831 0.20 _____________ ______
325,919,025 9.76 _____________ ______
France
2,078,300 Total* 118,387,837 3.54 _____________ ______
India
11,745,952 Cairn India 63,727,638 1.91 _____________ ______
Indonesia
49,500,000 Bumi Resources 14,241,070 0.43
7,142,860 Mitra Energia 20,000,008 0.60 _____________ ______
34,241,078 1.03 _____________ ______
Italy
5,650,000 ENI 132,564,940 3.97 _____________ ______
Norway
2,316,738 StatoilHydro 50,855,342 1.52 _____________ ______
Russia
818,400 Gazprom OAO ADR 17,350,080 0.52 _____________ ______
South Africa
418,800 Sasol 15,981,446 0.48 _____________ ______
Switzerland
611,120 Transocean 46,530,677 1.39
3,450,000 Weatherford International 68,758,500 2.06 _____________ ______
115,289,177 3.45 _____________ ______
United Kingdom
7,918,000 BG Group 130,713,927 3.91
23,056,324 BP 199,107,267 5.96
1,044,957 Cairn Energy 42,524,397 1.27
650,000 Dana Petroleum 14,855,984 0.45
5,380,000 Royal Dutch Shell 'B' 146,191,843 4.38 _____________ ______
533,393,418 15.97 _____________ ______
United States
2,557,009 Anadarko Petroleum 136,263,010 4.08
967,000 Apache 82,262,690 2.46
440,218 Caithness Petroleum 24,999,980 0.75
500,000 Cameron International 17,885,000 0.54
2,579,100 Chevron 179,789,061 5.38
2,170,000 ConocoPhillips 97,650,000 2.92
640,000 Consol Energy 23,936,000 0.72
5,220,772 Denbury Resources 77,476,256 2.32
520,000 Devon Energy 31,517,200 0.94
1,137,000 EOG Resources 81,170,430 2.43
2,905,500 Exxon Mobil 202,251,855 6.06
2,101,700 Halliburton 49,389,950 1.48
711,000 Hess 35,905,500 1.08
917,100 Marathon Oil 28,219,167 0.84
633,012 National Oilwell Varco 22,953,015 0.69
1,640,000 Newfield Exploration 63,107,200 1.89
550,000 Noble Energy 33,280,500 1.00
1,830,000 Occidental Petroleum 133,718,100 4.00
1,229,000 Range Resources 60,282,450 1.81
2,211,100 Schlumberger 124,308,042 3.72
1,344,400 Southwestern Energy 49,823,464 1.49
3,681,972 Valero Energy 67,932,383 2.03
1,580,000 Xto Energy 60,687,800 1.82 _____________ ______
1,684,809,053 50.45 _____________ ______
Total Common Stocks (Shares) 3,196,164,547 95.70 _____________ ______
Total Portfolio 3,309,544,881 99.10
Other Net Assets 30,119,911 0.90 _____________ ______
Total Net Assets (US$) 3,339,664,792 100.00 _____________ ______
Transferable Securities Admitted to an Official Stock Exchange
Listing or Dealt in on Another Regulated Market
Holding Description Value (US$) %
Transferable Securities Admitted to an Official Stock Exchange
Listing or Dealt in on Another Regulated Market
Holding Description Value (US$) %
Portfolio of Investments 31 August 2009
(*) Securities lent, see Note 11, for further details.

Audited Annual Report and Accounts 221
The notes on pages 236 to 244 form an integral part of these financial statements.
World Energy Fund continued
Open Forward Foreign Exchange Transactions as at 31 August 2009
EUR Hedged Share Class €
US$7,902,595 €5,582,673 15/9/2009 (52,180) (74,564)
€78,285,404 US$110,845,539 15/9/2009 712,098 1,017,574 __________ __________
Net unrealised profit 659,918 943,010 __________ __________
SGD Hedged Share Class SGD
SGD11,363,213 US$7,863,749 15/9/2009 9,647 6,683
US$895,750 SGD1,294,252 15/9/2009 (981) (680)__________ __________
Net unrealised profit 8,666 6,003 __________ __________
Total net unrealised profit 949,013 __________
Note: The net unrealised profit attributed to these transactions is included in the Statement
of Net Assets (see Note 2c).
Unrealised
profit/(loss)
US$ Equivalent
Unrealised
profit/(loss)Value dateSalesPurchases
Sector Breakdown as at 31 August 2009
Integrated oil & gas 50.60
Oil & gas exploration & products 30.94
Oil & gas equipment & services 8.49
Investment funds 3.40
Oil & gas refining & marketing 2.03
Coal & consumable fuels 1.48
Oil & gas drilling 1.39
Oil & gas storage & transportation 0.77
Other net assets 0.90 __________
100.00 __________
% of net
assets

222 BlackRock Global Funds (BGF)
World Financials Fund
COMMON STOCKS (SHARES)
Australia
131,300 Australia & New Zealand Banking Group 2,338,063 0.99
84,050 Commonwealth Bank of Australia 3,233,787 1.37
110,000 National Australia Bank 2,620,285 1.11
58,850 QBE Insurance Group 1,126,207 0.47
168,850 Westpac Banking 3,441,695 1.46 ___________ ______
12,760,037 5.40 ___________ ______
Belgium
32,400 KBC Groep 1,222,239 0.52 ___________ ______
Bermuda
18,100 Arch Capital Group 1,165,640 0.50
31,100 PartnerRe 2,297,357 0.97
75,450 RenaissanceRe Holdings 4,092,408 1.73 ___________ ______
7,555,405 3.20 ___________ ______
Canada
160,200 Bank of Nova Scotia 6,653,106 2.81
35,300 Royal Bank of Canada 1,787,945 0.76 ___________ ______
8,441,051 3.57 ___________ ______
Egypt
212,400 Commercial International Bank 2,079,422 0.88 ___________ ______
Finland
81,500 Sampo 'A' 1,955,309 0.83 ___________ ______
France
238,300 AXA 5,403,908 2.29
50,900 BNP Paribas 4,125,353 1.75
37,050 Societe Generale* 2,965,247 1.25
6,450 Unibail-Rodamco (Reit) 1,271,879 0.54 ___________ ______
13,766,387 5.83 ___________ ______
Germany
34,150 Allianz SE 3,930,153 1.66
38,550 Deutsche Euroshop 1,230,043 0.52
29,600 Muenchener Rueckversicherungs 4,371,287 1.85 ___________ ______
9,531,483 4.03 ___________ ______
Hong Kong
1,102,300 Franshion Properties China 310,025 0.13
479,700 Link REIT (Reit) 1,057,057 0.45 ___________ ______
1,367,082 0.58 ___________ ______
Indonesia
3,469,200 Bank Rakyat Indonesia 2,615,666 1.10 ___________ ______
Italy
118,450 Credito Emiliano 726,528 0.31
389,700 Intesa Sanpaolo 1,670,547 0.70
574,200 UniCredit 2,075,825 0.88 ___________ ______
4,472,900 1.89 ___________ ______
Japan
32,950 Mitsubishi Estate 546,775 0.23
556,200 Mitsubishi UFJ Financial Group 3,553,076 1.50
138,000 Sumitomo Mitsui Financial Group 5,951,283 2.52
107,400 Tokio Marine Holdings 3,199,419 1.36 ___________ ______
13,250,553 5.61 ___________ ______
Norway
816,800 DnB NOR 8,192,997 3.47 ___________ ______
Singapore
409,000 DBS Group Holdings 3,581,118 1.51
307,600 United Overseas Bank 3,558,370 1.51 ___________ ______
7,139,488 3.02 ___________ ______
Spain
285,300 Banco Bilbao Vizcaya Argentaria 5,055,109 2.14
481,950 Bancontander 7,392,837 3.13 ___________ ______
12,447,946 5.27 ___________ ______
Switzerland
44,900 ACE 2,338,841 0.99
69,150 Credit Suisse Group 3,444,460 1.46
87,100 Julius Baer Holding 4,408,288 1.87
30,600 Swiss Reinsurance 1,411,281 0.60
388,350 UBS 7,097,774 3.00
11,350 Zurich Financial Services 2,486,942 1.05 ___________ ______
21,187,586 8.97 ___________ ______
United Kingdom
97,400 Amlin 583,722 0.25
1,059,120 HSBC Holdings 11,554,854 4.89
1,631,650 Lloyds TSB Group 2,948,924 1.25
291,158 Standard Chartered 6,597,806 2.79 ___________ ______
21,685,306 9.18 ___________ ______
United States
50,200 Affiliated Managers Group 3,218,824 1.36
34,350 AON 1,440,983 0.61
79,500 Bancorpsouth 1,826,115 0.77
524,409 Bank of America 9,271,551 3.92
70,650 Bank of New York Mellon 2,016,351 0.85
14,500 CME Group 4,152,945 1.76
57,950 Cullen/Frost Bankers 2,833,755 1.20
97,050 Fidelity National Financial 'A' 1,455,750 0.62
31,100 Franklin Resources 2,871,774 1.22
56,950 Goldman Sachs Group 9,210,524 3.90
276,100 JPMorgan Chase & Co 11,794,992 4.99
21,050 Macerich (Reit) 608,345 0.26
99,550 Metlife 3,753,035 1.59
51,900 Northern Trust 3,006,567 1.27
88,800 People's United Financial 1,432,344 0.61
11,050 ProAssurance 589,407 0.25
25,419 Prudential Financial 1,301,707 0.55
30,150 Public Storage (Reit) 2,147,585 0.91
15,250 Regency Centers (Reit) 503,708 0.21
58,569 Simon Property Group (Reit) 3,725,574 1.58
192,300 US Bancorp 4,290,213 1.82
80,300 Visa 'A' 5,688,452 2.41
409,800 Wells Fargo & Co 11,199,834 4.74 ___________ ______
88,340,335 37.40 ___________ ______
Total Portfolio 238,011,192 100.75
Other Net Liabilities (1,776,879) (0.75)___________ ______
Total Net Assets (US$) 236,234,313 100.00 ___________ ______
Transferable Securities Admitted to an Official Stock Exchange
Listing or Dealt in on Another Regulated Market
Holding Description Value (US$) %
Transferable Securities Admitted to an Official Stock Exchange
Listing or Dealt in on Another Regulated Market
Holding Description Value (US$) %
Portfolio of Investments 31 August 2009
(*) Securities lent, see Note 11, for further details.

Audited Annual Report and Accounts 223
The notes on pages 236 to 244 form an integral part of these financial statements.
World Financials Fund continued
Sector Breakdown as at 31 August 2009
Diversified banks 47.16
Other diversified financial services 8.91
Asset management & custody 6.57
Multi-line insurance 5.83
Reinsurance 5.65
Diversified capital markets 4.46
Property & casualty insurance 3.94
Investment banking & brokerage 3.90
Retail REITs 3.04
Data processing & outsourced services 2.41
Life & health insurance 2.14
Regional banks 1.97
Specialised finance 1.76
Specialised REITs 0.91
Insurance brokers 0.61
Thrifts & mortgage finance 0.61
Real estate operating companies 0.52
Diversified real estate activities 0.36
Other net liabilities (0.75)__________
100.00 __________
% of net
assets

224 BlackRock Global Funds (BGF)
World Gold Fund
FUNDS
United Kingdom
35,208,355 Institutional Cash Series Institutional
Liquidity Fund 35,208,355 0.63 _____________ ______
Total Funds 35,208,355 0.63 _____________ ______
COMMON STOCKS (SHARES)
Australia
4,000,000 Avoca Resources 5,854,824 0.11
20,500,000 Newcrest Mining 514,559,586 9.18
9,642,425 Sino Gold Mining 53,954,566 0.96 _____________ ______
574,368,976 10.25 _____________ ______
Canada
3,950,000 Agnico-Eagle Mines 225,473,958 4.02
1,300,000 Alamos Gold 11,644,405 0.21
5,950,000 Barrick Gold 206,465,000 3.68
5,500,000 Centerra Gold 32,345,570 0.58
15,000,000 Eldorado Gold 154,851,590 2.76
1,250,000 European Goldfields 3,879,207 0.07
4,300,000 Franco-Nevada 108,545,400 1.94
10,200,000 Goldcorp 370,623,234 6.61
2,500,000 Harry Winston Diamond 14,204,908 0.25
11,000,000 IAMGOLD 127,292,259 2.27
23,500,000 Kinross Gold 448,205,554 8.00
5,500,000 Red Back Mining 56,430,579 1.01
22,000,000 Rusoro Mining 7,762,937 0.14
13,000,000 Yamana Gold 119,031,698 2.12 _____________ ______
1,886,756,299 33.66 _____________ ______
China
220,000,000 Zijin Mining Group 183,924,081 3.28 _____________ ______
Hong Kong
700,000,000 G-Resources Group 42,897,557 0.77 _____________ ______
Jersey
618,707 KazakhGold Group GDR 3,254,399 0.06
4,253,648 Randgold Resources ADR 246,158,610 4.39 _____________ ______
249,413,009 4.45 _____________ ______
Mexico
11,000,000 Industrias Penoles SAB de CV 168,582,290 3.01 _____________ ______
Papua New Guinea
115,000,000 Lihir Gold 266,436,320 4.75 _____________ ______
Peru
12,350,000 Cia de Minas Buenaventura ADR 311,714,000 5.56
17,000,000 Gold Fields La Cima 14,685,342 0.26 _____________ ______
326,399,342 5.82 _____________ ______
Russian Federation
4,721,400 Polymetal 'CLS' 37,836,873 0.67
3,400,000 Polymetal GDR 27,030,000 0.48
42,991 Polyus Gold 1,633,658 0.03
2,400,000 Polyus Gold ADR 47,520,000 0.85 _____________ ______
114,020,531 2.03 _____________ ______
South Africa
6,500,000 African Rainbow Minerals 132,561,772 2.36
4,500,000 AngloGold Ashanti ADR 170,730,000 3.04
14,000,000 Gold Fields 167,360,039 2.99
3,000,000 Gold Fields ADR 35,820,000 0.64
13,000,000 Harmony Gold Mining 120,889,666 2.16
7,000,000 Harmony Gold Mining ADR 64,890,000 1.16
11,700,000 Impala Platinum Holdings 271,776,644 4.85 _____________ ______
964,028,121 17.20 _____________ ______
United Kingdom
28,500,000 Fresnillo 288,447,467 5.15
14,000,000 Hochschild Mining 64,585,871 1.15
4,836,040 Peter Hambro Mining 60,563,536 1.08 _____________ ______
413,596,874 7.38 _____________ ______
United States
7,700,000 Newmont Mining 310,233,000 5.53 _____________ ______
Total Common Stocks (Shares) 5,500,656,400 98.13 _____________ ______
BONDS
Canada
C$7,416,000 Jaguar Mining 10.5% 23/3/2012 6,709,783 0.12 _____________ ______
United Kingdom
US$10,000,000 Peter Hambro Mining Group Finance
7% 19/10/2012 9,819,000 0.17
US$8,400,000 Peter Hambro Mining Group Finance
7.125% 11/8/2010 9,311,400 0.17 _____________ ______
19,130,400 0.34 _____________ ______
Total Bonds 25,840,183 0.46 _____________ ______
Total Transferable Securities Admitted
to an Official Stock Exchange Listing or
Dealt in on Another Regulated Market 5,561,704,938 99.22 _____________ ______
Unquoted Securities
COMMON STOCKS (SHARES)
International
2,956 Grafton Resource Investments 108,252 0.00 _____________ ______
Russian Federation
5,317,500 Vysochajshiy 45,578,526 0.81 _____________ ______
Total Unquoted Securities 45,686,778 0.81 _____________ ______
Total Portfolio 5,607,391,716 100.03
Other Net Liabilities (1,513,548) (0.03)_____________ ______
Total Net Assets (US$) 5,605,878,168 100.00 _____________ ______
Transferable Securities Admitted to an Official Stock Exchange
Listing or Dealt in on Another Regulated Market
Holding Description Value (US$) %
Transferable Securities Admitted to an Official Stock Exchange
Listing or Dealt in on Another Regulated Market
Holding Description Value (US$) %
Portfolio of Investments 31 August 2009

Audited Annual Report and Accounts 225
The notes on pages 236 to 244 form an integral part of these financial statements.
World Gold Fund continued
Open Forward Foreign Exchange Transactions as at 31 August 2009
EUR Hedged Share Class €
€195,997,100 US$277,257,851 15/9/2009 1,963,059 2,805,171
US$29,623,349 €20,928,697 15/9/2009 (197,316) (281,961)__________ __________
Net unrealised profit 1,765,743 2,523,210 __________ __________
SGD Hedged Share Class SGD
SGD1,266,490 US$876,712 15/9/2009 707 490
US$78,521 SGD113,831 15/9/2009 (464) (321)__________ __________
Net unrealised profit 243 169 __________ __________
Total net unrealised profit 2,523,379 __________
Note: The net unrealised profit attributed to these transactions is included in the Statement
of Net Assets (see Note 2c).
Unrealised
profit/(loss)
US$ Equivalent
Unrealised
profit/(loss)Value dateSalesPurchases
Sector Breakdown as at 31 August 2009
Gold 73.74
Precious metals & minerals 21.12
Diversified metals & mining 3.77
Internet software & services 0.77
Investment funds 0.63
Other net liabilities (0.03)__________
100.00 __________
% of net
assets

226 BlackRock Global Funds (BGF)
World Healthscience Fund
COMMON STOCKS (SHARES)
Germany
43,700 Bayer 2,673,839 0.87 ___________ ______
Ireland
95,000 Covidien 3,725,900 1.21
189,200 Warner Chilcott 'A' 3,905,088 1.26 ___________ ______
7,630,988 2.47 ___________ ______
Jersey
147,000 Shire ADR 7,232,400 2.34 ___________ ______
United States
180,000 Abbott Laboratories 8,200,800 2.66
175,000 Aetna 5,024,250 1.63
103,000 Alexion Pharmaceuticals 4,606,160 1.49
59,000 Allergan 3,249,130 1.05
291,300 AmerisourceBergen 6,146,430 1.99
148,300 Amgen 8,826,816 2.86
191,000 Baxter International 10,890,820 3.53
14,400 Beckman Coulter 954,000 0.31
30,000 Becton Dickinson & Co 2,095,500 0.68
100,000 Biogen Idec 4,949,000 1.60
178,900 Boston Scientific 2,041,249 0.66
77,400 Bristol-Myers Squibb 1,680,354 0.54
370,000 Celgene 19,214,100 6.22
170,000 Cephalon 9,591,400 3.11
10,400 Charles River Laboratories International 355,992 0.11
63,000 Covance 3,355,380 1.09
222,000 Emdeon 'A' 3,785,100 1.22
170,300 Express Scripts 12,184,965 3.95
206,500 Genoptix 5,996,760 1.94
95,000 Gen-Probe 3,667,000 1.19
286,000 Genzyme 15,535,520 5.03
320,000 Gilead Sciences 14,358,400 4.65
711,000 HLTH 10,181,520 3.30
394,600 Hologic 6,396,466 2.07
28,377 Invitrogen 1,274,127 0.41
135,000 Johnson & Johnson 8,121,600 2.63
91,000 Laboratory Corporation
of America Holdings 6,334,510 2.05
352,700 Masimo 8,835,135 2.86
185,000 Medco Health Solutions 10,119,500 3.28
164,600 Merck & Co 5,306,704 1.72
132,000 Mylan 1,925,880 0.62
20,700 NuVasive 827,379 0.27
120,000 Onyx Pharmaceuticals 3,813,600 1.24
125,000 Pfizer 2,078,750 0.67
68,000 Quest Diagnostics 3,669,280 1.19
217,756 Schering-Plough 6,114,588 1.98
286,800 SonoSite 6,711,120 2.17
40,000 St Jude Medical 1,540,000 0.50
118,900 Thermo Fisher Scientific 5,333,854 1.73
180,000 UnitedHealth Group 4,998,600 1.62
55,700 Varian Medical Systems 2,303,195 0.75
300,000 Vertex Pharmaceuticals 11,043,000 3.58
41,900 Waters 2,110,503 0.68
112,600 WebMD Health 'A' 3,673,012 1.19
87,700 WellCare Health Plans 2,130,233 0.69
180,000 WellPoint 9,540,000 3.09
79,000 Wright Medical Group 1,279,792 0.41
214,700 Wyeth 10,260,513 3.32 ___________ ______
282,631,987 91.53 ___________ ______
Total Portfolio 300,169,214 97.21
Other Net Assets 8,606,156 2.79 ___________ ______
Total Net Assets (US$) 308,775,370 100.00 ___________ ______
Transferable Securities Admitted to an Official Stock Exchange
Listing or Dealt in on Another Regulated Market
Holding Description Value (US$) %
Transferable Securities Admitted to an Official Stock Exchange
Listing or Dealt in on Another Regulated Market
Holding Description Value (US$) %
Portfolio of Investments 31 August 2009
Sector Breakdown as at 31 August 2009
Biotechnology 29.78
Pharmaceuticals 19.66
Healthcare equipment 16.61
Healthcare services 13.63
Managed healthcare 7.03
Life sciences tools & services 4.02
Healthcare technology 3.30
Healthcare distributors 1.99
Internet software & services 1.19
Other net assets 2.79 __________
100.00 __________
% of net
assets

Audited Annual Report and Accounts 227
The notes on pages 236 to 244 form an integral part of these financial statements.
World Income Fund
BONDS
ArgentinaUS$2,963,758 Argentina Government International
Bond 8.28% 31/12/2033 1,757,509 0.55
A$2,010,000 New South Wales Treasury 5.25%
1/5/2013 1,666,459 0.52 ___________ ______
3,423,968 1.07 ___________ ______
AustraliaA$3,230,000 Queensland Treasury 6% 14/9/2017 2,705,663 0.85 ___________ ______
BermudaUS$567,000 AES China Generating 8.25%
26/6/2010 548,580 0.17 ___________ ______
BrazilUS$500,000 Brazilian Government International
Bond 5.875% 15/1/2019 515,750 0.16
US$90,000 Brazilian Government International
Bond 7.125% 20/1/2037 100,332 0.03
US$736,667 Brazilian Government International
Bond 8% 15/1/2018 843,483 0.26
US$2,580,000 Brazilian Government International
Bond 8.25% 20/1/2034 3,212,100 1.01
US$4,000,000 Brazilian Government International
Bond 10.5% 14/7/2014 5,064,000 1.58 ___________ ______
9,735,665 3.04 ___________ ______
CanadaC$11,155,000 Canadian Government Bond 3.75%
1/6/2012 10,628,243 3.32
C$2,691,000 Canadian Government Bond 5%
1/6/2037 2,883,949 0.90
US$1,700,000 Export Development Canada 2.375%
19/3/2012 1,732,215 0.54
US$1,200,000 Province of Ontario Canada 4.1%
16/6/2014 1,258,978 0.40 ___________ ______
16,503,385 5.16 ___________ ______
ColombiaUS$1,070,000 Colombia Government International
Bond 7.375% 18/9/2037 1,124,356 0.35 ___________ ______
Denmark€1,000,000 Kingdom of Denmark 3.125%
17/3/2014 1,455,074 0.45
€1,125,000 Kommunekredit 4.375% 2/10/2012 1,682,226 0.53
DKK4,411,753 Realkredit Danmark FRN
1/10/2038 808,394 0.25 ___________ ______
3,945,694 1.23 ___________ ______
Dominican RepublicUS$737,759 Dominican Republic International
Bond 9.04% 23/1/2018 684,272 0.21 ___________ ______
France€1,000,000 AUTO ABS '2007-1 A' FRN 25/2/2019 1,309,874 0.41
€1,525,000 AXA 5.777% 6/7/2016 (Perpetual) 1,717,816 0.54
€500,000 Credit Agricole Covered Bonds 3.5%
21/7/2014 728,087 0.23
€45,000 France Government Bond OAT 4%
25/10/2038 63,064 0.02
€6,840,000 France Government Bond OAT 4.25%
25/10/2018 10,401,027 3.25
€5,225,000 France Government Bond OAT 4.25%
25/4/2019 7,930,669 2.48
US$1,805,000 Societe Financement de l'Economie
Francaise 3.375% 5/5/2014 1,845,721 0.57 ___________ ______
23,996,258 7.50 ___________ ______
GermanyUS$3,140,000 ABN Amro Bank/Deutschland for
OAO Gazprom 9.625% 1/3/2013 3,413,337 1.07
€4,300,000 Bundesrepublik Deutschland '01' 5%
4/7/2011 6,553,097 2.05
€313,000 Bundesrepublik Deutschland 3.5%
4/7/2019 456,040 0.14
€11,185,000 Bundesrepublik Deutschland 4.25%
4/1/2014 17,212,847 5.38
€3,345,000 Bundesrepublik Deutschland 4.25%
4/7/2039 5,007,148 1.57
€9,005,000 Bundesrepublik Deutschland 4.75%
4/7/2034 14,199,690 4.44
€1,310,000 Bundesrepublik Deutschland 6.5%
4/7/2027 2,474,800 0.77
US$3,350,000 Kreditanstalt fuer Wiederaufbau 3.5%
10/3/2014 3,463,356 1.08 ___________ ______
52,780,315 16.50 ___________ ______
Greece€1,770,000 Hellenic Republic Government Bond
FRN 20/2/2013 2,627,189 0.82 ___________ ______
International¥315,700,000 European Investment Bank 1.4%
20/6/2017 3,435,924 1.08
US$825,000 European Investment Bank 3.125%
4/6/2014 840,015 0.26 ___________ ______
4,275,939 1.34 ___________ ______
Ireland€500,000 Cars Alliance Funding '2007-1 A'
FRN 8/10/2023 668,137 0.21
€550,000 GE Capital European Funding 4.375%
30/3/2011 805,631 0.25
€1,102,623 Talisman Finance '7 A' FRN
22/4/2017 892,947 0.28 ___________ ______
2,366,715 0.74 ___________ ______
Italy€500,000 Auto ABS '2007-2 A' FRN
25/10/2020 680,808 0.21
€2,100,000 Italy Buoni Poliennali del Tesoro 4%
1/2/2037 2,610,017 0.82 ___________ ______
3,290,825 1.03 ___________ ______
Japan¥170,200,000 Japan Government Fifteen Year Bond
FRN 20/3/2021 1,828,755 0.57
¥519,000,000 Japan Government Twenty Year Bond
2.1% 20/12/2027 5,642,942 1.76
¥671,000,000 Japanese Government CPI Linked
Bond 1.2% 10/6/2017 6,675,001 2.09
¥130,800,000 Japanese Government CPI Linked
Bond 1.2% 10/12/2017 1,287,752 0.40
¥720,200,000 Japanese Government CPI Linked
Bond 1.3% 10/9/2017 7,167,899 2.24
¥30,500,000 Japanese Government CPI Linked
Bond 1.4% 10/3/2018 302,110 0.10
¥162,708,000 JLOC '37X A1' FRN 15/1/2015 1,652,715 0.52
¥95,802,000 JLOC '36X A1' FRN 16/2/2016 1,033,587 0.32 ___________ ______
25,590,761 8.00 ___________ ______
Transferable Securities Admitted to an Official Stock Exchange
Listing or Dealt in on Another Regulated Market
Holding Description Value (US$) %
Transferable Securities Admitted to an Official Stock Exchange
Listing or Dealt in on Another Regulated Market
Holding Description Value (US$) %
Portfolio of Investments 31 August 2009

228 BlackRock Global Funds (BGF)
World Income Fund continued
Jersey
€250,000 UBS Capital Securities (Jersey)
8.836% 11/4/2013 (Perpetual) 326,329 0.10 ___________ ______
Mexico
MXN33,210,000 Mexican Bonos 7.75% 14/12/2017 2,454,715 0.77
MXN26,206,000 Mexican Bonos 9.5% 18/12/2014 2,146,986 0.67
US$838,000 Mexico Government International
Bond 8.3% 15/8/2031 1,026,550 0.32 ___________ ______
5,628,251 1.76 ___________ ______
Netherlands
€500,000 ABN Amro Bank 3.75% 15/7/2014 731,202 0.23
€650,000 Fortis Bank Nederland Holding 3.375%
19/5/2014 948,547 0.30
€800,000 LeasePlan 3.25% 22/5/2014 1,159,566 0.36
US$1,000,000 Telefonica Europe 7.75% 15/9/2010 1,060,795 0.33 ___________ ______
3,900,110 1.22 ___________ ______
Norway
€1,100,000 Eksportfinans 4.375% 20/9/2010 1,618,476 0.50
US$700,000 Kommunalbanken AS 5.125%
30/5/2012 757,645 0.24 ___________ ______
2,376,121 0.74 ___________ ______
Peru
US$1,175,000 Peruvian Government International
Bond 6.55% 14/3/2037 1,180,875 0.37
US$433,000 Peruvian Government International
Bond 7.35% 21/7/2025 480,089 0.15
US$380,000 Peruvian Government International
Bond 8.75% 21/11/2033 474,050 0.15
US$4,400,000 Peruvian Government International
Bond 9.125% 21/2/2012 5,082,000 1.59 ___________ ______
7,217,014 2.26 ___________ ______
Poland
US$1,807,000 Poland Government International
Bond 6.375% 15/7/2019 1,934,394 0.60 ___________ ______
Russian Federation
US$1,560,000 Russia Government International
Bond 7.5% 31/3/2030
(Step-up coupon) 1,600,950 0.50 ___________ ______
South Africa
US$420,000 South Africa Government International
Bond 6.875% 27/5/2019 453,074 0.14 ___________ ______
Spain
€650,000 BBVA International Preferred 3.798%
22/9/2015 (Perpetual) 660,216 0.20
€1,250,000 Caja de Ahorros de Valencia Castellon
y Alicante 3% 11/5/2012 1,812,635 0.57
€1,280,000 Spain Government Bond 3.8%
31/1/2017 1,880,556 0.59
€1,510,000 Spain Government Bond 4.2%
30/7/2013 2,301,343 0.72
€3,790,000 Spain Government Bond 4.4%
31/1/2015 5,832,056 1.82 ___________ ______
12,486,806 3.90 ___________ ______
Sweden
€1,120,000 Svensk Exportkredit AB 3.625%
27/5/2014 1,629,114 0.51
SEK21,550,000 Sweden Government Bond 4.5%
12/8/2015 3,274,177 1.02 ___________ ______
4,903,291 1.53 ___________ ______
Switzerland
US$1,100,000 UBS (Stamford Branch) 5.875%
20/12/2017 1,088,132 0.34 ___________ ______
Turkey
TRY6,600,000 Turkey Government Bond 15%
10/2/2010 4,520,948 1.41
US$1,200,000 Turkey Government International
Bond 6.75% 3/4/2018 1,246,499 0.39
US$850,000 Turkey Government International
Bond 7% 5/6/2020 887,188 0.28 ___________ ______
6,654,635 2.08 ___________ ______
United Kingdom
£560,000 Chester Asset Receivables Dealings
No 12 6% 18/1/2011 900,577 0.28
€500,000 FCE Bank 7.125% 16/1/2012 648,371 0.20
£800,000 FCE Bank 7.875% 15/2/2011 1,217,502 0.38
€800,000 Imperial Tobacco Finance 5%
25/6/2012 1,191,391 0.37
€250,000 Lloyds TSB Bank 6.25% 15/4/2014 384,443 0.12
US$3,200,000 Northern Rock '144A' 5.625%
22/6/2017 2,886,371 0.90
£550,000 United Kingdom Gilt 4.25% 7/9/2039 907,635 0.29
£4,100,000 United Kingdom Gilt 4.5% 7/3/2019 7,158,135 2.24
£1,500,000 United Kingdom Gilt 4.5% 7/12/2042 2,594,359 0.81
£1,830,000 United Kingdom Gilt 5% 7/9/2014 3,306,546 1.03
£1,472,000 United Kingdom Gilt 5.25% 7/6/2012 2,598,499 0.81
US$250,000 Virgin Media Finance 9.125% 15/8/2016 254,375 0.08
US$825,000 Vodafone Group 4.15% 10/6/2014 844,333 0.27
US$850,000 Vodafone Group 7.75% 15/2/2010 877,047 0.28 ___________ ______
25,769,584 8.06 ___________ ______
United States
US$250,000 American Tire Distributors FRN 1/4/2012 191,563 0.06
US$415,000 American Tower 7.125% 15/10/2012 421,225 0.13
US$182,000 Ashton Woods USA/Ashton Woods
Finance '144A' 0% 30/6/2015
(Step-up Coupon) 36,400 0.01
€1,350,000 BA Covered Bond Issuer 4.25%
5/4/2017 1,833,233 0.57
US$1,750,000 Banc of America Commercial Mortgage
'2002-2 A3' 5.118% 11/7/2043 1,795,871 0.56
US$469,983 Bear Stearns Adjustable Rate Mortgage
Trust '2004-6 3A' FRN 25/9/2034 425,343 0.13
US$1,651,486 Bear Stearns Commercial Mortgage
Securities '2000-WF2 A2' 7.32%
15/10/2032 1,700,835 0.53
US$1,275,000 Bottling Group 5.125% 15/1/2019 1,347,796 0.42
US$75,000 Cablevision Systems 8% 15/4/2012 76,313 0.02
US$1,750,000 California State 5.95% 1/4/2016 1,801,643 0.56
US$525,000 California State 7.55% 1/4/2039 561,503 0.18
US$1,400,000 Cellco Partnership / Verizon Wireless
Capital '144A' 3.75% 20/5/2011 1,446,398 0.45
Transferable Securities Admitted to an Official Stock Exchange
Listing or Dealt in on Another Regulated Market
Holding Description Value (US$) %
Transferable Securities Admitted to an Official Stock Exchange
Listing or Dealt in on Another Regulated Market
Holding Description Value (US$) %
Portfolio of Investments 31 August 2009

Audited Annual Report and Accounts 229
The notes on pages 236 to 244 form an integral part of these financial statements.
World Income Fund continued
US$560,000 Cincinnati Bell 7.25% 15/7/2013 546,000 0.17
US$250,000 Corrections Corporation of America
6.75% 31/1/2014 243,125 0.08
US$1,063,391 Countrywide Asset-Backed Certificates
'2007-2 2A1' FRN 25/8/2037 933,407 0.29
US$570,000 Cricket Communications 10% 15/7/2015 555,750 0.17
US$907,535 CS First Boston Mortgage Securities
'2001-CKN5 A4' 5.435% 15/9/2034 935,009 0.29
US$1,530,000 CSC Holdings 6.75% 15/4/2012 1,545,300 0.48
US$1,180,000 Daimler Chrysler Auto Trust '2007-A A4'
5.28% 8/3/2013 1,228,539 0.38
US$212,475 Deutsche ALT-A Securities Inc Alternate
Loan Trust '2007-BAR1 A1' FRN
25/3/2037 210,265 0.07
US$140,000 DJO Finance 10.875% 15/11/2014 135,800 0.04
US$260,000 Duane Reade '144A' 11.75% 1/8/2015 263,900 0.08
US$500,000 Dycom Industries 8.125% 15/10/2015 437,500 0.14
US$640,000 Echostar DBS 7% 1/10/2013 632,000 0.20
US$1,311,486 Fannie Mae REMICS '2008-13 FC' FRN
25/6/2037 1,281,161 0.40
US$166,362 First Union National Bank Commercial
Mortgage '1999-C4 A2' 7.39%
15/12/2031 166,301 0.05
US$1,255,542 Ford Credit Auto Owner Trust
'2008-C A2A' 3.72% 15/1/2011 1,265,399 0.40
US$1,445,805 Freddie Mac REMICS '2920 HC'
4.5% 15/12/2018 1,508,395 0.47
€1,750,000 General Electric Capital 4% 15/6/2012 2,614,083 0.82
US$850,000 General Electric Capital 6.15%
7/8/2037‡ 781,751 0.24
US$1,150,000 General Mills 5.65% 15/2/2019 1,242,154 0.39
US$1,100,000 Georgia-Pacific 8.125% 15/5/2011 1,122,000 0.35
US$925,000 Goodyear Tire & Rubber 7.857%
15/8/2011 925,000 0.29
US$15,000 Graphic Packaging International 9.5%
15/8/2013 15,150 0.01
US$613,940 GSR Mortgage Loan Trust '2005-AR1 4A1'
FRN 25/1/2035 550,475 0.17
US$478,558 Home Equity Asset Trust '2007-2 2A1'
FRN 25/7/2037 439,985 0.14
€500,000 HVB Funding Trust VIII 7.055% 28/3/2012
(Perpetual) 484,599 0.15
US$1,454,456 JP Morgan Chase Commercial Mortgage
Securities '2001-CIBC A3' 6.26%
15/3/2033 1,513,457 0.47
US$1,100,000 JP Morgan Chase Commercial Mortgage
Securities '2002-C2 A2' 5.05%
12/12/2034 1,122,811 0.35
US$558,266 JP Morgan Mortgage Trust
'2004-A5 3A1' 5.309% 25/12/2034 528,058 0.17
US$987,733 LB-UBS Commercial Mortgage Trust
'2006-C7 A1' 5.279% 15/11/2038 1,007,403 0.32
US$500,000 Levi Strauss & Co 8.875% 1/4/2016 502,500 0.16
US$1,900,000 Merrill Lynch Mortgage Trust
'2002-MW1 A4' 5.619% 12/7/2034 1,930,847 0.60
US$549,000 MetLife 6.75% 1/6/2016 599,910 0.19
US$475,000 MetroPCS Wireless 9.25% 1/11/2014 467,875 0.15
US$995,000 National City Bank (Cleveland OH) FRN
9/9/2009 995,038 0.31
US$1,050,000 New Jersey ST TPK Authority TPK
Receivables 7.414% 1/1/2040 1,275,965 0.40
US$600,000 NewPage 10% 1/5/2012 328,500 0.10
US$500,000 Nielsen Finance 10% 1/8/2014 473,750 0.15
US$300,000 NRG Energy 7.25% 1/2/2014 292,500 0.09
US$60,000 NRG Energy 7.375% 1/2/2016 57,450 0.02
US$700,000 Occidental Petroleum 7% 1/11/2013 807,673 0.25
US$610,000 Peabody Energy 7.375% 1/11/2016 611,525 0.19
US$1,375,000 Princeton University 4.95% 1/3/2019 1,445,734 0.45
US$500,000 Qwest 7.5% 1/10/2014 497,500 0.16
US$720,000 Qwest Communications International
7.5% 15/2/2014 700,200 0.22
US$210,000 RathGibson 11.25% 15/2/2014 76,650 0.02
US$1,600,000 Sabine Pass LNG 7.5% 30/11/2016 1,308,000 0.41
C$570,000 SLM 4.3% 15/12/2009 508,500 0.16
US$300,000 SLM 5.4% 25/10/2011 261,394 0.08
US$1,734,288 SLM Student Loan Trust '2005-1 A2'
FRN 27/4/2020 1,691,601 0.53
US$1,200,000 SLM Student Loan Trust '2008-5 A2'
FRN 25/10/2016 1,211,643 0.38
US$1,200,000 SLM Student Loan Trust '2008-5 A3'
FRN 25/1/2018 1,216,489 0.38
US$1,200,000 SLM Student Loan Trust '2008-5 A4'
FRN 25/7/2023 1,227,192 0.38
US$1,325,000 Sovereign Bancorp 4.9% 23/9/2010 1,365,731 0.43
US$250,000 Stanley-Martin Communities 9.75%
15/8/2015 62,500 0.02
US$210,000 Steel Dynamics 7.375% 1/11/2012 208,950 0.07
US$850,000 Sungard Data Systems '144A' 10.625%
15/5/2015 887,188 0.28
US$94,000 Tenet Healthcare '144A' 9% 1/5/2015 96,820 0.03
US$34,000 Tenet Healthcare '144A' 10% 1/5/2018 36,805 0.01
US$950,000 Texas State 5.913% 1/10/2025 980,001 0.31
US$530,000 US Treasury Bond 2.625% 31/7/2014 534,803 0.17
US$6,300,000 US Treasury Bond 3.25% 31/7/2016 6,380,965 1.99
US$1,190,000 US Treasury Bond 3.625% 15/8/2019 1,208,686 0.38
US$575,000 US Treasury Bond 4.5% 15/8/2039 602,268 0.19
US$487,000 WaMu Mortgage Pass Through
Certificates '2006-AR10 3A2'
FRN 25/8/2046 352,984 0.11
US$675,000 West 9.5% 15/10/2014 627,750 0.20
US$250,000 Venezuela Government International
Bond 7.65% 21/4/2025 151,875 0.05
US$2,310,000 Venezuela Government International
Bond 9% 7/5/2023 1,640,100 0.51
US$10,660,000 Venezuela Government International
Bond 9.25% 15/9/2027 7,941,699 2.48
US$1,280,000 Venezuela Government International
Bond 9.25% 7/5/2028 889,600 0.28 ___________ ______
78,330,061 24.49 ___________ ______
Total Bonds 306,268,337 95.73 ___________ ______
COMMON STOCKS (SHARES)
Canada
27,928 Ainsworth Lumber 39,924 0.01
31,342 Ainsworth Lumber '144A' 44,805 0.02 ___________ ______
Total Common Stocks (Shares) 84,729 0.03 ___________ ______
Total Transferable Securities Admitted
to an Official Stock Exchange Listing or
Dealt in on Another Regulated Market 306,353,066 95.76 ___________ ______
Transferable Securities Admitted to an Official Stock Exchange
Listing or Dealt in on Another Regulated Market
Holding Description Value (US$) %
Transferable Securities Admitted to an Official Stock Exchange
Listing or Dealt in on Another Regulated Market
Holding Description Value (US$) %
Portfolio of Investments 31 August 2009

230 BlackRock Global Funds (BGF)
World Income Fund continued
BONDS
Canada
US$240,951 Ainsworth Lumber '144A' 11%
29/7/2015 126,499 0.04 ___________ ______
France
US$980,000 Dexia Credit Local '144A' 2.375%
23/9/2011 993,244 0.31 ___________ ______
United States
US$675,000 BAE Systems Holdings '144A' 4.95%
1/6/2014 696,985 0.22
US$810,000 Cengage Learning Acquisitions '144A'
10.5% 15/1/2015 739,125 0.23
US$390,000 Little Traverse Bay Bands of Odawa
Indians '144A' 10.25% 15/2/2014 175,500 0.06
US$1,125,000 Nissan Auto Receivables Owner Trust
'2009-1 A3' 5% 15/9/2014 1,177,323 0.37
US$435,000 Packaging Dynamics Finance '144A'
10% 1/5/2016 145,725 0.05
US$560,000 Rainbow National Services '144A'
10.375% 1/9/2014 588,700 0.18
US$250,000 San Pasqual Casino '144A' 8%
15/9/2013 238,750 0.07 ___________ ______
3,762,108 1.18 ___________ ______
Total Unquoted Securities 4,881,851 1.53 ___________ ______
Total Portfolio 311,234,917 97.29
Other Net Assets 8,665,200 2.71 ___________ ______
Total Net Assets (US$) 319,900,117 100.00 ___________ ______
Unquoted Securities
Holding Description Value (US$) %
Unquoted Securities
Holding Description Value (US$) %
Portfolio of Investments 31 August 2009
(‡) Securities given in guarantee, see Note 12, for further details.
Unrealised profit/(loss)
US$DescriptionNominal
Value
Unrealised profit/(loss)
US$DescriptionNominal
Value
US$1,000,000 Credit Default Swaps (Citibank)
(Fund provides default protection on
Mexico (United Mexican States) 7.5% 8/4/2033;
and receives Fixed 0.46%) (20/10/2011) (18,374)
US$2,500,000 Credit Default Swaps (Citibank)
(Fund provides default protection on
Indonesia (Republic of) 6.75% 10/3/2014;
and receives Fixed 1.63%) (20/3/2011) (4,986)
€800,000 Credit Default Swaps (Citibank)
(Fund receives default protection on
StMicroelectronics NV 0% 5/7/2013;
and pays Fixed 0.255%) (20/9/2012) 8,565
€1,600,000 Credit Default Swaps (Citibank)
(Fund provides default protection on
Imperial Tobacco Group Plc 0%;
and receives Fixed 0.75%) (20/9/2012) (43,340)
€800,000 Credit Default Swaps (Credit Suisse)
(Fund receives default protection on
Man Group Plc 3.75% 12/11/2009;
and pays Fixed 1.98%) (20/12/2013) 1,839
US$3,360,000 Credit Default Swaps (Deutsche Bank)
(Fund provides default protection on
CDX.EM 10 V1;
and receives Fixed 3.35%) (20/12/2013) 457,672
€7,100,000 Credit Default Swaps (Credit Suisse)
(Fund receives default protection on
iTraxx Europe HiVol Series 11 Version;
and pays Fixed 3.75%) (20/6/2014) (368,694)
€12,500,000 Interest Rate Swaps (Deutsche Bank)
(Fund receives Fixed 3.15%;
and pays Floating EUR Euribor 6 Month)
(5/5/2013) (6,752) __________
25,930 __________
Swaps as at 31 August 2009
Note: The total market value of (US$983,371) of these transactions is included in the Statement of Net Assets (see Note 2c).
Value US$
Unrealised loss US$Description
NominalValue
US$ 36,500,000 Fund purchases a call option (expiring
5/11/2009) to enter into an Interest
Rate Swap (JP Morgan). If exercised
Fund receives 2.5% Fixed semi annually
from 9/5/2010; and pays Floating
US$ Libor 3-month -BBA quarterly
from 9/2/2010; (5/11/2009) (155,125) 14,600 ___________ _________
(155,125) 14,600 ___________ _________
Swaptions as at 31 August 2009
Note: Swaptions are included in the Statement of Net Assets (see Note 2c).

Audited Annual Report and Accounts 231
The notes on pages 236 to 244 form an integral part of these financial statements.
World Income Fund continued
Open Futures Contracts as at 31 August 2009
203 Australian 3 Year Bond September 2009 45,601,350
4 Euro Bund September 2009 700,455
2 Australian 10 Year Bond September 2009 1,220,879
(10) Japanese 10 Year Bond (TSE) September 2009 (14,962,630)
69 US Long Bond (CBT) December 2009 8,213,156
6 Euro Schatz December 2009 923,838
(13) Canadian 10 Year Bond December 2009 (1,414,736)
(45) US Treasury 5 Year Note (CBT) December 2009 (5,176,406)
(45) US Treasury 10 Year Note December 2009 (5,260,781)
(180) US Treasury 2 Year Note (CBT) December 2009 (38,916,562)__________
Total commitment (9,071,437)__________
Note: The net unrealised loss of US$588,207 attributed to these transactions is included
in the Statement of Net Assets (see Note 2c).
Value
US$
Expiration
dateContracts/Description
Number
of Contracts
Open Forward Foreign Exchange Transactions as at 31 August 2009
Core Fund US$
€18,625,000 US$26,028,308 15/9/2009 585,204 585,204
€9,540,000 US$13,537,106 16/9/2009 94,725 94,725
US$35,069,165 €24,832,000 16/9/2009 (413,606) (413,606)
MXN36,005,000 US$2,781,340 18/9/2009 (80,618) (80,618)
US$2,764,645 MXN36,005,000 18/9/2009 63,923 63,923
US$2,079,330 ZAR17,075,000 18/9/2009 (104,095) (104,095)
AUD2,675,400 US$2,232,629 28/10/2009 (5,200) (5,200)
CAD6,595,000 US$6,013,934 28/10/2009 (46,630) (46,630)
DKK5,826,000 US$1,116,844 28/10/2009 290 290
£1,966,000 US$3,209,146 28/10/2009 (18,070) (18,070)
¥5,580,102,000 US$59,441,897 28/10/2009 591,934 591,934
PLN9,070,000 US$3,059,373 28/10/2009 90,914 90,914
US$8,975,019 AUD10,832,000 28/10/2009 (43,263) (43,263)
US$14,707,562 CAD15,970,500 28/10/2009 257,096 257,096
US$8,335,696 £5,033,500 28/10/2009 165,665 165,665
US$894,395 HUF173,944,500 28/10/2009 (8,590) (8,590)
US$2,893,015 MXN37,806,500 28/10/2009 72,404 72,404
US$1,785,779 SEK12,784,500 28/10/2009 (7,656) (7,656)
US$4,059,195 TRY6,193,000 28/10/2009 (13,918) (13,918)
KRW4,802,797,598 US$3,846,500 4/11/2009 (3,403) (3,403)__________ __________
Net unrealised profit 1,177,106 1,177,106 __________ __________
AUD Hedged Share Class AUD
AUD11,773,145 US$9,789,700 15/9/2009 56,798 47,506 __________ __________
Net unrealised profit 56,798 47,506 __________ __________
Total net unrealised profit 1,224,612 __________
Note: The net unrealised profit attributed to these transactions is included in the Statement
of Net Assets (see Note 2c).
Unrealised
profit/(loss)
US$ Equivalent
Unrealised
profit/(loss)Value dateSalesPurchases

232 BlackRock Global Funds (BGF)
World Mining Fund
FUNDS
Jersey
500,000 ETFS Physical Platinum – ETF 61,565,000 0.62 _____________ ______
United Kingdom
105,194,896 Institutional Cash Series Institutional
Liquidity Fund 105,194,896 1.07 _____________ ______
Total Funds 166,759,896 1.69 _____________ ______
COMMON & PREFERRED STOCKS (SHARES)
Australia
34,000,000 Alumina 47,490,987 0.48
10,500,000 Aquila Resources 62,353,877 0.63
14,504,099 Atlas Iron 19,592,015 0.20
925,000 Coal & Allied Industries 64,601,712 0.65
5,500,000 Coal of Africa 8,124,366 0.08
2,000,000 Energy Resources of Australia 43,492,980 0.44
20,000,000 Equinox Minerals 47,590,965 0.48
5,872,400 Iluka Resources 19,401,197 0.20
12,950,367 Newcrest Mining 325,060,267 3.29
120,000,000 Oxiana 106,390,519 1.08 _____________ ______
744,098,885 7.53 _____________ ______
Belgium
3,500,000 Nyrstar 35,858,678 0.36 _____________ ______
Bermuda
6,000,000 Aquarius Platinum 26,140,818 0.26
2,800,000 Namakwa Diamonds 1,443,069 0.02 _____________ ______
27,583,887 0.28 _____________ ______
Brazil
12,500,000 Bradespar (Pref) 192,893,074 1.96
45,000,000 Cia Vale do Rio Doce ADR 781,650,000 7.91 _____________ ______
974,543,074 9.87 _____________ ______
British Virgin Islands
8,479,511 Gem Diamonds 34,410,916 0.35 _____________ ______
Canada
444,115 Cameco 11,982,346 0.12
3,400,000 First Quantum Minerals 192,694,550 1.95
1,250,000 Harry Winston Diamond 7,102,454 0.07
11,500,000 Kinross Gold 219,334,633 2.22
100,000 Potash of Saskatchewan 8,880,000 0.09
17,250,000 Teck Cominco 'B' 419,524,307 4.25 _____________ ______
859,518,290 8.70 _____________ ______
Cayman Islands
1,000,000 Vale Capital 42,625,000 0.43 _____________ ______
China
35,000,000 China Shenhua Energy 'H' 141,110,384 1.43 _____________ ______
Finland
11,000,000 Talvivaara Mining 71,351,577 0.72 _____________ ______
France
770,000 Eramet 245,799,488 2.49 _____________ ______
India
500,000 Sterlite Industries India ADR 6,745,000 0.07 _____________ ______
Indonesia
115,000,000 Bumi Resources 33,085,315 0.34
12,500,000 International Nickel Indonesia 5,239,335 0.05 _____________ ______
38,324,650 0.39 _____________ ______
Ireland
17,999,900 Kenmare Resources 7,523,722 0.07 _____________ ______
Jersey
248,756 Randgold Resources ADR 14,395,510 0.14 _____________ ______
Mexico
2,940,500 Industrias Penoles SAB de CV 45,065,111 0.46 _____________ ______
Papua New Guinea
45,000,000 Lihir Gold 104,257,690 1.05 _____________ ______
Peru
12,450,000 Cia de Minas Buenaventura ADR 314,238,000 3.18
5,000,000 Minsur 11,877,851 0.12
2,500,000 Sociedad Minera Cerro Verde 58,750,000 0.60 _____________ ______
384,865,851 3.90 _____________ ______
South Africa
10,500,000 African Rainbow Minerals 214,138,247 2.17
2,500,000 Anglo Platinum 218,816,709 2.21
2,800,000 AngloGold Ashanti ADR 106,232,000 1.08
3,025,760 Gold Fields 36,170,808 0.37
500,000 Gold Fields ADR 5,970,000 0.06
6,500,000 Harmony Gold Mining 60,444,833 0.61
6,500,000 Harmony Gold Mining ADR 60,255,000 0.61
22,000,000 Impala Platinum Holdings 511,033,006 5.17
5,000,000 Kumba Iron Ore 163,736,555 1.66 _____________ ______
1,376,797,158 13.94 _____________ ______
United Kingdom
8,000,000 Anglo American† 262,447,060 2.66
13,000,000 Antofagasta 161,748,746 1.64
37,000,000 BHP Billiton† 977,780,870 9.90
21,000,000 Eurasian Natural Resources 294,863,363 2.98
2,000,000 Kazakhmys 32,091,653 0.32
1,718,081 Peter Hambro Mining 21,516,171 0.22
22,500,000 Rio Tinto 881,485,622 8.92
2,500,000 Vedanta Resources 72,721,600 0.74
46,000,000 Xstrata 617,143,418 6.25 _____________ ______
3,321,798,503 33.63 _____________ ______
United States
5,000,000 Alcoa 60,850,000 0.62
5,200,000 Freeport-McMoRan Copper & Gold 424,475,000 4.29
1,500,000 Newmont Mining 60,435,000 0.61
4,500,000 Peabody Energy 147,015,000 1.49
7,000,000 Southern Copper 200,690,000 2.03 _____________ ______
893,465,000 9.04 _____________ ______
Total Common & Preferred Stocks (Shares) 9,370,138,374 94.85 _____________ ______
BONDS
Belgium
€3,900,000 Nyrstar 7% 10/7/2014 6,387,796 0.06 _____________ ______
Transferable Securities Admitted to an Official Stock Exchange
Listing or Dealt in on Another Regulated Market
Holding Description Value (US$) %
Transferable Securities Admitted to an Official Stock Exchange
Listing or Dealt in on Another Regulated Market
Holding Description Value (US$) %
Portfolio of Investments 31 August 2009

Audited Annual Report and Accounts 233
The notes on pages 236 to 244 form an integral part of these financial statements.
World Mining Fund continued
CanadaUS$20,000,000 First Quantum Minerals 6%
19/6/2014 25,400,000 0.26
US$40,000,000 Teck Resources 10.75% 15/5/2019 45,500,000 0.46 _____________ ______
70,900,000 0.72 _____________ ______
Cayman IslandsUS$900,000 Vale Capital II 'VALE' 6.75%
15/6/2012 56,418,749 0.57 _____________ ______
LuxembourgUS$4,688,000 ArcelorMittal 5% 15/5/2014 6,633,520 0.07 _____________ ______
United KingdomUS$70,000,000 Anglo American 4% 7/5/2014 99,487,500 1.01
US$50,000,000 Vedanta Resources Jersey 5.5%
13/7/2016 54,750,000 0.55 _____________ ______
154,237,500 1.56 _____________ ______
Total Bonds 294,577,565 2.98 _____________ ______
Total Transferable Securities Admitted
to an Official Stock Exchange Listing or
Dealt in on Another Regulated Market 9,831,475,835 99.52 _____________ ______
BONDS
BrazilBRL6,750 Vale FRN Perpetual – 0.00 _____________ ______
Total Unquoted Securities – 0.00 _____________ ______
Total Portfolio 9,831,475,835 99.52
Other Net Assets 47,001,026 0.48 _____________ ______
Total Net Assets (US$) 9,878,476,861 100.00 _____________ ______
Transferable Securities Admitted to an Official Stock Exchange
Listing or Dealt in on Another Regulated Market
Holding Description Value (US$) %
Unquoted Securities
Holding Description Value (US$) %
Portfolio of Investments 31 August 2009
(†) Securities pledged, see Note 12, for further details.(‡) Securities given in guarantee, see Note 12, for further details.
Open Forward Foreign Exchange Transactions as at 31 August 2009
EUR Hedged Share Class €
€181,837,774 US$257,339,855 15/9/2009 1,742,993 2,490,702
US$31,264,120 €22,072,996 15/9/2009 (193,351) (276,295)__________ __________
Net unrealised profit 1,549,642 2,214,407 __________ __________
SGD Hedged Share Class SGD
SGD13,327,963 US$9,227,264 15/9/2009 5,774 4,000
US$1,036,576 SGD1,501,774 15/9/2009 (5,181) (3,589)__________ __________
Net unrealised profit 593 411 __________ __________
Total net unrealised profit 2,214,818 __________
Note: The net unrealised profit attributed to these transactions is included in the Statement
of Net Assets (see Note 2c).
Unrealised
profit/(loss)
US$ Equivalent
Unrealised
profit/(loss)Value dateSalesPurchases
(1,000) Anglo American Plc Call Option
strike price £19.50
expiring on 18/9/2009 60,550 (2,175,155)
(1,700) BHP Billiton Plc Call Option
strike price £16
expiring on 18/9/2009 701,414 (1,917,870)___________ _________
Total Written Call Options 761,964 (4,093,025)___________ _________
Note: Written Call Options are included in the Statement of Net Assets (see Note 2c).
Value US$
Unrealised profit
US$Issuer
Number ofcontracts
subject to Call
Written Call Options as at 31 August 2009
Sector Breakdown as at 31 August 2009
Diversified metals & mining 67.55
Precious metals & minerals 11.72
Gold 10.26
Coal & consumable fuels 5.10
Steel 2.01
Investment funds 1.69
Aluminum 1.10
Fertilizers & agricultural chemicals 0.09
Other net assets 0.48 __________
100.00 __________
% of net
assets

234 BlackRock Global Funds (BGF)
World Technology Fund
FUNDS
United States
133 iShares S&P Global Technology Sector Index
Fund – ETF 6,637 0.01
141 iShares S&P North American Technology
Sector Index Fund – ETF 6,604 0.01 ___________ ______
Total Funds 13,241 0.02 ___________ ______
COMMON STOCKS (SHARES)
Argentina
34,369 MercadoLibre 1,032,788 1.24 ___________ ______
Canada
22,251 Research In Motion 1,610,964 1.93 ___________ ______
Denmark
7,504 Vestas Wind Systems 535,165 0.64 ___________ ______
Finland
248,002 Nokia OYJ 3,405,537 4.08 ___________ ______
France
29,102 Eutelsat Communications 775,548 0.93 ___________ ______
Germany
5,396 SMA Solar Technology 394,929 0.48 ___________ ______
Hong Kong
45,100 CDC Software ADR 389,664 0.47
5,145,000 Inspur International 783,264 0.94 ___________ ______
1,172,928 1.41 ___________ ______
Japan
31,900 Advantest 795,913 0.95
81,000 Canon 3,109,856 3.73
149,400 Citizen Holdings 898,151 1.08
29,200 Konami 575,615 0.69
14,100 Rohm 950,766 1.14
23,600 Square Enix 607,861 0.73 ___________ ______
6,938,162 8.32 ___________ ______
Netherlands
65,142 ASML Holding 1,787,650 2.14 ___________ ______
Singapore
46,344 Avago Technologies 835,582 1.00 ___________ ______
South Africa
26,717 Naspers 872,134 1.05 ___________ ______
South Korea
2,954 Samsung Electronics 1,823,632 2.19 ___________ ______
Spain
28,337 Telefonica 715,682 0.86 ___________ ______
Sweden
99,208 Hexagon 'B' 1,022,662 1.23 ___________ ______
Taiwan
614,084 Taiwan Semiconductor Manufacturing 1,104,424 1.32 ___________ ______
United Kingdom
494,101 ARM Holdings 1,049,883 1.26
42,632 Autonomy 900,323 1.08
61,280 Aveva Group 832,090 0.99
80,230 CSR 615,483 0.74
228,783 Velti 625,762 0.75 ___________ ______
4,023,541 4.82 ___________ ______
United States
55,936 Activision 652,214 0.78
112,370 Adobe Systems 3,519,428 4.22
80,586 Altera 1,540,401 1.85
32,115 Apple 5,387,645 6.46
43,806 Broadcom 'A' 1,240,586 1.49
37,468 CA 836,660 1.00
117,313 Cisco Systems 2,539,826 3.05
36,421 Cognizant Technology Solutions 'A' 1,264,173 1.52
187,888 Dell 2,927,295 3.51
38,801 DIRECTV Group 952,177 1.14
11,204 FTI Consulting 487,262 0.58
2,761 Google 'A' 1,265,283 1.52
50,786 Hewlett-Packard 2,255,914 2.71
95,750 Intel 1,918,782 2.30
27,982 International Business Machines 3,281,169 3.93
47,940 Maxim Integrated Products 893,218 1.07
48,784 Microchip Technology 1,290,337 1.55
47,184 Microsemi 665,766 0.80
273,269 Microsoft 6,697,796 8.03
45,066 Molex 811,639 0.97
190,743 Oracle 4,198,253 5.03
68,288 QUALCOMM 3,159,605 3.79
34,107 Salesforce.com 1,771,519 2.12
65,407 Trimble Navigation 1,646,949 1.97
228,331 Xerox 1,975,064 2.37 ___________ ______
53,178,961 63.76 ___________ ______
Total Common Stocks (Shares) 81,230,289 97.40 ___________ ______
Total Portfolio 81,243,530 97.42
Other Net Assets 2,155,259 2.58 ___________ ______
Total Net Assets (US$) 83,398,789 100.00 ___________ ______
Transferable Securities Admitted to an Official Stock Exchange
Listing or Dealt in on Another Regulated Market
Holding Description Value (US$) %
Transferable Securities Admitted to an Official Stock Exchange
Listing or Dealt in on Another Regulated Market
Holding Description Value (US$) %
Portfolio of Investments 31 August 2009
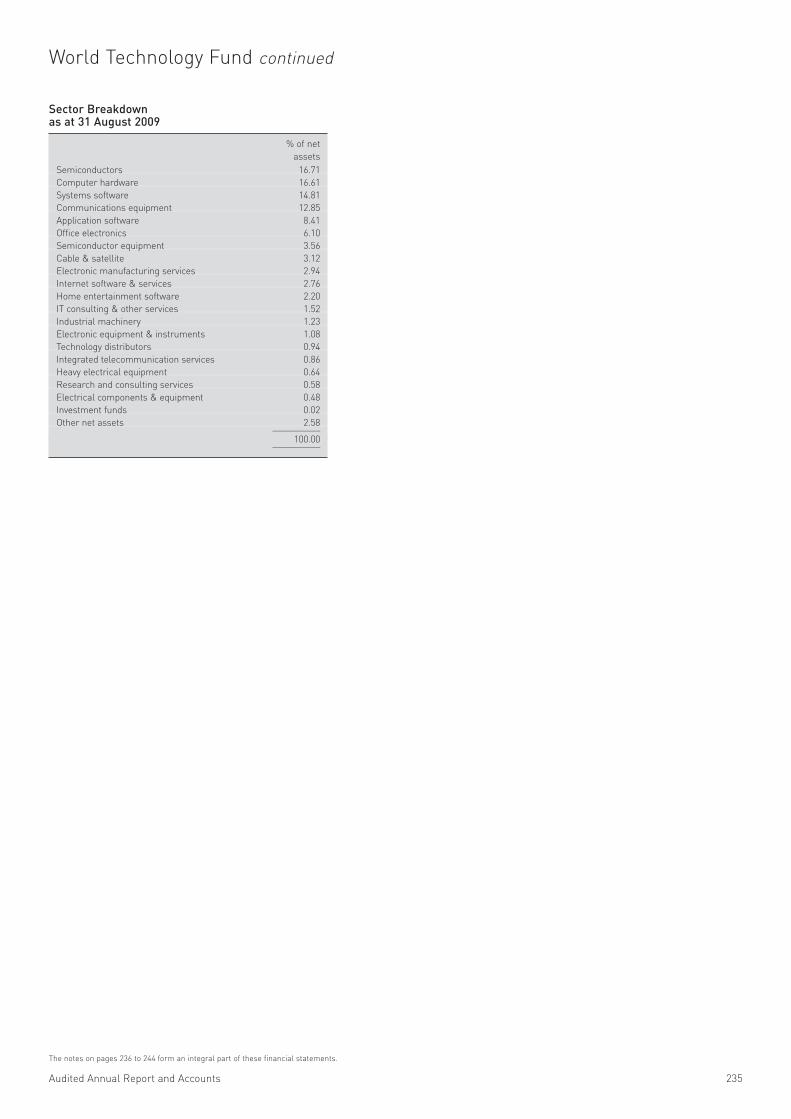
Audited Annual Report and Accounts 235
The notes on pages 236 to 244 form an integral part of these financial statements.
World Technology Fund continued
Sector Breakdown as at 31 August 2009
Semiconductors 16.71
Computer hardware 16.61
Systems software 14.81
Communications equipment 12.85
Application software 8.41
Office electronics 6.10
Semiconductor equipment 3.56
Cable & satellite 3.12
Electronic manufacturing services 2.94
Internet software & services 2.76
Home entertainment software 2.20
IT consulting & other services 1.52
Industrial machinery 1.23
Electronic equipment & instruments 1.08
Technology distributors 0.94
Integrated telecommunication services 0.86
Heavy electrical equipment 0.64
Research and consulting services 0.58
Electrical components & equipment 0.48
Investment funds 0.02
Other net assets 2.58 __________
100.00 __________
% of net
assets

236 BlackRock Global Funds (BGF)
Notes to the Financial Statements
1. Organisation
BlackRock Global Funds (the “Company”) is an open-ended
investment company (Société d’Investissement à Capital
Variable or SICAV) and formed under Part I of the Luxembourg
Law dated 20 December 2002 (the “2002 Law”).
As at 31 August 2009, the Company offered shares in 60 funds.
Each fund is a separate pool of assets and is represented by
separate shares of each fund which are divided into share
classes as follows:
Classes of Shares
As at 31 August 2009, the Company offers the following share
classes:
The classes of shares have equivalent rights in the Company
but carry different features and charging structures, which are
more fully described in the Company’s Prospectus.
India Fund
The BlackRock Global Funds India Fund invests substantially
all of its net assets in India exclusively through BlackRock India
Equities Fund (Mauritius) Limited (the “Subsidiary”), a wholly
A Class
A Class distributing (D) share
A Class distributing (D) share EUR hedged
A Class distributing (M) share
A Class distributing (M) share EUR hedged
A Class distributing (Q) share
A Class distributing (Q) share EUR hedged
A Class distributing (Q) share GBP hedged
A Class distributing (Q) share SGD hedged
A Class distributing (Q) share hedged USD
A Class non-distributing share
A Class non-distributing share EUR hedged
A Class non-distributing share CHF hedged
A Class non-distributing share GBP hedged
A Class non-distributing share SGD hedged
A Class non-distributing share USD hedged
A Class UK distributor status share
A Class UK distributor status share EUR hedged
A Class UK distributor status share GBP hedged
A Class HKD unhedged non-distributing share
B Class
B Class distributing (D) share
B Class distributing (D) share EUR hedged
B Class distributing (Q) share
B Class distributing (Q) share EUR hedged
B Class distributing (Q) share GBP hedged
B Class distributing (Q) share USD hedged
B Class non-distributing share
B Class non-distributing share EUR hedged
B Class non-distributing share GBP hedged
B Class non-distributing share SGD hedged
B Class non-distributing share USD hedged
B Class HKD unhedged non-distributing share
C Class
C Class distributing (D) share
C Class distributing (D) share EUR hedged
C Class distributing (M) share
C Class distributing (M) share EUR hedged
C Class distributing (Q) share
C Class distributing (Q) share EUR hedged
C Class distributing (Q) share GBP hedged
C Class continued
C Class distributing (Q) share USD hedged
C Class non-distributing share
C Class non-distributing share EUR hedged
C Class non-distributing share GBP hedged
C Class non-distributing share SGD hedged
C Class non-distributing share USD hedged
C Class HKD unhedged non-distributing share
D Class
D Class non-distributing share
D Class UK distributor status share
D Class non-distributing share EUR hedged
D Class non-distributing share GBP hedged
E Class
E Class distributing (Q) share EUR hedged
E Class non-distributing share
E Class non-distributing share EUR hedged
E Class non-distributing share GBP hedged
I Class
I Class non-distributing share*
I Class non-distributing share EUR hedged*
J Class
J Class distributing (M) share*
J Class non-distributing share*
Q Class
Q Class distributing (D) share**
Q Class distributing (D) share EUR hedged**
Q Class non-distributing share**
Q Class non-distributing share EUR hedged**
Q Class non-distributing share GBP hedged**
X Class
X Class non-distributing share*
X Class non-distributing share EUR hedged*
X Class non-distributing share CHF hedged*
X Class distributing share*
X Class distributing (M) share AUD hedged*
X Class distributing (M) share*
X Class UK distributor status share GBP hedged*
* available to institutional investors
** grandfathered share class available to investors previously holding shares in other funds
sponsored by entities within the BlackRock Group. Within the Company they are no longer
available for subscription.

Audited Annual Report and Accounts 237
Notes to the Financial Statements continued
owned subsidiary of the Company, in accordance with its
investment objectives and policies.
All assets and liabilities, income and expenses of the
Subsidiary are consolidated in the Statement of Net Assets
and Operations of the Company. All investments held by
the Subsidiary are disclosed in the accounts of the Company.
The Subsidiary was incorporated on 1 September 2004 under
the laws of Mauritius as an open-ended investment company
with limited liability. Currently, the Subsidiary benefits from
relief due to the India/Mauritius double tax treaty. There can be
no assurance that this will not change in the future.
Fund Launches
Effective 19 June 2009, the Global Inflation Linked Bond Fund,
denominated in USD was launched.
Effective 24 July 2009, the Euro Reserve Fund, denominated in
EUR was launched.
Fund Mergers
Effective 23 January 2009, the Conservative Allocation Fund
(US Dollar) and the Conservative Allocation Fund (Euro)
merged into the Global Allocation Fund.
Fund Closures
Effective 26 January 2009, the Dynamic Reserve Fund was
liquidated.
Effective 24 April 2009, the Global Capital Securities Absolute
Return Fund was liquidated.
Significant events during the year ended 31 August 2009
On 1 August 2009, BlackRock (Channel Islands) Limited retired
as Investment Manager. From this date BlackRock (Luxembourg)
S.A. has appointed and will oversee the Investment Advisers to
the Company directly. There is no change to the Investment
Advisers responsible for the day-to-day investment management
of each fund. In addition, BlackRock (Channel Islands) Limited
is retained as Principal Distributor in respect of the funds.
22 December 2008 D Class non-distributing share Continental European Flexible Fund
19 January 2009 A Class distributing (D) share Emerging Europe Fund, European Fund, Global AllocationFund, Global Dynamic Equity Fund, Latin American Fund,New Energy Fund, US Flexible Equity Fund, World EnergyFund, World Gold Fund, World Mining Fund
2 February 2009 A Class distributing (D) share EUR hedged US Flexible Equity Fund
27 February 2009 X Class non-distributing share Euro Corporate Bond Fund
27 February 2009 X Class non-distributing share EUR hedged Global Corporate Bond Fund
2 March 2009 X Class non-distributing share New Energy Fund
4 March 2009 A Class non-distributing share EUR hedged Emerging Markets Bond Fund
6 March 2009 X Class UK distributor status share GBP hedged Global Corporate Bond Fund
21 April 2009 D Class non-distributing share US Government Mortgage Fund
16 June 2009 X Class non-distributing share Global Corporate Bond Fund
19 June 2009 A Class non-distributing share Global Inflation Index Linked Bond Fund
19 June 2009 X Class non-distributing share EUR hedged Global Inflation Index Linked Bond Fund
25 June 2009 D Class UK distributor status share New Energy Fund
6 July 2009 X Class non-distributing share Euro Short Duration Bond Fund
23 July 2009 A Class non-distributing share EUR hedged Global Inflation Index Linked Bond Fund
23 July 2009 A Class distributing (M) share Global Inflation Index Linked Bond Fund
23 July 2009 C Class non-distributing share Global Inflation Index Linked Bond Fund
23 July 2009 C Class distributing (M) share Global Inflation Index Linked Bond Fund
24 July 2009 A Class non-distributing share Euro Reserve Fund
Effective date Type Fund
Share Classes Launched
The dates disclosed are the launch dates but the classes may have been seeded at a later date.

238 BlackRock Global Funds (BGF)
Notes to the Financial Statements continued
2. Summary of Significant Accounting Policies
The financial statements have been prepared in accordance
with the format and regulations prescribed by the Luxembourg
authorities for Luxembourg investment companies and include
the following significant accounting policies:
(a) Valuation of Investments and Other Assets
The Company’s investments and other assets are valued
as follows:
• transferable securities which are admitted to an official
exchange listing or dealt in on another regulated market,
are valued on the basis of the latest available price
prevailing on the valuation date. If securities are listed or
dealt in on several exchanges or markets, the latest
available prices, or, if appropriate, the average price on the
principal exchange or market will be applied.
For non-quoted securities or securities not traded or
dealt in on any stock exchange or other regulated market
(including securities of closed-ended investment funds),
as well as quoted or non quoted securities on such other
markets for which no valuation price is available, or
securities for which the quoted prices are, in the opinion
of the Board of Directors of the Fund, not representative
of the fair market value, the value thereof shall be
determined prudently and in good faith by the Board
of Directors of the Fund on the basis of the realisable
sale price.
• securities lending: securities are delivered to third party
brokers as per lending agent BlackRock Investment
Management, LLC instructions, the assets of which continue
to be valued as part of the portfolio of the fund;
• liquid assets and money market instruments may be valued
at nominal values plus any accrued interest or on an
amortised cost basis;
• cash, money market deposits, bills payable on demand and
other debts are valued at their nominal amount, unless it
appears unlikely that such nominal amount is obtainable;
• assets which include in particular interest and dividends
receivable, receivable for investments sold, receivable for
fund shares subscribed and restructuring expenses, are
valued at nominal value;
• liabilities, which include in particular income distribution
payable, payable for investments purchased, payable for fund
shares redeemed are valued at nominal value; and
• the date included in the description of the perpetual bonds
in the portfolios is referring to the callable date of the bonds
(not to the maturity date).
The interest rate disclosed in the description is the one
applicable at year end and is for information only as these
bonds are bearing variable interest rate.
(b) Income from Investments
The Company takes credit for income from its investments on
the following basis:
• interest income is accrued daily and includes the
amortization of premiums and accretion of discounts;
• bank interest and money market deposit income is
recognized on an accrual basis;
24 July 2009 B Class non-distributing share Euro Reserve Fund
24 July 2009 C Class non-distributing share Euro Reserve Fund
24 July 2009 D Class non-distributing share Euro Reserve Fund
24 July 2009 E Class non-distributing share Euro Reserve Fund
24 July 2009 Q Class non-distributing share Euro Reserve Fund
14 August 2009 X Class distributing (M) share AUD hedged World Income Fund
14 August 2009 X Class distributing (M) share World Income Fund
Effective date Type Fund
11 May 2009 Japan Opportunities Fund Japan Small & MidCap Opportunities Fund
11 May 2009 US Opportunities Fund US Small & MidCap Opportunities Fund
24 July 2009 Reserve Fund US Dollar Reserve Fund
Effective date Former Name New Name
Fund Name Changed

Audited Annual Report and Accounts 239
Notes to the Financial Statements continued
• dividend income is accrued on the ex-dividend date; and
• security lending income is accrued on a monthly basis.
(c) Financial Instruments
During the year, the Company has entered into a number of
forward foreign exchange and futures contracts. Open forward
foreign exchange and futures contracts are valued at the cost
to close the contracts on the accounting date. Surpluses/deficits
arising from these and closed unsettled contracts are taken
to unrealised profit/loss and are included under assets or
liabilities (as appropriate) in the Statement of Net Assets on
pages 6 to 11.
The Company can write covered call options, write put options
and purchase call and put options. When the Company writes
and purchases an option, an amount equal to the premium
received or paid by the Company is reflected as a liability or an
asset. The liability for a written option and the asset for a
purchased option is subsequently marked to market to reflect
the current value of the option. The Board of Directors have
agreed to value written options based on mid prices rather
than last traded prices as this methodology best reflects their
estimated probable value. When a security is sold through an
exercise of an option, the premium received (or paid) is
deducted from (or added to) the basis of the security sold.
When an option expires (or the Company enters into a closing
transaction), the Company realises a gain or loss on the option
to the extent of the premiums received or paid (or gain or loss
to the extent the cost of the closing transaction exceeds
premium paid or received).
The Company has entered into swap agreements to exchange
the return generated by one instrument for the return
generated by another investment. In the case of credit default
swaps, a series of premiums are paid to the seller of the
protection, in return for a payment contingent on a credit event
(predefined in the agreement). Where possible, swaps are
marked to market based upon daily prices obtained from third
party pricing agents and verified against the actual market
maker. Where such quotations are not available swaps are
priced based upon daily quotations from the market maker. In
both cases changes in quotations are recorded as unrealised
appreciation or depreciation in the Statement of Operations and
Changes in Net Assets. Realised gains or losses on maturity or
termination of the swaps are presented in the Statement of
Operations and Changes in Net Assets on pages 26 to 35.
Securities repurchase (or reverse repurchase) transactions are
treated as lending (or, respectively, borrowing) operations
guaranteed by the underlying securities. These are operations
by which the assignor assigns to another person (the assignee)
ownership of the securities and by which the assignor
undertakes irrevocably to repurchase the securities and the
assignee undertakes irrevocably to resell them, at an agreed
price and date. Securities repurchase agreements are valued
at their purchase price expressed in the original currency.
At 31 August 2009 there are no outstanding securities
repurchase (or reverse repurchase).
(d) Foreign Exchange
The cost of investments in currencies other than the currency
of denomination of the respective fund has been translated at
the rates of exchange ruling at the time of purchase. The
market value of investments and other assets in currencies
other than the currency of denomination of the respective fund
has been translated at the exchange rate prevailing at the
fund’s valuation point in Luxembourg on 31 August 2009.
(e) Total Consolidated Figures
The consolidated figures of the Company are expressed in USD
and include the total of the financial statements of the different
funds. For the Statement of Net Assets, the exchange rate
prevailing at the fund’s valuation point in Luxembourg on
31 August 2009 is:
EUR GBP JPY CHF
USD 0.6998 0.616 92.985 1.062
For the Statement of Operations and Changes in Net Assets,
the exchange rate is the average rate calculated over the year:
EUR GBP JPY CHF
USD 0.7406 0.6432 96.3949 1.1256
The average USD/EUR exchange rate used for the Conservative
Allocation Fund (Euro) (0.7446) was calculated during the
period 1 September 2008 – 23 January 2009 (date of merger
of the Fund).
For the Euro Reserve Fund, the USD/EUR exchange rate used
(0.7020) is calculated for the period between 24 July 2009 and
31 August 2009, since the Fund was launched 24 July 2009.
These figures are presented for information purposes only.
(f) Exchange rates
The following exchange rates are used to convert the
investments and other assets and other liabilities denominated
in currencies other than the base currency of the fund at
31 August 2009.
CCY GBP USD EUR JPY CHF
AED 0.1677 0.2723 0.1905 25.3156 0.2891
ARS 0.1600 0.2597 0.1817 24.1441 0.2758
AUD 0.5153 0.8364 0.5853 77.7730 0.8883
BRL 0.3272 0.5312 0.3718 49.3939 0.5641
CAD 0.5574 0.9048 0.6332 84.1301 0.9609
CHF 0.5801 0.9416 0.6590 87.5561 1.0000
CLP 0.0011 0.0018 0.0013 0.1678 0.0019

240 BlackRock Global Funds (BGF)
Notes to the Financial Statements continued
CCY GBP USD EUR JPY CHF
CNY 0.0902 0.1464 0.1025 13.6130 0.1555
COP 0.0003 0.0005 0.0003 0.0451 0.0005
CZK 0.0346 0.0562 0.0394 5.2291 0.0597
DKK 0.1183 0.1920 0.1343 17.8504 0.2039
EGP 0.1115 0.1809 0.1266 16.8238 0.1921
EUR 0.8803 1.4289 1.0000 132.8679 1.5175
GBP 1.0000 1.6233 1.1360 150.9379 1.7239
HKD 0.0795 0.1290 0.0903 11.9965 0.1370
HUF 0.0032 0.0052 0.0037 0.4879 0.0056
IDR 0.0001 0.0001 0.0001 0.0092 0.0001
ILS 0.1620 0.2629 0.1840 24.4489 0.2792
INR 0.0126 0.0205 0.0143 1.9045 0.0218
ISK 0.0049 0.0080 0.0056 0.7411 0.0085
JPY 0.0066 0.0108 0.0075 1.0000 0.0114
KRW 0.0005 0.0008 0.0006 0.0745 0.0009
KWD 2.1439 3.4800 2.4354 323.5886 3.6958
MAD 0.0778 0.1263 0.0884 11.7465 0.1342
MXN 0.0463 0.0752 0.0526 6.9890 0.0798
MYR 0.1749 0.2840 0.1987 26.4048 0.3016
NOK 0.1021 0.1658 0.1160 15.4165 0.1761
NZD 0.4192 0.6805 0.4762 63.2770 0.7227
PEN 0.2079 0.3374 0.2362 31.3768 0.3584
PHP 0.0126 0.0205 0.0143 1.9056 0.0218
PKR 0.0074 0.0121 0.0084 1.1206 0.0128
PLN 0.2149 0.3489 0.2441 32.4385 0.3705
QAR 0.1692 0.2746 0.1922 25.5366 0.2917
RUB 0.0193 0.0314 0.0220 2.9193 0.0333
SAR 0.1643 0.2667 0.1866 24.7947 0.2832
SEK 0.0864 0.1402 0.0982 13.0410 0.1489
SGD 0.4267 0.6927 0.4848 64.4112 0.7357
SKK 0.0292 0.0474 0.0332 4.4104 0.0504
THB 0.0181 0.0294 0.0206 2.7340 0.0312
TRY 0.4100 0.6655 0.4658 61.8839 0.7068
TWD 0.0187 0.0304 0.0213 2.8249 0.0323
USD 0.6160 1.0000 0.6998 92.9850 1.0620
ZAR 0.0790 0.1283 0.0898 11.9267 0.1362
3. Management Company
BlackRock (Luxembourg) S.A. has been appointed by
the Company to act as its Management Company.
The Management Company is authorised to act as a Fund
Management Company in accordance with Chapter 13
of the Law of 20 December 2002.
The Company has signed a restated Management Company
Agreement, with the Management Company effective
1 August 2009. Under this agreement, the Management
Company is entrusted with the day-to-day management of the
Company, with responsibility for performing directly or by way
of delegation all operational functions relating to the
Company’s investment management, administration, and
marketing of the funds.
In agreement with the Company, the Management Company
has decided to delegate several of its functions as is further
described in the Prospectus.
The Directors of the Management Company are: Graham Bamping,
Frank P. Le Feuvre and Geoffrey Radcliffe. BlackRock
(Luxembourg) S.A. is a wholly owned subsidiary within the
BlackRock Group. It is regulated by the Commission de
Surveillance du Secteur Financier.
4. Management and Distribution Fees
During the year the Company paid management fees. These
were paid to BlackRock (Channel Islands) Limited who acted
as Investment Manager for the period from 1 September 2008
to 31 July 2009; for the period from 1 August 2009 to
31 August 2009, following BlackRock (Channel Islands)
Limited’s retirement as Investment Manager, management
fees were paid directly to the Management Company,
BlackRock (Luxembourg) S.A.
The Company pays management fees as shown in Appendix E
of the Prospectus. The level of management fee varies from a
0.40% to 2.00% according to which fund the investor buys and,
with the exception of some Class D, Class I and Class Q
Shares, is the same for all classes of shares within each fund.
These fees accrue daily, are based on the Net Asset Value of
the relevant fund and are paid monthly. The Investment
Manager pays certain costs and fees out of the management
fee, including the fees of the Investment Advisers. Class J and
Class X Shares do not charge any management fees.
During the year the Company paid distribution fees to
BlackRock (Channel Islands) Limited who acted as Principal
Distributor.
The Principal Distributor may rebate all or part of its
distribution fee as described in paragraph 22 of Appendix C
of the current Prospectus, such rebates, if any, are included
in the Administration Fee Subsidy as discussed in note 5.
The Principal Distributor receives annual distribution fees as
shown in Appendix E of the Prospectus. These fees accrue
daily, are based on the Net Asset Value of the relevant fund
(reflecting, when applicable, any adjustment to the Net Asset
Value of the relevant fund, as described in paragraph 17(c) of
Appendix B) and are paid monthly.
Management fees and distributions fees due and payable at
31 August 2009 are included on the Statement of Net Assets
as other liabilities.
5. Administration Fees
The Company pays an administration fee of up to 0.25% per
annum. This fee accrues at a rate to be agreed between the
Board of Directors and the Management Company within the
0.25% maximum and may be amended from time to time at
their discretion, and without notice.
The rates charged per annum are as follows:

Audited Annual Report and Accounts 241
Notes to the Financial Statements continued
Share Class Equity Fixed Income Balanced / Cash /
Funds Funds Multi-Assets Short Term
Funds Funds
A, B, C, D, E, Q 0.25% 0.15% 0.20% 0.075%
I, J, X 0.04% 0.04% 0.04% 0.04%
Effective 1 July 2009, the rates for administration fees on all Institutional share (I, J & X)
classes changed from 0.03% to 0.04%.
Effective 24 July 2009, the rates for administration fees on Cash/Short Term Funds changed
from 0.10% to 0.075% with the exception of the BGF Local Emerging Markets Short Duration
Bond Fund which remains at 0.10%.
Investment in I, J and X Shares is restricted to institutional investors within the meaning of
Article 129 of the law of 20 December 2002.
The administration fee accrues daily, is based on the Net Asset
Value of the relevant class and is paid monthly. This fee covers
all fixed and variable third party expenses charged to the
Company in relation to fees which were previously referred to
as fund accounting fees, transfer agency fees, and other
expenses i.e., tax, legal, audit and any other professional
advisers, as well as all fees and recoverable expenses currently
charged by BlackRock to the Company such as Directors’ fees,
Investor Service Centre and global administration services.
Directors who are not representatives of the BlackRock Group
receive a fee of EUR 30,000 net of taxation in return for their
duties performed per financial year.
The administration fee excludes custody fees, for reasons of
tax efficiency. Taxation applicable in certain jurisdictions is also
excluded from the administration fee (see Note 7).
During the year, the following funds were subject to an
Administration Fee Subsidy:
Conservative Allocation Fund (Euro) Japan Fund
Conservative Allocation Fund (US Dollar) Japan Small & MidCap Opportunities Fund
Dynamic Reserve Fund Strategic Allocation Fund (Euro)
Emerging Europe Fund Strategic Allocation Fund (US Dollar)
Euro Corporate Bond Fund United Kingdom Fund
Euro Short Duration Bond Fund US Dollar Core Bond Fund
European Opportunities Fund US Dollar High Yield Bond Fund
Fixed Income Global Opportunities Fund US Dollar Short Duration Bond Fund
Global Capital Securities Absolute Return Fund US Government Mortgage Fund
Global Corporate Bond Fund World Financials Fund
Global Enhanced Equity Yield Fund World Healthscience Fund
Global Government Bond Fund World Income Fund
Global High Yield Bond Fund World Technology Fund
The Administration Fee Subsidy is disclosed separately on the
Statement of Operations and Changes in Net Assets.
Administration fees due and payable at 31 August 2009 are
included on the Statement of Net Assets as other liabilities.
6. Custodian and Depository Fees
Throughout the year the Custodian of the Company was The Bank
of New York Mellon (International) Ltd, Luxembourg Branch. The
Custodian receives annual fees, based on the value of securities,
which accrue daily, plus transaction fees. The annual custody
safekeeping fees range from 0.005% to 0.441% per annum and
the transaction fees range from USD 8.80 to USD 196 per
transaction. The rates for both categories of fees will vary
according to the country of investment and, in some cases,
according to asset class. Investments in bonds and developed
equity markets will be at the lower end of these ranges, while
some investments in emerging or developing markets will be at
the upper end. Thus the custody cost to each fund will depend on
its asset allocation at any time.
Custodian and depository fees due and payable at 31 August 2009
are included on the Statement of Net Assets as other liabilities.
7. Tax Status
Luxembourg
The Company is registered under Luxembourg law as an
investment company. Accordingly, no Luxembourg income or
capital gains tax is at present payable by the Company.
However, it is subject to an annual “taxe d’abonnement”
calculated at an annual rate of 0.05% and, in the case of the
Reserve Funds and all Class I, J and X Shares, at an annual
rate, of 0.01% of the Net Asset Value of each fund at the end of
each quarter.
Belgium
The Company is registered with the Banking and Finance
Commission in Belgium in accordance with Article 130 of the
Act of 20 July 2004 relating to financial transactions and the
financial markets. Funds registered for public distribution in
Belgium are subject to an annual tax of 0.08% on the net asset
value of units distributed in Belgium via Belgian intermediaries
as at 31 December of the previous year.
United Kingdom
Distributor Status
The Board of Directors intends to apply in respect of each
accounting period, for certification of the UK distributor status
sterling denominated Class A Shares in the United Kingdom as
a distributing share class for United Kingdom tax purposes.
However, no guarantee can be given that such certification will
be obtained.
In respect of the accounting year-end 31 August 2009 it is the
intention of the Board of Directors to apply for certification as a
distributing share class for United Kingdom tax to the HM
Revenue & Customs.
8. Investment Advice
The Management Company, BlackRock (Luxembourg) S.A., has
delegated some management and investment advice to the
Investment Advisers: BlackRock Financial Management, Inc.,
BlackRock International Limited, BlackRock Investment
Management LLC, BlackRock Investment Management (UK)
Limited, BlackRock Japan Co. Limited and BlackRock (Hong
Kong) Limited as described in the Prospectus.

242 BlackRock Global Funds (BGF)
BlackRock Financial Management, Inc. provides investment
advice in respect of the following funds:
Asian Tiger Bond Fund
Dynamic Reserve Fund (until 26 January 2009, date of liquidation)
Emerging Markets Bond Fund
Fixed Income Global Opportunities Fund
Global Inflation Linked Bond Fund
Local Emerging Markets Short Duration Bond Fund
US Dollar Core Bond Fund
US Dollar Reserve Fund
US Dollar High Yield Bond Fund
US Dollar Short Duration Bond Fund
US Government Mortgage Fund
World Income Fund
BlackRock Investment Management, LLC provides investment
advice in respect of the following funds:
European Enhanced Equity Yield Fund
Global Allocation Fund
Global Dynamic Equity Fund
Global Enhanced Equity Yield Fund
Global SmallCap Fund
Latin American Fund
US Basic Value Fund
US Flexible Equity Fund
US Focused Value Fund
US Growth Fund
US SmallCap Value Fund
World Financials Fund
World Healthscience Fund
BlackRock International, Ltd provides investment advice in
respect of the following funds:
Global Opportunities Fund
US Small & MidCap Opportunities Fund
In respect of the following funds, BlackRock Investment
Management (UK), Limited has in turn sub-delegated some
functions to BlackRock Japan Co., Ltd:
Japan Fund
Japan Small & MidCap Opportunities Fund
Japan Value Fund
BlackRock Financial Management, Inc. has in turn sub-
delegated some functions to BlackRock Investment
Management (UK) Limited, BlackRock International Limited,
and BlackRock Investment Management (Australia) Limited in
respect of the following funds:
Global Government Bond Fund
Global High Yield Bond Fund
World Bond Fund
In respect of the following funds, BlackRock Investment
Management (UK) Limited, has in turn sub-delegated some
functions to BlackRock (Hong Kong) Limited:
Asian Dragon Fund
China Fund
India Fund
BlackRock Investment Management (UK), Limited has in turn
sub-delegated some functions to BlackRock (Hong Kong)
Limited and BlackRock Japan Co, Ltd in respect of following
fund:
Pacific Equity Fund
For the remaining funds, BlackRock Investment Management
(UK) Limited is the Investment Adviser.
9. Transactions with Connected Persons
The ultimate holding company of the Management Company,
the Investment Manager and the Investment Advisers is
BlackRock, Inc., a company incorporated in Delaware, USA.
The Bank of America Corporation (which includes companies
within the Merrill Lynch & Co., Inc. group of companies) and
PNC Bank N.A. are substantial shareholders in BlackRock, Inc.
When arranging transactions in securities for the Company,
companies in the Bank of America Group or the PNC Group
may have provided securities brokerage, foreign exchange,
banking and other services, or may have acted as principal,
on their usual terms and may have benefited therefrom.
Commissions have been paid to brokers and agents in
accordance with the relevant market practice and the benefit of
any bulk or other commission discounts or cash commissions
rebates provided by brokers or agents have been passed on to
the Company. The services of Bank of America Group or PNC
Group companies could have been used by the Investment
Advisers where it was considered appropriate to do so provided
that their commissions and other terms of business are
generally comparable with those available from unassociated
brokers and agents in the markets concerned, and this is
consistent with the above policy of obtaining best net results.
During the year there have been no transactions which were
outside the ordinary course of business or which were not on
normal commercial terms. The total aggregate value of
transactions of the Company effected through BlackRock
companies was USD 841,095,958. The percentage of such
transactions in value compared to the total transactions during
the year amounted to 0.57% and the brokerage commission
paid in relation to these transactions totalled USD 1,012,019.
The average rate of commission so paid was 0.88%.
During the year, no Director purchased shares in any of the
funds.
Notes to the Financial Statements continued

Audited Annual Report and Accounts 243
Notes to the Financial Statements continued
10. Use of Commissions
One or more of the Investment Advisors (“Advisors”) may and
do enter into commission sharing arrangements or their
equivalent, where they are permitted to do so by local law or
regulation. Such arrangements will only be entered into where
the Advisors believe that the research or execution services
obtained through these arrangements either enhances their
investment decision-making capabilities or their execution of
trades, thereby increasing the prospects for higher investment
returns. The Advisors will enter into such arrangements with
key global brokers and the brokers agree to use some of
the commission arising on the trades from the Advisors in
recognition of the research and execution services they provide
to the Advisors or to pay for third party services that support
the execution of trades by the Advisors or the provision of
research to the Advisors. All trades remain subject to the
requirements of best execution and the arrangements are kept
under review.
11. Securities Lending
The Company has entered into securities lending with
BlackRock Investment Management, LLC. Under this
agreement, the Company may lend portions of its securities
portfolio to third parties, subject to certain conditions, including
adequate collateral. Such lending may only be effected via
recognised clearing houses, or through the intermediary of
prime financial institutions that specialise in such activities, on
the terms and conditions agreed with them, including collateral.
Such transactions may not be entered into for longer than
30 days. If the loan of securities exceeds 50% of the securities
portfolio of the fund concerned, it may only be effected on
condition that it is possible to terminate the loan contract with
immediate effect.
Under this agreement, it is permissible for the Company to
invest cash collateral received into approved securities,
resulting in the generation of additional income. Such securities
include BlackRock’s Ireland domiciled proprietary UCITS fund:
Institutional Cash Series.
The income earned from the securities lending program is shown
in the specific fund’s Statement of Operations and Changes in
Net Assets on pages 26 to 35. As at 31 August 2009 the total
valuation of securities on loan is USD 661,854,849 and the market
value of invested collateral is USD 731,605,402.
The collateral consists of cash which has been reinvested
24.22% in corporate bonds (with a rating of A-1 or equivalent),
41.61% in government bonds and 34.17% in commercial papers
and time deposits. This collateral is held by the Custodian and
is not reflected in the financial statements.
The table below provides the value of securities on loan which
are evidenced by an “*” in the relevant fund’s portfolio, at fund
level as at 31 August 2009:
Fund Value of securities
on loan
Emerging Europe Fund USD 120,855,697
Euro-Markets Fund USD 204,615,568
European Fund USD 203,178,444
European Growth Fund USD 8,291,312
European Value Fund USD 11,427,065
Global Allocation Fund USD 48,850,933
Global Enhanced Equity Yield Fund USD 2,863,736
Japan Small & MidCap Opportunities Fund USD 342,528
Latin American Fund USD 8,271,494
New Energy Fund USD 45,958,283
Pacific Equity Fund USD 1,475,416
US Flexible Energy Fund USD 3,337,250
World Energy Fund USD 2,307,089
World Financials Fund USD 80,034
12. Securities Pledged or Given in Guarantee
Underlying securities of written call options which are pledged
are evidenced by a “†” in the portfolios of the funds. As at
31 August 2009 the value of these securities amounts to
USD 343,179,015.
For the Global Enhanced Equity Yield Fund, the collateral on
written call options is pledged under a tri-party agreement
between BlackRock Investment Management (UK) Limited,
Merrill Lynch International and The Bank of New York Mellon.
As at 31 August 2009 the value of the collateral, evidenced by
a “^” in the portfolio of the fund, amounts to USD 50,647,805.
Securities which have been given as guarantee for futures
transactions, are evidenced by “‡” in the portfolios of the
funds. As at 31 August 2009 the value of these securities
amounts to USD 65,599,978.
13. Dividends
The Directors’ current policy is to retain and reinvest all net
income except for income from the distributing funds and
income from the UK distributor status classes. For the
distributing funds and UK distributor status classes, the policy
is to distribute substantially all the investment income for the
period after deduction of expenses. The Board of Directors may
also determine if and to what extent dividends may include
distributions from both realised and unrealised capital gains.
For those funds which offer distributing shares, the frequency
at which the dividend payment is made is determined by the
fund type, with dividends normally paid as follows:
• monthly on the bond distributing funds where there is
income to distribute;
• quarterly on the European Enhanced Equity Yield Fund,
Global Enhanced Equity Yield Fund and Fixed Income Global

244 BlackRock Global Funds (BGF)
Notes to the Financial Statements continued
Opportunities Fund (and such other Funds as the Board of
Directors may determine from time to time) where there is
income to distribute;
• annually on the equity distributing funds, at the discretion of
the Board of Directors. UK distributor status equity funds
pay an annual dividend, if there is income to distribute.
Those Distributing shares which pay dividends monthly are
further divided into shares as follows:
• those shares for which dividends are calculated daily are
known as Distributing (D) Shares;
• those shares for which dividends are calculated monthly are
known as Distributing (M) Shares.
Investors may choose to hold either Distributing (M) Shares or
Distributing (D) Shares but may not hold both.
Distributor shares with quarterly dividend payment are known
as Distributing (Q) Shares.
Distributing shares with annual dividend payment are known as
Distributing (A) Shares.
The declaration and payment of dividends and the reinvestment
options available to shareholders are set out in the Prospectus.
14. Subsequent Events
From 1 September 2009, the Company may operate income
equalisation arrangements with a view to ensuring that the
level of net income accrued within a Fund and attributable to
each Share is not affected by the issue, conversion or
redemption of those Shares during an accounting period. The
list of Funds operating income equalisation arrangements and
the income element included in the daily price of Distributing (M)
Shares, Distributing (Q) Shares and Distributing (A) Shares will
be made available upon request from the Company's registered
office or online at www.blackrock.com.
On 4 September 2009, the Board of Directors wrote to
shareholders advising them of their decision to close 40 share
classes to new investment or conversion into the relevant
classes from the date of the letter. All shares issued and in
existence on these classes were compulsorily redeemed
effective 16 October 2009 at the applicable net asset value on
that date, less the applicable contingent deferred sales charge
(CDSC) but without any redemption charges.
On 18 September 2009, the Asia Pacific Equity Income Fund,
denominated in USD was launched.
On 2 October 2009, the US SmallCap Value Fund merged into
the US Small & MidCap Opportunities Fund. The US SmallCap
Value Fund shares were replaced with the US Small & MidCap
Opportunities Fund shares of the same value as at the effective
merger date.
On 9 October 2009, the US Focused Value Fund merged into
the US Basic Value Fund. The US Focused Value Fund shares
were replaced with the US Basic Value Fund shares of the
same value as at the effective merger date.

Audited Annual Report and Accounts 245
Independent Auditor’s Report
To the Shareholders of
BlackRock Global Funds
We have audited the accompanying financial statements of BlackRock Global Funds and of
each of its funds, which comprise the statement of net assets and the portfolios of
investments as at 31 August 2009 and the statement of operations and changes in net
assets for the year then ended, and a summary of significant accounting policies and other
explanatory notes to the financial statements.
Board of Directors of the SICAV’s responsibility for the financial statements
The Board of Directors of the SICAV is responsible for the preparation and fair presentation
of these financial statements in accordance with Luxembourg legal and regulatory
requirements relating to the preparation of the financial statements. This responsibility
includes: designing, implementing and maintaining internal control relevant to the
preparation and fair presentation of financial statements that are free from material
misstatement, whether due to fraud or error; selecting and applying appropriate accounting
policies; and making accounting estimates that are reasonable in the circumstances.
Auditor’s responsibility
Our responsibility is to express an opinion on these financial statements based on our audit.
We conducted our audit in accordance with International Standards on Auditing as adopted
by the “Institut des Réviseurs d’Entreprises”. Those standards require that we comply with
ethical requirements and plan and perform the audit to obtain reasonable assurance whether
the financial statements are free from material misstatement.
An audit involves performing procedures to obtain audit evidence about the amounts and
disclosures in the financial statements. The procedures selected depend on the Auditor’s
judgment, including the assessment of the risks of material misstatement of the financial
statements, whether due to fraud or error. In making those risk assessments, the Auditor
considers internal control relevant to the entity’s preparation and fair presentation of the
financial statements in order to design audit procedures that are appropriate in the
circumstances, but not for the purpose of expressing an opinion on the effectiveness of the
entity’s internal control. An audit also includes evaluating the appropriateness of accounting
policies used and the reasonableness of accounting estimates made by the Board of
Directors of the SICAV, as well as evaluating the overall presentation of the financial
statements.
R.C.S. Luxembourg B 65 477 - TVA LU17564447
PricewaterhouseCoopers
Société à responsabilité limitée
Réviseur d'Entreprises
400, route d’Esch
B.P. 1443
L-1014 Luxembourg
Telephone +352 494848-1
Facsimile +352 494848-2900
www.pwc.com/lu

246 BlackRock Global Funds (BGF)
We believe that the audit evidence we have obtained is sufficient and appropriate to provide
a basis for our audit opinion.
Opinion
In our opinion, these financial statements give a true and fair view of the financial position
of BlackRock Global Funds and of each of its funds as of 31 August 2009, and of the
results of their operations and changes in their net assets for the year then ended in
accordance with Luxembourg legal and regulatory requirements relating to the preparation
of the financial statements.
Other matters
Supplementary information included in the annual report has been reviewed in the context
of our mandate but has not been subject to specific audit procedures carried out in
accordance with the standards described above. Consequently, we express no opinion on
such information. However, we have no observation to make concerning such information
in the context of the financial statements taken as a whole.
PricewaterhouseCoopers S.à r.l. Luxembourg, 2 December 2009Réviseur d’entreprisesRepresented by
John Parkhouse

Audited Annual Report and Accounts 247
General Information
Current Prospectus
The Company’s Prospectus, and Simplified Prospectus dated 9 October 2009 along with copies of the Application Form may be
obtained from the Investor Services Centre, the Manager or any of the Representatives or Distributors. Copies of the Company’s
Articles of Association and the Audited Annual and Unaudited Interim Report and Accounts may also be obtained free of charge
from any of these offices and from the Paying Agents.
Representatives
The representative in Hong Kong is BlackRock (Hong Kong) Limited, II/F York House No 15. Queens Road, Central Hong Kong.
The representative in Switzerland is BlackRock Investment Management (UK) Limited (London), Zurich Branch, Claridenstrasse 25,
P.O. Box 2118, CH-8022 Zürich. The representative in Poland is BlackRock Investment Management (UK) Limited, Oddział w Polsce,
Rondo Onz 1, 00-124 Warsaw, Poland.
Authorised Status
The Company is an Undertaking for Collective Investment in Transferable Securities (“UCITS”) under the Luxembourg law of
20 December 2002. Regulatory consents have been obtained or appropriate notifications have been made for the distribution of
shares of all the Company’s funds in the following countries:
Austria, Denmark, Finland, France, Germany, Gibraltar, Guernsey, Hungary, Iceland, Ireland, Jersey, Luxembourg, Mauritius,
Netherlands, Norway, Poland, Spain, Sweden and the United Kingdom.
Regulatory consents have been obtained or appropriate notifications have been made for the distribution of shares of certain
of the Company’s funds in the following countries:
Bahrain, Belgium, Brunei, Chile, Greece, Hong Kong, Italy, Japan, Korea, Macau, Peru, Portugal, Qatar, Switzerland and Taiwan.
Shares of certain of the Company’s funds may also be offered in Malta and Singapore by private placement.
Paying Agents
Austria
Raiffeisen Zentralbank
Österreich AG
Am Stadtpark 9
A-1030 Vienna
Belgium
J.P. Morgan Chase Bank,
Brussels Branch
1 Boulevard du Roi Albert II
B-1210 Brussels
Germany
J.P. Morgan AG
Junghofstrasse 14
60311 Frankfurt am Main
Luxembourg
Central Paying Agent
J.P. Morgan Bank
Luxembourg S.A.
European Bank
& Business Centre
6C, route de Trèves
L-2633 Senningerberg
Italy
Intesa Sanpaolo S.p.A.
Piazza San Carlo 156
I-10121 Turin
Banca Popolare Commercio
e Industria S.p.A.
Via della Moscova 33
I-20121 Milan
BNP Paribas Securities
Services
Succursale di Milano
Via Ansperto 5
I-20123 Milan
Banca Monte dei Paschi
di Siena S.p.A.
Piazza Salimbeni 3
I-53100 Siena
Société Générale Securities
Services S.p.A.
Via Benigno Crespi 19/A-MAC 2
I-20159 Milan
Allfunds Bank S.A.
Milan branch
Via Santa Margherita 7
I-20121 Milan
Poland
Bank Handlowy
w Warszawie S.A.
ul. Senatorska 16
PL-00-923 Warsaw
Switzerland
J.P. Morgan Chase Bank,
National Association,
Columbus,
Zurich Branch Switzerland
Dreikönigstrasse 21
CH-8002 Zurich
United Kingdom
J.P. Morgan Trustee and
Depositary Company Limited
Hampshire Building,
1st Floor
Chaseside
Bournemouth
BH7 7DA
248 BlackRock Global Funds (BGF)
General Information continued
Mauritius Subsidiary
Indian Investment Adviser Investment Manager
DSP BlackRock Investment Managers Private Limited BlackRock Investment Management (UK) Limited
Tulsiani Chambers, West Wing, 11th Floor 33 King William Street
Nariman Point London EC4R 9AS
Mumbai-400 021 England
India
Mauritian Administrator Legal Adviser
International Financial Services Limited In Mauritius
IFS Court R.R Luchmaya
TwentyEight Cybercity Luchmaya & Luchmaya Chambers
Ebene Georges Guibert Street
Mauritius Port Louis
Mauritius
Mauritian Auditor to the Subsidiary
PricewaterhouseCoopers
18 Cybercity,
Ebene
Mauritius
Publication of Prices and Notices to Shareholders
Notices of General Meetings are given by publication in the Recueil Spécial du Mémorial and the Luxemburger Wort in
Luxembourg, in the Financial Times in London, and also in newspapers in Frankfurt, Vienna and Zurich. Financial notices are given
by publication in the Financial Times in London, and also in Luxembourg, Frankfurt, Vienna and Zurich. The previous Dealing Day’s
prices for shares may be obtained during business hours from the Investor Service Centre. They will also be published in such
countries as required under applicable law and at the discretion of the Directors in a number of newspapers worldwide. The
Company cannot accept any responsibility for error or delay in the publication or non-publication of prices. Historic dealing prices
for all shares are available from the Fund Accountant or local Investor Services Centre.
Purchases and Sales
A detailed list of investments purchased and sold for any fund during the year is available upon request, free of charge, from the
Registered office, or the offices of the Representatives as mentioned above.
Disclosure Policy
Details of month end holdings and valuations for all BlackRock Global Funds will be made available upon request from the Investor
Services Centre to any BlackRock Global Funds shareholder no earlier than 10 business days after a given month end. BlackRock
Global Funds reserves the right to require shareholders to sign an appropriate non-disclosure document prior to providing such
information.


PRISMA 09/1543 BGF AR ENG 0809
FOR MORE INFORMATION
Tel: +44 (0)20 7743 3000
blackrock.com/international