Embed Size (px)
Citation preview

BlackRock Council Presentation
Prepared for The Nebraska Investment Council
Scott Dohemann, CFA, Managing Director
Diane Parish, Managing Director
FOR USE WITH INSTITUTIONAL INVESTORS ONLY – PROPRIETARY AND CONFIDENTIAL
June 13, 2017
BETA0617U-167594-468787
2FOR USE WITH INSTITUTIONAL INVESTORS ONLY – PROPRIETARY AND CONFIDENTIAL
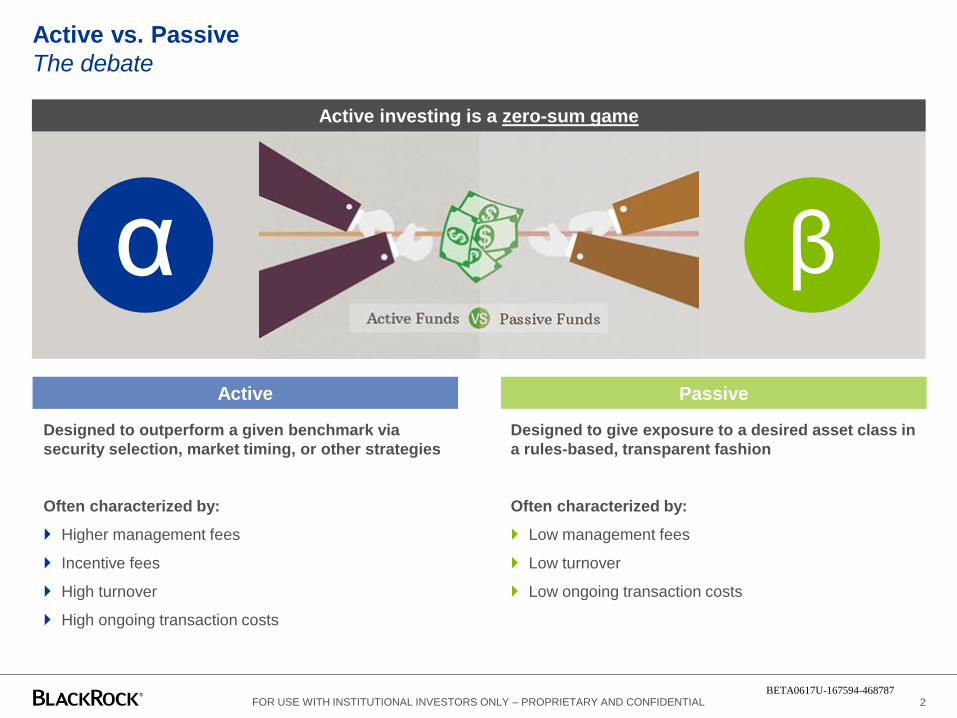
Active vs. Passive
The debate
α β
Active investing is a zero-sum game
Designed to outperform a given benchmark via
security selection, market timing, or other strategies
Often characterized by:
Higher management fees
Incentive fees
High turnover
High ongoing transaction costs
Active Passive
Designed to give exposure to a desired asset class in
a rules-based, transparent fashion
Often characterized by:
Low management fees
Low turnover
Low ongoing transaction costs
BETA0617U-167594-468787
3FOR USE WITH INSTITUTIONAL INVESTORS ONLY – PROPRIETARY AND CONFIDENTIAL
Fund Category BenchmarkMutual Funds
Net of fees
Mutual Funds
Gross of fees
Institutional
accounts
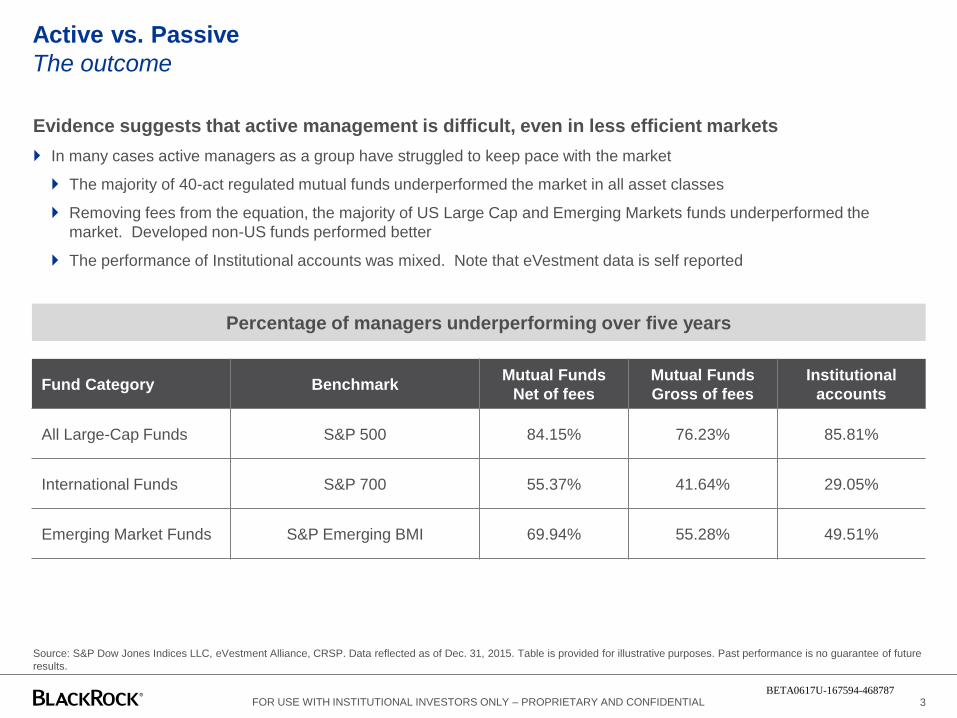
All Large-Cap Funds S&P 500 84.15% 76.23% 85.81%
International Funds S&P 700 55.37% 41.64% 29.05%
Emerging Market Funds S&P Emerging BMI 69.94% 55.28% 49.51%
Source: S&P Dow Jones Indices LLC, eVestment Alliance, CRSP. Data reflected as of Dec. 31, 2015. Table is provided for illustrative purposes. Past performance is no guarantee of future
results.
Active vs. Passive
The outcome
Evidence suggests that active management is difficult, even in less efficient markets
In many cases active managers as a group have struggled to keep pace with the market
The majority of 40-act regulated mutual funds underperformed the market in all asset classes
Removing fees from the equation, the majority of US Large Cap and Emerging Markets funds underperformed the
market. Developed non-US funds performed better
The performance of Institutional accounts was mixed. Note that eVestment data is self reported
Percentage of managers underperforming over five years
BETA0617U-167594-468787
Active vs. Passive
Plan sponsor considerations
4FOR USE WITH INSTITUTIONAL INVESTORS ONLY – PROPRIETARY AND CONFIDENTIAL
Do you have the skill to identify managers who will outperform after fees in the future?
If your active manager is underperforming, what actions does your governance structure require you to
take?
Non-US managers might inherently outperform the net total return benchmark due to foreign tax reclaim*.
Are they calling that alpha?
Are you getting the most out of your index assets?
*Sources: S&P Dow Jones Indices, 2016 SPIVA Report
BETA0617U-167594-468787
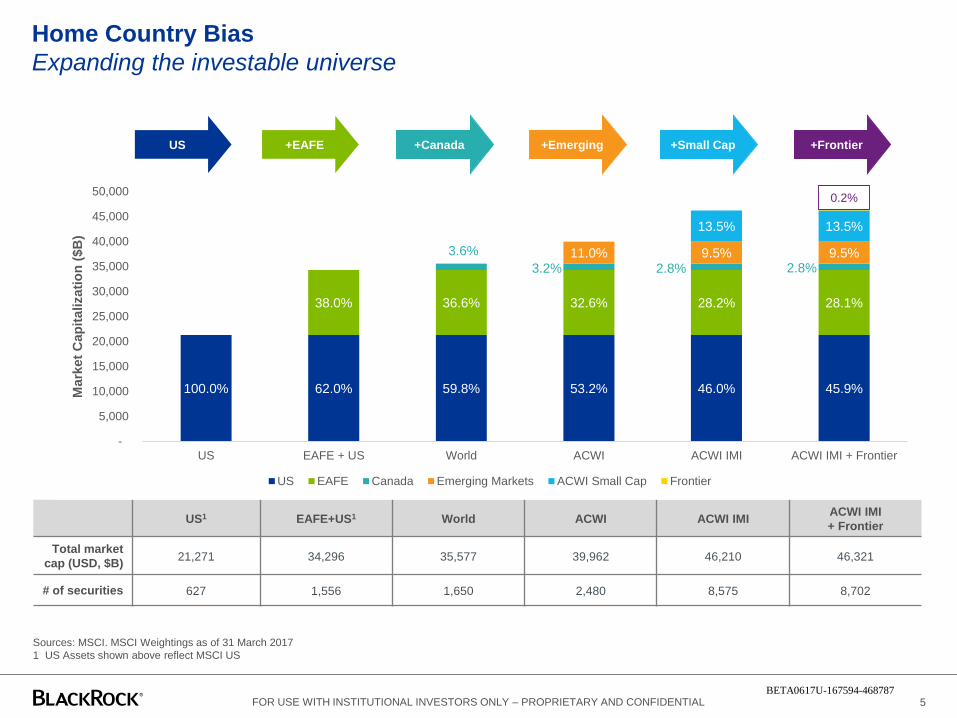
Home Country Bias
Expanding the investable universe
5FOR USE WITH INSTITUTIONAL INVESTORS ONLY – PROPRIETARY AND CONFIDENTIAL
US +EAFE +Canada +Emerging +Small Cap +Frontier
US1 EAFE+US1 World ACWI ACWI IMIACWI IMI
+ Frontier
Total market
cap (USD, $B)21,271 34,296 35,577 39,962 46,210 46,321
# of securities 627 1,556 1,650 2,480 8,575 8,702
Sources: MSCI. MSCI Weightings as of 31 March 2017
1 US Assets shown above reflect MSCI US
100.0% 62.0% 59.8% 53.2% 46.0% 45.9%
38.0% 36.6% 32.6% 28.2% 28.1%
11.0% 9.5% 9.5%
13.5% 13.5%
-
5,000
10,000
15,000
20,000
25,000
30,000
35,000
40,000
45,000
50,000
US EAFE + US World ACWI ACWI IMI ACWI IMI + Frontier
Mark
et
Cap
italizati
on
($B
)
US EAFE Canada Emerging Markets ACWI Small Cap Frontier
3.6%
3.2% 2.8% 2.8%
0.2%
BETA0617U-167594-468787
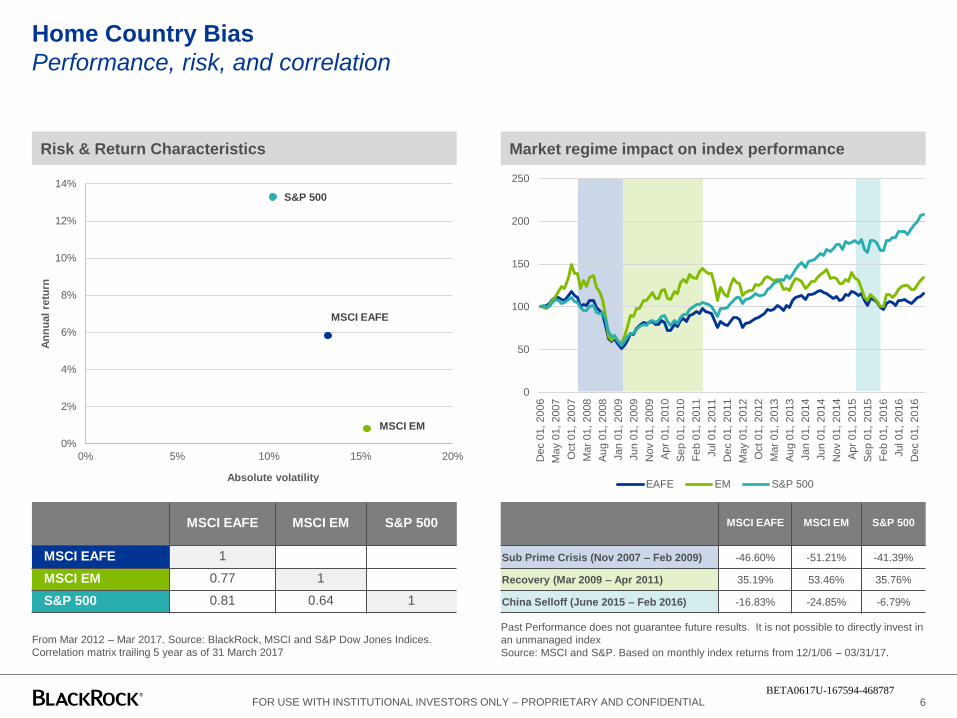
Home Country Bias
Performance, risk, and correlation
6FOR USE WITH INSTITUTIONAL INVESTORS ONLY – PROPRIETARY AND CONFIDENTIAL
0
50
100
150
200
250
Dec 0
1, 20
06
Ma
y 0
1, 2007
Oct 01,
2007
Ma
r 01
, 2008
Au
g 0
1, 2
008
Jan
01, 200
9
Jun
01, 200
9
Nov 0
1, 20
09
Ap
r 01,
2010
Se
p 0
1, 2
010
Fe
b 0
1, 2011
Jul 01, 2011
Dec 0
1, 20
11
Ma
y 0
1, 2012
Oct 01,
2012
Ma
r 01
, 2013
Au
g 0
1, 2
013
Jan
01, 201
4
Jun
01, 201
4
Nov 0
1, 20
14
Ap
r 01,
2015
Se
p 0
1, 2
015
Fe
b 0
1, 2016
Jul 01, 2016
Dec 0
1, 20
16
EAFE EM S&P 500
MSCI EAFE
MSCI EM
S&P 500
0%
2%
4%
6%
8%
10%
12%
14%
0% 5% 10% 15% 20%
An
nu
al
retu
rn
Absolute volatility
MSCI EAFE MSCI EM S&P 500
MSCI EAFE 1
MSCI EM 0.77 1
S&P 500 0.81 0.64 1
Risk & Return Characteristics
From Mar 2012 – Mar 2017. Source: BlackRock, MSCI and S&P Dow Jones Indices.
Correlation matrix trailing 5 year as of 31 March 2017
Market regime impact on index performance
MSCI EAFE MSCI EM S&P 500
Sub Prime Crisis (Nov 2007 – Feb 2009) -46.60% -51.21% -41.39%
Recovery (Mar 2009 – Apr 2011) 35.19% 53.46% 35.76%
China Selloff (June 2015 – Feb 2016) -16.83% -24.85% -6.79%
Past Performance does not guarantee future results. It is not possible to directly invest in
an unmanaged index
Source: MSCI and S&P. Based on monthly index returns from 12/1/06 – 03/31/17.
BETA0617U-167594-468787
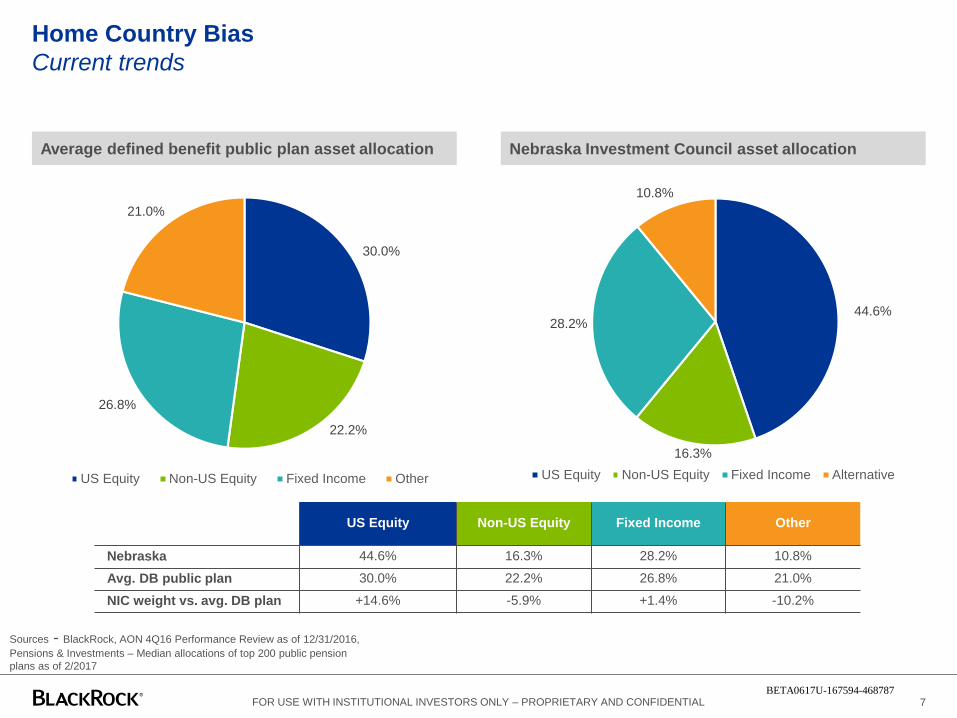
Home Country Bias
Current trends
7FOR USE WITH INSTITUTIONAL INVESTORS ONLY – PROPRIETARY AND CONFIDENTIAL
Average defined benefit public plan asset allocation Nebraska Investment Council asset allocation
30.0%
22.2%
26.8%
21.0%
US Equity Non-US Equity Fixed Income Other
44.6%
16.3%
28.2%
10.8%
US Equity Non-US Equity Fixed Income Alternative
US Equity Non-US Equity Fixed Income Other
Nebraska 44.6% 16.3% 28.2% 10.8%
Avg. DB public plan 30.0% 22.2% 26.8% 21.0%
NIC weight vs. avg. DB plan +14.6% -5.9% +1.4% -10.2%
Sources - BlackRock, AON 4Q16 Performance Review as of 12/31/2016,
Pensions & Investments – Median allocations of top 200 public pension
plans as of 2/2017
BETA0617U-167594-468787
8FOR USE WITH INSTITUTIONAL INVESTORS ONLY – PROPRIETARY AND CONFIDENTIAL
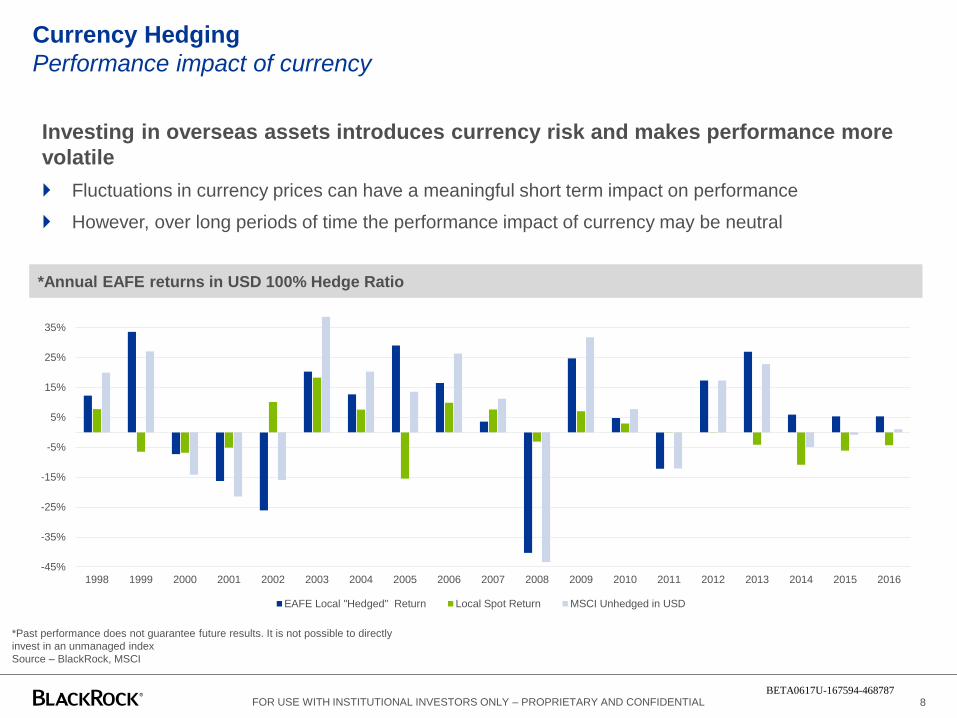
Currency Hedging
Performance impact of currency
Investing in overseas assets introduces currency risk and makes performance more
volatile
Fluctuations in currency prices can have a meaningful short term impact on performance
However, over long periods of time the performance impact of currency may be neutral
-45%
-35%
-25%
-15%
-5%
5%
15%
25%
35%
1998 1999 2000 2001 2002 2003 2004 2005 2006 2007 2008 2009 2010 2011 2012 2013 2014 2015 2016
EAFE Local "Hedged" Return Local Spot Return MSCI Unhedged in USD
*Annual EAFE returns in USD 100% Hedge Ratio
*Past performance does not guarantee future results. It is not possible to directly
invest in an unmanaged index
Source – BlackRock, MSCI
BETA0617U-167594-468787
9FOR USE WITH INSTITUTIONAL INVESTORS ONLY – PROPRIETARY AND CONFIDENTIAL
Currency Hedging
To hedge or not to hedge
Currency hedging helps minimize the volatility of holding overseas assets
Currency hedging can remove much of the effect of currency fluctuations of the domestic value of investments
Currency hedging helps investors isolate the equity exposure they want
Currency can be hedged at a relatively low cost
A hedging program or currency overlay is not expected to add alpha. It only seeks to reduces risk
An optimal currency hedge ratio can be determined that is designed to balance costs
and risks around a given strategic asset allocation
The hedging decision is based on the belief that currency exposure adds volatility (risk) to a portfolio without the
expectation of corresponding return
In general, implementing a hedging strategy may reduce the risk of an international portfolio; however, its impact on the
overall plan will depend on the size of the allocation to international assets
BETA0617U-167594-468787
10FOR USE WITH INSTITUTIONAL INVESTORS ONLY – PROPRIETARY AND CONFIDENTIAL
Currency Hedging
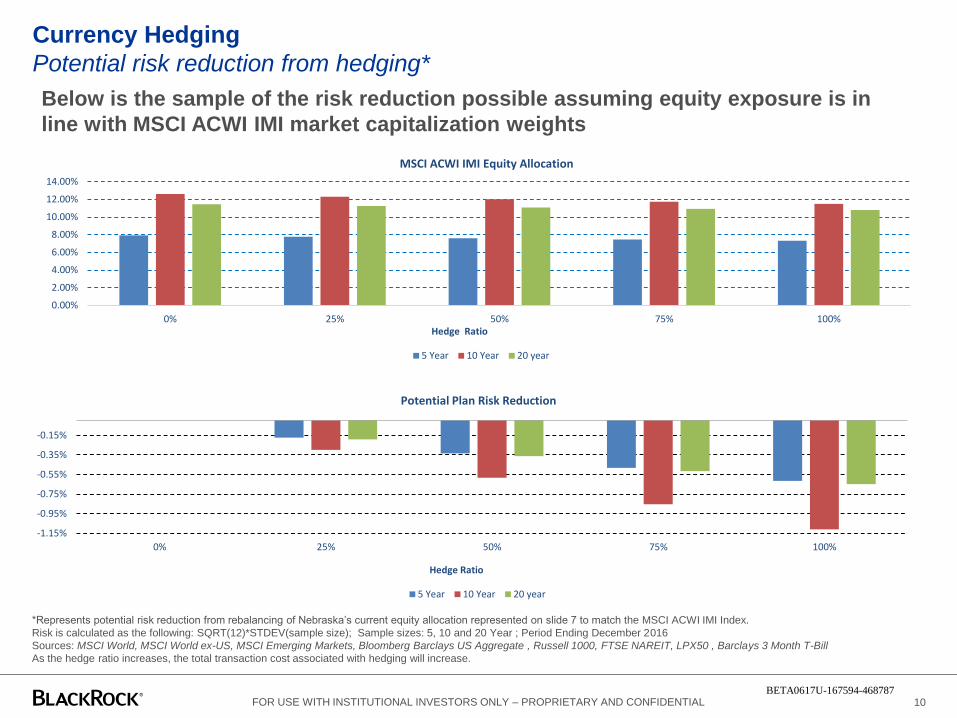
Potential risk reduction from hedging*
Below is the sample of the risk reduction possible assuming equity exposure is in
line with MSCI ACWI IMI market capitalization weights
0.00%
2.00%
4.00%
6.00%
8.00%
10.00%
12.00%
14.00%
0% 25% 50% 75% 100%Hedge Ratio
MSCI ACWI IMI Equity Allocation
5 Year 10 Year 20 year
-1.15%
-0.95%
-0.75%
-0.55%
-0.35%
-0.15%
0% 25% 50% 75% 100%
Hedge Ratio
Potential Plan Risk Reduction
5 Year 10 Year 20 year
*Represents potential risk reduction from rebalancing of Nebraska’s current equity allocation represented on slide 7 to match the MSCI ACWI IMI Index.
Risk is calculated as the following: SQRT(12)*STDEV(sample size); Sample sizes: 5, 10 and 20 Year ; Period Ending December 2016
Sources: MSCI World, MSCI World ex-US, MSCI Emerging Markets, Bloomberg Barclays US Aggregate , Russell 1000, FTSE NAREIT, LPX50 , Barclays 3 Month T-Bill
As the hedge ratio increases, the total transaction cost associated with hedging will increase.
BETA0617U-167594-468787
Appendix
A. Presenter Biographies
B. Disclosures
BETA0617U-167594-468787

Scott Dohemann, CFA, Managing Director, is Head of US Index Strategy within BlackRock's ETF & Index Investments Group.
Mr. Dohemann's service with the firm dates back to 1998, including his years with Barclays Global Investors (BGI), which
merged with BlackRock in 2009. Prior to his current Beta Strategy role, he was part of the Transition Management team where
he was responsible for advising clients on transition activity as well as further developing the transition product. At BGI, Mr.
Dohemann fulfilled a similar transition management role as a senior transition manager in the group both in advising clients
and in undertaking responsibilities for a team of portfolio managers and operational specialists. Prior to joining BGI, he worked
for Merrill Lynch as a financial consultant in the Private Client Group.
Mr. Dohemann earned a BSc in finance from San Diego State University in 1992.
Diane Parish, Managing Director, is a member of the US and Canada Institutional team within BlackRock's Institutional Client
Business. She is responsible for developing and maintaining relationships with institutional investors, including corporations
and public and private pension plans.
Previously Ms. Parish was a fixed income portfolio manager in BlackRock's Portfolio Management Group, specializing in
managing insurance company portfolios. Prior to joining BlackRock in 1995, Ms. Parish was a Director and fixed income
portfolio manager at CS First Boston Investment Management Corporation, with responsibility for institutional portfolios. Before
joining the investment affiliate, Ms. Parish was a Vice President in the fixed income research department of The First Boston
Corporation. She began her career at the Frank Russell Company, where she advised pension fund clients on fixed income
managers and investment strategies.
Ms. Parish earned a BA degree in business administration from the University of Washington and an MBA degree in finance
from Columbia University.
Presenter Biographies
FOR USE WITH INSTITUTIONAL INVESTORS ONLY – PROPRIETARY AND CONFIDENTIAL 12BETA0617U-167594-468787
THE INFORMATION CONTAINED HEREIN MAY BE PROPRIETARY IN NATURE AND HAS BEEN PROVIDED TO YOU ON A CONFIDENTIAL BASIS, AND
MAY NOT BE REPRODUCED, COPIED OR DISTRIBUTED WITHOUT THE PRIOR CONSENT OF BLACKROCK, INC. (“BLACKROCK”). These materials are
not an advertisement and are not intended for public use or dissemination.
This communication is not an offer and should not be deemed to be a contractual commitment or undertaking between the intended recipient of this communication
and BlackRock but an indication of what services may be offered subject to a legally binding contract between the parties and therefore no reliance should be
placed on this document or its content. Opinions, estimates and recommendations offered constitute our judgment and are subject to change without notice, as are
statements of financial market trends, which are based on current market conditions. We believe the information provided here is reliable, but do not warrant its
accuracy or completeness. This communication and its content represent confidential information. This material has been prepared for informational purposes only,
and is not intended to provide, and should not be relied on for, accounting, legal or tax advice. You should consult your tax or legal adviser regarding such matters.
Any reference herein to any security and/or a particular issuer shall not constitute a recommendation to buy or sell, offer to buy, offer to sell, or a solicitation of an
offer to buy or sell any such securities issued by such issuer.
Performance and Fees
Past performance is not a guarantee or a reliable indicator of future results. Certain performance figures do not reflect the deduction of investment advisory
fees (described in Part 2 of BlackRock's Form ADV) but they do reflect commissions, other expenses (except custody), and reinvestment of earnings. Such fees
that a client may incur in the management of their investment advisory account may reduce the client's return. For example, assuming an annual gross return of 8%
and an annual management/advisory fee of .40%, the net annualized total return of the portfolio would be 7.58% over a 5-year period. The “net of fees’ performance
figures reflect the deduction of actual investment advisory fees but do not reflect the deduction of custodial fees. All periods longer than one year are annualized.
(Separate account clients may elect to include BlackRock funds in their portfolio; sector funds may be subject to additional terms and fees.)
Credit Quality
The credit quality of a particular security or group of securities does not ensure the stability or safety of an overall portfolio. The Quality ratings of individual
issues/issuers are provided to indicate the credit worthiness of such issues/issuer and generally range from AAA, Aaa, or AAA (highest) to D, C, or D (lowest) for
S&P, Moody’s, and Fitch respectively.
Forward Looking Information
This material may contain “forward-looking” information that is not purely historical in nature. Such information may include, among other things, projections,
forecasts, estimates of yields or returns, and proposed or expected portfolio composition. Moreover, where certain historical performance information of other
investment vehicles or composite accounts managed by BlackRock, Inc. and/or its subsidiaries (together, “BlackRock”) has been included in this material, such
performance information is presented by way of example only. No representation is made that the performance presented will be achieved, or that every
assumption made in achieving, calculating or presenting either the forward-looking information or the historical performance information herein has been considered
or stated in preparing this material. Any changes to assumptions that may have been made in preparing this material could have a material impact on the
investment returns that are presented herein by way of example.
Important Notes
FOR USE WITH INSTITUTIONAL INVESTORS ONLY – PROPRIETARY AND CONFIDENTIAL 13BETA0617U-167594-468787
Important Notes cont’d
Forecast
This material is not intended to be relied upon as a forecast, research or investment advice, and is not a recommendation, offer or solicitation to buy or sell any securities or
to adopt any investment strategy. The opinions expressed are those of the authors and may change as subsequent conditions vary. Individual portfolio managers for
BlackRock may have opinions and/or make investment decisions that, in certain respects, may not be consistent with the information contained in this document. The
information and opinions contained in this material are derived from proprietary and nonproprietary sources deemed by BlackRock to be reliable, are not necessarily all
inclusive and are not guaranteed as to accuracy. Past performance is no guarantee of future results. There is no guarantee that any of these views will come to pass.
Reliance upon information in this material is at the sole discretion of the reader.
Index
It is not possible to directly invest in an unmanaged index.
Risk
Investing in the bond market is subject to certain risks including market, interest-rate, issuer, credit, and inflation risk. Equities may decline in value due to both real and
perceived general market, economic, and industry conditions. Mortgage and asset-backed securities may be sensitive to changes in interest rates, subject to early
repayment risk, and while generally backed by a government, government-agency or private guarantor there is no assurance that the guarantor will meet its obligations.
High-yield, lower-rated, securities involve greater risk than higher-rated securities; portfolios that invest in them may be subject to greater levels of credit and liquidity risk
than portfolios that do not. Investors will, at times, incur a tax liability. Income from municipal bonds may be subject to state and local taxes and at times the alternative
minimum tax. Derivatives may involve certain costs and risks such as liquidity, interest rate, market, credit, management and the risk that a position could not be closed
when most advantageous. Investing in derivatives could lose more than the amount invested.
There can be no assurance that the investment objectives of any strategy referred to herein will be achieved. An investment in any strategy referred to herein involves a
high degree of risk, including the risk that the entire amount invested may be lost.
THIS MATERIAL IS HIGHLY CONFIDENTIAL AND IS NOT TO BE REPRODUCED OR DISTRIBUTED TO PERSONS OTHER THAN THE RECIPIENT.
The information contained in this presentation is proprietary and confidential and may contain commercial or financial information, trade secrets and/or intellectual property
of BlackRock. If this information is provided to an entity or agency that has, or is subject to, open records, open meetings, “freedom of information”, “sunshine” laws, rules,
regulations or policies or similar or related laws, rules, regulations or policies that require, do or may permit disclosure of any portion of this information to any other person
or entity to which it was provided by BlackRock (collectively, “Disclosure Laws”), BlackRock hereby asserts any and all available exemption, exception, procedures, rights
to prior consultation or other protection from disclosure which may be available to it under applicable Disclosure Laws.
© 2017 BlackRock, Inc. All rights reserved. ALADDIN, BLACKROCK, BLACKROCK SOLUTIONS, and iSHARES are registered trademarks of BlackRock, Inc. or its
subsidiaries in the United States and elsewhere. All other trademarks are the property of their respective owners.
FOR USE WITH INSTITUTIONAL INVESTORS ONLY – PROPRIETARY AND CONFIDENTIAL 14BETA0617U-167594-468787