Embed Size (px)
Citation preview

BlackRock Cash Management
CalTRUST
August 3, 2017

For use with institutional investors only — proprietary and confidential
I. BlackRock Overview
II. Cash Management at BlackRock
III. Short Duration at BlackRock
IV. Market Review
V. CalTRUST Short Duration Portfolios
Appendices
A. Biographies of investment professionals
Table of contents
2

I. BlackRock Overview
For use with institutional investors only — proprietary and confidential
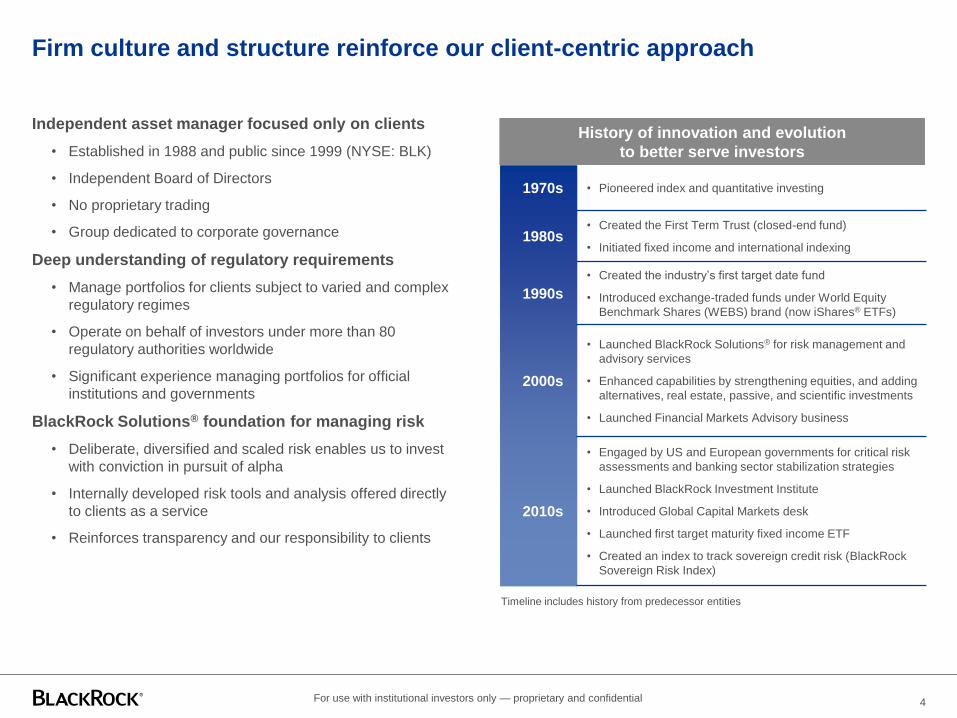
Firm culture and structure reinforce our client-centric approach
4
Independent asset manager focused only on clients
• Established in 1988 and public since 1999 (NYSE: BLK)
• Independent Board of Directors
• No proprietary trading
• Group dedicated to corporate governance
Deep understanding of regulatory requirements
• Manage portfolios for clients subject to varied and complex
regulatory regimes
• Operate on behalf of investors under more than 80
regulatory authorities worldwide
• Significant experience managing portfolios for official
institutions and governments
BlackRock Solutions® foundation for managing risk
• Deliberate, diversified and scaled risk enables us to invest
with conviction in pursuit of alpha
• Internally developed risk tools and analysis offered directly
to clients as a service
• Reinforces transparency and our responsibility to clients
1970s • Pioneered index and quantitative investing
1980s• Created the First Term Trust (closed-end fund)
• Initiated fixed income and international indexing
1990s
• Created the industry’s first target date fund
• Introduced exchange-traded funds under World Equity
Benchmark Shares (WEBS) brand (now iShares® ETFs)
2000s
• Launched BlackRock Solutions® for risk management and
advisory services
• Enhanced capabilities by strengthening equities, and adding
alternatives, real estate, passive, and scientific investments
• Launched Financial Markets Advisory business
2010s
• Engaged by US and European governments for critical risk
assessments and banking sector stabilization strategies
• Launched BlackRock Investment Institute
• Introduced Global Capital Markets desk
• Launched first target maturity fixed income ETF
• Created an index to track sovereign credit risk (BlackRock
Sovereign Risk Index)
History of innovation and evolution
to better serve investors
Timeline includes history from predecessor entities
For use with institutional investors only — proprietary and confidential
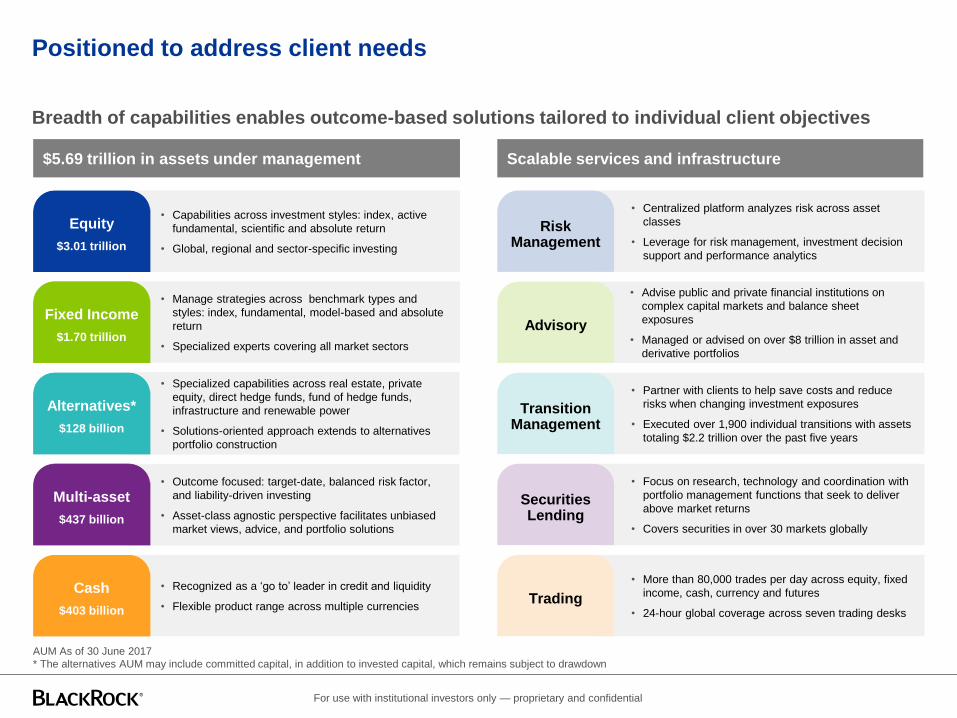
Positioned to address client needs
Breadth of capabilities enables outcome-based solutions tailored to individual client objectives
AUM As of 30 June 2017
* The alternatives AUM may include committed capital, in addition to invested capital, which remains subject to drawdown
• Capabilities across investment styles: index, active
fundamental, scientific and absolute return
• Global, regional and sector-specific investing
• Specialized capabilities across real estate, private
equity, direct hedge funds, fund of hedge funds,
infrastructure and renewable power
• Solutions-oriented approach extends to alternatives
portfolio construction
• Manage strategies across benchmark types and
styles: index, fundamental, model-based and absolute
return
• Specialized experts covering all market sectors
• Recognized as a ‘go to’ leader in credit and liquidity
• Flexible product range across multiple currencies
• Outcome focused: target-date, balanced risk factor,
and liability-driven investing
• Asset-class agnostic perspective facilitates unbiased
market views, advice, and portfolio solutions
$5.69 trillion in assets under management Scalable services and infrastructure
• Centralized platform analyzes risk across asset
classes
• Leverage for risk management, investment decision
support and performance analytics
• Partner with clients to help save costs and reduce
risks when changing investment exposures
• Executed over 1,900 individual transitions with assets
totaling $2.2 trillion over the past five years
• Advise public and private financial institutions on
complex capital markets and balance sheet
exposures
• Managed or advised on over $8 trillion in asset and
derivative portfolios
• More than 80,000 trades per day across equity, fixed
income, cash, currency and futures
• 24-hour global coverage across seven trading desks
• Focus on research, technology and coordination with
portfolio management functions that seek to deliver
above market returns
• Covers securities in over 30 markets globally
Equity
$3.01 trillion
Fixed Income
$1.70 trillion
Alternatives*
$128 billion
Multi-asset
$437 billion
Cash
$403 billion
Risk Management
Advisory
Transition Management
Securities Lending
Trading

For use with institutional investors only — proprietary and confidential
Global fixed income platform provides greater access to
investment opportunities
Benefits of BlackRock's breadth and depth
• Talent: 400+ fixed income professionals generate ideas and identify insights to create alpha opportunities
• Trading: Global execution platform provides deep market access
• Technology: Best-in-class analytics and risk management enables us to better understand and take risk in pursuit of alpha
• Culture: Fiduciary commitment to advising and serving clients drives our investment culture
Experienced leadership team oversees portfolio teams with decision-making autonomy
AUM in USD and data as of 30 June 2017; excludes fixed income alternative assets. For illustrative purposes only.
Active
$783 billion
Global Fixed Income Platform
$1.70 trillion
Tim WebbGlobal Head of Fixed Income
Rick RiederCIO of Global Fixed Income
Fundamental
$738 billion
Model-Based
$45 billion
Index
$557 billion
ETF
$365 billion
Passive
$922 billion
For use with institutional investors only — proprietary and confidential
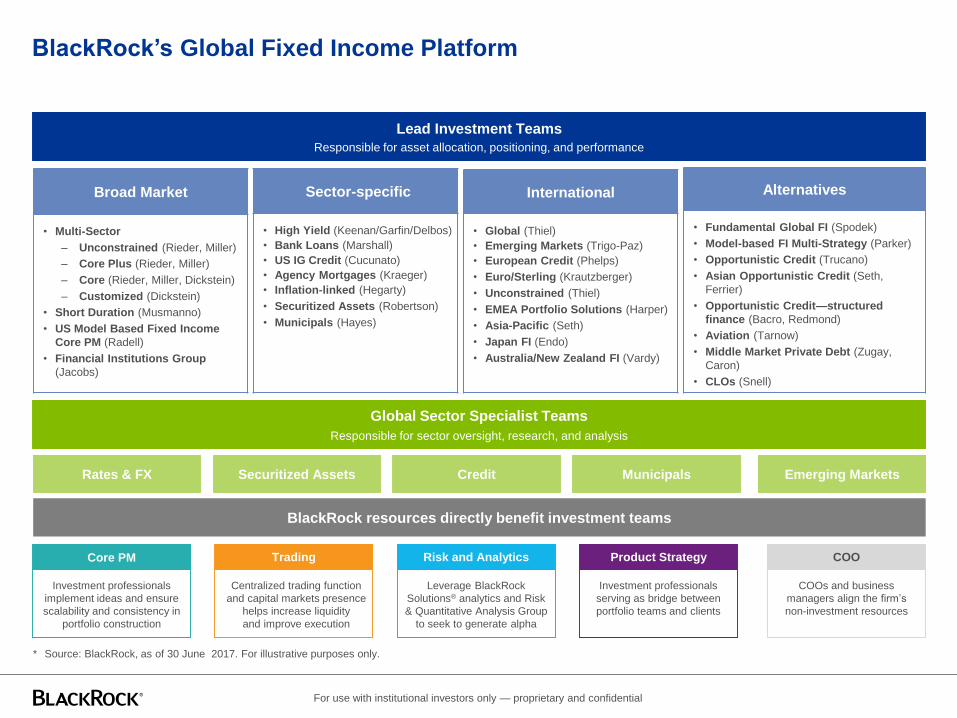
BlackRock’s Global Fixed Income Platform
* Source: BlackRock, as of 30 June 2017. For illustrative purposes only.
Global Sector Specialist Teams
Responsible for sector oversight, research, and analysis
Lead Investment Teams
Responsible for asset allocation, positioning, and performance
Rates & FX Securitized Assets Credit Municipals Emerging Markets
Risk and Analytics
Leverage BlackRock
Solutions® analytics and Risk
& Quantitative Analysis Group
to seek to generate alpha
Core PM
Investment professionals
implement ideas and ensure
scalability and consistency in
portfolio construction
Trading
Centralized trading function
and capital markets presence
helps increase liquidity
and improve execution
Product Strategy
Investment professionals
serving as bridge between
portfolio teams and clients
BlackRock resources directly benefit investment teams
COO
COOs and business
managers align the firm’s
non-investment resources
Broad Market
• Multi-Sector
– Unconstrained (Rieder, Miller)
– Core Plus (Rieder, Miller)
– Core (Rieder, Miller, Dickstein)
– Customized (Dickstein)
• Short Duration (Musmanno)
• US Model Based Fixed Income
Core PM (Radell)
• Financial Institutions Group
(Jacobs)
Sector-specific
• High Yield (Keenan/Garfin/Delbos)
• Bank Loans (Marshall)
• US IG Credit (Cucunato)
• Agency Mortgages (Kraeger)
• Inflation-linked (Hegarty)
• Securitized Assets (Robertson)
• Municipals (Hayes)
International
• Global (Thiel)
• Emerging Markets (Trigo-Paz)
• European Credit (Phelps)
• Euro/Sterling (Krautzberger)
• Unconstrained (Thiel)
• EMEA Portfolio Solutions (Harper)
• Asia-Pacific (Seth)
• Japan FI (Endo)
• Australia/New Zealand FI (Vardy)
Alternatives
• Fundamental Global FI (Spodek)
• Model-based FI Multi-Strategy (Parker)
• Opportunistic Credit (Trucano)
• Asian Opportunistic Credit (Seth,
Ferrier)
• Opportunistic Credit—structured
finance (Bacro, Redmond)
• Aviation (Tarnow)
• Middle Market Private Debt (Zugay,
Caron)
• CLOs (Snell)
II. Cash Management at BlackRock
For use with institutional investors only — proprietary and confidentialL-0651
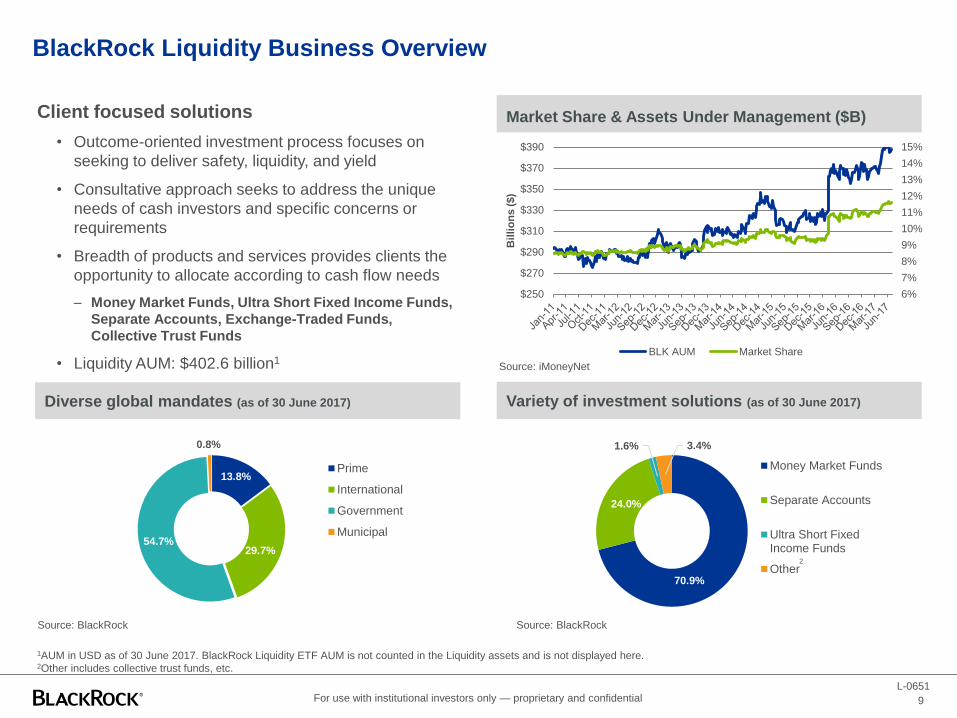
BlackRock Liquidity Business Overview
9
1AUM in USD as of 30 June 2017. BlackRock Liquidity ETF AUM is not counted in the Liquidity assets and is not displayed here. 2Other includes collective trust funds, etc.
Client focused solutions
• Outcome-oriented investment process focuses on
seeking to deliver safety, liquidity, and yield
• Consultative approach seeks to address the unique
needs of cash investors and specific concerns or
requirements
• Breadth of products and services provides clients the
opportunity to allocate according to cash flow needs
– Money Market Funds, Ultra Short Fixed Income Funds,
Separate Accounts, Exchange-Traded Funds,
Collective Trust Funds
• Liquidity AUM: $402.6 billion1
13.8%
29.7%54.7%
0.8%
Prime
International
Government
Municipal
Diverse global mandates (as of 30 June 2017)
Market Share & Assets Under Management ($B)
Variety of investment solutions (as of 30 June 2017)
70.9%
24.0%
1.6% 3.4%
Money Market Funds
Separate Accounts
Ultra Short FixedIncome Funds
Other
Source: iMoneyNet
Source: BlackRockSource: BlackRock
6%
7%
8%
9%
10%
11%
12%
13%
14%
15%
$250
$270
$290
$310
$330
$350
$370
$390
Bil
lio
ns
($)
BLK AUM Market Share
2
For use with institutional investors only — proprietary and confidential
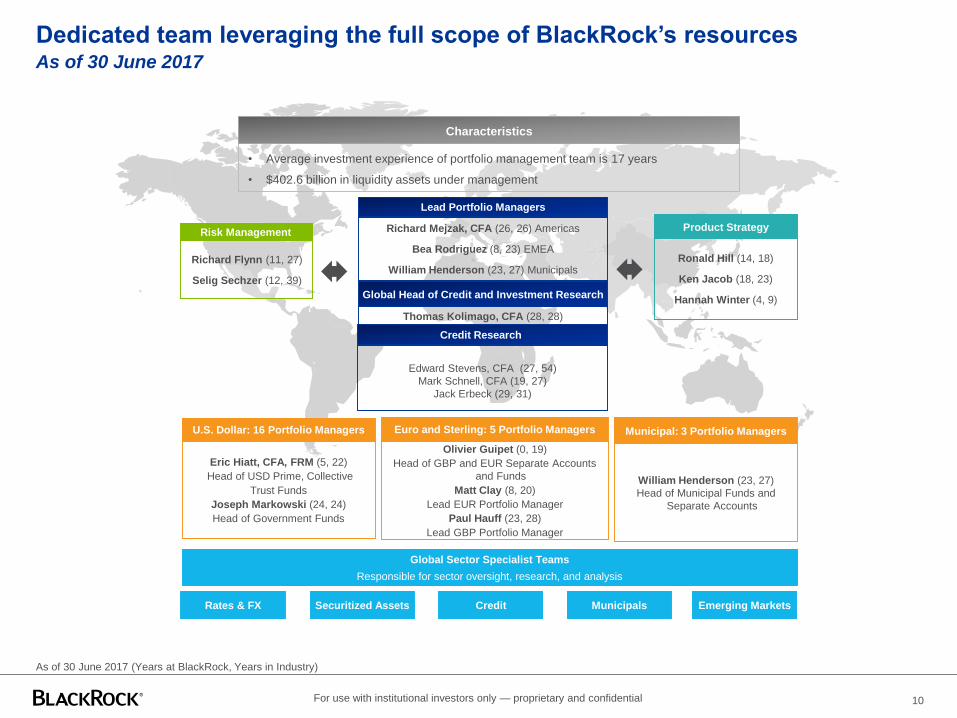
Dedicated team leveraging the full scope of BlackRock’s resourcesAs of 30 June 2017
• Average investment experience of portfolio management team is 17 years
• $402.6 billion in liquidity assets under management
Characteristics
As of 30 June 2017 (Years at BlackRock, Years in Industry)
Risk Management
Richard Flynn (11, 27)
Selig Sechzer (12, 39)
Richard Mejzak, CFA (26, 26) Americas
Bea Rodriguez (8, 23) EMEA
William Henderson (23, 27) Municipals
Lead Portfolio Managers
Global Head of Credit and Investment Research
Thomas Kolimago, CFA (28, 28)
Credit Research
Edward Stevens, CFA (27, 54)
Mark Schnell, CFA (19, 27)
Jack Erbeck (29, 31)
Product Strategy
Ronald Hill (14, 18)
Ken Jacob (18, 23)
Hannah Winter (4, 9)
Global Sector Specialist Teams
Responsible for sector oversight, research, and analysis
Rates & FX Securitized Assets Credit Municipals Emerging Markets
U.S. Dollar: 16 Portfolio Managers
Eric Hiatt, CFA, FRM (5, 22)
Head of USD Prime, Collective
Trust Funds
Joseph Markowski (24, 24)
Head of Government Funds
Euro and Sterling: 5 Portfolio Managers
Olivier Guipet (0, 19)
Head of GBP and EUR Separate Accounts
and Funds
Matt Clay (8, 20)
Lead EUR Portfolio Manager
Paul Hauff (23, 28)
Lead GBP Portfolio Manager
Municipal: 3 Portfolio Managers
William Henderson (23, 27)
Head of Municipal Funds and
Separate Accounts
10
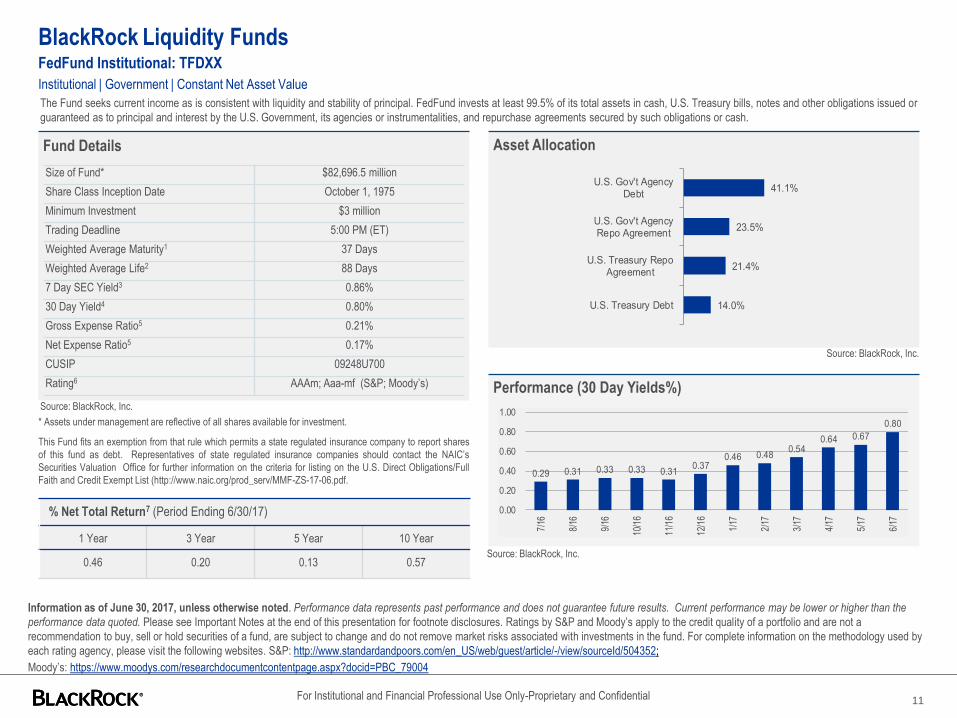
Performance (30 Day Yields%)
Fund Details
Size of Fund* $82,696.5 million
Share Class Inception Date October 1, 1975
Minimum Investment $3 million
Trading Deadline 5:00 PM (ET)
Weighted Average Maturity1 37 Days
Weighted Average Life2 88 Days
7 Day SEC Yield3 0.86%
30 Day Yield4 0.80%
Gross Expense Ratio5 0.21%
Net Expense Ratio5 0.17%
CUSIP 09248U700
Rating6 AAAm; Aaa-mf (S&P; Moody’s)
Information as of June 30, 2017, unless otherwise noted. Performance data represents past performance and does not guarantee future results. Current performance may be lower or higher than the
performance data quoted. Please see Important Notes at the end of this presentation for footnote disclosures. Ratings by S&P and Moody’s apply to the credit quality of a portfolio and are not a
recommendation to buy, sell or hold securities of a fund, are subject to change and do not remove market risks associated with investments in the fund. For complete information on the methodology used by
each rating agency, please visit the following websites. S&P: http://www.standardandpoors.com/en_US/web/guest/article/-/view/sourceId/504352;
Moody’s: https://www.moodys.com/researchdocumentcontentpage.aspx?docid=PBC_79004
BlackRock Liquidity Funds FedFund Institutional: TFDXX
The Fund seeks current income as is consistent with liquidity and stability of principal. FedFund invests at least 99.5% of its total assets in cash, U.S. Treasury bills, notes and other obligations issued or
guaranteed as to principal and interest by the U.S. Government, its agencies or instrumentalities, and repurchase agreements secured by such obligations or cash.
* Assets under management are reflective of all shares available for investment.
Source: BlackRock, Inc.
Source: BlackRock, Inc.
Asset Allocation
Source: BlackRock, Inc.
41.1%
23.5%
21.4%
14.0%
U.S. Gov't AgencyDebt
U.S. Gov't AgencyRepo Agreement
U.S. Treasury RepoAgreement
U.S. Treasury Debt
For Institutional and Financial Professional Use Only-Proprietary and Confidential
% Net Total Return7 (Period Ending 6/30/17)
1 Year 3 Year 5 Year 10 Year
0.46 0.20 0.13 0.57
This Fund fits an exemption from that rule which permits a state regulated insurance company to report shares
of this fund as debt. Representatives of state regulated insurance companies should contact the NAIC’s
Securities Valuation Office for further information on the criteria for listing on the U.S. Direct Obligations/Full
Faith and Credit Exempt List (http://www.naic.org/prod_serv/MMF-ZS-17-06.pdf.0.29 0.31 0.33 0.33 0.31
0.370.46 0.48
0.540.64 0.67
0.80
0.00
0.20
0.40
0.60
0.80
1.00
7/16
8/16
9/16
10/1
6
11/1
6
12/1
6
1/17
2/17
3/17
4/17
5/17
6/17
Institutional | Government | Constant Net Asset Value
11
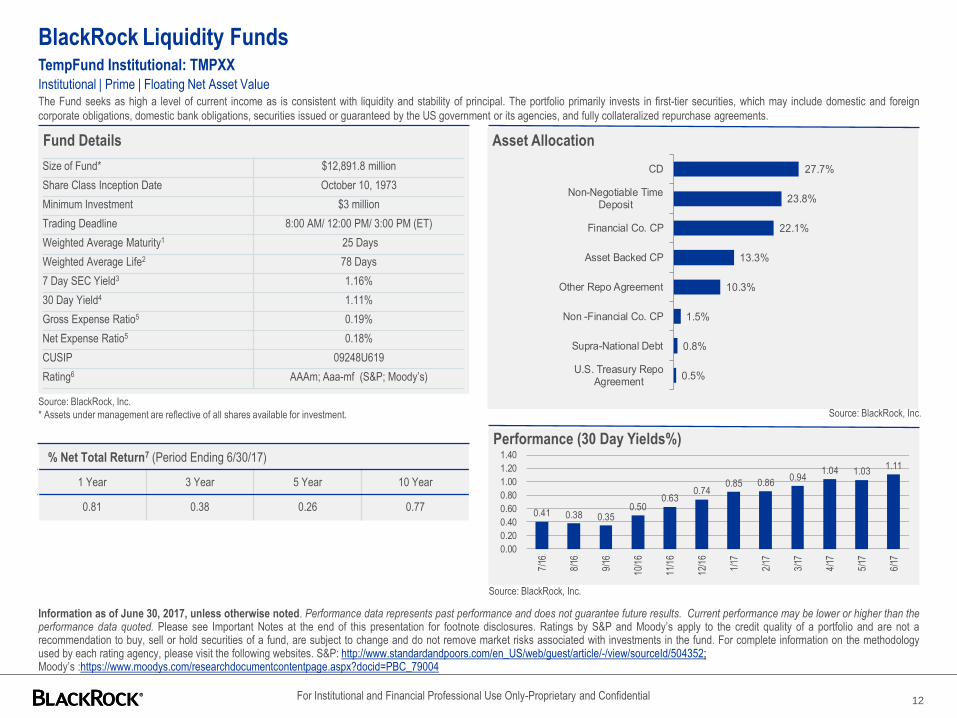
Performance (30 Day Yields%)
Fund Details
Size of Fund* $12,891.8 million
Share Class Inception Date October 10, 1973
Minimum Investment $3 million
Trading Deadline 8:00 AM/ 12:00 PM/ 3:00 PM (ET)
Weighted Average Maturity1 25 Days
Weighted Average Life2 78 Days
7 Day SEC Yield3 1.16%
30 Day Yield4 1.11%
Gross Expense Ratio5 0.19%
Net Expense Ratio5 0.18%
CUSIP 09248U619
Rating6 AAAm; Aaa-mf (S&P; Moody’s)
For Institutional and Financial Professional Use Only-Proprietary and Confidential
Information as of June 30, 2017, unless otherwise noted. Performance data represents past performance and does not guarantee future results. Current performance may be lower or higher than theperformance data quoted. Please see Important Notes at the end of this presentation for footnote disclosures. Ratings by S&P and Moody’s apply to the credit quality of a portfolio and are not arecommendation to buy, sell or hold securities of a fund, are subject to change and do not remove market risks associated with investments in the fund. For complete information on the methodologyused by each rating agency, please visit the following websites. S&P: http://www.standardandpoors.com/en_US/web/guest/article/-/view/sourceId/504352;Moody’s :https://www.moodys.com/researchdocumentcontentpage.aspx?docid=PBC_79004
BlackRock Liquidity Funds TempFund Institutional: TMPXX
The Fund seeks as high a level of current income as is consistent with liquidity and stability of principal. The portfolio primarily invests in first-tier securities, which may include domestic and foreign
corporate obligations, domestic bank obligations, securities issued or guaranteed by the US government or its agencies, and fully collateralized repurchase agreements.
0.41 0.38 0.350.50
0.630.74
0.85 0.860.94
1.04 1.031.11
0.00
0.20
0.40
0.60
0.80
1.00
1.20
1.40
7/16
8/16
9/16
10/1
6
11/1
6
12/1
6
1/17
2/17
3/17
4/17
5/17
6/17
Source: BlackRock, Inc.
Asset Allocation
Source: BlackRock, Inc.
* Assets under management are reflective of all shares available for investment.
27.7%
23.8%
22.1%
13.3%
10.3%
1.5%
0.8%
0.5%
CD
Non-Negotiable TimeDeposit
Financial Co. CP
Asset Backed CP
Other Repo Agreement
Non -Financial Co. CP
Supra-National Debt
U.S. Treasury RepoAgreement
Source: BlackRock, Inc.
% Net Total Return7 (Period Ending 6/30/17)
1 Year 3 Year 5 Year 10 Year
0.81 0.38 0.26 0.77
Institutional | Prime | Floating Net Asset Value
12

III. Short Duration at BlackRock
For use with institutional investors only — proprietary and confidential
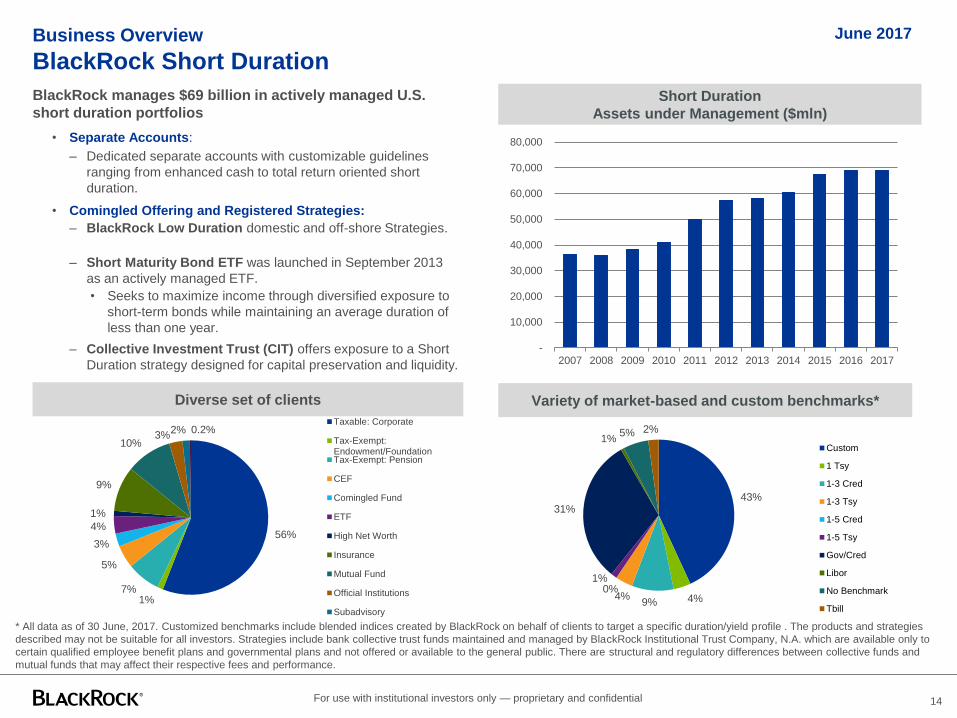
BlackRock manages $69 billion in actively managed U.S.
short duration portfolios
• Separate Accounts:
– Dedicated separate accounts with customizable guidelines
ranging from enhanced cash to total return oriented short
duration.
• Comingled Offering and Registered Strategies:
– BlackRock Low Duration domestic and off-shore Strategies.
– Short Maturity Bond ETF was launched in September 2013
as an actively managed ETF.
• Seeks to maximize income through diversified exposure to
short-term bonds while maintaining an average duration of
less than one year.
– Collective Investment Trust (CIT) offers exposure to a Short
Duration strategy designed for capital preservation and liquidity.
Business Overview
BlackRock Short Duration
* All data as of 30 June, 2017. Customized benchmarks include blended indices created by BlackRock on behalf of clients to target a specific duration/yield profile . The products and strategies
described may not be suitable for all investors. Strategies include bank collective trust funds maintained and managed by BlackRock Institutional Trust Company, N.A. which are available only to
certain qualified employee benefit plans and governmental plans and not offered or available to the general public. There are structural and regulatory differences between collective funds and
mutual funds that may affect their respective fees and performance.
Short Duration
Assets under Management ($mln)
June 2017
Variety of market-based and custom benchmarks*Diverse set of clients
14
-
10,000
20,000
30,000
40,000
50,000
60,000
70,000
80,000
2007 2008 2009 2010 2011 2012 2013 2014 2015 2016 2017
56%
1%7%
5%
3%
4%
1%
9%
10%3%
2% 0.2%Taxable: Corporate
Tax-Exempt:Endowment/FoundationTax-Exempt: Pension
CEF
Comingled Fund
ETF
High Net Worth
Insurance
Mutual Fund
Official Institutions
Subadvisory
43%
4%9%4%
0%1%
31%
1%5% 2%
Custom
1 Tsy
1-3 Cred
1-3 Tsy
1-5 Cred
1-5 Tsy
Gov/Cred
Libor
No Benchmark
Tbill
For use with institutional investors only — proprietary and confidential
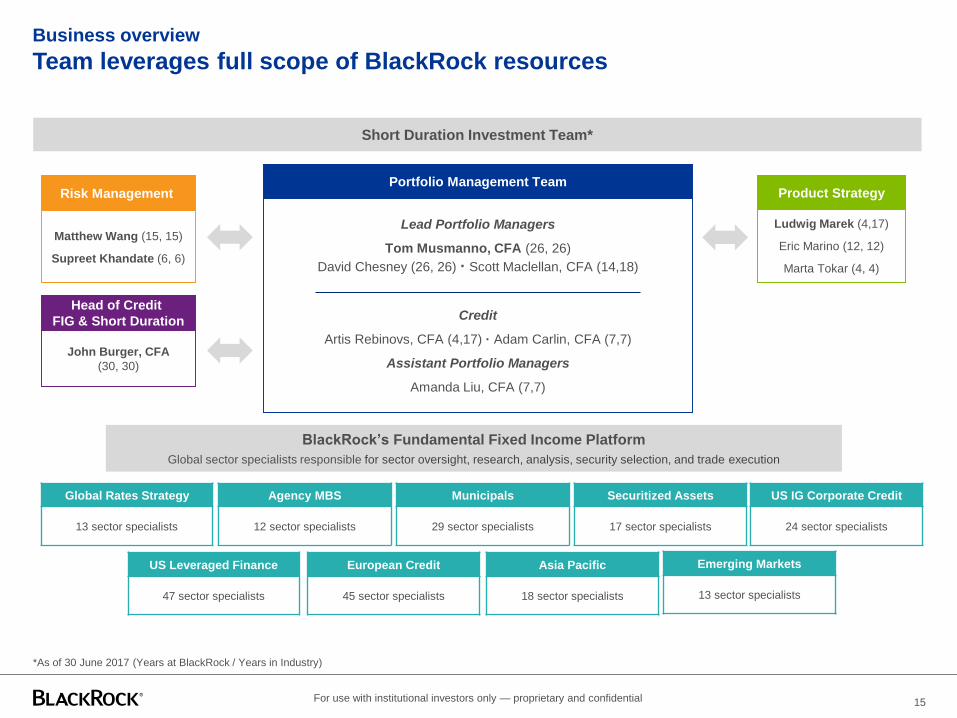
Business overview
Team leverages full scope of BlackRock resources
*As of 30 June 2017 (Years at BlackRock / Years in Industry)
Short Duration Investment Team*
Lead Portfolio Managers
Tom Musmanno, CFA (26, 26)
David Chesney (26, 26) · Scott Maclellan, CFA (14,18)
Credit
Artis Rebinovs, CFA (4,17) · Adam Carlin, CFA (7,7)
Assistant Portfolio Managers
Amanda Liu, CFA (7,7)
Portfolio Management TeamProduct Strategy
Ludwig Marek (4,17)
Eric Marino (12, 12)
Marta Tokar (4, 4)
Risk Management
Matthew Wang (15, 15)
Supreet Khandate (6, 6)
Head of Credit
FIG & Short Duration
John Burger, CFA
(30, 30)
BlackRock’s Fundamental Fixed Income Platform
Global sector specialists responsible for sector oversight, research, analysis, security selection, and trade execution
Securitized Assets
17 sector specialists
Municipals
29 sector specialists
US IG Corporate Credit
24 sector specialists
European Credit
45 sector specialists
Agency MBS
12 sector specialists
US Leveraged Finance
47 sector specialists
Emerging Markets
13 sector specialists
Asia Pacific
18 sector specialists
Global Rates Strategy
13 sector specialists
15

For use with institutional investors only — proprietary and confidential
Competitive advantages
With its flexible investment approach, the Short Duration team can seek the most attractive current market
opportunities at the short end of the curve across the fixed income spectrum
Dedicated portfolio team that leverages scale and resources of BlackRock
Global infrastructure fosters a culture of information sharing
Use scale to generate trading efficiencies, lowering transaction costs
Deep capital markets participation creates unique access to investment opportunities
Approach blends dynamic asset allocation with bottom-up portfolio construction
Portfolio durations are generally managed within a narrow band
Diversified portfolio provide both yield and total return advantages
Flexibility to invest in global opportunities on the short end of the yield curve
Multi-sector oriented portfolio provides diversification benefits
Portfolios may allocate to global sectors
Local expertise in global rates, corporate credit and securitized asset markets
Ability to harness opportunities in niche markets
Provides unique access to diverse investment opportunities:
Asian Credit - Small/Mid-cap Corporates
Aviation (sector) - European Securitized Assets
Partner with risk management to analyze risks and improve investment process
Seeks to ensure risks are deliberate, diversified, and appropriately scaled
Monitor developments and potential impact on positioning
Robust infrastructure and valuation procedures
Breadth and Depth
Efficient Alpha
Diversification
Niche Markets
Risk Management
16
For use with institutional investors only — proprietary and confidential
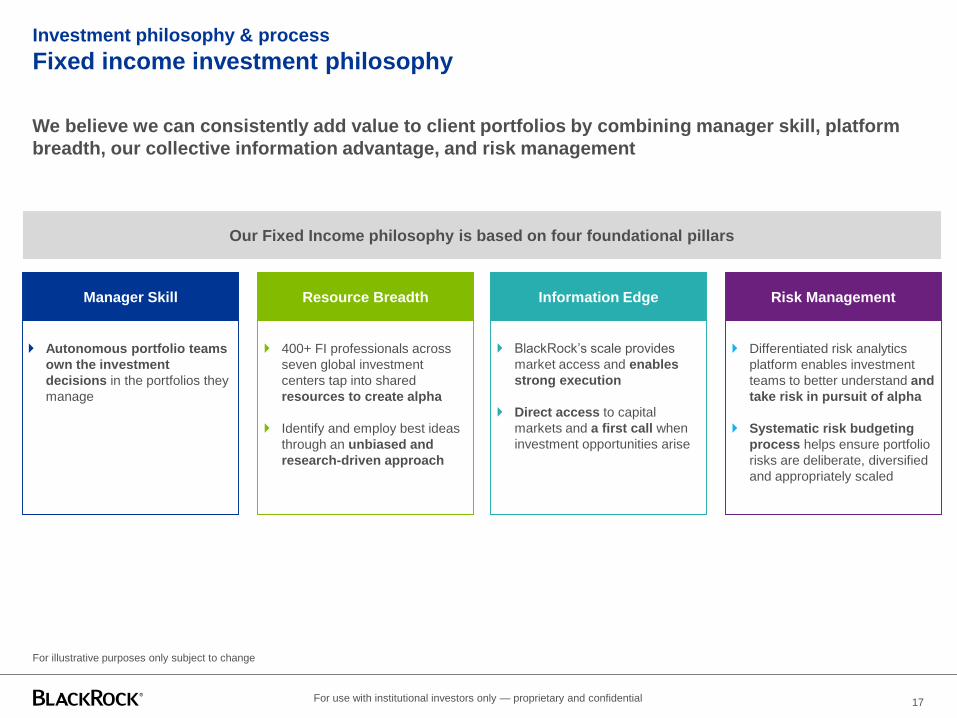
Investment philosophy & process
Fixed income investment philosophy
We believe we can consistently add value to client portfolios by combining manager skill, platform
breadth, our collective information advantage, and risk management
Resource Breadth
400+ FI professionals across
seven global investment
centers tap into shared
resources to create alpha
Identify and employ best ideas
through an unbiased and
research-driven approach
Manager Skill
Autonomous portfolio teams
own the investment
decisions in the portfolios they
manage
Information Edge
BlackRock’s scale provides
market access and enables
strong execution
Direct access to capital
markets and a first call when
investment opportunities arise
Risk Management
Differentiated risk analytics
platform enables investment
teams to better understand and
take risk in pursuit of alpha
Systematic risk budgeting
process helps ensure portfolio
risks are deliberate, diversified
and appropriately scaled
Our Fixed Income philosophy is based on four foundational pillars
For illustrative purposes only subject to change
17

For use with institutional investors only — proprietary and confidential
1-3yr Agy
0.5%
1-3yr Tsy
0.9%
1-5yr
Corporate
2.9%
Investment philosophy & process
The return potential from active sector rotation is significant…
Significant performance dispersion among fixed income sectors has always existed
In 2008 and 2009 we saw historically high dispersion of returns – 2008 losers became 2009 winners
Increasing dispersion in spread sectors makes active sector rotation important
Calendar Year Fixed Income Total Returns by Sector
*Note: MBS 15 Year Index has an inception date of 04/01/03
Source: Barclays; 31 December 2015. Past performance is no guarantee of future results. You cannot invest directly in an index. For illustrative purposes only. Not to be construed as investment advice
2000 2001 2002 2003 2004 2005 2006 2007 2008 2009 2010 2011 2012 2013 2014 2015 2016
ABS
10.8%
1-3yr
Credit
7.8%
1-3.5yr
CMBS
10.3%
1-3yr Tsy
8.4% 1-3yr Tsy
5.9%
1-5yr
Corporate
6.0%
1-3yr Tsy
1.9%
15yr MBS
4.2%
1-3yr Tsy
0.9%
1-3.5yr
CMBS
2.2%
1-5yr
Corporate
1.3%
1-5yr
Corporate
4.8%
1-3yr Tsy
3.9% ABS
2.2%
15yr MBS
8.5%
ABS
(12.7%)
Range of return
dispersion: 1–6%
Range of return
dispersion: 21–24%
ABS
24.7%
1-3yr Tsy
0.8%
Range of return
dispersion: 1–6%
1-3.5yr
CMBS
9.2%
1-3yr Agy
2.4%
ABS
5.1%
1-3yr Agy
1.5%
1-5yr
Corporate
6.2%
1-3yr Tsy
0.4%
1-3.5yr
CMBS
8.7%15yr MBS
7.3% 1-3yr
Corporate
1.7%
15yr MBS
(0.9%)
1-3yr TSY
0.6%
15yr MBS
4.1% 15yr MBS
1.3%
18

For use with institutional investors only — proprietary and confidential 19
Investment philosophy & process
BlackRock platform promotes idea sharing across multiple forums
CIO-led forums provide the structure for idea sharing
• Disciplined, structured process forms the basis for consistently diversified investment decisions
Frequency Forum Content
Daily
Morning MeetingPortfolio teams and sector specialists provide overnight market recap and discuss positioning
as well as risk events
Global Meeting Global portfolio teams and risk professionals provide multi-asset market recap
Positioning MeetingRisk team leads discussion of risk, positioning and performance as
Sector specialists update lead portfolio managers on changing views or positioning
Weekly
Macro Speaker SeriesExternal macro speaker addresses market views, prompting open dialog with BlackRock
investment professionals
Portfolio Strategy Lead portfolio managers review, discuss and debate top-down themes as well as risk posture
Sector Deep Dive Weekly rotation of sector specialists to provide in-depth fixed income sector insights
Investment StrategyCIO-led platform-wide discussion, focusing on bottom-up insights, themes, and trade ideas
from sector specialist teams
MonthlyCIO Monthly Markets
Call
Rick Rieder provides medium term horizon outlook and ongoing research designed to identify
the existing investment regime - open to clients
Low Duration investment team incorporates insights in to decision-making and portfolio construction process

IV. Market Review

For use with institutional investors only — proprietary and confidential
Macro Overview
• Federal Reserve: As widely expected, the Fed held policy rates steady at its July monetary policy meeting. This biggest change in the released
statement was moving the timeline of the intended implementation to the changes of its reinvestment policy from “this year” to “relatively soon.” In
addition, it acknowledged the recent weakness in inflation, relative to the 2% target, while mentioning the continued strength in labor markets.
• US Economy: June macro data showed a continued gradual path of economic recovery, albeit at a much slower pace than expected. Preliminary Q2
GDP saw the US economy accelerating to 2.6% annualized, which is close to market estimates of 2.7% and follows Q1 growth of 1.2%. The main
drivers of the pick up in growth were consumer spending business fixed investment, while residential expenditures were the biggest detractor.
• Global Rates: The Bank of Canada introduced a 25 bps rate hike in July, becoming the first G10 central bank to follow the Fed, and the market has
priced in a 75% chance of another 25bps hike in October. The European Central Bank President Draghi was dovish, keeping the quantitative easing
bias untouched, citing a lack of sustained improvement in inflation; the Bank of Japan also holds pat. Core inflation in the Eurozone is running at 1.1%
vs. the targeted 2%, yet its unemployment rate falls to lowest since Feb 2009.
• Corporate Earnings: Industrials saw 90% of companies having beaten earnings. Yet, 70% are trading down after the announcement (-2% on
average), driven by unfavorable comps due to the bottoming of the industrial recession and unfavorable input costs. The tech sector has shown the
strongest earnings growth with EPS for the sector rising over 20% YoY, and consumer discretionary is the only sector showing a YoY earnings
decline (-2.7%).
Continued soft inflation data were among the main drivers which
led to lower market expectations for a rate hike in September
July 2017
Source: Thompson Reuters. Report as of 27 July, 2017.
The last two quarters of released earnings surprises beat the 5-
year average of 55% of reporting companies
Source: FactSet. Report as of 28 July, 2017
21
See appendix for information on economic data sources
41%
65%
47%
54%52%
62%
53%
65%
59%58%
46%51%
45%47%
53%53%55%
53%
65%
73%
0%
10%
20%
30%
40%
50%
60%
70%
80%
S&P 500: Positive Sales Surprise (% of Companies)
For use with institutional investors only — proprietary and confidential
Federal Open Market Committee (FOMC)
Fed pushes up timeline of normalization program; odds drop for Sept rate hike
With maturity distribution of Fed-held Treasuries skewed to the
longer end, investors will monitor the longer end of the curve
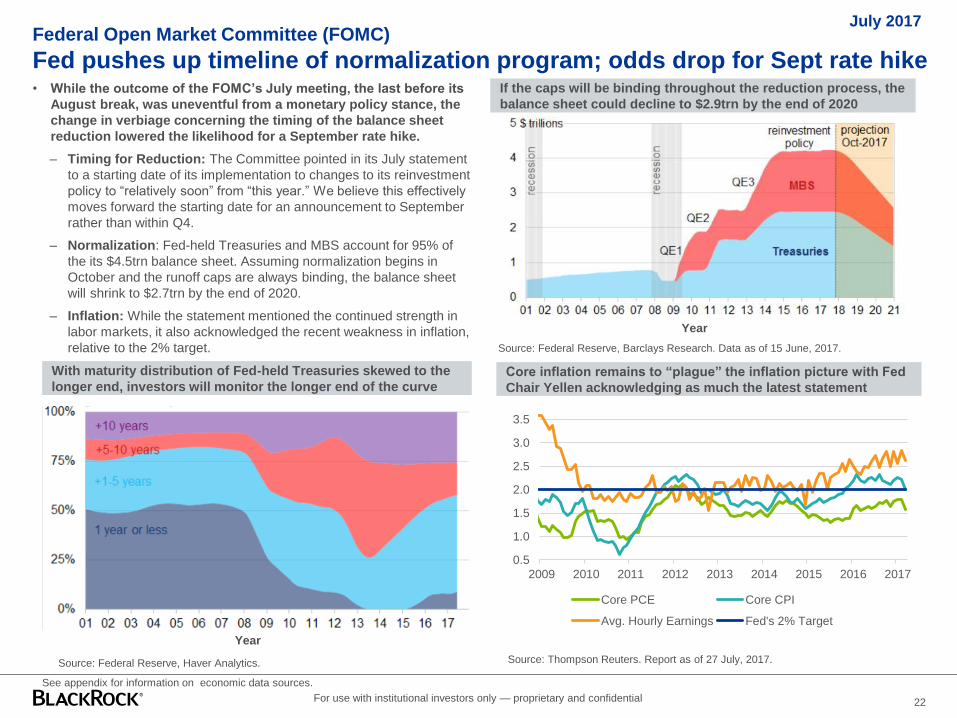
• While the outcome of the FOMC’s July meeting, the last before its
August break, was uneventful from a monetary policy stance, the
change in verbiage concerning the timing of the balance sheet
reduction lowered the likelihood for a September rate hike.
– Timing for Reduction: The Committee pointed in its July statement
to a starting date of its implementation to changes to its reinvestment
policy to “relatively soon” from “this year.” We believe this effectively
moves forward the starting date for an announcement to September
rather than within Q4.
– Normalization: Fed-held Treasuries and MBS account for 95% of
the its $4.5trn balance sheet. Assuming normalization begins in
October and the runoff caps are always binding, the balance sheet
will shrink to $2.7trn by the end of 2020.
– Inflation: While the statement mentioned the continued strength in
labor markets, it also acknowledged the recent weakness in inflation,
relative to the 2% target.
July 2017
If the caps will be binding throughout the reduction process, the
balance sheet could decline to $2.9trn by the end of 2020
Core inflation remains to “plague” the inflation picture with Fed
Chair Yellen acknowledging as much the latest statement
Source: Thompson Reuters. Report as of 27 July, 2017.
22
Source: Federal Reserve, Barclays Research. Data as of 15 June, 2017.
See appendix for information on economic data sources.
Source: Federal Reserve, Haver Analytics.
Year
0.5
1.0
1.5
2.0
2.5
3.0
3.5
2009 2010 2011 2012 2013 2014 2015 2016 2017
Core PCE Core CPI
Avg. Hourly Earnings Fed's 2% Target
Year

For use with institutional investors only — proprietary and confidential
US Economy
Q2 GDP report shows robust economic growth, though inflation remains at large
While the June Durable Goods Orders jumped 6.5% because of
the volatile aircraft category, recent data shows an upward trend
• The preliminary GDP report for Q2 showed a US economy that
continued to be supported by household consumption and
business spending bringing the annualize growth rate to 2.6%, a
lever of quarterly growth not seen since Q3 2016 with 2.7%.
– Growth was supported by private consumption, which rose 2.8%,
and by nonresidential fixed investment, which added 0.6%. The
rebound in activity was less than many expected as some
economists forecasted growth in the 3% region.
– Net trade also contributed to Q2 growth, for the second consecutive
quarter, as economic activity outside the US combined with decline
of USD since year-end boosted exports.
– Despite the good news, structural challenges within the retail sector
and particularly auto sales remain. Retail sales fell 0.2% in June with
the key control measure (ex-autos, gasoline and building materials)
falling 0.1% versus expectations for a 0.3% gain.
– Inflation also continued to be soft, as June core inflation only rose
0.1%, making this the weakest 4-month stretch in at least 60 years.
Source: BlackRock.* Data as of 30 November 2016.
July 2017
Preliminary Q2 GDP data showed a strong showing from net
trade (Exports) and personal consumption (PCE)
After a third straight rise in core inflation by 0.1% after a rare
0.1% drop in March, in 2017
23
Source: BEA, Haver Analytics, Barclays Research. Report as of 28 July, 2017.
See appendix for information on economic data sources. The BlackRock Economic Surprise index is defined as the weighted historical standard deviations of data surprises (actual
releases vs Bloomberg survey median). The weighting and relative importance of each economic data release is determined by BlackRock and is subjective.
% Q
oQ
SA
AR
Source: BLS, Haver Analytics. Report as of 28 July, 2017.Source: Census Bureau, JP Morgan. Report as of 16 June, 2017.
For use with institutional investors only — proprietary and confidential
Source: Bloomberg. Data as of 31 July, 2017
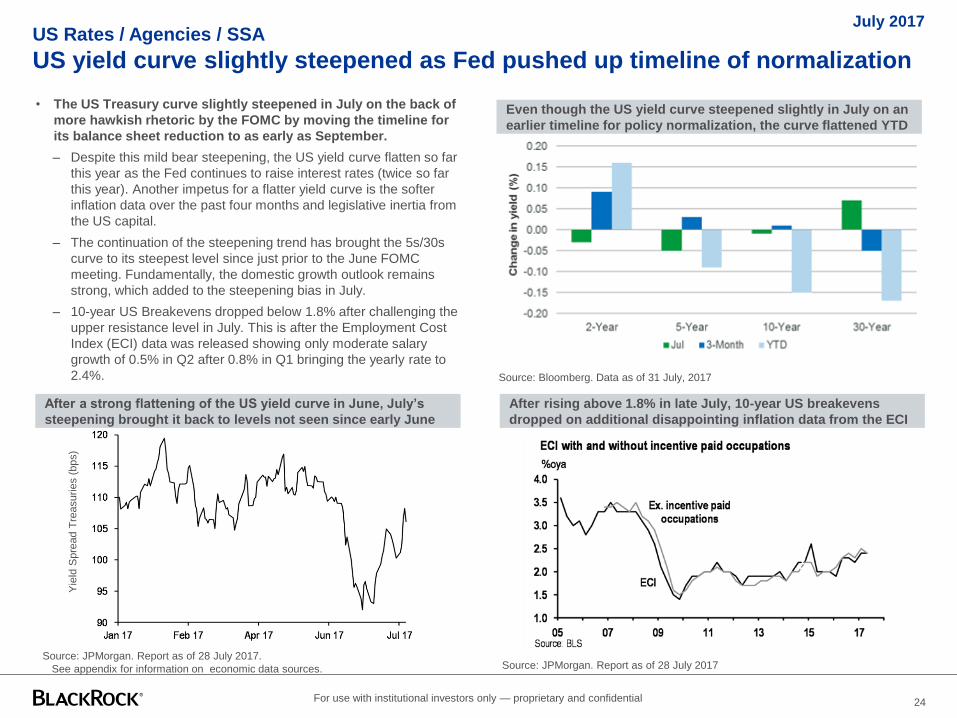
Even though the US yield curve steepened slightly in July on an
earlier timeline for policy normalization, the curve flattened YTD
US Rates / Agencies / SSA
US yield curve slightly steepened as Fed pushed up timeline of normalization
Source: JPMorgan. Report as of 28 July 2017.
After a strong flattening of the US yield curve in June, July’s
steepening brought it back to levels not seen since early June
July 2017
• The US Treasury curve slightly steepened in July on the back of
more hawkish rhetoric by the FOMC by moving the timeline for
its balance sheet reduction to as early as September.
– Despite this mild bear steepening, the US yield curve flatten so far
this year as the Fed continues to raise interest rates (twice so far
this year). Another impetus for a flatter yield curve is the softer
inflation data over the past four months and legislative inertia from
the US capital.
– The continuation of the steepening trend has brought the 5s/30s
curve to its steepest level since just prior to the June FOMC
meeting. Fundamentally, the domestic growth outlook remains
strong, which added to the steepening bias in July.
– 10-year US Breakevens dropped below 1.8% after challenging the
upper resistance level in July. This is after the Employment Cost
Index (ECI) data was released showing only moderate salary
growth of 0.5% in Q2 after 0.8% in Q1 bringing the yearly rate to
2.4%.
Source: JPMorgan. Report as of 28 July 2017
24
See appendix for information on economic data sources.
Yie
ld S
pre
ad T
reasurie
s (
bps)
After rising above 1.8% in late July, 10-year US breakevens
dropped on additional disappointing inflation data from the ECI
For use with institutional investors only — proprietary and confidential
Strong quarterly earnings and positive economic environment
led to further spread tightening in front end credit
Corporate Credit
Strong Q2 earnings and a benign economic picture led to tighter spreads
July 2017
Source: Barclays Research. Data as of 31 July 2017. Past performance is not a guarantee of
futures results. Index performance is for illustrative purposes only. It is not possible to invest
directly in an index. *Duration adjusted excess returns provided by Barclays. See appendix for
on economic data sources. Issuance data sourced from the BlackRock capital markets group.
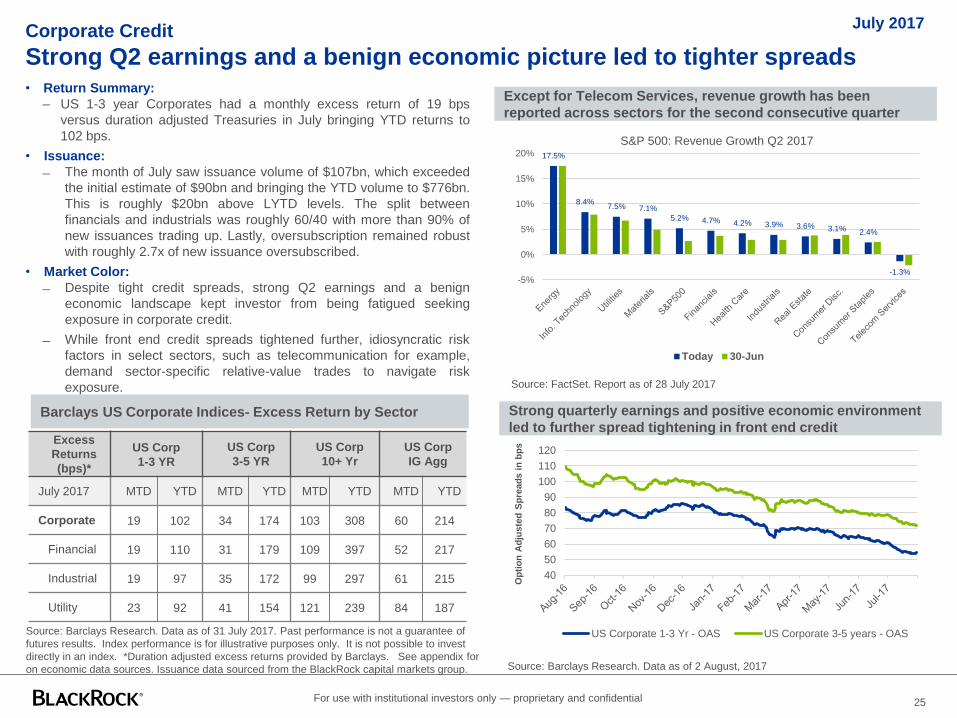
• Return Summary:
– US 1-3 year Corporates had a monthly excess return of 19 bps
versus duration adjusted Treasuries in July bringing YTD returns to
102 bps.
• Issuance:
The month of July saw issuance volume of $107bn, which exceeded
the initial estimate of $90bn and bringing the YTD volume to $776bn.
This is roughly $20bn above LYTD levels. The split between
financials and industrials was roughly 60/40 with more than 90% of
new issuances trading up. Lastly, oversubscription remained robust
with roughly 2.7x of new issuance oversubscribed.
• Market Color:
Despite tight credit spreads, strong Q2 earnings and a benign
economic landscape kept investor from being fatigued seeking
exposure in corporate credit.
While front end credit spreads tightened further, idiosyncratic risk
factors in select sectors, such as telecommunication for example,
demand sector-specific relative-value trades to navigate risk
exposure.
Except for Telecom Services, revenue growth has been
reported across sectors for the second consecutive quarter
Source: FactSet. Report as of 28 July 2017
Barclays US Corporate Indices- Excess Return by Sector
Source: Barclays Research. Data as of 2 August, 2017
25
Op
tio
n A
dju
ste
d S
pre
ad
s i
n b
ps
17.5%
8.4%7.5% 7.1%
5.2% 4.7% 4.2% 3.9% 3.6% 3.1% 2.4%
-1.3%-5%
0%
5%
10%
15%
20%
S&P 500: Revenue Growth Q2 2017
Today 30-Jun
Excess
Returns
(bps)*
US Corp
1-3 YR
US Corp
3-5 YR
US Corp
10+ Yr
US Corp
IG Agg
July 2017 MTD YTD MTD YTD MTD YTD MTD YTD
Corporate 19 102 34 174 103 308 60 214
Financial 19 110 31 179 109 397 52 217
Industrial 19 97 35 172 99 297 61 215
Utility 23 92 41 154 121 239 84 187
40
50
60
70
80
90
100
110
120
US Corporate 1-3 Yr - OAS US Corporate 3-5 years - OAS
For use with institutional investors only — proprietary and confidential
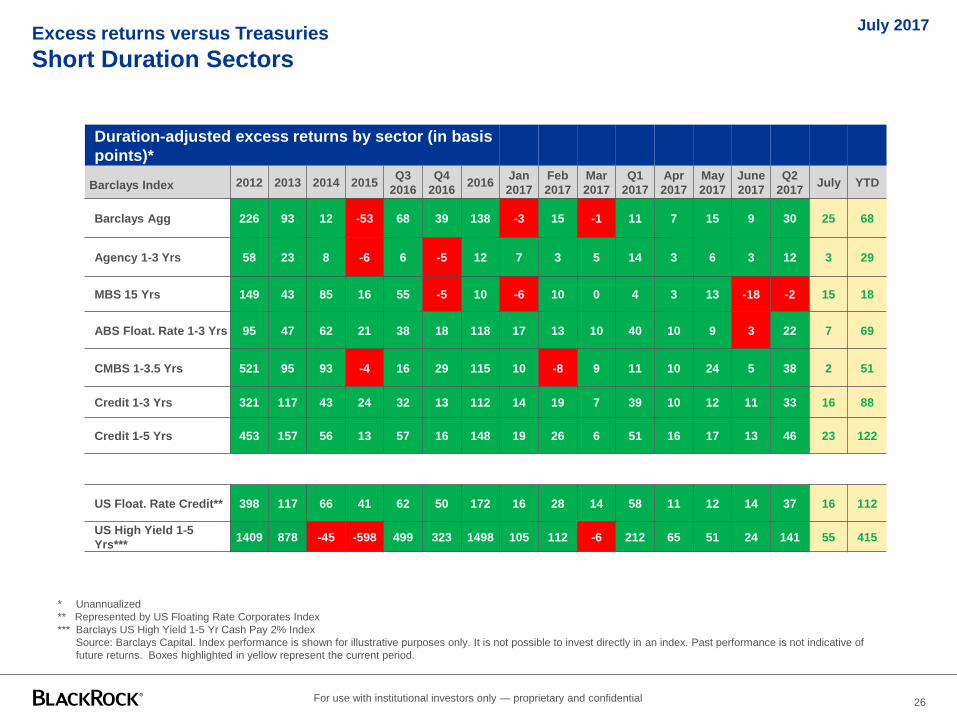
Excess returns versus Treasuries
Short Duration Sectors
* Unannualized
** Represented by US Floating Rate Corporates Index
*** Barclays US High Yield 1-5 Yr Cash Pay 2% Index
Source: Barclays Capital. Index performance is shown for illustrative purposes only. It is not possible to invest directly in an index. Past performance is not indicative of
future returns. Boxes highlighted in yellow represent the current period.
July 2017
Duration-adjusted excess returns by sector (in basis
points)*
Barclays Index 2012 2013 2014 2015Q3
2016
Q4
20162016
Jan
2017
Feb
2017
Mar
2017
Q1
2017
Apr
2017
May
2017
June
2017
Q2
2017July YTD
Barclays Agg 226 93 12 -53 68 39 138 -3 15 -1 11 7 15 9 30 25 68
Agency 1-3 Yrs 58 23 8 -6 6 -5 12 7 3 5 14 3 6 3 12 3 29
MBS 15 Yrs 149 43 85 16 55 -5 10 -6 10 0 4 3 13 -18 -2 15 18
ABS Float. Rate 1-3 Yrs 95 47 62 21 38 18 118 17 13 10 40 10 9 3 22 7 69
CMBS 1-3.5 Yrs 521 95 93 -4 16 29 115 10 -8 9 11 10 24 5 38 2 51
Credit 1-3 Yrs 321 117 43 24 32 13 112 14 19 7 39 10 12 11 33 16 88
Credit 1-5 Yrs 453 157 56 13 57 16 148 19 26 6 51 16 17 13 46 23 122
50
US Float. Rate Credit** 398 117 66 41 62 50 172 16 28 14 58 11 12 14 37 16 112
US High Yield 1-5
Yrs***1409 878 -45 -598 499 323 1498 105 112 -6 212 65 51 24 141 55 415
26
For use with institutional investors only — proprietary and confidential
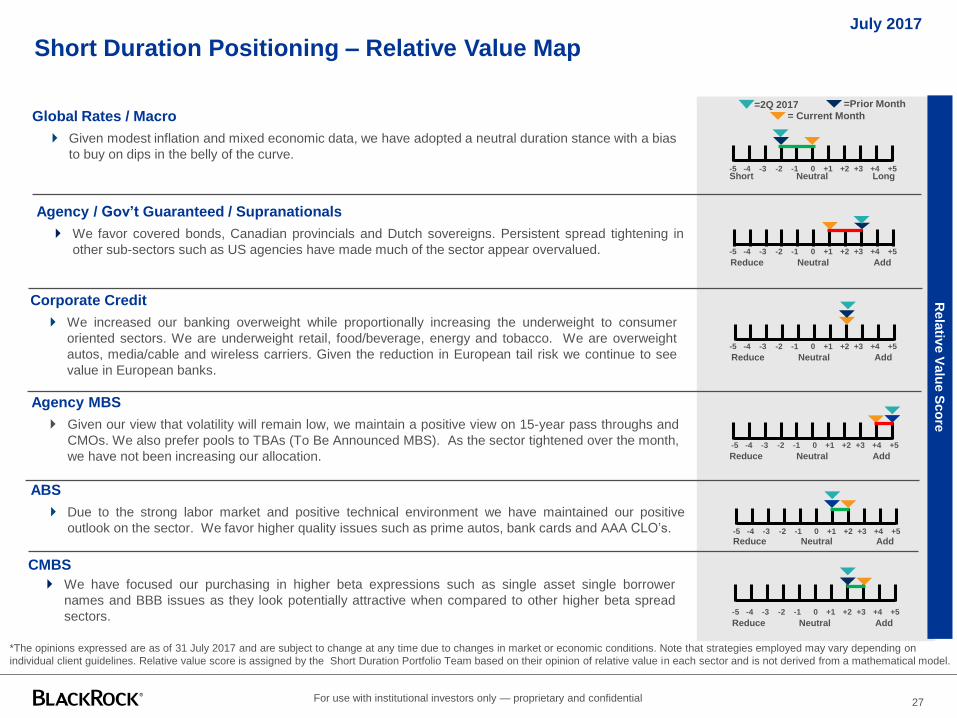
Short Duration Positioning – Relative Value MapJuly 2017
Corporate Credit
We increased our banking overweight while proportionally increasing the underweight to consumer
oriented sectors. We are underweight retail, food/beverage, energy and tobacco. We are overweight
autos, media/cable and wireless carriers. Given the reduction in European tail risk we continue to see
value in European banks.
CMBS
We have focused our purchasing in higher beta expressions such as single asset single borrower
names and BBB issues as they look potentially attractive when compared to other higher beta spread
sectors.
ABS
Due to the strong labor market and positive technical environment we have maintained our positive
outlook on the sector. We favor higher quality issues such as prime autos, bank cards and AAA CLO’s.
Global Rates / Macro
Given modest inflation and mixed economic data, we have adopted a neutral duration stance with a bias
to buy on dips in the belly of the curve.
Agency MBS
Given our view that volatility will remain low, we maintain a positive view on 15-year pass throughs and
CMOs. We also prefer pools to TBAs (To Be Announced MBS). As the sector tightened over the month,
we have not been increasing our allocation.
Agency / Gov’t Guaranteed / Supranationals
We favor covered bonds, Canadian provincials and Dutch sovereigns. Persistent spread tightening in
other sub-sectors such as US agencies have made much of the sector appear overvalued.
Rela
tive V
alu
e S
co
re
*The opinions expressed are as of 31 July 2017 and are subject to change at any time due to changes in market or economic conditions. Note that strategies employed may vary depending on
individual client guidelines. Relative value score is assigned by the Short Duration Portfolio Team based on their opinion of relative value in each sector and is not derived from a mathematical model.
= Current Month
=Prior Month
Short LongNeutral-4 -3 -2 -1 0 +1 +2 +3 +4 +5-5
Reduce AddNeutral
-4 -3 -2 -1 0 +1 +2 +3 +4 +5-5
Reduce AddNeutral
-4 -3 -2 -1 0 +1 +2 +3 +4 +5-5
Reduce AddNeutral
-4 -3 -2 -1 0 +1 +2 +3 +4 +5-5
Reduce AddNeutral-4 -3 -2 -1 0 +1 +2 +3 +4 +5-5
Reduce AddNeutral
-4 -3 -2 -1 0 +1 +2 +3 +4 +5-5
=2Q 2017
27

V. CalTRUST Short Duration Portfolios

For use with institutional investors only — proprietary and confidential 29
Credit Quality (% NAV) Sector Allocation Changes (%NAV)
Portfolio duration vs. benchmark (Years) Portfolio characteristics
CalTRUST Short Term Bond Fund
Portfolio Composition
36%
25%
7%
30%
2% GOVT
AAA
AA
A
BBB
Portfolio Benchmark Difference
Effective Duration (yrs.) 0.51 0.52 -0.01
Spread Duration 0.72 0.18 0.54
Convexity -0.02 0.00 -0.02
Yield (%) 1.34 1.28 0.06
Avg Credit Qual (Mdy/S&P) Aa2/AA- Aa1/AA -
Floating Rate Bonds (%) 24
Source: BlackRock
July 31, 2017
0.40
0.42
0.44
0.46
0.48
0.50
0.52
0.54
0.56
5-Jul-17 12-Jul-17 19-Jul-17 26-Jul-17
CalTrust Short Term Bond Fund
BBG Barclays Short Term Gov't/Corp. Index
20%
16%
9%
14%
0.1%
20%
8%
1% 1%
11%
15% 15%
7%
14%
0.1%
21%
8%
1%2%
17%
0%
5%
10%
15%
20%
25%
7/6/2017 7/31/2017

For use with institutional investors only — proprietary and confidential 30
14%
6%
0%
11%
42%
14%
0%3%
10%
0%
5%
10%
15%
20%
25%
30%
35%
40%
45%
7/31/2017
CalTRUST Short Term Bond FundPositioning
Effective Duration and WAL Breakdown (% NAV)
75%
19%
5%1%
92%
8%
0% 0%0%
10%
20%
30%
40%
50%
60%
70%
80%
90%
100%
<1 1-3 2-3 3-5
WAL %NAV Duration %NAV
Spread Duration (% NAV)
Source: BlackRock
-0.05-0.04
0.07
-0.08
-0.06
-0.04
-0.02
0.00
0.02
0.04
0.06
0.08
3M 1Yr 2Yr
Active Portfolio Yield Curve Positioning (years)
July 31, 2017

For use with institutional investors only — proprietary and confidential 31
Credit Quality (% NAV) Sector Allocation Changes (%NAV)
Portfolio duration vs. benchmark (Years) Portfolio characteristics
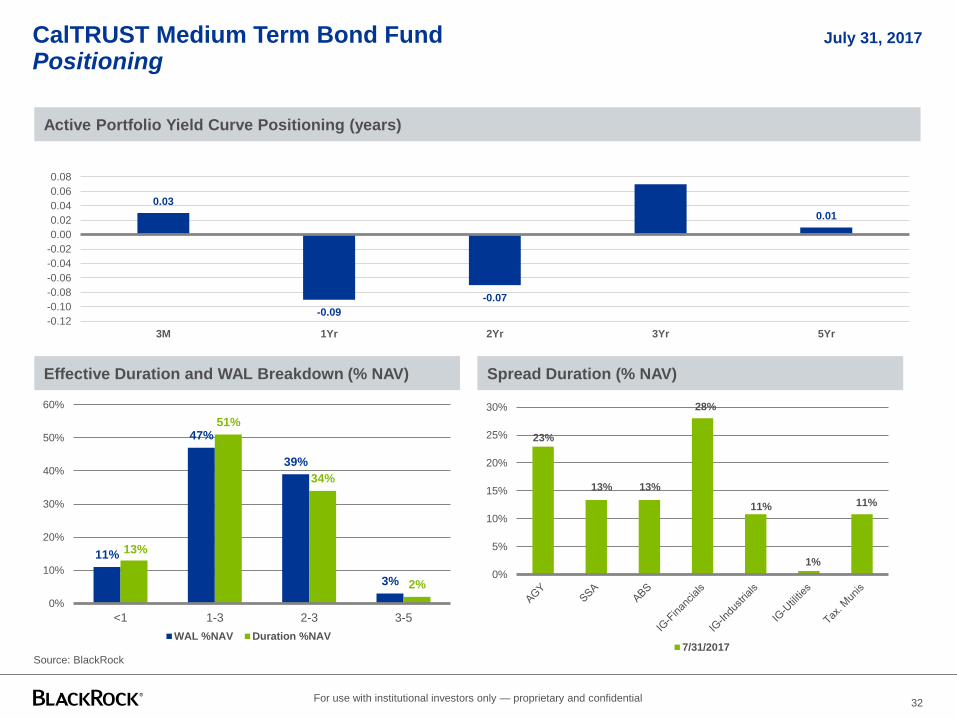
CalTRUST Medium Term Bond Fund
Portfolio Composition
32%
28%
14%
23%
3% GOVT
AAA
AA
A
BBB
Portfolio Benchmark Difference
Effective Duration (yrs.) 1.84 1.89 -0.05
Spread Duration 1.57 0.61 0.96
Convexity 0.04 0.03 0.01
Yield (%) 1.57 1.47 0.10
Avg Credit Qual (Mdy/S&P) Aa2/AA Aa1/AA -
Floating Rate Bonds (%) 1
Source: BlackRock
July 31, 2017
1.60
1.65
1.70
1.75
1.80
1.85
1.90
1.95
5-Jul-17 12-Jul-17 19-Jul-17 26-Jul-17
CalTRUST Medium Term Bond Fund
BofA ML Gov't/Corp 1-3 YR Ex. BBB Index
16%
25%
8%
13%
20%
8%
0.4%
9%
1%
14%
18%
10%
17%
22%
7%
0.4%
12%
0%0%
5%
10%
15%
20%
25%
30%
7/6/2017 7/31/2017
For use with institutional investors only — proprietary and confidential 32
23%
13% 13%
28%
11%
1%
11%
0%
5%
10%
15%
20%
25%
30%
7/31/2017
CalTRUST Medium Term Bond FundPositioning
Effective Duration and WAL Breakdown (% NAV)
11%
47%
39%
3%
13%
51%
34%
2%
0%
10%
20%
30%
40%
50%
60%
<1 1-3 2-3 3-5
WAL %NAV Duration %NAV
Spread Duration (% NAV)
Source: BlackRock
0.03
-0.09
-0.07
0.01
-0.12
-0.10
-0.08
-0.06
-0.04
-0.02
0.00
0.02
0.04
0.06
0.08
3M 1Yr 2Yr 3Yr 5Yr
Active Portfolio Yield Curve Positioning (years)
July 31, 2017

Appendix

For use with institutional investors only — proprietary and confidential
Thomas Musmanno, CFA, Managing Director, is Head of Short Duration within the Multi-Sector Institutional division of Americas Fixed
Income Alpha Strategies.
Mr. Musmanno's service with the firm dates back to 1991, including his years with Merrill Lynch Investment Managers (MLIM), which merged
with BlackRock in 2006. At MLIM, he was a fixed income and money market portfolio manager. Mr. Musmanno joined MLIM in 1991 as an
analyst and held a variety of positions, including fixed income research analyst in trust accounting in Merrill Lynch's Private Client Group.
Mr. Musmanno earned a BS degree in finance in 1991 from Siena College and an MBA degree in finance from St. John's University in 1993.
Joseph Markowski, Director and portfolio manager, is a member of BlackRock's Cash Management Group.
He is responsible for managing government and treasury money market portfolios. Prior to moving to his current role in 2008, Mr. Markowski
was a member of BlackRock's Fixed Income Portfolio Management Group. In this role, he was responsible for financing the firm's leveraged
funds and alternative products. Mr. Markowski joined BlackRock in 1993 as a member of the Global Client Group, where he was responsible
for marketing and sales support for the firm's institutional liquidity business.
Mr. Markowski earned a BS degree in finance from Drexel University in 1994.
Biographies of key investment professionals
34

For use with institutional investors only — proprietary and confidential 35
This material is for distribution only to those types of recipients as provided below and should not be relied upon by any other persons. This material is provided for
informational purposes only and does not constitute a solicitation in any jurisdiction in which such solicitation is unlawful or to any person to whom it is unlawful.
Moreover, it neither constitutes an offer to enter into an investment agreement with the recipient of this document nor an invitation to respond to it by making an offer to
enter into an investment agreement.
This material may contain “forward-looking” information that is not purely historical in nature. Such information may include, among other things, projections, forecasts,
estimates of yields or returns, and proposed or expected portfolio composition. Moreover, where certain historical performance information of other investment vehicles
or composite accounts managed by BlackRock, Inc. and/or its subsidiaries (together, “BlackRock”) has been included in this ma terial and such performance information
is presented by way of example only. No representation is made that the performance presented will be achieved, or that every assumption made in achieving,
calculating or presenting either the forward-looking information or the historical performance information herein has been considered or stated in preparing this material.
Any changes to assumptions that may have been made in preparing this material could have a material impact on the investment returns that are presented herein by
way of example.
This material is not intended to be relied upon as a forecast, research or investment advice, and is not a recommendation, offer or solicitation to buy or sell any securities
or to adopt any investment strategy. The opinions expressed are as of March 2017 and may change as subsequent conditions vary. The information and opinions
contained in this material are derived from proprietary and nonproprietary sources deemed by BlackRock to be reliable, are not necessarily all-inclusive and are not
guaranteed as to accuracy. There is no guarantee that any forecasts made will come to pass. Any investments named within this material may not necessarily be held in
any accounts managed by BlackRock. Reliance upon information in this material is at the sole discretion of the reader. Past performance is no guarantee of future
results.
In the US this material is for institutional investors only.
Past performance is not a guide to future performance. The value of investments and the income from them can fall as well as rise and is not guaranteed. You may not
get back the amount originally invested. Changes in the rates of exchange between currencies may cause the value of investments to diminish or increase. Fluctuation
may be particularly marked in the case of a higher volatility fund and the value of an investment may fall suddenly and substantially. Levels and basis of taxation may
change from time to time.
Any research in this document has been procured and may have been acted on by BlackRock for its own purpose. The results of such research are being made
available only incidentally. The views expressed do not constitute investment or any other advice and are subject to change. They do not necessarily reflect the views of
any company in the BlackRock Group or any part thereof and no assurances are made as to their accuracy.
This document is for information purposes only and does not constitute an offer or invitation to anyone to invest in any BlackRock funds and has not been prepared in
connection with any such offer.
This document contains general information only and is not intended to represent general or specific investment advice. The information does not take into account your
financial circumstances. An assessment should be made as to whether the information is appropriate for you having regard to your objectives, financial situation and
needs.
THIS MATERIAL IS HIGHLY CONFIDENTIAL AND IS NOT TO BE REPRODUCED OR DISTRIBUTED TO PERSONS OTHER THAN THE RECIPIENT.
© 2017 BlackRock, Inc. All Rights reserved. BLACKROCK, BLACKROCK SOLUTIONS, iSHARES, BUILD ON BLACKROCK, SO WHAT DO I DO WITH MY MONEY
and the stylized i logo are registered and unregistered trademarks of BlackRock, Inc. or its subsidiaries in the United States and elsewhere. All other trademarks are
those of their respective owners.
Important Notes

Important Notes- BlackRock Liquidity Funds
Footnotes
You should consider the investment objectives, risks and expenses of the Funds carefully before investing. The Funds’ prospectuses and, if available summary prospectuses, contain thisand other information about the Funds and are available by calling our Client Service Center at 800-441-7450 or by visiting www.blackrock.com/cash. Please read the prospectus carefullybefore investing.
1 Dollar-Weighted Average Maturity - the average maturity of a fund is the average amount of time until the organizations that issued the debt securities in the fund’s portfolio must pay off the principal
amount of the debt. “Dollar-weighted” means the larger the dollar value of a debt security in the fund, the more weight it gets in calculating this average. To calculate the dollar-weighted average maturity,
the fund may treat a variable or floating rate security as having a maturity equal to the time remaining to the security’s next interest rate reset date rather than the security’s actual maturity. 2 Dollar-
Weighted Average Life - the dollar-weighted average maturity of a fund’s portfolio calculated without reference to the exceptions used for variable or floating rate securities regarding the use of the
interest rate reset dates in lieu of the security’s actual maturity date. “Dollar-weighted” means the larger the dollar value of a debt security in the fund, the more weight it gets in calculating this average.3 7-Day SEC Yield: The 7-Day yield is computed in accordance with methods prescribed by the SEC .The 7-Day SEC yield excludes distributed capital gains/losses. 4 Average annualized 30-day yields
are based on net investment income and distributed gains or losses for the period shown. Yields will fluctuate as market conditions change. 5 Expenses are as of the most current prospectus. Investment
dividend expense, interest expense, acquired fund fees and expenses and certain other fund expenses are included in the Net, Including Investment Related expenses and excluded from the Net,
Excluding Investment Related expenses. BlackRock may contractually agree to waive or reimburse certain fees and expenses until a specified date. Contractual waivers are terminable upon 90 days’
notice by a majority of the funds non-interested trustees or by a vote of the majority of the outstanding voting securities of the fund. The investment advisor and/or other service providers may also
voluntarily agree to waive certain fees and expenses which can be discontinued at any time without notice. When waivers or reimbursements are in place, the operating expenses are reduced and total
returns to the shareholder in the fund increase. Please see the prospectus for additional information. 6 A rating by Standard & Poor’s and/or Moody’s Investor Service applies to the credit quality of the
portfolio and is not a recommendation to buy, sell or hold securities of the Funds and does not remove market risks associated with investments in the Fund. 7 The Fund’s current yield more closely
reflects the current earnings of the Fund than the total net return quotations.
One should consider the investment objectives, risks and expenses of the Funds carefully before investing.
Disclosures related to TempFund, TempCash, and MuniCash: You could lose money by investing in the Fund. Because the share price of the Fund will fluctuate, when you sell your shares
they may be worth more or less than what you originally paid for them. The Fund may impose a fee upon sale of your shares or may temporarily suspend your ability to sell shares if the
Fund's liquidity falls below required minimums because of market conditions or other factors. An investment in the Fund is not insured or guaranteed by the Federal Deposit Insurance
Corporation or any other government agency. The Fund's sponsor has no legal obligation to provide financial support to the Fund, and you should not expect that the sponsor will provide
financial support to the Fund at any time.
Prepared by BlackRock Investments, LLC, member FINRA.
©2017 BlackRock, Inc. All rights reserved. BLACKROCK, is a registered trademark of BlackRock,Inc., or its subsidiaries in the United States and elsewhere. All other marks are the property of their
respective owners.
For Institutional and Financial Professional Use Only-Proprietary and Confidential 36
Important Notes- BlackRock Liquidity Funds
Footnotes
You should consider the investment objectives, risks and expenses of the Funds carefully before investing. The Funds’ prospectuses and, if available summary prospectuses, contain thisand other information about the Funds and are available by calling our Client Service Center at 800-441-7450 or by visiting www.blackrock.com/cash. Please read the prospectus carefullybefore investing.
1 Dollar-Weighted Average Maturity - the average maturity of a fund is the average amount of time until the organizations that issued the debt securities in the fund’s portfolio must pay off the principal
amount of the debt. “Dollar-weighted” means the larger the dollar value of a debt security in the fund, the more weight it gets in calculating this average. To calculate the dollar-weighted average maturity,
the fund may treat a variable or floating rate security as having a maturity equal to the time remaining to the security’s next interest rate reset date rather than the security’s actual maturity. 2 Dollar-
Weighted Average Life - the dollar-weighted average maturity of a fund’s portfolio calculated without reference to the exceptions used for variable or floating rate securities regarding the use of the
interest rate reset dates in lieu of the security’s actual maturity date. “Dollar-weighted” means the larger the dollar value of a debt security in the fund, the more weight it gets in calculating this average.3 7-Day SEC Yield: The 7-Day yield is computed in accordance with methods prescribed by the SEC .The 7-Day SEC yield excludes distributed capital gains/losses. 4 Average annualized 30-day yields
are based on net investment income and distributed gains or losses for the period shown. Yields will fluctuate as market conditions change. 5 Expenses are as of the most current prospectus. Investment
dividend expense, interest expense, acquired fund fees and expenses and certain other fund expenses are included in the Net, Including Investment Related expenses and excluded from the Net,
Excluding Investment Related expenses. BlackRock may contractually agree to waive or reimburse certain fees and expenses until a specified date. Contractual waivers are terminable upon 90 days’
notice by a majority of the funds non-interested trustees or by a vote of the majority of the outstanding voting securities of the fund. The investment advisor and/or other service providers may also
voluntarily agree to waive certain fees and expenses which can be discontinued at any time without notice. When waivers or reimbursements are in place, the operating expenses are reduced and total
returns to the shareholder in the fund increase. Please see the prospectus for additional information. 6 A rating by Standard & Poor’s and/or Moody’s Investor Service applies to the credit quality of the
portfolio and is not a recommendation to buy, sell or hold securities of the Funds and does not remove market risks associated with investments in the Fund. 7 The Fund’s current yield more closely
reflects the current earnings of the Fund than the total net return quotations.
One should consider the investment objectives, risks and expenses of the Funds carefully before investing.
Disclosures related to Federal Trust, FedFund, T-Fund, Treasury Trust: You could lose money by investing in the Fund. Although the Fund seeks to preserve the value of your investment at
$1.00 per share, it cannot guarantee it will do so. An investment in the Fund is not insured or guaranteed by the Federal Deposit Insurance Corporation or any other government agency. The
Fund's sponsor has no legal obligation to provide financial support to the Fund, and you should not expect that the sponsor will provide financial support to the Fund at any time.
Prepared by BlackRock Investments, LLC, member FINRA.
©2017 BlackRock, Inc. All rights reserved. BLACKROCK, is a registered trademark of BlackRock,Inc., or its subsidiaries in the United States and elsewhere. All other marks are the property of their
respective owners.
For Institutional and Financial Professional Use Only-Proprietary and Confidential 37
For use with institutional investors only — proprietary and confidential
Important Notes
This material is for distribution only to those types of recipients as provided below and should not be relied upon by any other persons. This material is provided for
informational purposes only and does not constitute a solicitation in any jurisdiction in which such solicitation is unlawful or to any person to whom it is unlawful.
Moreover, it neither constitutes an offer to enter into an investment agreement with the recipient of this document nor an invitation to respond to it by making an offer
to enter into an investment agreement.
This material may contain “forward-looking” information that is not purely historical in nature. Such information may include, among other things, projections,
forecasts, estimates of yields or returns, and proposed or expected portfolio composition. Moreover, where certain historical performance information of other
investment vehicles or composite accounts managed by BlackRock, Inc. and/or its subsidiaries (together, “BlackRock”) has been included in this material and such
performance information is presented by way of example only. No representation is made that the performance presented will be achieved, or that every assumption
made in achieving, calculating or presenting either the forward-looking information or the historical performance information herein has been considered or stated in
preparing this material. Any changes to assumptions that may have been made in preparing this material could have a material impact on the investment returns that
are presented herein by way of example.
This material is not intended to be relied upon as a forecast, research or investment advice, and is not a recommendation, offer or solicitation to buy or sell any
securities or to adopt any investment strategy. The opinions expressed are as of December 2016 and may change as subsequent conditions vary. The information
and opinions contained in this material are derived from proprietary and nonproprietary sources deemed by BlackRock to be reliable, are not necessarily all-inclusive
and are not guaranteed as to accuracy. There is no guarantee that any forecasts made will come to pass. Any investments named within this material may not
necessarily be held in any accounts managed by BlackRock. Reliance upon information in this material is at the sole discretion of the reader. Past performance is no
guarantee of future results.
In the US this material is for institutional investors only.
This material is for distribution to Professional Clients (as defined by the FCA Rules) and Qualified Investors only and should not be relied upon by any other persons.
Issued by BlackRock Investment Management (UK) Limited, authorised and regulated by the Financial Conduct Authority. Registered office: 12 Throgmorton Avenue,
London, EC2N 2DL. Tel: 020 7743 3000. Registered in England No. 2020394. For your protection telephone calls are usually recorded. BlackRock is a trading name
of BlackRock Investment Management (UK) Limited.
Past performance is not a guide to future performance. The value of investments and the income from them can fall as well as rise and is not guaranteed. You may
not get back the amount originally invested. Changes in the rates of exchange between currencies may cause the value of investments to diminish or increase.
Fluctuation may be particularly marked in the case of a higher volatility fund and the value of an investment may fall suddenly and substantially. Levels and basis of
taxation may change from time to time.
Any research in this document has been procured and may have been acted on by BlackRock for its own purpose. The results of such research are being made
available only incidentally. The views expressed do not constitute investment or any other advice and are subject to change. They do not necessarily reflect the views
of any company in the BlackRock Group or any part thereof and no assurances are made as to their accuracy.
This document is for information purposes only and does not constitute an offer or invitation to anyone to invest in any BlackRock funds and has not been prepared in
connection with any such offer.
CONTINUED ON NEXT PAGE
38

For use with institutional investors only — proprietary and confidential
This document contains general information only and is not intended to represent general or specific investment advice. The information does not take into account
your financial circumstances. An assessment should be made as to whether the information is appropriate for you having regard to your objectives, financial situation
and needs.
Disclosures related to institutional prime and institutional municipal money market funds: You could lose money by investing in the Fund. Because the
share price of the Fund will fluctuate, when you sell your shares they may be worth more or less than what you originally paid for them. The Fund may
impose a fee upon sale of your shares or may temporarily suspend your ability to sell shares if the Fund's liquidity falls below required minimums because
of market conditions or other factors. An investment in the Fund is not insured or guaranteed by the Federal Deposit Insurance Corporation or any other
government agency. The Fund's sponsor has no legal obligation to provide financial support to the Fund, and you should not expect that the sponsor will
provide financial support to the Fund at any time.
Disclosures related to retail money market funds : You could lose money by investing in the Fund. Although the Fund seeks to preserve the value of your
investment at $1.00 per share, it cannot guarantee it will do so. An investment in the Fund is not insured or guaranteed by the Federal Deposit Insurance
Corporation or any other government agency. The Fund's sponsor has no legal obligation to provide financial support to the Fund, and you should not
expect that the sponsor will provide financial support to the Fund at any time.
Disclosures related to government money market funds : You could lose money by investing in the Fund. Although the Fund seeks to preserve the value of
your investment at $1.00 per share, it cannot guarantee it will do so. An investment in the Fund is not insured or guaranteed by the Federal Deposit
Insurance Corporation or any other government agency. The Fund's sponsor has no legal obligation to provide financial support to the Fund, and you
should not expect that the sponsor will provide financial support to the Fund at any time.
THIS MATERIAL IS HIGHLY CONFIDENTIAL AND IS NOT TO BE REPRODUCED OR DISTRIBUTED TO PERSONS OTHER THAN THE RECIPIENT.
© 2016 BlackRock, Inc. All Rights reserved. BLACKROCK, BLACKROCK SOLUTIONS, iSHARES, BUILD ON BLACKROCK, SO WHAT DO I DO WITH MY MONEY
and the stylized i logo are registered and unregistered trademarks of BlackRock, Inc. or its subsidiaries in the United States and elsewhere. All other trademarks are
those of their respective owners.
Important Notes
39