Embed Size (px)
DESCRIPTION
Joseph D. Blackburn V. Daniel R. Guide, Jr. Gilvan C. Souza Luk N. Van Wassenhove Unlike forward supply chains, design strategies for reverse supply chains are relatively unexplored and underdeveloped. Key concepts of forward supply chain design—such as coordination, postponement, and the bullwhip effect— may be useful for the development of reverse supply chain design strategies, but CALIFORNIA MANAGEMENT REVIEW VOL. 46, NO.2 WINTER 2004 6
Citation preview
O nce lightly regarded, the flow of product returns is becoming a significant concern for many manufacturers. The total valueof products returned by consumers in the U.S. is enormous—estimated at $100 billion annually.1 For commercial product
returns––products returned by customers for any reason within up to 90 days of sale—the manufacturer must typically credit the retailer (or reseller) and thendecide how to most profitably dispose of the product: reuse as–is, refurbish, sal-vage, or recycle. Managers struggle to design, plan, and control the reverse sup-ply chains that process returned products from the customer, recover theirvalue, and use or sell them again.
To most companies, commercial product returns have been viewed as anuisance; consequently, their legacy today is a reverse supply chain process thatwas designed to minimize costs. Cost efficient supply chains are not necessarilyfast; and, as a result, returns undergo a lengthy delay until they are re–used,either as–is or remanufactured. The longer it takes to retrieve a returned prod-uct, the lower the likelihood of economically viable reuse options. The advan-tages of time-based competition and faster response are well known anddocumented,2 and our experiences and research suggest that significant mone-tary values can be gained by redesigning the reverse supply chain to be faster3
and reduce costly time delays. These monetary values are higher in fast clock-speed industries such as consumer electronics, where the average life cycle of apersonal computer (PC) is expressed in months, as opposed to a slow clockspeedindustry such as power tools, with life cycles of around six years.
Unlike forward supply chains, design strategies for reverse supply chainsare relatively unexplored and underdeveloped. Key concepts of forward supplychain design—such as coordination, postponement, and the bullwhip effect—may be useful for the development of reverse supply chain design strategies, but
CALIFORNIA MANAGEMENT REVIEW VOL. 46, NO.2 WINTER 20046
Reverse Supply Chains for Commercial Returns
Joseph D. BlackburnV. Daniel R. Guide, Jr.Gilvan C. SouzaLuk N. Van Wassenhove

these concepts have not been examined for their relevance in this context. Forforward chains, Fisher proposes a useful dichotomous structure: responsive supplychains are appropriate for high demand-uncertainty products; efficient supply chainsare appropriate for low demand-uncertainty products.4 For reverse supplychains, our research indicates that the mostinfluential product characteristic for supplychain design is marginal value of time(MVT), which can be viewed as a measureof clockspeed. Responsive reverse supplychains are appropriate for products withhigh MVT, whereas efficient reverse supplychains are appropriate for products withlow MVT. In practice, however, the reversesupply chains of both slow and fast clock-speed industries are remarkably similar.Both are typically focused on local efficien-cies where all product returns flow to acentral facility. Managers have designedprocesses focused on providing low-cost solutions, despite the fact that much of the value for their products erodes away because of the lengthy delays.
In forward supply chains, Lee and Tang and others have introduced theconcept of product postponement and have shown that it has substantial finan-cial benefits.5 A modification of this concept can be very useful in a reversesupply chain: managers should make a disposition as early as possible to avoidprocessing returns with no recoverable value. We call this concept “prepone-ment” and posit that it can greatly benefit the profitability of a firm by avoidingunnecessary processing expenses, while at the same time providing faster recov-ery of products with significant value.
Product returns and their reverse supply chains represent an opportunityto create a value stream, not an automatic financial loss. Reverse supply chainsdeserve as much attention at the corporate level as forward supply chains andshould be managed as business processes that can create value for the company.
Product Returns and Reverse Supply Chains
Not all reverse supply chains are identical, nor should they be.6 However,most return supply chains are organized to carry out five key processes:
▪ product acquisition—obtaining the used product from the user;
▪ reverse logistics—transporting the products to a facility for inspecting, sort-ing, and disposition;
▪ inspection and disposition—assessing the condition of the return and makingthe most profitable decision for reuse;
Reverse Supply Chains for Commercial Returns
CALIFORNIA MANAGEMENT REVIEW VOL. 46, NO.2 WINTER 2004 7
Joseph D. Blackburn is the James A. SpeyerProfessor of Operations Management at theOwen Graduate School of Management atVanderbilt University.<[email protected]>
V. Daniel R. Guide, Jr. is an Assistant Professor of Operations and Supply Chain Management inthe Department of Supply Chain & InformationSystems at the Smeal College of BusinessAdministration at The Pennsylvania StateUniversity. <[email protected]>
Gilvan C. Souza is an Assistant Professor ofManagement Science at the R.H. Smith School of Business Administration at the University ofMaryland. <[email protected]>
Luk N. Van Wassenhove is the Henry Ford ChairedProfessor of Manufacturing at INSEAD in France.<[email protected]>
▪ remanufacturing (or refurbishing—we use the terms remanufacturing andrefurbishment interchangeably)—returning the product to original speci-fications;
▪ marketing—creating secondary markets for the recovered products.
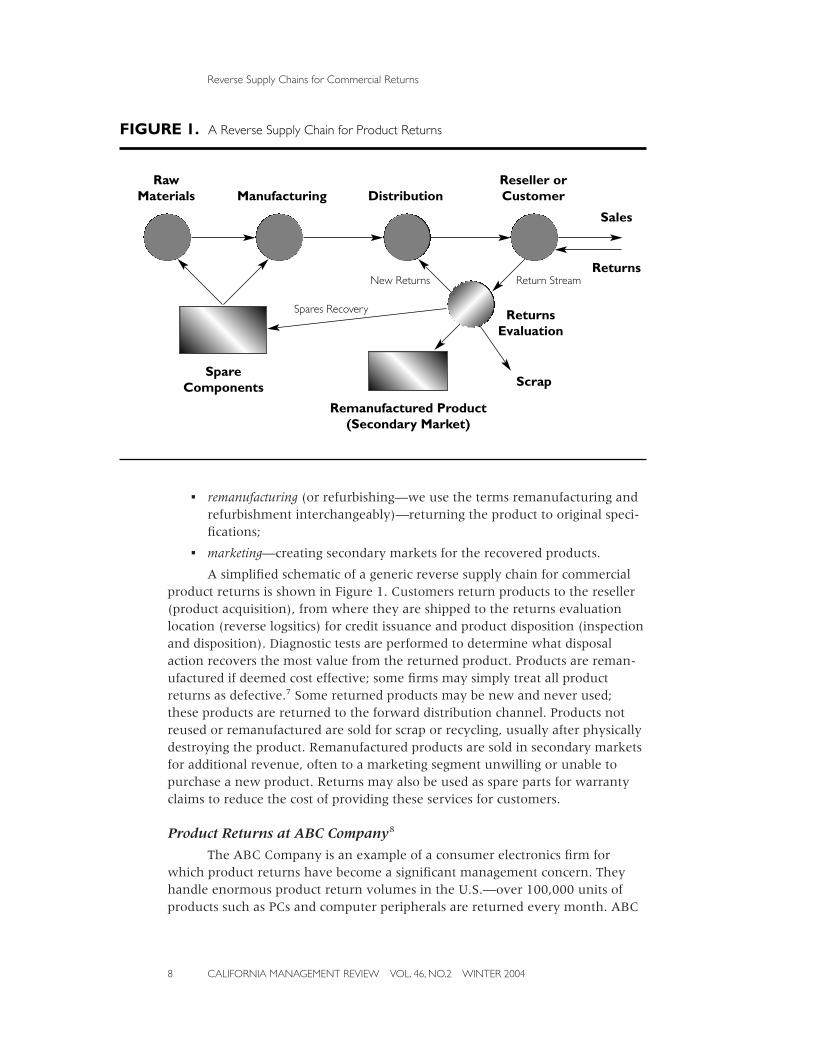
A simplified schematic of a generic reverse supply chain for commercialproduct returns is shown in Figure 1. Customers return products to the reseller(product acquisition), from where they are shipped to the returns evaluationlocation (reverse logsitics) for credit issuance and product disposition (inspectionand disposition). Diagnostic tests are performed to determine what disposalaction recovers the most value from the returned product. Products are reman-ufactured if deemed cost effective; some firms may simply treat all productreturns as defective.7 Some returned products may be new and never used;these products are returned to the forward distribution channel. Products notreused or remanufactured are sold for scrap or recycling, usually after physicallydestroying the product. Remanufactured products are sold in secondary marketsfor additional revenue, often to a marketing segment unwilling or unable topurchase a new product. Returns may also be used as spare parts for warrantyclaims to reduce the cost of providing these services for customers.
Product Returns at ABC Company8
The ABC Company is an example of a consumer electronics firm forwhich product returns have become a significant management concern. Theyhandle enormous product return volumes in the U.S.—over 100,000 units ofproducts such as PCs and computer peripherals are returned every month. ABC
Reverse Supply Chains for Commercial Returns
CALIFORNIA MANAGEMENT REVIEW VOL. 46, NO.2 WINTER 20048
FIGURE 1. A Reverse Supply Chain for Product Returns
Raw Materials Manufacturing
Spares Recovery
New Returns Return Stream
DistributionReseller orCustomer
Sales
Returns
ReturnsEvaluation
ScrapSpare
Components
Remanufactured Product(Secondary Market)

estimates the annual total cost of product returns to be between 2 and 4 percentof total outbound sales, where the cost of product returns is defined as the valueof the return plus all reverse logistics costs minus revenue recovered from theproduct.
Product returns are transported to a central returns depot for initial pro-cessing. At ABC, the first transaction is credit issuance: a third party physicallyverifies the return and issues credit to the retailer. Products are then sorted bytype and model, palletized, labeled, and moved to shipping. Products are shippedto specialized testing and refurbishment (T&R) facilities scattered around theU.S.
In each facility, all units sent from credit issuance undergo the refurbish-ment processes although some will be scrapped during processing or fail to meetABC quality standards after refurbishing. Refurbished products such as PCs arefirst used to fill the warranty pool; all remaining units are sold in secondary mar-kets in the U.S.
According to our experience, ABC’s centralized reverse supply chaindesign is remarkably similar to that used by others firms in Europe and in theU.S. When we first began studying ABC’s reverse supply chain in the late 1990s,they had an efficient supply chain that was designed to minimize the cost ofprocessing returns, not to recover value. In the intervening years, ABC has beencommitted to developing a more responsive supply chain.
The Time Value of Product Returns
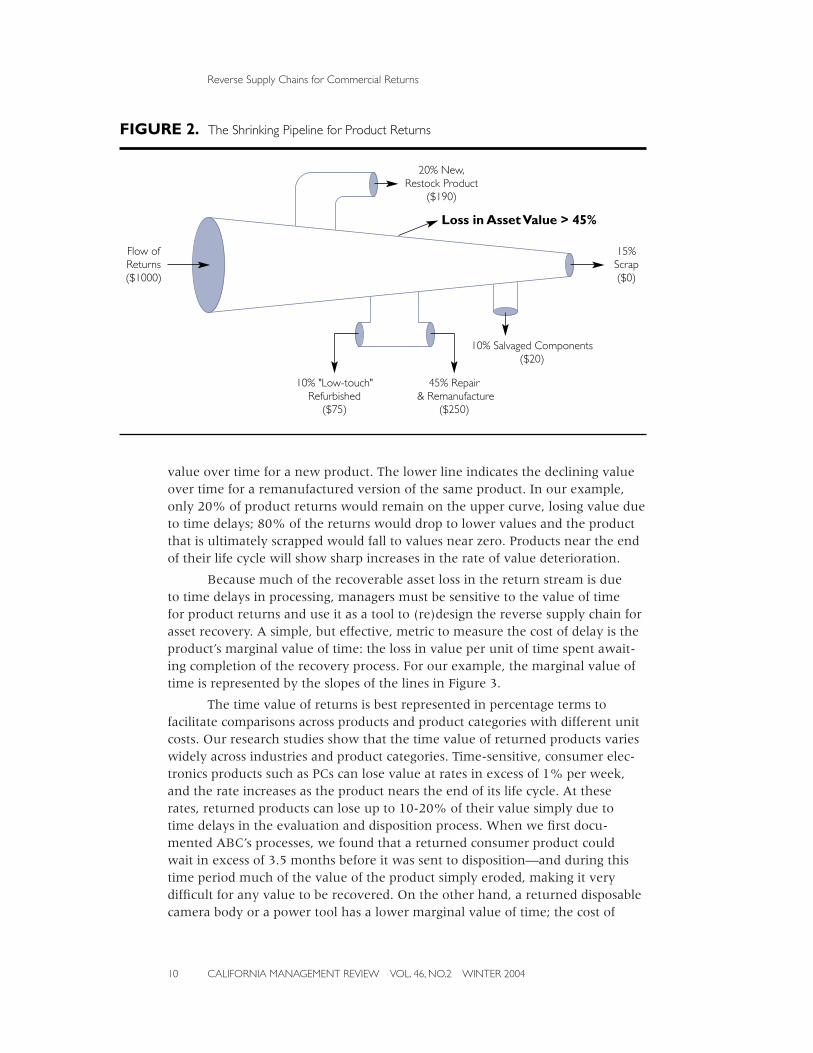
The flow of returned products represents a sizeable asset stream for manycompanies, but much of that asset value is lost in the reverse supply chain. Man-agers, focused predominantly on the forward supply chain for new products, areoften unaware of the magnitude of these losses and of how they occur. A visualmodel that illustrates how assets are lost in the return stream is shown in Figure2: the returns process is modeled as a shrinking, leaky pipeline. The percentagelosses shown in Figure 2 are representative averages from our research base ofcompanies. In Figure 2, for $1000 of product returns nearly half the asset value(>45%) is lost in the return stream. Most of the loss in asset value falls into twocategories: the returned product must be downgraded to a lower-valued prod-uct––a product once valued as new must be remanufactured, salvaged for parts,or simply scrapped as not repairable or obsolete; or, the value of the productdecreases with time as it moves through the pipeline to its ultimate disposition.Of these two loss categories, much of the first is unavoidable because only afraction of returns can be restocked as new items (20% in our example). How-ever, the losses due to time delays represent a significant opportunity for assetrecovery. These losses include not only the deterioration in value of a returnedproduct with time, but also the forced downgrading of product due toobsolescence.
Figure 3 illustrates the effects of time delays and product downgrading onasset loss in a return stream. The upper line in Figure 3 represents the declining
Reverse Supply Chains for Commercial Returns
CALIFORNIA MANAGEMENT REVIEW VOL. 46, NO.2 WINTER 2004 9
value over time for a new product. The lower line indicates the declining valueover time for a remanufactured version of the same product. In our example,only 20% of product returns would remain on the upper curve, losing value dueto time delays; 80% of the returns would drop to lower values and the productthat is ultimately scrapped would fall to values near zero. Products near the endof their life cycle will show sharp increases in the rate of value deterioration.
Because much of the recoverable asset loss in the return stream is due to time delays in processing, managers must be sensitive to the value of time for product returns and use it as a tool to (re)design the reverse supply chain forasset recovery. A simple, but effective, metric to measure the cost of delay is theproduct’s marginal value of time: the loss in value per unit of time spent await-ing completion of the recovery process. For our example, the marginal value oftime is represented by the slopes of the lines in Figure 3.
The time value of returns is best represented in percentage terms tofacilitate comparisons across products and product categories with different unitcosts. Our research studies show that the time value of returned products varieswidely across industries and product categories. Time-sensitive, consumer elec-tronics products such as PCs can lose value at rates in excess of 1% per week,and the rate increases as the product nears the end of its life cycle. At theserates, returned products can lose up to 10-20% of their value simply due to time delays in the evaluation and disposition process. When we first docu-mented ABC’s processes, we found that a returned consumer product could wait in excess of 3.5 months before it was sent to disposition—and during thistime period much of the value of the product simply eroded, making it verydifficult for any value to be recovered. On the other hand, a returned disposablecamera body or a power tool has a lower marginal value of time; the cost of
Reverse Supply Chains for Commercial Returns
CALIFORNIA MANAGEMENT REVIEW VOL. 46, NO.2 WINTER 200410
FIGURE 2. The Shrinking Pipeline for Product Returns
20% New,Restock Product
($190)
Flow ofReturns($1000)
10% "Low-touch"Refurbished
($75)
45% Repair& Remanufacture
($250)
10% Salvaged Components($20)
15%Scrap($0)
Loss in Asset Value > 45%

delay is usually closer to 1% per month. These differences in the marginal valueof time are illustrated in Figure 4.
Reverse Supply Chain Design
Reverse supply chain design decisions should reflect, and be driven by,differences in the marginal value of time among products. In Fisher’s taxonomyof strategic design choices for the forward supply chain, products are character-ized as either functional (predictable demand, long life cycle) or innovative (vari-able demand, short life cycle).9 He then proposes two fundamental supply chainstructures:
▪ efficient—a supply chain designed to deliver product at low cost;
▪ responsive—a supply chain designed for speed of response.
Reverse Supply Chains for Commercial Returns
CALIFORNIA MANAGEMENT REVIEW VOL. 46, NO.2 WINTER 2004 11
FIGURE 3. Time Value of Product Returns
ProductReturn
Processing Delay(�t)
$ Cost of Delay
Return to Stock
Remanufactured
Value afterRemanufacturing
T
Start Shipping
T
Begin ProductPhase-out
Value of ReturnedProduct ($)
Time

Within this framework, there is an appropriate matching of product to supplychain: efficient supply chains are best for functional products, and responsivechains are best for innovative products.
The relevance of Fisher’s strategic model for reverse supply chains isclearly seen by recasting it in time-based terms because asset recovery dependsso strongly on reducing time delays. To make the translation, observe that theproduct classifications—functional and innovative— roughly correspond toproducts with low and high marginal values of time respectively. Innovative,short life-cycle products such as laptop computers have a high marginal value of time, whereas products such as power tools or disposable cameras are lesstime-sensitive and have low marginal values of time.
If we classify products by time value, we can develop an analog of Fisher’ssupply chain structure to maximize the value of recovered assets in the returnstream. If our objective is to maximize the net value of recovered assets, thenthe cost of managing the reverse supply chain must also be considered. To useFisher’s terminology, efficient supply chains sacrifice speed for cost efficienciesand, in a responsive chain, speed is usually achieved at higher cost.
Viewed in this way, reverse supply chain design is a tradeoff betweenspeed and cost efficiency. For products with high marginal time values (such as laptop computers), the high cost of time delays tips the tradeoff toward aresponsive chain. For products with low marginal time values, delays are lesscostly and cost efficiency is a more appropriate objective. This suggests a supplychain design structure similar to the one Fisher proposes for forward supplychains; it is displayed as a two-dimensional matrix in Table 1. The right reverse
Reverse Supply Chains for Commercial Returns
CALIFORNIA MANAGEMENT REVIEW VOL. 46, NO.2 WINTER 200412
FIGURE 4. Differences in Marginal Value of Time for Returns
Time-sensitive Product (High MVT)
Time-insensitiveProduct (Low MVT)
% Lossin Value
Time

supply chain matches responsiveness with high time value products and costefficiency with low time value.
The major structural difference between efficient and responsive reversesupply chains is the positioning of the evaluation activity in the supply chain—that is, where in the chain is testing and evaluation conducted to determine thecondition of the product? If cost efficiency is the objective, then the returns sup-ply chain should be designed to centralize the evaluation activity. On the otherhand, if responsiveness is the goal, then a decentralized evaluation activity isneeded to minimize time delays in processing returns.
Efficient Supply Chains: The Centralized Model
A schematic of a returns supply chain with centralized testing and evalu-ation of returns is shown in Figure 5. The returns supply chain is designed for
Reverse Supply Chains for Commercial Returns
CALIFORNIA MANAGEMENT REVIEW VOL. 46, NO.2 WINTER 2004 13
TABLE 1. Time-Based Reverse Supply Chain Design Strategy
Low MVT Product
Efficient Chain
Match
Responsive Chain
No Match
High MVT Product No Match Match
FIGURE 5. Centralized, Efficient Reverse Supply Chain
Re-stock
Refurbish
Parts Recovery
Scrap
ProductReturns
Retailers &Resellers
CentralizedEvaluation & Test Facility

economies of scale––both in processing and transport of product. Every returnedproduct is sent to a central location for testing and evaluation to determine itscondition and issue credit. No attempt is made to judge the condition or qualityof the product at the retailer or reseller. To minimize shipping costs, productreturns are usually shipped in bulk. Once the condition of the product has beendetermined, it is channeled to the appropriate area (or facility) for disposition:restocking, refurbishment or repair, parts salvaging, or scrap recycling. Repairand refurbishment facilities also tend to be centralized, often outsourced.
The supply chain is designed to minimize processing costs, often at theexpense of long delays. Our research on reverse supply chains indicates thatthese delays can be excessive. Figure 6 shows the delay times for a typical prod-uct in ABC’s product returns system.
The centralized, efficient supply chain structure achieves processingeconomies by delaying credit issuance and testing, sorting, and grading until ithas been collected at a central location. This approach has been widely adoptedby managers of reverse supply chains, perhaps because it embodies a fundamen-tal design principle of forward supply chains: postponement. Postponement—ordelayed product differentiation—has been used as an effective strategy for deal-ing with the cost of variety in forward supply chains10 Manufacturing and stock-ing a basic product in generic form and delaying the addition of features, oroptions, until the product is closer to the customer has been used by firms suchas ABC to avoid the cost of carrying separate inventories of all varieties of finalproduct. The centralized, efficient supply chain structure is also easier from theperspectives of the third-party provider offering credit issuances and the retailerwho can send all the products back to a central location and do not have to sortreturns and ship products to multiple locations. Figure 7 shows how early and
Reverse Supply Chains for Commercial Returns
CALIFORNIA MANAGEMENT REVIEW VOL. 46, NO.2 WINTER 200414
FIGURE 6. Delays in the Disposition Process for a Product at ABC*
* ABC has worked aggressively to significantly reduce these times.
ProductReturns in
Field & ReturnPipeline
Queue forInspection,Testing &
Disposition
Inspection,Testing
& Disposition
ReplacementStock
Repair orRefurbish
SalvageComponents
Scrap~2 months ~40 days

delayed product differentiation work in a reverse supply chain for productreturns.
Postponement has less appeal as a strategy for reverse supply chains. Withreturns, product variety is already determined upon receipt, as is the conditionof the product, even though it may not be observable without examination andtesting. With a returned PC, for example, the same model may take differentforms, each requiring a different action: some PCs are new “factory seals” inwhich the box has never been opened; some may have only operated a fewtimes; some may need repair; some may only be salvageable for parts; and somecan only be scrapped (or recycled). The key return decision is to first evaluatethe product to determine its condition in order to make a disposition decision.There is little to be gained from postponing product differentiation.
Responsive Supply Chains:The Decentralized “Preponement” Model
In the reverse supply chain, there are significant time advantages to early,rather than late, process differentiation. Early diagnosis of product condition
Reverse Supply Chains for Commercial Returns
CALIFORNIA MANAGEMENT REVIEW VOL. 46, NO.2 WINTER 2004 15
FIGURE 7. Early vs. Delayed Product Differentiation in Return Stream
Delayed Product Differentiation:
Early Product Differentiation:
N R
C S
N
R
C
SDisposition &Testing CenterField
Restock
Refurbish
Recover Components
Scrap
R
C
N
R
C
S
Disposition &Testing Center
Restock
Refurbish
Recover Components
Scrap
N = New or RestockR = Refurbishable UnitC = Salvageable ComponentsS = Scrap

maximizes asset recovery by fast-tracking returns on to their ultimate dispositionand minimizing the delay cost.
The reverse supply chain for PCs at ABC illustrates the advantages ofwhat we call the preponement strategy. Figure 7 illustrates two alternativereverse supply chain configurations for PC returns. To simplify the example, we focus on a single PC model in four possible return conditions—new, refur-bishable, salvageable for components, or scrap. In appearance, these PCs canlook identical, and they must be tested and evaluated to determine their truecondition. With delayed (or postponed) product differentiation, all PCs areshipped from retailers and resellers to a central facility for evaluation and thendiverted to the appropriate processing center. Alternatively, if a field test is car-ried out to screen product into three categories—new, repairable, and scrap—then the new, unused product can be restocked without delay, scrap units can befiltered out and sent for recycling, and the remainder can be shipped to a centralfacility for further evaluation and repair.
To achieve preponement and make the reverse supply chain responsive,the testing and evaluation of product must be decentralized. The reverse supplychain for one such responsive supply chain is displayed in Figure 8. Instead of asingle point of collection and evaluation, product is initially evaluated at multi-ple locations—when possible, at the point of return from the customer.
Decentralizing the returns process with preponement improves assetrecovery by reducing time delays in two important ways. First, it reduces thetime delays for disposition of new and scrap products; new, unused products
Reverse Supply Chains for Commercial Returns
CALIFORNIA MANAGEMENT REVIEW VOL. 46, NO.2 WINTER 200416
FIGURE 8. Decentralized Returns Supply Chain with Preponement
Note: * = Evaluation of Product at Retailer or Reseller.
Re-stock
Refurbish
Parts Recovery
Scrap
ProductReturns
Retailers &Resellers
Test & Repair Facility
*
*
*
*
*
tend to have the highest marginal time value and the most to lose from delays inprocessing. Second, and not so obvious, preponement also tends to speed up theprocessing of the remaining products—the units that need further testing andrepair. By diverting the extremes of product condition (new and scrap) from themain returns flow, the flow of product requiring further evaluation, perhaps byremanufacturing specialists, is reduced. Reducing congestion for the flow ofrepairable product reduces the time delays in queuing and further diagnosis,thereby reducing the asset loss for these items as well. As in the example in Fig-ure 2, preponement to screen out new and scrap would reduce the flow of unitsneeding further evaluation by about 35%, which would make diagnosis easierand faster.
For products with a high marginal value of time, preponement can dra-matically increase asset recovery. In the case of ABC, reducing the losses in valueof new product alone can be significant. If a returned product is unused, thensending it to a centralized test and evaluation facility could keep the product offthe shelves for a month or more. During this time, the product could easily losemore than 5 % of its value. Preponement can eliminate much of the loss in thatproduct segment, as well as reduce the return flow to only those units needingthe attention of technicians.
There are two significant issues that must be addressed to achieve respon-sive, decentralized reverse supply chains. First is the question of technical feasi-bility—that is, being able to determine the condition of the product return in the field quickly and inexpensively.11 Second is the question of how to inducethe reseller to do these activities at the point of return. Incentive alignment viashared savings contracts may be the best way to induce cooperation and coordi-nation between the manufacturer and resellers, but firms must first know thevalue of such activities. As an alternative, ABC could use a vendor-managedinventory (VMI) approach at large retailers. This would entail ABC using theirown technicians, or a contractor, to do disposition at the resellers’ sites or distri-bution centers.
The Efficient-Responsive Tradeoff
To maximize the net value received from a reverse supply chain, thechoice between efficient and responsive designs involves a tradeoff between thevalue of assets recovered and the cost of processing returns. The desired designmaximizes the sum of product value recovered minus the processing cost. Thismay be best illustrated via an economic value added model (EVA®, a registeredtrademark of Stern Stewart & Co). EVA measures the difference between thereturn on a firm’s capital and the cost of that capital.12 In Figure 9, theefficient/effective tradeoff influences the different categories (revenue, costs,fixed and variable assets) differently. At one end of the scale, efficient chainsminimize processing costs, but the accompanying time delays may reduce thevalue of assets recovered. This is accomplished by lowering operating costs viaeconomies of scale at a centralized facility and the lower fixed asset expense of
Reverse Supply Chains for Commercial Returns
CALIFORNIA MANAGEMENT REVIEW VOL. 46, NO.2 WINTER 2004 17

a single facility. However, the time to return a product to the market for an effi-cient reverse supply chain will be longer; and this may reduce the selling priceand, as a result, the revenue generated by the system. Managers will need toexamine the final impact of the changes to determine whether an efficient sys-tem is better from an EVA perspective.
At the other extreme, responsive chains maximize recovery by reducingtime delays, usually at the expense of higher processing costs. The higher pro-cessing costs are a result of increases in the operating costs and fixed assetsrequired when there are multiple facilities used. Since the time to return aproduct to market is significantly faster, the selling price and revenues arehigher. Managers will again need to assess the net impact on the EVA. In eithercase (efficient or responsive), managers should act to maximize profits by exam-ining the impact of decisions on total economic profit.
Reverse Supply Chains for Commercial Returns
CALIFORNIA MANAGEMENT REVIEW VOL. 46, NO.2 WINTER 200418
FIGURE 9. The Impact of Effective and Responsive Reverse Supply Chain Design on EVA
Asset CalculationsProfit Calculations
PBIT = Profit Before Income TaxesNOPAT = Net Operating Profit After TaxesWACC = Weighted Average Cost of Capital
Efficient Reverse Supply Chains:• Lower Operating Costs• Lower Fixed Asset Investment
Responsive Reverse Supply Chains:• Increased Operating Costs• Increased Fixed Assets
Revenue
Fixed SP*Volume
OperatingCosts
Materials, Labor,Acquisition Price,
Disposal
CurrentAssets
Inventory, PrepaidRent & Insurance
CurrentLiabilities
Trade Payables,Accrued Expenses
(e.g., unpaidsalaries)
PBIT
= Revenue – Costs
Cash Taxes
Fixed
Fixed Assets
Machines &Building
WorkingCapital
Requirement
= Current Assets– CurrentLiabilities
NOPAT
= PBIT – Cash Taxes
CapitalEmployed
= Fixed Assets + Working
Capital
CapitalCharge
= CapitalEmployed � WACC
WACC
Fixed
EVA
= NOPAT –Capital Charge
EVA Calculations
� Lower Revenue
� Higher Revenue

In a responsive chain, preponement typically increases processing costdue to the expense of performing diagnostics in the field near the point ofreturn. It is often necessary to send out technicians or distribute test equipmentand, in some cases, to provide monetary incentives and training to retailers toenlist their cooperation. Processing costs are generally lower when the product is brought to a centralized facility than when the testing is moved out to thepoint of collection.
This tradeoff between efficiency and responsiveness depends primarily on the marginal time value of the product. For PCs, printers, and other productswith high marginal values of time, preponement is a powerful method for maxi-mizing asset recovery. The reverse supply chain should be decentralized andresponsive. For products with lower marginal values of time, such as powerhand-tools, the tradeoff tips toward centralized processing for cost efficiencybecause the cost of field testing can easily exceed the benefits of reduced timedelays.
Technology: Making Preponement More Efficient
The technology now included in some products can sharply reduce thecost of field evaluation to make preponement economically attractive even forproducts with low marginal costs of time. To be effective, the technology mustprovide a simple, inexpensive way to determine: if the product is new and hasnever been used; if the product needs repair; or if the product has exceeded itsuseful life. In recent years, manufacturers have begun to include such technol-ogy in their products, not for the purpose of preponement, but to facilitate prob-lem diagnosis and repair. For example, automobiles have always had odometers,and many automobiles are now equipped with on-board computers that canprovide a time profile of engine use and even early warning of potential prob-lems.
Technology, designed and built in for early product differentiation, alsoexists now in simpler products such as printers and power tools. In power toolssold in Germany, Bosch has introduced a “data logger” into their products—aninexpensive chip that is built into the electric motor of each tool to record thenumber of hours of use and the speed at which the tool has been operated.13 Byconnecting a returned tool to a test machine, Bosch (or a retailer) can quicklydetermine if the product would be better used for remanufacturing or recycling(operated above a certain number of hours) and if the product has been run athigh speed. The data logger makes preponement possible, quickly and inexpen-sively. Tools that have been run under extreme conditions can be identified andsent immediately to a recycling center; the remainder can be returned directly todedicated remanufacturing facilities.
Some printers have similar usage technology to measure the total numberof pages that have been printed. It is feasible, then, with a small investment toequip resellers or field collection centers with a handheld device (preliminarycosts offered by a printer manufacturer are estimated to be between $250-$350per handheld device) to determine if the product has never been used, lightly
Reverse Supply Chains for Commercial Returns
CALIFORNIA MANAGEMENT REVIEW VOL. 46, NO.2 WINTER 2004 19

used, or heavily used. Given this information, the printer can be more effectivelychanneled to the desired processing facility, saving time, and boosting assetrecovery.
Metering the usage of a product is one simple way that manufacturerscan facilitate preponement. As management grows more cognizant of the impor-tance of the value in the return stream, increased emphasis should be placed ondesigning new products to facilitate returns processing; for example, building insoftware that enables more extensive diagnosis of product condition at the pointof collection (or even before the product is returned by the customer). Includingtechnology to facilitate preponement can reduce some of the cost of field diag-nosis and give organizations the tools to be both responsive and efficient in theirreturn supply chains.
Conclusions and Recommendations for Managers
In our research, we have observed a small, but growing number of for-ward-looking companies that extract value from product returns. By theiractions, these successful firms provide a template for managers in other firms.The principles that managers can follow to improve their asset recovery are:
▪ Treat Returns as Perishable Assets —Fundamentally, managers in organiza-tions such as ABC and Bosch take a different view of commercial returns:returns are viewed as perishable assets, not simply a waste stream. Recog-nizing the perishability of returns and their loss of value over time, theyemphasize quickly extracting value from the returns flow rather thansimply disposing of product.
▪ Elevate the Priority of the Returns Process: Close the Loop on the Supply Chain—At most firms, returns flow below top management’s radar screen. Tochange this, management must, by its stated objectives and actions, estab-lish high priority for the returns process and make it a supply chainresponsibility. In this way, returns become an integral part of the supplychain management process.
▪ Make Time the Essential Performance Metric—Surprisingly, many firms do nottrack or record time metrics in their returns process; they are unaware ofthe magnitude of losses in product value simply due to time delays atdifferent stages in the process. For example, only when ABC beganrecording time metrics did they realize that it was taking several monthsfor returned products to reach the remanufacturing facility. Becausereturns are perishable assets, the percentage of asset value recovered isdirectly proportional to the speed of recovery and disposition of returnedproduct.
▪ Use Time Value to Design the Right Reverse Supply Chain—Like forward supplychains, the reverse supply chain can be designed for cost efficiency orquick response, and the decision pivots on the product’s time value. If theproduct has a low marginal value of time (that is, its value decays slowly),
Reverse Supply Chains for Commercial Returns
CALIFORNIA MANAGEMENT REVIEW VOL. 46, NO.2 WINTER 200420

then the returns supply chain should be designed for cost efficiency. A centralized reverse supply chain is cost efficient because it bringseconomies of scale in transportation and returns evaluation. If the prod-uct has a high marginal value of time, speed is critical and a decentralizedreverse supply chain is appropriate. The product is evaluated as close aspossible to the returns point and moved rapidly to its ultimate disposition.Although the costs of operating the returns process increase with decen-tralization, these costs can easily be offset by the gains from speedierrecovery of perishable assets.
▪ Use Technology to Achieve Speed at Lower Cost—To reduce the cost of evalu-ating a returned product’s condition, evaluation is often conducted at acentralized location, but centralization usually means longer delays. If theproduct evaluation can be simplified sufficiently to be carried out at thepoint of customer return, then the need for a centralized evaluationprocess is reduced and a decentralized supply chain can become attractiveeven for a low time-value product. For example, Bosch’s products losevalue at a rate considerably lower than ABC’s, suggesting that the appro-priate returns supply chain for Bosch would be centralized. However,technology built into the product made early product differentiation, orpreponement, easy to carry out in the field, reducing the need for central-ized evaluation.
Managers should give reverse supply chains as much attention as forwardsupply chains. Recognizing the significant value remaining in product returnsand their time sensitivity are keys to designing their reverse supply chains. Thisis especially true for maturing markets such as consumer electronics, wherethere are declining margins. Poorly handled return streams and increasingreturns volumes can quickly erode profits significantly.
Notes
1. J. Stock, T. Speh, and H. Shear, “Many Happy (Product) Returns,” Harvard Business Review,80/7 (July 2002): 16-17.
2. For a complete discussion, see J. Blackburn, Time-Based Competition: The Next Battleground inAmerican Manufacturing (Homewood, IL: Business One Irwin, 1991).
3. G. Souza, V. Daniel R. Guide, Jr., L.N. Van Wassenhove, and J. Blackburn, “Time Value ofCommercial Product Returns,” Working Paper 2003/48/TM INSEAD R&D, Fontainebleau,France.
4. M. Fisher, “What Is the Right Supply Chain for Your Product,” Harvard Business Review, 75/2(March/April 1997): 83-93.
5. H. Lee and C.S. Tang, “Modeling the Costs and Benefits of Delayed Product Differentiation,”Management Science, 43/1 (January 1997): 40-53.
6. See V. Daniel R. Guide, Jr., and L.N. Van Wassenhove, “The Reverse Supply Chain,” HarvardBusiness Review, 80/2 (February 2002): 25-26; V. Daniel R. Guide, Jr., and L.N. Van Wassen-hove, “Business Aspects of Closed-Loop Supply Chains,” in V. Daniel R. Guide, Jr. and L.N.Van Wassenhove, eds., Business Aspects of Closed-Loop Supply Chains (Pittsburgh, PA: CarnegieMellon University Press, 2003).
7. Some firms, including Robert Bosch Tools, treat all returned products as defective for severalreasons. First and foremost is brand name protection; companies are unwilling to risk dam-aging their reputation for quality. Second, from a legal standpoint a product that has beenused must be clearly labeled as such.
Reverse Supply Chains for Commercial Returns
CALIFORNIA MANAGEMENT REVIEW VOL. 46, NO.2 WINTER 2004 21

8. The information in this section is from our work with an international firm in the computerand computer peripherals industry. We have disguised the company name and use represen-tative data provided by the firm. We would also like to recognize that ABC has been work-ing over the last few years to build a more responsive returns supply chain and that thesystem we discuss in this article is undergoing significant changes.
9. Fisher, op. cit.10. E. Feitzinger and H. Lee, “Mass Customization at HP: The Power of Postponement,” Harvard
Business Review, 75/1 (January/February 1997): 116-121.11. For a complete discussion on the problem and some possible solutions, see M. Klausner, W.
Grim, and C. Hendrickson, “Reuse of Electric Motors in Consumer Products: Design andAnalysis of an Electronic Data Log,” Journal of Industrial Ecology, 2/2 (1998): 89-102; M.Klausner, W. Grim, C. Hendrickson, and A. Horvath, “Sensor-Based Data Recording of UseConditions for Product Takeback,” Proceedings of the 1998 IEEE International Symposium onElectronics and the Environment (Piscataway, NJ: IEEE, 1998), pp. 138-143.
12. D. Young, “Economic Value Added: A Primer for European Managers,” European ManagementJournal, 15/4 (August 1997): 335-343.
13. Klausner et al., op. cit.
Reverse Supply Chains for Commercial Returns
CALIFORNIA MANAGEMENT REVIEW VOL. 46, NO.2 WINTER 200422