Embed Size (px)
Citation preview
Running Head: BLACK-WHITE SUMMER LEARNING GAPS
Black-White Summer Learning Gaps: Interpreting the Variability of Estimates across
Representations
David M. Quinn
Harvard Graduate School of Education
Email: [email protected]
Quinn, D.M. (2015). Black-white summer learning gaps: Interpreting the variability of estimates
across representations. Educational Evaluation and Policy Analysis, 37(1), 50-69.
doi: 10.3102/0162373714534522
The final, definitive version is available at http://eepa.aera.net
I am grateful to Andrew Ho, James Kim, Richard Murnane, Felipe Barrera-Osorio, Celia Gomez,
and three anonymous reviewers for comments on drafts of this paper. All errors are my own.

BLACK-WHITE SUMMER LEARNING GAPS
1
Abstract
The estimation of racial test score gap trends plays an important role in monitoring educational
equality. Documenting gap trends is complex, however, and estimates can differ depending on
the metric, modeling strategy, and psychometric assumptions. The sensitivity of summer
learning gap estimates to these factors has been under-examined. Using national data, I find
black-white summer gap trends ranging from a significant relative disadvantage for black
students to a significant relative advantage. Preferred models show no overall gap change the
summer after kindergarten, but black students may make less summer math growth than white
students with similar true spring scores. In estimating gap trends, researchers must recognize
that different statistical models not only carry unique assumptions but answer distinct descriptive
questions.

BLACK-WHITE SUMMER LEARNING GAPS
2
Black-White Summer Learning Gaps: Interpreting the Variability of Estimates across
Representations
The estimation of racial test score gap trends plays an important role in monitoring
educational equality. Gap trend estimation is complex, however, and estimates can differ
depending on the test metric, modeling strategy, consideration of measurement error, and
assumptions made about the interval nature of the test scale (Bond & Lang, 2013; Ho, 2009).
Given the high stakes, it is crucial that researchers who are describing test score gap trends do so
carefully and reasonably, as policymakers are likely to take reported gap trends at face value.
In practice, however, researchers do not always examine the sensitivity of gap trend
estimates to psychometric assumptions or make explicit how modeling choices affect the
interpretation of results. One area in which more clarity is needed along these dimensions is the
study of racial disparities in summer learning. Black-white differences in summer learning may
help explain the gap growth seen over students’ school careers (e.g. Heyns, 1987; Phillips,
Crouse, & Ralph, 1998), but current evidence on summer gap trends is mixed. Some apparent
discrepancies in results may be due to cross-study diversity in modeling strategies.
Researchers have estimated black-white summer gap trends using various methods and
have reached different conclusions (e.g. Cooper, Nye, Charlton, Lindsay, & Greathouse, 1996;
Murnane, 1975; Phillips et al., 1998). Even researchers who have used the same publicly
available, nationally-representative data set – the Early Childhood Longitudinal Study,
Kindergarten class of 1998-1999 (ECLS-K) – have not all reported the same math gap trend (e.g
Burkam, Ready, Lee, & LoGerfo, 2004; Downey, von Hippel, & Broh, 2004). Although the
divergent findings in the ECLS-K studies call attention to the influence that methodological and
psychometric factors have over gap trend estimates, no systematic investigation has been

BLACK-WHITE SUMMER LEARNING GAPS
3
conducted to reveal how sensitive summer gap trend estimates are to a range of reasonable
representations. In this paper, I report the results of such an investigation.
I find that black-white summer gap trend estimates diverge, with estimates ranging from
a significant relative summer disadvantage for black students (compared to white students) to a
significant relative summer advantage for black students. Estimates are most affected by
modeling strategy and assumptions about measurement error. Given the effect of modeling
strategy, it is important that researchers documenting gap trends recognize that different models
not only require unique statistical assumptions, but answer distinct descriptive questions. This
contrasts the approach taken in prior summer gap trend literature, in which the interpretive
differences across models are not explicitly considered. When choosing among plausible gap
trend representations, we must go beyond purely statistical considerations; we must clearly
define our parameter of interest and examine the values and substantive assumptions that might
motivate interest in subtly different gap trend parameters.
I begin by providing motivation for examining black-white summer gap trends along with
an overview of past research. I then describe the methodological and psychometric factors that
influence gap trend estimates, which motivate this study’s research questions. Next, I describe
the strategies for answering these research questions and present gap trend estimates under a
range of reasonable representations. Finally, I discuss the lessons these results suggest for
researchers estimating gap trends, as well as their contributions to our understanding of black-
white summer learning gaps.
Background
Why Study Black-White Summer Gap Trends?

BLACK-WHITE SUMMER LEARNING GAPS
4
At school entry, large math and reading test score gaps exist between black and white
students, and most data suggest these gaps widen as students progress through the elementary
grades (see Reardon & Robinson, 2008; Reardon, Valentino, & Shores, 2012 for reviews). Such
“gap growth” has been observed when operationalized through repeated cross-sectional
comparisons of the same students over time (e.g. Fryer & Levitt, 2004 & 2006) and through gap
estimates that condition on students’ test scores from a prior year (e.g. Reardon 2008a &
2008b). Racial differences in summer learning may help explain such gap growth; however,
evidence on black-white gaps in summer learning has been mixed.
Heyns (1987) argued that “the entire racial gap in reading achievement is due to…‘small
differences’ in summer learning.” (p. 1158). In contrast, Cooper et al. (1996) concluded in their
meta-analysis that the black-white reading gap did not grow over the summer. The role of
summer vacation in black-white math gap trends has been similarly contested, with studies
reaching the conflicting conclusions that the math gap widens over the summer (Phillips et al.,
1998), that the math gap does not change over the summer (Cooper et al., 1996; Murnane, 1975),
and that black students’ math skills improve more over the summer than do white students’ math
skills (Ginsberg, Baker, Sweet, & Rosenthal, 1981; Klibanoff & Haggard, 1981, as cited in
Cooper et al., 1996).
The most recent nationally-representative evidence on these questions comes from the
Early Childhood Longitudinal Study, Kindergarten class of 1998-1999 (ECLS-K: 1999).
Specifically, the ECLS-K provides data on the summer between kindergarten and first grade.
Researchers have employed various methods to estimate summer gap trends using this data set.
Table 1 reports the findings from these studies, organized by modeling strategy.
<Insert Table 1 Here>

BLACK-WHITE SUMMER LEARNING GAPS
5
As seen in Table 1, none of the ECLS-K studies found a significant summer gap trend for
reading. The one study (Burkam et al., 2004) that found a significant black-white summer math
gap trend detrimental to black students is also the only study that used a change score model with
a pretest covariate (a model which is equivalent to regressing fall score on spring score [Werts &
Linn, 1970]). Although most of these studies adjust for a number of control variables, the
variation in math gap trend estimates is not simply the story of a gap trend disappearing when
more covariates are added. For example, Burkam et al. (2004) found a significant math gap
trend while controlling for socioeconomic status (SES); yet Fryer and Levitt (2004) reported a
non-significant gap trend while making unadjusted cross-sectional comparisons. This raises the
suspicion that summer gap trend estimates are sensitive to modeling choices – or to the way that
the gap trend question is operationalized – and provides motivation for the present study.
Adjusted Versus Unadjusted Black-White Gap Estimates
The common use of SES-related covariates in studies of racial summer gap trends raises
questions about the roles of adjusted versus unadjusted gap estimates. Many of the early studies
on racial summer learning gaps effectively controlled for SES by employing economically
homogeneous samples (Cooper et al., 1996). In later studies, researchers explicitly included SES
measures in their models (e.g. Alexander, Entwisle, & Olsen, 2001; Entwisle & Alexander,
1992). In this paper, however, I estimate unadjusted gap trends for the following reasons.
First, as discussed above, this paper is motivated in part by the possibility that differences
in summer learning explain the persistence, and possible growth, of black-white test score gaps.
The studies that document gap growth typically report unadjusted gaps, making raw summer gap
trends the appropriate comparison. More substantively, interest in unadjusted gap trends stems
from the very fact that the omitted covariates likely represent the mechanisms responsible for the

BLACK-WHITE SUMMER LEARNING GAPS
6
gaps in the first place. Black-white inequalities in SES-related measures are the legacy of
slavery and racism in the United States (Wilson, 2009) and it is important to acknowledge the
full extent of their impact. While multivariate analyses can provide evidence about the
mechanisms behind test score gaps, the task of explaining gaps should be kept conceptually
distinct from the task of describing them; by blurring the lines between description and
explanation, we risk glossing over the racial element of inequality.
Why Might Summer Learning Differences Exist?
Entwisle, Alexander, and Olson (2000) proposed the “faucet theory” to explain summer
gap trends. According to this theory, the “resource faucet” is on for all students during the
school year, but over the summer, students from disadvantaged backgrounds lose access to many
resources that remain available to more advantaged students. These may be material or financial
resources which, among other things, enable access to cognitively-stimulating summer activities;
or they may be human capital resources such as parental education (Borman, Benson, &
Overman, 2005). Some researchers have argued that differences in the quality and quantity of
students’ summer enrichment activities are explained by unequal access to material resources
(Chin & Phillips, 2004), while others have argued that upper-and middle-class parents
proactively “cultivate” their children’s cognitive development while lower-class parents do not
(Cheadle, 2008; Lareau, 2011).
Describing Test Score Gap Trends
Recent methodological work has emphasized that gap trends can be sensitive to the
choices that researchers make in modeling the gap trend, selecting among test scales, making
assumptions about the interval-nature of the test scale, and addressing (or not addressing)
measurement error in the test (Bond & Lang, 2013; Ho, 2009). This study examines the

BLACK-WHITE SUMMER LEARNING GAPS
7
sensitivity of black-white summer math and reading gap trends to a range of reasonable choices
along these dimensions.
Modeling. In the substantive literature, researchers often emphasize the statistical
considerations relevant to choosing a gap trend modeling strategy without explicit discussion of
how the interpretation of the parameter estimate changes across models (e.g. Phillips et al., 1998;
Downey et al., 2004; Burkam et al., 2004). In the context of gap trend measurement, different
modeling strategies should be understood as answering conceptually distinct descriptive
questions. When results differ across estimation strategies, then, these “discrepancies” can be
understood as answers to different questions. This section describes these differences.
“Change in gaps” and “differences in changes” measures. To examine how racial test
score gaps change from time 1 to time 2 within a stable sample of students, we could calculate
the difference between the gaps at each time point (the “change in gaps” or Δ𝐺 [Ho, 2009]) or
compare the average test score change from time 1 to time 2 for each group (the “difference in
changes” or Δ𝑇 [Ho, 2009]). When using an unstandardized test metric, both methods yield the
same result. However, because unstandardized gaps are often difficult to interpret, standardized
gaps are more commonly reported. With such measures, the choice of standard deviation unit “is
both judgmental and consequential” (Ho, 2009, p. 209).
A natural choice for the Δ𝐺 method is to standardize each cross-sectional gap by the
pooled time-specific standard deviation unit:
Δ𝐺𝐸𝑆 = 𝐺𝐸𝑆2 − 𝐺𝐸𝑆1 =�̅�𝑎2−�̅�𝑏2
𝑆(𝑎2,𝑏2)−
�̅�𝑎1−�̅�𝑏1
𝑆(𝑎1,𝑏1),
where a and b index the racial group, 1 and 2 index the time point, and 𝑆(𝑎𝑡,𝑏𝑡) is the pooled
standard deviation across groups at time t (Ho, 2009). A natural choice for the Δ𝑇 method is to

BLACK-WHITE SUMMER LEARNING GAPS
8
standardize each group’s test score change by the standard deviation pooled across time within
group:
Δ𝑇𝐸𝑆 = 𝑇𝐸𝑆𝑎− 𝑇𝐸𝑆𝑏
= �̅�𝑎1−�̅�𝑎2
𝑆(𝑎1,𝑎2)−
�̅�𝑏1−�̅�𝑏2
𝑆(𝑏1,𝑏2),
where 𝑆(𝑎1,𝑎2) is the pooled standard deviation for group a across times 1 and 2 (Ho, 2009).
When the four standard deviations (𝑎1, 𝑎2, 𝑏1, 𝑏2) are equal, Δ𝐺𝐸𝑆 and Δ𝑇𝐸𝑆 are
equivalent. If the four standard deviations are not equal, potentially unintuitive results may
follow. For example, if the difference in group means is equal at each time point (that is, if
�̅�𝑎2 − �̅�𝑏2 = �̅�𝑎1 − �̅�𝑏1), the Δ𝐺𝐸𝑆 measure will nevertheless suggest a widening gap if the
variance is larger at time 1, and will suggest a narrowing gap if the variance is larger at time 2
(analogous results can occur for Δ𝑇𝐸𝑆). One can instead choose a single standard deviation for
each denominator, such as the pooled standard deviation across time points and groups or the
advantaged group’s standard deviation at time 1; however, there is no clear universally-
applicable criterion for choosing a standard deviation unit (Ho, 2009).
Regressor variable models and change score models. Gap trends can also be
represented in a regression framework, using a “regressor variable” model or a “change score”
model (Allison, 1990). In the regressor variable method, time 2 scores are regressed on time 1
scores along with a group indictor variable. In the context of a racial achievement gap, this
model answers the question, “Do students of different races who share the same time 1 score
have different scores at time 2, on average?” One benefit of the regressor variable model is that
the time 1 and time 2 tests need not be on the same scale. This is particularly useful when gap
trends are estimated over a long period of time, when the vertical scaling of a test is most
questionable (McCaffrey, Lockwood, Koretz, & Hamilton, 2003).

BLACK-WHITE SUMMER LEARNING GAPS
9
If one can assume the time 1 and time 2 tests share a common scale, a change score
model can be fit. In a change score model, the outcome is the difference between a student’s
time 2 score and time 1 score. In the context of racial achievement gaps, the change score model
addresses the question, “Do students of different races make different amounts of growth over a
given period of time, on average?” (Mullens, Murnane, & Willett, 1996). When unstandardized
scores are used, change score models produce the same results as Δ𝑇 and Δ𝐺.
In what is known as “Lord’s paradox,” (Holland, 2005; Lord, 1967) the change score
model and the regressor variable model can yield seemingly contradictory results when groups
have different true mean scores at time 1. Lord’s (1967) initial example of the phenomenon
described a quasi-experimental study in which two non-equivalent groups showed no mean
change on a measure from time 1 to time 2. While a change score model showed no group
difference in change, a regressor variable model showed a group difference at time 2, controlling
for the time 1 measure. To see how this can happen mathematically, consider that the coefficient
on the group indicator in the change score model is �̅�𝑎2 − �̅�𝑏2 − (�̅�𝑎1 − �̅�𝑏1), where letters index
groups and numbers index time points. In the regressor variable model, the coefficient on the
group indicator is �̅�𝑎2 − �̅�𝑏2 − 𝑏(�̅�𝑎1 − �̅�𝑏1), where b is the regression coefficient for the time 1
measure from the same model. Because of inherent instability in the measure of Y, b will usually
fall between 0 and 1. Consequently, compared to the change score model, the regressor variable
model will subtract out less from the group difference at time 2 (Allison, 1990). This also
illustrates that the change score model is equivalent to a regressor variable model in which the
coefficient on the time 1 measure is constrained to be 1 (Allison, 1990). In a quasi-experimental
setting, resolving Lord’s paradox is a matter of choosing the model whose statistical assumptions
BLACK-WHITE SUMMER LEARNING GAPS
10
most closely match reality. In a descriptive study, the resolution lies in recognizing that the
models answer different questions.
Measurement error. The effect of measurement error on gap trend estimates can best
be understood by first considering that each person’s observed test score is a function of both his
or her true score and an error term. The true score is defined as the individual’s expected score
over many test administrations of equivalent test forms without effects of fatigue, memory, or
learning or forgetting (Crocker & Algina, 1986). It follows from this formulation that the
variance of observed test scores is equal to or greater than the variance of true scores.
Consequently, mean group differences that are standardized by observed score standard
deviation units will be smaller than mean group differences that are standardized by true score
standard deviation units.
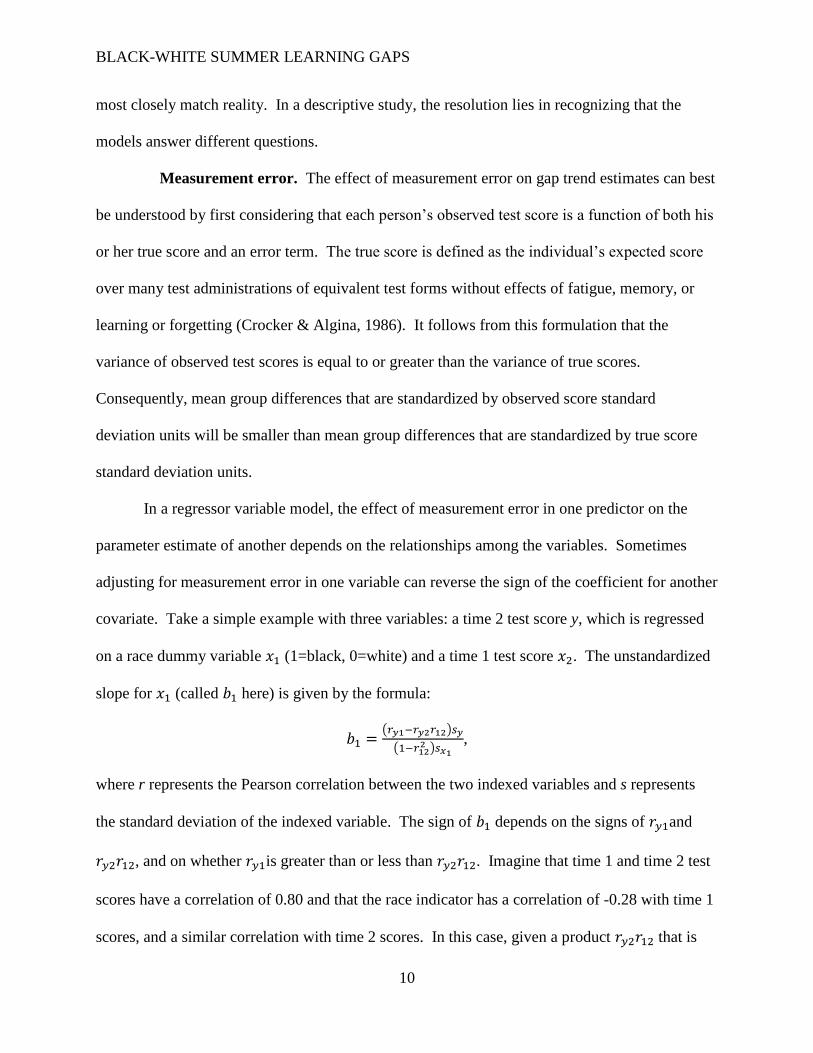
In a regressor variable model, the effect of measurement error in one predictor on the
parameter estimate of another depends on the relationships among the variables. Sometimes
adjusting for measurement error in one variable can reverse the sign of the coefficient for another
covariate. Take a simple example with three variables: a time 2 test score y, which is regressed
on a race dummy variable 𝑥1 (1=black, 0=white) and a time 1 test score 𝑥2. The unstandardized
slope for 𝑥1 (called 𝑏1 here) is given by the formula:
𝑏1 =(𝑟𝑦1−𝑟𝑦2𝑟12)𝑠𝑦
(1−𝑟122 )𝑠𝑥1
,
where r represents the Pearson correlation between the two indexed variables and s represents
the standard deviation of the indexed variable. The sign of 𝑏1 depends on the signs of 𝑟𝑦1and
𝑟𝑦2𝑟12, and on whether 𝑟𝑦1is greater than or less than 𝑟𝑦2𝑟12. Imagine that time 1 and time 2 test
scores have a correlation of 0.80 and that the race indicator has a correlation of -0.28 with time 1
scores, and a similar correlation with time 2 scores. In this case, given a product 𝑟𝑦2𝑟12 that is

BLACK-WHITE SUMMER LEARNING GAPS
11
greater than -0.28, 𝑏1 will be negatively signed; if the product of 𝑟𝑦2𝑟12 is less than -0.28, 𝑏1 will
be positively signed. Because adjusting for measurement error in the spring test disattenuates its
correlation with race (i.e., makes the correlation more negative), adjusting for measurement error
in the time 1 test could make the product 𝑟𝑦2𝑟12 less than -0.28, thereby reversing the sign of the
conditional gap estimate 𝑏1.
Without correction for measurement error, the regressor variable model answers the
question, “Is there a racial gap at time 2 between students who share the same observed time 1
score?” A model that corrects for measurement error replaces “observed time 1 score” with
“true time 1 score.”
Test metrics. Because each of the above gap measures is based on some mean
difference between groups, each requires the assumption that the test metric is interval-scaled
(Spencer, 1983). However, given that an achievement test is designed to measure a latent
construct (e.g. one’s math or reading ability), it is not possible to completely confirm that any
given scale measures the unobserved construct in equal intervals. If a test scale is not interval,
the interpretation of a gap expressed in terms of mean differences is unclear because units do not
correspond to the same “amount” of the construct at each point along the scale (Ballou, 2009).
Furthermore, if we cannot know whether a test scale is interval, we have no basis on which to
prefer one scale over another plausible nonlinear transformation of the scale. This is problematic
because nonlinear transformations of scale may change the magnitude, or even the sign, of a test
score gap (Ho, 2009; Spencer, 1983).
Variation in Black-White Gap Trend Estimates
Past work using the ECLS-K has shown how the above factors affect kindergarten
school-year gap trend estimates. Reardon’s (2008a, 2008b) results demonstrate that over the

BLACK-WHITE SUMMER LEARNING GAPS
12
kindergarten school year, the math gap could grow by 0.04 to 0.10 standardized units, depending
on the metric and assumptions. Estimates of gap growth in reading over kindergarten have
ranged from 0.01 (Reardon, 2008a) to 0.05 (Fryer & Levitt, 2004). Over the course of
elementary school, cross-sectional gap comparisons (from fall of kindergarten to spring of fifth
grade) demonstrate gap growth ranging from 0.15 to 0.35 standard deviation units for math and
from 0.23 to 0.39 for reading (Reardon, 2008a). Depending on the test scale and assumed
reliability of the kindergarten test, estimates of standardized fifth grade spring gaps conditional
on fall of kindergarten scores range from -0.65 to -0.24 for math and -0.67 to -0.35 for reading
(Reardon, 2008a).
Summary and Research Questions
Test score gap trend estimates can differ depending on choices of modeling, test scale,
and whether measurement error is accounted for. Given the role that these estimates play in
policy and research, it is important that researchers are thoughtful about the gap trends estimates
they report and explicit about their interpretations. Widening gaps over the summer may play a
role in the growth of black-white gaps over the elementary years, but research on black-white
summer gap trends has been mixed. The sensitivity of summer gap trend estimates to the above
factors is not well understood, and differences in estimation methods may explain the mixed
findings across studies. A methodological investigation in this area will allow for a more
informed judgment on the substantive question of racial differences in summer learning.
In this paper, I use data from the ECLS-K to ask: “To what extent do black-white
summer gap trend estimates differ by: 1) the modeling strategy, 2) the test metric, 3) the interval
test scale assumption, and 4) the handling of measurement error?” I interpret the differences in

BLACK-WHITE SUMMER LEARNING GAPS
13
results across models, discuss lessons for researchers addressing gap trends generally, and
consider substantive implications regarding black-white summer learning differences.
Methods
Sample
The ECLS-K followed a nationally-representative sample of students from kindergarten
to eighth grade. A random 30% subsample was chosen for round 3 testing, during which most
students were beginning the first grade. In this paper, I use data from only non-Hispanic white
students and non-Hispanic black students and remove students without round 2 (spring of
Kindergarten) or round 3 test scores, as well as students who attended year-round schools.
Additionally, in order to adjust test scores by test date (explained below), I remove students
without information on their test administration date, school start/end date, or with implausible
or extreme test dates (see Appendix A for details; results from models using all students are
similar, and are available upon request).
Test Scales
For each wave of data collection in the ECLS-K, students were orally administered test
questions in reading and math. In order to avoid floor and ceiling effects, students were first
given a set of routing items that determined the difficulty of the test questions they would
answer. Students’ latent ability 𝜃𝑖𝑡 was then estimated using a three-parameter item response
theory (IRT) model. In recent data releases, the ECLS-K has included students’ 𝜃 scores, along
with “scale scores,” which are a non-linear transformation of the 𝜃 scores estimating the number
of items the student would have answered correctly had he or she been asked all test questions
(Tourangeau, Nord, Le, Sorongon & Najarian, 2009). Although many researchers have used the
scale scores for longitudinal analysis, this metric is not well-suited for comparing learning rates

BLACK-WHITE SUMMER LEARNING GAPS
14
of students over time (Reardon, 2008b). In this metric, students’ scores – and their “distance”
from other students – depend on the questions that happen to be included on the test and the
difficulty of those questions for the sampled students (Reardon, 2008b). In contrast, if the IRT
model assumptions hold, students’ 𝜃 estimates should not depend on the particular test questions
or the abilities of other test-takers (Ballou, 2009). While 𝜃 is my preferred test scale from a
substantive perspective, I present results using both 𝜃 scores and scale scores in order to test the
sensitivity of gap trend estimates.
Accounting for Test Date
As with most research on summer learning, one challenge with the ECLS-K data
concerns the dates at which tests were administered. While the purpose of testing students in the
spring and fall was to measure summer learning, in actuality, these tests also capture some
school-year learning. To adjust for this, I use projected test scores. Appendix A describes the
projection method and Appendix B includes results based on observed scores (in the preferred 𝜃
meteric, results using observed scores show a pattern similar to that seen with projected scores).
Analytic Plan
I estimate black-white math and reading summer gap trends using six approaches: 1) the
change in gaps measure (Δ𝐺𝐸𝑆, employing multiple standardization methods), 2) the difference
in changes measure (Δ𝑇𝐸𝑆, employing multiple standardization methods), 3) an ordinal change in
gaps measure (Δ𝑉), 4) the regressor variable model (with and without accounting for
measurement error), 5) local-standardization regression models (with and without accounting for
measurement error), and 6) a change score model. All models incorporate the sampling weight
C23CW0 and adjust standard errors to account for the multistage sampling design (results from
models that instead cluster standard errors at the school level support the same inferences).
BLACK-WHITE SUMMER LEARNING GAPS
15
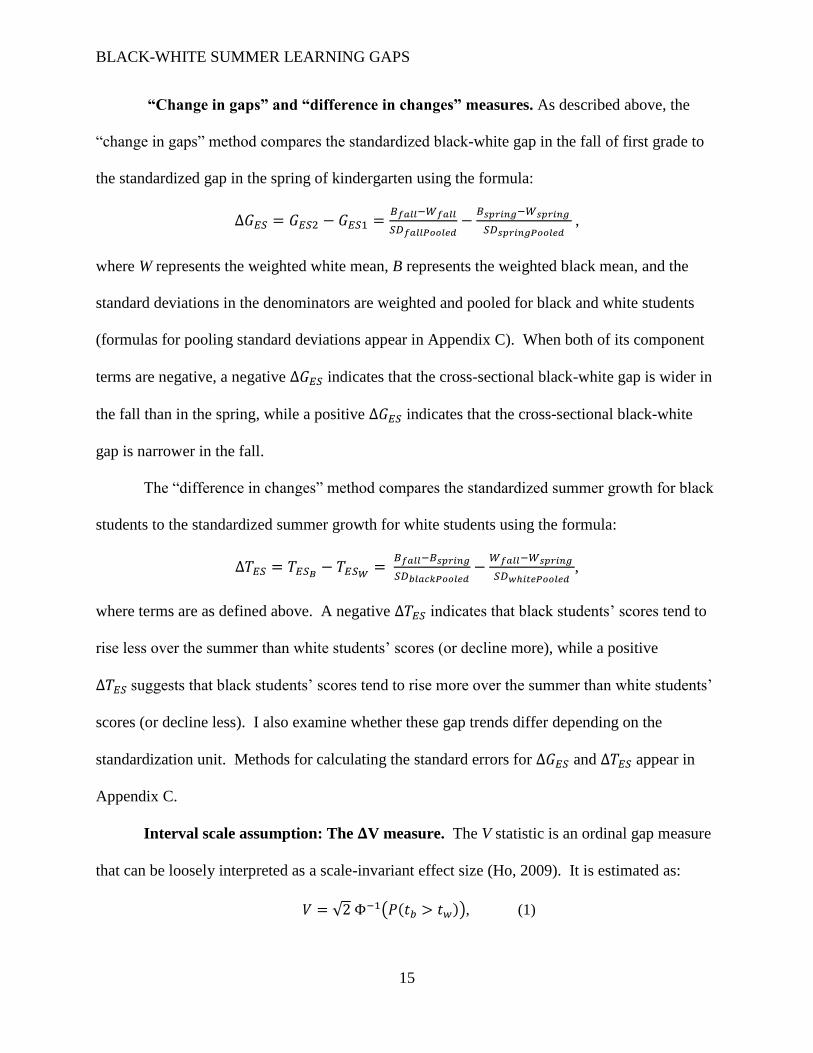
“Change in gaps” and “difference in changes” measures. As described above, the
“change in gaps” method compares the standardized black-white gap in the fall of first grade to
the standardized gap in the spring of kindergarten using the formula:
Δ𝐺𝐸𝑆 = 𝐺𝐸𝑆2 − 𝐺𝐸𝑆1 =𝐵𝑓𝑎𝑙𝑙−𝑊𝑓𝑎𝑙𝑙
𝑆𝐷𝑓𝑎𝑙𝑙𝑃𝑜𝑜𝑙𝑒𝑑−
𝐵𝑠𝑝𝑟𝑖𝑛𝑔−𝑊𝑠𝑝𝑟𝑖𝑛𝑔
𝑆𝐷𝑠𝑝𝑟𝑖𝑛𝑔𝑃𝑜𝑜𝑙𝑒𝑑 ,
where W represents the weighted white mean, B represents the weighted black mean, and the
standard deviations in the denominators are weighted and pooled for black and white students
(formulas for pooling standard deviations appear in Appendix C). When both of its component
terms are negative, a negative Δ𝐺𝐸𝑆 indicates that the cross-sectional black-white gap is wider in
the fall than in the spring, while a positive Δ𝐺𝐸𝑆 indicates that the cross-sectional black-white
gap is narrower in the fall.
The “difference in changes” method compares the standardized summer growth for black
students to the standardized summer growth for white students using the formula:
Δ𝑇𝐸𝑆 = 𝑇𝐸𝑆𝐵− 𝑇𝐸𝑆𝑊
= 𝐵𝑓𝑎𝑙𝑙−𝐵𝑠𝑝𝑟𝑖𝑛𝑔
𝑆𝐷𝑏𝑙𝑎𝑐𝑘𝑃𝑜𝑜𝑙𝑒𝑑−
𝑊𝑓𝑎𝑙𝑙−𝑊𝑠𝑝𝑟𝑖𝑛𝑔
𝑆𝐷𝑤ℎ𝑖𝑡𝑒𝑃𝑜𝑜𝑙𝑒𝑑,
where terms are as defined above. A negative Δ𝑇𝐸𝑆 indicates that black students’ scores tend to
rise less over the summer than white students’ scores (or decline more), while a positive
Δ𝑇𝐸𝑆 suggests that black students’ scores tend to rise more over the summer than white students’
scores (or decline less). I also examine whether these gap trends differ depending on the
standardization unit. Methods for calculating the standard errors for Δ𝐺𝐸𝑆 and Δ𝑇𝐸𝑆 appear in
Appendix C.
Interval scale assumption: The 𝚫V measure. The V statistic is an ordinal gap measure
that can be loosely interpreted as a scale-invariant effect size (Ho, 2009). It is estimated as:
𝑉 = √2 Φ−1(𝑃(𝑡𝑏 > 𝑡𝑤)), (1)

BLACK-WHITE SUMMER LEARNING GAPS
16
where Φ−1 is the inverse of the standard normal cumulative distribution function and 𝑃(𝑡𝑏 > 𝑡𝑤)
is the probability that a randomly chosen black student will have a higher score than a randomly
chosen white student. Because V treats test scores as ordinal, it is invariant to monotonic scale
transformations and does not require the interval scale assumption; it requires only the
assumption that the test score distributions of the two groups can be transformed to normal (Ho,
2009). When the test score distributions of the two groups are normal, V equals Cohen’s d (Ho
& Reardon, 2012).
While V represents a cross-sectional gap, a gap change can be represented as:
Δ𝑉 = 𝑉2 − 𝑉1 = √2 Φ−1(𝑃(𝑡𝑏 > 𝑡𝑤)2) − √2 Φ−1(𝑃(𝑡𝑏 > 𝑡𝑤)1), (2)
where the numerical subscripts represent the first and second time points (the methods for
incorporating sampling weights and calculating Δ𝑉 standard errors are described in Appendix
C).1
Conditional status models.
Regressor variable models. The regressor variable models take the general form:
𝐹𝑖 = 𝑓(𝑆𝑖) + δ𝐵𝑖 + 𝜖𝑖, (3)
where 𝐹𝑖 is student i’s fall of first grade test score, 𝑆𝑖 is student i’s spring of kindergarten score, 𝑓
is some continuous function (with quadratic terms as needed), 𝐵𝑖 is a dichotomous indicator for
race (1=student is black, 0=student is white), and 𝜖𝑖 is an error term. The spring and fall scores
in these models are standardized using the spring mean and standard deviation (of the black-
white sample, using sampling weights). A negatively-signed 𝛿 indicates that a black student will
have a lower predicted fall score than a white student with an identical spring score.2
Local standardization. An assumption of the regressor variable model is that the mean
fall black-white difference is the same at each point along the spring test score distribution, as is
BLACK-WHITE SUMMER LEARNING GAPS
17
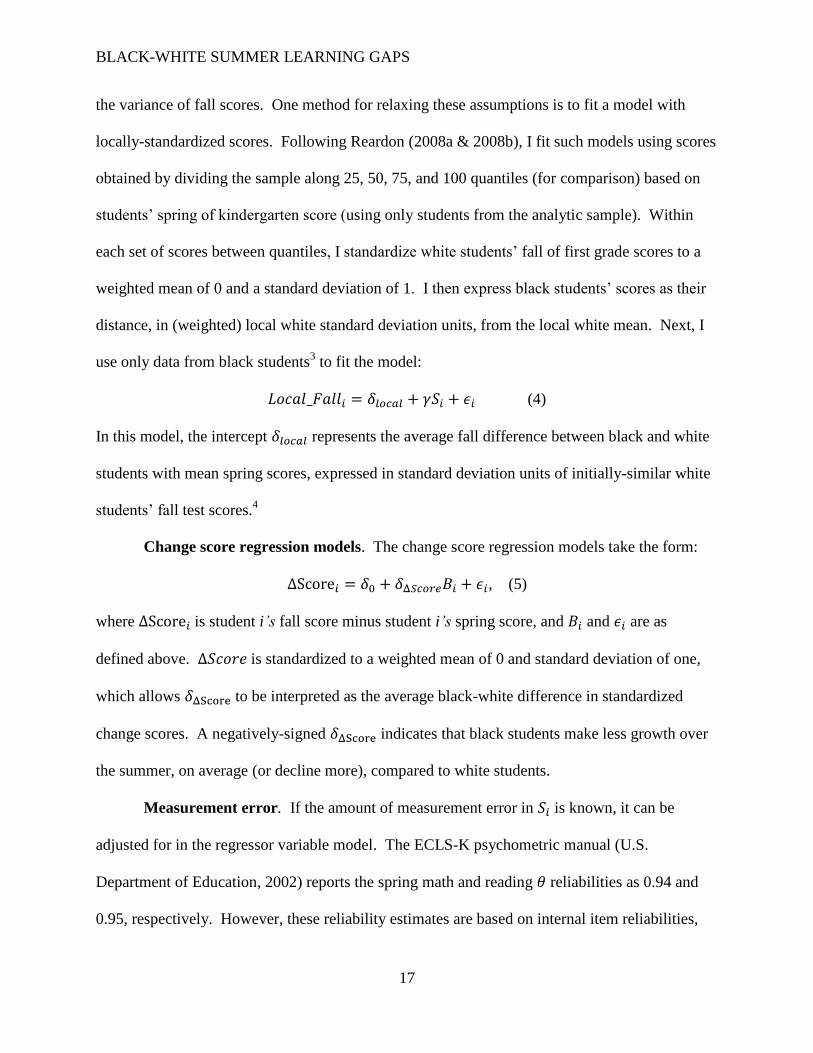
the variance of fall scores. One method for relaxing these assumptions is to fit a model with
locally-standardized scores. Following Reardon (2008a & 2008b), I fit such models using scores
obtained by dividing the sample along 25, 50, 75, and 100 quantiles (for comparison) based on
students’ spring of kindergarten score (using only students from the analytic sample). Within
each set of scores between quantiles, I standardize white students’ fall of first grade scores to a
weighted mean of 0 and a standard deviation of 1. I then express black students’ scores as their
distance, in (weighted) local white standard deviation units, from the local white mean. Next, I
use only data from black students3 to fit the model:
𝐿𝑜𝑐𝑎𝑙_𝐹𝑎𝑙𝑙𝑖 = 𝛿𝑙𝑜𝑐𝑎𝑙 + 𝛾𝑆𝑖 + 𝜖𝑖 (4)
In this model, the intercept 𝛿𝑙𝑜𝑐𝑎𝑙 represents the average fall difference between black and white
students with mean spring scores, expressed in standard deviation units of initially-similar white
students’ fall test scores.4
Change score regression models. The change score regression models take the form:
ΔScore𝑖 = 𝛿0 + 𝛿Δ𝑆𝑐𝑜𝑟𝑒𝐵𝑖 + 𝜖𝑖, (5)
where ΔScore𝑖 is student i’s fall score minus student i’s spring score, and 𝐵𝑖 and 𝜖𝑖 are as
defined above. Δ𝑆𝑐𝑜𝑟𝑒 is standardized to a weighted mean of 0 and standard deviation of one,
which allows 𝛿ΔScore to be interpreted as the average black-white difference in standardized
change scores. A negatively-signed 𝛿ΔScore indicates that black students make less growth over
the summer, on average (or decline more), compared to white students.
Measurement error. If the amount of measurement error in 𝑆𝑖 is known, it can be
adjusted for in the regressor variable model. The ECLS-K psychometric manual (U.S.
Department of Education, 2002) reports the spring math and reading 𝜃 reliabilities as 0.94 and
0.95, respectively. However, these reliability estimates are based on internal item reliabilities,

BLACK-WHITE SUMMER LEARNING GAPS
18
which only account for error due to item sampling; test-retest reliabilities are likely lower
(Reardon, 2008a). While spring-fall correlations for projected test scores are close to 0.80 for
math (0.78 for scale scores, 0.80 for 𝜃) and close to 0.90 for reading (0.88 for scale, 0.86 for 𝜃)5,
these may not be reasonable reliability estimates due to the lengthy time period between tests.
Specifically, these correlations will overestimate test reliability if students with higher true
spring ability learn more over the summer compared to students with lower true spring ability,
and will underestimate reliability if students with higher true ability in the spring learn less over
the summer than students with lower true spring ability (Reardon, 2008a). I therefore adjust for
measurement error in the regressor variable models under a range of assumed reliabilities: 0.90,
0.80, and 0.70.
To adjust (from model 3) for measurement error in 𝑆𝑖, I use Kelley’s formula for
estimating true scores (Kelley, 1947, as cited by Maassen, 2000):
𝜏𝑆𝑖 ̂ = 𝜌𝑠𝑠𝑆𝑖 + (1 − 𝜌𝑠𝑠)𝑆̅ (6)
Here, 𝜌𝑠𝑠 is the assumed reliability of the test, 𝑆𝑖 is student i’s observed spring score, and 𝑆̅ is the
sample mean spring score. I apply this formula to spring scores separately for black and white
students (using the weighted black or white mean). I then refit model 3 using the measurement-
error-adjusted spring score in place of the observed spring score. I also refit the local-
standardization models (model 4) using measurement error-adjusted spring scores as a predictor
and new locally-standardized fall scores as the outcome.
Results
Descriptive Statistics
Table 2 displays weighted descriptive statistics by race and testing season for the 𝜃 and
scale score metrics, including both the observed scores and projected scores (which are used in

BLACK-WHITE SUMMER LEARNING GAPS
19
the main analyses). Recall that both the spring and fall scores are standardized against the spring
mean and standard deviation. As seen in the table, black and white students experience a similar
number of school days and summer vacation days between tests.
Projected scores were highly correlated with observed scores (r=0.99 for all tests,
metrics, and test administrations; correlation matrices available on request). Spring gaps
(calculated by regressing standardized projected scores on the Black indicator variable, not
shown) were -0.70 (𝜃) or -0.65 (scale score) for math and -0.53 (𝜃) or -0.45 (scale score) for
reading.
<Insert Table 2 Here>
Gap Trend Estimates
Figures 1 and 2 display bar graphs of the math and reading gap trend estimates,
respectively, across all models, metrics, and assumed reliabilities. As seen in the figures, gap
trend estimates vary. Estimates for both outcomes change sign and significance levels, but the
majority of math estimates are negative (suggesting a relative summer disadvantage for black
students), while the majority of reading estimates are positive.
<Insert Figures 1 and 2 Here>
Test scale. As seen in Figures 1 and 2, for any given model, the preferred 𝜃 metric
generally shows gap trends that are somewhat less favorable to black students than those in the
scale score metric. Changing the test scale sometimes changes the sign or statistical significance
of an estimate, though never both at once. Here, choice of metric seems to matter somewhat
more for reading than for math; while the effect of metric is relatively modest in many models,
the most extreme example (see Table 4) shows a conditional reading 𝜃 gap that is roughly five
times the size of the corresponding scale score gap.

BLACK-WHITE SUMMER LEARNING GAPS
20
Modeling strategy and interval scale assumption.
𝚫𝐆𝐄𝐒, 𝚫𝑻𝑬𝑺, and 𝚫𝑽. Table 3 displays the Δ𝐺𝐸𝑆, Δ𝑇𝐸𝑆, and Δ𝑉 math and reading gap
trend estimates. For Δ𝐺𝐸𝑆 and Δ𝑇𝐸𝑆, I present results using the 𝜃 and scale score metrics with
different standardization units (recall that Δ𝑉 is invariant to monotonic scale transformations,
resulting in equivalent Δ𝑉 gaps across scales). The math gap trends are generally negatively
signed and small in magnitude, while the reading gap trends are generally positively signed and
small in magnitude. At 0.08, the reading scale score Δ𝐺𝐸𝑆 (with sd pooled across groups) is
much larger than the other reading gap trends, and is the only statistically significant estimate.
The ordinal ΔV gap trend estimates (-0.02 for math; +0.02 for reading) are similar to their
respective 𝜃 Δ𝐺𝐸𝑆 gap trend estimates using scores standardized by the pooled across-group,
within-time standard deviations. This is not surprising, given that the 𝜃 distributions are close to
normal.
<Insert Table 3 Here>
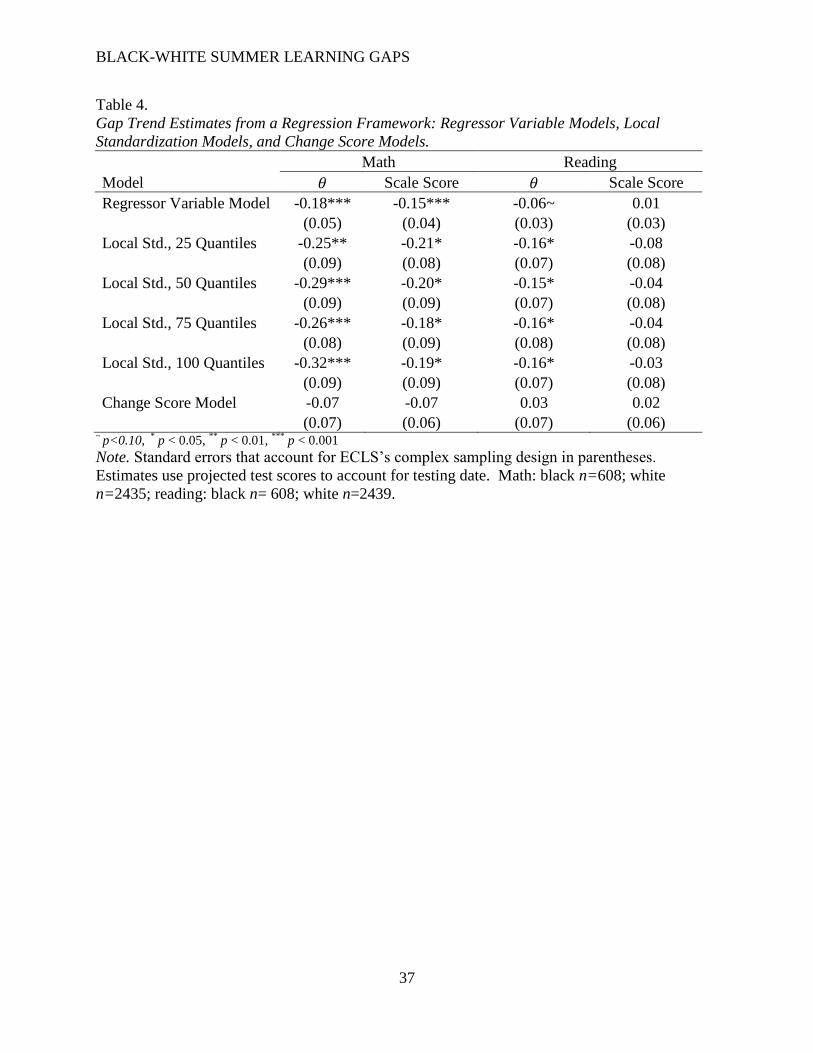
Conditional status and change score models. Table 4 presents the gap trend estimates
from the regression framework: the conditional status models (regressor variable and local
standardization) and the change score models. These models demonstrate an instance of Lord’s
paradox: the regressor variable model estimates differ from the change score model estimates.
The change score models show that black and white students make statistically equivalent math
growth over the summer (-0.07, p=0.30); while the regressor variable models show that a black
student is expected to have a lower fall math score than a white student who shares the same
spring score (𝜃 gap= -0.18, p<0.001). Similarly for reading, the regressor variable model shows
a negatively signed, marginally significant conditional gap (𝜃 gap= -0.06, p=0.10), while the
change score model gives a positively signed, non-significant growth difference (0.03, p=0.65).

BLACK-WHITE SUMMER LEARNING GAPS
21
For both math and reading, the locally-standardized conditional gap estimates are the
largest. Within subject, estimates are similar across the range of quantile bands for a given
metric. In reading, the conditional gap estimates range from a statistically significant -0.16
(p=0.03) in the 𝜃 metric to -0.03 (p=0.69) in the scale score metric. For math, locally-
standardized conditional gap estimates (which are all statistically significant) range from -0.18 to
-0.32 across metrics and number of quantile bands.
<Insert Table 4 Here>
Adjusting for measurement error. Table 5 presents the conditional gap estimates with
adjustments made for measurement error in spring scores. I include results under a variety of
reliability assumptions: 1.0 (replicating estimates from Table 4), 0.90, 0.80, and 0.70. These
results show that both the sign and significance of the conditional fall gaps are sensitive to
assumptions about spring test reliability. As assumed reliabilities decrease, conditional math gap
estimates become positively signed and marginally significant (in the scale score metric);
conditional reading gap estimates become positively signed and statistically significant (in both
metrics).
<Insert Table 5 Here>
Table 6 provides conditional gap estimates under a range of assumed reliabilities using
locally-standardized test scores (shown here for 75 quantiles; results from other bandwidths are
similar). The same pattern from Table 5 appears, but more pronounced; here, conditional math
gap estimates range from a significant -0.26 (using 𝜃 scores and perfect reliability) to a
significant +0.24 (using scale scores and reliability of 0.70). Conditional reading gaps range
from a significant -0.16 (using 𝜃 scores and perfect reliability) to a significant + 0.30 (using scale
scores and reliability of 0.70).

BLACK-WHITE SUMMER LEARNING GAPS
22
<Insert Table 6 Here>
Discussion
This study addressed the question, “To what extent do black-white summer gap trend
estimates differ by: 1) the modeling strategy, 2) the test metric, 3) the interval test scale
assumption, and 4) the handling of measurement error?” Results show that summer gap trend
estimates differ in direction, magnitude, and statistical significance across various reasonable
representations. While relatively little of the overall variation in gap trend estimates stemmed
from the test metric in this case, metric sometimes switched the sign or statistical significance of
an estimate from a given model (though never both at once, and more often for reading than for
math). By comparing the Δ𝑉 gap trend estimates to the Δ𝐺𝐸𝑆 estimates, we see that ordinal and
interval test scale assumptions generally yield similar results with these metrics, particularly for
𝜃. Estimates varied the most under different modeling strategies (e.g. change score models vs.
regressor variable models) and assumed test reliabilities.
The sign-switching of summer gap trend estimates across models and metrics contrasts
Reardon’s (2008a & 2008b) findings regarding kindergarten school-year gap trends, in which
spring gaps were always larger than fall gaps. While Reardon’s estimates of fifth grade gaps
conditional on kindergarten score consistently showed significant gaps unfavorable to black
students, the absolute differences between his gap estimates assuming perfect reliability and
those assuming a reliability of 0.70 are quite similar to the absolute differences in estimates I
found across analogous models for the summer. Furthermore, I found that conditional fall gaps
were generally larger than Δ𝐺𝐸𝑆 summer gap trends, which parallels Reardon’s findings
regarding gap trends from fall of kindergarten to spring of fifth grade. I therefore focus the
discussion on these issues which seem to matter most: modeling and measurement error.

BLACK-WHITE SUMMER LEARNING GAPS
23
Modeling Strategy
These summer gap trends demonstrate an instance of Lord’s paradox: for both math and
reading, change score models yield small and non-significant learning gaps, while conditional
gap models (unadjusted for measurement error) yield larger and statistically significant (for
math) or marginally significant (for reading) fall gaps. How should we make sense of this?
In a descriptive study, we must frame the problem differently from how previous
discussions of Lord’s paradox have. Lord (1967) and other scholars (Allison, 1990; Holland,
2005; Rubin, Stuart, & Zanutto, 2004; Wainer, 1991) have discussed the paradox in the context
of estimating the causal effect of some intervention in a non-experimental setting. In such
situations, researchers ask questions such as, “What is the causal effect of treatment X on
outcome Y?” (as in Allison, 1990) or “Does the causal effect of the treatment on outcome Y
differ by membership in group X?” (as in Lord, 1967). In both cases, the researcher addresses a
single causal question and must decide which model is best suited for answering that question.
The papers cited above help researchers choose the model that best fits their context by
describing each model’s assumptions.
In a study such as the present one, such guidance is less relevant. The goal here is not to
estimate the causal effect of some treatment, but rather to describe an achievement gap trend. It
is therefore more instructive to think of the models as answering two different questions, and to
consider precisely how the descriptive statements that each model supports differ (Holland,
2005; Wainer, 1991).
Because these models answer different questions in a descriptive context, their results are
not contradictory (as they may be in a quasi-experimental setting). As described above, the
change score models address the question, “On average, do black and white students make

BLACK-WHITE SUMMER LEARNING GAPS
24
different amounts of academic growth over the summer?” The results from these models support
the descriptive statement that black and white students make statistically equivalent academic
growth over the summer. When assuming a common test scale across time, the question
addressed by the regressor variable models can be phrased as, “On average, do black and white
students with identical spring scores make different amounts of academic growth over the
summer?” Leaving measurement error aside for the moment, the results from these models
support the statements that on average, black students make less math growth over the summer
than white students who shared the same spring math score, and that black students’ reading
growth is lower by a marginally significant amount compared to white students with identical
spring reading scores. In the context of estimating a test score gap trend, we should choose the
model that answers the descriptive question of interest.
Different contexts and different interests may call for different descriptive questions.
Under certain conditions (e.g. when the initial test score distributions are identical by race), the
point will be moot because both models will support the same conclusion. However, outside of
such conditions, a recommendation for one model over the other must be informed by an ethical
argument for a particular conception of equality. Are we interested in “unconditional equality”
or “conditional equality”? That is, would we be satisfied with a situation in which, overall, black
and white students make the same amount of academic progress over the summer, even if, when
restricting the comparison to black and white students of similar initial skill, black students make
less growth than white students? This is not a question that statistical theory can answer, and
arguing for a particular theory of equality is beyond the scope of this paper. Nevertheless, for
researchers estimating gap trends, it is important to be precise when interpreting gap trend
BLACK-WHITE SUMMER LEARNING GAPS
25
estimates and to acknowledge that different values give rise to different questions, which are
answered by different models, which may have different implications.
The Effect of Addressing Measurement Error
If observed scores were of greater interest than true scores, we could take the above
descriptive statements about conditional fall status as our final conclusions. While observed
scores may be of more interest under some circumstances, true scores are arguably of greater
interest in the present study. Here, the motivation is to understand how racial inequalities in
particular types of academic knowledge and skills develop or are maintained. From the
conditional models, we therefore hope to learn whether fall gaps exist between black and white
students who had the same true level of knowledge and skill in the spring, as opposed to learning
whether fall gaps exist between black and white students who simply earned the same score on a
particular set of items during a particular test administration. Consequently, measurement error
related to item sampling, test occasion, and test administrator should all be removed from spring
test scores before fitting the conditional models. Unfortunately, we do not have reliability
estimates that account for all of these factors.
If we were to take the spring-fall test correlations as test-retest reliability estimates, we
would conclude that no fall math gap exists between black and white students with similar spring
true scores, and that black students may have higher spring reading scores than white students
with similar true spring scores. This conclusion would also be supported in the presence of a
“Matthew effect” (Stanovich, 1986) in which students with higher true ability learn more over
the summer compared to students with lower true ability (because under a Matthew effect,
spring-fall correlations would overestimate test reliability). However, if students with lower true
spring ability learn more over the summer compared to those with higher true spring ability, the

BLACK-WHITE SUMMER LEARNING GAPS
26
results reported here would support the conclusion that conditional fall math gaps exist that are
unfavorable to black students, while conditional fall reading gaps probably do not exist.
Empirically, it is true that students’ projected spring 𝜃 scores are negatively correlated with their
spring-fall change scores (r= -0.27 for math; r= -0.22 for reading), but it is not possible to
determine the extent to which this simply reflects regression to the mean.
The volatility of gap estimates under different assumptions about test reliability
highlights the importance of test makers providing reliability estimates that go beyond internal
consistency reliability. These results also demonstrate the importance of testing the sensitivity of
gap trend estimates to different reliability assumptions.
Black-White Summer Learning Gaps
Substantively, what do these analyses teach us about black-white summer learning gaps?
The cross-sectional math and reading gaps appear to be no larger in the fall of first grade
compared to the spring of kindergarten, and this result is robust to different assumptions about
the interval nature of the test scales. There also appears to be no difference, on average, in the
amount of math or reading growth made by black and white students during the summer
following kindergarten. This remains true for reading when we condition on spring scores, but
black students may make less math growth than white students with the same spring true score.
However, this math result hinges on untestable reliability assumptions. Collectively, these
results do not provide evidence that summer learning differences contribute to the growth in
cross-sectional black-white gaps across the elementary school years. However, the conditional
fifth grade math gap seen between black and white students with similar kindergarten math skills
may be partly due to differential summer math growth between black and white students who
begin the summer with the same math skills.

BLACK-WHITE SUMMER LEARNING GAPS
27
Overall gap trends. Given that out-of-school experiences seem to lead to large black-
white gaps prior to school entry (Brooks-Gunn, Klebanov, Smith, Duncan, & Lee, 2003; Fryer &
Levitt, 2004; Phillips, Brooks-Gunn, Duncan, Klebanov, & Crane, 1998), we might expect the
same processes to operate over summer break. Why then do unconditional gaps appear not to
grow over the summer? One possibility drawn from developmental theory is that students
experience a “sensitive period” (Knudson, 2004) prior to school entry, during which their
academic development is particularly responsive to their environments. Before kindergarten, the
developmental trajectories of black and white students may depart at a more accelerated rate than
during the summer after kindergarten. Yet even if the pre-kindergarten gap growth rate were to
continue over the summer after kindergarten, we may not be able to detect summer gap growth
simply due to the relatively brief time period. For example, if we assume that black and white
students’ trajectories begin to diverge at nine months of age (as shown in Fryer & Levitt, 2013),
this would mean that the gaps observed at the beginning of kindergarten would have developed
over approximately 60 months. Using a rough linear interpolation, the expected gap growth over
a summer break of 2.5 months would be small (approximately 0.03 𝜃 sd units of growth for math
and 0.02 for reading, according calculations based on observed fall of kindergarten ECLS gaps)6.
Gap trends of this size would likely not be statistically detectable in the ECLS-K (in fact, this
math interpolation is close to the non-significant math 𝜃 Δ𝐺𝐸𝑆 estimate reported in Table 3).
Conditional gaps. If it is true that black students make less math growth over the
summer than white students with the same spring true score, then why would the same not hold
for reading? Many researchers argue that school environments have more influence over
students’ math scores than their reading scores, which are more influenced by non-school
environments (e.g. Burkam et al., 2004; Cooper et al., 1996; Murnane, 1975). If much of

BLACK-WHITE SUMMER LEARNING GAPS
28
students’ reading ability is determined by their non-school environments, this may mean that
black and white students with the same spring reading skills also experience similar non-school
environments (at least along the dimensions relevant to literacy development) and consequently
make similar summer reading growth. In contrast, similar true spring math scores for black and
white students may not necessarily imply similar non-school environments.
Connection to prior research. These results are compatible with a methodological
explanation for the discrepancies in summer math gap trend estimates found in previous analyses
of ECLS-K. Consistent with the collection of previous studies in which growth models yielded
small, non-significant gap trends, the change score model here showed no average difference in
summer math or reading growth by race. The math results from the regressor variable models
here accord with the finding from the one previous study using the regressor variable method
(Burkam et al., 2004), which produced the only significant gap trend from earlier ECLS-K
studies.
Future Research
Research is needed on summer gap trends in the later grades, when higher-level math
content is more susceptible to summer loss (Cooper et al., 1996). The field would also benefit
from evidence on whether gap trend patterns differ by sub-domains within each content area,
such as number sense and problem-solving in math or comprehension and decoding in reading.
Past research suggests that procedural skills are more susceptible to summer loss than conceptual
understanding (Cooper et al., 1996), and that social class differences in math performance are
seen more in problem-solving skills than computation skills (Entwisle & Alexander, 1990). It is
important to understand how these factors may play out with summer racial test score gap trends.

BLACK-WHITE SUMMER LEARNING GAPS
29
To draw conclusions about differences by sub-domain, however, we need tests designed to
support those inferences, which the ECLS-K tests were not (Koretz & Kim, 2007).
Conclusion
These results have shown that various reasonable models and assumptions support
substantively different conclusions about black-white summer gap trends. Given the important
role that gap trend estimates play in educational policy and research, researchers examining gap
trends must be thoughtful about the methods they use and the assumptions they make.
Policymakers and practitioners are likely to take gap trend estimates at face value and to make
different decisions depending on the trends reported to them. While researchers clearly must
weigh statistical and psychometric considerations when deciding how to estimate and present
gap trend statistics, it is equally important that researchers recognize how the questions
addressed by various approaches differ, and to be explicit about how modeling choices affect the
interpretation of results. Often it will be instructive to look at gap trends from a variety of
perspectives, but whether researchers present a single gap trend statistic or several, they must
clearly describe and defend the question their gap trend statistic answers and consider how the
implications may shift if the question were posed differently.

BLACK-WHITE SUMMER LEARNING GAPS
30
References
Alexander, K.L., Entwisle, D.R., & Olsen, L.S. (2001). Schools, achievement, and inequality: A
seasonal perspective. Educational Evaluation and Policy Analysis, 23, 171-191.
doi: 10.1037/h0028330
Allison, P.D. (1990). Change scores as dependent variables in regression analysis. Sociological
Methodology, 20, 93-114. doi: 10.2307/271083
Ballou, D. (2009). Test scaling and value-added measurement. Education Finance and Policy, 4,
351-383. doi: 10.1162%2Fedfp.2009.4.4.351
Benson, J., & Borman, G. (2010). Family, neighborhood, and school settings across seasons:
When do socioeconomic context and racial composition matter for the reading
achievement growth of young children? Teachers College Record, 112, 1338-1390.
Bond, T.N., & Lang, K. (2013). The evolution of the black-white test score gap in grades K-
3: The fragility of results. Review of Economics and Statistics, 95.
doi:10.1162/REST_a_00370
Borman, G. D., Benson, J., & Overman, L. T. (2005). Families, schools, and summer
learning. The Elementary School Journal, 106, 131-150. doi: 10.1086/499195
Brooks-Gunn, J., Klebanov, P. K., Smith, J., Duncan, G. J., & Lee, K. (2003). The black-white
test score gap in young children: Contributions of test and family characteristics. Applied
Developmental Science, 7, 239-252. doi: 10.1207/S1532480XADS0704_3
Burkam, D.T., Ready, D.D., Lee, V.E., & LoGerfo, L.F. (2004). Social class differences in
summer learning between kindergarten and first grade: Model specification and
estimation. Sociology of Education, 77, 1-31. doi: 10.1177/003804070407700101
Cheadle, J. (2008). Educational investment, family context, and children’s math and reading
growth from kindergarten through the third grade. Sociology of Education, 81, 1–31. doi:
10.1177/003804070808100101
Chin, T., & Phillips, M. (2004). Social reproduction and child-rearing practices: Social class,
children's agency, and the summer activity gap. Sociology of Education, 77, 185-210. doi:
10.1177/003804070407700301
Cooper, H., Nye, B., Charlton, K., Lindsay, J., & Greathouse, S. (1996). The effects of summer
vacation on achievement test scores: A narrative and meta-analytic review. Review of
Educational Research, 66, 227–268. doi: 10.3102/00346543066003227
Crocker, L., & Algina, J. (1986). Introduction to classical and modern test theory. Fort Worth,
TX: Harcourt.
Downey, D. B., von Hippel, P. T., & Broh, B. (2004). Are schools the great equalizer? Cognitive
inequality during the summer months and the school year. American Sociological
Review, 69, 613–635. doi: 10.1177/000312240406900501
Entwisle, D.R., & Alexander, K.L., (1990). Beginning school math competence: Minority and
majority comparisons. Child Development, 61, 454-471. doi: 10.2307/1131107
Entwisle, D.R., & Alexander, K.L., (1992). Summer setback: Race, poverty, school composition,
and mathematics achievement in the first two years of school. American Sociological
Review, 57, 72-84. doi: 10.2307/2096145
Entwisle, D. R., Alexander, K. L., & Olson. L. S. (2000). Summer learning and home
environment. In R. D. Kahlenberg (Ed.), A notion at risk: Preserving public education as
an engine for social mobility (pp. 9–30). New York, NY: Century Foundation Press.
Fryer, R.G. & Levitt, S.D. (2004). Understanding the black‐white test score gap in the first two

BLACK-WHITE SUMMER LEARNING GAPS
31
years of school. The Review of Economics and Statistics 86, 447‐464.
doi: 10.1162/003465304323031049
Fryer, R. G., & Levitt, S. D. (2006). The black-white test score gap through third
grade. American Law and Economics Review, 8, 249-281. doi: 10.1093/aler/ahl003
Fryer, R.G., & Levitt, S. D. (2013). Testing for racial differences in the mental ability of
young children. The American Economic Review, 103, 981-1005. doi:
10.1257/aer.103.2.981
Heyns, B. (1987). Schooling and cognitive development: Is there a season for learning? Child
Development, 58, 1151-1160. doi: 10.2307/1130611.
Ho, A.D. (2009). A nonparametric framework for comparing trends and gaps across tests.
Journal of Educational and Behavioral Statistics, 34, 201-228.
doi: 10.3102/1076998609332755
Ho, A.D., & Reardon, S.F. (2012). Estimating achievement gaps from test scores reported in
ordinal “proficiency” categories. Journal of Educational and Behavioral Statistics, 37,
489-517. doi: 10.3102/1076998611411918
Holland, P.W. (2005). Lord’s paradox. In B.S. Everitt & D.C. Howell, (Eds.) Encyclopedia of
statistics in behavioral science (pp.1106-1108). Chichester: John Wiley & Sons.
Knudsen, E. I. (2004). Sensitive periods in the development of the brain and behavior. Journal of
Cognitive Neuroscience, 16, 1412-1425. doi: 10.1162/0898929042304796
Koretz, D., & Kim, Y. (2007). Changes in the black-white test score gap in the elementary
grades. CSE Report 715. Center for the Study of Evaluation, National Center for
Research on Evaluation, Standards, and Student Testing. Retrieved from
http://www.cse.ucla.edu/products/reports/r715.pdf
Lareau, A. (2011). Unequal childhoods: Class, race, and family life. (2nd ed.). Berkeley:
University of California Press.
Lord, F.M. (1967). A paradox in the interpretation of group comparisons. Psychological Bulletin,
68, 304-305. doi: 10.1037/h0025105
Maassen, G.H. (2000). Principles of defining reliable change indices. Journal of Clinical and
Experimental Neuropsychology, 22, 622-632.
doi: 10.1076/1380-3395(200010)22:5;1-9;FT622
McCaffrey, D., Lockwood, J.R., Koretz, D., & Hamilton, L. (2003). Evaluating value-added
models for teacher accountability. Santa Monica, CA: Rand Corporation.
Mullens, J. E., Murnane, R. J., & Willett, J. B. (1996). The contribution of training and
subject matter knowledge to teaching effectiveness: A multilevel analysis of longitudinal
evidence from Belize. Comparative Education Review, 40, 139–157. doi: 0.1086/447369
Murnane, R.J. (1975). The impact of school resources on the learning of inner city children.
Cambridge, MA: Ballinger.
Murnane, R.J., Willett, J.B., & Levy, F. (1995). The growing importance of cognitive skills in
wage determination. Review of Economics and Statistics, 78, 251-266.
doi: 10.2307/2109863
National Center for Education Statistics (2013). The Nation’s Report Card: Trends in Academic
Progress 2012 (NCES 2013 456). Institute of Education Sciences, U.S. Department of
Education, Washington, D.C.
Phillips, M. Brooks-Gunn, J., Duncan, G., Klebanov, P. & Crane, J. (1998) Family background,

BLACK-WHITE SUMMER LEARNING GAPS
32
parenting practices, and the black-white test score gap, in C. Jencks & M. Phillips (Ed.)
The black-white test score gap (pp-103-145). Washington, DC: The Brookings
Institution.
Phillips, M., Crouse, J., & Ralph, J. (1998). Does the black-white test score gap widen after
children enter school? In C. Jencks & M. Phillips (Eds.), The black-white test score gap
(pp. 229 – 272). Washington, DC: Brookings Institution.
Reardon, S.F. (2008a). Differential growth in the black-white achievement gap
during elementary school among initially high- and low-scoring students. Stanford
University Institute for Research on Education Policy & Practice WORKING PAPER #
2008-07. Retrieved from http://www.ccpr.ucla.edu/events/ccpr-seminars-previous-
years/reardon_Differential%20Growth.pdf
Reardon, S.F. (2008b). Thirteen ways of looking at the black-white test score gap. Working
paper, Stanford University. Retrieved from: http://www.stanford.edu/group/irepp/cgi-
bin/joomla/working-papers.html
Reardon, S. F., & Robinson, J. P. (2008). Patterns and trends in racial/ethnic and socioeconomic
academic achievement gaps. In H. F. Ladd & E. B. Fiske (Eds.), Handbook of research in
education finance and policy (pp. 499–518). New York: Routledge.
Reardon, S. F., Valentino, R. A., & Shores, K. A. (2012). Patterns of literacy among US
students. The Future of Children, 22, 17-37.
Rubin, D.B., Stuart, E.A., & Zanutto, E.L. (2004). A potential outcomes view of value-added
assessment in education. Journal of Educational and Behavioral Statistics, 29, 103-116.
doi: 10.3102/10769986029001103
Spencer, B. (1983). On interpreting test scores as social indicators: Statistical considerations.
Journal of Educational Measurement, 20, 317-333.
doi: 10.1111/j.1745-3984.1983.tb00210.x
Stanovich, K. E. (1986). Matthew effects in reading: Some consequences of individual
differences in the acquisition of literacy. Reading Research Quarterly, 21, 360-407.
doi: 10.1598/RRQ.21.4.1
Tourangeau, K., Nord, C., Lê, T., Sorongon, A. G., and Najarian, M. (2009). Early childhood
longitudinal study, kindergarten class of 1998–99 (ECLS-K), combined user’s manual for
the ECLS-K eighth-grade and K–8 full sample data files and electronic codebooks (NCES
2009–004). National Center for Education Statistics, Institute of Education Sciences, U.S.
Department of Education. Washington, DC.
U.S. Department of Education, National Center for Education Statistics (2002). Early childhood
longitudinal study-kindergarten class of 1998–99 (ECLS–K), psychometric report for
kindergarten through first grade, NCES 2002–05, by Donald A. Rock and Judith M.
Pollack, Educational Testing Service, Elvira Germino Hausken, project officer.
Washington, DC.
Wainer, H. (1991). Adjusting for differential base rates: Lord’s paradox again. Psychological
Bulletin, 109, 147-151. doi: 10.1037/0033-2909.109.1.147
Werts, C.E., & Linn, R.L. (1970). A general linear model for studying growth. Psychological
Bulletin, 73, 17-22. doi: 10.1037/h0028330.
Wilson, W. J. (2009). More than just race: Being black and poor in the inner city (issues of our
time). New York, NY: WW Norton & Company.

BLACK-WHITE SUMMER LEARNING GAPS
33
Notes
1
I use the rocfit routine in Stata to estimate each cross-sectional V gap, with the “cut” number set
to 20.
2In models not presented here, I included an interaction between 𝑆𝑖 and 𝐵𝑖 to test whether the
size of the conditional fall gap differed in different regions of the spring test score distribution;
this term was not significant in any models.
3Reardon (2008a) explains that white students’ regression line is a horizontal line through the
origin; they are therefore not included in the regression.
4In this model, the parameter 𝛾 (not presented in the results) expresses the extent to which the
conditional fall gap changes with each standard deviation change in spring kindergarten score.
Consistent with the results described in endnote 2, this term was not significant in any model.
5 Empirically, spring-fall projected score correlations are similar for black and white students.
Math 𝜃: r=0.78 for both groups; reading 𝜃: r=0.83 for black students, 0.86 for white students.
6 Reading: fall K gap (-0.47) divided by 60, multiplied by 2.5≈-0.02; math: fall K gap (-0.66)
divided by 60, multiplied by 2.5 ≈-0.03.
Author
David M. Quinn is a doctoral student at the Harvard Graduate School of Education. His research
interests relate to measuring, explaining, and ending educational inequity; he is particularly
interested in how teachers and teaching practice can improve student learning and close
achievement gaps. He can be reached at [email protected].

BLACK-WHITE SUMMER LEARNING GAPS
34
Table 1.
Black-White Summer Gap Trend Estimates from Studies using ECLS-K: 1999.
Gap Trend Parameter Studies Math Gap
Trend (B-W)
Reading Gap
Trend (B-W)
Key Control Variables
Standardized Gap Trends
Difference in change scores,
controlling for spring test (equivalent
to regressor variable model)
Burkam, Ready, Lee &
LoGerfo (2004)
-0.11***,
-0.12***
-0.05 (n.s.) SES quintile, whether child repeated
K, summer activities, single-parent
home, home language, age, home
resources, days in school/summer
Cross-sectional comparisons Fryer & Levitt (2004) 0.09 (unadj.),
-0.04 (adj.), n.s
0.03 (unadj.),
0.02 (adj.), n.s.
SES (continuous), gender, age, #
books in home, mother's age at first
birth, child birth weight, WIC
participation
Unstandardized Gap Trends (Scale Score Units)
Difference in monthly learning rates
(multi-level growth model)
Benson & Borman
(2010); Cheadle
(2008); Downey, von
Hippel, & Broh (2004)
-0.10(n.s.) to
0.04 (n.s.)
0.13 (n.s.) to
0.25*
Benson & Borman (2010): SES,
family characteristics, whether
repeated K, school context and
neighborhood context measures;
Cheadle (2008): concerted cultivation
index; Downey et al. (2004): SES
Note. All studies use the scale score metric. As a reference point for unstandardized black-white learning rate differences, the overall mean
summer learning rate was +0.51 scale score points/month for reading and -0.01 scale score points/month for math (Downey et al., 2004).

BLACK-WHITE SUMMER LEARNING GAPS
35
Table 2.
Weighted Descriptive Statistics by Student Race for Analytic Sample for all Test Scales (by testing round), Number of Summer
Vacation Days, Number of Spring School Days, and Number of Fall School Days between Tests.
Note. Spring and fall test scores are standardized using the spring mean and standard deviation. Minimum values for the number of
spring school days captured are negative because some students were tested after the end of the school year.
White Students Black Students
Mean sd Min Max Mean sd Min Max
Math Spring 𝜃 0.19 0.95 -3.2 3 -0.50 0.92 -3.4 3
Scores Fall 𝜃 0.75 0.94 -2.9 3 0.01 1.01 -3.3 3
Projected Spring 𝜃 0.16 0.96 -3.3 3 -0.54 0.95 -3.6 3
Projected Fall 𝜃 0.29 0.97 -3.3 3 -0.45 1.05 -3.7 3
Spring Scale 0.18 1.01 -2.0 6 -0.48 0.77 -2.0 4
Fall Scale 0.82 1.20 -1.9 6 0.01 0.96 -2.0 5
Proj. Spring Scale 0.15 1.01 -2.0 6 -0.50 0.79 -2.1 4
Proj. Fall Scale 0.27 1.12 -3.1 6 -0.44 0.90 -2.4 4 Reading Spring 𝜃 0.16 0.96 -3.1 4 -0.36 0.95 -3.2 3
Scores Fall 𝜃 0.61 0.98 -2.7 4 0.09 0.97 -2.9 3
Projected Spring 𝜃 0.12 0.96 -3.4 4 -0.41 0.99 -3.6 3
Projected Fall 𝜃 0.10 0.99 -3.3 3 -0.42 0.99 -3.5 3
Spring Scale 0.13 1.05 -1.7 8 -0.32 0.72 -1.7 4
Fall Scale 0.61 1.33 -1.6 8 0.06 0.97 -1.6 6
Proj. Spring Scale 0.10 1.04 -1.7 8 -0.35 0.73 -1.8 4
Proj. Fall Scale 0.03 1.21 -2.5 7 -0.40 0.86 -2.3 5
Time # Day Summer 77.49 8.70 37.0 149 75.56 9.64 42.0 101
Periods # Sch Days Spring 34.27 14.38 -48.0 76 31.62 14.92 -5.0 73
# School Days Fall 45.43 15.72 13.0 84 48.03 15.80 14.0 83
N 2435 608

BLACK-WHITE SUMMER LEARNING GAPS
36
Table 3.
𝛥𝐺𝐸𝑆, 𝛥𝑇𝐸𝑆, and 𝛥𝑉 Gap Trend Estimates
Math Reading
Gap Measure Gap Measure Denominator 𝜃 Scale Scores 𝜃 Scale Scores
Change in Gaps (Δ𝐺𝐸𝑆) pooled across groups, within time -0.02 0.02 0.03 0.08**
(0.05) (0.05) (0.04) (0.03) Difference in Changes (Δ𝑇𝐸𝑆) pooled across time, within group -0.05 -0.04 0.02 -0.01
(0.04) (0.04) (0.05) (0.04)
Δ𝐺𝐸𝑆/ Δ𝑇𝐸𝑆 pooled across groups and times -0.05 -0.05 0.02 0.01
(0.04) (0.04) (0.05) (0.04)
spring white sd -0.05 -0.05 0.02 0.01
(0.04) (0.04) (0.05) (0.04)
ΔV N/A -0.02
(0.04)
0.02
(0.04) ~
p<0.10, * p < 0.05,
** p < 0.01,
*** p < 0.001
Note. Standard errors that account for ECLS’s complex sampling design in parentheses. Estimates use projected test scores to account
for testing date. Math: black n=608; white n=2435; reading: black n= 608; white n=2439.
BLACK-WHITE SUMMER LEARNING GAPS
37
Table 4.
Gap Trend Estimates from a Regression Framework: Regressor Variable Models, Local
Standardization Models, and Change Score Models.
Math Reading
Model 𝜃 Scale Score 𝜃 Scale Score
Regressor Variable Model -0.18*** -0.15*** -0.06~ 0.01
(0.05) (0.04) (0.03) (0.03)
Local Std., 25 Quantiles -0.25** -0.21* -0.16* -0.08
(0.09) (0.08) (0.07) (0.08)
Local Std., 50 Quantiles -0.29*** -0.20* -0.15* -0.04
(0.09) (0.09) (0.07) (0.08)
Local Std., 75 Quantiles -0.26*** -0.18* -0.16* -0.04
(0.08) (0.09) (0.08) (0.08)
Local Std., 100 Quantiles -0.32*** -0.19* -0.16* -0.03
(0.09) (0.09) (0.07) (0.08)
Change Score Model -0.07 -0.07 0.03 0.02
(0.07) (0.06) (0.07) (0.06) ~
p<0.10, * p < 0.05,
** p < 0.01,
*** p < 0.001
Note. Standard errors that account for ECLS’s complex sampling design in parentheses.
Estimates use projected test scores to account for testing date. Math: black n=608; white
n=2435; reading: black n= 608; white n=2439.

BLACK-WHITE SUMMER LEARNING GAPS
38
Table 5.
Reliability-adjusted Gap Trend Estimates from the Regressor Variable Model under a Range of
Assumed Test Reliabilities
Math Reading
Assumed Reliability 𝜃 Scale Scores 𝜃 Scale Scores
1 -0.18*** -0.15*** -0.06~ 0.01
(0.05) (0.05) (0.03) (0.03)
0.9 -0.12* -0.09* 0.00 0.07*
(0.05) (0.04) (0.03) (0.03)
0.8 -0.04 -0.01 0.06~ 0.13***
(0.05) (0.04) (0.04) (0.03)
0.7 0.05 0.08~ 0.13*** 0.20***
(0.05) (0.05) (0.04) (0.03) ~
p<0.10, * p < 0.05,
** p < 0.01,
*** p < 0.001
Note. Standard errors that account for ECLS’s complex sampling design in parentheses.
Estimates use projected test scores to account for testing date. Math: black n=608; white
n=2435; reading: black n= 608; white n=2439.

BLACK-WHITE SUMMER LEARNING GAPS
39
Table 6.
Reliability-adjusted Gap Trend Estimates from the Local-standardization Model (75 quantiles)
under a Range of Assumed Test Reliabilities
Math Reading
Assumed Reliability 𝜃 Scale Scores 𝜃 Scale Scores
1 -0.26*** -0.18* -0.16* -0.04
(0.08) (0.09) (0.08) (0.08)
0.9 -0.15~ -0.08 -0.05 0.02
(0.09) (0.09) (0.09) (0.08)
0.8 -0.02 0.00 0.06 0.14
(0.10) (0.10) (0.08) (0.09)
0.7 0.14 0.24* 0.20* 0.30**
(0.12) (0.10) (0.09) (0.09) ~
p<0.10, * p < 0.05,
** p < 0.01,
*** p < 0.001
Note. Standard errors that account for ECLS’s complex sampling design in parentheses.
Estimates use projected test scores to account for testing date. Black n=608.

BLACK-WHITE SUMMER LEARNING GAPS
40
Figure 1. Standardized black-white summer math gap trend estimates across a range of
reasonable representations; estimates differ in modeling strategy, test metric, assumptions about
measurement error, and assumptions about the interval-nature of the test scale. Bars represent
95% confidence intervals.
Note. Estimates are grouped by model and sorted by magnitude of theta gap trend. 25-100
Quant= conditional status local standardization models using 25, 50, 75, or 100 quantiles of
spring test for local standardization, as noted. Reg Var= regressor variable model. Reg Var,
rel.=.70-.90: regressor variable models with assumed spring test reliabilities of 0.70, .80, or 0.90.
75 Quant, rel=.70-.90: local standardization models based on 75 quantiles, assuming spring test
reliabilities of 0.70, 0.80, or 0.90.

BLACK-WHITE SUMMER LEARNING GAPS
41
Figure 2. Standardized black-white summer reading gap trend estimates across a range of
reasonable representations; estimates differ in modeling strategy, test metric, assumptions about
measurement error, and assumptions about the interval-nature of the test scale. Bars represent
95% confidence intervals.
Note. Estimates are grouped by model and sorted by magnitude of theta gap trend. 25-100
Quant= conditional status local standardization models using 25, 50, 75, or 100 quantiles of
spring test for local standardization, as noted. Reg Var= regressor variable model. Reg Var,
rel.=.70-.90: regressor variable models with assumed spring test reliabilities of 0.70, .80, or 0.90.
75 Quant, rel=.70-.90: local standardization models based on 75 quantiles, assuming spring test
reliabilities of 0.70, 0.80, or 0.90.

BLACK-WHITE SUMMER LEARNING GAPS
42
Appendix A. Test Score Projection Method
On average, kindergarteners ended school 34 days (including weekends; sd=15.9) after
their spring assessments and first graders began school 44.4 days (including weekends; sd=15.6)
before their fall assessment dates. We would like to know the scores students would have earned
had they been tested on the last day of kindergarten and the first day of first grade. Assuming
that during the school year test scores are a linear function of time, each student’s observed test
score can be projected backward or forward in time according to his or her personal learning rate
in order to obtain estimates of these scores (recall from Table 2 that the average length of
summer vacation was similar and not statistically different for black and white students [75.56
days and 77.49 days, respectively]). I generate projected Spring K and Fall 1st grade scores
through the following procedure:
1) I calculate each student’s kindergarten rate of learning (separately for each test scale) as:
𝐾 𝑟𝑎𝑡𝑒 =𝑆𝑝𝑟𝑖𝑛𝑔 𝐾 𝑇𝑒𝑠𝑡 𝑆𝑐𝑜𝑟𝑒−𝐹𝑎𝑙𝑙 𝐾 𝑇𝑒𝑠𝑡 𝑆𝑐𝑜𝑟𝑒
𝑁𝑢𝑚𝑏𝑒𝑟 𝑜𝑓 𝑑𝑎𝑦𝑠 𝑏𝑒𝑡𝑤𝑒𝑒𝑛 𝑡𝑒𝑠𝑡𝑠
2) I calculate each student’s projected spring K score as:
𝑆𝑝𝑟𝑖𝑛𝑔 𝐾 𝑝𝑟𝑜𝑗𝑒𝑐𝑡𝑒𝑑 =
𝑂𝑏𝑠𝑒𝑟𝑣𝑒𝑑 𝑆𝑝𝑟𝑖𝑛𝑔 𝑆𝑐𝑜𝑟𝑒 + (𝐾 𝑟𝑎𝑡𝑒) ∗ (# 𝑑𝑎𝑦𝑠 𝑏𝑒𝑡𝑤𝑒𝑒𝑛 𝑠𝑝𝑟𝑖𝑛𝑔 𝐾 𝑡𝑒𝑠𝑡 𝑎𝑛𝑑 𝑙𝑎𝑠𝑡 𝑑𝑎𝑦 𝑜𝑓 𝐾)
3) I calculate each student’s first grade rate of learning (separately for each test scale) as:
𝐺𝑟1 𝑟𝑎𝑡𝑒 =𝑆𝑝𝑟𝑖𝑛𝑔 1𝑠𝑡 𝑇𝑒𝑠𝑡 𝑆𝑐𝑜𝑟𝑒−𝐹𝑎𝑙𝑙 1𝑠𝑡 𝑇𝑒𝑠𝑡 𝑆𝑐𝑜𝑟𝑒
𝑁𝑢𝑚𝑏𝑒𝑟 𝑜𝑓 𝑑𝑎𝑦𝑠 𝑏𝑒𝑡𝑤𝑒𝑒𝑛 𝑡𝑒𝑠𝑡𝑠
4) I calculate each student’s projected fall 1st grade score as:
𝐹𝑎𝑙𝑙 1𝑠𝑡 𝑝𝑟𝑜𝑗𝑒𝑐𝑡𝑒𝑑 =
𝑂𝑏𝑠𝑒𝑟𝑣𝑒𝑑 𝐹𝑎𝑙𝑙 𝑆𝑐𝑜𝑟𝑒 − (𝐺𝑟1 𝑟𝑎𝑡𝑒) ∗ (# 𝑑𝑎𝑦𝑠 𝑏𝑒𝑡𝑤𝑒𝑒𝑛 𝐹𝑎𝑙𝑙 1𝑠𝑡 𝑡𝑒𝑠𝑡 𝑎𝑛𝑑 𝑓𝑖𝑟𝑠𝑡 𝑑𝑎𝑦 𝑜𝑓 1𝑠𝑡 𝑔𝑟𝑎𝑑𝑒)
5) I standardize each new set of projected scores using the same procedures by which I
standardized the original observed scores.

BLACK-WHITE SUMMER LEARNING GAPS
43
As explained in the body of the paper, I removed students whose calculated days of
summer vacation were 150 or more (95 white students and 24 black students; the 99th percentile
was 99 days of vacation), students with 30 or fewer days of summer vacation (5 white students
and 6 black students; 1st percentile was 44 days), students at or above 99th percentile for the
number of school days remaining after spring testing (77 days; 29 white students and 9 black
students), students whose fall test dates were above the 99th percentile for number of days after
the first day of school (85 days; 27 white students and 11 black students), and one (white)
student whose spring test was calculated to be 30 days into summer vacation (results from
models using all students are similar, and are available upon request).

BLACK-WHITE SUMMER LEARNING GAPS
44
Appendix B. Gap Estimates Using Observed Scores
In Tables B1-B4, I present math gap trend estimates that parallel the models from Tables
3-6, but that compare the estimates using observed scores versus projected scores. In Tables B5-
B8, I present analogous results for reading. The sample sizes for the observed score analyses are
larger than those for the projected scores because the observed score analyses include students
dropped from the projected score analyses due to missing or extreme data on test date and/or
school start/end date.
Across most models, the difference between using observed versus projected scores is
less pronounced for theta scores than for scale scores. This is reassuring given that (as described
in the paper) theta scores are the preferred metric. One exception is that in the local
standardization models for math, the magnitude of the difference between projected and
observed score models is greater for theta scores than for scale scores. Much of this difference
stems from the sample differences as opposed to the test score projection per se. Observed score
gap estimates are much closer to projected score gap estimates when the same analytic sample is
used (results are not shown here, but are available upon request).
As seen in Tables B1 and B5, gap trend estimates derived from observed theta scores
result in similar conclusions as those derived from projected theta scores. In all cases, the Δ𝐺𝐸𝑆 ,
Δ𝑇𝐸𝑆,and Δ𝑉 gap trends are small and not statistically significant, as they also are for the change
score gap trend estimate (Tables B2 and B6). In Tables B2 and B6, we see that the conditional
gap estimates are somewhat smaller in magnitude using observed rather than projected theta
scores (again, most of the magnitude change for math appears to be a result of the sample
difference rather than projection). For both math and reading, the local standardization models
yield theta estimates that are more negative when projected test scores are used. The magnitude

BLACK-WHITE SUMMER LEARNING GAPS
45
of the difference is small for reading. The locally-standardized math theta estimates are
significant for both observed and projected scores. The magnitude of this difference is larger for
math than for reading, and again it appears that most of the magnitude change for math is due to
differences in samples.
Many of the gap trend estimates using observed scale scores are comparable to the
estimates obtained using projected scale scores, with somewhat smaller conditional gap estimates
using observed scale scores compared to projected scale scores. However, there are some
important differences. Unlike with the projected scale scores, the change score models using
observed scale scores (Tables B2 and B6) yield large and statistically significant gap trends (-
0.16 for math, -0.14 for reading), indicating that black students make less math and reading
growth (in standardized scale score units) than white students over this period, on average.
Additionally (as seen in Tables B1 and B5), when standardized by the pooled overall sd (across
time and groups) or the white spring sd, the observed scale Δ𝐺𝐸𝑆 and Δ𝑇𝐸𝑆 math gap trend
estimates are significant and twice as large as their projected scale score counterparts (-0.10
versus -0.05); the difference for these estimates is also notable for reading.
As noted above, the theta metric is more trustworthy than the scale score metric and the
robustness of the projected and observed theta estimates (for any given model) increases
confidence in these results. Nonetheless, it is worth understanding why conclusions based on
scale score estimates were sensitive to projection.
As explained in the paper, the scale score metric is a non-linear transformation of the
theta metric. The transformation pulls the left tail of the distribution closer to center and
stretches the right tail further from center. Because black and white students are not evenly
spread across the test score distribution, the stretching of the right tail affects white students
BLACK-WHITE SUMMER LEARNING GAPS
46
more than black students. Furthermore, because the students in the right tail of the theta
distribution are higher-scoring in later test rounds, the effect of the scale score transformation is
more extreme in later testing rounds. One consequence of this is that white students have
significantly higher learning rates than black students over both kindergarten and first grade in
the scale score metric, but not in the theta metric. Therefore, when using learning rates to
calculate projected scores for students, the adjustments made to the scale metric disturb the
relative positions of black and white students more so than the adjustments made to the theta
metric. In the observed scale score metric, white students show significantly more math growth
than black students because the “inflation” of learning rates for students in the upper end of the
distribution causes high-scoring white students to raise the average gain score for all white
students.

BLACK-WHITE SUMMER LEARNING GAPS
47
Table B1.
Math Gap Trend Estimates: 𝛥𝐺𝐸𝑆, 𝛥𝑇𝐸𝑆, and 𝛥𝑉
Observed Scores Projected Scores
Gap Measure Gap Measure Denominator 𝜃
Scale
Scores
𝜃
Scale
Scores
Change in Gaps (Δ𝐺𝐸𝑆) pooled across groups, within time 0.01 0.01
-0.02 0.02
(0.04) (0.05) (0.05) (0.05) Difference in Changes (Δ𝑇𝐸𝑆) pooled across time, within group -0.01 0.03
-0.05 -0.04
(0.04) (0.04) (0.04) (0.04)
Δ𝐺𝐸𝑆/ Δ𝑇𝐸𝑆 pooled across groups and times 0.00 -0.10* -0.05 -0.05
(0.04) (0.04) (0.04) (0.04)
spring white sd 0.00 -0.10* -0.05 -0.05
(0.04) (0.04) (0.04) (0.04)
ΔV N/A 0.02 -0.02
(0.04) (0.04) ~
p<0.10, * p < 0.05,
** p < 0.01,
*** p < 0.001
Note. Standard errors that account for ECLS’s complex sampling design in parentheses. Observed: black n=752; white
n=2861; projected: black n=608; white n=2435.

BLACK-WHITE SUMMER LEARNING GAPS
48
Table B2.
Math Gap Trend Estimates from a Regression Framework: Regressor Variable Models, Local Standardization Models, and
Change Score Models.
Observed Scores Projected Scores
Model 𝜃 Scale Score 𝜃 Scale Score
Regressor Variable Model -0.10*** -0.11*** -0.18*** -0.15***
(0.03) (0.03) (0.05) (0.04)
Local Std., 25 Quantiles -0.15~ -0.14~ -0.25** -0.21*
(0.08) (0.07) (0.09) (0.08)
Local Std., 50 Quantiles -0.15* -0.14~ -0.29*** -0.20*
(0.07) (0.07) (0.09) (0.09)
Local Std., 75 Quantiles -0.17* -0.13~ -0.26*** -0.18*
(0.08) (0.07) (0.08) (0.09)
Local Std., 100 Quantiles -0.16* -0.13~ -0.32*** -0.19*
(0.08) (0.07) (0.09) (0.09)
Change Score Model 0.00 -0.16*** -0.07 -0.07
(0.06) (0.05) (0.07) (0.06) ~
p<0.10, * p < 0.05,
** p < 0.01,
*** p < 0.001
Note. Standard errors that account for ECLS’s complex sampling design in parentheses. Observed: black n=752; white
n=2861; projected: black n=608; white n=2435.

BLACK-WHITE SUMMER LEARNING GAPS
49
Table B3.
Reliability-adjusted Math Gap Trend Estimates from the Regressor Variable Model under a Range of Assumed Test
Reliabilities
Observed Scores Projected Scores
Assumed Reliability 𝜃 Scale Scores 𝜃 Scale Scores
1 -0.10*** -0.11*** -0.18*** -0.15***
(0.03) (0.03) (0.05) (0.05)
0.9 -0.04 -0.04 -0.12* -0.09*
(0.03) (0.03) (0.05) (0.04)
0.8 0.04 0.04 -0.04 -0.01
(0.03) (0.03) (0.05) (0.04)
0.7 0.14*** 0.15*** 0.05 0.08~
(0.03) (0.03) (0.05) (0.05) ~
p<0.10, * p < 0.05,
** p < 0.01,
*** p < 0.001
Note. Standard errors that account for ECLS’s complex sampling design in parentheses. Observed: black n=752; white
n=2861; projected: black n=608; white n=2435.

BLACK-WHITE SUMMER LEARNING GAPS
50
Table B4.
Reliability-adjusted Math Gap Trend Estimates from the Local-standardization Model (75 quantiles) under a Range of
Assumed Test Reliabilities
Observed Scores Projected Scores
Assumed Reliability 𝜃 Scale Scores 𝜃 Scale Scores
1 -0.17* -0.13~ -0.26*** -0.18*
(0.08) (0.07) (0.08) (0.09)
0.9 -0.04 -0.01 -0.15~ -0.08
(0.08) (0.08) (0.09) (0.09)
0.8 0.14 0.18~ -0.02 0.00
(0.09) (0.09) (0.10) (0.10)
0.7 0.32** 0.39** 0.14 0.24*
(0.09) (0.11) (0.12) (0.10) ~
p<0.10, * p < 0.05,
** p < 0.01,
*** p < 0.001
Note. Standard errors that account for ECLS’s complex sampling design in parentheses. Observed: black n=752; projected:
black n=608.

BLACK-WHITE SUMMER LEARNING GAPS
51
Table B5.
Reading Gap Trend Estimates:𝛥𝐺𝐸𝑆, 𝛥𝑇𝐸𝑆, and 𝛥𝑉
Observed Scores Projected Scores
Gap Measure Gap Measure Denominator 𝜃
Scale
Scores
𝜃
Scale
Scores
Change in Gaps (Δ𝐺𝐸𝑆) pooled across groups, within time 0.01 0.02
0.03 0.08**
(0.04) (0.04) (0.04) (0.03) Difference in Changes (Δ𝑇𝐸𝑆) pooled across time, within group 0.02 0.05
0.02 -0.01
(0.04) (0.04) (0.05) (0.04)
Δ𝐺𝐸𝑆/ Δ𝑇𝐸𝑆 pooled across groups and times 0.01 -0.07~ 0.02 0.01
(0.04) (0.04) (0.05) (0.04)
spring white sd 0.01 -0.08* 0.02 0.01
(0.04) (0.04) (0.05) (0.04)
ΔV N/A 0.02 0.02
(0.04) (0.04) ~
p<0.10, * p < 0.05,
** p < 0.01,
*** p < 0.001
Note. Standard errors that account for ECLS’s complex sampling design in parentheses. Observed: black n=755; white
n=2865; projected: black n=608; white n=2439.

BLACK-WHITE SUMMER LEARNING GAPS
52
Table B6.
Reading Gap Trend Estimates from a Regression Framework: Regressor Variable Models, Local Standardization Models, and
Change Score Models.
Observed Scores Projected Scores
Model 𝜃 Scale Score 𝜃 Scale Score
Regressor Variable Model -0.04 -0.02 -0.06~ 0.01
(0.03) (0.03) (0.03) (0.03)
Local Std., 25 Quantiles -0.14~ -0.14* -0.16* -0.08
(0.07) (0.07) (0.07) (0.08)
Local Std., 50 Quantiles -0.14~ -0.12 -0.15* -0.04
(0.08) (0.08) (0.07) (0.08)
Local Std., 75 Quantiles -0.14~ -0.11 -0.16* -0.04
(0.08) (0.08) (0.08) (0.08)
Local Std., 100 Quantiles -0.14~ -0.09 -0.16* -0.03
(0.08) (0.08) (0.07) (0.08)
Change Score Model 0.03 -0.14** 0.03 0.02
(0.06) (0.05) (0.07) (0.06) ~
p<0.10, * p < 0.05,
** p < 0.01,
*** p < 0.001
Note. Standard errors that account for ECLS’s complex sampling design in parentheses. Observed: black n=755; white
n=2865; projected: black n=608; white n=2439.

BLACK-WHITE SUMMER LEARNING GAPS
53
Table B7.
Reliability-adjusted Reading Gap Trend Estimates from the Regressor Variable Model under a Range of Assumed Test Reliabilities
Observed Scores Projected Scores
Assumed Reliability 𝜃 Scale Scores 𝜃 Scale Scores
1 -0.04 -0.02 -0.06~ 0.01
(0.03) (0.03) (0.03) (0.03)
0.9 0.00 0.03 0.00 0.07*
(0.03) (0.03) (0.03) (0.03)
0.8 0.06* 0.09** 0.06~ 0.13***
(0.03) (0.03) (0.04) (0.03)
0.7 0.14*** 0.17*** 0.13*** 0.20***
(0.03) (0.03) (0.04) (0.03) ~
p<0.10, * p < 0.05,
** p < 0.01,
*** p < 0.001
Note. Standard errors that account for ECLS’s complex sampling design in parentheses. Observed: black n=755; white n=2865;
projected: black n=608; white n=2439.

BLACK-WHITE SUMMER LEARNING GAPS
54
Table B8.
Reliability-adjusted Reading Gap Trend Estimates from the Local-standardization Model (75 quantiles) under a Range of Assumed
Test Reliabilities
Observed Scores Projected Scores
Assumed Reliability 𝜃 Scale Scores 𝜃 Scale Scores
1 -0.14~ -0.11 -0.16* -0.04
(0.08) (0.08) (0.08) (0.08)
0.9 -0.08 -0.02 -0.05 0.02
(0.08) (0.07) (0.09) (0.08)
0.8 0.07 0.13~ 0.06 0.14
(0.07) (0.07) (0.08) (0.09)
0.7 0.30*** 0.33*** 0.20* 0.30**
(0.08) (0.09) (0.09) (0.09) ~
p<0.10, * p < 0.05,
** p < 0.01,
*** p < 0.001
Note. Standard errors that account for ECLS’s complex sampling design in parentheses. Observed: black n=755; projected: black
n=608.
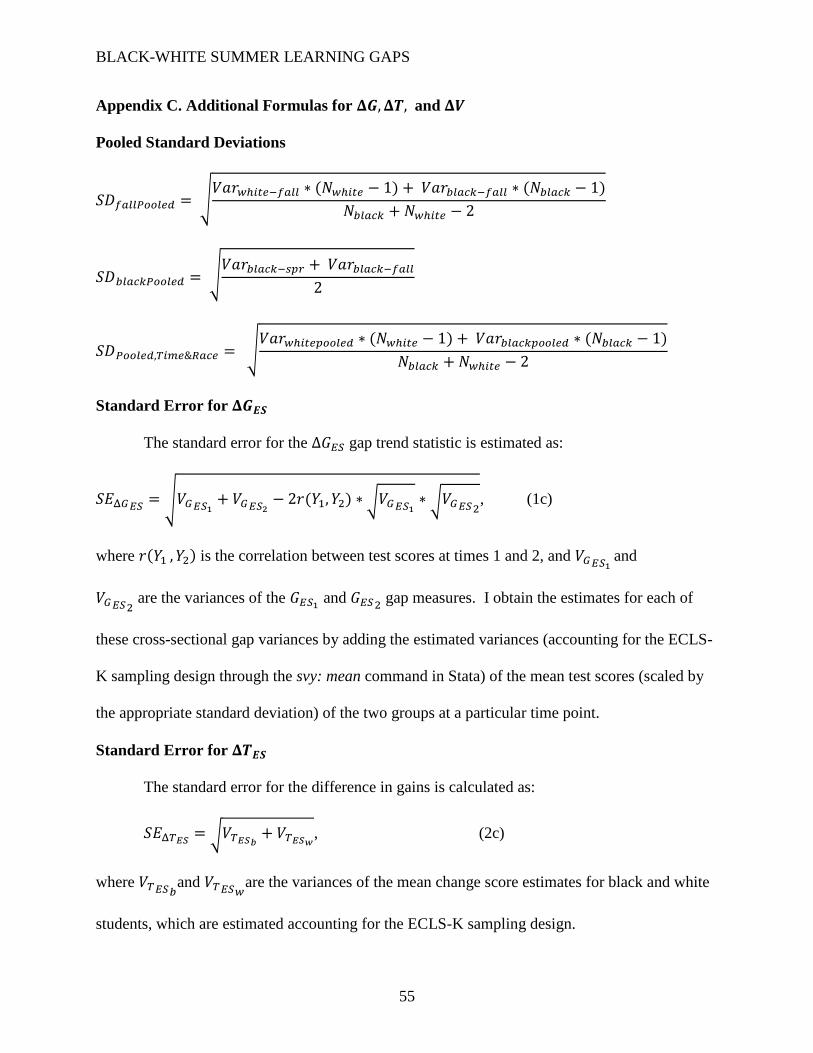
BLACK-WHITE SUMMER LEARNING GAPS
55
Appendix C. Additional Formulas for 𝚫𝑮, 𝚫𝑻, and 𝚫𝑽
Pooled Standard Deviations
𝑆𝐷𝑓𝑎𝑙𝑙𝑃𝑜𝑜𝑙𝑒𝑑 = √𝑉𝑎𝑟𝑤ℎ𝑖𝑡𝑒−𝑓𝑎𝑙𝑙 ∗ (𝑁𝑤ℎ𝑖𝑡𝑒 − 1) + 𝑉𝑎𝑟𝑏𝑙𝑎𝑐𝑘−𝑓𝑎𝑙𝑙 ∗ (𝑁𝑏𝑙𝑎𝑐𝑘 − 1)
𝑁𝑏𝑙𝑎𝑐𝑘 + 𝑁𝑤ℎ𝑖𝑡𝑒 − 2
𝑆𝐷𝑏𝑙𝑎𝑐𝑘𝑃𝑜𝑜𝑙𝑒𝑑 = √𝑉𝑎𝑟𝑏𝑙𝑎𝑐𝑘−𝑠𝑝𝑟 + 𝑉𝑎𝑟𝑏𝑙𝑎𝑐𝑘−𝑓𝑎𝑙𝑙
2
𝑆𝐷𝑃𝑜𝑜𝑙𝑒𝑑,𝑇𝑖𝑚𝑒&𝑅𝑎𝑐𝑒 = √𝑉𝑎𝑟𝑤ℎ𝑖𝑡𝑒𝑝𝑜𝑜𝑙𝑒𝑑 ∗ (𝑁𝑤ℎ𝑖𝑡𝑒 − 1) + 𝑉𝑎𝑟𝑏𝑙𝑎𝑐𝑘𝑝𝑜𝑜𝑙𝑒𝑑 ∗ (𝑁𝑏𝑙𝑎𝑐𝑘 − 1)
𝑁𝑏𝑙𝑎𝑐𝑘 + 𝑁𝑤ℎ𝑖𝑡𝑒 − 2
Standard Error for 𝚫𝑮𝑬𝑺
The standard error for the Δ𝐺𝐸𝑆 gap trend statistic is estimated as:
𝑆𝐸Δ𝐺𝐸𝑆= √𝑉𝐺𝐸𝑆1
+ 𝑉𝐺𝐸𝑆2− 2𝑟(𝑌1, 𝑌2) ∗ √𝑉𝐺𝐸𝑆1
∗ √𝑉𝐺𝐸𝑆2, (1c)
where 𝑟(𝑌1 , 𝑌2) is the correlation between test scores at times 1 and 2, and 𝑉𝐺𝐸𝑆1 and
𝑉𝐺𝐸𝑆2 are the variances of the 𝐺𝐸𝑆1
and 𝐺𝐸𝑆2 gap measures. I obtain the estimates for each of
these cross-sectional gap variances by adding the estimated variances (accounting for the ECLS-
K sampling design through the svy: mean command in Stata) of the mean test scores (scaled by
the appropriate standard deviation) of the two groups at a particular time point.
Standard Error for 𝚫𝑻𝑬𝑺
The standard error for the difference in gains is calculated as:
𝑆𝐸Δ𝑇𝐸𝑆= √𝑉𝑇𝐸𝑆𝑏
+ 𝑉𝑇𝐸𝑆𝑤, (2c)
where 𝑉𝑇𝐸𝑆𝑏and 𝑉𝑇𝐸𝑆𝑤
are the variances of the mean change score estimates for black and white
students, which are estimated accounting for the ECLS-K sampling design.

BLACK-WHITE SUMMER LEARNING GAPS
56
It should be noted that the Δ𝐺𝐸𝑆 and Δ𝑇𝐸𝑆 standard error formulas above do not account
for sampling variability in the standard deviation, and therefore somewhat underestimate the
sampling variability of these effect sizes. This is not of much consequence in the current paper,
given that the Δ𝐺𝐸𝑆 and Δ𝑇𝐸𝑆 gap trends are not close to significant in the preferred 𝜃 metric
even without accounting for this additional sampling variability.
Standard Error for 𝚫𝑽
The standard error for Δ𝑉 is calculated as:
𝑆𝐸Δ𝑉 = √𝑉𝑉1+ 𝑉𝑉2
− 2𝜌 √𝑉𝑉1√𝑉𝑉2, (3c)
where 𝜌 is the Spearman correlation between spring and fall scores, and 𝑉𝑉𝑡is the variance of the
V gap at time t.
In order to account for the complex sampling design of ECLS-K in the estimation of the
Δ𝑉 standard error, I incorporate the replicate weights provided by ECLS-K. Specifically, for
each V gap estimate, I fit 41 models using the rocfit routine in Stata. In each set of models, the
first model incorporates the sampling weight that provides the correct point estimate (designated
weight 0); the remaining 40 models each incorporate a different replicate weight and provide a
different V estimate. I store these estimates and use them to obtain the correct V gap variance
estimate at time t with the following formula (adapted from Tourangeau, Nord, Lê, Sorongon, &
Najarian, 2009):
𝑉𝑉𝑡= √∑ (�̂�𝑖𝑡 − �̂�𝑡)
240 𝑖=1 (4c)
where 𝑉𝑖𝑡 indexes the V estimate using replicate weight i (1-40) at test wave t, and 𝑉𝑡 indicates
the V estimate obtained using the original sampling weight (weight 0) for the indexed test wave.

BLACK-WHITE SUMMER LEARNING GAPS
57
References
Tourangeau, K., Nord, C., Lê, T., Sorongon, A. G., and Najarian, M. (2009). Early
childhood longitudinal study, kindergarten class of 1998–99 (ECLS-K), combined user’s
manual for the ECLS-K eighth-grade and K–8 full sample data files and electronic
codebooks (NCES 2009–004). National Center for Education Statistics, Institute of
Education Sciences, U.S. Department of Education. Washington, DC.