Embed Size (px)
Citation preview
THE JOURNAL OF CHEMICAL PHYSICS122, 174706s2005d
“Black spots” in a surfactant-rich Belousov–Zhabotinsky reactiondispersed in a water-in-oil microemulsion system
Akiko Kaminaga, Vladimir K. Vanag, and Irving R. EpsteinDepartment of Chemistry and Volen Center for Complex Systems, MS 015, Brandeis University, Waltham,Massachusetts 02454
sReceived 23 November 2004; accepted 16 February 2005; published online 3 May 2005d
The Belousov–ZhabotinskysBZd reaction dispersed in water-in-oil aerosol OTsAOTdmicroemulsion has been studied at small radiusRd of water nanodroplets(Rd snmd>0.17v ,v=fH2Og / fAOTg=9). Stationary spotlike and labyrinthine Turing patterns are found close to the fullyoxidized state. These patterns, islands of high concentration of the reduced state of the Rusbpyd3
2+
catalyst, can coexist either with “black” reduction waves or, under other conditions, with the “white”oxidation waves usually observed in the BZ reaction. The experimental observations are analyzedwith the aid of a new Oregonator-like model and qualitatively reproduced in computersimulations. ©2005 American Institute of Physics. fDOI: 10.1063/1.1888386g
-
ctionctor,
iontemms,
n
en
dOTat-orp
lystentlyots,se terve
disisf
io
tloreions
nd-n-eri-
e-
ineys-plets.cur at
heo-can
andntalOTl re-iblewiththat.
de-s-T
l
aine-
I. INTRODUCTION
The Belousov–ZhabotinskysBZd reaction,1,2 the catalytic periodic oxidation of malonic acidsMA d by bromate inacidic aqueous solution, is the prototype nonlinear reafor studying chemical oscillations in a stirred tank reaand waves in spatially extended systemssgels,3 membranes4
mesoporous glasses,5 and ion-exchange resins6d. The BZ re-action dispersed in water-in-oil aerosol OT microemulssBZ-AOT systemd has been shown to be an excellent sysfor studying pattern formation in reaction-diffusion systeincluding stationary Turing patterns,7 oscillons,8 and newwave patterns such as packet waves and antispirals,9,10 dashwaves, and segmented spirals.11,12
In general, global Turing patterns13 are of three maitypes: hexagons, stripessor labyrinthine patternsd, or honey-combssor reverse hexagonsd. All of these patterns have beobserved in the chlorite-iodide-malonic acidsCIMA d reac-tion in a gel reactor,14,15 but until now only hexagons anlabyrinthine patterns have been found in the BZ-Asystem.7 Hexagons consist of “white” spots, since the pterns are typically recorded at the maximum of the abstion band of the reduced state of the catalystfferroin orRusbpyd3
2+g, and the spots are islands of the oxidized catawhich has significantly less absorption and consequtransmits more light than its surroundings. “Black” spstationary islands of the reduced catalyst, patterns inverthe white-spot hexagons, have not previously been obsin the BZ-AOT system.
An AOT fsodium biss2-ethylhexyldsulfosuccinateg mi-croemulsion consists of nanometer-sized water dropletspersed in a continuous oilsoctaned phase. Each dropletsurrounded by a surfactantsAOTd monolayer. The radius othe water droplet cores is determined by the molar ratv=fH2Og / fAOTg and is roughly equal toRw=0.17v snmd.16,17
Most of our previous experiments were performed av=15–20. In the present set of experiments we expsmaller water droplets that form in surfactant-rich emuls
with v=9. Water molecules in such droplets are adjacent to0021-9606/2005/122~17!/174706/11/$22.50 122, 1747
Downloaded 10 May 2005 to 129.64.51.111. Redistribution subject to AIP
-
,
od
-
the polarsSO32−d groups of the AOT surfactant molecules a
therefore have special physical propertiesse.g., high viscosity, small dielectric constantd.18 Chemical reaction rates geerally change in such an environment. In preliminary expments with the BZ-AOT system in a stirred reactorsCSTRd,we found unusual oscillations atv=9, with spikes in thconcentration of oxidized catalystsferriind during the autocatalytic stage of the oscillations.19 A decrease inv alsoimplies an increase in the volume fraction of surfactantws atconstant volume fraction of waterww sincews>21.6ww/v.As a consequence, there will be a repartitioning of bromswhich acts as a fast-diffusing inhibitor in the BZ-AOT stemd between the continuous oil phase and the nanodroThese observations suggest that new patterns may ocsmall v.
In this paper we present the first experimental and tretical results on black spots in the BZ-AOT system thatbe observed either alone or accompanied by wavessblack orwhited. In Sec. II, we briefly describe our experimentaltheoretical methods. In Sec. III, we report our experimeresults. In Sec. IV, we suggest a new model of the BZ-Asystem that qualitatively captures the main experimentasults found in this work. In Sec. V, we discuss plausexplanations for black spots and their interactionswaves and finally link these patterns to Turing patternscan be altered by the excitability of the BZ-AOT system
II. MATERIALS AND METHODS
The experimental arrangement and methods arescribed in detail elsewhere.7,10,11Two stock microemulsionsMEd, with the same molar ratiov and volume droplet fraction wd swd=ws+wwd, were prepared by mixing 1.5 M AOin octane with aqueous solutions of malonic acid and H2SO4
sME-1d or with NaBrO3 and Rusbpyd32+ sME-2d. The fina
reactive ME was obtained by mixing ME-1 with ME-2svol-ume ratio 1:1d and with enough additional octane to obtthe desiredwd. We worked mostly with microemulsions b
low the percolation level, as confirmed by measurements of© 2005 American Institute of Physics06-1
license or copyright, see http://jcp.aip.org/jcp/copyright.jsp
-ligh
-n an
The, anwicervetcop
ap-
ter-
nsthe
on
steppecias
eteith, as
ofic
ide
erves of
s oithin
hepat-col-llts
ave
firstthaold
sesg onelay
iallyclude
ns ofows
or
ddlepondhein the
ac-t
atcata-Fig..
nt to
174706-2 Kaminaga, Vanag, and Epstein J. Chem. Phys. 122, 174706 ~2005!
the electrical conductivitysYSI 3200d. The radius distribution of the water droplets was measured by quasielasticscatteringsProtein Solutions, DynaProd.
A small drop s<0.1 mLd of reactive ME was sandwiched between two flat glass windows separated by anular teflon gasketsZefluor membraned of thickness 80mm,inner diameter 25 mm, and outer diameter 47 mm.edges of the glass windows were sealed with teflon tapethen the two windows were pressed together. This sandconstitutes our reactor. Patterns in the reactor were obsthrough a microscopesSZH10, Olympusd in transmitted lighpassed through a 450 nm interference filter. The microsis equipped with a charge-coupled devicesCCDd camerasTM-7CN, Pulnixd connected to a personal computer. Snshots and movies were recorded and analyzed withIMAGE-
PRO PLUSsoftware. The wavelength of a pattern was demined from the maximum of its fast fourier transformsFFTd.
Numerical simulations of ordinary differential equatioand reaction-diffusion equations were performed withsoftwareFLEXPDE,20 in which a Newton–Raphson iteratiprocess is used with a variable time step and mesh.FLEXPDE
refines the triangular finite element mesh and/or timeuntil the estimated error in any variable is less than a sfied tolerance, which we chose as 10−4 sor in some cases10−5d at every cell of the mesh. The accuracy ofFLEXPDE ata chosen tolerance was checked by comparing the paramfound for the onset of Hopf and/or Turing instability wthose obtained analytically from linear stability analysiswell as by varying the tolerance.
III. EXPERIMENTAL RESULTS
A. Turing patterns
An AOT microemulsion loaded with the componentsthe BZ reactionfsulfuric acid, sodium bromate, malonacid, and Rusbpyd3g generates Turing patterns in a wrange of initial reagent concentrations atv=15 and wd
,0.5 sbelow the onset of percolationd.7,8 At lower vs>9dwith similar or identical reactant concentrations, we obsa new pattern of “black spots,” which are actually islandhigh concentration of the reduced catalyst Rusbpyd3
2+ in acontinuous white background of oxidized Rusbpyd3
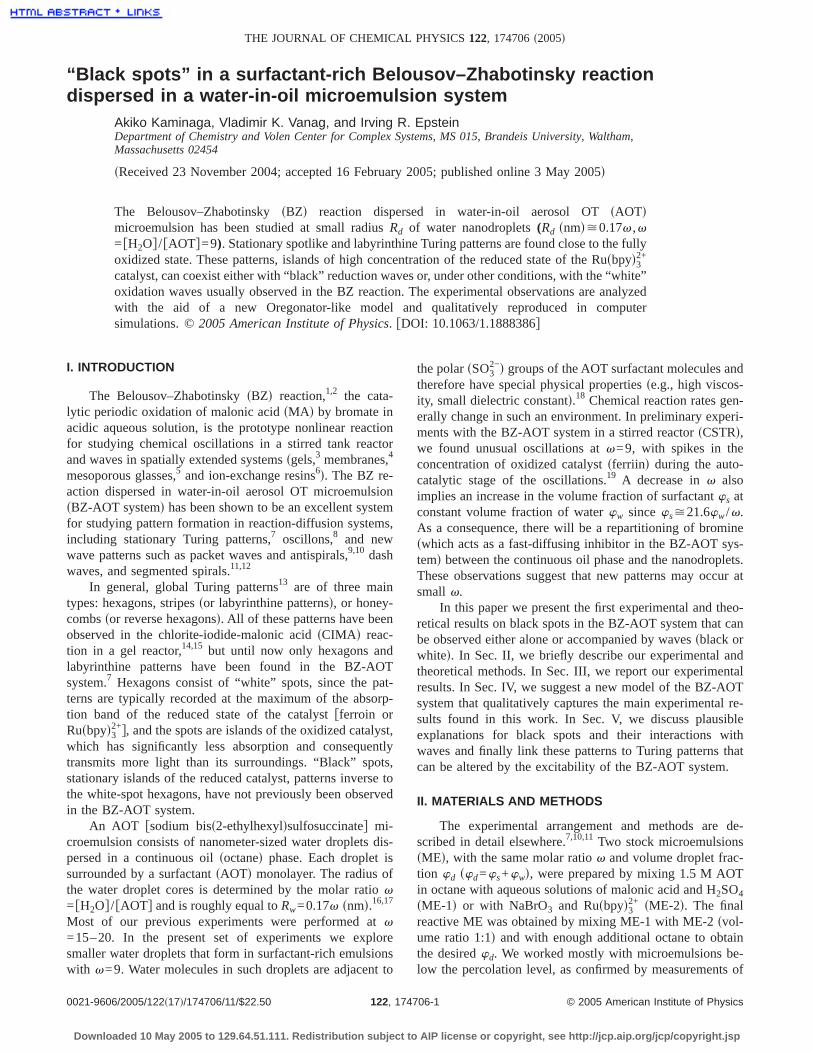
3+. Figure1 demonstrates patterns at different initial concentrationbromate. The left column shows patterns that emerge w1–2 min after the first autocatalytic oxidation of Rusbpyd3
2+,which occurs after an induction period of 10–40 min. Tmiddle column demonstrates the relatively stationaryterns that develop from the transient patterns in the leftumn. White spot Turing patternssbd are found at smafNaBrO3g, while novel black spot patternsfscd–sfdg emerge alarger fNaBrO3g. We also see in Fig. 1sdd that black spotmay be irregular in shape. Figure 1sfd and its cloudy FFTshow that these patterns need not have an intrinsic wlength and that the spots may vary in size.
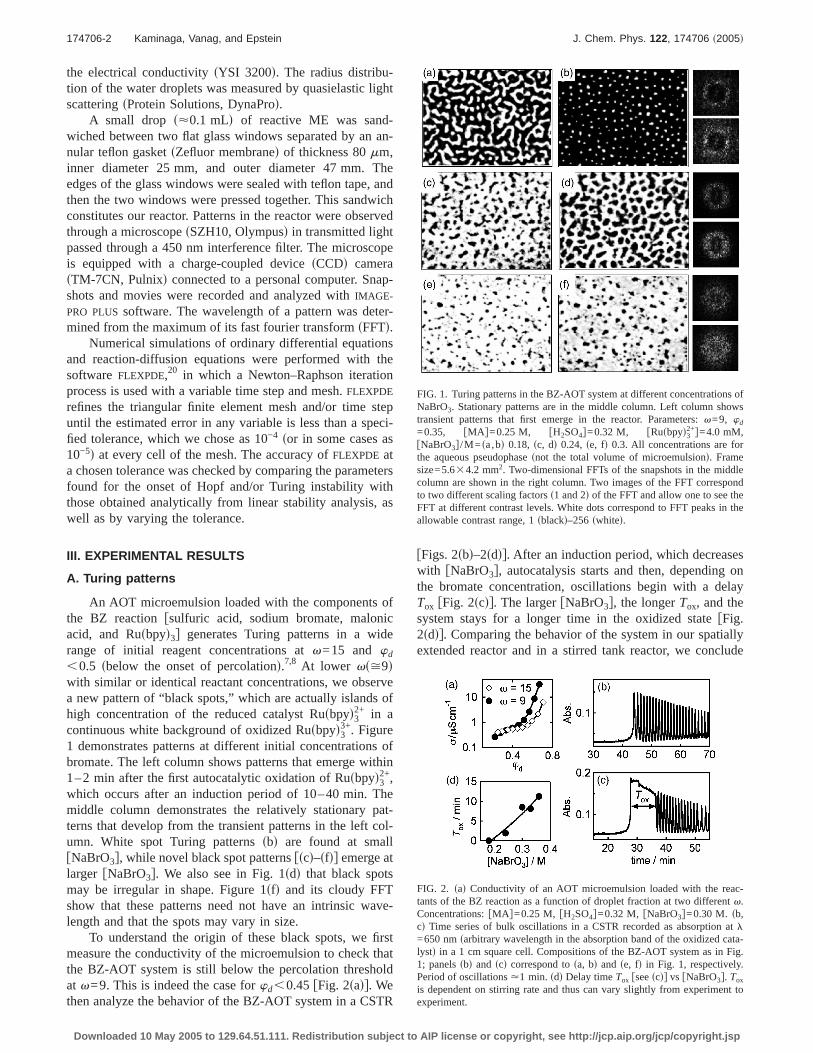
To understand the origin of these black spots, wemeasure the conductivity of the microemulsion to checkthe BZ-AOT system is still below the percolation threshat v=9. This is indeed the case forwd,0.45 fFig. 2sadg. We
then analyze the behavior of the BZ-AOT system in a CSTRDownloaded 10 May 2005 to 129.64.51.111. Redistribution subject to AIP
t
-
dhd
e
-
rs
f
-
t
fFigs. 2sbd–2sddg. After an induction period, which decreawith fNaBrO3g, autocatalysis starts and then, dependinthe bromate concentration, oscillations begin with a dTox fFig. 2scdg. The largerfNaBrO3g, the longerTox, and thesystem stays for a longer time in the oxidized statefFig.2sddg. Comparing the behavior of the system in our spatextended reactor and in a stirred tank reactor, we con
FIG. 1. Turing patterns in the BZ-AOT system at different concentratioNaBrO3. Stationary patterns are in the middle column. Left column shtransient patterns that first emerge in the reactor. Parameters:v=9, wd
=0.35, fMA g=0.25 M, fH2SO4g=0.32 M, fRusbpyd32+g=4.0 mM,
fNaBrO3g /M= sa,bd 0.18, sc, dd 0.24, se, fd 0.3. All concentrations are fthe aqueous pseudophasesnot the total volume of microemulsiond. Framesize=5.634.2 mm2. Two-dimensional FFTs of the snapshots in the micolumn are shown in the right column. Two images of the FFT corresto two different scaling factorss1 and 2d of the FFT and allow one to see tFFT at different contrast levels. White dots correspond to FFT peaksallowable contrast range, 1sblackd–256 swhited.
FIG. 2. sad Conductivity of an AOT microemulsion loaded with the retants of the BZ reaction as a function of droplet fraction at two differenv.Concentrations:fMA g=0.25 M, fH2SO4g=0.32 M, fNaBrO3g=0.30 M. sb,cd Time series of bulk oscillations in a CSTR recorded as absorptionl=650 nmsarbitrary wavelength in the absorption band of the oxidizedlystd in a 1 cm square cell. Compositions of the BZ-AOT system as in1; panelssbd and scd correspond tosa, bd and se, fd in Fig. 1, respectivelyPeriod of oscillations<1 min. sdd Delay timeTox fseescdg vs fNaBrO3g. Tox
is dependent on stirring rate and thus can vary slightly from experime
experiment.license or copyright, see http://jcp.aip.org/jcp/copyright.jsp
firshusntrar in
pottstt
pat-od
the
tsreas
omve-eh amin
ve-
aven ah,igh-h in
otatized
at
e
de
ingterns
ta-ob-
sn-hs af-is
isticeter-edhoutocal-criti-
callo-
cles.ntem
pletseseicles
mi-
hee-R
174706-3 “Black spots” Belousov–Zhabotinsky reaction J. Chem. Phys. 122, 174706 ~2005!
that black spots emerge at the time when the systemexhibits autocatalysis and stays in the oxidized state. Tthe emergence of black spots at larger bromate concetions is related to the fully oxidized state of the catalyst, oother words to the oxidized state of the system.
Increasing the sulfuric acid concentrationsfrom0.24 M to 0.32 M atfNaBrO3g=0.18 M,fMA g=0.25 M andfRusbpyd3
2+g=3.2 mMd gives the same tendency: white sTuring patterns at smallerfH2SO4g transform to black spoTuring patterns at largerfH2SO4g. A decrease in the catalyconcentration sfrom fRusbpyd3
2+g=4 mM to 3.2 mM afNaBrO3g=0.18 M, fH2SO4g=0.32 M, andfMA g=0.25 Mdbrings the system from white spot to black spot Turingterns. These dependences are in agreement with our ms10d and s11d described below and with the response ofmodel to the parameterm fsee Eq.s17d belowg. In all theabove-mentioned experiments, emergence of black spothe spatially extended reactor is accompanied by an incin the timeTox in the CSTR.
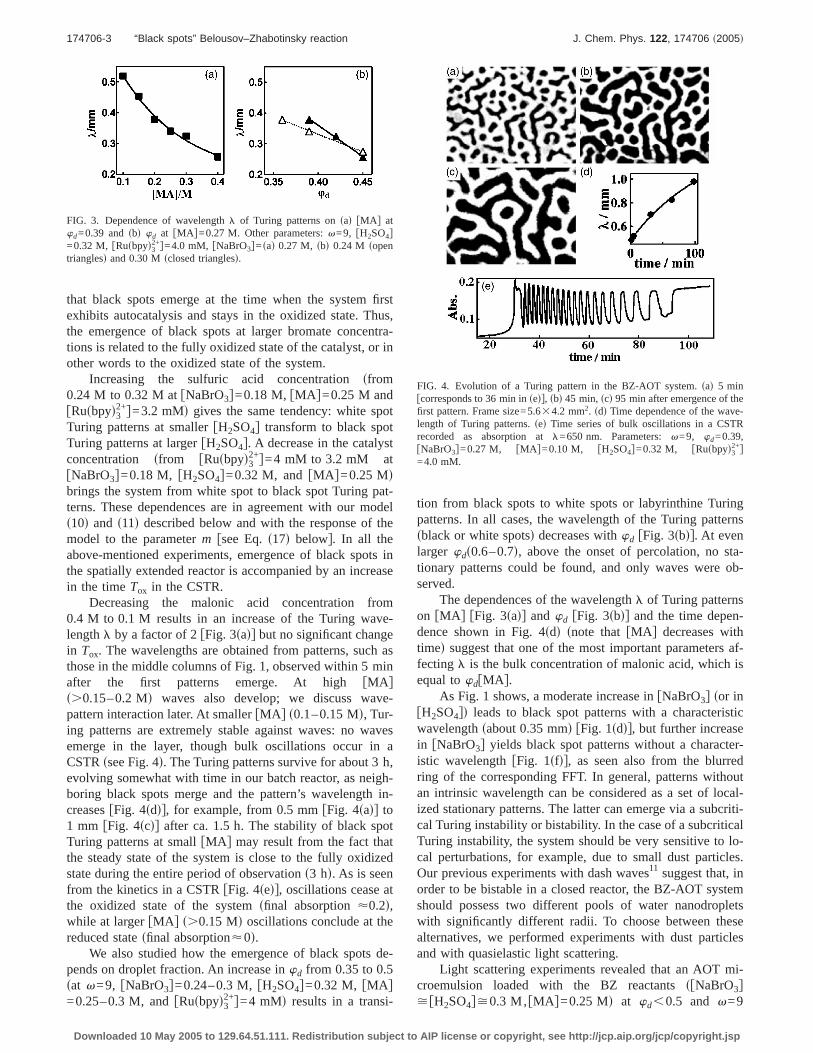
Decreasing the malonic acid concentration fr0.4 M to 0.1 M results in an increase of the Turing walengthl by a factor of 2fFig. 3sadg but no significant changin Tox. The wavelengths are obtained from patterns, sucthose in the middle columns of Fig. 1, observed within 5after the first patterns emerge. At highfMA gs.0.15–0.2 Md waves also develop; we discuss wapattern interaction later. At smallerfMA g s0.1–0.15 Md, Tur-ing patterns are extremely stable against waves: no wemerge in the layer, though bulk oscillations occur iCSTRssee Fig. 4d. The Turing patterns survive for about 3evolving somewhat with time in our batch reactor, as neboring black spots merge and the pattern’s wavelengtcreasesfFig. 4sddg, for example, from 0.5 mmfFig. 4sadg to1 mm fFig. 4scdg after ca. 1.5 h. The stability of black spTuring patterns at smallfMA g may result from the fact ththe steady state of the system is close to the fully oxidstate during the entire period of observations3 hd. As is seenfrom the kinetics in a CSTRfFig. 4sedg, oscillations ceasethe oxidized state of the systemsfinal absorption<0.2d,while at largerfMA g s.0.15 Md oscillations conclude at threduced statesfinal absorption<0d.
We also studied how the emergence of black spotspends on droplet fraction. An increase inwd from 0.35 to 0.5sat v=9, fNaBrO3g=0.24–0.3 M,fH2SO4g=0.32 M, fMA g
2+
FIG. 3. Dependence of wavelengthl of Turing patterns onsad fMA g atwd=0.39 andsbd wd at fMA g=0.27 M. Other parameters:v=9, fH2SO4g=0.32 M, fRusbpyd3
2+g=4.0 mM, fNaBrO3g=sad 0.27 M, sbd 0.24 M sopentrianglesd and 0.30 Msclosed trianglesd.
=0.25–0.3 M, andfRusbpyd3 g=4 mMd results in a transi-
Downloaded 10 May 2005 to 129.64.51.111. Redistribution subject to AIP
t,-
el
ine
s
s
-
-
tion from black spots to white spots or labyrinthine Turpatterns. In all cases, the wavelength of the Turing patsblack or white spotsd decreases withwd fFig. 3sbdg. At evenlarger wds0.6–0.7d, above the onset of percolation, no stionary patterns could be found, and only waves wereserved.
The dependences of the wavelengthl of Turing patternon fMA g fFig. 3sadg and wd fFig. 3sbdg and the time depedence shown in Fig. 4sdd snote thatfMA g decreases wittimed suggest that one of the most important parameterfecting l is the bulk concentration of malonic acid, whichequal towdfMA g.
As Fig. 1 shows, a moderate increase infNaBrO3g sor infH2SO4gd leads to black spot patterns with a characterwavelengthsabout 0.35 mmd fFig. 1sddg, but further increasin fNaBrO3g yields black spot patterns without a characistic wavelengthfFig. 1sfdg, as seen also from the blurrring of the corresponding FFT. In general, patterns witan intrinsic wavelength can be considered as a set of lized stationary patterns. The latter can emerge via a subcal Turing instability or bistability. In the case of a subcritiTuring instability, the system should be very sensitive tocal perturbations, for example, due to small dust partiOur previous experiments with dash waves11 suggest that, iorder to be bistable in a closed reactor, the BZ-AOT sysshould possess two different pools of water nanodrowith significantly different radii. To choose between thalternatives, we performed experiments with dust partand with quasielastic light scattering.
Light scattering experiments revealed that an AOTcroemulsion loaded with the BZ reactantssfNaBrO3g
FIG. 4. Evolution of a Turing pattern in the BZ-AOT system.sad 5 minfcorresponds to 36 min insedg, sbd 45 min,scd 95 min after emergence of tfirst pattern. Frame size=5.634.2 mm2. sdd Time dependence of the wavlength of Turing patterns.sed Time series of bulk oscillations in a CSTrecorded as absorption atl=650 nm. Parameters:v=9, wd=0.39,fNaBrO3g=0.27 M, fMA g=0.10 M, fH2SO4g=0.32 M, fRusbpyd3
2+g=4.0 mM.
>fH2SO4g>0.3 M,fMA g=0.25 Md at wd,0.5 and v=9
license or copyright, see http://jcp.aip.org/jcp/copyright.jsp
erede aBZ
BZ-ou
eri-glasmed
eran-cles
nsate
/otstr-rge
cir--e o
e-rstced
m is
lityem:ck
ns
themer-
bulkime;opftart
tate
BZntionteepthishite
lyplotent
sing
lackor for
ap-raves
ters:
n
theh
ste
174706-4 Kaminaga, Vanag, and Epstein J. Chem. Phys. 122, 174706 ~2005!
has only a single narrow peak in the intensity of scattlight as a function of the droplet radius. Thus we havmonodisperse microemulsion, which suggests that theAOT system has only one steady state.
Small dust particles are inevitably present in theAOT system. To eliminate these particles we first carrieda simple filtration of the microemulsion through a 0.2mmteflon filter, as we usually do in our light scattering expments. We then carefully cleaned the surfaces of thewindows. Some dust particles, probably precipitate forin a reaction of the catalyst with bromine,21 are firmly ad-sorbed on the windows and require removal with sevsolventsse.g., ethanol, acetoned. Even such thorough cleaing procedures did not allow us to eliminate dust particompletely, but did significantly reduce their number.
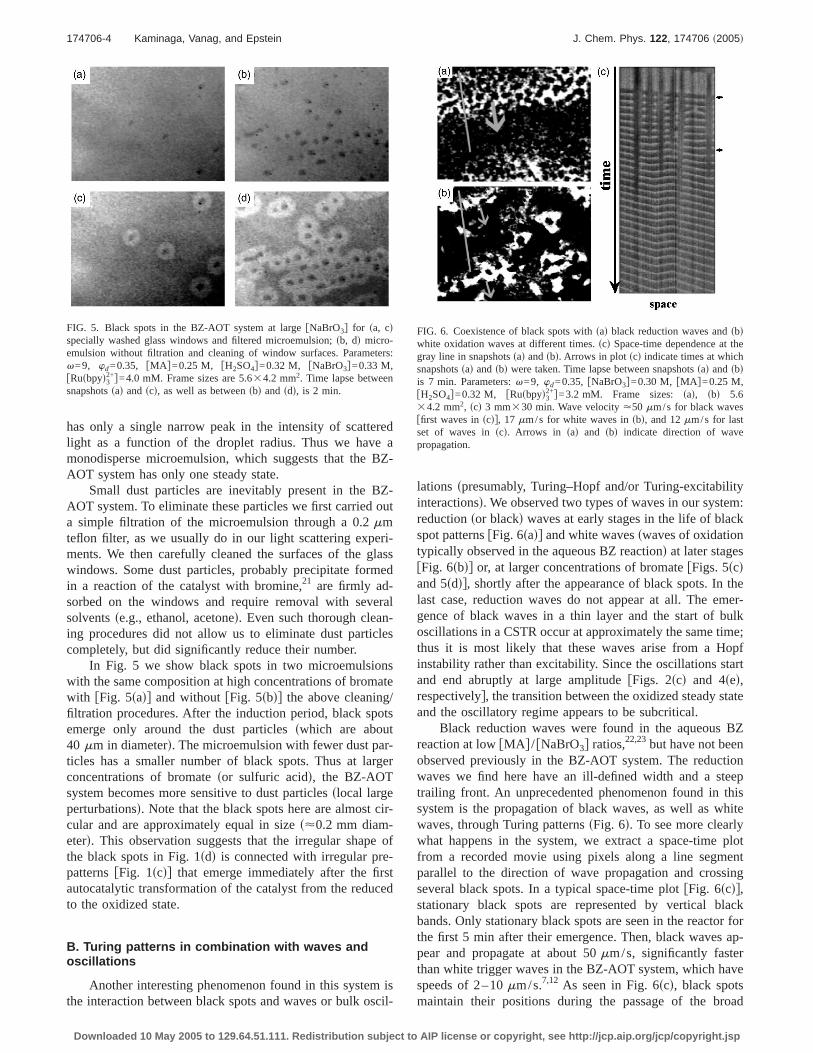
In Fig. 5 we show black spots in two microemulsiowith the same composition at high concentrations of bromwith fFig. 5sadg and withoutfFig. 5sbdg the above cleaningfiltration procedures. After the induction period, black spemerge only around the dust particlesswhich are abou40 mm in diameterd. The microemulsion with fewer dust paticles has a smaller number of black spots. Thus at laconcentrations of bromatesor sulfuric acidd, the BZ-AOTsystem becomes more sensitive to dust particlesslocal largeperturbationsd. Note that the black spots here are almostcular and are approximately equal in sizes<0.2 mm diameterd. This observation suggests that the irregular shapthe black spots in Fig. 1sdd is connected with irregular prpatternsfFig. 1scdg that emerge immediately after the fiautocatalytic transformation of the catalyst from the reduto the oxidized state.
B. Turing patterns in combination with waves andoscillations
Another interesting phenomenon found in this syste
FIG. 5. Black spots in the BZ-AOT system at largefNaBrO3g for sa, cdspecially washed glass windows and filtered microemulsion;sb, dd micro-emulsion without filtration and cleaning of window surfaces. Paramev=9, wd=0.35, fMA g=0.25 M, fH2SO4g=0.32 M, fNaBrO3g=0.33 M,fRusbpyd3
2+g=4.0 mM. Frame sizes are 5.634.2 mm2. Time lapse betweesnapshotssad and scd, as well as betweensbd and sdd, is 2 min.
the interaction between black spots and waves or bulk oscil
Downloaded 10 May 2005 to 129.64.51.111. Redistribution subject to AIP
-
t
s
l
r
f
lations spresumably, Turing–Hopf and/or Turing-excitabiinteractionsd. We observed two types of waves in our systreductionsor blackd waves at early stages in the life of blaspot patternsfFig. 6sadg and white wavesswaves of oxidatiotypically observed in the aqueous BZ reactiond at later stagefFig. 6sbdg or, at larger concentrations of bromatefFigs. 5scdand 5sddg, shortly after the appearance of black spots. Inlast case, reduction waves do not appear at all. The egence of black waves in a thin layer and the start ofoscillations in a CSTR occur at approximately the same tthus it is most likely that these waves arise from a Hinstability rather than excitability. Since the oscillations sand end abruptly at large amplitudefFigs. 2scd and 4sed,respectivelyg, the transition between the oxidized steady sand the oscillatory regime appears to be subcritical.
Black reduction waves were found in the aqueousreaction at lowfMA g / fNaBrO3g ratios,22,23but have not beeobserved previously in the BZ-AOT system. The reducwaves we find here have an ill-defined width and a strailing front. An unprecedented phenomenon found insystem is the propagation of black waves, as well as wwaves, through Turing patternssFig. 6d. To see more clearwhat happens in the system, we extract a space-timefrom a recorded movie using pixels along a line segmparallel to the direction of wave propagation and crosseveral black spots. In a typical space-time plotfFig. 6scdg,stationary black spots are represented by vertical bbands. Only stationary black spots are seen in the reactthe first 5 min after their emergence. Then, black wavespear and propagate at about 50mm/s, significantly fastethan white trigger waves in the BZ-AOT system, which hspeeds of 2–10mm/s.7,12 As seen in Fig. 6scd, black spot
FIG. 6. Coexistence of black spots withsad black reduction waves andsbdwhite oxidation waves at different times.scd Space-time dependence atgray line in snapshotssad andsbd. Arrows in plotscd indicate times at whicsnapshotssad andsbd were taken. Time lapse between snapshotssad andsbdis 7 min. Parameters:v=9, wd=0.35, fNaBrO3g=0.30 M, fMA g=0.25 M,fH2SO4g=0.32 M, fRusbpyd3
2+g=3.2 mM. Frame sizes:sad, sbd 5.634.2 mm2, scd 3 mm330 min. Wave velocity<50 mm/s for black waveffirst waves inscdg, 17 mm/s for white waves insbd, and 12mm/s for lasset of waves inscd. Arrows in sad and sbd indicate direction of wavpropagation.
-maintain their positions during the passage of the broad
license or copyright, see http://jcp.aip.org/jcp/copyright.jsp
for-are
k. Thri-
tes,ate.andting
lavestrig
neaprok, gho-ucewhaurine otica
ies
sceigs.
t totha
ves
xi-wee
lysoxi-atezed
henave
thetheear.
inu-e re
edalld, o
tiond
k-gin
n.
e,
cil-zed.ughig. 7
naryest ofoil
as in
hro-6
aceac-estsaveslated
f the
eee in:
174706-5 “Black spots” Belousov–Zhabotinsky reaction J. Chem. Phys. 122, 174706 ~2005!
black waves despite the fact that we temporarily lose inmation about the location of the spots while the wavespassing through them. Figure 6scd also shows that blacspots do not oscillate during the passage of black wavesblack spots are essentiallyswithin the accuracy of our expementd stationary during the propagation of black waves.
Black waves can be observed only for a few minuwhen the system is very close to the fully oxidized stThen, black waves gradually transform to white waves,after ca. 5–7 min we clearly see white waves propagathrough the still stationary black spotsfFig. 6sbdg. The veloc-ity of these white waves is about 17mm/s, which is stilhigher than that of trigger waves. The propagation of wthrough stationary black spots resembles the behavior ofger waves in the presence of small obstacles. If the lisize of the obstacle is small, as in our case, the waveceeds unchanged. Large obstacles cause waves to breaing rise to spirals. The difference is that our medium ismogeneous and our “obstacles” are islands of redcatalyst. Theoretical questions about how and undercircumstances waves are able to propagate through Tstructures will be discussed below. After the appearancwhite waves, the black spots slowly fade out as the verblack stripes in Fig. 6scd vanish. Finallyfbottom of Fig. 6scdgwe observe only thin white spiral waves with velocitaround 12mm/s.
At larger bromate concentrations, we find anothernario for the emergence of white waves. As shown in F5scd and 5sdd, after a stationary period black spots staremit white circular waves. Figure 5 clearly demonstratesthe simultaneous presence of black spots and white wapossible if the stationary steady state of the systemsgraybackgroundd lies between the fully reduced and fully odized states, so that the catalyst in the black spots is betthe fully reduced statesblackd and the backgroundsgrayd,while in the areas occupied by white waves, the cataconcentration is between the background and the fullydizedswhited levels. Figure 2scd suggests that the steady stindeed lies between the fully reduced and fully oxidistates, since the concentration during the periodTox corre-sponds to the pseudosteady state.
Note also that black spots remain clearly visible wwhite waves pass through them. In areas between two wson the gray backgroundd black spots are seen only atearly stages of white waves for several minutes afterwaves’ emergence. At later stages, black spots become ninvisible on the graysalmost blackd background, as in Fig6sbd. We interpret this behavior as arising from the contously changing steady state level, which approaches thduced steady state of the catalystfsee also Fig. 2scdg.
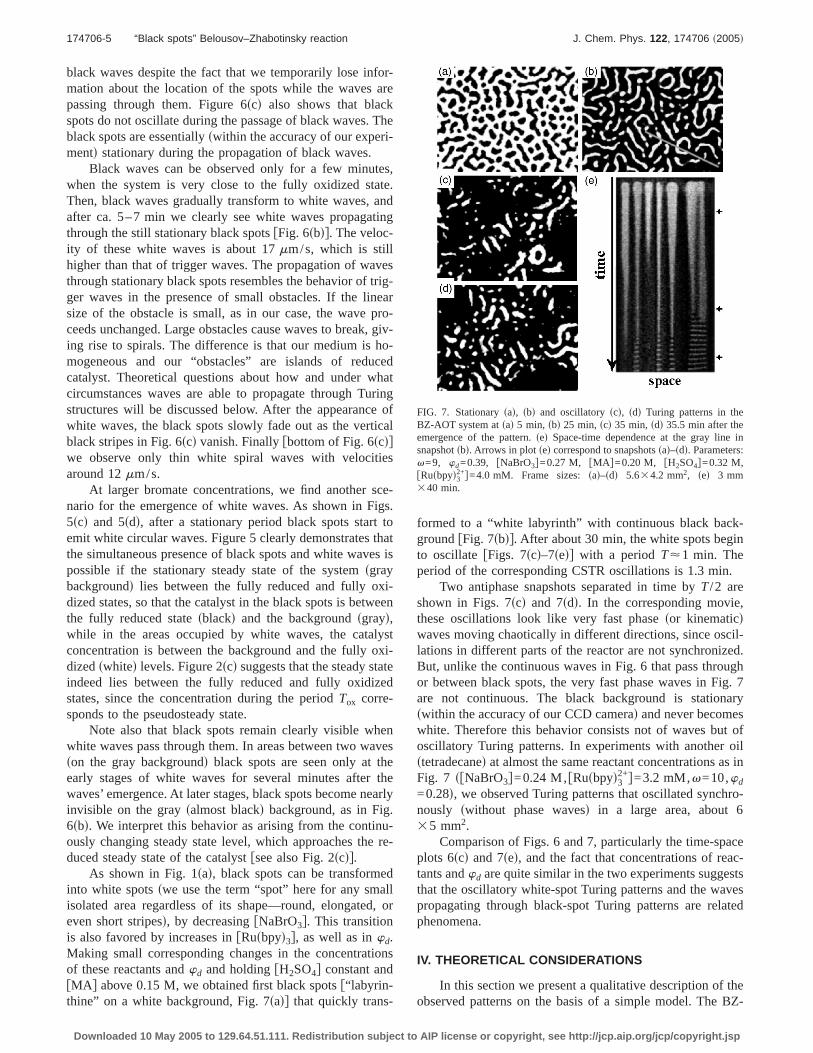
As shown in Fig. 1sad, black spots can be transforminto white spotsswe use the term “spot” here for any smisolated area regardless of its shape—round, elongateeven short stripesd, by decreasingfNaBrO3g. This transitionis also favored by increases infRusbpyd3g, as well as inwd.Making small corresponding changes in the concentraof these reactants andwd and holdingfH2SO4g constant anfMA g above 0.15 M, we obtained first black spotsf“labyrin-
thine” on a white background, Fig. 7sadg that quickly trans-Downloaded 10 May 2005 to 129.64.51.111. Redistribution subject to AIP
e
-r-iv-
dtgfl
-
tis
n
t
s
ly
-
r
s
formed to a “white labyrinth” with continuous black bacgroundfFig. 7sbdg. After about 30 min, the white spots beto oscillate fFigs. 7scd–7sedg with a periodT<1 min. Theperiod of the corresponding CSTR oscillations is 1.3 mi
Two antiphase snapshots separated in time byT/2 areshown in Figs. 7scd and 7sdd. In the corresponding movithese oscillations look like very fast phasesor kinematicdwaves moving chaotically in different directions, since oslations in different parts of the reactor are not synchroniBut, unlike the continuous waves in Fig. 6 that pass throor between black spots, the very fast phase waves in Fare not continuous. The black background is statioswithin the accuracy of our CCD camerad and never becomwhite. Therefore this behavior consists not of waves buoscillatory Turing patterns. In experiments with anotherstetradecaned at almost the same reactant concentrationsFig. 7 sfNaBrO3g=0.24 M,fRusbpyd3
2+g=3.2 mM,v=10,wd
=0.28d, we observed Turing patterns that oscillated syncnously swithout phase wavesd in a large area, about35 mm2.
Comparison of Figs. 6 and 7, particularly the time-spplots 6scd and 7sed, and the fact that concentrations of retants andwd are quite similar in the two experiments suggthat the oscillatory white-spot Turing patterns and the wpropagating through black-spot Turing patterns are rephenomena.
IV. THEORETICAL CONSIDERATIONS
In this section we present a qualitative description o
FIG. 7. Stationarysad, sbd and oscillatoryscd, sdd Turing patterns in thBZ-AOT system atsad 5 min, sbd 25 min,scd 35 min,sdd 35.5 min after themergence of the pattern.sed Space-time dependence at the gray linsnapshotsbd. Arrows in plotsed correspond to snapshotssad–sdd. Parametersv=9, wd=0.39, fNaBrO3g=0.27 M, fMA g=0.20 M, fH2SO4g=0.32 M,fRusbpyd3
2+g=4.0 mM. Frame sizes:sad–sdd 5.634.2 mm2, sed 3 mm340 min.
observed patterns on the basis of a simple model. The BZ-
license or copyright, see http://jcp.aip.org/jcp/copyright.jsp
s al
butatolic-nno
thenlackr su.the
laindr, isof
foreddi-catalystn th
a-he
lh
ngedly
tic
m
lac-
te.the
s.ingr
,
t
,f
oy.
-ntali-
174706-6 Kaminaga, Vanag, and Epstein J. Chem. Phys. 122, 174706 ~2005!
AOT system is so complex that no single model capturethe patterns found to date. The Field–Kőrös–Noyes model24
describes the chemistry of the BZ system quite well,contains a large number of variables. The Oregonmodel7,25 for the BZ reaction is simple, but does not expitly take into account the catalyst concentration and caexplain phenomena occurring at the oxidized state ofcatalyst, like reduction waves.23 This is a severe limitatiofor studying the phenomena of interest here, since bspots emerge at large concentrations of bromate and/ofuric acid, when the system is in the fully oxidized state
A model that nicely describes oscillations close tooxidized state26 has been applied successfully to expcollision-stable reduction waves,27 which we also observein our experiments. This many-variable model, howevestill quite complex and time consuming for simulationsthe spatially extended BZ-AOT system. We have theredeveloped a new Oregonator-like model with just one ational phenomenological term that shuts down the autolytic reaction when the concentration of oxidized cataapproaches its total concentration. This model is based ofollowing chemical equations:
2H+ + A + Y → X sk18d, s1d
H+ + X + Y → 0 sk28d, s2d
H+ + A + X + 2red→ 2X + 2Z sk38d, s3d
2X → 0 sk4d, s4d
B + Z → hY+ red sk58d, s5d
where A=BrO3−, B is a mixture of malonic and bromom
lonic acids,X=HBrO2, Y=Br−, red is the reduced state of tcatalyst, andZ is its oxidized statesfredg+fZg;C0d, h is astoichiometric coefficient,k38 andn3 fthe rate of reactions3dgdepend onfredg as
k38 = k39fredg/sfredg + cd, s6d
n3 = k39fXgfAgfH+gred/sfredg + cd, s7d
where c!C0, the total catalyst concentration. Iffredg@c,thenk38>k39 andn3=k38fXgfAgfH+g=k3fXg, as in the classicaOregonator modelsH+ andA=BrO3
− are present in such higinitial concentrations that they remain essentially unchaduring the reactiond. If fZg is close toC0 and consequentfredg!c, thenk38 tends to zero. Equationss6d ands7d reflectthe competition between the forward reaction
BrO2* + red→ HBrO2 + Z s8d
and the back reaction of radical recombination
BrO2* + BrO2
* → BrO3− + HBrO2. s9d
At large fredg, reactions8d dominates andk38>k39. At smallfredg, however, reactions9d prevails and the autocatalyreactions3d stops.
On introducing dimensionless variablesfXg=k3x/ f2k4g,fYg=k3y/k2, fZg=k3
2z/ sk4k5d, t=t /k5, and parametersf =2h,2
q=2k4k1/ sk2k3d, m=k3/ sC0k4k5d, «1=c/C0, «=k5/k3, whereDownloaded 10 May 2005 to 129.64.51.111. Redistribution subject to AIP
l
r
t
l-
-
e
k1=k18fH+g2fAg, k2=k28fH
+g, k3=k38fH+gfAg, k5=k58fBg, the
rate equations fors1d–s5d with diffusion terms take the for
]x/]t = s1/«dfsq − xdfz/sq + xd
+ xs1 − mzd/s«1 + 1 −mzd − x2g + DxDx, s10d
]z/]t = xs1 − mzd/s«1 + 1 −mzd − z+ DzDz, s11d
where the quasistationary state approximationdy/dt=0 hasbeen made. The diffusion coefficientsDx and Dz are alsodimensionless, and only their ratio is important. The Lapian D;]2/]r2 in 1D andD;]2/]x2+]2/]y2 in 2D, wherer,x, andy here represent spatial coordinates.
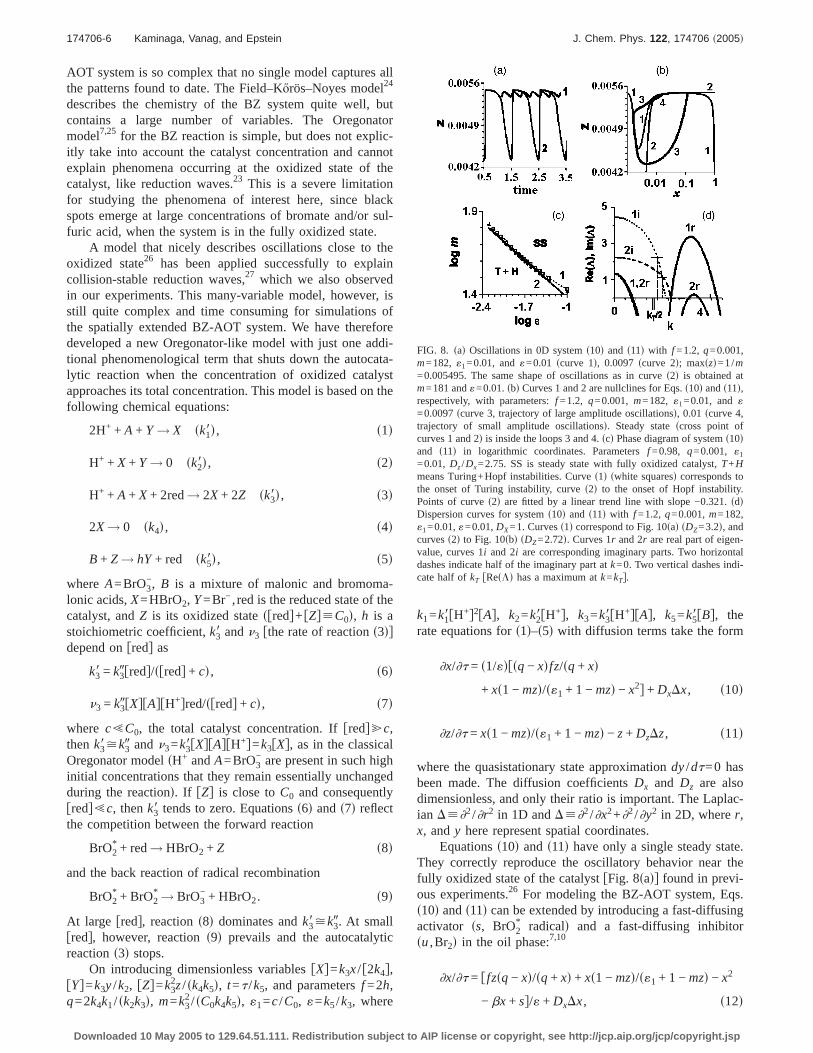
Equationss10d and s11d have only a single steady staThey correctly reproduce the oscillatory behavior nearfully oxidized state of the catalystfFig. 8sadg found in previ-ous experiments.26 For modeling the BZ-AOT system, Eqs10d ands11d can be extended by introducing a fast-diffusactivator ss, BrO2
* radicald and a fast-diffusing inhibitosu,Br2d in the oil phase:7,10
]x/]t = ffzsq − xd/sq + xd + xs1 − mzd/s«1 + 1 −mzd − x2
FIG. 8. sad Oscillations in 0D systems10d and s11d with f =1.2, q=0.001m=182, «1=0.01, and«=0.01 scurve 1d, 0.0097 scurve 2d; maxszd=1/m=0.005495. The same shape of oscillations as in curves2d is obtained am=181 and«=0.01.sbd Curves 1 and 2 are nullclines for Eqs.s10d ands11d,respectively, with parameters:f =1.2, q=0.001, m=182, «1=0.01, and«=0.0097scurve 3, trajectory of large amplitude oscillationsd, 0.01scurve 4trajectory of small amplitude oscillationsd. Steady statescross point ocurves 1 and 2d is inside the loops 3 and 4.scd Phase diagram of systems10dand s11d in logarithmic coordinates. Parametersf =0.98, q=0.001, «1
=0.01, Dz/Dx=2.75. SS is steady state with fully oxidized catalyst,T+Hmeans Turing+Hopf instabilities. Curves1d swhite squaresd corresponds tthe onset of Turing instability, curves2d to the onset of Hopf instabilitPoints of curves2d are fitted by a linear trend line with slope −0.321.sddDispersion curves for systems10d and s11d with f =1.2, q=0.001,m=182,«1=0.01,«=0.01,DX=1. Curvess1d correspond to Fig. 10sad sDZ=3.2d, andcurvess2d to Fig. 10sbd sDZ=2.72d. Curves 1r and 2r are real part of eigenvalue, curves 1i and 2i are corresponding imaginary parts. Two horizodashes indicate half of the imaginary part atk=0. Two vertical dashes indcate half ofkT fResLd has a maximum atk=kTg.
− bx + sg/« + DxDx, s12d
license or copyright, see http://jcp.aip.org/jcp/copyright.jsp
late
kfou
ndd,
Hoprgeem-ingrnsyrnsopf
cidison
ma-easno
r ofly-n i
s.
litym
futese
ase,,
eper
-
igs.
atak
i-asitive-
b-
eper-
are
eady
ts. If
t atlocalea,
ally
174706-7 “Black spots” Belousov–Zhabotinsky reaction J. Chem. Phys. 122, 174706 ~2005!
]z/]t = xs1 − mzd/s«1 + 1 −mzd − z− az+ gu + DzDz,
s13d
]s/]t = sbx − sd/«2 + DsDs, s14d
]u/]t = saz− gud/«3 + DuDu. s15d
This extension increases flexibility and allows us to simublack spots withDz=Dx. However, if we takeDz.Dx, thetwo-variable models10d ands11d is sufficient to obtain blacspots. Since these two equations are simpler than thevariable models12d–s15d, we employ them.
The systems10d ands11d can have both supercritical asubcritical Hopf bifurcationssbetween the fully oxidizesteady state and the oscillatory stated, can exhibit excitabilityand can show canard behaviorfsee Figs. 8sad and 8sbdg, inwhich a small parameter change near a supercriticalinstability transforms small amplitude oscillations to laamplitude oscillations. The combination of these bulk tporals0Dd behaviors with supercritical and subcritical Turinstabilities gives rise to a variety of spatiotemporal pattestationary Turing patternssblack spotsd, localized stationarTuring patterns, several types of oscillatory Turing patteincluding subharmonic Turing and subharmonic Hmodes, and reduction waves.
Two parameters of models10d and s11d, namely,« andm, depend on the concentrations of bromate, sulfuric aand malonic acid, which allows us to make a comparwith the experimental data;
« = sk58/k38dfBg/sfH+gfAgd, s16d
m= fk382/sk48k58dgfH
+g2fAg2/sC0fBgd. s17d
The parameterf depends on the ratio between the bromolonic and malonic acid concentrations and should incrwith time in our batch experiment, since initially there isbromomalonic acid, sof =0. Thus we assume thatf is smallwhen we are looking for black spots in the model.
As a first step in investigating the dynamical behaviosystems10d ands11d, we carried out a linear stability anasis and constructed dispersion curves, like those showFig. 8sdd. An eigenvalueL of the Jacobian matrix of Eqs10d and s11d with ResLd=0, ImsLdÞ0 at k=0 implies thesupercritical onset of a Hopf instability. If ResLd=0 andImsLd=0 at kÞ0, we have the onset of a Turing instabisalso supercriticald. Typical dynamical behavior of systes10d ands11d in the«-m parameter plane at smallf is shownin Fig. 8scd. Depending onDz/Dx, the Turing linesonset oTuring instabilityd can lie above or below the Hopf line, bthe two lines are always nearly parallel. The slope of thlines in logarithmic coordinates is about −0.3. If we incree.g., bromatesfAgd, as in the experiments shown in Fig. 1«decreases asfAg−1 and m increases asfAg2, in accord withEqs.s16d ands17d. Since the slope of lnfAg2 vs lnfAg−1 is −2,i.e., significantly less than −0.3, an increase infAg pushes thsystem toward the steady state domain, as we find in exment. Thus this simple test of models10d ands11d is consis
tent with our experimental results.Downloaded 10 May 2005 to 129.64.51.111. Redistribution subject to AIP
r-
f
:
,
,
e
n
i-
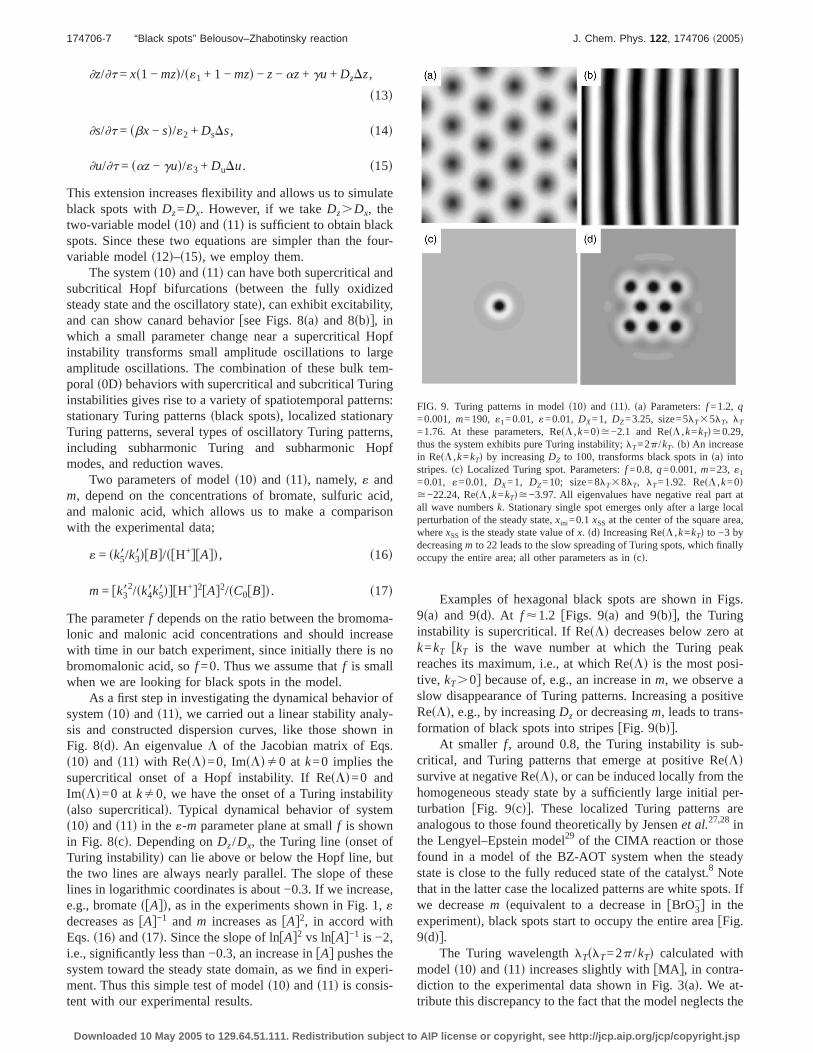
Examples of hexagonal black spots are shown in F9sad and 9sdd. At f <1.2 fFigs. 9sad and 9sbdg, the Turinginstability is supercritical. If ResLd decreases below zerok=kT fkT is the wave number at which the Turing pereaches its maximum, i.e., at which ResLd is the most postive, kT.0g because of, e.g., an increase inm, we observeslow disappearance of Turing patterns. Increasing a poResLd, e.g., by increasingDz or decreasingm, leads to transformation of black spots into stripesfFig. 9sbdg.
At smaller f, around 0.8, the Turing instability is sucritical, and Turing patterns that emerge at positive ResLdsurvive at negative ResLd, or can be induced locally from thhomogeneous steady state by a sufficiently large initialturbation fFig. 9scdg. These localized Turing patternsanalogous to those found theoretically by Jensenet al.27,28 inthe Lengyel–Epstein model29 of the CIMA reaction or thosfound in a model of the BZ-AOT system when the stestate is close to the fully reduced state of the catalyst.8 Notethat in the latter case the localized patterns are white spowe decreasem sequivalent to a decrease infBrO3
−g in theexperimentd, black spots start to occupy the entire areafFig.9sddg.
The Turing wavelengthlTslT=2p /kTd calculated withmodels10d ands11d increases slightly withfMA g, in contra-diction to the experimental data shown in Fig. 3sad. We at-
FIG. 9. Turing patterns in models10d and s11d. sad Parameters:f =1.2, q=0.001, m=190, «1=0.01, «=0.01, DX=1, DZ=3.25, size=5lT35lT, lT
=1.76. At these parameters, ResL ,k=0d>−2.1 and ResL ,k=kTd>0.29,thus the system exhibits pure Turing instability;lT=2p /kT. sbd An increasein ResL ,k=kTd by increasingDZ to 100, transforms black spots insad intostripes.scd Localized Turing spot. Parameters:f =0.8, q=0.001,m=23, «1
=0.01, «=0.01, DX=1, DZ=10; size=8lT38lT, lT=1.92. ResL ,k=0d>−22.24, ResL ,k=kTd>−3.97. All eigenvalues have negative real parall wave numbersk. Stationary single spot emerges only after a largeperturbation of the steady state,xini =0.1xSS at the center of the square arwherexSS is the steady state value ofx. sdd Increasing ResL ,k=kTd to −3 bydecreasingm to 22 leads to the slow spreading of Turing spots, which finoccupy the entire area; all other parameters as inscd.
tribute this discrepancy to the fact that the model neglects the
license or copyright, see http://jcp.aip.org/jcp/copyright.jsp
,uleion,
y
orycanur-the
,ring
ingng tsareby
odeally
n
e antill
cil-avio
ell-clikelri-Wes. Aenda
lFTturewesure
dic
ated-Thehav-
ar-is ex-een a
rd,
eig.
of
tyf
-le as
ternss aes,2.eter-fully
al
lead--ed
pa-
m
hownn
174706-8 Kaminaga, Vanag, and Epstein J. Chem. Phys. 122, 174706 ~2005!
reaction of MA with Br2. If Br2 is the fast-diffusing inhibitorthen its diffusion lengthld, the average distance a molecof Br2 diffuses before undergoing a chemical reactshould be strongly dependent onfMA g and wd. The TuringwavelengthlT should increase withld. The latter quantitwould decrease withfMA g if the MA-Br2 reaction weretaken into account.
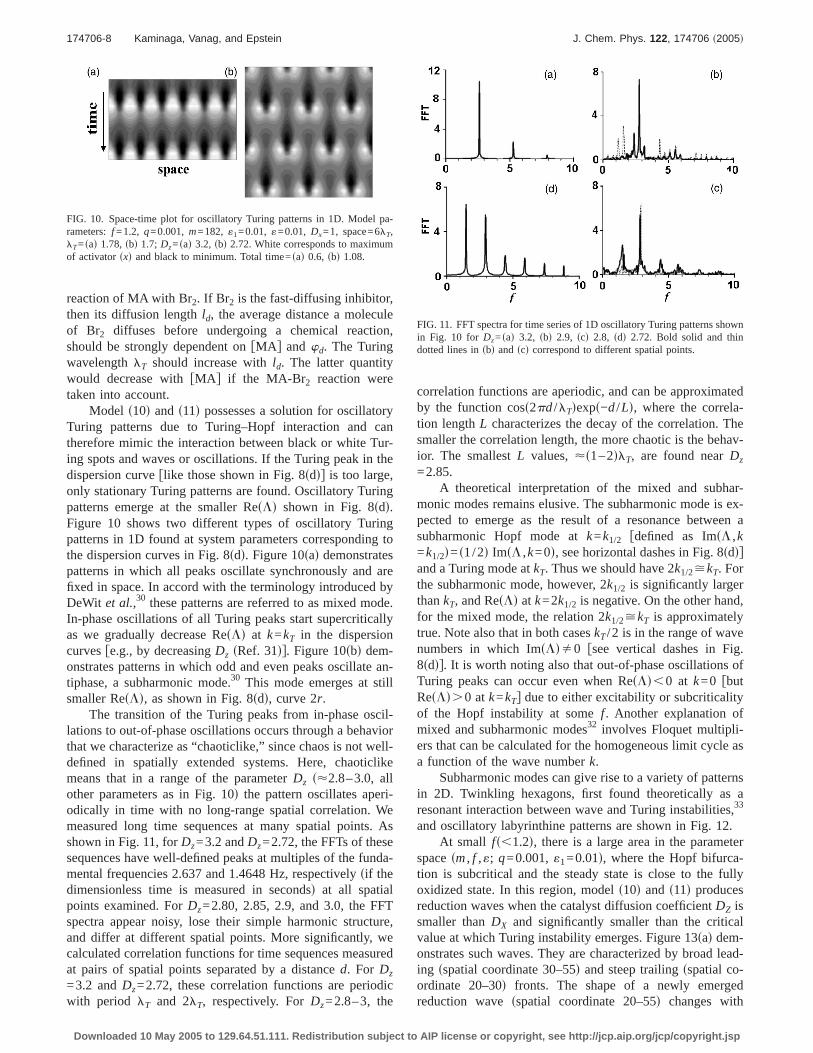
Model s10d and s11d possesses a solution for oscillatTuring patterns due to Turing–Hopf interaction andtherefore mimic the interaction between black or white Ting spots and waves or oscillations. If the Turing peak indispersion curveflike those shown in Fig. 8sddg is too largeonly stationary Turing patterns are found. Oscillatory Tupatterns emerge at the smaller ResLd shown in Fig. 8sdd.Figure 10 shows two different types of oscillatory Turpatterns in 1D found at system parameters correspondithe dispersion curves in Fig. 8sdd. Figure 10sad demonstratepatterns in which all peaks oscillate synchronously andfixed in space. In accord with the terminology introducedDeWit et al.,30 these patterns are referred to as mixed mIn-phase oscillations of all Turing peaks start supercriticas we gradually decrease ResLd at k=kT in the dispersiocurvesfe.g., by decreasingDz sRef. 31dg. Figure 10sbd dem-onstrates patterns in which odd and even peaks oscillattiphase, a subharmonic mode.30 This mode emerges at ssmaller ResLd, as shown in Fig. 8sdd, curve 2r.
The transition of the Turing peaks from in-phase oslations to out-of-phase oscillations occurs through a behthat we characterize as “chaoticlike,” since chaos is not wdefined in spatially extended systems. Here, chaotimeans that in a range of the parameterDz s<2.8–3.0, alother parameters as in Fig. 10d the pattern oscillates apeodically in time with no long-range spatial correlation.measured long time sequences at many spatial pointshown in Fig. 11, forDz=3.2 andDz=2.72, the FFTs of thessequences have well-defined peaks at multiples of the fumental frequencies 2.637 and 1.4648 Hz, respectivelysif thedimensionless time is measured in secondsd at all spatiapoints examined. ForDz=2.80, 2.85, 2.9, and 3.0, the Fspectra appear noisy, lose their simple harmonic strucand differ at different spatial points. More significantly,calculated correlation functions for time sequences meaat pairs of spatial points separated by a distanced. For Dz
=3.2 andDz=2.72, these correlation functions are perio
FIG. 10. Space-time plot for oscillatory Turing patterns in 1D. Modelrameters:f =1.2, q=0.001,m=182, «1=0.01, «=0.01, Dx=1, space=6lT,lT=sad 1.78,sbd 1.7; Dz=sad 3.2, sbd 2.72. White corresponds to maximuof activatorsxd and black to minimum. Total time=sad 0.6, sbd 1.08.
with period lT and 2lT, respectively. ForDz=2.8–3, the
Downloaded 10 May 2005 to 129.64.51.111. Redistribution subject to AIP
o
.
-
r
s
-
,
d
correlation functions are aperiodic, and can be approximby the function coss2pd/lTdexps−d/Ld, where the correlation lengthL characterizes the decay of the correlation.smaller the correlation length, the more chaotic is the beior. The smallestL values,<s1–2dlT, are found nearDz
=2.85.A theoretical interpretation of the mixed and subh
monic modes remains elusive. The subharmonic modepected to emerge as the result of a resonance betwsubharmonic Hopf mode atk=k1/2 fdefined as ImsL ,k=k1/2d=s1/2d ImsL ,k=0d, see horizontal dashes in Fig. 8sddgand a Turing mode atkT. Thus we should have 2k1/2>kT. Forthe subharmonic mode, however, 2k1/2 is significantly largethankT, and ResLd at k=2k1/2 is negative. On the other hanfor the mixed mode, the relation 2k1/2>kT is approximatelytrue. Note also that in both caseskT/2 is in the range of wavnumbers in which ImsLdÞ0 fsee vertical dashes in F8sddg. It is worth noting also that out-of-phase oscillationsTuring peaks can occur even when ResLd,0 at k=0 fbutResLd.0 atk=kTg due to either excitability or subcriticaliof the Hopf instability at somef. Another explanation omixed and subharmonic modes32 involves Floquet multipliers that can be calculated for the homogeneous limit cyca function of the wave numberk.
Subharmonic modes can give rise to a variety of patin 2D. Twinkling hexagons, first found theoretically aresonant interaction between wave and Turing instabiliti33
and oscillatory labyrinthine patterns are shown in Fig. 1At small fs,1.2d, there is a large area in the param
spacesm, f ,«; q=0.001,«1=0.01d, where the Hopf bifurcation is subcritical and the steady state is close to theoxidized state. In this region, models10d and s11d producesreduction waves when the catalyst diffusion coefficientDZ issmaller thanDX and significantly smaller than the criticvalue at which Turing instability emerges. Figure 13sad dem-onstrates such waves. They are characterized by broading sspatial coordinate 30–55d and steep trailingsspatial coordinate 20–30d fronts. The shape of a newly emerg
FIG. 11. FFT spectra for time series of 1D oscillatory Turing patterns sin Fig. 10 for Dz=sad 3.2, sbd 2.9, scd 2.8, sdd 2.72. Bold solid and thidotted lines insbd and scd correspond to different spatial points.
reduction wavesspatial coordinate 20–55d changes with
license or copyright, see http://jcp.aip.org/jcp/copyright.jsp
lead
r the
lla-are
ertion
deles
n ofa-lose
eticalanave--e totherto an the
ex-nari-spec-up-itial
ternst
dy-the
flso torns.ve-
cter-lit
ong
-
ent
-. At
lla-ertu
8e
174706-9 “Black spots” Belousov–Zhabotinsky reaction J. Chem. Phys. 122, 174706 ~2005!
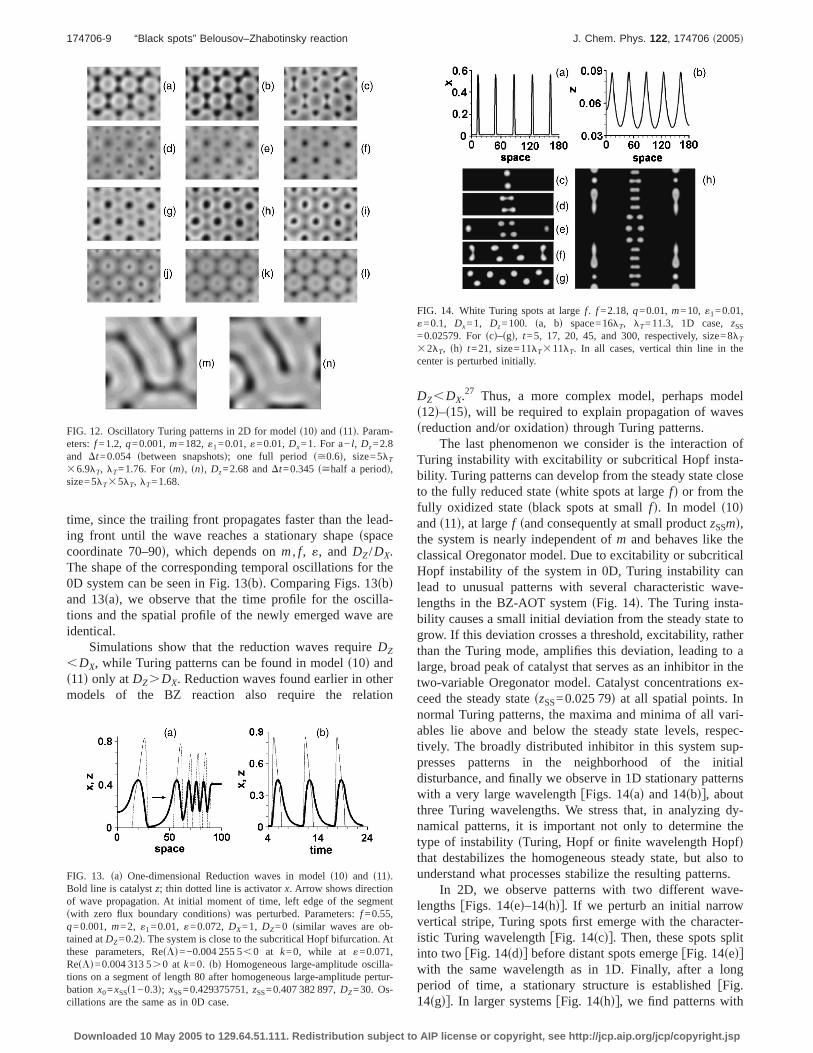
time, since the trailing front propagates faster than theing front until the wave reaches a stationary shapesspacecoordinate 70–90d, which depends onm, f, «, and DZ/DX.The shape of the corresponding temporal oscillations fo0D system can be seen in Fig. 13sbd. Comparing Figs. 13sbdand 13sad, we observe that the time profile for the oscitions and the spatial profile of the newly emerged waveidentical.
Simulations show that the reduction waves requireDZ
,DX, while Turing patterns can be found in models10d ands11d only atDZ.DX. Reduction waves found earlier in othmodels of the BZ reaction also require the rela
FIG. 12. Oscillatory Turing patterns in 2D for models10d ands11d. Parameters:f =1.2, q=0.001,m=182, «1=0.01,«=0.01,Dx=1. For a−l, Dz=2.8and Dt=0.054 sbetween snapshotsd; one full period s>0.6d, size=5lT
36.9lT, lT=1.76. Forsmd, snd, Dz=2.68 andDt=0.345 s>half a periodd,size=5lT35lT, lT=1.68.
FIG. 13. sad One-dimensional Reduction waves in models10d and s11d.Bold line is catalystz; thin dotted line is activatorx. Arrow shows directionof wave propagation. At initial moment of time, left edge of the segmswith zero flux boundary conditionsd was perturbed. Parameters:f =0.55,q=0.001, m=2, «1=0.01, «=0.072, DX=1, DZ=0 ssimilar waves are obtained atDZ=0.2d. The system is close to the subcritical Hopf bifurcationthese parameters, ResLd=−0.004 255 5,0 at k=0, while at «=0.071,ResLd=0.004 313 5.0 at k=0. sbd Homogeneous large-amplitude oscitions on a segment of length 80 after homogeneous large-amplitude pbation x0=xSSs1−0.3d; xSS=0.429375751,zSS=0.407 382 897,DZ=30. Os-
cillations are the same as in 0D case.Downloaded 10 May 2005 to 129.64.51.111. Redistribution subject to AIP
-
DZ,DX.27 Thus, a more complex model, perhaps mos12d–s15d, will be required to explain propagation of wavsreduction and/or oxidationd through Turing patterns.
The last phenomenon we consider is the interactioTuring instability with excitability or subcritical Hopf instbility. Turing patterns can develop from the steady state cto the fully reduced stateswhite spots at largefd or from thefully oxidized statesblack spots at smallfd. In model s10dands11d, at largef sand consequently at small productzSSmd,the system is nearly independent ofm and behaves like thclassical Oregonator model. Due to excitability or subcriHopf instability of the system in 0D, Turing instability clead to unusual patterns with several characteristic wlengths in the BZ-AOT systemsFig. 14d. The Turing instability causes a small initial deviation from the steady statgrow. If this deviation crosses a threshold, excitability, rathan the Turing mode, amplifies this deviation, leadinglarge, broad peak of catalyst that serves as an inhibitor itwo-variable Oregonator model. Catalyst concentrationsceed the steady stateszSS=0.025 79d at all spatial points. Inormal Turing patterns, the maxima and minima of all vables lie above and below the steady state levels, retively. The broadly distributed inhibitor in this system spresses patterns in the neighborhood of the indisturbance, and finally we observe in 1D stationary patwith a very large wavelengthfFigs. 14sad and 14sbdg, abouthree Turing wavelengths. We stress that, in analyzingnamical patterns, it is important not only to determinetype of instabilitysTuring, Hopf or finite wavelength Hopdthat destabilizes the homogeneous steady state, but aunderstand what processes stabilize the resulting patte
In 2D, we observe patterns with two different walengthsfFigs. 14sed–14shdg. If we perturb an initial narrowvertical stripe, Turing spots first emerge with the charaistic Turing wavelengthfFig. 14scdg. Then, these spots spinto two fFig. 14sddg before distant spots emergefFig. 14sedgwith the same wavelength as in 1D. Finally, after a lperiod of time, a stationary structure is establishedfFig.r-
FIG. 14. White Turing spots at largef. f =2.18,q=0.01,m=10, «1=0.01,«=0.1, Dx=1, Dz=100. sa, bd space=16lT, lT=11.3, 1D case,zSS
=0.02579. Forscd–sgd, t=5, 17, 20, 45, and 300, respectively, size=lT
32lT, shd t=21, size=11lT311lT. In all cases, vertical thin line in thcenter is perturbed initially.
14sgdg. In larger systemsfFig. 14shdg, we find patterns with
license or copyright, see http://jcp.aip.org/jcp/copyright.jsp
otsandof
Z-ingrnsisall-
tategthere
rns
ear-
rgettern
endom
sugs inan
g a
inadiithenewntra-
thoutise inl
ugh
ut inpletsseentslyution-
lity.
-bro-
ce oflack
bil-e andocal-spotsain,tate.the
iffu--
lackandtternsuringodelat-odeled
r-oralmstseentheen-
-
lually
in
174706-10 Kaminaga, Vanag, and Epstein J. Chem. Phys. 122, 174706 ~2005!
significantly different distances between neighboring spThis last case is extremely time consuming to simulate,we were able to calculate only a relatively short periodtime sup to t=21d.
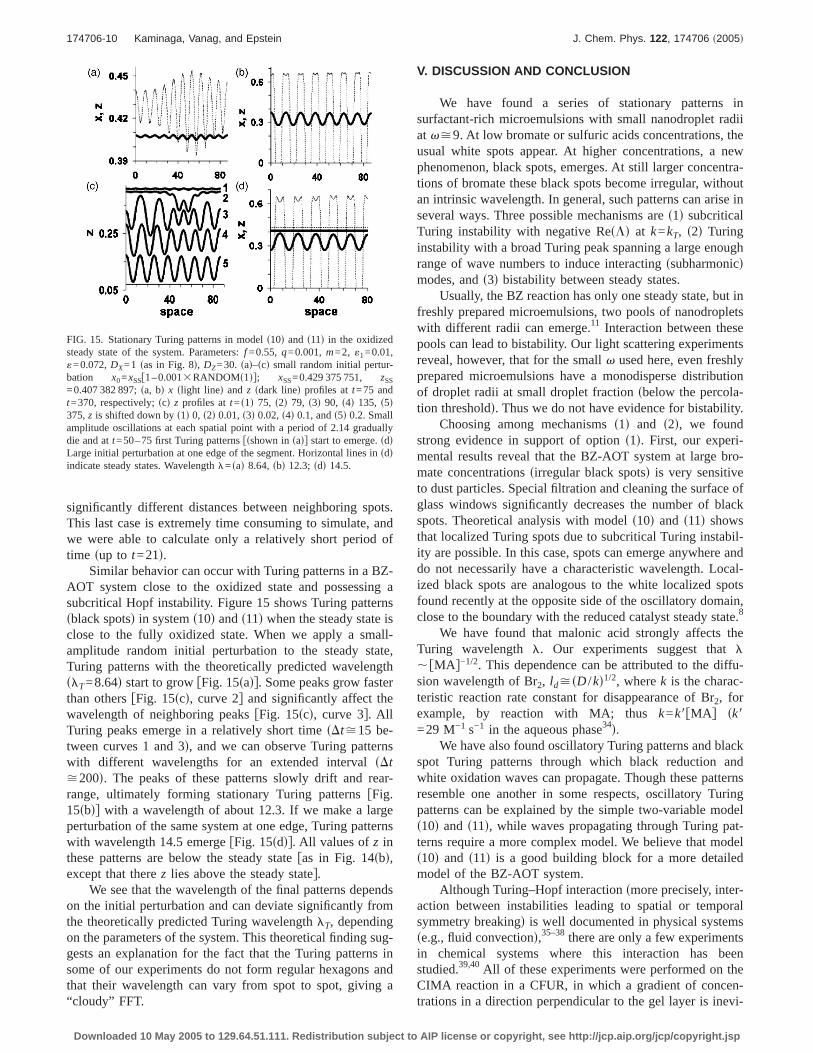
Similar behavior can occur with Turing patterns in a BAOT system close to the oxidized state and possesssubcritical Hopf instability. Figure 15 shows Turing pattesblack spotsd in systems10d ands11d when the steady stateclose to the fully oxidized state. When we apply a smamplitude random initial perturbation to the steady sTuring patterns with the theoretically predicted wavelenslT=8.64d start to growfFig. 15sadg. Some peaks grow fastthan othersfFig. 15scd, curve 2g and significantly affect thwavelength of neighboring peaksfFig. 15scd, curve 3g. AllTuring peaks emerge in a relatively short timesDt>15 be-tween curves 1 and 3d, and we can observe Turing pattewith different wavelengths for an extended intervalsDt>200d. The peaks of these patterns slowly drift and rrange, ultimately forming stationary Turing patternsfFig.15sbdg with a wavelength of about 12.3. If we make a laperturbation of the same system at one edge, Turing pawith wavelength 14.5 emergefFig. 15sddg. All values ofz inthese patterns are below the steady statefas in Fig. 14sbd,except that therez lies above the steady stateg.
We see that the wavelength of the final patterns depon the initial perturbation and can deviate significantly frthe theoretically predicted Turing wavelengthlT, dependingon the parameters of the system. This theoretical findinggests an explanation for the fact that the Turing patternsome of our experiments do not form regular hexagonsthat their wavelength can vary from spot to spot, givin
FIG. 15. Stationary Turing patterns in models10d and s11d in the oxidizedsteady state of the system. Parameters:f =0.55, q=0.001,m=2, «1=0.01,«=0.072,DX=1 sas in Fig. 8d, DZ=30. sad–scd small random initial perturbation x0=xSSf1–0.0013RANDOMs1dg; xSS=0.429 375 751, zSS
=0.407 382 897;sa, bd x slight lined and z sdark lined profiles att=75 andt=370, respectively;scd z profiles att=s1d 75, s2d 79, s3d 90, s4d 135, s5d375,z is shifted down bys1d 0, s2d 0.01,s3d 0.02,s4d 0.1, ands5d 0.2. Smalamplitude oscillations at each spatial point with a period of 2.14 graddie and att=50–75 first Turing patternsfsshown insadg start to emerge.sddLarge initial perturbation at one edge of the segment. Horizontal linessddindicate steady states. Wavelengthl=sad 8.64, sbd 12.3; sdd 14.5.
“cloudy” FFT.
Downloaded 10 May 2005 to 129.64.51.111. Redistribution subject to AIP
.
a
,
s
s
-
d
V. DISCUSSION AND CONCLUSION
We have found a series of stationary patternssurfactant-rich microemulsions with small nanodroplet rat v>9. At low bromate or sulfuric acids concentrations,usual white spots appear. At higher concentrations, aphenomenon, black spots, emerges. At still larger concetions of bromate these black spots become irregular, wian intrinsic wavelength. In general, such patterns can arseveral ways. Three possible mechanisms ares1d subcriticaTuring instability with negative ResLd at k=kT, s2d Turinginstability with a broad Turing peak spanning a large enorange of wave numbers to induce interactingssubharmonicdmodes, ands3d bistability between steady states.
Usually, the BZ reaction has only one steady state, bfreshly prepared microemulsions, two pools of nanodrowith different radii can emerge.11 Interaction between thepools can lead to bistability. Our light scattering experimreveal, however, that for the smallv used here, even freshprepared microemulsions have a monodisperse distribof droplet radii at small droplet fractionsbelow the percolation thresholdd. Thus we do not have evidence for bistabi
Choosing among mechanismss1d and s2d, we foundstrong evidence in support of options1d. First, our experimental results reveal that the BZ-AOT system at largemate concentrationssirregular black spotsd is very sensitiveto dust particles. Special filtration and cleaning the surfaglass windows significantly decreases the number of bspots. Theoretical analysis with models10d and s11d showsthat localized Turing spots due to subcritical Turing instaity are possible. In this case, spots can emerge anywherdo not necessarily have a characteristic wavelength. Lized black spots are analogous to the white localizedfound recently at the opposite side of the oscillatory domclose to the boundary with the reduced catalyst steady s8
We have found that malonic acid strongly affectsTuring wavelength l. Our experiments suggest thatl,fMA g−1/2. This dependence can be attributed to the dsion wavelength of Br2, ld>sD /kd1/2, wherek is the characteristic reaction rate constant for disappearance of Br2, forexample, by reaction with MA; thusk=k8fMA g sk8=29 M−1 s−1 in the aqueous phase34d.
We have also found oscillatory Turing patterns and bspot Turing patterns through which black reductionwhite oxidation waves can propagate. Though these paresemble one another in some respects, oscillatory Tpatterns can be explained by the simple two-variable ms10d and s11d, while waves propagating through Turing pterns require a more complex model. We believe that ms10d and s11d is a good building block for a more detailmodel of the BZ-AOT system.
Although Turing–Hopf interactionsmore precisely, inteaction between instabilities leading to spatial or tempsymmetry breakingd is well documented in physical systese.g., fluid convectiond,35–38there are only a few experimenin chemical systems where this interaction has bstudied.39,40All of these experiments were performed onCIMA reaction in a CFUR, in which a gradient of conc
trations in a direction perpendicular to the gel layer is inevi-license or copyright, see http://jcp.aip.org/jcp/copyright.jsp
narb
lyThe
ernsncems,tial
rnstterther
unes.
262
ine
ess,
ture
. Let
m.
ica D
, J.
ett. A
ig.
cen-
bulk
em.
orck-
t--
174706-11 “Black spots” Belousov–Zhabotinsky reaction J. Chem. Phys. 122, 174706 ~2005!
table. These patterns, which are a combination of statioTuring spots and propagating phase waves, caninterpreted41 in terms of two sublayers or planessthe top andbottom of the reactive gel layerd, one of which contains onTuring patterns, while the other one supports waves.experiments described here with oscillatory Turing pattsFigs. 6 and 7d provide the strongest experimental evideto date of the Turing–Hopf interaction in chemical systesince our batch reactor is homogeneous and essengradient-free.
With the identification of the black-spot Turing patteand related phenomena described here, the gallery of pain the BZ-AOT system is becoming more complete. Furresearch is needed on pattern formation in other hithertoexplored regions in the space of microemulsion structur
ACKNOWLEDGMENT
This work was supported by Grant No. CHE-0306from the National Science Foundation.
1B. P. Belousov,Collection of Short Papers on Radiation MedicsMedgiz, Moscow, 1959d, pp. 145–152sin Russiand.
2A. M. Zhabotinsky, Proc. Acad. Sci. USSR157, 392 s1964d.3T. Yamaguchi, L. Kuhnert, Zs. Nagy-Ungvarai, S. C. Müller, and B. HJ. Phys. Chem.95, 5831s1991d.
4D. Winston, M. Arora, J. Maselko, V. Gáspár, and K. Showalter, NasLondond 351, 132 s1991d.
5T. Amemiya, M. Nakaiwa, T. Ohmori, and T. Yamaguchi, Physica D84,103 s1995d.
6J. Maselko and K. Showalter, NaturesLondond 339, 609 s1989d.7V. K. Vanag and I. R. Epstein, Phys. Rev. Lett.87, 228301s2001d.8V. K. Vanag and I. R. Epstein, Phys. Rev. Lett.92, 128301s2004d.9V. K. Vanag and I. R. Epstein, Science294, 835 s2001d.
10V. K. Vanag and I. R. Epstein, Phys. Rev. Lett.88, 088303s2002d.11V. K. Vanag and I. R. Epstein, Phys. Rev. Lett.90, 098301s2003d.12V. K. Vanag and I. R. Epstein, Proc. Natl. Acad. Sci. U.S.A.100, 14635
s2003d.13A. M. Turing, Philos. Trans. R. Soc. London, Ser. B237, 37 s1952d.14V. Castets, E. Dulos, J. Boissonade, and P. De Kepper, Phys. Rev
64, 2953s1990d.15Q. Ouyang and H. L. Swinney, NaturesLondond 352, 610 s1991d.16
M. Kotlarchyk, S. H. Chen, and J. S. Huang, J. Phys. Chem.86, 3273Downloaded 10 May 2005 to 129.64.51.111. Redistribution subject to AIP
ye
ly
ns
-
t.
s1982d.17P. L. Luisi, M. Giomini, M. P. Pileni, and B. H. Robinson, Biochi
Biophys. Acta 947, 209 s1988d.18T. K. De and A. Maitra, Adv. Colloid Interface Sci.59, 95 s1995d.19V. K. Vanag sunpublishedd.20FlexPDE, http://www.pdesolutions.com/flexpde.htms2001d.21S. Kéki, I. Magyar, M. T. Beck, and V. Gáspár, J. Phys. Chem.96, 1725
s1992d.22P. Kastanek, J. Kosek, D. Snita, I. Schreiber, and M. Marek, Phys
84, 79 s1995d.23M. Marek, P. Kastanek, and S. C. Müller, J. Phys. Chem.98, 7452s1994d.24R. J. Field, E. Körös, and R. M. Noyes, J. Am. Chem. Soc.94, 8649
s1972d.25R. J. Field and R. M. Noyes, J. Chem. Phys.60, 1877s1974d.26A. M. Zhabotinsky, F. Buchholtz, A. B. Kiyatkin, and I. R. Epstein
Phys. Chem.97, 7578s1993d.27J. Kosek and M. Marek, Phys. Rev. Lett.74, 2134s1995d.28O. Jensen, V. O. Pannbacker, G. Dewel, and P. Borckmans, Phys. L
179, 91 s1993d.29I. Lengyel and I. R. Epstein, Proc. Natl. Acad. Sci. U.S.A.89, 3977
s1992d.30A. De Wit, D. Lima, G. Dewel, and P. Borckmans, Phys. Rev. E54, 261
s1996d.31As we have noted, ResLd at k=kT in the dispersion curves, shown in F
8sdd as curves 1r or 2r, can be decreased either by increasingm or bydecreasingDz. Variations inm correspond to changes in reactant contrations. In our simulations, we have chosen to varyDz swhich is probablyconstant in actual experimentsd, since in this case the steady state andbehavior of the model remain unchanged.
32L. Yang, A. M. Zhabotinsky, and I. R. Epstein, Phys. Rev. Lett.92,198303s2004d.
33Yu. A. Logvin, T. Ackemann, and W. Lange, Europhys. Lett.38, 583s1997d.
34H.-D. Försterling, L. Stuk, A. Barr, and W. D. McCormick, J. Phys. Ch97, 2623s1993d.
35D. P. Vallette, W. S. Edwards, and J. P. Gollub, Phys. Rev. E49, R4783s1994d.
36I. Rehberg and G. Ahlers, Phys. Rev. Lett.55, 500 s1985d.37B. J. A. Zielinska, D. Mukamel, and V. Steinberg, Phys. Rev. A33, 1454
s1986d.38P. Kolodner, Phys. Rev. E48, R665s1993d.39J.-J. Perraud, A. De Wit, E. Dulos, P. De Kepper, G. Dewel, and P. B
mans, Phys. Rev. Lett.71, 1272s1993d.40B. Rudovics, E. Dulos, and P. De Kepper, Phys. Scr., TT67, 43 s1996d.41J. Boissonade, E. Dulos, and P. De Kepper, inChemical Waves and Pa
terns, edited by R. Kapral and K. ShowaltersKluwer Academic, Dor
drecht, 1995d, pp. 221–268.license or copyright, see http://jcp.aip.org/jcp/copyright.jsp