Embed Size (px)
Citation preview

1
MKT80005 MARKETING DECISION TOOLS BLACK SNAKE PRODUCTIONS Metrics for Wildlife-based demonstrations at Shopping Centers
Submitted to: Dr. Ann Mitsis Submitted By: Isha Arora (2077035) 2nd June 2014

2
EXECUTIVE SUMMARY
This report is commissioned to provide a suitable mix of metrics on the dashboard for
the wildlife-based demonstrations at shopping centers to the marketing department of
Black Snake Productions.
These events at shopping centers in one amongst a few initiatives at Black Snake
Productions that caters to the need of educating and making people aware about the
existence and conservation of the incredible wildlife in Australia as disappearing of
these species is quite an environmental concern.
A few assumptions have been made with regards to the objectives of Black snakes ion
order to choose the appropriate metrics to monitor the marketing performance of the
company as far as the shopping center events are concerned. It has been observed that
the company is not that recognized by its audiences and greater significance needs be
directed at creating brand awareness and consumer engagement on both B2B & B2C
platforms to enhance performance. The dashboard is geared to a conservative
approach rather than a heavy above the line advertising and campaigning.
Several key metrics have been selected, however six metrics have been tracked as
critical to the company’s objectives. In terms of market profitability, ‘Net Marketing
Contribution’ of the shopping center events has been measured and tactics to
operationalize that have been outlined.
A few other metrics on the dashboard are ‘Brand Awareness’ about the organisation
and its initiatives to gauge interest and involvement. Aligned to its objectives,
measuring customer metrics such as ‘Visitors’ at events, ‘Customer Satisfaction’ and
‘Retention’ and ‘Net Promoter Score’ have been justified to understand the level of
brand advocacy amongst its audiences. Digital metrics such as ‘Unique Visitors’,
‘Social Media Engagement’ and ‘SEO’ have been described as vital to tracking its
marketing performance. In addition, ‘Response Rate’ is tracked from the marketing
activities with regards to electronic direct mail campaigns pre and post event.
With these metrics, we recommend quarterly and yearly reviewing to track
performance and progress and understanding the loopholes to be reviewed.

3
TABLE OF CONTENTS EXECUTIVE SUMMARY ......................................................................................... 2
1. SCOPE ................................................................................................................... 4
2. OBJECTIVES ....................................................................................................... 4
3. BACKGROUND ................................................................................................... 5 3.1 COMPANY ....................................................................................................... 5 3.2 INITIATIVE ..................................................................................................... 5
4. RECOMMENDED METRICS ............................................................................ 6 4.1 PROFITABILITY METRICS ........................................................................... 7
4.1.1 NET MARKETING CONTRIBUTION .................................................... 7 4.2 IMAGE ............................................................................................................. 8
4.2.1 BRAND AWARENESS ............................................................................ 8 4.3 CUSTOMER ..................................................................................................... 9
4.3.1 FOOTFALL/ VISITORS AND ITS SOURCE .......................................... 9 4.3.2 CUSTOMER SATISFACTION ................................................................. 9 4.3.3 CUSTOMER RETENTION ..................................................................... 10 4.3.4 NET PROMOTER SCORE ..................................................................... 10
4.4 PROMOTION ................................................................................................. 11 4.4.1 RESPONSE RATE .................................................................................. 11
4.5 DIGITAL ........................................................................................................ 12 4.5.1 SOCIAL MEDIA ENGAGEMENT ........................................................ 12 4.5.2 SEARCH ENGINE OPTIMIZATION .................................................... 12 4.5.3 VISITORS ................................................................................................ 14
5. METRIC DASHBOARD ................................................................................... 15
6. JUSTIFICATION OF INTEGRATION TO OTHER INITIATIVES .......... 22
7. RECOMMENDATIONS ................................................................................... 23
8. CONCLUSION ................................................................................................... 23
9. REFERENCES ................................................................................................... 24
10. APPENDICES ................................................................................................... 26

4
1. SCOPE The scope of this report is to identify a set of key metrics to measure the success of
Black Snake Productions’ (Black Snakes) initiative of organizing events at shopping
centres in business-to-consumer (B2C) and business-to-business (B2B) setting.
2. OBJECTIVES This report attempts to consider and examine a set of metrics to measure and track the
performance of Black Snake Productions initiative of having wildlife-based
demonstrations in the shopping centers to spread public awareness towards the issue
of disappearing wildlife and how can it be conserved.
However, before selecting the appropriate set of metrics and creating a metric
dashboard for the company, establishing the organizational goals and objectives is
fundamental. With the primary goal to increase brand awareness amongst Australians,
thereby educating the public for wildlife conservation, a few objectives have been
outlined in the Table 1 below –
Table 1 – Summary of Black Snake Productions’ Goals and Objectives
Category Objective
Profitability To increase revenue by 25% by 31st July 2015
Brand Image To increase brand awareness amongst its B2C target market to 20% by 31st July 2015
Customer To increase customer engagement and involvement in their initiatives and retain its current customers To increase willingness to recommend further
Digital To increase online presence and brand recognition by increasing monthly visitors to at least 1000 per month by 31st July 2015
Promotion To establish a database of at least 10,000 people and increase response rate by atleast 15% for their eDM campaign

5
3. BACKGROUND
3.1 COMPANY
Black Snake Productions caters to the need to educate and make people aware about
the existence and conservation of the incredible wildlife in Australia. Essentially, it is
going to be one of the amazing experiences for the future generations to be
surrounded by these wonderful creatures and therefore, disappearing of these species
is quite an environmental concern (Black Snake Productions, 2009)
Founded in November 2006 and spearheaded by Michael Alexander, Black Snake
Productions has been giving a chance to the Australians to touch, feel and experience
the massive range of animals such as reptiles, birds, scorpions, and a more, thereby,
educating everyone for their conservations through events at schools, day cares,
shopping centers, birthday parties, corporate events, and much more (Black Snake
Productions, 2009).
3.2 INITIATIVE
Amongst a number of initiatives and events that Black Snake has been organising in
order to gauge interests of Australians and educate them about the significance of the
amazing wildlife, wildlife based demonstrations at ‘Shopping Centers’ across
Melbourne during school holidays, is the one that strives to educate and entertain
family audiences, primarily.
Since these demonstrations not only involves direct interaction with the adults
(present generation) responsible for the wildlife protection, but also children (future
generation) who should understand its consequences at a common platform, events at
shopping centers are the most appropriate means of educating and entertaining
audiences (Black Snake Productions, 2009).

6
4. RECOMMENDED METRICS We propose the use of 10 key marketing metrics to assist Black Snake Productions
understand, measure, and track and examine their marketing performance in their
industry.
Table 2 depicts the summary of the proposed key metrics that are significant for
Black Snake productions in their B2C and B2B environment.
Table 2 – Summary of the proposed key Marketing Metrics
Category Metrics
1 Profitability Net Marketing Contribution
2 Image Brand Awareness
3
Customer
Footfall/ Visitors and its Source
4 Customer Satisfaction
5 Customer Retention
6 Net Promoter Score
7 Promotion Response Rate
8
Digital
Social Media Engagement
9 SEO
10 Unique Visitors
Refer to Appendix 1 for the summarized description of these 10 key metrics.

7
4.1 PROFITABILITY METRICS
4.1.1 NET MARKETING CONTRIBUTION
Net Marketing Contribution (NMC) is a market profitability metric that helps
determine the marketing contribution of a product/ service to the overall organization.
It basically differentiates the marketing and sales expenses associated with the
marketing activities from the firm’s operating expenses as a share of the firm’s gross
profit (Best 2009, p. 44)
The Formula for Net Marketing Contribution is –
Net Marketing Contribution = Sales
Revenue X % Gross Profit – Marketing & Sales Expenses
Table 3 – Net marketing Contribution Metric
Analytic Descriptors Sales Revenue Gross revenue from shopping centers
marketing team % Gross Profit Revenue less cost of equipment/ display
materials, as a percentage of revenue Marketing and Sales Expenses
The expenses related to marketing and support services
Net Marketing Contribution
The contribution of marketing as a share of gross profit
(Best 2009) It is an important metric; as it benefits the marketing function justify the contribution
of marketing activities for a product/ service line(s) to the overall success of the
organisation.

8
4.2 IMAGE
4.2.1 BRAND AWARENESS
Farris et. al. (2008, p. 33) describes ‘Brand awareness’ as the likelihood of the
customers to recognise and recall the existence of an organisation and/ or its products/
services and can be unprompted and prompted.
The Formula for Brand Awareness is –
Brand Awareness = Unprompted
Awareness + Prompted Awareness
Table 4 – Brand Awareness Metric
Analytic Descriptors Unprompted Awareness Likelihood of brand recall when provided
brand attributes/ objectives Prompted Awareness Likelihood of awareness and knowledge when
provided with the brand name (brand recognition)
Brand Awareness Likelihood of the customers to recognise and recall the existence of an organisation/ products/ services
(Farris et. al. 2008) Measuring ‘Brand awareness’ is vital to an organisation as success of any business
revolves around what customers know and feel about its existence and its
undertakings, which will help build and intensify the business profile amongst its
business and end-customers.

9
4.3 CUSTOMER Customer metrics are essential to cater to the need of increasing brand awareness to
further seek involvement amongst the Australians in both B2C and B2B settings.
4.3.1 FOOTFALL/ VISITORS AND ITS SOURCE Events and demonstrations are mainly conceptualized in order to attract and invite a
huge number of (target) audiences at a common platform and disseminate relevant
information to seek involvement and participation. It is understood that higher the
number of visitors at any particular event; larger is the increase in brand awareness,
lead generation, customer database and revenues of the firm.
The company may make use of various channels such as direct mails, social media,
website, advertisements or outdoor advertising to promote their event to interest and
reach maximum people. It is worthwhile to track and monitor the sources of these
promotions and invitations to ascertain the effective media usages amongst the
audience, and can be optimized to generate higher event success rate, as the registered
visitors will always be different than the actual number of visitors.
4.3.2 CUSTOMER SATISFACTION Customer Satisfaction is the level of perceived satisfaction experienced by customers
in terms of their engagement and experience with the organisation as a whole or their
products/ services (Best 2009, p. 9). It is usually measured on a 5-point (or a 7-point)
likert scale where 5 is ‘extremely satisfied’ and 1 is ‘extremely dissatisfied’.
Table 5 – Customer Satisfaction Metric
Extremely Satisfied
Somewhat Satisfied Neutral Somewhat
Dissatisfied Extremely Dissatisfied
5 4 3 2 1
Customer Satisfaction Surveys can be developed, wherein people/ respondents can be
questioned on various parameters such as product quality, ease of purchase, customer
support and the overall brand experience (Farris et. al. 2008, p. 39).

10
It helps the business gauge and measure success of their current product or service
offerings as the metric clearly articulates the consumer’s involvement, liking, positive
word-of-mouth publicity, thereby contributing to its overall objective of making
profits (Best 2009, p. 9). It leads to consumers’ willingness to recommend, as only
satisfied customers would be willing to recommend the brand to others and can serve
as a powerful marketing advantage (Farris et. al 2008, p. 37).
4.3.3 CUSTOMER RETENTION
Customer Retention can be understood as ‘holding and maintaining’ the satisfied and
loyal customers which directly has an impact on the company’s profitability and
reputation. It boosts the company’s effort to maintain and sustain long-term
relationships with their B2C and B2B customers. It demands high levels of customer
satisfaction to ensure high levels of customer retention (Best 2009, p. 16- 17)
Table 6 – Customer Retention Metric
Definitely will
repurchase
Plan To
Repurchase
Probably will
Repurchase
Probably will not
repurchase
Will Not
Repurchase
Definitely will not
Repurchase
The satisfied, loyal customers that can be retained are the actual brand advocates and
often share their experiences with the brand with peers and family and others, which
may further trigger the introduction of new potential customers to the business and for
a newer business, it is extremely important to retain current customers to acquire new.
(p. 22).
4.3.4 NET PROMOTER SCORE
Net Promoter Score (NPS) is typically a measure of a customer’s conviction. In
simple terms, it measures the degree to which a customer recommends a product,
service or a brand, thereby demonstrating confidence in its value. The consumers can
be termed as ‘Promoters, ‘Passives’ or ‘Detractors’ and can be sampled on a scale of
0 – 10, where 10 being extremely likely to recommend (Best 2009, p. 19-20).

11
The Formula for Net Promoter Score is –
Net Promoter Score (NPS) = % Promoters – % Detractors
Table 7 – Net Promoter Score Metric
Analytic Descriptors % of Promoters Audience that scored 9 or 10 % of Detractors Audience that scored 0 to 6 Net Promoter Score The degree to which a customer recommends
a product, service or a brand (Best 2009)
It is vital as NPS is closely linked to organisational growth and strong promotion by
customers and intermediaries is a valuable way of communicating and spreading.
4.4 PROMOTION
4.4.1 RESPONSE RATE
Davis (2013) explains Response Rate as the percentage of people who respond to a
call, an email or any other form of communication to the total number of people who
were exposed to this communication. It can be used to target audiences by sending
direct mails to their new and existing database, as it is an inexpensive step to convey
the existence of a brand and its products and its advantages to its consumers.
The Formula for Response Rate is –
Response
Rate (%) =
Number of People who read/ responded to an eDM (#) X100
Number of people in the database (#)
It is a key metric to determine the number of people who are keen to know about an
organisation and its offerings, thereby generating prospective leads. These people can
then be targeted and induced to buy at their conviction stage and can also act as brand
advocates, spreading positive word-of-mouth.

12
4.5 DIGITAL
4.5.1 SOCIAL MEDIA ENGAGEMENT
Social Media is one of the most recent and currently ongoing platforms to spread
brand awareness in the most inexpensive ways, thereby having a presence in the
target audience’s mind. As majority of Australian population is using social media
platform like Facebook, YouTube, Twitter, etc., it has become a little easier to reach
your target audience and engage them on these platforms.
By being proactive and writing content appropriate for your TG, increased social
engagement can be achieved. Interaction via social media helps build and enhance
your online presence and provides uninterrupted insights into what customers like and
want and being more active to influencers and brand advocates (Vocus, 2013)
4.5.2 SEARCH ENGINE OPTIMIZATION
Search Engine Optimization (SEO) influences page ranks (PR) in search results, and
makes the web page more visible to its viewers. It needs to be understood that
‘KeyWords’ are the most important component of SEO. Further, tracking the right
metrics is very important for SEO success. Some of the important sub-metrics to track
are –
• Number of pages indexed, percentage of sight indexed • PageRank Score • Ranking by keywords • Unique pages: Number of unique pages crawled by search engine bouts like
googlebot. • Visitors per keyword – ratio of search engine delivered visitors to search terms
Search Engine Performance can be measured by –
• Google Trends • Google Analytics
(http://www.google.com/trends/explore#q=black%20snake%2C%20black%20snake%20production%2C%20snake%2C%20wildlife&geo=AU&cmpt=q)
• WooRank (http://www.woorank.com/en/www/blacksnakeproductions.com.au), which provides graphical relative search comparison

13
These software/ tools help calculates page ranks, keyword consistency, and number of
links, indexed pages and other important information.
For Instance, below are few snapshots from Google Trends
`

14
4.5.3 VISITORS
By definition unique visitor is “The number of inferred individual people (filtered for
spiders and robots), within a designated reporting timeframe, with activity consisting
of one or more visits to a site. Each individual is counted only once in the unique
visitor measure for the reporting period.”
• Unique Visitors can be of different types based on time periods (hourly, daily,
weekly, monthly, etc.) within a time reference (time frame). If you change
your time frame, it is likely to affect the tally of the time periods.
• Authentication or user registration through login can be a measurement of
unique users. But as most web pages do not require a login so persistent
cookies are used instead.
• Services available to calculate unique visitors
! Google Analytics
" Results are available through the pre-populated data or on the fly.
" Each visitor has a unique visitor ID that helps in calculating the unique
count.
" Provides a dashboard with site usage (visits, unique visitors, page
views, bounce rate, new visits), traffic sources (Direct Traffic, Search
Engine or referencing sites), demographic based data and content
views.
(Hamel 2008) (Burby, Brown and WAA Standards Committee, 2006)
The Formula for Visitors is –
Visitors (#) = Total Visits (#) – Repeat Visits (#)

15
5. METRIC DASHBOARD We propose to make use of a customized ‘Metrics Dashboard’ that would help Black
Snake Productions redefine, measure, track and monitor their key marketing
outcomes and deliverables and at the same time review and report marketing results.
It will help the business assess what is and what is not working effectively, thereby
providing an understanding of improved decision making to the company’s advantage
(Patterson 2007).
Refer to Appendix 2 for the data collection methods, sources and timing
for the critical 6 metrics on the dashboard.
1. NET MARKETING CONTRIBUTION Net Marketing Contribution (NMC) helps determine and understand the marketing
contribution from organizing demonstrations at shopping centers, especially during
school holidays. Simply put, it segregates the marketing expenses (associated with
development and execution of the set marketing strategies) from the firm’s operating
expenses as a share of the firm’s gross profit (Best 2009, p. 44)
The Formula for Net Marketing Contribution is –
Net Marketing Contribution = Sales
Revenue X % Gross Profit – Marketing & Sales Expenses
It is an important metric as it aids the marketing function to justify the contribution of
marketing activities to the overall success of the organization. Additionally,
considering the demonstrations at shopping centers as one of the few initiatives of
Black Snakes, NMC measurement helps in tracking the marketing contribution and
value created by this initiative. Analyzing and examining the NMC will also support
B2B dealings with shopping centers’ marketing team and their events/ demonstrations
targeting customers (adults and children).

16
2. BRAND AWARENESS Farris et. al. (2008, p. 33) explains ‘Brand awareness’ as the probability that a
customer would recognise and recall the existence of a company called ‘Black Snake
Productions’ and their events and wildlife-based demonstrations at shopping centers.
These can either be unprompted (or unaided), that is the customer recalls the brand
and its attributes without any suggestions; and prompted (or aided), wherein the
customer recognizes the brand upon certain relevant attributes being disclosed.
The Formula for Brand Awareness is –
Brand Awareness = Unprompted
Awareness + Prompted Awareness
Black Snake Productions as an organization working towards educating Australians
towards wildlife conservation is one the very few in this industry. Also, in reference
to their social brand presence, apparently it is not so popular. Hence, it is critical as
the monitoring of this metric is aligned to the primary objective of creating awareness
and knowledge about the company’s existence and its mission, which will help build
and increase the business profile amongst customers (B2C) and intermediaries (B2B).
Brand Awareness will be tracked by Qualitative studies generating human responses
when questioned about brand recall and brand recognition. (Refer to Appendix 3)
For Instance –
Have you heard of an organisation that helps educate and entertain
people for conservation of wildlife? Unprompted
Have you heard of Black Snake Productions or its initiatives? Prompted

17
3. CUSTOMER RETENTION Customer Retention can be understood as ‘holding and maintaining’ the satisfied and
loyal customers which directly has an impact on the company’s profitability and
reputation. It boosts the company’s effort to maintain and sustain long-term
relationships with their B2C and B2B customers and, for a company like Black
Snakes (which is not so popular and recognizable), generation and retention of a
strong customer database is very vital. It demands higher levels of customer
satisfaction to ensure higher levels of customer retention (Best 2009, p. 16-17).
The satisfied, loyal customers that can be retained are the actual brand advocates and
often share their experiences with the brand with peers and family and others, which
may further trigger the introduction of new potential customers to the business (p. 22).
Also, it is understood that loyal and happy customers are more profitable than
dissatisfied or new acquired customers (p. 14) therefore, customer retention is an
important metric to be measured for Black Snakes as it relies on its current and
potential customers to bring in more customers, in both B2C and B2B frameworks.
This can lead to customer satisfaction and willingness to recommend further.
Customer retention rates can be estimated through Quantitative techniques by using
‘Customer surveys’ (Refer to Appendix 3), wherein they will be questioned on the
likelihood of them repurchasing a product/ service again and can respond/ rate in one
of the following ways –
Definitely will
repurchase
Plan To
Repurchase
Probably will
Repurchase
Probably will not
repurchase
Will Not
Repurchase
Definitely will not
Repurchase

18
4. NET PROMOTER SCORE Net Promoter Score (NPS) measures customer’s conviction about Black Snakes and
their initiatives towards conservation of wildlife. In simple terms, it measures the
degree to which a customer recommends would recommend Black Snakes to his
family and friends, thereby demonstrating confidence in its value. The consumers can
be termed as ‘Promoters, ‘Passives’ or ‘Detractors’ and can be sampled on a scale of
0 – 10, where 10 being extremely likely to recommend (Best 2009, p. 19-20).
The Formula for Net Promoter Score is –
NPS is fundamental to Black Snakes as it is aligned to the objective of increasing
brand awareness, advocacy and growth in order to reach and engage maximum people
for wildlife conservation and entertainment along with.

19
5. RESPONSE RATE Response Rate can be adjudged as the percentage of people who respond to an email
or any other form of event communication before these demos at shopping centers to
the total number of people who were exposed to this communication. It can be used to
target the families and their children by sending direct mails to their new and existing
database and response rate could be the number of people who read (or responded
back to) the eDM from the net people who have been sent this email (Gasper 2014)
The Formula for Response Rate is –
Response
Rate (%) =
Number of People who read/ responded to an eDM (#) X100
Number of people in the database (#)
Further, from the number of people who must have read this communication,
ascertain how many out of those contacted, were keen to revert back in any of the
following ways –
• Progress to check your web page
• Check your Facebook page or like or leave a comment
• Information enquiry through a telephone call
• Request for any further information
Quantitative techniques will be used by counting the number of email reverts,
callbacks, new visitors on the website after the electronic direct mails have been sent
to the existing and new database (Refer to Appendix 3).
It is worthwhile to track and monitor the sources of these promotions and invitations
to ascertain the effective media usages amongst the audience, and can be optimized
by having distinct landing page to generate higher event success rate, as the registered
visitors will always be different than the actual number of visitors. It is a key metric to
determine the number of people who are keen to know about Black Snakes and their
initiatives contributing to the community and would participate in the conservation of
wildlife at some stage ad can then be targeted as brand advocates spreading word-of-
mouth.

20
6. SOCIAL MEDIA ENGAGEMENT Social Media is about engaging your community and is very critical to Black Snake
Productions to track and monitor if the company’s social media strategies are working
effectively and efficiently. Social media engagement can be measured in the
following ways –
Table 8 – Measurement of Social Media Engagement
Facebook Page Insights YouTube Insights
Using Facebook Insights, you can quickly determine how many people are interacting with your posts
Provides full feature analytics platform for the YouTube channel. As Black Snake Productions has its own public channel, can be measure using YouTube analytics
Engagement is defined by the following equation:
Likes + Comments + Shares + Post Clicks = # of People Engaged
Includes important metrics like • User Demographics • Playback location • Number of views • Know Where Viewers Are
Finding Your Videos • Viewer retention likes &
dislikes, comments
Page Insights gives ‘Page managers’ a number of aggregate metrics, including the number of people who like their Page, how many people see a post and how many people clicked the post
(Garst, 2014) (YouTube 2014)
21
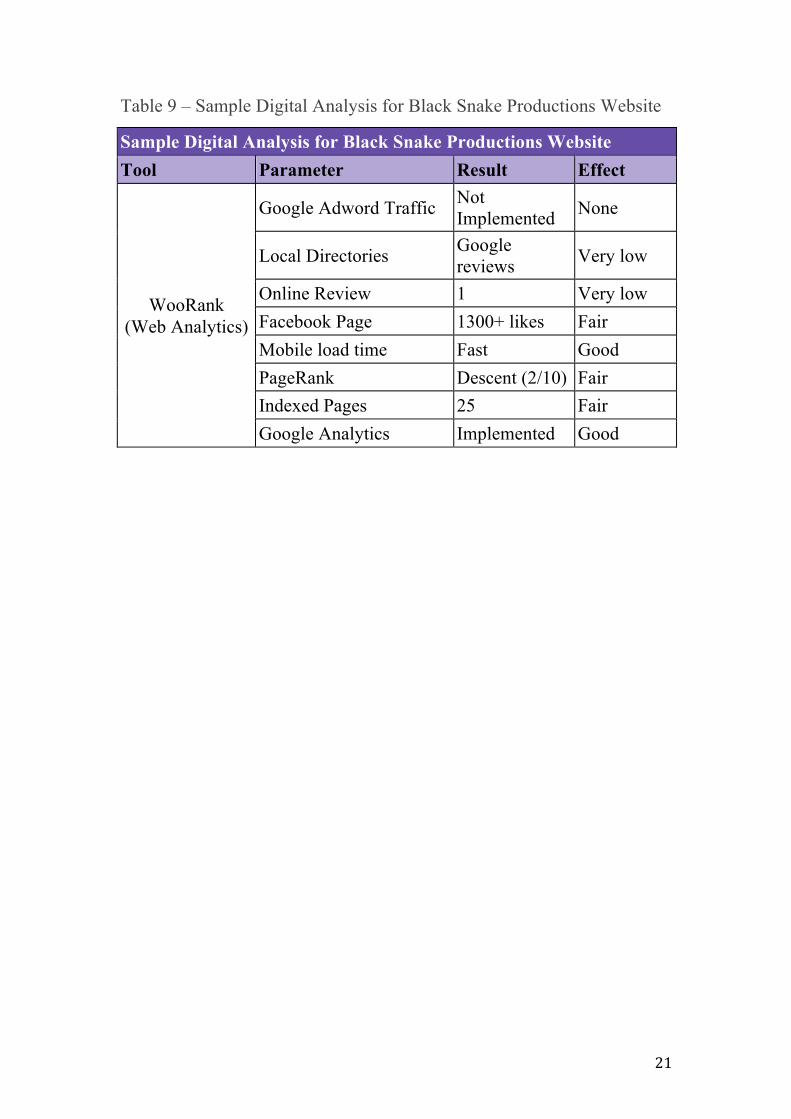
Table 9 – Sample Digital Analysis for Black Snake Productions Website
Sample Digital Analysis for Black Snake Productions Website Tool Parameter Result Effect
WooRank (Web Analytics)
Google Adword Traffic Not Implemented None
Local Directories Google reviews Very low
Online Review 1 Very low Facebook Page 1300+ likes Fair Mobile load time Fast Good PageRank Descent (2/10) Fair Indexed Pages 25 Fair Google Analytics Implemented Good

22
6. JUSTIFICATION OF INTEGRATION TO
OTHER INITIATIVES
SocialMedia
Engagement
ResponseRate
NetProm
oterScore
Customer
Retention
BrandAw
areness
Net
Marketing
Contributions
ME
TR
ICS
Birthday
Parties
Snake
Rem
oval
Schools and
Kinder
Fairs and
Events
Corporate E
vents
RE
LA
TE
D
INIT
IAT
IVE
S Social media is the m
ost important m
etric to measure and track if B
lack Snake's social m
edia strategies are working effectively or not and needs to be linked to all initiatives
and marketing activities and m
ore engaging the content on social media, increased is
the brand awareness.
Response R
ate is the percentage of people who respond to an electronic direct m
ail (eD
M) cam
paign to the total number of people w
ho were exposed to this
comm
unication. This metric can very w
ell be linked to all other stated initiatives as every kind of event or dem
onstration will require eD
M to be sent across to the database
and expect responses from custom
ers in B2B
and B2C
settings.
NPS is typically a m
easure of a customer’s conviction and m
easures the degree to w
hich a customer recom
mends B
lack Snake Production or its activities, thereby dem
onstrating confidence in its value. It is again critical to convert all the passives or detractors into prom
oters in all sets of initiatives in order to make overall aim
of the organization a success.
To achieve more revenues and enhance reputation of B
lack Snakes, it is vital to hold and m
aintain their satisfied and loyal customers like em
ployees, children, parents, day carers, teachers, m
all managem
ent personnel (B2B
& B
2C) in all kinds of initiatives.
It is very important to m
ake customers recognise and recall the brand (unprom
pted and prom
pted awareness) and all its initiatives and m
arketing activities in order to involve, engage and seek participation in this w
ildlife-conservation as the end motive of all the
initiatives is to educate people to conserve disappearing wildlife in A
ustralia.
NM
C is basically the m
arketing contribution of a particular product/initiative to the overall business success. Therefore, calculating and m
easuring the marketing
contribution of other stated initiatives would articulate individual m
arketing contributions to the business as a share of gross profit
JUST
IFICA
TIO
N
(Black Snake Productions 2009)

23
7. RECOMMENDATIONS • Make use of low-cost digital promotion techniques like email distributions, social
media, Adwords
• Perform frequent reviews of the metrics, to set smaller targets and gauge success
more frequently
• Increase the presence on third party websites by motivating users to review the
services online
• Examine the brand in a periodic manner if any further metrics need to be advised
and implemented
• Increase the presence on social media, by running campaigns on Facebook, also
creating an account on powerful social website Twitter
• Google Analytics Dashboard should be used integrated with other important
metrics results
8. CONCLUSION This Report has been able to outline a set of 10 key metrics that will support Black
Snake Productions to monitor their growth and the marketing performance with
regards to their wildlife-based demonstrations in shopping centers. Further, a
marketing metric dashboard was developed comprising of the six key metrics that
were critical to the company’s growth. The choice of metrics has been based on the
organisational objectives and on the assumption that it has decent brand awareness
and market presence and a limited budget to rack and improve marketing
performance.
The metrics will seek to apprehend the marketing contribution of the selected
initiative, consumer’s perceived value and satisfaction levels, power of digital
marketing and people’s response to promotion; and also how these metrics can be
linked to measure the marketing performance of the other initiatives like events at
schools, corporate events and birthday parties.

24
9. REFERENCES Black Snake Productions, 2009, Wildlife Conservation through interactive education, Black Snake Productions, viewed 19 May 2014, <http://www.blacksnakeproductions.com.au/index.php> Black Snake Productions, 2009, Shopping Centres, Black Snake Productions, viewed 19 May 2014, <http://www.blacksnakeproductions.com.au/shopping-centres.php> Best R.J. 2009, Market-Based Management: Strategies for growing Customer value and Profitability, 5th edn, viewed 20 May 2014, Pearson Education Inc., New Jersey Burby J., Brown A and WAA Standards Committee, 2006, Web Analytics: “Big Three” Definitions, Web Analytics Association, viewed 27 May 2009, <http://www.digitalanalyticsassociation.org/Files/PDF_standards/WebAnalyticsDefinitionsBig3.pdf > Davis J.A. 2013, Measuring Marketing: 110+ Key Metrics Every Marketer Needs, 2nd edn, viewed21 May 2014, John Wiley & Sons, Singapore Farris PW, Bendle NT, Pfeifer PE & Reibstein DJ 2008, Key Marketing Metrics, viewed 19 May 2014, Pearson Education, Inc, USA Garst K. 2014, Social Media Measurement and the only Metric that matters, The HuffingtonPost.com, Inc., viewed 28 May 2014, <http://www.huffingtonpost.com/kim-garst/social-media-measurement-_b_4910702.html> Gasper C S 2014, Metrics to weigh the success of your promotional postcard, Readabilityformulas.com, viewed 27 May 2014, <http://www.readabilityformulas.com/articles/five-metrics-to-weigh-the-success-of-your-postcard.php> Hamel S. 2008, Understanding Unique Visitors, Stephane Hamel, viewed 29 May 2014, <http://blog.immeria.net/2008/01/understanding-unique-visitors.html > Patterson L. 2007, Taking on the Metric Challenge, Journal of Targeting, measurement and analysis for Marketing, p. 270- 276, viewed on 29 May 2014

25
Sullivan D.O., Abela A.V. and Hutchinson M, 2009, Marketing performance measurement and firm performance: Evidence from the European high-technology sector, European Journal of Marketing, Vol. 43 Issue: 5/6, pp.843 – 862, viewed 31 May 2014 Vocus 2014, 10 Key Metrics for success in 2013, Vocus Marketing Software, viewed 23 May 2014, <http://img.vocus.com/white-papers/10-key-marketing-metrics.pdf> YouTube 2014, YouTube Analytics, YouTube, viewed 28 May 2014, <https://www.youtube.com/yt/playbook/yt-analytics.html>

26
10. APPENDICES Appendix 1: Summary of the description of the key metrics with its data requirements Category Metric Description
Profitability Net
Marketing Contribution
Market profitability metric to determine the marketing contribution of wildlife-based demonstrations at shopping centers by Black Snakes. It articulates the contribution of marketing to the business as a share of gross profit.
Image Brand Awareness
Likelihood of the customers to recognise and recall the existence of Black Snake Productions and their initiatives, can be unprompted and prompted.
Customer
Footfall/ Visitors and
its Source
Measurement of the footfall or the number of visitors that attended a particular event/ demonstration and source of information about the demonstration.
Customer Satisfaction
Customer Satisfaction is the level of perceived satisfaction experienced by customers in terms of their engagement and experience with the organisation as a whole or their products/ services
Customer Retention
Holding and maintaining the satisfied and loyal customers, which directly has an impact on the Black Snake's profitability and reputation.
Net Promoter Score
NPS is typically a measure of a customer’s conviction and measures the degree to which a customer recommends Black Snake Production or its activities, thereby demonstrating confidence in its value.
Promotion Response Rate
Response Rate is the percentage of people who respond to a call, an email or any other form of communication to the total number of people who were exposed to this communication.
Digital
Social Media Engagement
Social media is a very important metric to measure and track if Black Snake's social media strategies are working effectively or not.
SEO SEO defines for a website is performing including page rank, keywords and number of pages indexed.
Unique Visitors
The number of inferred individual people (filtered for spiders and robots), within a designated reporting timeframe, with activity consisting of one or more visits to a site. Each individual is counted only once in the unique visitor measure for the reporting period.

27
Appendix 2: Summary of 6 critical metrics on the Dashboard with its sources and timing Category Metric Data Sources Timing
Profitability Net Marketing Contribution Internal sales and expense data Quarterly
Image Brand Awareness Annual Quantitative Research Annually
Customer
Customer Retention
Quarterly through regular surveys in newsletters and at point of sale. But, benchmark in the Annual Quantitative Research
Benchmark Quarterly / Annually
Net Promoter Score
Quarterly through regular surveys in newsletters and at point of sale. But, benchmark in the Annual Quantitative Research
Benchmark Quarterly/ Annually
Promotion Response Rate Collected after each activity and reported quarterly Quarterly
Digital Social Media Engagement
Collected via Facebook and YouTube insights Monthly

28
Appendix 3: Comparison with existing protocols/ peer reviewed journal articles with the current organisation ORIGINAL SURVEY QUESTIONS ADAPTED SURVEY QUESTIONS
1. Ability to measure marketing activities
For each of the following marketing activities please rate your company's ability to measure performance (1= poor, 7= excellent).
• Branding. • Direct mail/e-mail campaigns. • Web site and Internet presence. • PR and internal communications. • Channel marketing. • Market research. • Advertising. • Telemarketing and contact management. • Tradeshows and events. • Analyst and stakeholder relations. • CRM systems.
1. Ability to measure marketing activities
For each of the following marketing activities please rate your company's ability to measure performance (1= poor, 5= excellent).
• Branding. • Direct mail/e-mail campaigns. • Web site and Internet presence. • PR and internal communications. • Advertising. • Telemarketing and contact management. • Tradeshows and events.
2. Ability to generate a comprehensive set of marketing metrics
Please rate your company's current ability to provide the following MPM information (1= poor, 7= excellent).
• Financial indicators of marketing performance.
• Non-financial indicators of marketing performance.
• Benchmark indicators of marketing performance against plans.
• Benchmark indicators of marketing performance against competitors.
2. Ability to generate a comprehensive set of marketing metrics
Please rate your company's current ability to provide the following MPM information (1= poor, 5= excellent).
• Financial indicators of marketing performance.
• Non-financial indicators of marketing performance.
• Benchmark indicators of marketing performance against plans.
3. Primary firm performance outcomes
Please indicate your firm's performance over the last year relative to all other competitors in the primary market that you serve (1= very poor, 7=outstanding).
• Sales growth. • Market share. • Profitability.
3. Primary firm performance outcomes
Please indicate your firm's performance over the last year in the primary market that you serve (1= very poor, 5=outstanding).
• Revenue growth. • Market share. • Profitability.

29
4. Secondary firm performance outcomes
• ROA (COMPUSTAT). • Size-adjusted Stock Returns
4. N.A.
5. CEO satisfaction with marketing
In your opinion, what is your CEO's evaluation of your company's current marketing performance?
• Excellent. • Above average. • Average. • Below average. • Poor.
5. CEO satisfaction with marketing
In your opinion, what is your CEO's evaluation of your company's current marketing performance?
• Excellent. • Above average. • Average. • Below average. • Poor.
6. Use of a marketing dashboard
Please rate your company's current ability to provide the following MPM information ( 1= poor, 7= excellent ).
• High level “dashboard” of key marketing performance indicators.
• Automated reporting of performance from the full range of marketing activities.
• Automated “drill-down” information for detailed analysis of individual marketing programs
6. Use of a marketing dashboard
Please rate your company's current ability to provide the following MPM information (1= poor, 7= excellent).
• High level “dashboard” of key marketing performance indicators.
• Automated reporting of performance from the full range of marketing activities.
• Automated “drill-down” information for detailed analysis of individual marketing programs
7. Marketing performance reporting frequency scale items
Considering the following measures, how frequently are they reported to senior management? ( 1= monthly or more, 5= never ).
• Qualified leads generated. • Number of campaign leads converted. • Brand equity measures. • Press coverage and analyst influence. • Web site traffic and content viewing. • Share of mind and share of discussion
audits. • Customer retention, loyalty and
satisfaction. • Benchmarking surveys and perception
studies. • Competitive intelligence tracking.
7. Marketing performance reporting frequency scale items
Considering the following measures, how frequently are they reported to senior management? (1= monthly or more, 5= never).
• Qualified leads generated. • Number of campaign leads converted. • Brand equity measures. • Web site traffic and content viewing. • Customer retention, loyalty and
satisfaction. • Benchmarking surveys and perception
studies.
(Source: Sullivan, Abela and Hutchinson, 2009)