Embed Size (px)
Citation preview

Black Aspergillus species:
implications for ochratoxin A
in Australian grapes and wine
Su-lin Lynette Leong
Discipline of Plant and Pest Science School of Agriculture and Wine
University of Adelaide
Mycology and Mycotoxins Food Microbiology
CSIRO Food Science Australia
July, 2005

- ii -
Statement of originality This work contains no material which has been accepted for the award of any other
degree or diploma in any university or other tertiary institution and, to the best of my
knowledge and belief, contains no material previously published or written by another
person, except where due reference has been made in the text.
I give consent to this copy of my thesis, when deposited in the University library,
being available for loan and photocopying.
Su-lin L. Leong
29 July, 2005

- iii-
Abstract
Ochratoxin A (OA), a nephrotoxin and potential carcinogen, has been found in many
foods, including grapes and grape products. Limits of 2 µg/kg in wine and 10 µg/kg in
dried vine fruit have been introduced by the European Union. This study presents
information on the ecology of ochratoxin A production by black Aspergillus spp. in
Australian vineyards, and the passage of the toxin throughout winemaking.
Aspergillus niger and A. carbonarius were isolated from vineyard soils in 17 of 17,
and four of 17 Australian viticultural regions, respectively. A. aculeatus was isolated
infrequently. All thirty-two isolates of A. carbonarius and three of 100 isolates of A.
niger produced OA. Of Australian A. niger isolates analysed for restriction fragment
length polymorphisms within the internal transcribed spacer region of 5.8S ribosomal
DNA, 61 of 113 isolates, including the three toxigenic isolates, were of type N pattern,
and 52 were type T. A selection of these A. carbonarius and A. niger aggregate
isolates, as well as imported isolates, were compared using enterobacterial repetitive
intergenic consensus (ERIC)-PCR, amplified fragment length polymorphisms (AFLP)
and microsatellite markers. ERIC and AFLP clearly differentiated A. niger from A.
carbonarius. AFLP further divided A. niger into types N and T. Six polymorphic
microsatellite markers, developed specifically for A. niger, also differentiated strains
into N and T types. There was no clear relationship between genotypic distribution
and ochratoxigenicity, substrate or geographic origin.
The survival of A. carbonarius spores on filter membranes was examined at water
activities (aw) 0.4-1.0, and at 1 °C, 15 °C, 25 °C and 37 °C. Survival generally
increased at lower temperatures. The lowest water activity, 0.4, best supported the
survival of spores, but 0.6-0.9 aw was often deleterious. Complex interactions between
temperature and water activity were observed. Viability of A. carbonarius spores on
filter membranes decreased ca 105 fold upon exposure to sunlight, equivalent to 10
mWh of cumulative ultraviolet irradiation at 290-400 nm. Growth and toxin
production were examined for five isolates of A. carbonarius and two of A. niger on
solid medium simulating juice at early veraison, within the range 0.98-0.92 aw, and at
15 °C, 25 °C, 30 °C and 35 °C. Maximum growth for A. carbonarius and A. niger
occurred at ca 0.965 aw / 30 °C and ca 0.98 aw / 35 °C, respectively. The optimum
temperature for OA production was 15 °C and little was produced above 25 °C. The
optimum aw for toxin production was 0.95 for A. niger and 0.95-0.98 for A.

- iv-
carbonarius. Toxin was produced in young colonies, however, levels were reduced as
colonies aged.
Black Aspergillus spp. were more commonly isolated from the surface than from the
pulp of berries, and increased with berry maturity, or damage. A. niger was isolated
more frequently than A. carbonarius and A. aculeatus. Populations of A. carbonarius
inoculated onto bunches of Chardonnay and Shiraz decreased from pre-bunch closure
to early veraison. Populations from veraison to harvest were variable, and increased in
bunches with tight clustering and splitting. In a trial with Semillon bunches, omitting
fungicide sprays after flowering did not increase the development of Aspergillus rot.
Inoculation of bunches with A. carbonarius spore suspension did not necessarily
result in Aspergillus bunch rot. In vitro trials suggested that the severity of rot was
mediated primarily by the degree of berry damage, followed by the extent of spore
coverage. No clear trends regarding cultivar susceptibility were observed. For
Semillon bunches inoculated with A. carbonarius spores with and without berry
puncture, increased susceptibility to rot and OA formation was associated with berry
damage, in particular at greater than 12.3 °Brix (20 d before harvest). OA
contamination of bunches was related to the number of mouldy berries per bunch,
with shrivelled, severely mouldy berries the primary source of OA.
Puncture-inoculation of white grapes (Chardonnay and Semillon) and red grapes
(Shiraz) on the vine with A. carbonarius resulted in berries containing OA. Inoculated
grapes displayed greater total soluble solids due to berry shrivelling, and greater
titratable acidity due to production of citric acid by the fungus. Samples taken
throughout vinification of these grapes were analysed for OA. Pressing resulted in the
greatest reduction in OA (68-85% decrease in concentration, compared with that of
crushed grapes). Additional reductions occurred at racking from grape and gross lees,
and after storage. OA was removed by binding to marc, grape and gross lees.
Pectolytic enzyme treatment of white must, bentonite juice fining, recovery of juice or
wine from lees, and static or rotary style fermentation of red must, had no effect on
OA contamination. Bentonite in white wine (containing 56 mg/L grape-derived
proteins) and yeast hulls in red wine were effective fining agents for removing OA.
Findings from these studies may contribute to the improvement of strategies to
minimise OA in Australian wine and dried vine fruit.

- v-
Acknowledgements I wish to thank my supervisors, Ailsa Hocking and Eileen Scott for their guidance and support, and for honing my skills as a scientist throughout this endeavour; thanks also to John Pitt, who first set me on the path of mycotoxin research. The support of the Cooperative Research Centre for Viticulture, in particular from Liz Waters and Jim Hardie, is also gratefully acknowledged. The varied aspects of this study could not have been conducted without the help of many people. Viticulturalists and researchers around Australia sent soil samples for the isolation of black Aspergillus spp., and the molecular study was conducted in partnership with Alex Esteban of the Autonomous University of Barcelona. David Mitchell of Cranfield University and Neus Bellí of the University of Lleida are thanked for their advice regarding fungal growth and ochratoxin A production on solid media. Collaborators for field and winemaking studies have included: in Mildura, Vic, Bob Emmett, Benozir Kazi, Kathy Clarke, Narelle Nancarrow, Mark Krstic, Glenda Kelly and Fred Hancock of the Department of Primary Industries; Gary Clarke and Craig Thornton of the Wingara Wine Group; Phil Sheehan of BA Scott Estate; Sonja Needs of CSIRO Plant Industry; and in the Hunter Valley, NSW, Glen Howard of Somerset Vineyard, Pokolbin; Trevor Klein of Syngenta Pty Ltd; Stephen W. White and Nick Charley of Food Science Australia; Margaret Leong, Mark Leong and numerous other family and friends (you know who you are). Peter Godden gave advice on vinification trials, and protein analyses were conducted by Liz Waters and Ken Pocock of the Australian Wine Research Institute. Peter Varelis and Georgina Giannikopoulos of Food Science Australia were instrumental in designing methods for OA analysis. Statistical advice was provided by Janine Jones, Colleen Hunt and Michelle Lorimer of BiometricSA. Thank you to Keith Richardson for checking the final draft of the manuscript. Special mention must be made of Nai Tran-Dinh, who not only supervised the molecular study and helped with fieldwork and winemaking, but who also shared his wisdom as one who has trod the PhD path, and who made coming to work fun. Mariam Begum, Anne-Laure Markovina and Helen Nicholson of the Mycology Group at Food Science Australia are also thanked for their warm friendship and encouragement. My deepest love and gratitude is extended to my family - Mum, Dad, Bro and Granny - who have been so generous with their love and patience, and to my extended Christian “family” as well, who have demonstrated their care and concern in many ways, usually by heartfelt prayer (especially during the little crises encountered during any PhD). Many other family and friends have expressed support and encouragement along the way - thank you to all of you! Christina Rosetti wrote “Were there no God, we would be in this glorious world with grateful hearts and no one to thank.” I thank God for opening a career in research which has been fulfilling and rewarding, and has challenged and extended me personally - at no stage more so than during the course of this body of work just completed. The science is great fun, but it’s from people and their generosity of spirit that the joy comes - each contribution acknowledged above, as well as those (many) unacknowledged, is for me an expression of God’s grace, and for this, I am truly grateful.

- vi-
Table of contents Black Aspergillus species: implications for ochratoxin A in Australian grapes and
wine ........................................................................................................................... i
Statement of originality ............................................................................................. ii Abstract.................................................................................................................... iii Acknowledgements ....................................................................................................v Table of contents ...................................................................................................... vi List of figures .............................................................................................................x List of tables........................................................................................................... xiii Publications arising from this project........................................................................xv
1 Introduction ..................................................................................................... 1 1.1 Rationale for the project ............................................................................. 1 1.2 Toxicity of ochratoxin A ............................................................................ 2 1.3 Occurrence of ochratoxin A ....................................................................... 4 1.4 Source of ochratoxin A .............................................................................20 1.5 Fungal infection of grapes .........................................................................26 1.6 Effect of processing on ochratoxin A ........................................................29 1.7 Detection of ochratoxin A .........................................................................30 1.8 Objectives .................................................................................................31
2 General Materials and Methods.....................................................................32
2.1 Enumeration and identification of black Aspergillus spp. on various substrates ..................................................................................................32 2.2 Storage of fungal isolates ..........................................................................33 2.3 Preparation of spore suspensions...............................................................33 2.4 Assessment of ochratoxin A production on agar plates..............................33
2.4.1 Sampling and extraction ....................................................................33 2.4.2 HPLC analysis of culture extracts......................................................34
2.5 Assessment of ochratoxin A in grapes .......................................................36 2.5.1 Extraction and purification ................................................................36 2.5.2 Liquid Chromatography-Mass Spectrometry analysis ........................36
2.6 Statistical analysis .....................................................................................37 3 Aspergillus niger and A. carbonarius from Australian vineyards: isolation,
toxigenicity and molecular relationships .......................................................39
3.1 Introduction ..............................................................................................39 3.1.1 Distribution of black Aspergillus spp. on Australian grapes ...............39 3.1.2 Techniques to assess molecular relationships among black Aspergillus
spp. ...................................................................................................42 3.2 Isolation of black Aspergillus spp. from Australian viticultural regions .....44
3.2.1 Methods ............................................................................................44 3.2.1.1 Isolation ........................................................................................44 3.2.1.2 Toxigenicity screening...................................................................45 3.2.1.3 RFLP analysis of Aspergillus niger................................................45
3.2.1.3.1 DNA extraction .......................................................................45 3.2.1.3.2 PCR amplification and digestion of amplicons.........................47

- vii-
3.2.2 Results ..............................................................................................47
3.2.2.1 Frequency of isolation from soil and rachis samples ......................47 3.2.2.2 Frequency of toxigenicity ..............................................................48 3.2.2.3 Strain typing of Aspergillus niger ..................................................59
3.3 Techniques to assess molecular relationships among isolates of Aspergillus
niger and A. carbonarius...........................................................................60 3.3.1 Methods ............................................................................................60
3.3.1.1 Strain selection and DNA extraction..............................................60 3.3.1.2 ERIC-PCR ....................................................................................60 3.3.1.3 AFLP ............................................................................................61 3.3.1.4 Microsatellites ...............................................................................63 3.3.1.5 Construction of dendrograms.........................................................64
3.3.2 Results ..............................................................................................65 3.3.2.1 ERIC-PCR ....................................................................................65 3.3.2.2 AFLP ............................................................................................68 3.3.2.3 Microsatellites ...............................................................................68
3.4 Discussion ................................................................................................74 3.4.1 Isolation and toxigenicity of black Aspergillus spp. from Australian viticultural regions ............................................................................74 3.4.2 Molecular relationships among Aspergillus niger, A. carbonarius and A. aculeatus.......................................................................................75
3.4.2.1 Evaluation of techniques................................................................75 3.4.2.2 Significance...................................................................................77
3.4.3 Implications for viticulture and oenology ..........................................79 4 Survival, growth and toxin production by Aspergillus carbonarius and
A. niger ............................................................................................................81
4.1 Introduction ..............................................................................................81 4.1.1 Effect of temperature, water activity and sunlight on survival of Aspergillus carbonarius spores..........................................................81 4.1.2 Effect of temperature and water activity on growth and ochratoxin A production by Aspergillus carbonarius and A. niger ..........................82
4.2 Effect of temperature, water activity and sunlight, on survival of Aspergillus
carbonarius spores....................................................................................84 4.2.1 Methods ............................................................................................84
4.2.1.1 Effect of temperature and water activity ........................................84 4.2.1.2 Effect of sunlight ...........................................................................85
4.2.2 Results ..............................................................................................86 4.2.2.1 Temperature and water activity......................................................86 4.2.2.2 Sunlight.........................................................................................88
4.3 Effect of temperature and water activity on growth and ochratoxin A production by Aspergillus carbonarius and A. niger..................................89
4.3.1 Methods ............................................................................................89 4.3.1.1 Medium preparation ......................................................................89 4.3.1.2 Preparation of inoculum ................................................................90 4.3.1.3 Inoculation and incubation.............................................................90 4.3.1.4 Growth and estimation of ochratoxin A .........................................90

- viii-
4.3.2 Results ..............................................................................................91 4.3.2.1 Growth ..........................................................................................91 4.3.2.2 Ochratoxin A production ...............................................................92
4.4 Discussion...............................................................................................101 4.4.1 Survival of Aspergillus carbonarius spores .....................................101 4.4.2 Growth............................................................................................103 4.4.3 Ochratoxin A production .................................................................105 4.4.4 Implications for vineyard ecosystems ..............................................108 4.4.5 Future research................................................................................110
5 Factors affecting the incidence and growth of Aspergillus carbonarius on
grapes in vineyards .......................................................................................113
5.1 Introduction ............................................................................................113 5.2 Natural occurrence of black Aspergillus spp. on grapes in Australia ........114
5.2.1 Methods ..........................................................................................114 5.2.1.1 Location of vineyard trials ...........................................................114 5.2.1.2 Assessment of incidence of black Aspergillus spp. on grapes.......116
5.2.1.2.1 2001, 2002 - Cultivar and vineyard management ...................116 5.2.1.2.2 2003, 2004 - Cultivar and berry maturity ...............................117
5.2.2 Results ............................................................................................118 5.2.2.1 Effect of cultivar and vineyard management on incidence of black Aspergillus spp. at harvest ...........................................................118 5.2.2.2 Effect of cultivar and berry maturity on fungal populations on grapes ....................................................................................................121
5.3 Significance of berry damage and inoculum coverage in the development of Aspergillus rot ........................................................................................122
5.3.1 Methods ..........................................................................................122 5.3.1.1 Inoculation of bunches in vineyards.............................................122 5.3.1.2 Development of Aspergillus rot in vineyards ...............................123 5.3.1.3 Development of Aspergillus rot in vitro .......................................123
5.3.2 Results ............................................................................................126 5.3.2.1 Development of Aspergillus rot in vineyards ...............................126 5.3.2.2 Development of Aspergillus rot in vitro .......................................129
5.4 Survival and growth of Aspergillus carbonarius on wine grapes before harvest ....................................................................................................137
5.4.1 Methods ..........................................................................................137 5.4.2 Results ............................................................................................138
5.5 Effect of damage and berry maturity on Aspergillus rot and ochratoxin A formation in Semillon bunches................................................................145
5.5.1 Methods ..........................................................................................145 5.5.2 Results ............................................................................................147
5.6 Discussion...............................................................................................152 5.6.1 Occurrence of black Aspergillus spp. on bunches and development of Aspergillus rot.................................................................................152 5.6.2 Significance ....................................................................................160

- ix-
6 Fate of ochratoxin A during vinification......................................................162 6.1 Introduction ............................................................................................162 6.2 Methods..................................................................................................163
6.2.1 Inoculation of grapes, incubation and harvest ..................................163 6.2.2 Vinification - 2002, 2003.................................................................164 6.2.3 Sampling - 2002, 2003 ....................................................................167 6.2.4 Effect of enzymes and bentonite during white juice clarification, 2004. ........................................................................................................167 6.2.5 Ochratoxin A during fermentation, 2004 .........................................168
6.2.5.1 Semillon......................................................................................168 6.2.5.2 Shiraz - static vs rotary fermentation............................................168
6.2.6 Recovery of juice and wine from lees, 2004 ....................................169 6.2.7 Effect of fining agents on removal of ochratoxin A .........................169 6.2.8 Ochratoxin A extraction ..................................................................170
6.2.8.1 Liquids ........................................................................................170 6.2.8.2 Solids ..........................................................................................171 6.2.8.3 HPLC analysis.............................................................................171
6.2.9 Other analyses.................................................................................171 6.3 Results ....................................................................................................172
6.3.1 Effect of Aspergillus carbonarius infection on appearance, total soluble solids and titratable acidity of wine grapes ..........................172 6.3.2 Ochratoxin A during vinification.....................................................175 6.3.3 Ochratoxin A during clarification ....................................................178 6.3.4 Ochratoxin A during fermentation...................................................178
6.3.4.1 Semillon, 2004 ............................................................................178 6.3.4.2 Shiraz, 2004 ................................................................................179
6.3.5 Ochratoxin A in juice and wine from lees........................................180 6.3.6 Removal of ochratoxin A by fining agents.......................................181
6.4 Discussion ..............................................................................................182 7 General Discussion .......................................................................................192
7.1 Strategies to minimise ochratoxin A in grapes and wine..........................192 7.1.1 Viticulture .......................................................................................192 7.1.2 Dried vine fruit production ..............................................................198 7.1.3 Oenology ........................................................................................198
7.2 Concluding remarks ................................................................................200 Appendices............................................................................................................201
A Mycological media ........................................................................................201
B Preparation of isotopically-labelled ochratoxin A.......................................204
C Molecular biology reagents ..........................................................................205
D Molecular data..............................................................................................207
E Spray application and sampling times, Hunter Valley................................214 References.............................................................................................................218

- x-
List of figures Figure 1.1: Ochratoxin A........................................................................................... 2 Figure 1.2: Incidence and degree of ochratoxin A contamination in wines produced in
viticultural regions worldwide............................................................................ 7 Figure 1.3: Infection of Semillon berries by Aspergillus carbonarius........................28 Figure 2.1: Ochratoxin A (469 ng/mL extract ≡ 2.2 µg/g medium) produced by
Aspergillus carbonarius FRR 5690 on synthetic grape juice medium, water activity 0.965 at 15 °C after 22 d.......................................................................35
Figure 2.2: Ochratoxin A (0.49 ng/mL extract ≡ 0.0022 µg/g medium) produced by Aspergillus niger FRR 5695 on synthetic grape juice medium, water activity 0.95 at 25 °C after 5 d...............................................................................................35
Figure 2.3: Liquid chromatography-mass spectroscopy calibration curves for ochratoxin A within the ranges 0-25 ng, 25-190 ng and 190-3200 ng generated by three replicate injections ..............................................................................38
Figure 3.1: Overlaid chromatograms of ochratoxin A produced by Aspergillus niger FRR 5695 in underivitized and derivitized forms ..............................................58
Figure 3.2: Chromatogram of a mixed sample consisting of standard ochratoxin A solution, derivitized OA standard, and derivitized extract from Aspergillus niger
FRR 5701. ........................................................................................................58 Figure 3.3: RFLP analysis of ribosomal DNA from a selection of Aspergillus niger
isolates from Australian vineyards; differentiation of type N from type T strains.........................................................................................................................59
Figure 3.4: Amplification of DNA from black Aspergillus spp. in PCR with ERIC primers .............................................................................................................66
Figure 3.5: Determination of molecular relationships among isolates of Aspergillus
carbonarius, A. niger aggregate and A. aculeatus by ERIC-PCR ......................67 Figure 3.6: Determination of molecular relationships among isolates of Aspergillus
carbonarius, A. niger aggregate and A. aculeatus by AFLP ..............................69 Figure 3.7a-f: Multiple sequence alignment of microsatellite loci ACNM1, ACNM2,
ACNM3, ACNM5, ACNM6 and ACNM7 from isolates of Aspergillus niger and A. carbonarius ............................................................................................ 70-71
Figure 3.8: Determination of molecular relationships among isolates of the Aspergillus niger aggregate by analysis of six polymorphic microsatellite loci..73
Figure 4.1: Effect of water activity and temperature on survival of Aspergillus
carbonarius spores on filter membranes............................................................87 Figure 4.2: Survival of Aspergillus carbonarius spores on filter membranes exposed
to sunlight.........................................................................................................88 Figure 4.3: Bleaching of Aspergillus carbonarius spores on filter membranes exposed
to sunlight for 9 d compared with covered spores..............................................89 Figure 4.4: Mean growth rate and mean maximum ochratoxin A yield produced on
synthetic grape juice medium within 36 d for Aspergillus carbonarius FRR 5682, FRR 5690, FRR 5691, FRR 5692, FRR 5693 (data pooled) and A. niger FRR 5694, FRR 5695 (data pooled) ..........................................................................96
Figure 4.5: Maximum ochratoxin A produced by isolates of Aspergillus carbonarius and A. niger on synthetic grape juice medium...................................................97
Figure 4.6: Ochratoxin A production by Aspergillus carbonarius and A. niger on synthetic grape juice medium over time at various temperatures and water activities, expressed as a proportion of the maximum OA yield for each isolate ...................................................................................................................... 98-99

- xi-
Figure 4.7: Ochratoxin A production by Aspergillus carbonarius FRR 5690, A. carbonarius FRR 5692 and A. niger FRR 5694 on synthetic grape juice
medium at various colony sizes for three temperatures and three water activities, expressed as a proportion of the maximum OA yield for each species.............100
Figure 5.1: Natural incidence of black Aspergillus spp. on grapes at harvest, 2002. 120 Figure 5.2: Fungi other than black Aspergillus spp. commonly isolated from wine
grapes, from pre-bunch closure until harvest, 2004 .........................................122 Figure 5.3: Diagrammatic key for the assessment of disease severity on grape bunches
based on proportion of surface area affected ...................................................125 Figure 5.4: Incidence of black Aspergillus spp. on inoculated grapes at harvest, 2002
.......................................................................................................................127 Figure 5.5: Comparison of propagules of black Aspergillus spp. bound to the surface
or in the pulp of homogenised berries, with those dislodged from the surface of berries by vigorous shaking in water, for white (Chardonnay and Semillon) and red (Cabernet Sauvignon and Shiraz) cultivars................................................128
Figure 5.6: Yeast growth on Chardonnay berries slit with a scalpel and moist incubated at room temperature for 8 d.............................................................129
Figure 5.7: Effect of damage and inoculation with Aspergillus carbonarius on Chardonnay bunches moist incubated at room temperature for 8 d..................130
Figure 5.8: Wizened berries in Semillon bunches on the vine, and growth of black Aspergillus spp. on aborted and wizened Cabernet Sauvignon berry in moist incubation conditions......................................................................................136
Figure 5.9: Berry splitting and fungal growth on Cabernet Sauvignon grapes spray-inoculated with Aspergillus carbonarius on the vine pre-harvest and subjected to simulated rain damage, followed by moist incubation at room temperature for 8 d.......................................................................................................................137
Figure 5.10: Counts of Aspergillus carbonarius in 2003 and 2004 following immersion-inoculation of grapes at pre-bunch closure, veraison and pre-harvest.......................................................................................................................142
Figure 5.11: Insect casing indicative of insect damage, a focus for berry rot developing over 24 d in a Chardonnay bunch inoculated by immersion in Aspergillus carbonarius spore suspension at veraison.....................................143
Figure 5.12: Effect of Syngenta’s and grower’s standard spray programs on survival of Aspergillus carbonarius spores immersion-inoculated onto Semillon bunches at pre-bunch closure and pre-harvest, and subsequent growth..........................144
Figure 5.13: Effect of Syngenta’s and grower’s standard spray programs on development of bunch rot caused by Aspergillus carbonarius spores immersion-inoculated onto Semillon bunches at pre-bunch closure and pre-harvest..........145
Figure 5.14: Four categories of berries from a single Semillon bunch immersion-inoculated with a suspension of Aspergillus carbonarius spores 10 d before harvest ............................................................................................................146
Figure 5.15: Development of Aspergillus rot in Semillon bunches inoculated by immersion in Aspergillus carbonarius spore suspension 20 d pre-harvest. ......147
Figure 5.16: Severity of infection and ochratoxin A in Semillon bunches inoculated by immersion in Aspergillus carbonarius spore suspension before harvest, with and without berry damage .....................................................................................148
Figure 5.17: Relationship between ochratoxin A in Semillon bunches inoculated by immersion in Aspergillus carbonarius spore suspension before harvest and number of berries displaying visible infection with black Aspergillus spp.. .....150

- xii-
Figure 5.18: Ochratoxin A in berries visually sorted from four Semillon bunches inoculated by immersion in a suspension of Aspergillus carbonarius spore suspension 10 d before harvest........................................................................151
Figure 6.1: Pressing Shiraz must through 50% shadecloth in a hydraulic press .......165 Figure 6.2: Fermentation vessels for Semillon juice and Shiraz must, 2003 and 2004
.......................................................................................................................166 Figure 6.3: Shrivelling of Chardonnay berries inoculated with Aspergillus
carbonarius before harvest, 2002, showing berry discolouration at inoculation point, shrivelling of inoculated berries, sporulation and bunch shatter.............173
Figure 6.4: Shiraz must from fruit inoculated with Aspergillus carbonarius before harvest, a mixture of inoculated and uninoculated fruit, and uninoculated fruit only, 2003.......................................................................................................173
Figure 6.5: Ochratoxin A in must from grapes puncture-inoculated before harvest with a suspension of Aspergillus carbonarius spores ..............................................174
Figure 6.6: Summary of the fate of ochratoxin A during white (Chardonnay and Semillon) and red (Shiraz) vinification over three vintages .............................176
Figure 6.7: Partitioning of ochratoxin A and mass at solid:liquid separation steps during vinification of Semillon must, 2004 .....................................................177
Figure 6.8: Partitioning of ochratoxin A and mass at solid:liquid separation steps during vinification of Shiraz must, 2004 .........................................................177
Figure 6.9: Summary of the reduction in ochratoxin A achieved during clarification of white grape juice over three vintages ..............................................................178
Figure 6.10: Ochratoxin A during Semillon fermentation and racking.....................179 Figure 6.11: Ochratoxin A in the liquid portion of Shiraz must during fermentation
until pressing ..................................................................................................180 Figure 6.12: Effect of fining agents added at two rates to wine containing ochratoxin
A; Semillon ca 8 µg/kg, Shiraz ca 5 µg/kg......................................................182 Figure 7.1: Factors which may affect the incidence and growth of black Aspergillus
spp. in vineyards and formation of ochratoxin A in grapes, in particular, changes in temperature and water activity or relative humidity.....................................197
Figure B.1: Chromatogram of 13C-ochratoxin A and the corresponding mass spectrum.......................................................................................................................204

- xiii-
List of tables Table 1.1: Estimates of ochratoxin A exposure for Australian consumers ...................5 Table 1.2: Prevalence of ochratoxin A in wines ..........................................................8 Table 1.3: Prevalence of ochratoxin A in Australian wines .......................................13 Table 1.4: Prevalence of ochratoxin A in aperitifs, fortified and other special wines .15 Table 1.5: Prevalence of ochratoxin A in commercial grape juice and juice from
crushed grapes at harvest ..................................................................................16 Table 1.6: Prevalence of ochratoxin A in dried vine fruits.........................................19 Table 1.7: Surveys for ochratoxin A production by black Aspergillus spp.................22 Table 3.1: Isolation of Aspergillus section Nigri from wine grapes and dried grapes in
Europe and South America ...............................................................................40 Table 3.2: Isolation of Aspergillus niger, A. carbonarius and A. aculeatus from soils,
rachides and berries from Australian vineyards .................................................49 Table 3.3: Isolates of black Aspergillus spp. examined and ability to produce
ochratoxin A.....................................................................................................50 Table 3.4: PCR primer sequences, number of alleles and size range observed for
microsatellite loci in Aspergillus niger ..............................................................72 Table 4.1: Saturated solutions and water activities generated at various temperatures
.........................................................................................................................85 Table 4.2: Effect of water activity and temperature on linear growth rates of
Aspergillus carbonarius and A. niger................................................................94 Table 5.1: Sites of vineyard trials ...........................................................................115 Table 5.2: Frequency of contamination with black Aspergillus spp. in 2001 - number
of bunches within certain ranges of contamination..........................................119 Table 5.3: Natural incidence of black Aspergillus spp. on wine grapes from pre-bunch
closure until harvest in 2003 and 2004 ............................................................121 Table 5.4: Bunch treatments - inoculation with Aspergillus carbonarius and damage
to bunches ......................................................................................................124 Table 5.5: Bunch parameters at harvest, 2002.........................................................126 Table 5.6a: Incidence of black Aspergillus infection on slit berries, inoculated with a
suspension of Aspergillus carbonarius spores in vitro.....................................131 Table 5.6b: Incidence of black Aspergillus infection on berries spray-inoculated on
the vine with a suspension of A. carbonarius, harvested and slit .....................131 Table 5.6c: Incidence and severity of black Aspergillus infection on uninoculated
berries, harvested and slit ................................................................................132 Table 5.6d: Incidence and severity of black Aspergillus infection on bunches
subjected to simulated rain damage, followed by inoculation with a suspension of A. carbonarius spores in vitro .........................................................................133
Table 5.6e: Incidence and severity of black Aspergillus infection on berries spray-inoculated on the vine with a suspension of A. carbonarius spores, harvested and subjected to simulated rain damage.................................................................134
Table 5.6f: Incidence and severity of black Aspergillus infection on uninoculated bunches, harvested and subjected to simulated rain damage ............................135
Table 5.7: Mean bunch and berry weights of grapes at designated growth stages, 2003 and 2004.........................................................................................................141
Table 5.8: Multiple linear regression model describing the total ochratoxin A per bunch for Semillon bunches inoculated by immersion in Aspergillus carbonarius
spore suspension during the 30 d before harvest, 2004 ....................................150 Table 6.1: Preparation of ochratoxin A-contaminated grapes for winemaking.........164

- xiv-
Table 6.2: Effect of Aspergillus carbonarius infection on total soluble solids and titratable acidity of wine grapes at harvest.......................................................174
Table 6.3: Ochratoxin A concentration in juice and wine recovered from lees by centrifugation, 2004........................................................................................181
Table 6.4: Comparison of reduction in ochratoxin A during vinification achieved in this and two related studies .............................................................................183
Table 6.5: Efficacy of fining agents in this study for the reduction of ochratoxin A, compared with related studies .........................................................................190
Table D.1: Presence or absence of bands scored in the analysis of ERIC-PCR amplification of black Aspergillus spp. ...........................................................207
Table D.2: Polymorphism in allele size at six microsatellite loci in black Aspergillus
spp..................................................................................................................210 Table E.1: Spray application, 2003 .........................................................................214 Table E.2: Spray application, 2004 .........................................................................216

- xv-
Publications arising from this project Esteban, A., Leong, S.L., Tran-Dinh, N., 2005. Isolation and characterization of six
polymorphic microsatellite loci in Aspergillus niger. Molecular Ecology Notes
375-377.
Leong, S.L., 2006. Wine and fungi - implications of vineyard infections. In:
Dijksterhuis, J., Samson, R.A. (Eds), New challenges in Food Mycology.
Marcel Dekker Inc., New York, in press.
Leong, S.L., Hocking, A.D., Pitt, J.I., Kazi, B.A., Emmett, R.W., Scott, E.S., 2006.
Australian research on ochratoxigenic fungi and ochratoxin A. International
Journal of Food Microbiology, in press.
Leong, S.L., Hocking, A.D., Pitt, J.I., Kazi, B.A., Emmett, R.W., Scott, E.S., 2006.
Black Aspergillus spp. in Australian vineyards: from soil to ochratoxin A in
wine. In: Hocking, A.D., Pitt, J.I., Samson, R.A., Thrane, U. (Eds.), Advances
in Food Mycology. Springer, New York, 153-171.
Leong, S.L., Hocking, A.D., Scott, E.S., 2006. Survival and growth of Aspergillus
carbonarius on wine grapes before harvest. International Journal of Food
Microbiology, in press.

- xvi-

- 1 -
1 Introduction
1.1 Rationale for the project
Fungi classified in Aspergillus section Nigri (the black aspergilli) are ubiquitous
saprophytes in soils around the world, particularly in tropical and subtropical regions
(Klich and Pitt, 1988; Pitt and Hocking, 1997). Several species in this section are
common in vineyards and are often associated with bunch rot of grapes (Amerine et
al., 1980). Within this group, A. carbonarius and A. niger have been shown to
produce the mycotoxin, ochratoxin A (OA) (Abarca et al., 1994; Téren et al., 1996).
OA is a demonstrated nephrotoxin, which may also be carcinogenic, teratogenic,
immunogenic and genotoxic. It has been classified by the International Agency for
Research on Cancer (IARC) as Group 2B, a “possible human carcinogen”
(Castegnaro and Wild, 1995).
OA has been detected in grapes and grape products including juice, wine, dried vine
fruit and wine vinegars (Zimmerli and Dick, 1996; MacDonald et al., 1999; Majerus
et al., 2000; Markarki et al., 2001; Da Rocha Rosa et al., 2002; Sage et al., 2002). A
survey of 600 Australian wines showed that OA was present only at low
concentrations. Fifteen percent of samples had more than 0.05 µg/L and 85% of these
were less than 0.2 µg/L. The maximum found was 0.61 µg/L (Hocking et al., 2003).
The European Union has introduced limits for OA in dried vine fruits and wine of 10
µg/kg (ppb) and 2 µg/kg, respectively (European Commission, 2005).
It is now widely accepted that OA contamination of wine and other grape products is
a result of the growth of toxigenic A. carbonarius and A. niger in grapes [reviewed by
Abarca et al. (2004)]. Toxigenic isolates of A. carbonarius have been obtained from
Australian grapes grown for dried vine fruit production (Heenan et al., 1998; Leong et
al., 2004). However, the occurrence of such fungi in the wine grape vineyards of
Australian viticultural regions has not yet been examined. Little is known about the
ecology of the black aspergilli in Australian vineyards, in particular, the effects of
environmental factors on their survival, infection, growth and ability to produce OA
in grapes. The passage of OA from grapes into wine is also not well understood. This
project was undertaken to investigate these factors.

- 2 -
1.2 Toxicity of ochratoxin A
OA was first identified as a secreted toxic metabolite of Aspergillus ochraceus (van
der Merwe et al., 1965), a species belonging to section Circumdati. Other members of
this section, as well as sections Aspergillus, Flavi, Fumigati and Nigri, have been
reported to produce OA [reviewed by Abarca et al. (2001); Varga et al. (2001b)].
Penicillium verrucosum and its close relative, P. nordicum, are the only species in the
genus Penicillium in which a significant proportion of strains consistently produce
OA (Pitt, 1987; Larsen et al., 2001; Castellà et al., 2002), although production by
other species has been reported [reviewed by Varga et al. (2001b)].
COOH
N
O
O
O
CH3
Cl
H
OH
H
H
H
Figure 1.1: Ochratoxin A
OA contains an isocoumarin ring linked to L-phenylalanine through an amide bond
(Fig. 1.1), and is nephrotoxic to humans and animals, as well as displaying alternative
modes of toxicity [reviewed by Marquardt et al. (1990); Kuiper-Goodman (1996);
Creppy (1999); Petzinger and Ziegler (2000); Pfohl-Leszkowicz et al. (2002); Pitt and
Tomaska (2002); O'Brien and Dietrich (2005)]. The nephrotoxicity of OA to birds and
mammals, with the exception of ruminants, is well documented (Pfohl-Leszkowicz et
al., 2002). In particular, OA plays a major role in the etiology of porcine nephropathy
(Krogh et al., 1973). In humans, OA binds to serum albumen in blood, where it has a
long half-life of elimination (840 h) (Petzinger and Ziegler, 2000). It has been
detected in blood, breast milk and kidneys. OA has been linked to the chronic
nephropathic condition Balkan Endemic Nephropathy (BEN) in Bulgaria and the
former Yugoslavia, but its role in the etiology is still not clear (Pfohl-Leszkowicz et
al., 2002). Other possible etiological agents of BEN have been raised, such as the
presence or absence of metals, other elements and minerals, infection with bacteria or
viruses, or the synergistic action of fumonisins (Jurjevic et al., 1999) or citrinin
(Vrabcheva et al., 2000) with OA.

- 3 -
OA damages cells of the immune system (is immunotoxic), as demonstrated in
animals and in human lymphocyte cell culture (Pfohl-Leszkowicz et al., 2002), and is
also thought to damage DNA (genotoxic). The genotoxicity of OA is a matter of some
controversy, as various standard tests for genotoxicity using prokaryotes were
negative or only slightly positive. However, genotoxicity has since been demonstrated
in animal and human cell culture, and also observed in vivo in the DNA of mice
injected or fed with OA (Pfohl-Leszkowicz et al., 2002).
OA is carcinogenic in rats and mice, causing the development of renal cancers. The
carcinogenicity of OA in humans has not been proven, although there is a correlation
between BEN and urinary tract tumours, leading some to suggest that the two should
be considered a single syndrome with the same etiology (Pfohl-Leszkowicz et al.,
2002). A role for OA in testicular cancer has also been hypothesised (Schwartz, 2002).
Based on this information, IARC has classified OA as a group 2B carcinogen,
meaning that it is possibly carcinogenic for humans, but not yet probably carcinogenic
(group 2A) (Castegnaro and Wild, 1995). Clarification of the genotoxicity of OA to
human cells may lead to a re-classification into group 2A.
The Provisional Tolerable Daily Intake (PTDI) for OA has been proposed within the
range 1.2-14 ng/kg body weight, the latter figure being calculated based on
nephrotoxicity data [reviewed by Pitt and Tomaska (2002)]. The European Union
Scientific Committee for Food continues to support a PTDI of 5 ng/kg body weight
(European Commission, 2002), and this value was used by Pitt and Tomaska (2002)
to assess the extent of exposure to OA for Australian consumers. However, Petzinger
and Ziegler (2000) argued for a lower PTDI based on the unfavourable toxicokinetics
of OA in humans, particularly its persistence in human blood. Ingestion of
contaminated food may not be the sole means of exposure to OA; inhalation of dust
(Di Paolo et al., 1994; Richard et al., 1999; Iavicoli et al., 2002) or fungal spores
(Skaug et al., 2000) containing OA may represent alternative means of exposure.
- 4 -
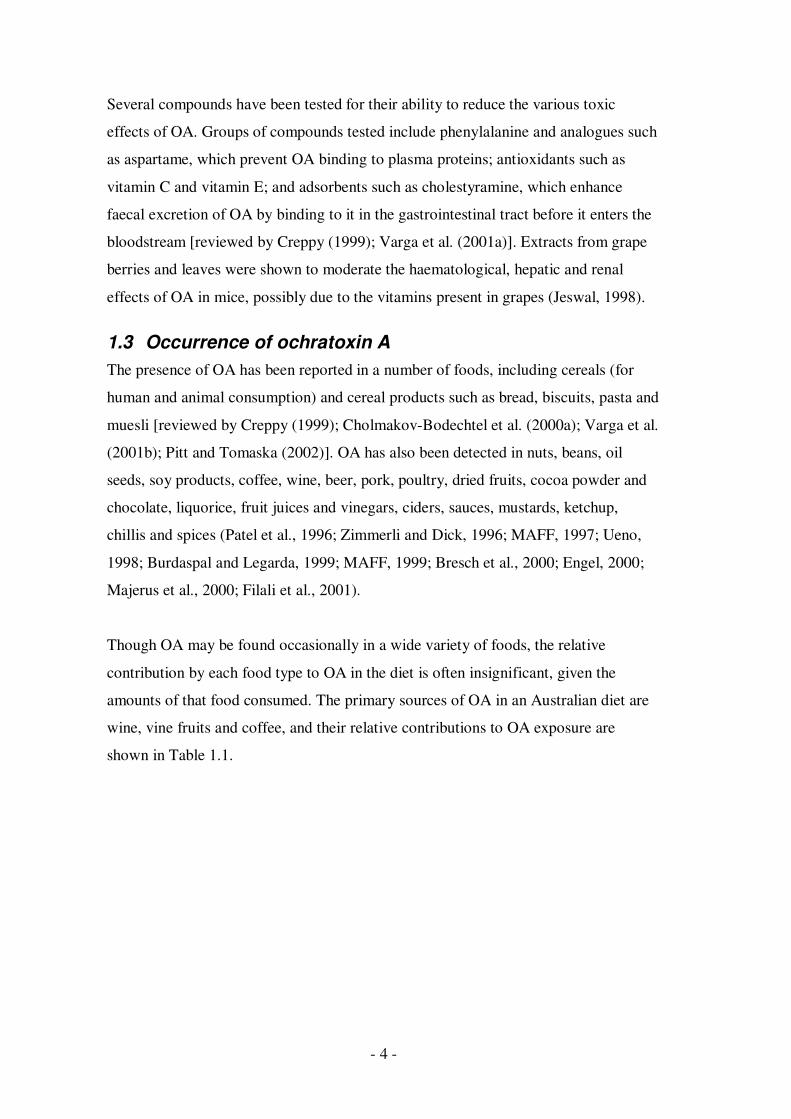
Several compounds have been tested for their ability to reduce the various toxic
effects of OA. Groups of compounds tested include phenylalanine and analogues such
as aspartame, which prevent OA binding to plasma proteins; antioxidants such as
vitamin C and vitamin E; and adsorbents such as cholestyramine, which enhance
faecal excretion of OA by binding to it in the gastrointestinal tract before it enters the
bloodstream [reviewed by Creppy (1999); Varga et al. (2001a)]. Extracts from grape
berries and leaves were shown to moderate the haematological, hepatic and renal
effects of OA in mice, possibly due to the vitamins present in grapes (Jeswal, 1998).
1.3 Occurrence of ochratoxin A
The presence of OA has been reported in a number of foods, including cereals (for
human and animal consumption) and cereal products such as bread, biscuits, pasta and
muesli [reviewed by Creppy (1999); Cholmakov-Bodechtel et al. (2000a); Varga et al.
(2001b); Pitt and Tomaska (2002)]. OA has also been detected in nuts, beans, oil
seeds, soy products, coffee, wine, beer, pork, poultry, dried fruits, cocoa powder and
chocolate, liquorice, fruit juices and vinegars, ciders, sauces, mustards, ketchup,
chillis and spices (Patel et al., 1996; Zimmerli and Dick, 1996; MAFF, 1997; Ueno,
1998; Burdaspal and Legarda, 1999; MAFF, 1999; Bresch et al., 2000; Engel, 2000;
Majerus et al., 2000; Filali et al., 2001).
Though OA may be found occasionally in a wide variety of foods, the relative
contribution by each food type to OA in the diet is often insignificant, given the
amounts of that food consumed. The primary sources of OA in an Australian diet are
wine, vine fruits and coffee, and their relative contributions to OA exposure are
shown in Table 1.1.

- 5 -
Table 1.1: Estimates of ochratoxin A exposure for Australian consumers (taken from Pitt and Tomaska (2002))
Food Mean
exposurea (µg/kg)
Intake for Australian
population (g/d)b
Mean OA intake (ng/d)c
Proportion of PDTI (%)
POPULATION (age 2 years and over) Wine 0.1 43.5 4 1.3 Vine fruits 2.5 4 10 3.3 Coffee 1 3.4 3 1.0 Total 17
d 5.6 CONSUMERS Wine 0.1 321 32 10.7 Vine fruits 2.5 8.8 22 7.3 Coffee 1 7.1 7 2.3 Total 61 20.3 95TH PERCENTILE CONSUMER Wine 0.1 775 78 26 Vine fruits 2.5 30 75 25 Coffee 1 18.2 18 6 Total 171 57 a data for exposure taken from MAFF (1997) in the UK. Cereals, an important source of OA consumption in Europe have been omitted here in the absence of evidence for the occurrence of OA in Australian cereals. Intake data for food consumption taken from Australian Total Diet Survey (ANZFA, 1996). A PDTI of 5 ng/kg body weight has been used, equivalent to 300 ng/d for a 60 kg individual. The estimate assumes that all food consumed contains OA at the mean concentration, an overestimate of intake b mean intake of wine, vine fruits and coffee for the total population age 2 years and over, mean intake for consumers of those foods, and intake for an individual consuming amounts greater than 95% of other consumers c multiplication of columns two and three gives the mean daily intake of OA by individuals d figures summed are in italics
Exposure to OA in European countries potentially represents a greater risk than in
Australia, due to OA contamination of cereals and cereal products, and the greater
consumption of cereal products in Europe. Cereal-based foods contributed 40-50% of
the total dietary intake of OA by German adults. These were followed in importance
by coffee (14.5%) and beer (9.8%) (Cholmakov-Bodechtel et al., 2000b). The
contribution of wine and champagne was negligible for the median consumer (1.4%),
but increased to more than 11.3% for the top 10% of consumers, a significant source
of exposure to OA. Exposure of children to OA was primarily through fruit juices,
especially red grape juice (15.4%) and sweets such as chocolate, cereal-based bars
and biscuits (9.9%). The mean daily exposure for adults in Germany was 39.9 ng; this
figure is lower than the Australian estimate in Table 1.1, because the German figures

- 6 -
were calculated using the median of OA concentration which is typically lower than
the mean concentration, as the concentrations of OA in food surveys are typically
skewed towards lower values. An individual on the 90th percentile of the bell-shaped
curve for consumption of foods containing OA in the German study was exposed to
higher levels of OA than an individual on the 95th percentile of a similar bell-shaped
curve in Australia (247.9 ng/d cf 171 ng/d). Recently, Sizoo and Van Egmond (2005)
estimated from a study of actual diets in the Netherlands that the daily OA intake was
72 ng/d, an amount below the tolerable daily intake proposed by Pitt and Tomaska
(2002). Nevertheless, OA continues to be of great concern to the European Union,
which has introduced maximum levels for OA of 5 µg/kg in raw cereals, 3 µg/kg in
cereal products, 5 µg/kg in coffee beans, 10 µg/kg in instant coffee, 10 µg/kg in dried
vine fruits, 2 µg/kg in wine and grape juice, and 0.5 µg/kg in baby foods (European
Commission, 2002, 2005). Countries exporting products such as wine and dried vine
fruits to Europe must invest in strategies to ensure that their products consistently
meet the above limits.
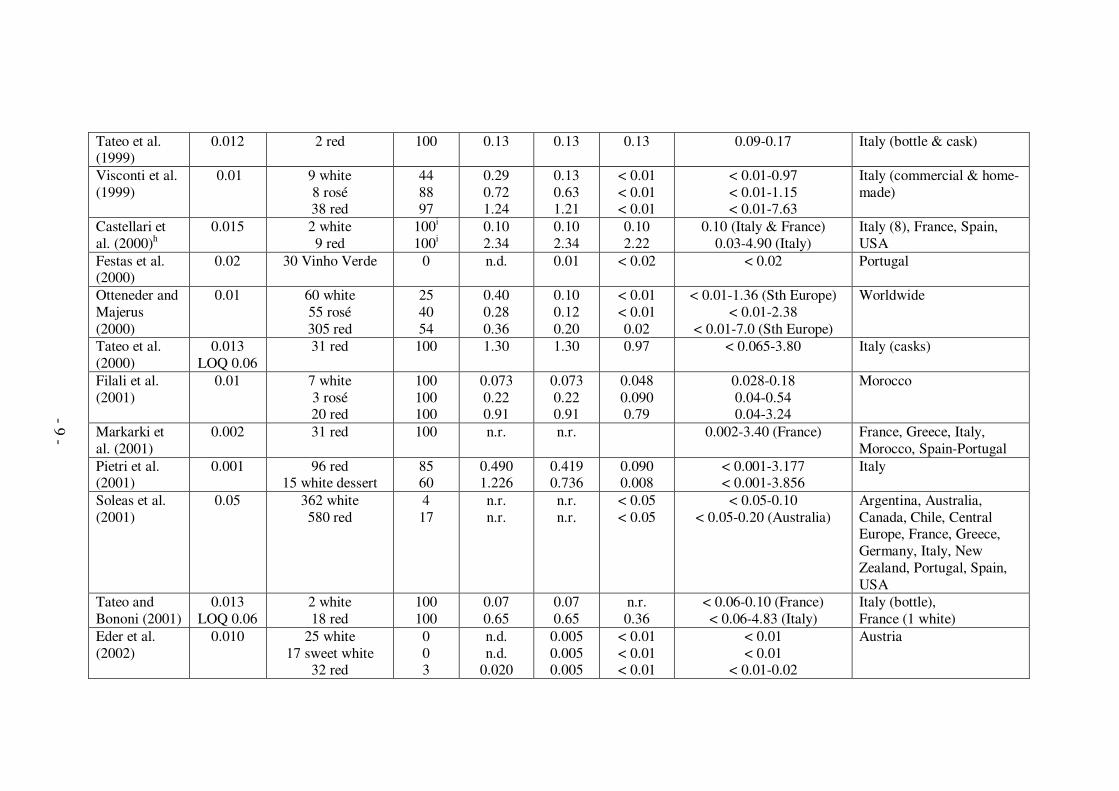
Several surveys of OA in wine have been published, and these are summarised in Fig.
1.2 and Table 1.2. Wines from most of the major viticultural regions of the world
were represented in these surveys, but the number of red wines assayed far exceeded
that of white and rosé wines. The range of OA concentrations reported varied among
surveys, depending on the extraction and assay technique (differing limits of detection)
and source of the wine. The highest concentration of OA reported to date in wine is
15.25 µg/L, in mistelle from Spain (Bellí et al., 2004a), followed by 7.63 µg/L, in a
commercial red wine from Italy (Visconti et al., 1999). In most of the surveys of
wines produced commercially, the incidence and/or mean concentration of OA
contamination was higher in red wines than in white wines (Fig. 1.2, Table 1.2).
Zimmerli and Dick (1996) postulated that this could be an effect of viticultural region,
with red grapes more commonly grown in warm climates than white grapes. However,
Otteneder and Majerus (2000) demonstrated that red wines from cool regions
(Germany and France) contained higher levels of OA than white wines from the same
regions. They suggested that the primary source of difference was in processing, i.e.
white grapes are pressed off skins immediately, whereas crushed red grapes may be
put aside for several days before fermentation.

- 7 -
OA was detected most frequently in wines from Mediterranean countries and northern
Africa (Fig. 1.2), following a trend for increased prevalence in wines from southern
(warmer) regions compared with northern regions in the Northern hemisphere
(Majerus and Otteneder, 1996; Zimmerli and Dick, 1996; Ospital et al., 1998;
Otteneder and Majerus, 2000; Markarki et al., 2001; Pietri et al., 2001). Occurrence of
OA in wines from the so-called “new world” (USA, Canada, South America, South
Africa, Australia, New Zealand) was low. In wines from Australia and South Africa,
no obvious differences were observed between OA in red and white wines, and wines
from warmer areas did not show increased contamination rates (Stander and Steyn,
2002; Hocking et al., 2003; Leong et al., 2005a).
0%
20%
40%
60%
80%
100%
W
(73)
R
(50)
W
(65)
R
(92)
W
(48)
R
(135)
W
(76)
R
(584)
W
(33)
Rs
(21)
R
(114)
W
(44)
R
(23)
W
(33)
R
(48)
R
(25)
W
(152)
R
(218)
W
(49)
R
(92)
W
(60)
R
(82)
W
(375)
R
(462)
< 0.05 < 0.1 < 0.2 < 0.3 < 0.5 < 1.0 > 1.0 µg/L
Germany Central / France Italy --- Spain --- Portugal Greece North USA South South Australia
Switzerland Eastern Africa Canada America Africa New Zealand
Austria Europe
Figure 1.2: Incidence and degree of ochratoxin A contamination in wines produced in viticultural regions worldwide. White wines (W), red wines (R), rosé (Rs); the cumulative number of wines tested for each region from various surveys is given in brackets. Dessert and fortified wines were not included. Data presented here were calculated from Majerus and Otteneder (1996), Zimmerli and Dick (1996), MAFF (1997), Ospital et al. (1998), MAFF (1999), Tateo et al. (1999), Visconti et al. (1999), Castellari et al. (2000), Festas et al. (2000), Tateo et al. (2000), Filali et al. (2001), Markarki et al. (2001), Pietri et al. (2001), Soleas et al. (2001), Tateo and Bononi (2001), Eder et al. (2002), Stander and Steyn (2002), Hocking et al. (2003), Micheli et al. (2003), Siantar et al. (2003), Soufleros et al. (2003), Tateo and Bononi (2003), Blesa et al. (2004), Ng et al. (2004), Ratola et al. (2004), Rosa et al. (2004), Czerwiecki et al. (2005) and Leong et al. (2005a)
Perc
enta
ge o
f w
ines w
ithin
OA
conta
min
ation r
ange

Table 1.2: Prevalence of ochratoxin A in wines
Citation Limit of detection
(µg/L) Wines assayed
% Samples in which OA was detected
Mean of positives (µg/L)
Meana (µg/L)
Median (µg/L)
Range (source of maximum value, where known) (µg/L)
Country of origin
Majerus and Otteneder (1996)
0.01 41 white 14 rosé 89 red
34 43 45
n.r.b n.r. n.r.
n.r. n.r. n.r.
0.07 0.1
0.19
< 0.01-1.20 < 0.01-2.40
< 0.01-7.00 (Italy)
Australia, Chile, France, Germany, Greece, Italy, Macedonia, Moldova, Portugal, South Africa, Spain, Tunisia, USA
Zimmerli and Dick (1996)
0.003 LOQc 0.005
24 white 15 rosé 79 red
27d 92d 78d
n.r. n.r. n.r.
0.011e 0.025 e 0.039 e
< 0.003 0.019 0.013
< 0.003-0.178 (France) < 0.003-0.123 (France) < 0.003-0.388 (Tunisia)
Argentina, France, Italy, North Africa, Portugal, South Africa, Spain, Switzerland
MAFF (1997) 0.2 10 white 10 red
0 40
n.d.f 1.0
0.1 0.4
< 0.2 < 0.2
< 0.2 < 0.2-1.1 (France)
France, Italy, Spain
Ospital et al. (1998)
0.01 4 white 2 rosé 20 red
25 50 60
0.016 0.110 0.083
0.008 0.058 0.052
< 0.01 0.060 0.015
< 0.01-0.016 (France) < 0.01-0.11 (France) < 0.01-0.27 (France)
France, Portugal (2), Spain (1)
Ueno (1998) 0.003 5 white 5 rosé 36 red
20 60 42
0.006 0.024 0.052
0.002 0.015 0.023
< 0.003 n.r.
< 0.003
< 0.003-0.006 (Germany) < 0.003-0.037
< 0.003-0.245 (France)
Australia, Chile, France, Germany, Italy, Japan, South Africa, USA
Burdaspal and Legarda (1999)
0.003 69 white 32 rosé 91 red
12 sparkling
45 29 84 83
n.r. n.r. n.r. n.r.
0.020g 0.031g 0.054g 0.012g
< 0.003 < 0.003
n.r. n.r.
< 0.003-0.267 (Spain) < 0.003-0.161 (France) < 0.003-0.603 (Spain) < 0.003-0.037 (Spain)
France, Germany, Hungary, Italy, Portugal, Spain, USA
MAFF (1999) 0.01 50 red 56 0.13 0.08 0.02 < 0.01-0.8 (France) Argentina, Australia, Bulgaria, Chile, Italy, France, South Africa, Spain, USA
- 8 -
Tateo et al. (1999)
0.012 2 red 100 0.13 0.13 0.13 0.09-0.17 Italy (bottle & cask)
Visconti et al. (1999)
0.01 9 white 8 rosé 38 red
44 88 97
0.29 0.72 1.24
0.13 0.63 1.21
< 0.01 < 0.01 < 0.01
< 0.01-0.97 < 0.01-1.15 < 0.01-7.63
Italy (commercial & home-made)
Castellari et al. (2000)h
0.015 2 white 9 red
100i 100i
0.10 2.34
0.10 2.34
0.10 2.22
0.10 (Italy & France) 0.03-4.90 (Italy)
Italy (8), France, Spain, USA
Festas et al. (2000)
0.02 30 Vinho Verde 0 n.d. 0.01 < 0.02 < 0.02 Portugal
Otteneder and Majerus (2000)
0.01 60 white 55 rosé 305 red
25 40 54
0.40 0.28 0.36
0.10 0.12 0.20
< 0.01 < 0.01 0.02
< 0.01-1.36 (Sth Europe) < 0.01-2.38
< 0.01-7.0 (Sth Europe)
Worldwide
Tateo et al. (2000)
0.013 LOQ 0.06
31 red 100 1.30 1.30 0.97 < 0.065-3.80 Italy (casks)
Filali et al. (2001)
0.01 7 white 3 rosé 20 red
100 100 100
0.073 0.22 0.91
0.073 0.22 0.91
0.048 0.090 0.79
0.028-0.18 0.04-0.54 0.04-3.24
Morocco
Markarki et al. (2001)
0.002 31 red 100 n.r. n.r. 0.002-3.40 (France) France, Greece, Italy, Morocco, Spain-Portugal
Pietri et al. (2001)
0.001 96 red 15 white dessert
85 60
0.490 1.226
0.419 0.736
0.090 0.008
< 0.001-3.177 < 0.001-3.856
Italy
Soleas et al. (2001)
0.05
362 white 580 red
4 17
n.r. n.r.
n.r. n.r.
< 0.05 < 0.05
< 0.05-0.10 < 0.05-0.20 (Australia)
Argentina, Australia, Canada, Chile, Central Europe, France, Greece, Germany, Italy, New Zealand, Portugal, Spain, USA
Tateo and Bononi (2001)
0.013 LOQ 0.06
2 white 18 red
100 100
0.07 0.65
0.07 0.65
n.r. 0.36
< 0.06-0.10 (France) < 0.06-4.83 (Italy)
Italy (bottle), France (1 white)
Eder et al. (2002)
0.010 25 white 17 sweet white
32 red
0 0 3
n.d. n.d.
0.020
0.005 0.005 0.005
< 0.01 < 0.01 < 0.01
< 0.01 < 0.01
< 0.01-0.02
Austria
- 9 -

Table 1.2 (cont.)
Citation Limit of detection
Wines assayed % Positives
Mean of positives
Meana (µg/L)
Median (µg/L)
Range (source of maximum) (µg/L)
Country of origin
Lopez de Cerain et al. (2002)
0.05 12 white 28 red
58 46
0.186 0.156
0.119 0.086
n.r. < 0.05
< 0.05-0.208 < 0.05-0.316
Spain (from experimental vineyards)
Stander and Steyn (2002)
0.01 15 white (inexp.)j 16 red (inexp.)
5 dessert (inexp.) 27 white (exp.) j
49 red (exp.) 3 dessert (exp.)
40 63 80 52 18
100
n.r. n.r. n.r. n.r. n.r. n.r.
n.r. n.r. n.r. n.r. n.r. n.r.
< 0.01 0.014 0.130 n.r. n.r.
1.732
< 0.01-0.195 < 0.01-0.217 < 0.01-0.270
< 0.01-0.1 < 0.01-0.126 < 0.01-2.672
South Africa
Hocking et al. (2003)
0.02 LOQ 0.05
257 white 344 red
16c 14c
0.11 0.12
0.04 0.04
< 0.05 < 0.05
< 0.05-0.5 < 0.05-0.62
Australia (bottle and cask)
Micheli et al. (2003)
0.01 6 red 100 0.145 0.145 0.145 0.06-0.26 Italy (organic wine)
Shephard et al. (2003)
0.01 8 white 7 white dessert
9 red 3 white 5 red
100 100 100 100 100
0.19 0.12 0.25 0.05 0.58
0.19 0.12 0.25 0.05 0.58
n.r. n.r. n.r. n.r. n.r.
0.04-0.33 0.06-0.18 0.07-0.39 0.01-0.08 0.23-0.91
South Africa (bottle and cask) Italy
Siantar et al. (2003)
0.01 27 white 1 rosé 54 red
26 0 33
0.010 n.d.
0.112
0.006 0.005 0.041
< 0.01 n.r.
< 0.01
< 0.01-0.08 n.r.
< 0.01-1.68
USA
Soufleros et al. (2003)
0.02 17 white 1 rosé 17 red
65 0 65
0.612 n.d.
0.627
0.399 0.010 0.409
0.08 < 0.02 0.14
< 0.02-3.20 < 0.02
< 0.02-2.51
Greece (dry and sweet wines)
- 10 -

Stefanaki et al. (2003)
0.05 118 white 20 rosé 104 red
18 dessert 8 retsina
53 65 68 83 75
0.45 0.25 0.49 0.69 0.78
0.25 0.17 0.34 0.58 0.59
0.06 0.08 0.09 0.33 0.27
< 0.05-1.72 < 0.05-1.16 < 0.05-2.69 < 0.05-2.82 < 0.05-1.75
Greece
Tateo and Bononi, (2003)
0.013 LOQ 0.06
4 white 76 red
0 95
n.d. 0.27
0.007 0.26
< 0.013 0.12
< 0.013 (Italy) < 0.013-2.90 (Italy)
Italy, Chile (1), France(1)
Bellí et al. (2004a)
0.05 50 white 130 red
10 sparkling
8 18 40
0.40 0.60 0.44
0.06 0.13 0.19
< 0.05 < 0.05 < 0.05
< 0.05-1.13 < 0.05-4.24 < 0.05-0.71
Spain
Blesa et al. (2004)
0.01 24 white 21 rosé 61 red
17 57 34
0.41 0.20 0.17
0.07 0.12 0.06
< 0.01 ~ 0.03 < 0.01
< 0.01-0.76 < 0.01-0.46 < 0.01-0.53
Spain
Ng et al. (2004)
white 0.004
red 0.008
43 white (Can.)k 36 red (Can.)
53 white (imp.)k 48 red (imp.)
23 14 42 54
0.038 0.125 0.281 0.383
0.010 0.021 0.118 0.209
< 0.004 < 0.008 < 0.004
n.r.
< 0.004-0.156 < 0.008-0.393
< 0.004-3.720 (Greece) < 0.008-2.320 (Italy)
Canada Algeria (1), Cyprus (1), France, Greece, Italy, Spain, Turkey (2), USA
Ratola et al. (2004)
0.084 189 Port, 85 Vinho verde,
66 other
20 total all but two < 0.5
n.r. < 0.084 < 0.084-2.1 Portugal
Rosa et al. (2004)
0.021 15 white (S. Am.)l 5 rosé (S. Am.) 22 red (S. Am.)
18 white (Europe) 20 red (Europe)
13 20 32 22 45
0.028 0.035 0.039 0.024 0.034
0.013 0.015 0.020 0.013 0.021
< 0.021 < 0.021 < 0.021 < 0.021 < 0.021
< 0.021-0.028 (Brazil) < 0.021-0.035 (Brazil) < 0.021-0.071 (Chile)
< 0.021-0.028 (Portugal) < 0.021-0.057 (Portugal)
Argentina, Brazil, Chile France, Italy, Portugal, Spain
Berente et al. (2005)
0.024 5 white 5 red
57, type not stated
0 0 0
n.d. n.d. n.d.
n.d. n.d. n.d.
< 0.024 < 0.024 < 0.024
< 0.024 < 0.024 < 0.024
Hungary
- 11 -

Table 1.2 (cont.)
Citation Limit of detection
Wines assayed % Positives
Mean of positives
Meana (µg/L)
Median (µg/L)
Range (source of maximum) (µg/L)
Country of origin
Brera et al. (2005)
0.01 21 white (Italy) 9 rosé (Italy)
159 red (Italy) 19 dessert (Italy) 30 white (Hng.)m
2 rosé (Hng.) 27 red (Hng.)
19 56 84 63 0 0 0
n.r. n.r. n.r. n.r. n.d. n.d. n.d.
n.r. n.r n.r. n.r. n.d. n.d. n.d.
< 0.01 n.r. n.r. n.r.
< 0.01 < 0.01 < 0.01
< 0.01-0.21 < 0.01-1.04 < 0.01-4.00 < 0.01-1.64
< 0.01 < 0.01 < 0.01
Hungary, Italy
Czerwiecki et al. (2005)
0.0005 53 red 92 n.r. 0.039g 0.478 < 0.0005-6.710 (France) Argentina, Bulgaria, Croatia, France, Germany, Greece, Hungary, Italy, Romania, Spain
Lin et al. (2005)
0.2 10 red 50 0.3 0.2 n.r. < 0.2-0.5 Italy, Taiwan (1 of 2 tested was positive)
a mean OA concentrations calculated assuming any results below the limit of detection contained OA at half the limit of detection, unless otherwise noted b n.r.: not reported c LOQ: limit of quantification d positive samples contained OA above the limit of quantification e mean as reported, samples below limits of quantification and detection were defined as having the limiting values f n.d.: not detected g mean as reported, values attributed to samples below limits of detection unknown h results from reference method (pre-extraction with chloroform followed by clean-up with Ochraprep columns) i OA positive samples chosen for this study j (inexp.) refers to wines of low to medium price purchased locally; (exp.) refers to higher priced, export-quality wines k Canadian (Can.) and imported (imp.) wines l South American (S. Am.) wines m Hungarian (Hng.) wines
- 12 -

- 13 -
Australian wines have been included in international surveys for the presence of OA
(Table 1.3). Hocking et al. (2003) completed an extensive survey of Australian wines,
testing 257 white and 344 red wines, including dessert and sparkling wines. Less
expensive wines, such as those sold in plastic-lined cardboard boxes (casks) were also
included in the survey. OA was detected at greater than 0.05 µg/L in 16% of white
wines and 14% of red wines, but 85% of these positive samples were below 0.2 µg/L.
The highest concentration observed was 0.62 µg/L, in a bottle of red “lambrusco”-
style wine. No single grape variety showed markedly higher OA contamination than
any other, though the incidence of contamination in Shiraz and Shiraz blends was
slightly greater than in Cabernet Sauvignon and Cabernet blends. Among the whites,
Riesling and Riesling blends showed a slightly higher contamination rate than
Chardonnay, Semillon or Sauvignon Blanc. Generally, unnamed blends and styles
such as “dry red”, “lambrusco”, or “sweet white” had a higher incidence of
contamination. These blends were often lower quality bottled wines or those packaged
in casks. Cask wines were more likely to contain OA than bottled wines (38% and
15% positive, respectively); this trend was also noted for wines in Italy and South
Africa (Tateo et al., 2000; Tateo and Bononi, 2001; Stander and Steyn, 2002; Tateo
and Bononi, 2003).
Table 1.3: Prevalence of ochratoxin A (µg/L) in Australian wines
Number of samples in the concentration range
Wine Maximum
OA < 0.05
0.05 - < 0.1
0.1 - < 0.2
≥ 0.2 Citation
Red 0.22 1 Majerus and Otteneder (1996) Red n.r.a 3 Ueno (1998) Red 0.05 4 1 MAFF (1999) Red 0.2 36 8 1 White n.r. 10 1
Soleas et al. (2001)
Red 0.62 295 29 16 4 White 0.50 216 19 13 9
Hocking et al. (2003)
Red n.r. 57 White 0.17 75 1 2
Australian Wine and Brandy Corporationb
a not reported b unpublished data. From wines exported in 2001-2004

- 14 -
Most of the results summarised in Table 1.2 were from surveys of still red and white
table wines, with the exception of Hocking et al. (2003), where dessert and sparkling
wines were included in the overall analysis. In three of four surveys, OA
contamination of dessert wines was greater than that of white and red wines in the
same surveys (Pietri et al., 2001; Stander and Steyn, 2002; Shephard et al., 2003;
Stefanaki et al., 2003), whereas, in sparkling wines, OA was present at levels similar
to those of still wines in the same surveys (Burdaspal and Legarda, 1999; Bellí et al.,
2004a). OA contamination in aperitifs, port wines and sherries was typically low
(Table 1.4); however, the mean contamination of wines such as marsala, malaga,
moscatel, fondillón and mistelle, was 2-10 fold higher than the mean contamination
reported for standard table wines in the same surveys (Table 1.2).
OA contamination of grape juice (Table 1.5) occurred over the same range as that of
wine and, as observed in several wine surveys, contamination of red juice was often
worse than that of white juice. Majerus et al. (2000) postulated that higher OA
concentrations were found in red juice due to the practice of enzymatic treatment of
the crude juice and berries at increased temperatures over an extended time to
improve colour yield; however, data to differentiate between OA production by the
mould, or OA partitioning from the pulp into the juice are not available. Certain
studies surveyed both wine and grape juice for OA contamination (Table 1.5 cf Table
1.2), which was often greater in red juice than in red wine. Binding of OA to yeast
cells during and after fermentation (Bejaoui et al., 2004) may have reduced its
concentration in wine. Zimmerli and Dick (1996) observed greater OA contamination
in juice blends from warmer climates in France and southern Italy. Roset (2003),
likewise, noted that OA in juice increased in conditions of high rainfall and warmth
prior to harvest, in particular from vineyards near the coast and from late-harvested
grape cultivars. OA was also detected in fresh juice from wine grapes (Table 1.5) and,
in southern France, appeared to be associated with isolation of ochratoxigenic fungi
from those vineyards (Sage et al., 2002, 2004). However, consistent relationships
between the presence of visible mould or ochratoxigenic fungi and OA in grapes,
were not demonstrated in studies of grapes from Italy, Spain and Switzerland
(Zimmerli and Dick, 1996; Bellí et al., 2004a; Battilani et al., 2005b).

- 15 -
Table 1.4: Prevalence of ochratoxin A in aperitifs, fortified and other special wines
Samples Positive samples
Meana (µg/kg)
Range (µg/kg) Country of origin
Aperitifs Vermouth (Zimmerli and Dick, 1996)
0/2 < 0.003 < 0.003 Italy
Burdaspal and Legarda (1999)
35/47 0.04b < 0.003-0.254 France, Germany, Portugal, Spain
Port wines and sherries Port (Zimmerli and Dick, 1996)
6 tested 0.011c < 0.003-0.017 Portugal
Sherry (Zimmerli and Dick, 1996)
2/2 0.042 0.029-0.054 Spain
Port (Festas et al., 2000)
3/34d 0.01 < 0.02-0.08 Portugal
Port (Tateo et al., 2000)
4/6 0.085 < 0.013-0.34 not stated
Fortified (Stander and Steyn, 2002)
3/7 median 0.021
< 0.01-0.168 South Africa
Marsala, Malaga, Moscatel, Fondillón, Mistelle Zimmerli and Dick (1996)
5/5 0.250 0.044-0.451 Italy, Spain
Burdaspal and Legarda (1999)
15/16 1.048b < 0.003-2.540 Italy, Spain
Tateo et al. (2000)
0/2 < 0.033 < 0.033 not stated
Bellí et al. (2004a)
9/20 2.03 < 0.05-15.25 Spain, including sherry and vermouth
Blesa et al. (2004)
8/13 0.133 < 0.01-0.40 Spain
Ice wine Eder et al. (2002)
0/5 < 0.01 < 0.01 Austria
a mean OA concentrations calculated assuming any results below the limit of detection contained OA at half limit of detection, unless otherwise noted b mean as reported, values attributed to samples below limits of detection unknown c mean as reported, samples below limits of quantification and detection were defined as having the limiting values d the three positive samples had been adulterated in an unspecified manner

- 16 -
Table 1.5: Prevalence of ochratoxin A in commercial grape juice and juice from crushed grapes at harvest
Citation Samples Positive samples
Meana (µg/L)
Range (µg/L) Country of origin
White juice 1/6 0.016 < 0.01-0.73 Majerus and Otteneder (1996)
Red juice 12/14 median 1.8
< 0.01-4.7 purchased in Europe
White juice 1/3 brands
0.003b < 0.003-0.005
Red juice 7/8 brands
0.188b < 0.003-0.337
France, Italy, Switzerland
Zimmerli and Dick (1996)
Juice from red and white grapes (including visibly mouldy fruit)
0/17 not detected
< 0.003 Italy, Switzerland
White juice 0/3 not detected
< 0.003 Ueno (1998)
Red juice 2/6 0.018 < 0.003-0.006
purchased in Japan
Grape + other juices
10/10 0.044c 0.015-0.102 France, Spain
Burdaspal and Legarda (1999) Juice from red
and white grapes
8 tested 0.046c < 0.003-0.176 Spain
White juice 10/11 0.28 < 0.01-0.45 MAFF (1999) Red juice 9/9 0.74 0.03-2.05
not known
White juice 21/27 median 0.09
< 0.01-1.3 Majerus et al. (2000)
Red juice 56/64 median 0.27
< 0.01-5.3
purchased in Europe
Sage et al. (2002)
Juice from red wine grapes
8/11 not reported
< 0.010-0.461 France
Abrunhosa et al. (2003)
Juice from wine grapes
2/11 not reported
all < 0.01 Portugal
< 0.02-0.1 Austria < 0.02 Germany 0.8-8.0 Greece
< 0.02-4.5 France < 0.02-8.5 Italy
Roset (2003) Juice from grapes (for commercial juice production prior to processing)
not reported
not calculated
< 0.02-6.0 Spain
Abdulkadar et al. (2004)
Grape juice 0/5 not detected
< 0.15 purchased in Qatar
Grape juice 0/10 not detected
< 0.05
Juice from white wine grapes
2/10 0.05 < 0.05-0.18
Bellí et al. (2004a)
Juice from red wine grapes
0/10 not detected
< 0.05
Spain

- 17 -
Table 1.5 (cont.)
Citation Samples Positive samples
Meana (µg/L)
Range (µg/L) Country of origin
Bellí et al. (2004c)
Juice from white (12) and red (28) wine grape samples
6/40 not reported
< 0.07-0.81 Spain
White juice 4/25 0.009 < 0.008-0.071 Ng et al. (2004) Red juice 5/45 0.010 < 0.008-0.104
Canada, USA
Rosa et al. (2004)
Red juice 14/48 0.019 (of
positives 0.038)
< 0.021-0.100 Brazil
Sage et al. (2004)
Juice from white and red wine grapes
11/37 0.02 < 0.01-0.43 France
Berente et al. (2005)
Juice from white and red wine grapes
0/10 not detected
< 0.024 Hungary
Czerwiecki et al. (2005)
White grape juice
3/3 0.044 0.0029-0.064 Poland
a mean OA concentrations calculated assuming any results below the limit of detection contained OA at the half limit of detection, unless otherwise noted b mean of brands c mean as reported, values attributed to samples below limits of detection unknown
OA contamination of wine vinegar was fairly common, particularly in balsamic
vinegars. Majerus et al. (2000) reported that 50% of 38 wine vinegars contained OA
above 0.01 µg/L (median 0.1 µg/L, maximum 1.9 µg/L, similar to wines in the same
survey), but 83% of 29 balsamic vinegars were positive for OA, and at higher levels
(median 0.65 µg/L, maximum 4.35 µg/L). Similarly, a survey of 15 wine vinegars by
Markarki (2001) demonstrated that the highest concentrations were found in three
balsamic vinegars (0.156, 0.102 and 0.252 µg/L), whereas the remaining 12 samples
fell between 0.008- 0.046 µg/L. These concentrations were slightly lower than those
reported for wines in the same survey. Grape must is concentrated up to 50 fold
during the production of balsamic vinegar (http://lebaccanti.com/travel-incentives-
tuscany.php?id=35, accessed 05/04/05), which may explain the higher OA
contamination in this product.

- 18 -
OA was detected frequently in dried vine fruits (Table 1.6) and, although the mean
contamination was below that of the proposed EU limit of 10 µg/kg (European
Commission, 2002), the maximum contamination reported in most surveys exceeded
the limit by up to five fold. No single type of dried vine fruit displayed the greatest
OA contamination in all the surveys. The mean contamination observed for dried vine
fruit (Table 1.6) appeared to be closer to the 10 µg/kg limit than the corresponding
mean concentration for wine (Table 1.2) and its 2 µg/kg limit (European Commission,
2005). For example, even in this limited number of surveys, three sets of samples
[currants and sultanas reported by MacDonald et al. (1999); currants reported by
MAFF (1999)] displayed mean contamination greater than 40% (arbitrarily assigned)
of the limit. In contrast, mean contamination of only four sets of wine samples from a
far greater number of analyses achieved concentrations greater than 40% of the limit
(Table 1.2; Visconti et al., 1999; Castellari et al., 2000; Tateo et al., 2000; Filali et al.,
2001). Consistently meeting the EU limit will probably be a greater challenge for
dried vine fruit producers than for wine producers.
OA in dried vine fruit may be reduced during processing. Automated laser sorters
reject misshapen and darkened berries during processing of Australian dried vine fruit
(Australian Dried Fruits Association Inc., 1998). In some cases, berry darkening
occurs due to the action of the browning enzyme, polyphenol oxidase (Grncarevic and
Hawker, 1971). Browning is often caused by slow drying, as in the case of “natural”
sultanas dried without emulsion. However, cell damage associated with berry splitting
may also trigger browning, and rots caused by ochratoxigenic fungi have been
observed to result in berry discoloration (Clarke et al., 2003). In seasons when berry
splitting was common, dark berries contained OA at greater concentrations than light
berries (Leong et al., 2005a). Discarded berries are sometimes added to cow feed, and
might have posed a potential risk for OA contamination in dairy products, were it not
for cleavage of the molecule by rumen microbes into non-toxic products (Engel,
2000); dairy products typically do not contain OA (264 samples below 0.01µg/kg),
thus this practice appears to be safe.

- 19 -
Table 1.6: Prevalence of ochratoxin A in dried vine fruits
Citation, LOD / LOQa
Samples Positive samples
Meanb (µg/kg)
Maximum (µg/kg)
Country of origin
Saxena and Mehrotra (1990), qualitative assessment
Raisins 1/20 n.r.c n.r. India
Abdel-Sater and Saber (1999), LOD not reported
Raisins 0/20 n.d.c n.d. Egypt
Currants 19/20 9.2 53.6 Greece Raisins 17/20 2.8 20.0 Australia, Chile, USA,
mixed origin
MacDonald et al. (1999), LOD > 0.2 µg/kg Sultanas 17/20 4.9 18.1 Greece, Turkey, mixed
origin Currants 96/100 5.0 40.8 Australia, Greece, mixed
origin Raisins 98/101 3.4 29.8 USA, Chile, South Africa,
mixed origin
MAFF (1999), LOD > 0.1 µg/kg
Sultanas 92/100 2.9 25.1 Australia, Greece, Turkey Currants 16/17d 1.3d 10.2d Möller and
Nyberg (2003), LOD > 0.1 µg/kg
Raisins 80/101d 2.0d 34.6d not stated
Currants 43/54 2.8 13.8 Greece Stefanaki et al. (2003), LOD > 0.5 µg/kg
Sultanas 17/27 2.1 13.2 Greece
Abdulkadar et al. (2004), LOD > 0.15 µg/kg
Raisins 2/7 0.4 1.2 Qatar
Currants 2/2 2.8 4.9 Raisins 67/85 1.8 26.6
Lombaert et al. (2004), LOQ > 0.1 µg/kg
Sultanas 39/66 1.9 26.0
Australia, Chile, Greece, Hong Kong, Iran, Israel, Mexico, South Africa, Turkey, United Arab Emirates, USA, unknown origin
Black 21/31 1.7 14.0 Magnoli et al. (2004), LOD > 1 µg/kg
White 16/19 3.2 7.5 Argentina
a LOD: limit of detection; LOQ: limit of quantification b mean OA concentrations calculated assuming any results below the limit of detection contained OA at half the limit of detection, unless otherwise noted c n.r.: not reported; n.d.: not detected d number of samples included subsamples from the same retail packages. OA results reported for extraction with sodium bicarbonate and methanol

- 20 -
1.4 Source of ochratoxin A
The source of OA in foods is well understood for certain foods only [reviewed by Pitt
and Tomaska (2002)]. The occurrence of OA in cereals and cereal products is known
to be primarily due to growth of P. verrucosum during storage in cool, temperate
regions such as northern and central Europe and Canada. When OA-contaminated
grain is fed to non-ruminant animals, the toxin accumulates in the flesh. P.
verrucosum is rarely isolated from Australian grains. The probable source of OA in
coffee is A. ochraceus, with some potential contribution from toxigenic strains of
Aspergillus section Nigri. More recently, the source of OA in cured and fermented
meats has been associated with the growth of P. nordicum, a close relative of P.
verrucosum (Larsen et al., 2001; Castellà et al., 2002). Whereas it is generally
accepted that OA is produced as a secondary metabolite during fungal infection of
foods, Mantle (2000) and Trucksess and Maragos (2001) postulated an alternative
mechanism for the presence of OA in crops, namely, that OA produced by toxigenic
fungi in soil could be taken up into the plant. However, the natural occurrence of OA
in soils at concentrations of concern is yet to be demonstrated.
The source of OA in grapes and grape products has been elucidated over the past 15
years. Aspergillus niger and other species within section Nigri, such as A. aculeatus
and A. carbonarius, are common saprophytes often isolated from soils (Klich and Pitt,
1988), and it has long been known that bunch rots caused by black Aspergillus spp.
sporadically occur in vineyards situated in warm to temperate regions (Amerine et al.,
1980; Hewitt, 1988; Snowdon, 1990; Emmett et al., 1992). A. niger is used widely in
food processing, and has been awarded a Generally Regarded As Safe (GRAS) status
by the US Food and Drug Administration (Pitt and Hocking, 1997); thus it was
surprising when Abarca et al. (1994) reported production of OA by two strains of A.
niger from feed. In the following year, Horie (1995) reported OA production by a
second species, A. carbonarius, also used in industrial enzyme production (Kiss and
Kiss, 2000; Okolo et al., 2001), but more importantly, known to cause grape rots
(Gupta, 1956).
Following the first reports of OA in wine (Majerus and Otteneder, 1996; Zimmerli
and Dick, 1996), Heenan et al. (1998) isolated ochratoxigenic black Aspergillus spp.

- 21 -
during dried grape processing, suggesting that such species may indeed be the source
of OA in grapes. Since then, black Aspergillus spp. which produce ochratoxins have
frequently been isolated from grapes in France (Sage et al., 2002, 2004; Bejaoui et al.,
2005), Italy (Battilani et al., 2003b), Spain (Cabañes et al., 2002; Abarca et al., 2003;
Bellí et al., 2004c; Bau et al., 2005a), Portugal (Serra et al., 2003, 2005a), Greece
(Tjamos et al., 2004, 2005), Israel (Guzev et al., 2005), South America (Da Rocha
Rosa et al., 2002; Magnoli et al., 2003, 2004) and Australia (Leong et al., 2004), as
well as from other substrates such as coffee and feed (Table 1.7). Isolates of A.
carbonarius from a range of substrates were frequently toxigenic (up to 100% of
isolates), whereas a relatively small proportion of A. niger strains produced OA.
Reports of toxin production by a few A. aculeatus or A. japonicus isolates are yet to
be confirmed. Toxigenic isolates of A. ochraceus have only occasionally been isolated
from grapes (Da Rocha Rosa et al., 2002; Battilani et al., 2003b; Serra et al., 2003;
Bellí et al., 2004c; Bau et al., 2005a). It can safely be concluded that A. carbonarius is
the primary source of OA contamination of grapes.
The role of toxin production in the ecology of ochratoxigenic fungi has not been
elucidated. Størmer and Høiby (1996) suggested that OA may confer a competitive
advantage to the fungi by sequestering iron in the environment, thus making it
unavailable to competing organisms. Alternatively, OA in the sclerotia of A.
carbonarius may represent a chemical defence system against fungivorous insects
(Wicklow et al., 1996).

Table 1.7: Surveys for ochratoxin A production by black Aspergillus spp.
Citation Species Positive strains
Growth medium Detection method Range of OA
production (ppb, µg/L, µg/kg)
Source of isolates (source of OA-producing isolates, where known, shown in bold)
Abarca et al. (1994)
A. niger 2/19 corn, YESa broth screening by TLCb, confirmation by HPLCb
210-590 poultry mixed feed, corn, soya
beans, peas
Ono et al. (1995)
A. niger aggregate
5/27 rice screening by TLC and HPLC
9-239 Institute for Fermentation, Osaka culture collection, including strains used for food and beverage fermentations
A. carbonarius 1/1 400-6780 Horie (1995) A. niger
aggregate 0/5
malt-yeast broth, rice
TLC, HPLC not detected
culture collection
A. niger aggregate
3/100 20-100 culture collections, including type strains, clinical isolates, isolates from rotted onion bulbs, Ugandan coffee beans, soil from various countries
A. japonicus 0/45 not detected culture collections, isolates from various countries
Téren et al. (1996)
A. carbonarius 5/12
YES agar/broth screening by ELISAb and TLC; confirmation by TLC and HPLC of concentrated extracts
60-150 culture collections, isolates
various countries Wicklow et al. (1996)
A. carbonarius 1/1 corn HPLC and 13C-NMRb not reported culture collection, NRRL 369
Téren et al. (1997)
A. niger aggregate
some strains
positive
YES broth TLC, ELISA not reported green coffee beans
Nakajima et al. (1997)
not stated 2/30 rice not stated 0.08-0.56 green coffee beans, Yemen
- 22 -

A. niger 2/115 (0/114d)
not detected Heenan et al. (1998)
A. carbonarius 30/33 (34/34d)
CCAa, YES agar reverse fluorescence on CCA; TLC of CCA and YES not reported
washwater from dried sultana
processing line containing fruit
from Australia and the Middle
East
A. niger 2/173 not reported A. japonicus 0/4 not detected
Taniwaki et al. (1999)
A. carbonarius 28/51
YES agar TLC
not reported
coffee, Brazil
Accensi et al. (2001)
A. niger 6/92e YES broth screening by TLC, confirmation by HPLC
26-1124 animal feed, raw materials, soil, animals/humans, culture
collections Joosten et al. (2001)
A. carbonarius 9/10 CCA, coffee cherries reverse fluorescence on CCA; coffee cherries by HPLC
3-4810 coffee cherries, Thailand;
tomatoes, air, apples
Urbano et al. (2001)
A. niger 87/344 YES agar TLC not reported raw coffee, Brazil
A. niger 0/1 not detected Cabañes et al. (2002) A. carbonarius 18/18
CYAa, YES agar HPLC 0.22-1.51
wine grapes, Spain
A. niger 16/53 26,000-96,000 A. carbonarius 8/32 18,000-234,000
Malbec and Chardonnay, Brazil Da Rocha Rosa et al. (2002) A. niger 8/48
CYA, YES broth TLC and HPLC
32,000-77,000 Malbec and Chardonnay,
Argentina
A. niger aggregate
41/82 13-25
A. japonicus 4/10 13-14
Dalcero et al. (2002)
A. aculeatus 0/2
YES broth HPLC
not detected
poultry feed, pig feed, rabbit
feed, Argentina
A. niger aggregate
0/73 not detected Sage et al. (2002)
A. carbonarius 14/15
CYA, YES agar HPLC
100-87,500
wine grapes, southern France
A. niger 1/168 not reported Abarca et al. (2003) A. carbonarius 88/91
CYA, YES agar HPLC not reported
dried grapes, Spain
- 23 -

Table 1.7 (cont.)
Citation Species Positive strains
Growth medium Detection method Range of OA
(µg/kg) Source (source of OA-producing isolates shown in bold)
A. niger 13/202 CYA HPLC not reported wine grapes, Portugal Abrunhosa et al. (2003) A. carbonarius 32/33 not reported
Biseriate i.e. A. niger
~ 14/270 not reported
Uniseriate i.e. A. japonicus
~ 3/108 not reported
Battilani et al. (2003b)
A. carbonarius ~ 52/86
Czapek Yeast Sucrose broth
HPLC
not reported
wine grapes, Italy
Magnoli et al. (2003)
A. niger aggregate
25/63 YES broth HPLC 2-25 wine grapes, Argentina
A. niger
aggregate 12/294 not reported
A. japonicus 0/1 not detected
Serra et al. (2003)
A. carbonarius 38/39
CYA HPLC
not reported
wine grapes, Portugal
A. niger 16/549 not reported Taniwaki et al. (2003) A. carbonarius 42/54
YES agar TLC not reported
coffee, Brazil
Accensi et al. (2004)
A. niger 3/52 CYA, YES agar HPLC 11,600-20,530 Cereals, legumes, mixed feeds, Spain
Bellí et al. (2004c)
Aspergillus section Nigri
(not separated into species)
18/386 CYA HPLC 0.02-2.82 wine grapes, Spain
A. niger 0/470 not detected A. aculeatus 0/200 not detected
Leong et al. (2004)
A. carbonarius 245/245
CCA reverse fluorescence on CCA; some isolates also tested by TLC and/or HPLC
not reported
fresh and dried grapes,
Sunraysia, Australia,
- 24 -

A. niger var. niger and var. awamori
41/188 2-61 Magnoli et al. (2004)
A. carbonarius 19/23
YES broth HPLC
2-5203
dried grapes, Argentina
A. niger 17/29 not detected Sage et al. (2004) A. carbonarius 10/10
CYA, YES agar HPLC 0.01-1.90
wine grapes (veraison and
harvest), France
Suárez-Quiroz et al. (2004)
A. niger 2/2 coffee bean medium, rice medium
HPLC 2.2-114 coffee cherries, Mexico
A. niger 123/159 Tjamos et al. (2004) A. carbonarius 58/60
Czapek Dox agar ELISA 0.25- > 25 raisins and wine grapes, Greece
A. niger 61/761 < 10- > 100 A. carbonarius 295/328 < 10- > 100
Battilani et al. (2005b)
A. japonicus 0/640
CYA HPLC
not detected
wine grapes, Italy
A. niger 0/474 not detected A. carbonarius 101/101 not reported
Bau et al. (2005a)
A. japonicus var. aculeatus
0/5
CYA, YES agar HPLC
not detected
wine grapes, Spain
A. niger 14/392 not reported A. carbonarius 104/135 not reported
Bellí et al. (2005a)
A. japonicus 0/117
CYA HPLC
not detected
wine grapes, Spain
A. niger 23/571 137 Serra et al. (2005a) A. carbonarius 68/68
CYA HPLC 1129
wine grapes, Portugal
a YES: yeast extract sucrose; CCA: coconut cream agar; CYA: Czapek yeast extract agar b TLC: thin layer chromatography; HPLC: high performance liquid chromatography; ELISA: enzyme-linked immunosorbent assay; NMR: nuclear magnetic resonance spectroscopy d these isolates were re-tested: one A. niger isolate was re-identified as A. carbonarius. The other A. niger isolate did not show OA production when assayed by HPLC. A.
carbonarius isolates that were negative by CCA fluorescence and TLC were positive by the more sensitive HPLC method e of the six positive isolates, five were isolates previously described as positive in other papers
- 25 -

- 26 -
1.5 Fungal infection of grapes
The production of OA in grapes requires the presence of the toxigenic fungus in the
vineyard environment and the transfer of the fungus from that environment to the
berry, followed by conditions suitable for infection, growth and toxin production. The
interior of a grape berry is sterile, comprising fleshy mesocarp tissue (pulp) and seeds.
The berry exocarp (skin) is the primary barrier to fungal infection, consisting of a
waxy cuticle, epidermal and sub-epidermal cells. The microbiota on the skin
comprises yeasts and bacteria which exist at a low metabolic rate on small amounts of
nutrients that leak from the berry, and dormant fungal and bacterial spores
(McGechan, 1978). When the skin is damaged, nutrients are no longer limiting, and
the microbial population increases dramatically. Skin damage can be caused by many
factors, including disease (black spot, downy mildew, powdery mildew), pests (bunch
mites, mealy bug, light brown apple moth) and the vineyard environment (wind injury,
sunburn, hail damage, bird damage). Some of these factors cause localised hardening
of the skin, which may increase the susceptibility of the fruit to splitting.
Berry splitting occurs when the influx of moisture into a berry is significantly greater
than the efflux. Water taken into a vine from the roots is typically lost through
evaporation from the leaves and, to a lesser extent, from the berries. In conditions of
high atmospheric humidity, evaporation from the leaves may cease, thus berries
become the natural sink for excess water in the vine, particularly when they
accumulate solutes with increasing maturity. As evaporative loss from a berry is slow,
it must expand to allow for the extra volume. The mesocarp of the berry is highly
extensible; however, the epidermis and sub-epidermis have a limited capacity to
extend. At critical turgor pressure, a berry skin will have extended to its limit, and will
split (Considine and Kriedemann, 1972). Skin extensibility is affected by the number
and shape of epidermal and sub-epidermal cells, as determined by cultivar.
Temperature also has an inherent effect on skin extensibility, as, at higher
temperatures, the internal pressure increases in a manner which cannot solely be
attributed to the concomitant volume increase (Lang and During, 1990). In addition,
broader factors which affect the fine balance of water in the vine may influence
splitting, e.g. bunch architecture or canopy management, which result in localised
areas of high humidity and thus low evaporative rates. Chief among such factors that

- 27 -
cause splitting is summer rain while the grapes are ripening, as this simultaneously
increases moisture uptake and decreases evaporative losses (Considine and
Kriedemann, 1972).
When the berry skin stretches due to a slow increase in turgor pressure, cracking may
occur, but if the increase is rapid, splitting is likely to occur. The distinction is
important because in cracking, only the cuticle and epidermis are breached, and these
breaches are sealed off with suberin; whereas, in splitting, damage occurs throughout
the cuticle, epidermis, sub-epidermis and outer cells of the mesocarp, and this damage
is not sealed off. Thus in split berries, the nutrient rich contents of the mesocarp cells
are available for the growth of microorganisms (Swift et al., 1974). Apart from the
induction of anti-fungal pathogenesis-related proteins and phytoalexins in the berry
(Jacobs et al., 1999; Jeandet et al., 2002), no further mechanisms hinder infection
throughout the entire berry.
A positive correlation has been demonstrated between splitting, especially at the
pedicel end of the berry, and bunch rots of Rhine Riesling grapes in Western Australia
(Barbetti, 1980). In addition, a positive correlation was found between rots and bunch
weight. It can be postulated that tight, heavy bunches are more susceptible to splitting
due to decreased evaporation and expanding berries pressing against each other.
Barbetti (1980) also noted that the predominant fungi associated with bunch rots were
different from those isolated from bunches at flowering. This suggests that “bunch-
rotting” fungi, which may have been present on the bunch at low levels, possessed a
competitive advantage when the berries split and nutrients became available.
Moulds that compete effectively in this situation include Aspergillus spp. (in
particular the black aspergilli), Rhizopus spp., Penicillium spp. and Cladosporium spp.
(Emmett et al., 1992). These moulds are generally thought to be wound and/or
secondary invaders; however, Hewitt (1988) stated that A. niger in a drop of water
may infect mature fruit directly through the skin at 20-32 °C. The incidence of these
moulds in vineyards varies according to climate, with Aspergillus spp. favoured by
hot, dry conditions, and Penicillium spp. favoured by cool, humid conditions
(Amerine et al., 1980).

- 28 -
Aspergillus rot (Fig. 1.3), caused by A. niger and the related species, A. aculeatus
(Jarvis and Traquair, 1984) and A. carbonarius (Gupta, 1956), results in berries
becoming watery with a foul odour. A coating of black/brown spores develops and
after complete decay, only shells of berries remain (Emmett et al., 1992). Control of
Aspergillus bunch rot primarily lies in the prevention of splitting. Many fungicides are
applied at flowering, hence, have little effect on the rapid increase in fungal
population that occurs when berries split some months later (Barbetti, 1980).
Pyrimethanil, or a combination of fludioxonil and cyprodinil, were effective in
reducing Aspergillus rots and OA in grapes, particularly when applied nearing
veraison (Lataste et al., 2004; Tjamos et al., 2004; Battilani et al., 2005b), the stage
marked by the colour change and softening of berry skins, and a steady increase in
berry sugars. Application of Candida guillermondi as an antagonistic biocontrol agent
has also shown some success in reducing Aspergillus rots in Israel (Zahavi et al.,
2000). In addition to causing bunch rots, A. niger has been implicated in causing
grape-vine cankers, infecting the vines through wounds (Michailides et al., 2002).
Figure 1.3: Infection of Semillon berries by Aspergillus carbonarius
Apart from OA, black Aspergillus spp. may produce other toxins such as ceramide,
produced by A. niger (Amerine et al., 1980), and naphthopyrones, produced by A.
niger and A. carbonarius (Ghosal et al., 1979; Priestap, 1984). However, these toxins
are not listed among those of concern to human and animal health (CAST, 2003), and
thus their occurrence in grapes and grape products has not been examined. Other
mycotoxins potentially present in grapes and wine include citrinin, patulin and
trichothecenes produced by fungi such as Penicillium expansum, Fusarium spp. and
Trichothecium roseum (Ough and Corison, 1980; Schwenk et al., 1989; Abrunhosa et
al., 2001; Serra et al., 2005a).
- 29 -
1.6 Effect of processing on ochratoxin A
Most of the raw commodities in which OA is produced, such as cereals, coffee
cherries and grapes [reviewed by Pitt and Tomaska (2002)] undergo further
processing prior to consumption. Fresh table grapes are the exception, and even these
undergo careful inspection for the removal of visibly mouldy berries. Thus, the
concentration of OA in the final product is a function of the concentration in the raw
commodity and the effect of inspection and/or processing. OA, the food matrix, and
the process interact in three ways. First, OA may be located in a specific part of the
commodity that is removed during processing, for example, the husks of grains
(Alldrick, 1996) or coffee beans (Blanc et al., 1998). Battilani et al. (2001) reported
greater concentrations of OA in the grape skins compared to pulp in six of eight
samples. Second, OA may preferentially partition or bind to certain matrices based on
its chemical characteristics, as affected by the pH and aqueous or organic nature of the
matrix. For example, OA bound to spent grains in beer production rather than
dissolving in the aqueous matrix (Baxter et al., 2001), and it bound to yeasts in beer
and wine fermentation (Bejaoui et al., 2004). Third, OA may undergo some thermal
degradation during baking and coffee roasting (Subirade, 1996; Viani, 1996),
although a substantial amount remained and was concentrated during boiling in the
production of the grape beverage, Pekmez (Arici et al., 2004). Baxter et al. (2001)
suggested that a proportion of OA may be degraded by yeast during beer fermentation;
however, Bejaoui et al. (2004) and Lataste et al. (2004) did not find evidence of
degradation during wine fermentation. Many strategies to reduce OA during food
processing [reviewed by Scott (1996)], such as gamma irradiation and degradation by
enzymes (Deberghes et al., 1995; Stander et al., 2000), do not seem immediately
applicable to wine production, as they may affect the sensory properties of wine.
In the production of wine, grapes undergo multiple stages during which solids and
liquids are separated. In white vinification, grapes are crushed, then pressed to remove
the skins and seeds. The juice may be treated with a pectinase to enhance precipitation
of grape solids before fermentation commences. In red vinification, grapes are
crushed then fermented in the presence of skins and seeds to extract colour and
tannins. This mixture is later pressed to remove the skins and seeds. Both white and
red wines undergo successive clarification stages to remove precipitated yeasts and

- 30 -
other solids. Malolactic fermentation, in which malic acid is converted into lactic acid
by lactic acid bacteria, may also occur after fermentation. Fernandes et al. (2003, 2005)
reported reduction of OA whenever solids and liquids were separated, thus these
authors proposed that the partitioning or binding of OA to certain substrates was the
primary means of removal during vinification.
1.7 Detection of ochratoxin A
Numerous methods exist for the detection of OA, both in foods and, in culture media
during screening for toxigenic isolates [reviewed by Varga et al. (2001b)]. The
principal methods in current use include thin layer chromatography (TLC), high
performance liquid chromatography (HPLC) and enzyme-linked immunosorbent
assay (ELISA) (Table 1.7). For quantification of OA in grapes and wine, sample
purification using immuno-affinity columns followed by quantification by HPLC is
most widely used [reviewed by Bellí et al. (2002), see also Saez et al. (2004); Serra et
al. (2004)]. For the rapid screening of fungal isolates, production of OA can be
detected in situ on white coconut cream agar (CCA), by observing the natural blue
fluorescence of the toxin in acid/neutral media under long-wavelength ultra-violet
(UV) light, followed by a change to violet fluorescence under basic conditions
(Heenan et al., 1998). A second screening method involves growing the fungi on
plates, and extraction of OA from agar plugs into an organic solvent, which is then
filtered and injected directly into the HPLC apparatus for quantification (Bragulat et
al., 2001). Recently, a lateral flow device based on an immuno-assay for OA has been
developed for detection of the toxin extracted from agar plugs (Danks et al., 2003).

- 31 -
1.8 Objectives
Mycotoxin contamination of food is often a multi-stage process. Mycotoxins occur in
crops when a mycotoxigenic strain is in the environment, comes in contact with the
crop, either in the field or during storage, and is able to infect and grow in that crop in
conditions that allow mycotoxin production. The mycotoxin must then be stable
throughout any subsequent processing, in order to present a potential health risk in the
final product. Consumers now have a greater focus on food integrity (Winemakers'
Federation of Australia, 2000), and the presence of toxins in foods must be handled
with sensitivity. It is likely that other governments will follow the EU in introducing
limits for the allowable amount of OA in foods. Research on the ecology of the black
aspergilli and OA production in Australian vineyards is needed to ensure that the wine
industry can develop appropriate management strategies in the field and during
winemaking to minimise contamination with OA.
To this end, the project has four primary objectives, each examining one aspect of the
biology of black Aspergillus spp. in grapes and OA in wine. First, to determine the
occurrence of toxigenic black Aspergillus spp., in particular A. carbonarius, in the
primary viticultural regions of Australia and to characterise molecular relationships
among these strains using PCR-based techniques. Second, to test the effect of ultra-
violet radiation, temperature and water activity on the survival of A. carbonarius
spores in vitro, and to assess the effect of temperature and water activity, manipulated
in a simulated grape juice medium, on growth and toxin production. Such studies may
be useful to predict the potential response of A. carbonarius to various environmental
conditions in vineyards. Third, to examine the incidence and infection processes of A.
carbonarius on both white and red grape cultivars in vitro and in vineyards, with a
particular focus on survival of spores on berry surfaces in the vineyard, and infection
in the presence of berry damage. Last, to monitor the stability and partitioning of OA
during white and red vinification based on practices widely used in Australia.
- 32 -
2 General Materials and Methods
2.1 Enumeration and identification of black Aspergillus spp. on various substrates
Samples, including soil, dried rachides, fungal suspensions dried onto membrane
filters, and grapes, were first homogenised in a manner appropriate to the sample
(shaking, mixing in a stomacher, mixing in a blender). Further details are given in the
relevant chapters. Homogenates were serially diluted in sterile peptone solution (0.1%
w/v; Amyl Media, Dandenong, Vic, Australia). Appropriate dilutions (0.1 mL) were
plated in duplicate onto Dichloran Rose Bengal Chloramphenicol agar (DRBC; Pitt
and Hocking (1997); Appendix A). Plates were incubated in the dark at 25 °C for 3 d,
after which colonies of black Aspergillus spp. were enumerated. Colonies were
presumptively identified as A. aculeatus, A. carbonarius or A. niger, based on spore
size, colour, depth of the colony and tendency for the conidial chains to split into
columns around the vesicles when viewed under a stereomicroscope (M5-72033, x750;
Wild Heerbrugg, Switzerland). A. aculeatus colonies were typically a light brown in
colour with a powdery appearance to the sporulating surface, and a tendency for
conidial chains to split into columns around the vesicles. A. niger colonies were
various shades of brown and had the smallest spores of the three species. A.
carbonarius colonies were dark charcoal brown (almost black) with large, glistening
spores.
When the identity of an isolate was unclear, the isolate was subcultured by a three-
point inoculation onto Czapek Yeast Agar (CYA; Pitt and Hocking (1997); Appendix
A) and grown in the dark at 25 °C for 7 d. Aspergilla (vesicles plus conidiogenous
structures) and conidia, removed from the colony with a fine inoculating wire, were
mounted in lactic acid, and identification was confirmed by examination of slides
using a compound microscope (Axioskop, x800; Zeiss, Göttingen, Germany). Isolates
with rough conidia (ellipsoidal or spherical) and which displayed only phialides
surrounding the vesicle (uniseriate) were identified as A. aculeatus. Isolates with
rough conidia approximately 3-5 µm in diameter, with both phialides and metulae
surrounding the vesicle (biseriate) were identified as A. niger. Isolates with
tuberculate (highly roughened) conidia approximately 6-8 µm in diameter, with both

- 33 -
phialides and metulae surrounding the vesicle (biseriate) were identified as A.
carbonarius (Klich and Pitt, 1988).
2.2 Storage of fungal isolates
For regular use, isolates were stored on CYA slants in the dark at 25 °C with
subculturing as necessary. For long-term storage, isolates were grown on CYA plates
as described in section 2.1. Spores were collected on the tip of an inoculating wire,
and were introduced into an Eppendorf tube containing 1 mL sterile glycerol solution
(25% w/w). The suspension was mixed by vortexing, snap frozen in 95% ethanol
containing dry ice, and stored at -80 °C. Selected isolates were freeze-dried and
accessioned into the FRR culture collection (Food Science Australia, North Ryde,
NSW, Australia). Cultures were retrieved from storage by inoculation onto CYA.
Freeze-dried cultures were rehydrated with sterile reverse osmosis (RO) water prior to
inoculation.
2.3 Preparation of spore suspensions
Isolates were inoculated at three points onto CYA plates and incubated in the dark at
25 °C for 7-14 d. Spores were harvested by flooding the plates with sterile RO water
containing 0.05% (w/v) Tween-80® (Merck, Kilsyth, Vic, Australia) as a wetting
agent, after which spores were scraped from the surface of the colonies with a sterile
spatula. The resulting suspension was shaken in a bottle containing sterile glass beads
(2-3 mm diameter, Crown Scientific, Moorebank, NSW, Australia) to break up the
spore chains. The concentration of spores was determined using a haemocytometer,
after which the suspension was further diluted in sterile Tween-80® solution to
achieve the desired concentration.
2.4 Assessment of ochratoxin A production on agar plates
2.4.1 Sampling and extraction
OA production on agar plates was assessed by the method of Bragulat et al. (2001)
with the following modifications. Agar plugs (5 mm diameter) were taken from the
edge and the centre of the colony, and midway between the edge and the centre. Plugs
were stored in 4 mL borosilicate glass vials (Alltech, Deerfield, IL, USA) at -20 °C
until extraction. The three plugs were vortexed with 1 mL methanol, allowed to stand
for 1 h at room temperature (ca 22 °C), mixed again, and the extract filtered through

- 34 -
Millex®-HV filters (0.45 µM, 13 mm or 25 mm diameter; Millipore, Billerica, MA,
USA). The extracts were kept at room temperature and analysed by HPLC the same
day.
2.4.2 HPLC analysis of culture extracts
OA in culture extracts was detected by chromatography through an Ultracarb (30)
C18 4.6 x 250 mm, 5 µm column (Phenomenex, Torrance, CA, USA). The mobile
phase consisted of acetonitrile:water:acetic acid (55:44.1:0.9, v/v), and was delivered
through the heated column (40 °C) at a flow of 1 mL/min using a Shimadzu 10A VP
high pressure binary gradient solvent delivery system (Kyoto, Japan). Detection of
OA was achieved by post-column addition of ammonia (12.5% w/w, 0.1 mL/min) and
monitoring the natural fluorescence of OA at 435 nm after excitation at 385 nm
(Shimadzu, RF-10AXL). Samples were injected using a Shimadzu SIL-10Advp
autosampler, and the injection volume was 3-5 µL. Samples which yielded OA
concentrations that exceeded the scale of the detector were diluted in methanol and re-
injected. OA in culture extracts was calculated by comparison with a calibration curve
generated from OA standards (Sigma-Aldrich, St Louis, MO, USA) prepared in
methanol over a range of concentrations. A typical chromatogram of OA produced by
A. carbonarius on synthetic grapejuice medium (Appendix A) is shown in Fig. 2.1.
The limit of quantification was estimated to be 0.0018 µg/g, based on 80% of the
amount yielding a small, symmetrical peak (Fig. 2.2). The limit of detection was
estimated to be 20% of the limit of quantification, i.e. approximately 0.0004 µg/g,
based on advice from the Analytical Chemistry section, Food Science Australia (Peter
Varelis, pers. comm. 10/01/05).

- 35 -
Minutes
0 1 2 3 4 5 6 7 8 9 10 11 12
Vo
lts
0.00
0.05
0.10
0.15
0.20
0.25
Vo
lts
0.00
0.05
0.10
0.15
0.20
0.25
Detector A (Ex:385nm, Em:435nm)
P0831
P0831
Figure 2.1: Ochratoxin A (469 ng/mL extract ≡ 2.2 µg/g medium) produced by Aspergillus carbonarius FRR 5690 on synthetic grape juice medium, water activity 0.965 at 15 °C after 22 d. OA eluted after 9.4 min
Minutes
0 1 2 3 4 5 6 7 8 9 10 11 12
Vo
lts
0.000
0.005
0.010
0.015
Vo
lts
0.000
0.005
0.010
0.015
Detector A (Ex:385nm, Em:435nm)
P0146
P0146
Figure 2.2: Ochratoxin A (0.49 ng/mL extract ≡ 0.0022 µg/g medium) produced by Aspergillus niger FRR 5695 on synthetic grape juice medium, water activity 0.95 at 25 °C after 5 d. OA eluted after 9.5 min

- 36 -
2.5 Assessment of ochratoxin A in grapes
2.5.1 Extraction and purification
Grapes were homogenised in a blender (Philips HR2835/AB) for 2 min, a 10 g
subsample weighed into a centrifuge tube, and 5 mL Milli-Q water added. Grape
samples which were likely to contain greater levels of OA due to severe infection with
A. carbonarius were diluted up to 10 fold with RO water prior to homogenisation.
Subsamples of these homogenates (15 g) were weighed into centrifuge tubes.
A solution of internal standard containing isotopically-labelled OA (250 µL;
Appendix B) was added to each sample, which was mixed by vortexing and held at 1
°C overnight to equilibrate. Methanol (5 mL) and hydrochloric acid (10 N, ca 0.1 mL)
were added, and mixed by vortexing. The mixture was centrifuged at 2500 rpm for 15
min (Orbital 420, Clements Medical Equipment Pty Ltd, Somersby, NSW, Australia).
A 900 mg C18 solid phase extraction cartridge (Maxi-Clean™, Alltech, Deerfield,
USA) was conditioned with 5 mL acetonitrile followed by 5 mL water, and the
supernatant was passed dropwise through this cartridge under vacuum (Vacuum
manifold, Alltech, Deerfield, USA). The cartridge was washed with 10 mL 10%
methanol.
A 200 mg aminopropyl cartridge (4 mL Extract-Clean™, Alltech, Deerfield, USA)
was conditioned with 3 mL methanol. The C18 and aminopropyl cartridges were
attached in series, and the sample was eluted from the C18 cartridge onto the
aminopropyl cartridge with the addition of 10 mL methanol. The sample was eluted
from the aminopropyl cartridge with 10 mL 35% ethyl acetate in cyclohexane
containing 0.75% formic acid. The eluate was dried under a nitrogen stream at 50 °C
and resuspended in 1 mL 50% methanol containing 0.1% formic acid.
2.5.2 Liquid Chromatography-Mass Spectrometry analysis
Liquid chromatography-mass spectrometry (LC-MS) analyses were performed on a
Thermo Finnigan system (Waltham, MA, USA) comprising a Surveyor quaternary
pump as inlet, and injection by a Surveyor autosampler. Chromatographic separation
was achieved through an Ultracarb (30) C18 2.1 x 50 mm, 5 µm column
(Phenomenex, Torrance, CA, USA). The mobile phase consisted of

- 37 -
methanol:water:formic acid (85:14.985:0.015, v/v), and was delivered through the
heated column (30 °C) at a flow of 250 µL/min. The sample was ionised using the
electrospray technique, and OA detected by a TSQ triple-stage high resolution
quadrupole mass spectrometer operating in the selective reaction monitoring mode.
A set of calibration standards was prepared for a range of OA concentrations from 0-
3200 ng/mL. To each 1 mL standard solution was added 250 µL of the internal
standard, the same volume that was added to each test sample (section 2.5.1). The
ratio of the naturally occurring isocoumarin portion of the OA molecule to the 13C-
labelled isocoumarin of the internal standard was plotted on the y-axis against the total
amount of OA present on the x-axis. Three calibration curves were generated with the
ranges 0-25 ng, 25-190 ng and 190-3200 ng. The injection volume for standards and
grape samples was 5 µL. The amount of OA in the sample was calculated by
comparison with the appropriate calibration curve (Fig. 2.3).
2.6 Statistical analysis
Where amenable to statistical analysis, data were examined by ANOVA (Genstat, 6th
Edition, Lawes Agricultural Trust, Rothamsted, UK). In the absence of significant
higher order interactions, comparison of means was conducted by Tukey’s test of
honestly significant difference (h.s.d.; http://faculty.vassar.edu/lowry/ch14pt2.html,
accessed 01/05).

- 38 -
Figure 2.3: Liquid chromatography-mass spectroscopy calibration curves for ochratoxin A (x-axis) within the ranges (a) 0-25 ng, (b) 25-190 ng and (c) 190-3200 ng generated by three replicate injections. All data points were given equal weight. The Area Ratio on the y-axis refers to the relative peak areas of the unlabelled vs isotopically-labelled isocoumarin portion of the OA molecule
OTA_(M+H)
Y = 0.0611508+0.00239121*X R^2 = 0.9879 W: Equal
0 5 10 15 20 25
ng
0.00
0.01
0.02
0.03
0.04
0.05
0.06
0.07
0.08
0.09
0.10
0.11
0.12
Are
a R
ati
o
OTA_(M+H)
Y = 0.0468621+0.00257317*X R^2 = 0.9976 W: Equal
0 50 100 150 200
ng
0.00
0.05
0.10
0.15
0.20
0.25
0.30
0.35
0.40
0.45
0.50
0.55
Are
a R
ati
o
b
a
c
OTA_(M+H)
Y = -0.0724972+0.0028227*X R^2 = 0.9987 W: Equal
0 500 1000 1500 2000 2500 3000 3500
ng
0
1
2
3
4
5
6
7
8
9
Are
a R
atio

- 39 -
3 Aspergillus niger and A. carbonarius from Australian vineyards: isolation, toxigenicity and molecular relationships
3.1 Introduction
3.1.1 Distribution of black Aspergillus spp. on Australian grapes
Ochratoxigenic black Aspergillus spp. have been isolated from dried grapes in
Sunraysia, Victoria, Australia (Heenan et al., 1998; Leong et al., 2004). Although A.
niger was the species most commonly isolated from Australian dried grapes (Leong et
al., 2004), no isolates produced OA. A. aculeatus and A. carbonarius were isolated
less frequently. Toxigenicity was not demonstrated for A. aculeatus, whereas all
isolates of A. carbonarius produced OA. The presence of ochratoxigenic black
Aspergillus spp. in other Australian viticultural regions has not been demonstrated,
although OA has been detected in wines from various regions (Hocking et al., 2003).
A. niger appears to be the dominant black Aspergillus species in vineyards in Europe
and South America (Table 3.1), as well as in Australia. However, Cabañes et al. (2002)
and Tjamos et al. (2004) described some vineyards where A. carbonarius was the
dominant species. The toxigenicity of isolates is summarised in Table 1.7. Fungi were
isolated directly from grapes in the European and South American studies. However,
Kazi et al. (2004) demonstrated that black Aspergillus spp. in Australian wine grape
and dried grape vineyards were most commonly isolated from soil directly beneath
vines (also reported by Leong et al. (2005b)). Rachides (dried bunch stems) were
another source.
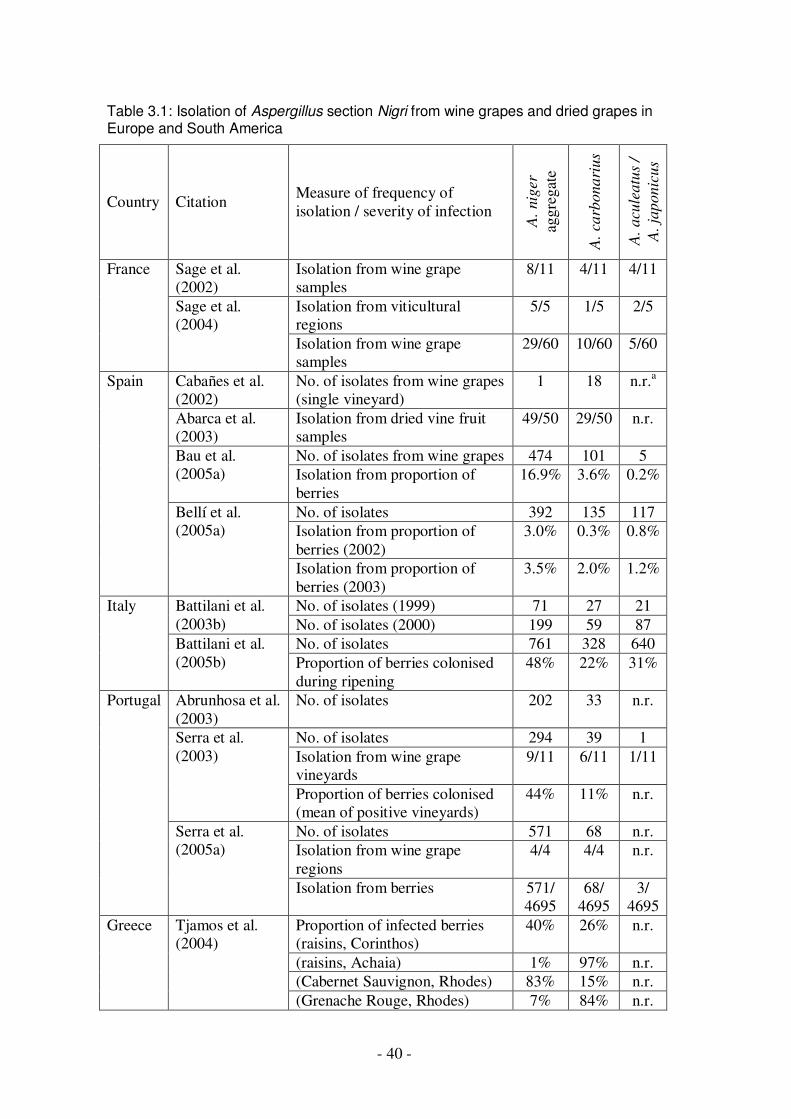
- 40 -
Table 3.1: Isolation of Aspergillus section Nigri from wine grapes and dried grapes in Europe and South America
Country Citation Measure of frequency of isolation / severity of infection
A.
nig
er
aggr
egat
e
A.
carb
onari
us
A.
acu
leatu
s /
A. ja
ponic
us
Sage et al. (2002)
Isolation from wine grape samples
8/11 4/11 4/11
Isolation from viticultural regions
5/5 1/5 2/5
France
Sage et al. (2004)
Isolation from wine grape samples
29/60 10/60 5/60
Cabañes et al. (2002)
No. of isolates from wine grapes (single vineyard)
1 18 n.r.a
Abarca et al. (2003)
Isolation from dried vine fruit samples
49/50 29/50 n.r.
No. of isolates from wine grapes 474 101 5 Bau et al. (2005a) Isolation from proportion of
berries 16.9% 3.6% 0.2%
No. of isolates 392 135 117 Isolation from proportion of berries (2002)
3.0% 0.3% 0.8%
Spain
Bellí et al. (2005a)
Isolation from proportion of berries (2003)
3.5% 2.0% 1.2%
No. of isolates (1999) 71 27 21 Battilani et al. (2003b) No. of isolates (2000) 199 59 87
No. of isolates 761 328 640
Italy
Battilani et al. (2005b) Proportion of berries colonised
during ripening 48% 22% 31%
Abrunhosa et al. (2003)
No. of isolates 202 33 n.r.
No. of isolates 294 39 1 Isolation from wine grape vineyards
9/11 6/11 1/11 Serra et al. (2003)
Proportion of berries colonised (mean of positive vineyards)
44% 11% n.r.
No. of isolates 571 68 n.r. Isolation from wine grape regions
4/4 4/4 n.r.
Portugal
Serra et al. (2005a)
Isolation from berries 571/ 4695
68/ 4695
3/ 4695
Proportion of infected berries (raisins, Corinthos)
40% 26% n.r.
(raisins, Achaia) 1% 97% n.r. (Cabernet Sauvignon, Rhodes) 83% 15% n.r.
Greece Tjamos et al. (2004)
(Grenache Rouge, Rhodes) 7% 84% n.r.

- 41 -
Table 3.1 (cont.)
Country Citation Frequency of isolation / severity of infection
A. niger A. carbonarius A. aculeatus
/ japonicus
No. of isolates 53 32 n.r. Isolation from proportion of grape samples (Malbec)
58% 12% n.r. Brazil Da Rocha
Rosa et al. (2002)
(Chardonnay) 62% 26% n.r. No. of isolates 48 0 n.r. Isolation from proportion of grape samples (Malbec)
45% 0 n.r. Da Rocha Rosa et al. (2002)
(Chardonnay) 50% 0 n.r. Isolation from proportion of grape samples (surface sterilised)
60% (niger) 12%
(awamori) 11%
(foetidus)
0b 0b Magnoli et al. (2003)
Mean proportion of infected berries (surface sterilised)
6% (niger) 4%
(awamori) 4%
(foetidus)
0b 0b
No. of isolates 194 23 2 Isolation from proportion of samplesc (surface sterilised) (black dried vine fruit)
75% (niger) 80%
(awamori) 14%
(foetidus)
45% 10%
Argentina
Magnoli et al. (2004)
(white dried vine fruit)
42% (niger) 25%
(awamori) 8%
(foetidus)
16% 8% (japonicus)
8% (aculeatus)
a n.r. not reported b all isolates of Aspergillus section Nigri identified to species level but A. carbonarius
and A. aculeatus/japonicus not reported, therefore assumed to be absent c highest % infection on either DRBC or Dichloran 18% Glycerol agar (DG18) reported

- 42 -
The three species commonly isolated from vineyards can be distinguished by
morphology (see section 2.1). Isolates of A. niger may be further classified as type N
or type T by the method of Accensi et al. (1999) based on the restriction fragment
length polymorphism (RFLP) analysis of the internal transcribed spacer (ITS) region
of 5.8S ribosomal DNA. To date, toxigenicity has been restricted to a few type N
isolates, whereas it has not been demonstrated in type T isolates (Accensi et al., 2001).
Twelve isolates from Sunraysia were previously all classified as type T (Leong et al.,
2004). It is not known if this predominance of type T is representative of Australian
vineyards in general. Varga et al. (1994) also noted a predominance of type T (13 of
15 isolates) from (non-vineyard) soils in the Kimberley region, Western Australia.
The first section of this chapter reports on the isolation of black Aspergillus spp. from
soil and/or rachides from vineyards in many of the primary viticultural regions of
Australia, and the ability of A. carbonarius and A. niger isolates to produce OA. In
addition, RFLP analysis was used to assess the incidence of N type or T type among
isolates of A. niger.
3.1.2 Techniques to assess molecular relationships among black Aspergillus spp.
Various genotypic and phenotypic methods have been employed to assess
relationships among black Aspergillus spp., particularly within the morphologically
indistinguishable A. niger aggregate. Methods to assess genotypic relationships have
been based on both nuclear (chromosomal) and mitochondrial DNA, and have
included analysis of karyotype, RFLP, sequences from ribosomal and other genes,
presence of double-stranded RNA mycoviruses and random amplification of
polymorphic DNA (RAPD) [reviewed by Varga et al. (2000b); Abarca et al. (2004);
Varga et al. (2004a)].
This chapter reports on the development of three techniques, based on random
polymorphisms within the genome, which are used to differentiate between A. niger
and A. carbonarius isolates of differing toxigenicity and from various sources. Two of
these techniques, enterobacterial repetitive intergenic consensus (ERIC)-PCR
(Versalovic et al., 1991) and microsatellite markers, have yet to be tested for utility in

- 43 -
distinguishing the various black Aspergillus spp. Analysis of amplified fragment
length polymorphisms (AFLP) has been utilised in the assessment of strains from
coffee (Schmidt et al., 2004) and grapes (Perrone et al., 2005).
ERIC-PCR is closely related to RAPD, in that both techniques rely on the binding of
primers to complementary sequences randomly distributed throughout the genome.
The primer length for RAPD is typically 10 base pairs (bp), whereas ERIC-PCR
utilises primers of 22 bp (Gillings and Holley, 1997). Although based on sequences
originally characterised in eubacterial genomes, this technique has found broader
application in a diverse range of fungal genera, including Fusarium (Edel et al., 1995;
Smith-White et al., 2001), Verticillium (Arora et al., 1996) and Pochonia, a
nematophagous genus (Morton et al., 2003).
AFLP analysis is based on two distinct aspects of polymorphism: first, the presence of
recognition sequences at which chromosomal DNA is cut by two restriction enzymes;
and second, the selective amplification of a population of fragments through
complementary binding of the primers to the ligation adapters plus one or two bp into
the unknown region (Vos et al., 1995; Aarts and Keijer, 1999). AFLP has previously
been used in the molecular characterisation of the ochratoxigenic fungi P. verrucosum
/ P. nordicum (Castellà et al., 2002) and A. ochraceus (Schmidt et al., 2003), as well
as aflatoxigenic Aspergillus species (Montiel et al., 2003).
Microsatellites, also known as simple sequence repeats, are tandem arrays of short
DNA sequences composed of two to six bp motifs. Polymorphisms frequently occur
at these loci due to slippage of DNA polymerase and subsequent misaligned
reassociation of the strands. Methods of isolation for microsatellites and their utility as
fungal genetic markers have been reviewed by Carter et al. (2004). One such method
of isolation utilises algorithms that screen published sequences for microsatellite
repeats, and has yielded six polymorphic microsatellie loci within the aflatoxigenic
species A. flavus and A. parasiticus (Tran-Dinh and Carter, 2000).
Few Australian isolates of black Aspergillus spp. have been included in molecular
studies of this group, apart from those discussed in section 3.1.1. Isolates of A.
carbonarius and A. niger from Australian vineyards are included in this analysis of

- 44 -
over 70 strains. Isolates from European viticultural regions as well as isolates of
interest from culture collections were included, as the development of these molecular
techniques for black Aspergillus spp. was performed in collaboration with Alexandre
Esteban (University of Barcelona; see section 3.3). Although toxigenicity is fairly
uncommon among isolates of A. niger (Abarca et al., 2004), several toxigenic strains
were included in the analysis in order to assess any potential association between
molecular relatedness and toxigenicity. Isolates from the same substrates and/or
countries were assessed for molecular relatedness.
3.2 Isolation of black Aspergillus spp. from Australian viticultural regions
3.2.1 Methods
3.2.1.1 Isolation
Samples of soil and rachides were sourced from many of the primary viticultural
regions of Australia (Table 3.2). Collaborators were contacted between May and
October (after vintage and during vine dormancy), in order to increase the likelihood
of their participation, and were requested to sample soil from directly beneath vines,
including any fallen vine material, from different parts of the vineyard. Samples of at
least 100 g were collected in zip-lock polyethylene bags (18 cm x 17 cm, Glad
Products, Padstow, NSW, Australia) and sent to the Food Science Australia laboratory
in North Ryde (NSW Agriculture permit 03/3904) for analysis.
As described in section 2.1, soil samples (10 g) were added to 90 mL sterile peptone
solution in a bottle and mixed by shaking. Rachides were weighed and homogenised
with an appropriate volume of sterile distilled water (approximately 150 mL) in a
stomacher (Bagmixer, Interscience, France). Homogenates (0.1 mL) were plated onto
DRBC (five replicates), and colonies of black Aspergillus spp. identified and
enumerated.
Isolates of A. niger and A. carbonarius representative of the various colony
morphologies present in each region were stored as described in section 2.2 for further
analysis.

- 45 -
3.2.1.2 Toxigenicity screening
Production of OA by isolates of A. carbonarius was tested according to the method of
Heenan et al. (1998) by centrally inoculating plates of coconut cream agar (CCA;
Appendix A) with spores on the point of an inoculating wire. Plates were incubated in
the dark at 25 °C for 7 d. The reverse of the plates was examined under long wave UV
light (Chromo-vue, Ultra-violet Products, Inc., San Gabriel, CA, USA). Colonies
showing a blue fluorescence were deemed to produce OA, as compared with
fluorescence by a known toxigenic strain (A. carbonarius FRR 5374). For isolates that
fluoresced only weakly, a confirmatory test was performed. Colonies on CCA plates
with the lids removed were held within an enclosed glass tank containing a solution of
ammonium hydroxide (approximately 28% ammonia) for 2 h. The plates were
ventilated in the fume cupboard for a few minutes before re-examining the reverse
under long wave UV light. The presence of OA was detected as a strong violet
fluorescence.
Production of OA by isolates of A. niger was tested by centrally inoculating plates of
YES medium (Appendix A), as this medium was shown to be better than CYA for the
production of OA by A. niger (Bragulat et al., 2001; Esteban et al., 2004). Plates were
incubated in the dark at 25 °C for 7 d. Extraction and detection of OA by HPLC were
as described in section 2.4. The identity of the OA peak in the chromatogram was
confirmed by derivitization with boron trifluoride (Hunt et al., 1979). A standard
solution of OA (22 ng/mL) was also derivitized for comparison.
Isolates of A. aculeatus were not screened for OA production because reports of OA
production by A. japonicus / A. aculeatus (Dalcero et al., 2002; Battilani et al., 2003b)
are dubious and, currently, this species is thought to be non-toxigenic (Abarca et al.,
2004).
3.2.1.3 RFLP analysis of Aspergillus niger
3.2.1.3.1 DNA extraction
A liquid medium (approximately 15 mL) based on modified Spezielle Nahstoffarmer
Agar (SNA) (Appendix A; Nirenberg (1976)) in sterile 9 mm plastic Petri dishes was
inoculated with A. niger spores on the point of an inoculating wire. The plates were

- 46 -
swirled gently to distribute the spores and were incubated at 25 °C for 2-3 d, until
white mycelial growth covered the surface of the medium. DNA extraction
commenced before colonies sporulated heavily, to minimise the presence of pigments
that could potentially interfere with PCR amplification.
DNA was extracted using a modified FastPrep protocol (BIO 101, Inc., Carlsbad, CA,
USA; Smith-White et al. (2001)). The mycelial mat was transferred to a filter paper (9
cm diameter, Whatman No. 1, UK) in a Buchner funnel, and residual medium was
removed under vacuum. Mycelium was scraped from the paper with a spatula and
transferred to a FastPrep DNA tube. The Buchner funnel and spatula were rinsed with
10% bleach followed by RO water between samples. DNA extraction buffer (1 mL;
Appendix C) was added to the mycelium in the FastPrep tube, which also contained
ground garnet and a ceramic sphere to facilitate cell lysis during homogenisation. The
mixture was homogenised in a FastPrep FP120 (Bio 101, Inc., Carlsbad, CA, USA)
set at 5.5 for 35 s, after which the tubes were stored at -4 °C for 5 min to reduce
aerosols. The tubes were centrifuged at 13,000 rpm (1K15, Sigma, Osterode am Harz,
Germany) for 5 min, and the supernatant (750 µL) transferred to an Eppendorf tube
containing 150 µL protein precipitating solution (Appendix C). Contents of the tube
were briefly mixed by gentle vortexing, and centrifuged at 13,000 rpm for 5 min. The
supernatant (700 µL) was transferred to an Eppendorf tube containing 700 mL of
binding matrix (Appendix C), and mixed by inversion for 30 min. The tube was
centrifuged at 10,000 rpm for 10 s and the supernatant discarded. The pellet was
gently resuspended in 800 µL salt ethanol wash solution (Appendix C) using wide
bore pipette tips in order to minimise shearing of chromosomal DNA. The suspension
was mixed by inversion for 20 min, and centrifuged at 10,000 rpm for 10 s, after
which the supernatant was discarded. The tube was centrifuged for 10 s again, and the
remaining supernatant removed with a 200 µL micropipette with a fine-pointed tip.
The open tube was covered with a tissue and dried overnight at room temperature.
The pellet was resuspended in Tris-EDTA buffer (200 µL; Appendix C) and left to
stand for 5 min, after which the tube was centrifuged at 12,000 rpm for 2 min. The
supernatant (160 µL) containing the extracted DNA was transferred to an Eppendorf
tube and stored at -4 °C.

- 47 -
3.2.1.3.2 PCR amplification and digestion of amplicons
Following the method of Accensi et al. (1999), the ITS region flanking the 5.8S rDNA
unit was amplified with primers ITS 4 (5’-TCCTCCGCTTATTGATATGC-3’) and
ITS 5 (5’-GGAAGTAAAAGTCGTAACAAGG-3’) (White et al., 1990). Reaction
mixtures (50 µL) containing 1x PCR buffer (Qiagen, Germany), 5% glycerol, 125 µM
each dNTP, 12.5 pmol of each primer, 1.25 U of Taq DNA polymerase (Qiagen,
Germany) and 20-40 ng of DNA as template were amplified in a Hybaid PCR Express
Thermal Cycler (Integrated Sciences, Willoughby, NSW, Australia) with the cycling
parameters: 94 °C for 5 min, 35 cycles of 94 °C for 1 min, 50 °C for 1 min and 72 °C
for 1 min, and then a final extension step of 72 °C for 7 min. Amplicons (10 µL) were
loaded onto an agarose gel (2% w/v in TBE buffer; Appendix C) containing ethidium
bromide (0.007 % v/v). After electrophoresis in TBE buffer (100V; Electro-fast®
Wide system, ABgene, Epsom, UK; Electrophoresis constant power supply ECPS
3000/150, Pharmacia Fine Chemicals, Uppsala, Sweden), amplicons were visualised
through a UV transilluminator (TFX-20.M, Vilber Lourmat, France) and the image
captured via the EDAS 290 camera system and 1D Image Analysis Software (Kodak,
New Haven, CT, USA). Amplicon sizes were estimated from the pGEM molecular
weight marker (Promega, Madison, WI, USA).
Restriction digests of amplicons were carried out in 20 µL volumes containing 1x
Buffer C (10 mM Tris-HCl pH 7.9, 50 mM NaCl, 10 mM MgCl2, 1 mM
dithiothreitol), 0.1% bovine serum albumin and 5 U RsaI (Promega, Madison, WI,
USA). Approximately 1 µg DNA was used for each reaction (roughly equivalent to 5
µL of amplicon). Digestion was performed at 37 °C for 1 h, after which the products
were electrophoresed and visualised as described above.
3.2.2 Results
3.2.2.1 Frequency of isolation from soil and rachis samples
Black Aspergillus spp. were isolated from vineyard soils in the 17 viticultural regions
examined (Table 3.2), and were present in 33 of 37 vineyards. Soil from four
vineyards in Tasmania did not yield black Aspergillus spp.; however, only single soil
samples were examined from each of these vineyards. Isolation from rachides was
less frequent than from soils. A. niger was the most frequently isolated species and

- 48 -
generally occurred in soils at a greater concentration than either A. carbonarius or A.
aculeatus, being present in vineyard soil at greater than 1000 cfu/g in 11 of 17 regions.
In this study, A. carbonarius was isolated from four regions: Hunter Valley and
Riverina, New South Wales; Riverland, South Australia; and St George, Queensland.
A. carbonarius was present in vineyard soil at greater than 1000 cfu/g in only two
regions, Riverland and Queensland. This species was also frequently isolated in a
follow-up study of nine table grape vineyards in Queensland (data not shown). A.
aculeatus was isolated from six regions, including the four regions where A.
carbonarius was present.
Representative isolates of A. niger and A. carbonarius selected from each region for
further analysis are listed in Table 3.3. Also included in Table 3.3 are isolates from
vineyards in Sunraysia, Victoria (Leong et al., 2004). Isolates of A. aculeatus were not
subjected to further analysis as this species typically does not produce OA.
3.2.2.2 Frequency of toxigenicity
All 32 isolates of A. carbonarius displayed the blue fluorescence characteristic of OA
when grown on CCA (Table 3.3). Extracts from three of 100 isolates of A. niger
grown on YES produced peaks corresponding to the retention time of OA when
analysed by HPLC. The identity of OA in each of these extracts was confirmed by
noting the corresponding peak shift upon derivitization of the extracts, as shown in
Fig. 3.1. Note that after derivitization, most of the original OA was derivitized and
hence only a slight peak remained at the original retention time. The identity of the
derivitized OA in the fungal extract is demonstrated by co-elution with the derivitized
OA from the standard solution (Fig. 3.2). The three toxigenic A. niger isolates were
accessioned into the FRR culture collection (FRR 5694, FRR 5695 and FRR 5701) as
described in section 2.2. FRR 5694 was isolated from soil beneath Cabernet
Sauvignon vines in Margaret River, Western Australia, and FRR 5695 and FRR 5701
were from a single sample of rachides (variety unknown) from Coonawarra, South
Australia. Although the screening technique was not quantitative, it was noted that
FRR 5694 produced more OA on YES than the other two isolates (data not shown).

- 49 -
Table 3.2: Isolation of Aspergillus niger, A. carbonarius and A. aculeatus from soils, rachides and berries from Australian vineyards
Presence of black Aspergillus species No. in which black Aspergillus spp. presenta / No. tested
No. of samples within concentration range for black Aspergillus spp. (cfu/g)
State Region
Vin
eyar
ds
Soil samples (unless otherwise
indicated)
20-100
100-1000
103-104 > 104
Hunter Valley 4/4 16/16
2/3 rb
1 nc
2 ac 3 n
1 cc
1 n
12 n
1 n
Mudgee 2/2 6/7 0/1 r 0/3 bb
1 n
1 a
3 n 1 n 1 n
New South Wales
Riverina 2/2 12/12
3/4 b
1 n 2 a 3 nd 1 cd
1 n 2 a
7 n 3 n
Alpine Valley 1/1 12/12 1 n 6 n 5 n Victoria Yarra Valley 1/1 2/12 2 n Adelaide Hills 1/1 7/12
0/6 r 4 n 3 n
Barossa Valley 2/2 12/16 9/10 r
2 n 6 n
5 n
4 n
4 n
Clare Valley 1/1 8/8 2/4 r
2 n 4 n 1 n
2 n
1 n
Coonawarra 2/2 4/13 1/14 r
3n 1 n 1 n
Langhorne Creek
1/1 6/12 0/6 r
6 n
McLaren Vale 1/1 13/13
0/6 r
3 n 1 a
2 n 8 n
Padthaway 1/1 9/12 0/6 r
4 n 4 n 1 n
South Australia
Riverland 1/1 12/12
5/7 r
3 c
1 n
1 c
1 n 2 c 5 a
1 n
8 n
2 c
2 a
3 n
3 n
Margaret River 3/3 13/15 0/6 r
10 n 3 n Western Australia
Pemberton 1/1 3/12 0/6 r
3 n
Tasmania 3/7 2/7 1/7 r
2 n
1 n
Queensland 6/6 (1/6 c)
9/14
3 n
1 a
3 n 3 n
1 c
1 a
1 c
1 a
a limit of detection 20 cfu/g soil b r: isolated from rachides; b: isolated from berries (berry samples only obtained from Mudgee and the Riverina) c n: no. of samples from which A. niger was isolated; a: A. aculeatus; c: A. carbonarius d detected at approximately 10 cfu/g berries

Table 3.3: Isolates of black Aspergillus spp. examined and ability to produce ochratoxin A
Species Isolate Accession no.
Source Location OA
production N/T
profileb
Inclusion in molecular study, section 3.3
A. carbonarius CHV1 FRRa 5682 Soil beneath Semillon vines Hunter Valley, NSWc + - yes A. carbonarius CHV2 FRR 5683 Soil beneath Semillon vines Hunter Valley, NSW + - yes A. carbonarius CHV1a FRR 5699 Shiraz grapes Hunter Valley, NSW + - yes A. carbonarius CHV1b FRR 5700 Shiraz grapes Hunter Valley, NSW + - yes A. carbonarius CRv1 FRR 5690 Semillon grapes Riverina, NSW + - yes A. carbonarius CRv2 FRR 5702 Semillon grapes Riverina, NSW + - yes A. carbonarius CRL2 FRR 5703 Soil beneath Chardonnay vines Riverland, SAc + - yes A. carbonarius CRL3 FRR 5704 Soil beneath Chardonnay vines Riverland, SA + - yes A. carbonarius CRL4 FRR 5705 Soil beneath Shiraz vines Riverland, SA + - yes A. carbonarius CRL5 FRR 5706 Soil beneath Shiraz vines Riverland, SA + - yes A. carbonarius CRL6 FRR 5707 Soil beneath Chenin Blanc vines Riverland, SA + - yes A. carbonarius CRL7 FRR 5708 Soil beneath Chenin Blanc vines Riverland, SA + - yes A. carbonarius CRL10 FRR 5709 Soil beneath Chenin Blanc vines Riverland, SA + - yes A. carbonarius CRL11 FRR 5710 Soil beneath Chenin Blanc vines Riverland, SA + - yes A. carbonarius CRL12 FRR 5711 Soil beneath Colombard vines Riverland, SA + - yes A. carbonarius CRL13 FRR 5691 Soil beneath Chardonnay vines Riverland, SA + - yes A. carbonarius CRL15 FRR 5712 Soil beneath Chardonnay vines Riverland, SA + - yes A. carbonarius CRL16 FRR 5713 Soil beneath Chardonnay vines Riverland, SA + - yes A. carbonarius CRL17 FRR 5714 Chardonnay rachides Riverland, SA + - yes A. carbonarius FRR 5374 Flame seedless grapes Sunraysia, Vicc + - yes A. carbonarius FRR 5573 Sultana grapes Sunraysia, Vic + - yes A. carbonarius FRR 5574 Sultana grapes Sunraysia, Vic + - yes A. carbonarius PP1-3 FRR 5693 Waltham raisins Sunraysia, Vic + - yes
- 50 -

A. carbonarius RR2-4 FRR 5696 Waltham raisins Sunraysia, Vic + - yes A. carbonarius K3-7 FRR 5697 Sultana grapes Sunraysia, Vic + - yes A. carbonarius SS5-2 FRR 5698 Semillon grapes Sunraysia, Vic + - yes A. carbonarius Q1-9 FRR 5719 Sultana grapes Sunraysia, Vic + - yes A. carbonarius CQL1 FRR 5715 Soil beneath Shiraz vines Queensland + - yes A. carbonarius CQL2 FRR 5716 Soil beneath Shiraz vines Queensland + - yes A. carbonarius CQL4 FRR 5717 Soil beneath Shiraz vines Queensland + - yes A. carbonarius CQL5 FRR 5718 Soil beneath Shiraz vines Queensland + - yes A. carbonarius CQL6 FRR 5692 Soil beneath Shiraz vines Queensland + - yes A. niger NHV1 FRR 5720 Soil beneath Semillon vines Hunter Valley, NSW - T yes A. niger NHV2 Chardonnay grapes Hunter Valley, NSW - T A. niger NHV3 Shiraz grapes Hunter Valley, NSW - T A. niger NHV5 Vineyard soil Hunter Valley, NSW - N A. niger NHV7 Vineyard soil Hunter Valley, NSW - T A. niger NHV10 Vineyard soil Hunter Valley, NSW - T A. niger NHV11 Rachides Hunter Valley, NSW - T A. niger NHV13 Shiraz grapes Hunter Valley, NSW - N A. niger NMu2 Soil beneath Cabernet
Sauvignon vines Mudgee, NSW - N
A. niger NMu4 Soil beneath Chardonnay vines Mudgee, NSW - N A. niger NMu5 Soil beneath Merlot vines Mudgee, NSW - T A. niger NMu6 Soil beneath Merlot vines Mudgee, NSW - T A. niger NMu7 Soil beneath Merlot vines Mudgee, NSW - N A. niger NMu8 Soil beneath Shiraz vines Mudgee, NSW - T A. niger NMu9 Vineyard soil Mudgee, NSW - N A. niger NMu10 Soil beneath Chardonnay vines Mudgee, NSW - T A. niger NRv1 Soil beneath Cabernet
Sauvignon vines Riverina, NSW - T
A. niger NRv2 Soil beneath Semillon vines Riverina, NSW - N
- 51 -
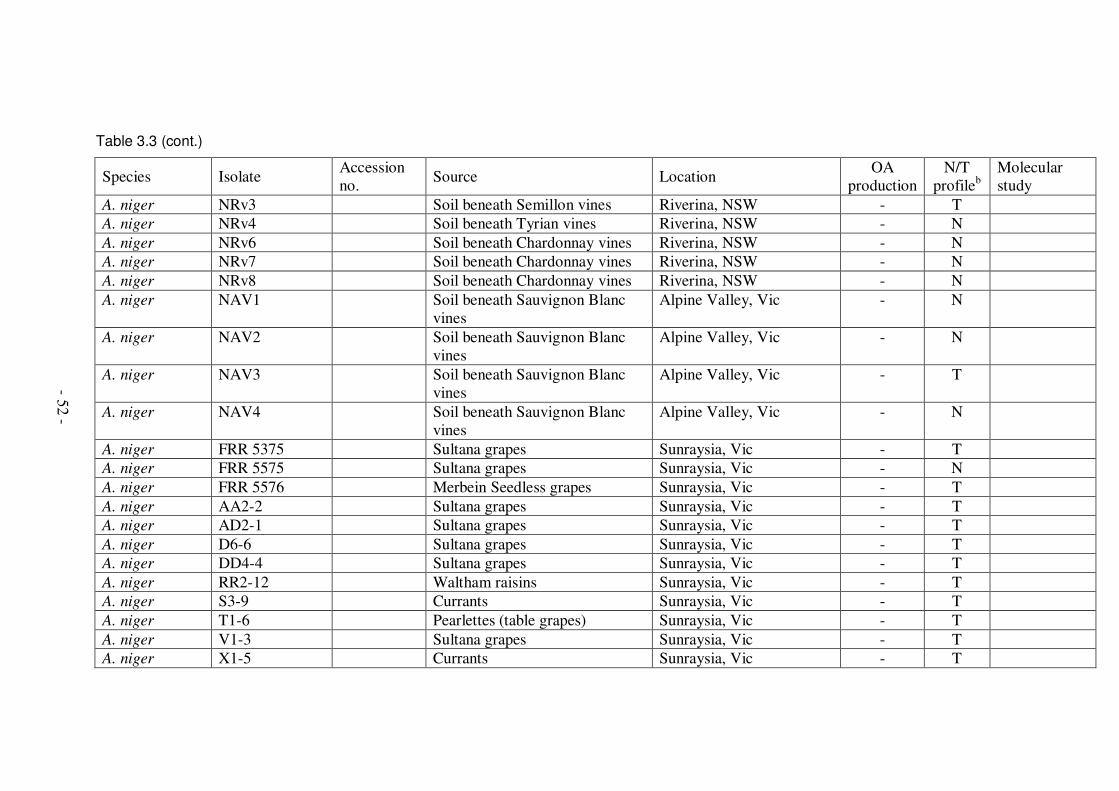
Table 3.3 (cont.)
Species Isolate Accession no.
Source Location OA
production N/T
profileb Molecular study
A. niger NRv3 Soil beneath Semillon vines Riverina, NSW - T A. niger NRv4 Soil beneath Tyrian vines Riverina, NSW - N A. niger NRv6 Soil beneath Chardonnay vines Riverina, NSW - N A. niger NRv7 Soil beneath Chardonnay vines Riverina, NSW - N A. niger NRv8 Soil beneath Chardonnay vines Riverina, NSW - N A. niger NAV1 Soil beneath Sauvignon Blanc
vines Alpine Valley, Vic - N
A. niger NAV2 Soil beneath Sauvignon Blanc vines
Alpine Valley, Vic - N
A. niger NAV3 Soil beneath Sauvignon Blanc vines
Alpine Valley, Vic - T
A. niger NAV4 Soil beneath Sauvignon Blanc vines
Alpine Valley, Vic - N
A. niger FRR 5375 Sultana grapes Sunraysia, Vic - T A. niger FRR 5575 Sultana grapes Sunraysia, Vic - N A. niger FRR 5576 Merbein Seedless grapes Sunraysia, Vic - T A. niger AA2-2 Sultana grapes Sunraysia, Vic - T A. niger AD2-1 Sultana grapes Sunraysia, Vic - T A. niger D6-6 Sultana grapes Sunraysia, Vic - T A. niger DD4-4 Sultana grapes Sunraysia, Vic - T A. niger RR2-12 Waltham raisins Sunraysia, Vic - T A. niger S3-9 Currants Sunraysia, Vic - T A. niger T1-6 Pearlettes (table grapes) Sunraysia, Vic - T A. niger V1-3 Sultana grapes Sunraysia, Vic - T A. niger X1-5 Currants Sunraysia, Vic - T
- 52 -

A. niger Z3-2 Sultana grapes Sunraysia, Vic - T A. niger NYV1 FRR 5721 Soil beneath Chardonnay vines Yarra Valley, Vic - N yes A. niger NYV2 Soil beneath Chardonnay vines Yarra Valley, Vic - T A. niger NAH1 Soil beneath Pinot Noir vines Adelaide Hills, SA - T A. niger NAH2 Soil beneath Verdelho vines Adelaide Hills, SA - T A. niger NAH3 Soil beneath Verdelho vines Adelaide Hills, SA - T A. niger NAH4 Soil beneath Cabernet
Sauvignon vines Adelaide Hills, SA - T
A. niger NBa1 Vineyard soil Barossa Valley, SA - N A. niger NBa2 Vineyard soil Barossa Valley, SA - N A. niger NBa3 Vineyard soil Barossa Valley, SA - N A. niger NBa7 Vineyard soil Barossa Valley, SA - N A. niger NBa8 Rachides Barossa Valley, SA - N A. niger NCL1 Soil beneath Cabernet
Sauvignon vines Clare Valley, SA - N
A. niger NCL3 Soil beneath Shiraz vines Clare Valley, SA - N A. niger NCL4 Soil beneath Shiraz vines Clare Valley, SA - N A. niger NCL5 Soil beneath Shiraz vines Clare Valley, SA - N A. niger NCL6 Soil beneath Petit Verdot vines Clare Valley, SA - T A. niger NCL7 Soil beneath Grenache vines Clare Valley, SA - N A. niger NCL8 Soil beneath Cabernet
Sauvignon vines Clare Valley, SA - N
A. niger NCL9 Soil beneath Cabernet Sauvignon vines
Clare Valley, SA - N
A. niger NCL10 Soil beneath Cabernet Sauvignon vines
Clare Valley, SA - N
A. niger NCL12 Soil beneath Semillon vines Clare Valley, SA - N A. niger NCn1 Vineyard soil Coonawarra, SA - N A. niger NCn2 Vineyard soil Coonawarra, SA - N
- 53 -

Table 3.3 (cont.)
Species Isolate Accession no.
Source Location OA
production N/T
profileb Molecular study
A. niger NCn5 Vineyard soil Coonawarra, SA - N A. niger NCn6 Vineyard soil Coonawarra, SA - N A. niger NCn7 FRR 5701 Rachides Coonawarra, SA + N A. niger NCn9 FRR 5695 Rachides Coonawarra, SA + N yes A. niger NLC1 Soil beneath Merlot vines Langhorne Creek, SA - N A. niger NLC2 Soil beneath Shiraz vines Langhorne Creek, SA - T A. niger NLC3 Soil beneath Shiraz vines Langhorne Creek, SA - N A. niger NLC4 Soil beneath Shiraz vines Langhorne Creek, SA - T A. niger NLC5 Soil beneath Cabernet
Sauvignon vines Langhorne Creek, SA - N
A. niger NLC7 Soil beneath Shiraz vines Langhorne Creek, SA - T A. niger NMV1 Vineyard soil McLaren Vale, SA - N A. niger NMV2 Vineyard soil McLaren Vale, SA - T A. niger NMV3 Vineyard soil McLaren Vale, SA - T A. niger NMV5 Vineyard soil McLaren Vale, SA - N A. niger NMV7 Vineyard soil McLaren Vale, SA - T A. niger NMV9 Vineyard soil McLaren Vale, SA - T A. niger NPd1 Soil beneath Shiraz vines Padthaway, SA - T A. niger NPd2 Soil beneath Semillon vines Padthaway, SA - N A. niger NPd3 Soil beneath Chardonnay vines Padthaway, SA - T A. niger NPd4 Soil beneath Riesling vines Padthaway, SA - T A. niger NPd5 Soil beneath Shiraz vines Padthaway, SA - N A. niger NPd6 Soil beneath Cabernet
Sauvignon vines Padthaway, SA - T
A. niger NRL1 Soil beneath Chardonnay vines Riverland, SA - T
- 54 -

A. niger NRL10 Chardonnay rachides Riverland, SA - T A. niger NRL11 Chardonnay rachides Riverland, SA - N A. niger NRL12 Shiraz rachides Riverland, SA - N A. niger NRL2 Soil beneath Shiraz vines Riverland, SA - T A. niger NRL3 Soil beneath Chenin Blanc vines Riverland, SA - T A. niger NRL4 Soil beneath Chenin Blanc vines Riverland, SA - N A. niger NRL7 Soil beneath Chardonnay vines Riverland, SA - N A. niger NRL8 Soil beneath Shiraz vines Riverland, SA - T A. niger NRL9 Chenin Blanc rachides Riverland, SA - N A. niger NMR1 Soil beneath Cabernet
Sauvignon vines Margaret River, WA - N
A. niger NMR3 Soil beneath Cabernet Sauvignon vines
Margaret River, WA - N
A. niger NMR4 FRR 5694 Soil beneath Cabernet Sauvignon vines
Margaret River, WA + N yes
A. niger NMR5 Soil beneath Shiraz vines Margaret River, WA - N A. niger NMR6 Soil beneath Chenin Blanc vines Margaret River, WA - N A. niger NMR7 Soil beneath Chenin Blanc vines Margaret River, WA - T A. niger NMR8 Soil beneath Chenin Blanc vines Margaret River, WA - T A. niger NPm1 Soil beneath Cabernet
Sauvignon vines Pemberton, WA - N
A. niger NPm2 Soil beneath Chardonnay vines Pemberton, WA - T A. niger NPm3 Soil beneath Chardonnay vines Pemberton, WA - N A. niger NTa1 Soil beneath Pinot and Merlot
vines Tasmania - T
A. niger NTa2 FRR 5722 Rachides Tasmania - N yes A. niger NQL1 Soil beneath Chardonnay vines Queensland - N A. niger NQL2 Soil beneath Chardonnay vines Queensland - N A. niger NQL3 Soil beneath Chardonnay vines Queensland - N
- 55 -

Table 3.3 (cont.)
Species Isolate Accession no.
Source Location OA
production N/T
profileb Molecular study
A. niger NQL4 Soil beneath Shiraz vines Queensland - N A. niger NQL5 Soil beneath Merlot vines Queensland - T A. niger NQL6 Soil beneath Shiraz vines Queensland - N Additional strains A. carbonarius A-941a Grapes Spain + - yes A. carbonarius A-1477 Grapes Jerez, Spain + - yes A. carbonarius A-1500 Grapes Vendrell, Spain + - yes A. carbonarius A-1040 Raisins Spain + - yes A. carbonarius A-1070 Raisins Spain + - yes A. carbonarius CBS 110.49a Air Indonesia - - yes A. carbonarius M325 Apples supplied by H.M.L.J
Joosten + - yes
A. carbonarius CBS 127.49 Coffee Unknown + - yes A. carbonarius NRRL67a Soil Brazil + - yes A. carbonarius A-642 Soil Portugal + - yes A. niger FRR 2522 Peanuts Kingaroy, Australia - N yes A. niger FRR 333 Rice Murrumbidgee Irrigation
Area, Australia - N yes
A. niger A-943 Grapes Portugal + N yes A. niger A-947 Grapes Spain - T yes A. niger w-148a A-1743 Grapes Spain - N yes A. niger A-1241 Grapes Turis, Spain + N yes A. niger A-942 Raisins Greece + N yes A. niger A-75 FRR 5361 Feed Spain + N yes A. niger A-220 Feed Spain + N yes
- 56 -

A. niger A-615 Feed Spain - T yes A. niger A-136 FRR 5353 Soy Canada + N yes A. niger A-655 Wheat Spain - N yes A. niger A-487 Wheat Spain - T yes A. niger CECT 2088 CBS 120.49 Unknown USA - N yes A. niger A-946 Coffee Portugal - N yes A. niger CBS 121.55 Otomycosis Switzerland - N yes A. niger A-656 Soil Spain - T yes A. niger CBS 554.65 Tannin-gallic acid ferment USA - N yes A. awamori
d CBS 139.52 Kuro-koji Japan + N yes
A. foetidusd CBS 618.78 Unknown Germany + N yes
A. tubingensisd CBS 134.48 Unknown Unknown - T yes
A. aculeatus A-1122 Grapes Murcia, Spain - - yes A. aculeatus A-1325 Grapes Vendrell, Spain - - yes A. aculeatus A-1355 Grapes Penedès, Spain - - yes A. aculeatus A-1356 Grapes Penedès, Spain - - yes
a isolates accessioned into the FRR culture collection, Food Science Australia, North Ryde, NSW, Australia. A and w: isolates from the collection of the Autonomous University of Barcelona, Veterinary Faculty, Bellaterra, Barcelona, Spain. CBS: Centraalbureau voor Schimmelcultures, Utrecht, Netherlands. CECT: Coleccion Espanola de Cultivos Tipo, Burjassot, Valencia, Spain. NRRL: Agricultural Research Service Culture Collection, Peoria, IL, USA b RFLP profile for A. niger strains only (Accensi et al., 1999) c NSW: New South Wales; SA: South Australia; Vic: Victoria; WA: Western Australia d these species are closely related to A. niger and are often morphologically indistinguishable. They are usually described as members of the A.
niger aggregate
- 57 -

- 58 -
Minutes
0.0 2.5 5.0 7.5 10.0 12.5 15.0 17.5 20.0 22.5 25.0 27.5 30.0
Vo
lts
0.0
0.2
0.4
0.6
0.8
1.0
Vo
lts
0.0
0.2
0.4
0.6
0.8
1.0
Detector A (Ex:385nm, Em:435nm)
dxNCn9
dxNCn9
Detector A (Ex:385nm, Em:435nm)
NCn09b
NCn09b
Figure 3.1: Overlaid chromatograms of ochratoxin A produced by Aspergillus niger FRR 5695 in (a) underivitized (retention time 9.3 min) and (b) derivitized (retention time 23.3 min) forms. The dotted trace shows the fungal extract prior to derivitization and the bold trace, the fungal extract after derivitization
Minutes
0.0 2.5 5.0 7.5 10.0 12.5 15.0 17.5 20.0 22.5 25.0 27.5 30.0
Vo
lts
0.0
0.2
0.4
0.6
0.8
1.0
Vo
lts
0.0
0.2
0.4
0.6
0.8
1.0
Detector A (Ex:385nm, Em:435nm)
dxMixCn7b
dxMixCn7b
Figure 3.2: Chromatogram of a mixed sample consisting of standard ochratoxin A solution (22 ng/mL), derivitized OA standard, and derivitized extract from Aspergillus niger FRR 5701. Peak ‘a’ comprises OA from the standard, retention time 9.3 min; peak ‘b’ demonstrates the co-elution of derivitized OA in both the standard and fungal extract, retention time 23.4 min
a
b
a
b

- 59 -
3.2.2.3 Strain typing of Aspergillus niger
RFLP analysis of 113 isolates of A. niger from 18 Australian viticultural regions
separated the isolates into the same two groups described by Accensi et al. (1999).
Briefly, type N fragments possess the restriction site for RsaI and the cleaved
fragment of type N strains is smaller (519 bp) than the uncleaved fragment of type T
strains (595 bp) (Fig. 3.3). Sixty one isolates, including the three toxigenic isolates,
showed the type N pattern, and 52 isolates showed the type T pattern (Table 3.3).
Figure 3.3: RFLP analysis of ribosomal DNA from a selection of Aspergillus niger isolates from Australian vineyards; differentiation of type N from type T strains. M denotes the pGEM molecular weight marker. In the final two lanes (bottom right of gel) are isolates of known RFLP type, FRR 5361 type N and FRR 3252 type T. Details of isolates are given in Table 3.3. Loaded in ascending numerical order on the gel are isolates NHV3, NHV5, NHV7, NHV10, NHV11, NHV13, NMu4, NMu5, NMu6, NMu7, NMu8, NMu9, NMu10, NRv1, NRv2, NRv3, NRv4, NRv6, NRv7, NRv8, NCn5, NCn6, NCn7 (FRR 5701), NCn9 (FRR 5695), NBa1, NBa2, NBa3, NBa7, NBa8, NMV1, NMV2, NMV3, NMV7, NMV9, NCL1, NCL3, NCL4, NCL5, NCL6, NCL7, NCL8, NCL9, NCL10, NCL12, NAH1, NAH2, NAH3, NAH4, NLC1, NLC2, NCL3, NLC4, NLC5, NLC7, NMR3, NMR4 (FRR 5694), NMR5, NMR6, NMR7, NMR8, NPd1, NPd2, NPd3, NPd4, NPd5, NPd6, NPm1, NPm2, NPm3, NTa2 (FRR 5722), NRL1, NRL2, NRL3, NRL4, NRL7, NRL8, NRL9, NRL10, NRL11, NRL12, NQL1, NQL2, NQL3, NQL4, NQL5, NQL6, NMV5, NYV1, NYV2 (FRR 5721), NAV1, NAV2, NAV3, NAV4. Isolate 94 was FRR 3911 A. niger var. awamori from soil in Western Australia
2645 1196 1605 676 517
2645 1196 1605 676 517
1 2 3 4 5 6 7 8 M 9 10 11 12 13 14 15 16 M
17 18 19 20 21 22 23 24 M 25 26 27 28 29 30 31 32 M
33 34 35 36 37 38 39 40 M 41 42 43 44 45 46 47 48 M
49 50 51 52 53 54 55 56 M 57 58 59 60 61 62 63 64 M
65 66 67 68 69 70 71 72 M 73 74 75 76 77 78 79 80 M
81 82 83 84 85 86 87 88 M 89 90 91 92 93 94 N T M

- 60 -
3.3 Techniques to assess molecular relationships among isolates of Aspergillus niger and A. carbonarius
The experiments reported in section 3.3 were planned, executed and analysed in
collaboration with Alexandre Esteban, a PhD candidate from the Autonomous
University of Barcelona on a visiting scholarship to Food Science Australia. The
findings are jointly reported in the PhD theses of both Su-lin Leong and Alexandre
Esteban.
3.3.1 Methods
3.3.1.1 Strain selection and DNA extraction
All the isolates of A. carbonarius from Australian vineyards (all toxigenic) described
in section 3.2 plus one toxigenic A. niger isolate from each of Margaret River,
Western Australia (FRR 5694) and Coonawarra, South Australia (FRR 5695) were
included in this study of the molecular relationships among black Aspergillus spp.
Three non-toxigenic A. niger isolates, from the Hunter Valley, New South Wales
(FRR 5720), the Yarra Valley, Victoria (FRR 5721) and Tasmania (FRR 5722), were
also included, with FRR 5720 representing a type T strain. The remainder of the
isolates examined in this study comprised black Aspergillus isolates from a variety of
sources and locations, several of which have been characterised for OA production by
Esteban et al. (2004). Isolates from grapes in Europe were included in the study for
comparison with Australian isolates. Table 3.3 gives details of the isolates used in this
molecular study. DNA was extracted from the isolates as described in section
3.2.1.3.1.
3.3.1.2 ERIC-PCR
PCR amplification was performed in 20 µL reaction volumes containing 1x PCR
buffer (Qiagen, Germany), 5% glycerol, 250 µM each dNTP, 20 pmol of each primer
(ERIC2F: 5’-AAGTAAGTGACTGGGGTGAGCG-3’ and ERIC1R: 5’-
ATGTAAGCTCCTGGGGATTCAC-3’; Gillings and Holley (1997); Proligo,
Boulder, CO, USA), 1 U of Taq DNA polymerase (Qiagen, Germany) and 20-40 ng
of DNA as template. Amplification was performed in a Hybaid PCR Express Thermal
Cycler (Integrated Sciences, Willoughby, NSW, Australia) with the cycling
parameters: 94 °C for 3 min, 35 cycles of 94 °C for 30 s, 52 °C for 30 s and 68 °C for
- 61 -
8 min, and then a final extension step of 68 °C for 8 min. Electrophoresis and
visualisation of amplicons were described in section 3.2.1.3.2.
Each set of comigrating bands was designated as a locus and each isolate was scored
visually for the presence (1) or absence (0) of a band at that locus (Appendix D, Table
D.1). A distance matrix based on pairwise comparisons was obtained using the
RAPDistance program version 1.04 (Armstrong et al. (1994);
http://www.anu.edu.au/BoZo/software/, accessed 09/08/04).
3.3.1.3 AFLP
All primers and adapters used in AFLP analysis were obtained from Proligo (Lismore,
NSW, Australia). This method was based on a protocol developed for black Aspergillus
spp. as part of the EU project, Risk Assessment and Integrated Ochratoxin A Management
in Grapes and Wine (Wine Ochra-Risk, QLK-CT-2001-01761) (G. Mulè, Istituto di
Scienze delle Produzioni Alimentari (ISPA), CNR, Italy, pers. comm. 05/05/04).
Approximately 400-800 ng of genomic DNA was digested with the restriction
endonucleases EcoRI (13 U) and MseI (7 U) (New England BioLabs, Inc., Beverly, MA,
USA) in 40 µL 1x One-Phor-All buffer (Amersham Biosciences UK Ltd,
Buckinghamshire, UK) at 37 °C for 2.5 h. The restriction fragments were ligated to the
double-stranded restriction site-specific adapters EcoRI (4 pmol) and MseI (38 pmol)
using T4-ligase (0.75 Weiss units) in 0.2x T4 ligase buffer (Promega, Wisconsin, MI,
USA), total volume 7.5 µL. Pre-amplification was performed using the combination of
primers EcoRI-A (5’-GACTGCGTACCAATTCA-3’) + MseI-C (5’-
GATGAGTCCTGAGTA AC-3’), or EcoRI (5’-ACTGCGTACCAATTC-3’) + MseI-C.
The pre-amplification mixture (25 µL) contained 1x PCR buffer (Qiagen, Germany), 200
µM each dNTP, 25 pmol of each primer, 0.5 U of Taq DNA polymerase (Qiagen,
Germany) and 20-40 ng digested DNA as template. Amplification was performed in a
Hybaid PCR Express Thermal Cycler (Integrated Sciences, Willoughby, NSW, Australia)
for 20 cycles of 94 °C for 30 s, 56 °C for 1 min and 72 °C for 1 min.

- 62 -
Amplicons from the pre-amplification reaction were diluted 1:10 in sterile Milli-Q
water for use as a template for the selective amplification. Three primer combinations
were chosen for use with template DNA from the EcoRI-A + MseI-C pre-
amplification: A [EcoRI-AC (5’-GACT GCGTACCAATTCAC-3’) + MseI-CC (5’-
GATGAGTCCTGAGTAACC-3’)]; B [EcoRI-AT (5’-GACTGCGTACCAATTCAT-
3’) + MseI-CG (5’-GATGAGTCCTGAGTAACG-3’)]; C [EcoRI-AC + MseI-CA (5’-
GATGAGTCCTGAGTAACA-3’)]. A fourth primer combination, D [EcoRI-G (5’-
GACTGCGTACCAATTCG-3’) + MseI-CT (5’-GATGAGTCCTGAGTAACT-3’)],
was chosen for use with template DNA from the Eco-RI + MseI-C pre-amplification.
The EcoRI primers were labelled at the 5’ end with the fluorescent dye FAM for
primer sets A, C and D, and with HEX for primer set B. The reaction mixture (25 µL)
contained 5 µL diluted template amplicons, 1x PCR buffer (Qiagen, Germany), 200
µM each dNTP, 20 pmol of each primer and 2.5 U of Taq DNA polymerase (Qiagen,
Germany). The cycling parameters for amplification were: 10 cycles of 94 °C for 1
min, 65-56 °C for 1 min (decreasing every cycle from 65 °C by 1 Celsius degree) and
72 °C for 90 s; followed by 20 cycles of 94 °C for 30 s, 56 °C for 30 s and 72 °C for 1
min. Electrophoresis and visualisation of amplicons were described in section
3.2.1.3.2. The sizes of the multiple amplicons present for each isolate were assessed
using an automated sequencer (SUPAMAC, Camperdown, NSW, Australia).
Each amplicon within the size range 50-500 bp and above the threshold height
(fluorescence intensity greater than 200) was defined as an allele and a distance
matrix was produced by pairwise comparison using the Dice coefficient (Dice, 1945)
and ADE-4 software version 2001 (LecPCR and DistAFLP; http://pbil.univ-
lyon1.fr/ADE-4/microb/, accessed 23/07/04).
To base the phylogenetic analysis on the most robust data, the entire procedure was
replicated from the DNA digestion stage with selective primer sets B and D. For each
isolate, only alleles (amplicons) that were detected in both replicates (Align2, ADE-4
software version 2001; http://pbil.univ-lyon1.fr/ADE-4/microb/, accessed 16/09/04)
were included in the phylogenetic analysis. Data from primer sets B and D were
combined for pairwise comparison.

- 63 -
3.3.1.4 Microsatellites
Database searches of published sequences were performed using software available
through the WebANGIS interface of the Australian National Genomic Information
Service (ANGIS; http://www.angis.org.au, accessed 06/04). Sequences of A. niger
and A. carbonarius from GenBank (3390 in total) were screened for microsatellite
motifs, using all possible dinucleotide and trinucleotide motifs, each in ten tandem
repeats, as queries in BLASTN searches. Primers for PCR amplification were
designed to complement sequences flanking the microsatellite loci identified in the
BLASTN search, using Primer3© (Whitehead Institute for Biomedical Research,
Cambridge, MA, USA) and Net primer© (Biosoft International, Palo Alto, CA, USA)
software.
Polymorphism at these loci was detected by screening a subset of A. niger isolates (A-
136, A-656, A-942, A-946, A-947, FRR 2522 and FRR 5694) comprising both
toxigenic and non-toxigenic isolates and isolates of both type N and type T RFLP
profiles. Isolates of A. carbonarius (A-941, CBS 110.49, FRR 5371 and FRR 5715)
and A. aculeatus (A-1122) were also included in this subset, to determine if these
microsatellite markers could be used to characterise species closely related to A. niger.
PCR amplification was performed as described in section 3.2.1.3.2, with reaction
volume adjusted to 20 µL. Polymorphisms were presumptively identified as slight
differences in amplicon size when visualised on an agarose gel. Amplicons were
selected for sequencing (SUPAMAC, Camperdown, NSW, Australia) if presumptive
polymorphisms were observed, or if amplified from isolates of different species,
RFLP type or toxigenic ability. Sequences were aligned using ClustalW (accessed
through WebAngis).
Details of the six loci utilised in this study are listed in Table 3.4. The reverse primer
from each polymorphic locus was 5’-labelled with a fluorophor (PE Biosystems,
Foster City, CA, USA) for sizing with an automated sequencer and PIG-tailed
(Brownstein et al., 1996) in order to standardise the adenylation of the 3’ end of the
complementary strand.

- 64 -
To achieve clear and reproducible bands and to minimise non-specific annealing of
the primers, PCR conditions were optimised by increasing the annealing temperature
in 1 Celsius degree increments from 54 °C to 62 °C, using the subset of isolates
described above. The optimal cycling parameters were: 94 °C for 5 min, 30 cycles of
94 °C for 1 min, 54 °C for 1 min (ACNM2, 5, 6, 7) or 61 °C for 1 min (ACNM1, 3)
and 72 °C for 1 min, and then a final extension step of 72 °C for 10 min.
Amplification with combinations of forward and reverse primer concentrations at 50
nM, 200 nM and 800 nM was also tested, but did not improve clarity of bands; hence,
the standard concentration of 250 nM for both primers was retained.
Based on trends observed during the screening of the subset of isolates, PCR
amplifications using ACNM1, 2, 3, 5 and 7 were performed for all A. niger isolates.
Amplification using ACNM6 was only performed for A. niger type N isolates, as no
amplicons were observed for type T isolates during screening. The presence of
amplicons within the appropriate size range was assessed following electrophoresis on
an agarose gel, as described in section 3.2.1.3.2, after which the products were diluted
and the size of amplicons determined using an automated sequencer (SUPAMAC,
Camperdown, NSW, Australia). Amplicons from ACNM1, 2 and 3 were combined
into a single sample for analysis, as were amplicons from ACNM 5, 6 and 7. The
amplicons differed in size and were labelled with different fluorophores, thus the
fluorescence peaks detected by the sequencer were unlikely to overlap and interfere
with the signal.
Each amplicon of unique size was designated an allele and the absence of an amplicon
was defined as a null allele. Pairwise population distances were calculated using the
Microsat2 program (http://hpgl.stanford.edu/projects/microsat/, accessed 24/09/04)
based on the proportion of shared alleles. Bootstrap analysis was based on 200
resampled data sets.
3.3.1.5 Construction of dendrograms
Distance matrices derived by the various techniques were analysed using the
neighbour-joining algorithm in Phylip (Felsenstein (1989); accessed via WebANGIS,
2004-05; also available from http://evolution.genetics.washington.edu/phylip.html)
and dendrograms drawn using TreeExplorer 2.12 (K. Tamura;

- 65 -
http://evolgen.biol.metro-u.ac.jp/TE/TE_man.html, accessed 22/07/1999). Where
possible, isolates of A. aculeatus were used as the outgroup, as this uniseriate species
is distinct from A. carbonarius and A. niger, which are both biseriate. Bootstrap
analyses for the ERIC-PCR and AFLP dendrograms were based on 1000 resampled
data sets generated using PAUP* (D.L. Swofford; Phylogenetic Analysis Using
Parsimony (*and Other Methods), Version 4, Sinauer Associates, Sunderland, MA,
USA).
3.3.2 Results
3.3.2.1 ERIC-PCR
The dendrogram was constructed based on the presence or absence of bands at 16
distinct loci (Fig. 3.4; Appendix D, Table D.1). A. carbonarius and A. niger formed
two clusters when A. aculeatus isolates were used as the outgroup (Fig. 3.5). Three
toxigenic isolates of A. niger (two from Spain and one from Australia) fell outside the
main A. niger cluster. ERIC-PCR did not differentiate among the A. carbonarius
isolates. Differences among isolates of A. niger were detected; however, this
differentiation did not seem to be reliable. For example, a toxigenic strain, A-136, was
not differentiated from a non-toxigenic strain, A-946. Toxigenic and non-toxigenic
isolates, and N and T RFLP types within the A. niger aggregate were mixed in the
same clusters by this technique. Isolates of A. niger from Australia clustered together,
with the inclusion of a single Spanish isolate. No other association between origin or
substrate and molecular relatedness was observed. Bootstrap analysis provided little
support for the ERIC-PCR dendrogram.

- 66 -
Figure 3.4: Amplification of DNA from black Aspergillus spp. in PCR with ERIC primers. Lanes containing amplicons from A. niger isolates are numbered in yellow, from A. carbonarius isolates, in white and from A. aculeatus isolates, in pink. Details of isolates are tabulated in Appendix D, Table D.1. M denotes the pGEM molecular weight marker
M 1 2 3 4 5 6 7 8 M 9 10 11 12 13 14 15 16
M 17 18 19 20 21 22 23 M 25 26 27 28 29 30 31 32
M 33 34 35 36 37 38 39 40 M 41 42 43 44 45 46 47 48
M 49 50 51 52 53 54 55 56 M 57 58 59 60 61 62 63 64
M 65 66 67 68 69 70 71 M 72 24 M

- 67 -
Figure 3.5: Determination of molecular relationships among isolates of Aspergillus carbonarius, A. niger aggregate and A. aculeatus by ERIC-PCR. Colours denote the continent of origin, if known: Australia, Europe, Asia, Americas. Toxigenic isolates are italicised and denoted *. Isolates associated with grapes (including those from vineyard soil, raisins, rachides) are in bold. The RFLP type (N/T; Accensi et al. (1999)) is given for A. niger isolates
FRR 5696, grapes, Sunraysia *
FRR 5706, vineyard, Riverland *
FRR 5719, grapes, Sunraysia *
FRR 5714, vineyard, Riverland *
FRR 5715, vineyard, Queensland *
FRR 5717, vineyard, Queensland *
FRR 5718, vineyard, Queensland *
A-75, feed, Spain, N *
A-136, soy, Spain, N*
A-946, coffee, Portugal N
CBS 618.78, N*
CBS 134.48, T A-487, wheat, Spain, T
A-942, raisins, Spain, N*
FRR 5722, vineyard, Tasmania, N
FRR 2522, peanuts, Queensland, N FRR 333, rice, NSW, N
FRR 5694, vineyard, Margaret River, N*
FRR 5720, vineyard, Hunter Valley, T
FRR 5721, vineyard, Yarra Valley, T
A-947, grapes, Spain, T
A-943, grapes, Portugal, N*
CBS 139.52, kuro-koji, Japan, N*
CBS 121.55, otomycosis, Switzerland, N CECT 2088, USA, N
CBS 554.65, tannin-gallic acid ferment, USA, N
A-1743, grapes, Spain, N
A-655, wheat, Spain, N
A-656, soil, Spain, T
A-656, soil, Spain, T
A-1122, grapes, Spain
A-1355, grapes, Spain
A-1356, grapes, Spain
A-1325, grapes, Spain
A-1241, grapes, Spain, N*
A-220, feed, Spain, N*
FRR 5695, vineyard, Coonawarra, N*
FRR 5697, grapes, Sunraysia *
FRR 5698, grapes, Sunraysia *
NRRL 67, soil, Brazil *
CBS 127.49, coffee *
FRR 5374, grapes, Sunraysia *
CBS 110.49, air, Indonesia FRR 5716, vineyard, Queensland *
FRR 5692, vineyard, Queensland *
FRR 5574, grapes, Sunraysia *
FRR 5692, vineyard, Queensland *
M 325, apples *
FRR 5693, grapes, Sunraysia *
FRR 5703, vineyard, Riverland *
A-642, soil, Portugal *
A-1040, raisins, Spain *
FRR 5704, vineyard, Riverland *
FRR 5705, vineyard, Riverland *
FRR 5707, vineyard, Riverland *
FRR 5709, vineyard, Riverland *
FRR 5691, vineyard, Riverland *
A-941, grapes, Spain *
FRR 5682, vineyard, Hunter Valley *
FRR 5683, vineyard, Hunter Valley *
A-1070, raisins, Spain *
A-1477, grapes, Spain * A-1500, grapes, Spain *
FRR 5699, grapes, Hunter Valley *
FRR 5700, grapes, Hunter Valley *
FRR 5690, grapes, Riverina *
FRR 5702, grapes, Riverina *
FRR 5708, vineyard, Riverland *
FRR 5710, vineyard, Riverland *
FRR 5711, vineyard, Riverland *
FRR 5712, vineyard, Riverland *
FRR 5713, vineyard, Riverland *
0.1
A. aculeatus
A. carbonarius
A. niger
aggregate

- 68 -
3.3.2.2 AFLP
Data from selective amplification primer combinations B (EcoRI-AT + MseI-CG) and
D (EcoRI-G + MseI-CT) produced dendrograms that reliably separated A.
carbonarius, A. niger and A. aculeatus into three clusters (data not shown), hence,
these combinations were selected for repetition of the analysis from DNA digestion
onwards. Data were also analysed using the Jaccard coefficient of similarity (Sneath
and Sokal, 1973) and the dendrograms produced showed clustering similar to those
produced using the Dice coefficient (data not shown).
AFLP analyses of combined data from the primer combinations mentioned above
differentiated between the three species and also separated the A. niger aggregate into
two distinct groups corresponding to the N and T RFLP types (Fig. 3.6). The type N
cluster was further subdivided into two groups, with bootstrap value 92%, each group
containing a mixture of toxigenic and non-toxigenic isolates. Clustering among A.
carbonarius isolates was not evident. Relationships between major clusters and
substrate or geography were not observed, with isolates from vineyards closely related
to isolates from various other sources. Similarly, isolates from Europe and Australia
were interspersed in the dendrogram. Isolates of A. carbonarius from a single
Queensland vineyard shared some similarities, appearing at the bottom of the A.
carbonarius cluster together with isolates from Brazil and Indonesia. Isolates of A.
carbonarius from other viticultural regions were interspersed in the middle and upper
portions of the cluster.
3.3.2.3 Microsatellites
From the search of sequences in GenBank, ten microsatellite loci were identified
among A. niger sequences. However, no loci were identified in sequences of A.
carbonarius lodged as at June, 2004. Of these ten loci, six were polymorphic.
Multiple sequence alignments showing polymorphisms within the six microsatellite
loci are shown in Fig. 3.7. ACNM3 and ACNM7 contained perfect microsatellite
repeats, whereas other loci contained imperfect repeats, with occasional base
substitutions within the repeated motif. Differences in allele size among isolates did
not always correspond exactly to the addition or deletion of dinucleotide or
trinucleotide repeat units, which suggested that other polymorphisms existed within
the amplified region.

- 69 -
Figure 3.6: Determination of molecular relationships among isolates of Aspergillus carbonarius, A. niger aggregate and A. aculeatus by AFLP. Colours denote the continent of origin, if known: Australia, Europe, Asia, Americas. Toxigenic isolates are italicised and denoted *. Isolates associated with grapes (including those from vineyard soil, raisins, rachides) are in bold. The RFLP type (N/T; Accensi et al. (1999)) is given for A. niger isolates
A-1122, grapes, Spain A-1325, grapes, Spain
FRR 5720, vineyard, Hunter Valley, T
A-487, wheat, Spain, T
FRR 333, rice, NSW, N
FRR 2522, peanuts, Queensland, N
A-220, feed, Spain, N*
FRR 5714, vineyard, Riverland *
FRR 5713, vineyard, Riverland *
FRR 5698, grapes, Sunraysia *
FRR 5699, grapes, Hunter Valley *
A-941, grapes, Spain * A-642, soil, Portugal *
FRR 5700, grapes, Hunter Valley *
M 325, apples *
FRR 5574, grapes, Sunraysia * FRR 5682, vineyard, Hunter Valley *
FRR 5703, vineyard, Riverland * FRR 5374, grapes, Sunraysia *
A-1477, grapes, Spain * FRR 5706, vineyard, Riverland *
FRR 5702, grapes, Riverina * FRR 5704, vineyard, Riverland *
FRR 5573, grapes, Sunraysia * FRR 5696, grapes, Sunraysia *
FRR 5690, grapes, Riverina *
A-1070, raisins, Spain * FRR 5710, vineyard, Riverland *
A-1500, grapes, Spain * FRR 5719, grapes, Sunraysia *
FRR 5691, vineyard, Riverland * FRR 5709, vineyard, Riverland *
FRR 5705, vineyard, Riverland * FRR 5707, vineyard, Riverland *
FRR 5711, vineyard, Riverland *
A-75, feed, Spain, N *
A-136, soy, Spain, N*
CBS 139.52, kuro-koji, Japan, N* A-1241, grapes, Spain, N*
CECT 2088, USA, N
CBS 618.78, N* FRR 5722, vineyard, Tasmania, N
A-946, coffee, Portugal N CBS 554.65, tannin-gallic acid ferment, USA, N
A-942, raisins, Spain, N*
A-943, grapes, Portugal, N* FRR 5694, vineyard, Margaret River, N*
CBS 121.55, otomycosis, Switzerland, N A-655, wheat, Spain, N
A-1743, grapes, Spain, N
FRR 5695, vineyard, Coonawarra, N*
A-1355, grapes, Spain A-1356, grapes, Spain
CBS 134.48, T A-947, grapes, Spain, T
A-656, soil, Spain, T FRR 5721, vineyard, Yarra Valley, T
A-615, feed, Spain, T
FRR 5718, vineyard, Queensland * FRR 5716, vineyard, Queensland *
CBS 110.49, air, Indonesia FRR 5692, vineyard, Queensland *
NRRL 67, soil, Brazil *
FRR 5717, vineyard, Queensland *
FRR 5715, vineyard, Queensland * CBS 127.49, coffee *
FRR 5708, vineyard, Riverland *
FRR 5683, vineyard, Hunter Valley *
FRR 5693, grapes, Sunraysia *
FRR 5697, grapes, Sunraysia *
A-1040, raisins, Spain * FRR 5712, vineyard, Riverland *
0.02
A. niger
aggregate
A. carbonarius
A. aculeatus
99
98
92
98
99
93 79
100
84
77
75

- 70 -
Figure 3.7: Multiple sequence alignment of microsatellite loci (a) ACNM1, (b) ACNM2, (c) ACNM3, (d) ACNM5, (e) ACNM6 and (f) ACNM7 from isolates of Aspergillus niger and A. carbonarius. The microsatellite repeat units are underlined and the allele size in base pairs is given after the sequence
Figure 3.7a: ACNM1 multiple sequence alignment showing (CA)n repeat
331 341 351 361 371
A. niger A-136 TAAGTCTCAACCTTGCCACACACACACACACACACACACACAGA--
A. niger A-942 TAAGTCTCAACCTTGCCACACACACACACACACACACACACACACA
381 391 401
A-136 ------------------AAGGGAAAGAAATA (485)
A-942 CACACACACACACACAAAAAGGGAAAGAAATA (509)
Figure 3.7b: ACNM2 multiple sequence alignment showing (GA)n repeat
341 351 361 371 381
A. niger A-136 TGAATTCTCCATTGGGAACGAATCAGAGAGAGAGAGAGAGAGAGAAA
A. niger A-942 TTAATTTTCCATTGGGAAAGAATCAGAGAGAGAGAGAGAGAGAGA--
A. niger A-946 TTAATTTTCCATTGGGAAAGAATCAGAGAGATAGAGAGAGAGAGATA
391 401 411
A-136 GATAGAAAGAGA------GGCAGAGTAA (428)
A-942 ------------------GGCAGAGTAA (418)
A-946 AAGAGAGAGAGAGAGAGAGGCAGAGTAA (446)
Figure 3.7c: ACNM3 multiple sequence alignment showing (CCA)n repeat
101 111 121 131
A. niger A-136 ATCAACTTTATTGTGGAGAAACCACCACCACCACCA
A. niger A-942 ATCAACTTTATTGTGGAGAAATCACCACCACCACCA
A. niger FRR 2522 ATCAACTT-ATTGTGGAGAAACCACCACCACCACCA
A. carbonarius FRR 5374 ATCAACTTTATTGTGGAGAAATCACCACCACCACCA
141 151 161
A-136 CCACCAACAACCACGGAGGCAAGTTAA (192)
A-942 CCA---ACAACCACGGAGGCAAGTTA- (189)
FRR 2522 -------CAACCACGGAGGGAAGTTAA (184)
FRR 5374 CCA---ACAACCACGGAGGCAAGTTAA (189)
Figure 3.7d: ACNM5 multiple sequence alignment showing (CAA)n repeat
81 91 101 111 121
A. niger A-136 GAGCGGTTGCCGGAGGGTTTCCAACAGCAA---------------
A. niger A-942 GAGCGGTTGCCGGAGGGTTTCCAACAA------------------
A. niger A-946 GAGCGGTTGCCGGAGGGTTTCCAACAACAACAACAACAACAACAA
131 141 151
A-136 ---------CAACAACGTATCTTGTGACTCAAACCT (164)
A-942 ---------CAACAACGTATCTTGTGACTCAAACCT (163)
A-946 CAACAACAACAACAACGTATCTTGTGACTCAAACCT (204)

- 71 -
Figure 3.7e: ACNM6 multiple sequence alignment showing (ATC)n repeat
181 191 201 211 221
A. niger A-136 GACAATAACAACAACAACAACATCATCATCATCATCATCATCATC
A. niger A-942 GGCAATAACAAC---------------------ATCATCATCACC
231 241 251
A-136 ATCATCATCATCACAAAGGAGCTGTATA (455)
A-942 ATCATCATCATCACAAAGGAGCTGTATA (431)
Figure 3.7f: ACNM7 multiple sequence alignment showing (GTA)n repeat
141 151 161 171
A. niger A-136 ATTCGACCACATTTGACGATGGTAGTAGTAGTAGTA
A. niger A-942 ATTCGACCACATTTGACGATGGTAGTAGTAGTAGTA
A. carbonarius FRR 5374 ATTCGACCACATTTGACGATGGTAGTAGTAGTAGTA
181 191 201 211 221
A-136 GTAGTAGTAGTAGTAGTATAGATGTTCTGTAGAAGTATGTATAAGCC (405)
A-942 GTAGTAGTA------GTATAGATGTTCTGTAGAAGTATGTATAAGCC (399)
FRR 5374 GTAGTAGTA------GTATAGATGTTCTGTAGAAGTATGTATAAGCC (399)
Amplicons for five of the six polymorphic loci were detected from a majority of the
26 A. niger strains, and displayed 6-13 alleles (Table 3.4), with an average of 9.67
alleles per locus. Based on the initial screening results, amplification of ACNM6 was
attempted only from type N A. niger strains; however, amplicons were detected from
both toxigenic and non-toxigenic type N strains. When these microsatellite markers
were tested using four isolates of A. aculeatus and 32 isolates of A. carbonarius,
amplicons were detected for ACNM1 and ACNM3 from A. aculeatus; however,
ACNM3 often displayed two bands of similar size from individual isolates. It is not
clear whether the double bands resulted from non-specific amplification or if they
represented two alleles within individual isolates. Amplicons from certain A.
carbonarius isolates were detected for ACNM1, 2, 3, 5 and 7, and sequencing
demonstrated the presence of microsatellites for ACNM3 and 7 (Fig. 3.7c,f). However,
consistent results could not be achieved, the loci were not amplified in several isolates
and ACNM3 again commonly displayed double bands for individual isolates. Hence,
insufficient data precluded the inference of phylogenetic relationships among A.
carbonarius and A. aculeatus isolates using these microsatellite primer sets. Allele
sizes for all amplified loci are listed in Appendix D, Table D.2.

- 72 -
Table 3.4: PCR primer sequences, number of alleles and size range observed for microsatellite loci in Aspergillus niger
Locus R
epea
t mot
if
Primer (5’-3’) Size range
No.
of
alle
les
Db HOc
GenBank accession
no.
ACNM1 (CA)15 TCTCGACTCTGGCTCCTACC aFGTTTGCTTACTCACCGACTGGAAAA
464-509
13 0.93 0.90 AY081845
ACNM2 (CT)10 TGCCCTTACTCTGCCTCTCT HGTTTCCATTATTCACCCTCCCTTCT
409-446
6 0.80
0.77
AX952973
ACNM3 (CCA)15 TAACTTGCCTCCGTGGTTGT RGTTTGAGACCGGAAACATTGGAGTAG
177-215
12 0.91
0.88
BE759201
ACNM5 (GTT)12 CGTTTTCTCGGAAGGTTTGA RGTTTGTGCGTGTTGGGGACTATCT
163-204
8 0.73
0.71
ANAJ5117
ACNM6 (ATC)12 CGACAGCCGCATCATAGTT FGTTTCCTGCTCTTTTTGCCTTCTTT
429-458
9 0.84
0.81
AY081847
ACNM7 (GTA)10 TGAGGGAAGGGGGTTTTATT HGTTTGATCTACGGGGGTGTTTGTC
378-468
10 0.89 0.86 ANI278532
a superscript letters indicate fluorescent labels: FFAM, HHEX, RROX b numerical index of discriminatory power (Hunter, 1991) c observed heterozygosity (Nei, 1978)
Polymorphisms at the six microsatellite loci separated isolates of the A. niger
aggregate into two distinct clusters which corresponded with the N and T types of the
RFLP analysis (Fig. 3.8). The microsatellite dendrogram showed similar topology to
the AFLP dendrogram, although bootstrap analysis of the microsatellite data showed
low support. Type N isolates were subdivided into two groups that corresponded with
those derived by AFLP (Fig. 3.6), apart from slight differences in the minor branching.

- 73 -
Figure 3.8: Determination of molecular relationships among isolates of the Aspergillus niger aggregate by analysis of six polymorphic microsatellite loci. Colours denote the continent of origin, if known: Australia, Europe, Asia, Americas. Toxigenic isolates are italicised and denoted *. Isolates associated with grapes (including those from vineyard soil, raisins) are in bold. N/T denotes the RFLP type (Accensi et al., 1999), and type T isolates were used as the outgroup
A-942, raisins, Spain, N*
FRR 5694, vineyard, Margaret River, N*
A-1743, grapes, Spain, N
FRR 5695, vineyard, Coonawarra, N*
FRR 2522, peanuts, Queensland, N
A-75, feed, Spain, N*
CBS 139.52, kuro-koji, Japan, N*
A-1241, grapes, Spain, N*
A-136, soy, Spain, N*
A-220, feed, Spain, N*
CBS 554.65, tannin-gallic acid ferment, USA, N
CBS 618.78, N*
CECT 2088, USA, N
A-946, coffee, Portugal, N
FRR 5722, vineyard, Tasmania, N
CBS 134.48, T
A-947, grapes, Spain, T
A-615, feed, Spain, T
A-656, soil, Spain, T
FRR 5720, vineyard, Hunter Valley, T
FRR 5721, vineyard, Yarra Valley, T
A-487, wheat, Spain, T
FRR 333, rice, NSW, N
CBS 121.55, otomycosis, Switzerland, N
A-655, wheat, Spain, N
A-943, grapes, Portugal, N*
0.1

- 74 -
3.4 Discussion
3.4.1 Isolation and toxigenicity of black Aspergillus spp. from Australian viticultural regions
The dominance of A. niger over A. carbonarius and A. aculeatus in Australian
vineyards mirrors the frequent isolation of this species from grapes in Europe and
South America (discussed in section 3.1.1, Table 3.1). The dominance of A. niger has
been attributed to its high optimum and maximum growth temperatures compared
with the other two species (Battilani et al., 2003c; Bellí et al., 2004b; Leong et al.,
2004; Bellí et al., 2005a) and its rapid rate of growth. This is examined in greater
detail in chapter 4. A. carbonarius was isolated primarily from warm regions such as
the Riverland and Queensland (Table 3.2), and A. aculeatus was often isolated from
the same samples or regions. It is not clear whether these two species share some
characteristic which was favoured by local conditions in those vineyards and/or
regions.
The frequency of toxigenicity among A. niger and A. carbonarius isolates from
Australian vineyards is similar to that among isolates from grapes in Spain (Cabañes
et al., 2002; Abarca et al., 2003; Bau et al., 2005a), Italy (Battilani et al., 2005b),
France (Sage et al., 2002) and Portugal (Serra et al., 2003, 2005a). Nearly all A.
carbonarius isolates from grapes in Greece (Tjamos et al., 2004) or from dried vine
fruit in Argentina (Magnoli et al., 2004) produced OA; however, toxigenicity, albeit at
low concentrations, was also observed in a higher proportion of A. niger isolates than
reported in the other countries listed above. This high frequency of toxigenicity
among A. niger isolates and, conversely, a relatively low frequency of toxigenicity
among A. carbonarius isolates from grapes in South America was reported by Da
Rocha Rosa et al. (2002) and Magnoli et al. (2003). It is not apparent whether these
variations represent differing population structures in vineyards in these countries, or
if they result from misidentification of the fungi or erroneous detection of OA at low
concentrations. Non-toxigenic isolates of A. carbonarius, tentatively designated as a
new species A. ibericus (as mentioned by Serra et al. (2005a), with preliminary
molecular characterisation by Bau et al. (2005b)), have not been reported in Australia.
For A. niger isolates from grapes in Europe screened for OA production and
subsequently classified as type N or type T based on RFLP analysis, toxigenicity

- 75 -
occurred in about 2% of isolates, which were solely type N (F. J. Cabañes, pers.
comm. 18/11/03), as previously demonstrated extensively with strains from a variety
of sources (Accensi et al., 2001). In the European study, N and T types were isolated
with equal frequency from grapes. This is mirrored by the findings from Australian
vineyards. Both N and T types were isolated from all regions, with the exception of
the Adelaide Hills (four T types), the Barossa Valley (five N types) and Coonawarra
(seven N types). Examination of additional isolates is likely to reveal the presence of
the other type in these regions; for example, the presence of 12 T type strains from
Sunraysia was reported by Leong et al. (2004); however, examination of a thirteenth
strain revealed it to be type N.
The consistent presence of both N and T types within a single region suggested that
no region is exempt from the possibility of OA contamination of grapes by a toxigenic
isolate of A. niger. Furthermore, this species is dominant in vineyards of the world.
Fortunately, toxigenicity occurs infrequently in this species. The toxigenicity of all
Australian A. carbonarius isolates examined to date indicated that this is the primary
species of concern for the minimisation of OA in Australian grapes. It is perhaps
fortuitous that this species does not occur with the same frequency as A. niger.
3.4.2 Molecular relationships among Aspergillus niger, A. carbonarius and A. aculeatus
3.4.2.1 Evaluation of techniques
ERIC-PCR was the least informative technique for strain differentiation. Although the
three species clustered separately, subdivisions within those clusters did not
correspond with previously demonstrated differences such as N and T RFLP type for
A. niger, neither did subdivisions correspond with toxigenicity of the strains. The
species clusters were not robust, and changed if certain strains were removed from the
analysis (Esteban et al., 2005b). Hence, the grouping of Australian isolates of A. niger
into a single cluster was unlikely to be reliable and reproducible. In ERIC-PCR, a
relatively small proportion of the genome was surveyed through binding of the single
set of primers, resulting in 16 loci for analysis. Differences at these loci were not
representative of the genetic variation among black Aspergillus spp. In contrast,
analysis of RAPD with multiple primers surveyed a greater proportion of the genome
[122 loci analysed by Megnegneau et al. (1993), 59 loci analysed by Kevei et al.

- 76 -
(1996), 72 loci analysed by Fungaro et al. (2004b)]; thus, more meaningful molecular
data were generated.
AFLP was a fairly robust technique for the examination of strain relationships among
black Aspergillus spp., supported by bootstrap values over 75%. Two of the four
primer combinations used by researchers at ISPA, Italy were readily transferable to
the collection of strains in this study, and produced data that separated the three
species into distinct clusters, as well as separating the A. niger aggregate into N and T
RFLP types. Similar clustering was reported by researchers at ISPA for isolates
primarily from grapes (24 month report; http://www.ochra-wine.com, accessed
24/03/05). AFLP analysis of isolates, primarily from coffee, with selective primers
EcoRI-AT + MseI-CT was also capable of robust species separation; however, no
clustering within the A. niger aggregate, that could potentially correspond with the N /
T separation, was observed, as toxigenic isolates (likely to be type N) were distributed
among all the minor clusters within the aggregate (Schmidt et al., 2004). The RFLP
profiles of the isolates in that study were not reported; hence, the absence of a
potential type T cluster could be due to the omission of type T isolates from the
analysis.
This study represents the first characterisation (Esteban et al., 2005c) and use of
polymorphic microsatellite loci for the examination of molecular relationships among
strains of the A. niger aggregate. The relatively high numerical indices of
discriminatory power (Hunter, 1991) and observed heterozygosities (Nei, 1978)
(Table 3.4) demonstrated a level of diversity suitable for differentiation of isolates
within the same species. The amplification of these loci in certain isolates of A.
carbonarius and A. aculeatus, as well as limited sequencing data for the former
species, suggested that several of these microsatellite loci characterised for A. niger
may also be present within the genome of other black Aspergillus spp. So-called
“null” alleles in A. carbonarius and A. aculeatus, from which no amplicons were
detected, may have resulted from polymorphisms in the flanking regions to which the
primers anneal. Further refinements in primer design and PCR may increase the utility
of these microsatellite markers for analysis of inter- as well as intra-specific variation.
Low bootstrap support values for the microsatellite dendrogram likely arose due to the
relatively small number of loci examined, and the frequency of null alleles for certain

- 77 -
loci. Nevertheless, the strong homology between the microsatellite and AFLP
dendrograms suggests that the clustering generated by both these independent sources
of polymorphism accurately reflects the genetic relationships among the A. niger
aggregate isolates examined.
3.4.2.2 Significance
The various molecular techniques applied to the black Aspergillus spp. as a group are
considered robust only if they reliably differentiate between the species that are
clearly delineated by morphological techniques [reviewed by Varga et al. (2000b);
Abarca et al. (2004); Varga et al. (2004a)]. AFLP analysis fell into this category.
Although microsatellite markers were applicable only to the A. niger aggregate,
similar clustering in dendrograms derived from both AFLP and microsatellite data
confirmed the validity of these techniques. Given that sources of polymorphism in
AFLP and microsatellite analyses are independent, molecular relationships
demonstrated by both these techniques were likely to parallel the phylogenetic
relationships among the strains. The separation of the A. niger aggregate into two
groups corresponding to N and T RFLP types by both techniques strongly suggested
that these are two different species. This separation into two species, often called A.
niger and A. tubingensis, has been observed by RFLP analysis of ribosomal DNA,
mitochondrial DNA and chromosomal DNA, the latter followed by hybridisation with
probes; as well as RAPD, isoenzymes (Megnegneau et al., 1993; Fungaro et al.,
2004b) and sequencing [reviewed by Abarca et al. (2004)]. Sequencing of the
cytochrome b gene also divided the A. niger aggregate into two groups, however, it is
not apparent if the two proposed clades, A. niger and A. awamori (Yokoyama et al.,
2001) correspond with N and T types. Many of the studies in which clustering
corresponded with N and T types showed further subdivisions within these types,
hence the subdivision of our N type strains into two groups was not unexpected. An
area for future study would be the comparison of this subdivision with those reported
by means of RFLP techniques (Megnegneau et al., 1993; Varga et al., 1993, 1994;
Parenicová et al., 1997).
The lack of sub-groups among isolates of A. carbonarius is in keeping with reports
that this species displays less intra-specific variation than A. niger (Kevei et al., 1996;
Parenicová et al., 1996). Those authors observed some differences among A.

- 78 -
carbonarius strains based on RAPD and RFLP analysis of ribosomal and
mitochondrial DNA. Fungaro et al. (2004b) divided isolates of A. carbonarius from
coffee into two clusters, with one group comprising only toxigenic strains, and the
other, a mixture of toxigenic and non-toxigenic isolates. Schmidt et al. (2004) also
divided A. carbonarius isolates from coffee into two groups by AFLP, however, both
groups contained a mixture of toxigenic and non-toxigenic strains. No such clustering
was observed for the A. carbonarius isolates in this study, which were primarily from
Australian vineyards; rather, all isolates of A. carbonarius appeared to be closely
related.
Few associations between genetic relatedness and phenotype have been demonstrated
among black Aspergillus spp., apart from the absence of toxigenicity to date among
type T A. niger isolates. This absence of any association between toxigenicity and
molecular relatedness was observed in dendrograms based on ERIC-PCR, AFLP and
microsatellites, and has also been reported by Fungaro et al. (2004b) and Schmidt et al.
(2004). Clusters delimited within A. carbonarius or within the A. niger aggregate by
molecular techniques could not be differentiated by phenotypic analysis of carbon
utilization patterns (Kevei et al., 1996). In contrast, clusters in P. verrucosum based
on RAPD and AFLP analysis (Castellà et al., 2002) corresponded with those derived
from secondary metabolite profiles (Larsen et al., 2001), including degree of
toxigenicity, thus supporting the delineation of a separate species, P. nordicum.
Within A. ochraceus, certain clusters corresponded with toxigenicity (Varga et al.,
2000a), whereas others did not (Fungaro et al., 2004a). Mühlencoert et al. (2004)
proposed that the poor relationship observed at times between genotype and
toxigenicity may be due to environmental conditions suppressing toxin production in
certain strains. Development of novel conditions and additives to enhance OA
production during the screening of black Aspergillus spp. continues to be an area for
research.
No association between molecular relatedness and substrate or country of isolation
was observed for black Aspergillus spp. in this study, as Varga et al. (2000a) also
reported for A. ochraceus. Our findings support the belief that the black Aspergillus
spp. are cosmopolitan in their distribution over a range of substrates and locations
(Klich and Pitt, 1988).

- 79 -
3.4.3 Implications for viticulture and oenology
One motivation for elucidating the phylogeny of mycotoxigenic fungi using molecular
techniques is to search for similarities among toxigenic isolates. If present, such
similarities may potentially be exploited for the detection and/or reduction of that
specific group of isolates. Given the cosmopolitan nature of the black Aspergillus spp.
and the absence of any association between molecular relatedness and toxigenicity,
such an approach currently does not show potential for this group of fungi. Based on
current knowledge, it seems unlikely that management strategies can be designed to
selectively identify and minimise toxigenic isolates. Rather, management will focus
on reduction of the black aspergilli in vineyards overall, thus proportionally reducing
any toxigenic isolates which may be present [reviewed by Leong et al. (2005a)].
Another potential application of molecular techniques in the viticultural setting is in
the rapid detection of the toxigenic species in grapes and, by inference, some
estimation of OA likely to be present. PCR-based techniques are more rapid than
isolation, growth, identification and screening for toxin production on traditional
culture media; furthermore, expertise in identification of isolates based on
morphological characteristics is not required. Sensitive and specific PCR-assays for
the detection of A. carbonarius have been developed, some of which have also been
validated in artificially and naturally contaminated biological matrices (coffee beans)
(Fungaro et al., 2004b; Perrone et al., 2004; Schmidt et al., 2004; reviewed by Niessen
et al. (2005) for all ochratoxigenic fungi). However, a few key issues regarding the
use of molecular methods as a screening tool are highlighted below [reviewed by
Edwards et al. (2002); Varga et al. (2004b)].
First, the presence of the potentially toxigenic species on grapes does not necessarily
indicate the presence of toxin. As these fungi are ubiquitous in vineyards, they may be
present as dormant spores on berries without producing OA. It also follows that the
amount of fungal DNA is not necessarily indicative of the amount of OA present.
Schmidt et al. (2004) did not observe any relationship between the amount of A.
carbonarius template DNA in naturally infected coffee beans, as estimated by
fluorescence intensity of the amplicons on the gel, and OA concentration in the beans.
Second, species-specific PCR detects both toxigenic and non-toxigenic isolates, as
was the case for the PCR assays reported above for A. carbonarius. Attempts to

- 80 -
identify DNA sequences that were present only in toxigenic isolates were
unsuccessful (Fungaro et al., 2004b). It would be desirable to amplify toxigenic
isolates of both A. carbonarius and A. niger in the same assay. One strategy to
overcome this is to target genes directly involved in toxin synthesis. A correlation was
demonstrated between amount of DNA for a gene involved in trichothecene synthesis
in Fusarium spp., as quantified by real-time PCR, and the toxin deoxynivalenol in
wheat (Schnerr et al., 2002). None of the genes involved in OA synthesis in black
Aspergillus spp. have been identified, although some have been characterised for A.
ochraceus (O'Callaghan et al., 2003) and P. nordicum (Färber and Geisen, 2004).
These genera possibly possess different pathways for OA synthesis under different
regulatory mechanisms [reviewed by Niessen et al. (2005)]. An additional problem
with Aspergillus spp. is the likelihood that homologues of genes for toxin synthesis
exist in non-toxigenic strains, although this issue does not arise in genera such as
Fusarium [reviewed by Edwards et al. (2002)]. Furthermore, subtle differences in
gene sequences among related species may hinder development of a single test for
toxigenic isolates of both A. carbonarius and A. niger.
Third, although quantification of mRNA transcripts of genes involved in OA
synthesis in the black aspergilli would overcome many of the barriers described above,
environmental factors (temperature, water activity, pH) may differ in their influences
on gene regulation. In studies of the OA polyketide synthase gene in P. nordicum,
Geisen (2004) observed that changes in OA concentration in liquid medium coincided
with changes in the amount of mRNA, as affected by period of incubation and a range
of NaCl concentrations. However, changes in temperature which led to upregulation
of mRNA production did not always result in increased OA, thus, weakening the
predictive value of mRNA quantification.
At present, molecular techniques are unlikely to generate a rapid test for OA
contamination in grapes that could be used at receival in wineries. However, detection
of toxigenic species such as A. carbonarius could be helpful in identifying loads that
require further sampling and analysis to establish the presence and concentration of
OA. Development of a rapid and robust PCR-based identification system for toxigenic
isolates of A. carbonarius and A. niger may also have some application for the early
identification of these strains in Aspergillus bunch rots.

- 81 -
4 Survival, growth and toxin production by Aspergillus carbonarius and A. niger
4.1 Introduction
4.1.1 Effect of temperature, water activity and sunlight on survival of Aspergillus carbonarius spores
The black aspergilli are saprophytic and have been isolated from soils around the
world (Klich and Pitt, 1988; Varga et al., 1994). Thus it is no surprise, that, of the
multitude of potential substrates in vineyards, soil is the most frequent source of A.
carbonarius (Leong et al., 2005a). Black Aspergillus propagules probably overwinter
in soil. Preliminary studies have demonstrated that soil temperature and moisture
significantly affect the survival of A. carbonarius. Kazi et al. (2003b) inoculated soil
with A. carbonarius on milled oats as a carrier, and noted an optimum survival
temperature of 25 °C. Increasing the moisture content of the soil reduced survival of A.
carbonarius. When vineyards were irrigated, counts of A. carbonarius plummeted but
returned to pre-irrigation levels as the soil dried. Greater reductions were observed in
clay loam soils, which retain more moisture, than in sandy soils.
Spores are blown from soil onto the surface of berries (Leong et al., 2005b), where
particular relative humidities and temperatures may be deleterious. This, coupled with
exposure to UV radiation in sunlight, may affect the frequency of isolation of black
Aspergillus spp. from berries during maturation. In vineyards worldwide, these fungi
were isolated more frequently as berries mature (Nair, 1985; Battilani et al., 2003a;
Serra et al., 2003; Bellí et al., 2004c). However, geography and changes in
temperature and relative humidity also contributed to variations in fungal incidence
and OA contamination (Battilani et al., 2003a; Roset, 2003; Serra et al., 2003; Sage et
al., 2004; Battilani et al., 2005b; Bellí et al., 2005a; Serra et al., 2005a). Overhead
irrigation increased the relative humidity within the vine canopy and also the
frequency of isolation (N. Bellí, pers. comm. 23/09/03). The sporocidal effect of both
artificial and natural UV radiation (in sunlight) has been demonstrated for A. niger
spores (Rotem and Aust, 1991). Clumps of spores were more resistant than single
spores, and the melanised, thick-walled spores of A. niger were more resistant to UV
radiation than the hyaline, thin-walled spores of Botrytis cinerea. The resistance of A.
carbonarius to UV radiation has not been demonstrated, however, in A. carbonarius,

- 82 -
the spores are also melanised with thick walls, hence could be expected to show some
resistance.
Complex interactions between temperature, moisture and microbiota may play a role
in the survival of A. carbonarius in soil and on berry surfaces. By removing the
confounding factors of the soil matrix and the canopy environment, it is possible to
study in isolation the interaction between water activity and temperature on the
survival of A. carbonarius propagules. Interactions were observed over a range of
water activities (0.4-1.0) and temperatures (1-37 °C) likely to occur during the year in
Australian viticultural regions. A. carbonarius spores were also exposed to sunlight
and their survival noted over time.
4.1.2 Effect of temperature and water activity on growth and ochratoxin A production by Aspergillus carbonarius and A. niger
In the right conditions, spores on berry surfaces germinate and grow. Once A.
carbonarius has penetrated the berry, temperature and water activity play a major role
in regulating fungal growth and toxin production.
Several researchers have noted that OA is more frequently detected in wines from
warmer regions (generally, southern Europe) than in wines from cooler regions
(section 1.3). Battilani et al. (2003a) and Serra et al. (2003) reported increased
incidence of OA in wine grapes from regions subject to warm, humid conditions or
during warm, humid seasons. OA was absent from grapes grown in cool, dry climates.
Such observations do not distinguish between the potential effects of temperature and
water activity on incidence of toxigenic fungi in the environment, infection processes,
growth and toxin production, nevertheless, examining the latter two factors in
isolation is worthwhile. Temperatures differ among viticultural regions, among
seasons, during stages of berry maturation and, for dried vine fruit production, during
drying. Water activity within the berry decreases during maturation upon
accumulation of berry sugars, and further decreases when berries are dried.
Understanding the potential for OA production during drying is critical for
minimising contamination of dried grapes. Bucheli et al. (2000) observed OA
production during drying of coffee cherries and Joosten et al. (2001) studied OA

- 83 -
production in coffee cherries by A. carbonarius, but few data are available regarding
OA production during drying of grapes.
To date, few studies have characterised the effects of temperature and/or water
activity on OA directly in grapes (Battilani et al., 2004). However, effects have been
studied on a synthetic grape juice medium (SGM) designed to simulate grape juice
during early veraison. The growth and toxigenicity of isolates of A. carbonarius and A.
niger from vineyards in Europe and Israel have been characterised on SGM within a
matrix of temperatures and water activities (Battilani et al., 2003c; Mitchell et al.,
2003, 2004; Bellí et al., 2004b,d, 2005b). The effect of temperature on growth of
Australian isolates of A. niger and A. carbonarius has been reported (Leong et al.,
2004); however, these isolates were from a single viticultural region, and significant
intra-specific variation has been reported in European studies. Furthermore, isolates
were grown on a standard mycological medium, CYA, which would not reflect the
potential for growth and OA production in grapes. Choice of medium has a significant
effect on OA production (Bragulat et al., 2001).
The aim of the experiment reported here was to characterise growth and OA
production by Australian isolates of A. carbonarius and A. niger on SGM at various
temperatures and water activities, in order to compare the growth and toxigenic
potential of Australian isolates with those from Europe. Reports of the time taken to
reach maximum toxin production on SGM are contradictory. For example, Bellí et al.
(2004d) observed that OA maxima at 25 °C and water activity above 0.98 always
occurred at 5 d of incubation, whereas Mitchell et al. (2004) suggested that 10 d was
more appropriate for testing over a range of water activities and temperatures. Both
authors noted a decrease in OA after the maximum, suggesting degradation of the
toxin, a metabolic process which has previously been observed for black Aspergillus
spp. (Varga et al., 2000c; Abrunhosa et al., 2002; Varga et al., 2002). Understanding
the pattern of OA production, as well as the potential for subsequent degradation, may
aid in decisions regarding crops affected by Aspergillus bunch rot.

- 84 -
4.2 Effect of temperature, water activity and sunlight, on survival of Aspergillus carbonarius spores
4.2.1 Methods
4.2.1.1 Effect of temperature and water activity
A. carbonarius isolates from grapes in the Sunraysia region, Victoria (FRR 5374,
FRR 5573, FRR 5574, previously described by Leong et al. (2004)) were grown on
CYA in the dark at 25 °C for 8 d in a preliminary experiment, and for 11 d when the
trial was repeated, after which spores were harvested as described in section 2.3. The
spore suspension was diluted in cold, sterile water containing 0.05% (w/v) Tween-80®
to give a final concentration of 4-5 x 10⁵ spores/mL. The volume of suspension
prepared was 2-5 L, and this was mixed in a large beaker with a magnetic stirrer.
Aliquots (10 mL) of spore suspension were filtered under vacuum onto individual
sterile filter membranes (pore size 0.45 µm, 40 mm diameter, mixed cellulose esters;
Millipore, Billerica, MA, USA). The membranes were placed into 9 cm plastic Petri
dishes with the lids removed and dried at 37 °C for 60-120 min, then the lids were
replaced until use.
Small bowls of saturated salt solutions were placed in closed plastic boxes and
allowed to equilibrate at the temperatures shown in Table 4.1 to generate
environments of particular water activities. The Petri dishes holding the filters were
uncovered, and were placed in the boxes in such a way that no dish was covered, that
is, the airspace above each filter was contiguous with the air above the saturated salt
solution. Salt solutions were refilled as required. Eighteen filters were prepared at
each water activity x temperature combination.
To establish the initial spore load, 40 filters were sampled prior to incubation. During
incubation, filters were sampled in triplicate at intervals up to 618 d. Given that 18
filters were incubated in each condition, each water activity x temperature
combination could be sampled a maximum of six times. At each sampling point,
spores were dislodged from membranes into 100 mL sterile peptone solution using the
stomacher and A. carbonarius colonies were enumerated as described in section 2.1.
Samples were taken less frequently in conditions that were likely to extend survival of
the spores, and were taken more frequently when a decrease in viable spore count was

- 85 -
observed. Where counts were expected to be small, colonies were enumerated on
filters directly plated onto DRBC.
Due to irregular sampling points, these data were not amenable to statistical analysis.
Table 4.1: Saturated solutions and water activities generated at various temperatures
Saturated salt solutions and resultant water activities Desired water activity 1 °C 15 °C 25 °C 37 °C
1.00 (moist) water water water water 0.90 BaCl2
0.920a BaCl2 0.911a
BaCl2 0.900b
BaCl2 0.893a
0.80 (NH4)2SO4
0.825b (NH4)2SO4
0.810b (NH4)2SO4
0.800b (NH4)2SO4
0.790d 0.60 Na2Cr2O7
0.595b NaBr 0.610b
NH4NO3 + AgNO3 0.615b
NaNO2 0.615d
0.40 CaCl2 0.400b
NaI 0.409c
K2CO3 0.430b
K2CO3 0.400d
a calculated from Young (1967) b Winston and Bates (1960) c Greenspan (1977) d values from Winston and Bates (1960) for solutions at 40 °C
4.2.1.2 Effect of sunlight
A. carbonarius isolates (FRR 5374, FRR 5573, FRR 5574, as for section 4.2.1.1) were
grown on CYA in the dark at 25 °C for 7 d. Spores were harvested as described in
section 2.3 and lodged on filter membranes as described in section 4.2.1.1. Each
membrane was placed into a closed 9 cm diameter plastic Petri dish and dried at 37 °C
overnight.
The Petri dishes were supported on metal racks, the lids removed, and the filter
membranes exposed to direct sunlight outdoors, including cloudy days when UV
radiation was less intense. The first experiment conducted over 5 d was curtailed
when rain wet the filters. When the experiment was repeated, UV radiation was less
intense hence the exposure period was extended to 9 d. Controls comprised
membranes covered with aluminium foil to shield the spores from sunlight while
undergoing temperature fluctuations similar to the test membranes. The estimated UV
radiation (290-400 nm) for each day was obtained from the Australian Bureau of
- 86 -
Meteorology website (http://www.bom.gov.au/weather/nsw/forecasts.shtml, accessed
12/03-04/04). At each sampling point, two test membranes and a single control
membrane were randomly collected from each of the three replicate racks. Spores
were dislodged from membranes into 100 mL sterile peptone solution using the
stomacher and A. carbonarius colonies were enumerated as described in section 2.1.
Where counts were expected to be small, colonies were enumerated on filters directly
plated onto DRBC. Due to irregular sampling points, these data were not amenable to
statistical analysis.
4.2.2 Results
4.2.2.1 Temperature and water activity
The effects of water activity and temperature on the survival of spores of A.
carbonarius are shown in Fig. 4.1. The limit of detection was 500 cfu/filter. When no
colonies were detected by this method, an arbitrary value of half the detection limit
was assigned (250 cfu/filter). If available, additional filters were directly plated onto
DRBC to assess for the presence of any viable spores, hence the presentation of some
data of less than 100 cfu/filter.
Over the range of water activities, 37 °C did not support the survival of A.
carbonarius spores; as the temperature decreased, spores survived for longer periods.
At 1 °C, spores survived for well over a year at 0.9 aw and below. The relationship
between water activity and survival was more complex. It was evident that the lowest
water activity, 0.4, best supported the survival of spores over the temperatures
examined, but the converse, that the highest water activity was most deleterious, did
not hold true. Survival at 0.9 and 0.8 aw at temperatures above 15 °C appeared to be
poorer than survival at 1.0 aw, although there was insufficient material to assess long-
term survival at 1.0 aw / 15 °C and 1.0 aw / 25 °C. Water activity 0.6 also was not
conducive for long term survival and, at 37 °C, decline in viable spores occurred most
rapidly at 0.6. Of note was the effect of moisture (1.0 aw) on long term survival at 1
°C. A gradual decrease in spore viability was observed during both experiments A and
B. Similarly, towards the end of the experiment, a decrease in viability at 1 °C and 0.9
aw was observed. There were no decreases in viability at lower water activities.
Complex relationships between temperature and water activity clearly affect the
survival of spores.

- 87 -
Figure 4.1: Effect of water activity and temperature on survival of Aspergillus carbonarius spores on filter membranes. The experiment was conducted twice (A, B). Mean of counts from three replicate 40 mm diameter filter membranes. Error bars denote the standard error of the mean
1
10
100
1,000
10,000
100,000
1,000,000
10,000,000
0 100 200 300 400 500 600
Time (d)
0.9
1
10
100
1,000
10,000
100,000
1,000,000
10,000,000
0 100 200 300 400 500 600
Time (d)
0.81
10
100
1,000
10,000
100,000
1,000,000
10,000,000
0 100 200 300 400 500 600
Time (d)
0.6
1
10
100
1,000
10,000
100,000
1,000,000
10,000,000
0 100 200 300 400 500 600
Time (d)
0.4
A.
carb
on
ari
us c
ou
nt
(cfu
/filte
r)
1
10
100
1,000
10,000
100,000
1,000,000
10,000,000
0 100 200 300 400 500 600
Time (d)
1 ºC, A
15 ºC, A
25 ºC, A
37 ºC, A
1 ºC, B
15 ºC, B
25 ºC, B
37 ºC, B
1.0

- 88 -
4.2.2.2 Sunlight
Spores of A. carbonarius supported on filter membranes were killed by exposure to
sunlight (Fig. 4.2) and also became lighter in colour, compared with covered spores
(Fig. 4.3). The rate of decline was greater when the experiment was repeated (B) over
9 d, when a large decrease (over 105) in spore viability was observed after 10 mWh
cumulative exposure to UV radiation. Only a small part of this decrease
(approximately 15%) was attributed to wind blowing a proportion of spores from the
filter membranes (estimated from Fig. 4.3).
1
10
100
1,000
10,000
100,000
1,000,000
10,000,000
0 2 4 6 8 10 12
Cumulative UV exposure (mWh)
Sun A
Control A
Sun B
Control B
Figure 4.2: Survival of Aspergillus carbonarius spores on filter membranes exposed to sunlight. Cumulative UV exposure quoted for 290-400 nm. The experiment was conducted twice (A, B). Control plates were shielded with aluminium foil. Mean of counts from 40 mm diameter filter membranes on three replicate racks; error bars denote the standard error of the mean (at each time point, two filters exposed to sunlight plus one control per rack were sampled)
A.
carb
on
ari
us c
ou
nt
(cfu
/filte
r)

- 89 -
Figure 4.3: Bleaching of Aspergillus carbonarius spores on filter membranes exposed to sunlight for 9 d (left) compared with covered spores (right). (Photograph taken through a Leica Wild M3C stereomicroscope, magnification x 16 (Heerbrugg, Switzerland) with direct illumination (Intrulux®500, Switzerland))
4.3 Effect of temperature and water activity on growth and ochratoxin A production by Aspergillus carbonarius and A. niger
4.3.1 Methods
4.3.1.1 Medium preparation
Glycerol was added to SGM (modified from Mitchell et al. (2003); Bellí et al. (2004b);
Appendix A) to generate water activities of 0.965, 0.95 and 0.92 (glycerol added at
54.64 g/L, 108.21 g/L and 218.00 g/L, respectively). The water activity of unadjusted
SGM was 0.98, as determined using an Aqualab CX3 water activity meter (Decagen
Devices, Inc., Pullman, Washington, USA). Media were prepared in 5 L volumes
(S9000, AES Laboratoire, Combourg, France) and 20 mL were delivered into 9 cm
diameter plastic Petri dishes by an automatic plate pourer (APS300, AES Laboratoire,
Combourg, France). Plates were allowed to dry at room temperature for 4 hours, after
which plates of the same water activity were sealed in plastic sleeves and stored at 4
°C until use.

- 90 -
4.3.1.2 Preparation of inoculum
Ochratoxigenic isolates of A. carbonarius (FRR 5682, FRR 5690, FRR 5691, FRR
5692, FRR 5693) and A. niger (FRR 5694, FRR 5695) from Australian vineyards
were selected to represent genetically distinct strains (Fig. 3.6) from different
viticultural regions (Table 3.3). Strong producers of OA and atypical weak producers
were assessed. Isolates were grown on SGM in the dark at 25 °C for 7 d. For each
isolate, a spore suspension was prepared as described in section 2.3 in sterile glycerol
solution (60% w/w). The suspension was filtered through sterile glass wool to remove
hyphal fragments, and was diluted in additional glycerol solution to a concentration of
approximately 105 spores/mL. Aliquots (1 mL) of the suspension were stored in sterile
Eppendorf tubes at -80 °C until use.
4.3.1.3 Inoculation and incubation
SGM plates were allowed to equilibrate at room temperature overnight and the spore
suspensions thawed and mixed by vortexing. The spore suspension (5 µL) was
delivered to the centre of the plate using an automatic pipette (Genex Beta, Finland)
with sterile plugged pipette tips to avoid cross-contamination. Inoculations were
performed on duplicate plates for replicates A and B, and on triplicate plates for
replicate C. Replicates A, B and C were set up on three consecutive days, and freshly
thawed aliquots of spore suspension were used for each replicate. The edge of each
plate was sealed with low density polyethylene film (Cling Wrap, Homebrand,
Woolworths, Yennora, NSW, Australia) to minimise moisture loss while allowing
free gaseous exchange. Plates of the same water activity were incubated in low
density polyethylene bags (Cospak, Minto, NSW, Australia) in stacks of no more than
seven Petri dishes. Plates were incubated at 15 °C, 25 °C, 30 °C and 35 °C, thus
yielding a full factorial design of four temperatures x four water activities x seven
isolates. Uninoculated plates were incubated in identical conditions and no change in
water activity was observed after 15 d.
4.3.1.4 Growth and estimation of ochratoxin A
In order to calculate the linear growth rate of each isolate under each condition,
colony diameter was recorded for every plate at intervals appropriate to the growth
rate of that isolate. Isolates incubated at 30 °C and 35 °C were measured up to three
times daily, whereas isolates incubated at 15 °C were measured every 2-3 d. Linear

- 91 -
growth rates were calculated by plotting radial extension (mm) against time (d).
Growth rates were analysed as described in section 2.6.
OA production on SGM was assessed by the agar plug method described in section
2.4. Samples were taken in order to estimate the maximum OA yield under each
condition; hence, sampling ceased after a decline in OA production was observed.
Additional samples were taken at time points of interest for A. carbonarius isolates
FRR 5690 and FRR 5692 and A. niger isolate FRR 5694, as these isolates produced
more OA than the other isolates tested. Sampling ceased after 36 d. Agar plugs were
weighed in order to calculate OA yield per gram of medium.
Contour plots for mean growth rate and mean maximum OA yield over the range of
water activities and temperatures examined were prepared in Sigmaplot (v 9.01,
Systat Software, Inc., Point Richmond, CA, USA).
4.3.2 Results
4.3.2.1 Growth
The interaction between temperature, water activity and isolate was highly significant
(P < 0.001); hence, the main effects were not tested independently. Growth rates for
all the isolates are listed in Table 4.2. The maximum growth rate achieved was 11.35
mm/d by A. niger isolate FRR 5695 at 0.98 aw and 35 °C. The minimum growth rate
observed in this study was 0.27 mm/d, calculated for A. carbonarius FRR 5682 at
0.92 aw and 15 °C. Growth by A. niger isolates was significantly faster (P < 0.05) than
growth by A. carbonarius isolates at 30 °C and 35 °C over the range of water
activities examined, whereas at 20 °C and 15 °C, growth achieved by some isolates of
both species was similar at most water activities. Some significant differences in
growth rate were observed between the five isolates of A. carbonarius at 25 °C and
above, whereas the growth rates of the two isolates of A. niger were generally similar,
except at 35 °C at all water activities and, at 30 °C and 25 °C at 0.98 aw only. No
single isolate grew significantly faster or slower than other members of the same
species in every condition, although A. carbonarius FRR 5692 and A. niger FRR 5694
grew fastest in most conditions.

- 92 -
Between 15 °C and 30 °C, growth rate increased significantly with temperature for all
isolates. Growth for most isolates of A. carbonarius was significantly greater at 30 °C
than 25 °C, whereas for A. niger at most water activities, growth at 35 °C was
approximately equal to or greater than that displayed at 30 °C. Growth for all isolates
was significantly greater at water activity 0.95 than 0.92, and generally increased with
increasing water activity, though, above 0.95 aw, these increases were not significant
for every isolate over the 0.15 aw increment. At 35 °C, three isolates of A. carbonarius
grew more slowly at 0.98 aw than at 0.965.
These trends are summarised in Fig. 4.4, where data for all isolates of each species are
combined. Most rapid growth for A. carbonarius isolates occurred around 0.965 aw
and 30 °C, whereas for A. niger isolates, most rapid growth observed within the
parameters of this trial occurred at 0.98 aw and 35 °C.
4.3.2.2 Ochratoxin A production
Whereas growth maxima were observed at 30 °C and above and at 0.965 aw and
above for both species, maxima for OA production were observed at the lowest
temperature tested, 15 °C, and around 0.96 aw for A. carbonarius and 0.95 aw for A.
niger (Fig. 4.4). For A. carbonarius, temperatures between 15 °C and 25 °C favoured
OA production at higher water activities (0.965-0.98), whereas for A. niger, the most
OA was produced at 0.95 aw regardless of temperature. OA was produced by all
isolates at 0.92 aw at 15 °C; however, little OA was produced at this water activity as
the temperature increased. Relatively little OA was produced above 30 °C at any
water activity.
The isolates examined showed varying abilities to produce OA (Fig. 4.5). The
maximum OA produced was 21 µg/g, by A. carbonarius FRR 5692 at 0.95 aw and 15
°C after 15 d, whereas the maximum OA produced by an isolate of A. niger was 15
µg/g (FRR 5694), in the same conditions. Maximum OA production occurred at 0.95
or 0.965 aw, 15 °C and after 15 d for all isolates, except for A. niger FRR 5695, when
the maximum was observed after 22 d.
Production of OA over time is shown in Fig. 4.6, indicating a strong trend for all
strains in nearly all conditions tested to produce OA up to a maximum, followed by a

- 93 -
decrease in OA concentration over time. As noted previously, maximum toxin
production generally occurred at 15 °C, however, A. carbonarius isolates FRR 5682,
FRR 5690 and FRR 5692 produced comparable levels of OA at 25 °C and higher
water activities. These three isolates were relatively strong OA producers (Fig. 4.5). It
was demonstrated that, at the higher water activities and lower temperatures which
favoured maximum toxin production, OA could also be degraded rapidly, with well
over half the toxin degraded within 5-7 d of the observed maximum. The trends for
OA production and degradation at 30 °C and 35 °C are not visible in Fig. 4.6, as
relatively little OA was produced. An exception to this general trend of OA
production and degradation was A. niger isolate FRR 5695 at 0.98 or 0.965 aw and 15
°C, where OA increased until the final sampling point at 22 d. Isolates incubated at 15
°C and 0.92 aw accumulated OA until 36 d when the trial ended. Germination and
growth in these conditions were slow; hence, it was several days before visible
colonies could be sampled for analysis.
Trends in maximum OA production could not be linked to a specific time, due to the
strong effect of temperature on germination and growth rate; namely, isolates at 15 °C
produced maximum OA after a longer period than isolates at 25 °C (10-15 d cf 5 d)
(Fig. 4.6). To remove the confounding effect of growth rate, the relationship between
OA concentration and colony size is shown in Fig. 4.7 for the three most toxigenic
isolates in this trial. Data for 0.92 aw and 35 °C are not shown as little OA was
produced in these conditions. For the two isolates of A. carbonarius, OA at 10-100%
of the maximum was primarily observed at 15 °C and 25 °C. Maximum OA for every
condition occurred when the colony radius was roughly 13-20 mm, after which OA
reached a plateau and/or decreased. A radius of 20 mm represents colonisation of
approximately 25% of the agar surface. This growth was achieved in less than 5 d at
30 °C, but took 10-15 d at 15 °C. For the same extent of growth, OA yield at 30 °C
was far less than at 15 °C. A. niger FRR 5694 showed trends slightly different from
the two isolates of A. carbonarius. OA at 10-100% of the maximum was only
observed at 15 °C and, as for A. carbonarius, maximum OA occurred when the
colony radius was roughly 13-20 mm. Less OA was produced at 25 °C and 30 °C;
however, OA continued to accumulate until the colony radius was greater than 30 mm
at 30 °C and until the medium was fully colonised at 25 °C.

Table 4.2: Effect of water activity and temperature on linear growth rates (mm/d) of Aspergillus carbonarius and A. niger
Isolate A. carbonarius A. niger
Wat
er
acti
vity
Tem
pera
ture
FRR 5682a FRR 5690 FRR 5691 FRR 5692 FRR 5693 FRR 5694 FRR 5695
15 °C 0.27b ± 0.001c 0.50 ± 0.011 0.40 ± 0.021 0.65 ± 0.011,2 0.31 ± 0.011 1.09 ± 0.012 1.05 ± 0.012
25 °C 2.21 ± 0.045,6,7,8,9
2.59 ± 0.039,10,11
2.96 ± 0.0510,11,12
3.67 ± 0.0114,15
3.03 ± 0.0612,13
4.48 ± 0.0317,18,19,20
4.87 ± 0.0219,20,21,22
30 °C 3.24 ± 0.0612,13,14
3.25 ± 0.0112,13,14
3.95 ± 0.0315,16
4.25 ± 0.0616,17,18
3.12 ± 0.0312,13
6.62 ± 0.0239,40,41
6.38 ± 0.0237,38,39,40
0.92
35 °C 2.57 ± 0.098,9,10
2.41 ± 0.037,8,9
3.43 ± 0.0513,14
3.02 ± 0.0411,12,13
3.02 ± 0.0211,12,13
7.23 ± 0.0442,43,44
5.84 ± 0.1028,29,30,31,
32,33,34,35
15 °C 1.68 ± 0.013 1.68 ± 0.003 1.78 ± 0.023,4 1.96 ± 0.023,4,5,6
1.85 ± 0.013,4,5
1.85 ± 0.013,4,5
1.87 ± 0.003,4,5
25 °C 4.37 ± 0.0116,17,18
4.64 ± 0.0118,19,20,21
5.13 ± 0.0222,23,24
5.99 ± 0.0831,32,33,34,
35,36,37,38
5.34 ± 0.0723,24,25,26,
27
5.57 ± 0.0825,26,27,28,
29,30,31
5.69 ± 0.1026,27,28,29,
30,31,32,33
30 °C 5.99 ± 0.0331,32,33,34,
35,36,37,38
5.55 ± 0.0224,25,26,27,
28,29,30
6.36 ± 0.0337,38,39,40
7.00 ± 0.0741,42,43,44
7.34 ± 0.1644,45
8.03 ± 0.0246 7.92 ± 0.3346
0.95
35 °C 5.19 ± 0.0222,23,24,25
4.98 ± 0.0521,22
5.76 ± 0.0227,28,29,30,
31,32,33,34
5.54 ± 0.0923,24,25,26,
27,28,29,30
5.69 ± 0.0226,27,28,29,
30,31,32,33
9.27 ± 0.0248 7.90 ± 0.0746
- 94 -

15 °C 1.98 ± 0.023,4,5,6,7
2.01 ± 0.013,4,5,6,7
2.06 ± 0.013,4,5,6,7
2.32 ± 0.036,7,8,9
2.02 ± 0.023,4,5,6,7
2.01 ± 0.013,4,5,6,7
2.18 ± 0.044,5,6,7,8,9
25 °C 4.47 ± 0.0717,18,19
5.13 ± 0.0222,23
5.48 ± 0.0623,24,25,26,
27,28,29
6.30 ± 0.0136,37,38,39
5.85 ± 0.0528,29,30,31,
32,33,34,35
5.63 ± 0.0926,27,28,29,
30,31
5.62 ± 0.0425,26,27,28,
29,30,31
30 °C 6.79 ± 0.0740,42,42
5.87 ± 0.0429,30,31,32,
33,34,35,36
6.88 ± 0.0141,42,43
7.69 ± 0.0245,46
7.92 ± 0.2246 8.51 ± 0.0547 8.81 ± 0.0247
0.965
35 °C 5.58 ± 0.0225,26,27,28,
29,30,31
5.66 ± 0.0726,27,28,29,
30,31,32
5.96 ± 0.0830,31,32,33,
34,35,36,37,38
6.20 ± 0.0235,36,37,38,
39
6.09 ± 0.0232,33,34,35,
36,37,38
9.60 ± 0.0248,49
8.78 ± 0.0747
15 °C 1.95 ± 0.013,4,5,6
2.17 ± 0.044,5,6,7,8,9
2.16 ± 0.014,5,6,7,8,9
2.31 ± 0.016,7,8,9
2.31 ± 0.016,7,8,9
2.21 ± 0.004,5,6,7,8,9
2.15 ± 0.004.5,6,7,8
25 °C 4.18 ± 0.0416,17
5.42 ± 0.0423,24,25,26,
27,28
5.20 ± 0.0722,23,24,25
6.15 ± 0.0234,35,36,37,
38
5.95 ± 0.0730,31,32,33,
34,35,36,37
5.49 ± 0.0423,24,25,26,
27,28,29
6.12 ± 0.0533,34,35,36,
37,38
30 °C 5.82 ± 0.1228,29,30,31,
32,33,34,35
5.95 ± 0.0230,31,32,33,
34,35,36,37
6.39 ± 0.0538,39,40
7.27 ± 0.0443,44,45
7.42 ± 0.0944,45
8.51 ± 0.0647 9.29 ± 0.0448
0.98
35 °C 5.70 ± 0.2126,27,28,29,
30,31,32,33
4.87 ± 0.0820,21,22
5.29 ± 0.1922,23,24,25,
26
6.10 ± 0.0533,34,35,36,
37,38
5.34 ± 0.0323,24,25,26,
27
11.35 ± 0.0650
9.76 ± 0.0249
a FRR culture collection, Food Science Australia, North Ryde, NSW, Australia b standard error of mean from three replicate growth rates cgrowth rates with different superscript numerals differ significantly, calculated according to Tukey’s “honestly significant difference” (P < 0.01) (http://faculty.vassar.edu/lowry/ch14pt2.html, accessed 01/05; critical values for the Studentized range were estimated using http://calculators.stat.ucla.edu/studrange.php, accessed 01/05)
- 95 -
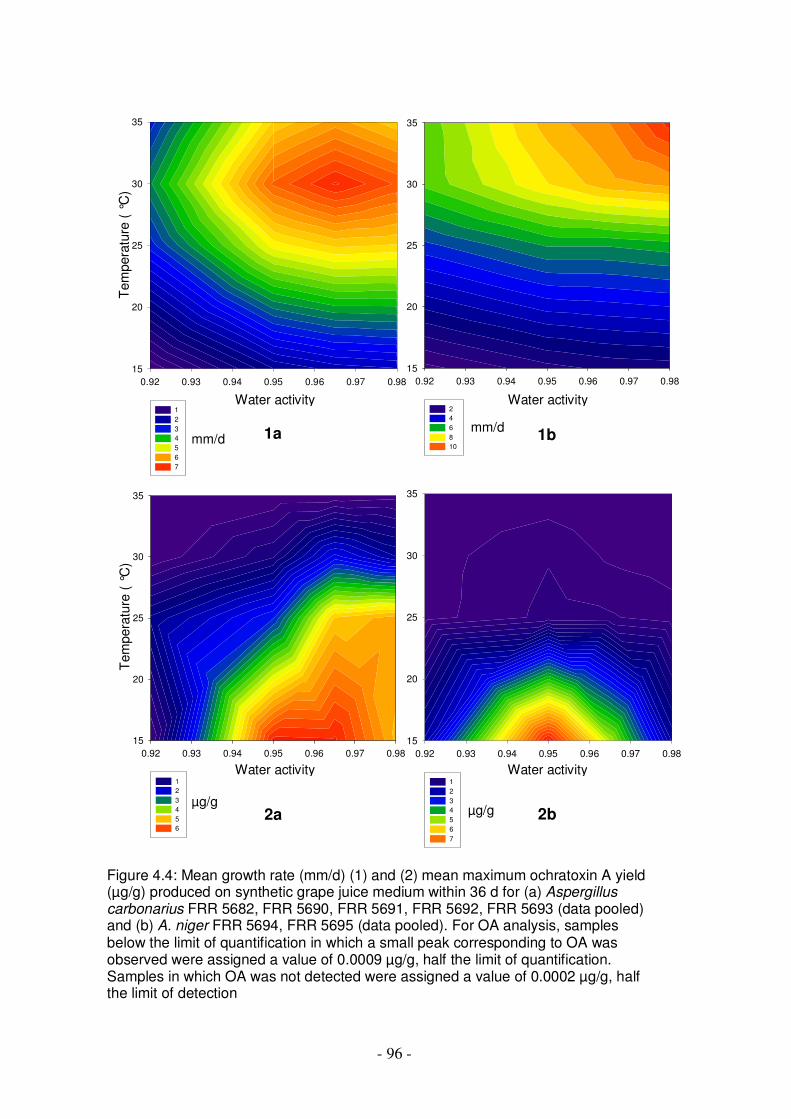
- 96 -
Figure 4.4: Mean growth rate (mm/d) (1) and (2) mean maximum ochratoxin A yield (µg/g) produced on synthetic grape juice medium within 36 d for (a) Aspergillus carbonarius FRR 5682, FRR 5690, FRR 5691, FRR 5692, FRR 5693 (data pooled) and (b) A. niger FRR 5694, FRR 5695 (data pooled). For OA analysis, samples below the limit of quantification in which a small peak corresponding to OA was observed were assigned a value of 0.0009 µg/g, half the limit of quantification. Samples in which OA was not detected were assigned a value of 0.0002 µg/g, half the limit of detection
0.92 0.93 0.94 0.95 0.96 0.97 0.98
15
20
25
30
35
1
2
3
4
5
6
7
0.92 0.93 0.94 0.95 0.96 0.97 0.98
15
20
25
30
35
1
2
3
4
5
6
0.92 0.93 0.94 0.95 0.96 0.97 0.98
15
20
25
30
35
2
4
6
8
10
0.92 0.93 0.94 0.95 0.96 0.97 0.98
15
20
25
30
35
1
2
3
4
5
6
7
Tem
pera
ture
( °
C)
1a
2a
1b
2b
Water activity Water activity
Water activity Water activity
Tem
pera
ture
( °
C)
mm/d mm/d
µg/g µg/g

- 97 -
0
5
10
15
20
25
FRR
5682
FRR
5690
FRR
5691
FRR
5692
FRR
5693
FRR
5694
FRR
5695
------ 0.965, 15 d ------ -------- 0.95, 15 d ------- 0.95, 22 d
----------------- A. carbonarius ----------------- -- A. niger --
Figure 4.5: Maximum ochratoxin A produced by isolates of Aspergillus carbonarius and A. niger on synthetic grape juice medium. Maximum OA was produced at 15 °C, in conditions as noted below the x-axis. Isolates with OA maxima at water activity 0.965 are shown in orange; those maxima at 0.95 are shown in green. Error bars denote the standard error of the mean of three replicates
OA
(µ
g/g
)

Perc
enta
ge
of m
axim
um
OA
yie
ld
0%
20%
40%
60%
80%
100%
120%
0 5 10 15 20 25 30 35 40
Time (d)
0.965
0%
20%
40%
60%
80%
100%
120%
0 5 10 15 20 25 30 35 40
Time (d)
0.965
0%
20%
40%
60%
80%
100%
120%
0 5 10 15 20 25 30 35 40
Time (d)
15 ºC, FRR 5682
15 ºC, FRR 5690
15 ºC, FRR 5691
15 ºC, FRR 5692
15 ºC, FRR 5693
25 ºC, FRR 5682
25 ºC, FRR 5690
25 ºC, FRR 5691
25 ºC, FRR 5692
25 ºC, FRR 5693
30 ºC, FRR 5682
30 ºC, FRR 5690
30 ºC, FRR 5691
30 ºC, FRR 5692
30 ºC, FRR 5693
35 ºC, FRR 5682
35 ºC, FRR 5690
35 ºC, FRR 5691
35 ºC, FRR 5692
35 ºC, FRR 5693
A. carbonarius
0.98
0%
20%
40%
60%
80%
100%
120%
0 5 10 15 20 25 30 35 40
Time (d)
15 ºC, FRR 5694
15 ºC, FRR 5695
25 ºC, FRR 5694
25 ºC, FRR 5695
30 ºC, FRR 5694
30 ºC, FRR 5695
35 ºC, FRR 5694
35 ºC, FRR 5695
A. niger
0.98
- 98 -

0%
20%
40%
60%
80%
100%
120%
0 5 10 15 20 25 30 35 40
Time (d)
0.92
0%
20%
40%
60%
80%
100%
120%
0 5 10 15 20 25 30 35 40
Time (d)
0.92
Perc
enta
ge
of m
axim
um
OA
yie
ld
0%
20%
40%
60%
80%
100%
120%
0 5 10 15 20 25 30 35 40
Time (d)
A. carbonarius
0.95
0%
20%
40%
60%
80%
100%
120%
0 5 10 15 20 25 30 35 40
Time (d)
A. niger
0.95
Figure 4.6 (including facing page): Ochratoxin A production by Aspergillus carbonarius and A. niger on synthetic grape juice medium over time at various temperatures and water activities, expressed as a proportion of the maximum OA yield for each isolate (Fig. 4.5). Error bars denote the standard error of the mean of three replicates
- 99 -

- 100 -
0%
1%
10%
100%
0 5 10 15 20 25 30 35 40 45
Colony radius (mm)
15 ºC, 0.95
25 ºC, 0.95
30 ºC, 0.95
15 ºC, 0.965
25 ºC, 0.965
30 ºC, 0.965
15 ºC, 0.98
25 ºC, 0.98
30 ºC, 0.98
a
0%
1%
10%
100%
0 5 10 15 20 25 30 35 40 45
Colony radius (mm)
15 ºC, 0.95
25 ºC, 0.95
30 ºC, 0.95
15 ºC, 0.965
25 ºC, 0.965
30 ºC, 0.965
15 ºC, 0.98
25 ºC, 0.98
30 ºC, 0.98
b
0%
1%
10%
100%
0 5 10 15 20 25 30 35 40 45
Colony radius (mm)
15 ºC, 0.95
25 ºC, 0.95
30 ºC, 0.95
15 ºC, 0.965
25 ºC, 0.965
30 ºC, 0.965
15 ºC, 0.98
25 ºC, 0.98
30 ºC, 0.98
c
Figure 4.7: Ochratoxin A production by (a) Aspergillus carbonarius FRR 5690, (b) A. carbonarius FRR 5692 and (c) A. niger FRR 5694 on synthetic grape juice medium at various colony sizes for three temperatures and three water activities, expressed as a proportion of the maximum OA yield for each species (Fig. 4.5) and plotted on a logarithmic scale. Error bars denote the standard error of the mean of three replicates. Where two successive samples were taken on fully colonised plates, the first sample was plotted at radius 40 mm and the second at radius 41 mm
Perr
ce
nta
ge o
f m
axim
um
OA
yie
ld
Perr
ce
nta
ge o
f m
axim
um
OA
yie
ld
Perr
ce
nta
ge o
f m
axim
um
OA
yie
ld
- 101 -
4.4 Discussion
4.4.1 Survival of Aspergillus carbonarius spores
The effects of temperature and water activity on survival of A. carbonarius spores can
be broadly summarised by the observation that survival was prolonged at low
temperatures and at water activity below 0.6. Little data are available regarding the
effect of temperature and water activity on survival and subsequent germination of A.
carbonarius; however, germination data for the related species, A. niger, may provide
some indication of the limits for black Aspergillus spp. in general. Snow (1949) and
Reiss (1986) reported germination limits of 0.84 aw and 10 °C for A. niger, whereas
Ayerst (1969) reported germination down to 0.78 aw. Given that A. carbonarius seems
less tolerant of low water activity than A. niger, as demonstrated by the slower growth
of A. carbonarius at 0.92 aw, it is reasonable to assume that A. carbonarius would not
germinate at water activity below that of the limit for A. niger (0.78 aw), and would be
dormant below this limit. Mitchell et al. (2004) observed that 0.88 aw was the limit of
growth for many strains of A. carbonarius. The longevity of A. carbonarius spores at
low water activities and temperatures could be attributed to exogenous dormancy.
Temperatures above the optimum for growth generally represent a stress for fungi. A.
carbonarius grew at 35 °C in these trials; however, Leong et al. (2004) reported that
37 °C severely retarded growth and 42 °C was sporocidal. Hence, heat stress at 37 °C
was likely to contribute to the relatively rapid death of A. carbonarius spores, as even
A. niger spores died after prolonged incubation at 45 °C (Rotem and Aust, 1991). This
effect of temperature is common to many genera (Hong et al., 1997).
The effect of intermediate water activities is more puzzling. Survival at low water
activities can be associated with spore dormancy, but survival at 1.0 aw was also
typically greater than at 0.6-0.9 aw. This phenomenon has occasionally been noted in
other genera (Hong et al., 1997). Germination is typically most rapid at 1.0 aw and
decreases with decreasing water activity (Snow, 1949; Ayerst, 1969). Given that the
limit for growth of A. carbonarius is approximately 0.88 aw, it is noted that 0.6-0.9 aw
represent water activities just below or around the limits for growth and germination.
It is possible that spores in this intermediate or borderline range are subject to the
stress of cycling between true dormancy and low levels of metabolic activity. A

- 102 -
similar rationale could explain the relatively poor survival of spores at 1.0 aw and 1 °C,
compared with lower water activities and 1 °C at which spores are truly dormant, or,
1.0 aw at 15 °C and above, at which spores are metabolically active.
Reports of survival of A. carbonarius inoculated into soils (Kazi et al., 2003b) show
some similarities to and some points of divergence from our data. In soils, survival
decreased at temperatures above 25 °C, but increased in dry soil (low water activity),
in keeping with this in vitro study. The poor survival observed in soil at low
temperatures or high water activities (moist soil) was not supported by our data and
may be related to stimulation of soil microflora (Greaves and Jones, 1944) which may,
in turn, compete with or be antagonistic to A. carbonarius.
An observation of minor interest from this trial was that spores in the repeated
experiment (B) tended to survive longer than those in the first experiment (A). Spores
in B were harvested after an additional incubation of 3 d and appeared to be slightly
more resistant. This observation, if experimentation proves it to be consistent, may
have relevance in the vineyard, where spore dispersal by strong winds may occur
quite some time after sporulation, resulting in fairly resistant spores being deposited
on the surface of berries.
Spores on the surface of berries may survive for weeks over a range of water activities
(relative humidities), even at 37 °C, but UV radiation in sunlight is deleterious for A.
carbonarius spores, despite this species possessing thick, melanised spore walls. A
cumulative exposure of 10 mWh of UV irradiation, which resulted in an approximate
105 fold decrease in viability, could be achieved in one week of high UV intensity
with cloudless skies, such as typically occurs during summer in Australia. However,
the exposure to UV light of spores on bunches would be less than on flat filter
membranes, and would be influenced by bunch and canopy architecture. The same
cumulative UV exposure resulted in a greater decrease in spore viability during the
repeated experiment (B) than during the first (A). Exposure during B comprised lower
daily UV intensity over an extended period (9 d compared with 5 d), suggesting that
duration of exposure may play a role in spore death.

- 103 -
4.4.2 Growth
Factors that affect spore survival have a different effect on fungal growth. UV light is
likely to have little influence on mould growth within the berry. The influence of
temperature and water activity on growth rate of Australian isolates of A. carbonarius
and A. niger was significant, and A. niger grew more rapidly than A. carbonarius, as
reported for European isolates (Battilani et al., 2003c; Mitchell et al., 2003, 2004;
Bellí et al., 2004b). Mitchell et al. (2003, 2004) reported slight differences in growth
rate among isolates of A. carbonarius from Greece, Israel, Italy and Portugal, and this
was also observed for Australian isolates. Bellí et al. (2005b) likewise reported slight
differences in growth rate and optimal conditions for growth among isolates of A.
carbonarius from France, Italy, Portugal and Spain; however, these were not
statistically significant. Growth rate data for Australian isolates of A. carbonarius did
not exactly fit the model based on data from European isolates (Bellí et al., 2005b).
The optimum conditions for growth of Australian isolates of A. carbonarius on SGM
(0.965 aw, 30 °C) were similar to those reported and/or predictively modelled by Bellí
et al. (2004b) (0.97 aw, ca 32 °C), Mitchell et al. (2004) (0.97-0.985 aw, 25-35 °C) and
Bellí et al. (2005b) (0.98 aw, ca 28 °C) for European isolates grown on the same
medium. Battilani et al. (2003c) reported an optimum temperature of 30 °C for Italian
isolates of A. carbonarius. Australian A. niger isolates examined here demonstrated
an optimum for growth at the highest water activity and temperature combination
within the limits of this trial, namely, 0.98 and 35 °C. Likewise, Bellí et al. (2004b)
observed maximum growth for European A. niger isolates at 0.97 aw and 35 °C, and
Battilani et al. (2003c) reported the same optimal growth temperature. Optima for
growth of A. niger on other media have been reported by Ayerst (1969) (1.0 aw, 35 °C)
and Reiss (1986) (0.96-0.98 aw, 35-37 °C). The reproducibility of these growth
optima indicates that A. niger has a higher optimum growth temperature than A.
carbonarius and possibly also takes greater advantage of high water activities for
rapid growth. This study has also confirmed the greater tolerance of A. niger for lower
water activities reported by Bellí et al. (2004b). Reducing the water activity from 0.98
to 0.92 resulted in a 32% decrease in growth rate for A. niger, compared with a 50%
decrease for A. carbonarius, as also observed by Mitchell et al. (2004). Whereas A.
niger was more tolerant of low water activities, A. carbonarius was slightly more
tolerant of low temperatures, most probably due to its lower optimum growth

- 104 -
temperature. A. carbonarius isolates at 15 °C grew at 27% of the rate at the optimum
(30 °C) whereas A. niger isolates at 15 °C grew at 21% of the rate at the optimum (35
°C).
In general, Australian isolates of A. carbonarius and A. niger displayed growth rates
similar to European isolates. When examining the extremes of growth for comparison,
combined data from Bellí et al. (2004b) and Bellí et al. (2005b) for a total of 12
isolates from France, Italy, Portugal and Spain are given in square brackets: rates for
five Australian isolates of A. carbonarius at 0.92 aw and 15 °C were 0.27-0.65 mm/d
[0.25-1.12 mm/d at 0.93 aw] and rates at 0.98 aw and 30 °C were 5.82-7.42 mm/d
[3.45 at 0.98 aw, to a maximum value at 0.99 aw of 10.1 mm/d]. Rates for two
Australian isolates of A. niger at 0.92 aw and 15 °C were both 1.05-1.09 mm/d [0.91-
1.13 mm/d at 0.93 aw for three European isolates], and rates at 0.98 aw and 30 °C were
8.51-9.29 mm/d [6.14-9.34 mm/d]. The twelve European isolates of A. carbonarius
displayed a wider range of growth rates than the five Australian isolates. Bellí et al.
(2004b) noted that one strain displaying the rapid growth rate of 9.3 mm/d at 0.98 aw
and 30 °C was similar to strains of the new species tentatively designated A. ibericus
(see section 3.4.1). For growth of eight A. carbonarius isolates at 25 °C, Mitchell et al.
(2004) reported a range of ca 4-11 mm/d at 0.98 aw and ca 3-8 mm/d at 0.93 aw,
whereas all five Australian isolates all grew within the range ca 4-6 mm/d at 0.98 aw
and ca 2-4 mm/d at 0.92 aw. Four isolates from Portugal, Israel and Greece grew
faster than 6 mm/d at 0.98 aw and three isolates grew faster than 4 mm/d at 0.93 aw.
Characterisation of additional Australian isolates of A. carbonarius may yield similar
strains capable of faster growth. At present, suffice to say that differences in growth
rate do exist among A. carbonarius isolates, although the wide variation among
European isolates is yet to be demonstrated among Australian strains. No relationship
between growth rate and region of origin has been observed for European strains
(Bellí et al., 2004b; Mitchell et al., 2004). The growth rates for Australian isolates of
A. carbonarius from the Hunter Valley (FRR 5682) and Riverina (FRR 5690)
appeared to be similar, whereas the rates for isolates from the Riverland (FRR 5691),
Sunraysia (FRR 5693) and Queensland (FRR 5692) showed some differences,
although not to the same extent as European isolates. It is not likely that these regional
differences in growth rate would be preserved upon examination of additional isolates.
- 105 -
4.4.3 Ochratoxin A production
The values for mean maximum OA yield in Fig. 4.4 should not be taken to imply that
A. niger isolates produce, on average, more OA than A. carbonarius isolates. Only
two A. niger isolates were examined and atypical low OA producing isolates of A.
carbonarius were included in this study.
The conditions for maximum OA production by A. carbonarius on SGM (ca 0.96 aw,
15 °C) were similar to those reported by Mitchell et al. (2004) (ca 0.95-0.98 aw, 15-20
°C) and Bellí et al. (2005b) (ca 0.95-0.99 aw, 20 °C). The optimum temperature for
OA production by A. niger was also 15 °C. Battilani et al. (2003c), likewise, reported
15-20 °C as the optimum for OA production by black Aspergillus spp. on SGM, and
Esteban et al. (2004) reported maximum toxin production at 15-25 °C on YES and
CYA. Our data support the optimal water activities for OA production reported by
Bellí et al. (2004d) for two isolates of A. carbonarius grown on SGM at 25 °C (0.95-
0.98 aw). In contrast, the optimal water activity observed for A. niger (0.98-0.995) by
Bellí et al. (2004d) was higher than demonstrated by our data, viz. a strong optimum
at 0.95 aw, regardless of temperature. Optima for OA production by other fungi differ
from the black aspergilli: A. ochraceus has optima around 0.95-0.99 aw and 25-37 °C
(Bacon et al., 1973; Northolt et al., 1979; Aziz and Moussa, 1997; Lee and Magan,
2000) and P. verrucosum, 0.95-0.99 aw or 0.92 aw, depending on substrate, and 24 °C
(Northolt et al., 1979; Patterson and Damaglou, 1986). This indicates that
ochratoxigenic species differ in their response to changes in water activity and
temperature.
The most toxigenic Australian isolates of A. carbonarius and A. niger produced OA
on SGM in the same order of magnitude as the most toxigenic isolates reported from
Europe to date. At 0.95 aw, A. carbonarius FRR 5692 produced 21 µg/g at 15 °C and
10 µg/g at 25 °C, and Bellí et al. (2005b) similarly reported OA production of 20.5
µg/g at 0.95 aw and 20 °C after 7 d by an isolate from Spain. Eight European isolates
examined by Mitchell et al. (2004) produced far less OA, with maximum OA at 20 °C
of only ca 0.75 µg/g. At 25 °C, the maximum OA yield by A. carbonarius FRR 5692
was 10 µg/g, as mentioned above, and the maximum yield by A. niger FRR 5694 was
5.6 µg/g. Similarly, Bellí et al. (2004b) reported maximum yield by Spanish isolates
of A. carbonarius and A. niger incubated at 25 °C to be 5.06 µg/g and 2.26 µg/g,

- 106 -
respectively. To highlight the importance of medium for mycotoxin production, the
maximum yield reported by Esteban et al. (2004) was 485 µg/g on CYA for A.
carbonarius CBS 127.49 and 98 µg/g on YES for A. foetidus CBS 618.78 (belonging
to the A. niger aggregate). Bellí et al. (2004d), Esteban et al. (2004), Mitchell et al.
(2004) and this study have all utilised the same method for OA extraction from agar
plugs followed by detection and quantification by HPLC (Bragulat et al., 2001), with
only minor modifications; hence, it is unlikely that the major variation reported
between strains results from methodological considerations.
OA production on natural substrates may not reach the same concentrations as on rich
mycological media. Joosten et al. (2001) reported a maximum yield of 4.8 µg/g OA
on coffee cherries inoculated with A. carbonarius and incubated at 0.99 and 25 °C,
and Serra et al. (2005b), likewise, reported a maximum yield of 5.8 µg/g on
homogenised grapes collected at early veraison and inoculated with A. carbonarius.
This is a similar concentration to that observed on SGM. However, maximum
concentrations of OA reported on whole, damaged or intact grapes inoculated with A.
carbonarius were ca 0.2 µg/g (Battilani et al., 2004) to 2.4 µg/g (section 5.5.2).
Maximum OA concentrations observed naturally occurring in grapes at early veraison
and harvest were lower still: 0.00065-0.013 µg/g (Battilani et al., 2003a, 2005b; Serra
et al., 2005b).
At temperatures of 25 °C and above, maximum OA production on SGM occurred 3-5
d after inoculation for all five Australian isolates of A. carbonarius. At 15 °C, maxima
occurred from 10 d onwards; the time till maximum OA yield (accumulation time)
increased with lower water activities due to longer lag times (Mitchell et al., 2004)
and slower growth. Poor toxin production at 15 °C reported by Mitchell et al. (2004)
and Bellí et al. (2005b), particularly at lower water activities, may have resulted from
shorter incubation times, 10 d and 7 d, respectively, than those in this study (10-22 d).
As found in this study, Bellí et al. (2004d) reported maxima after incubation at 25 °C
for 5 d for water activity 0.95 and above, whereas at 0.90 aw, maxima occurred after
10 d. Maxima for A. niger isolates in the same trial also occurred after 5-10 d,
depending on strain; however, there was a tendency for longer accumulation times at
lower water activities. The two Australian A. niger isolates displayed maxima at 3-5 d
above 30 °C, but it is of note that at 25 °C, maxima sometimes occurred after 10 d

- 107 -
(after the maxima of A. carbonarius) and again, at 15 °C, maxima were sometimes
delayed compared with A. carbonarius. A. niger FRR 5695 displayed the longest
accumulation times for OA on SGM. Other authors have noted accumulation times of
10-14 d to reach maximum OA on SGM (Battilani et al., 2003c; D. Mitchell, pers.
comm. 27/10/04). On CYA, Esteban et al. (2004) observed that A. niger yielded
maximum OA after 5 d of incubation at 25 °C as above, with increasing accumulation
times at lower temperatures. No trends for A. carbonarius isolates grown on YES
were observed due to significant differences among strains. Téren et al. (1996) also
reported strain differences in the time till maximum OA yield in YES broth - some
strains of both A. carbonarius and A. niger produced maximum levels at 4 d, others,
after 10 d. Varga et al. (2002) detected OA as early as 4 d, with maxima for A. niger
in YES broth after 7 d, and for A. carbonarius after 10 d. Time for maximum OA
production by other species varies and is dependent on medium and strain. Varga et al.
(2002) reported data for several species. For one example, OA production was
detected after 4 d for A. ochraceus in YES broth with maxima at 7-10 d depending on
strain, whereas Harris and Mantle (2001) reported OA detection after 8 h with the
maximum yield after 3 d in potato dextrose broth, suggesting that OA production
during the early stages of growth is a phenomenon common to toxigenic species.
The isolates of A. carbonarius and A. niger in this study all demonstrated a decrease
in OA following the peak of production, except where samples were not taken after
the maxima. This decrease in OA was presumed to be due to degradation of the toxin
(Varga et al., 2000c; Abrunhosa et al., 2002), and has also been observed by Varga et
al. (2002), Battilani et al. (2003c), Bellí et al. (2004d) and Esteban et al. (2004). This
phenomenon is not restricted to the black aspergilli and has been observed for other
Aspergillus and Penicillium spp. (Harris and Mantle, 2001; Saxena et al., 2001; Varga
et al., 2002; Geisen, 2004); however, A. albertensis was capable of maintaining a
constant concentration of OA in broth and, furthermore, this concentration was the
same regardless of incubation temperature (Varga et al., 2002). Control of OA
production and degradation is possibly governed at the genetic level by different
mechanisms in A. albertensis compared with other Aspergillus spp.
This study, as well as the studies discussed above, has demonstrated that conditions
for maximum growth and for maximum OA production are different. Within species,

- 108 -
isolates with the most rapid growth rate do not necessarily produce the most OA; A.
carbonarius FRR 5692 grew fastest among the isolates examined and also produced
the most OA, but the second highest producer, FRR 5690, generally grew more
slowly than some of the other isolates. Similarly, for A. ochraceus, a correlation
between growth rate and OA yield was dependent on strain (Pardo et al., 2004). OA
production by A. carbonarius and A. niger was not related to extent of growth, as the
yield in relation to colony size was strongly governed by temperature. This could also
be interpreted as an effect of growth rate, given the relationship between growth and
temperature. However, OA yield varied from 5 µg/g at 0.98 aw and 15 °C to 0.004
µg/g at 0.92 aw and 25 °C for A. carbonarius FRR 5690, even though growth rates
were similar in both sets of conditions (2.2 mm/d and 2.6 mm/d, respectively). Hence,
it cannot be conclusively stated that rapid growth suppresses OA production, as
postulated by Häggblom (1982) for A. ochraceus; rather, the suppression may be due
to the interaction between temperature and growth rate or some other factor.
Removing consideration of the actual OA yield, the maximum yield in each set of
conditions for A. carbonarius growing on SGM plates appeared to be somewhat
related to colony size, or extent of growth, as reported for fumonisin production by
Fusarium spp. (Simbarashe et al., 2005). The relationship between OA production by
A. ochraceus and extent of growth as measured by glucosamine or ergosterol
concentration has been studied; however, no consistent trends have been observed
(Häggblom, 1982; Harris and Mantle, 2001; Saxena et al., 2001). Differences among
species exist in the relationship between extent of growth and OA production. Our
preliminary data suggested that A. niger accumulated OA until the medium was 60-
100% colonised at temperatures above 25 °C, whereas A. carbonarius accumulated
OA until 25% colonisation.
4.4.4 Implications for vineyard ecosystems
Several stages exist in the cycle of OA production by black Aspergillus spp. in grapes:
1) the propagules survive in their reservoir, most likely to be soil (Kazi et al., 2004)
for extended periods, 2) they survive on the berry surface once they have been blown
there by wind, 3) they infect the berry by some means, typically when the cuticle is
damaged, 4) they grow and colonise the berry if conditions are conducive, 5) they
produce OA while growing, again, if conditions are conducive, and 6) they sporulate
and the spores are transferred to other berries or back to the soil. Strategies for the

- 109 -
minimisation of OA in grapes may be targeted at reduction of toxigenic fungi in soil
and on berry surfaces (stages 1 and 2), thus lowering the probability of infection;
reducing infection of berries by preventing berry damage (stage 3, discussed in
chapter 5); and understanding parameters for fungal growth and OA production in
grapes (stages 4 and 5), so that appropriate measures can be taken regarding
application of sprays to control fungal growth and/or removal of the damaged bunches.
If the toxin levels are likely to be low, wine made from the crop could be blended
with that from uncontaminated grapes.
During vine dormancy when soil temperatures are cold and/or soil is dry,
ochratoxigenic black Aspergillus spp. have the potential to survive for extended
periods, as spores are dormant. At warmer temperatures, interactions with other
members of the soil ecosystem are likely to play a major role, as suggested by the soil
studies of Kazi et al. (2003b). Research into the incidence of A. carbonarius in
various soil types and reduction of this species in soil through management of tillage,
mulching and irrigation [reviewed by Leong et al. (2005a)] is continuing at the
Department of Primary Industries in Mildura, Victoria.
On berry surfaces, spores may be shielded by a vigorous canopy from the lethal
effects of UV radiation in sunlight, and cooler conditions within the canopy may also
prolong spore survival. Increased humidity within the canopy may favour the
development of bunch rots. Exposing bunches to the sun may decrease the spore load,
but sun-damage to berries may increase the susceptibility to infection.
The water activity of berries from early veraison until harvest changes from
approximately 0.98 to 0.95 as sugars accumulate. This estimate is based on the water
activity of SGM that contained 10 g of glucose/fructose (ca 10 °Brix) and yielded a
water activity of 0.98. The range of water activities from veraison until harvest
supports optimal growth of both A. carbonarius and A. niger, with rate primarily
governed by temperature. In hot weather, A. niger is likely to be dominant, as was
reported by Leong et al. (2004) on grapes grown for drying. At temperatures below 20
°C, growth is retarded for both species.

- 110 -
As the optimum water activity for OA production was around 0.95-0.96, the potential
for OA production increases as berries mature. However, A. carbonarius is capable of
producing large amounts of OA as early as veraison (0.98 aw) at temperatures below
25 °C. More OA is produced at lower temperatures, as has been noted by Battilani et
al. (2004) for Italian grapes inoculated with A. carbonarius and incubated at 20 °C
and 25 °C (0.12 µg/g and 0.03 µg/g, respectively). However, those researchers also
reported an increased incidence of mould development at 20 °C compared with 25 °C,
which is contrary to the trends for growth rate observed here. In the production of
dried vine fruit, once desiccation begins, the water activity decreases below 0.95 and
OA production is retarded. Rapid drying of potentially infected berries to below 0.88
aw removes the threat of continued OA production, although rewetting of berries in
inclement weather may reactivate toxin production. This phenomenon has been noted
by Bucheli et al. (2000) during drying of coffee cherries.
OA production by black Aspergillus spp. was detected during the early stages of
growth, and often reached maximum yield after relatively little growth had occurred.
Hence the earliest signs of visible berry rot by a toxigenic isolate may be indicative of
OA contamination. Fortunately, it seems that the same mould has the potential to
degrade the toxin fairly rapidly after it has been produced, demonstrated in this study
and by other researchers (Varga et al., 2000c; Abrunhosa et al., 2002; Varga et al.,
2002; Battilani et al., 2003c; Bellí et al., 2004d; Esteban et al., 2004). In vineyards,
this has been supported by anecdotal evidence for grapes inoculated with A.
carbonarius for a winemaking trial (described in chapter 6), in which grapes
harvested 8-9 d after inoculation contained ca 0.11 µg/g OA, whereas grapes
harvested 14-21 d after inoculation contained ca 0.006 µg/g. Aspergillus rot that
develops just prior to harvest may represent a greater risk for OA contamination than
rot that develops earlier in the season.
4.4.5 Future research
A change in pH accompanies the change in water activity during berry maturation.
Esteban et al. (2005a) reported that pH optima for OA production by A. carbonarius
on standard culture media, CYA and YES, were dependent on isolate and temperature
of incubation, and occurred within the approximate range 2-7. Currently, all trials
using SGM were conducted around pH 3.8-4.2, whereas the pH in grapes may be

- 111 -
closer to 2 during early veraison. Exploring the effects of pH, temperature and water
activity simultaneously could aid in the simulation of growth and toxin production in
grapes.
Given that growth is favoured by warmer temperatures whereas OA production is
favoured by cooler temperatures, study of the effect of diurnal fluctuations on toxin
production would be of interest. Hypothetically, during the day, black Aspergillus spp.
would rapidly colonise the available substrate, whereas the cooler night would be
optimum for toxin production; toxin produced at night may, in turn, be rapidly
degraded the following day. Simulated diurnal fluctuations had no direct effect on
production of OA by A. ochraceus in raw coffee; rather, OA was increased due to the
condensation on the coffee surface that resulted from the temperature changes
(Palacios-Cabrera et al., 2004). For A. ochraceus, optima for growth and OA
production coincide with daytime temperatures, whereas these optima are separated
between day and night for black Aspergillus spp., hence diurnal fluctuations may have
a marked effect.
A. niger has always been isolated more frequently than A. carbonarius from fresh
grapes in the vineyard (section 3.1.1). Both these species have also been isolated from
dried vine fruit (Heenan et al., 1998; Abarca et al., 2003; Clarke et al., 2004; Leong et
al., 2004; Magnoli et al., 2004; Tjamos et al., 2004), and there is a sense among some
researchers that the relative incidence of A. carbonarius in both Australia and Europe
is increased in drying and dried grapes (Valero et al., 2005; S.L. Leong, unpublished
data; R.W. Emmett, pers. comm. 10/06/04; D. Mitchell, pers. comm. 27/10/94). This
is a puzzling phenomenon, as A. carbonarius grows more slowly than A. niger under
all the conditions tested to date. Some other physiological factor must confer on A.
carbonarius a competitive advantage in particular situations. One hypothesis is that A.
carbonarius is more resistant to the lethal effects of UV radiation than A. niger. A.
carbonarius spores contain more melanin, may have thicker walls, are larger and thus
contain more cytoplasm to buffer any deleterious effects, and possess multiple nuclei
(Kevei et al., 1996) which could compensate for UV damage to the genome (J.I. Pitt,
pers. comm. 02/04/04). It remains to be tested if this, or some other mechanism,
confers a competitive advantage on A. carbonarius in dried grape vineyards.

- 112 -
Regulation of OA production is not well understood at the molecular level (section
3.4.3). It is likely that the genes responsible for OA synthesis in black Aspergillus spp.
are different from those in A. ochraceus, P. nordicum and P. verrucosum, and under
different regulatory mechanisms [reviewed by Niessen et al. (2005)]. Future
investigation of these genes would contribute much to the fundamental understanding
of OA production.
All the research to date, including this study, has focussed on OA production by
mould in commodities which are ingested by humans and animals. An alternative
route of intoxication, inhalation, was proposed by Di Paolo et al. (1994), Richard et al.
(1999) and Iavicoli et al. (2002), and spores of P. verrucosum were shown to contain
OA (Skaug et al., 2000). Quantification of OA present in conidia of toxigenic black
Aspergillus spp. would be of interest for the safety of viticulturalists, who may inhale
these conidia from sporulating Aspergillus spp. in rotten bunches.
- 113 -
5 Factors affecting the incidence and growth of Aspergillus carbonarius on grapes in vineyards
5.1 Introduction
The incidence of A. niger increases as berries mature, and Aspergillus rot may
develop post-veraison; these are well-established facts (Nair, 1985; Hewitt, 1988;
Snowdon, 1990; Emmett et al., 1992). The discovery that A. carbonarius was the
likely source of OA in grapes (see sections 1.4 and 3.4.1), however, led to re-
examination of the incidence of black Aspergillus spp. on grapes, with particular
attention to species differentiation. Several factors affect the potential for growth and
toxin production of black Aspergillus spp. on grapes, including climate, vineyard
management, berry maturity, cultivar and cuticle integrity.
The occurrence of black Aspergillus spp. on grapes correlated with increased
temperature and, to a lesser extent, with increased humidity and rainfall, based on data
from Spanish viticultural regions over three seasons (Bellí et al., 2005a). Italian data
likewise showed a positive correlation between black Aspergillus spp. and
temperature, but a negative correlation with rainfall (Battilani et al., 2005b). Black
aspergilli were isolated more frequently from warmer regions with a Mediterranean
climate than from temperate regions in France (Sage et al., 2004), Italy (Battilani et al.,
2003a), Portugal (Serra et al., 2003, 2005a) and Spain (Bellí et al., 2005a). Bellí et al.
(2005a) also reported increased isolation of black aspergilli during the warmest of
three seasons. Serra et al. (2003) observed that black aspergilli were more frequently
isolated from a hot, dry region than from a temperate, humid region, suggesting that
the effect of temperature is stronger than that of humidity. Roset (2003) noted that OA
in grape juice correlated with increased pre-harvest temperature, rainfall, proximity to
the coast and later date of harvest; similar trends regarding temperature and rainfall
were reported by Battilani et al. (2003a).
Several authors have reported an increase in black aspergilli on grapes from berry set
until harvest (Nair, 1985; Battilani et al., 2003a; Serra et al., 2003; Bellí et al., 2004c,
2005a; Bau et al., 2005a; Serra et al., 2005a), although this trend was not consistent
for all black Aspergillus spp. over three years in Italian vineyards (Battilani et al.,
2005b). Incidence of black Aspergillus spp. in vineyard soil increased with regular

- 114 -
tillage (Kazi et al., 2004). Battilani et al. (2004) reported differences in susceptibility
to infection and OA production in vitro among grape cultivars commonly grown in
Italy; furthermore, OA production correlated with severity of infection for certain
cultivars but not others. However, these trends were not necessarily reflected by
infection and OA contamination in vineyards; differences among cultivars were often
more strongly associated with seasonal variations in climate and time of ripening
(Battilani et al., 2005b; Leong et al., 2005a).
Much of these data were collected from vineyards in Europe (Table 3.1), from which
black aspergilli were isolated by direct plating of individual berries. Sporadic isolation
of toxigenic Aspergillus spp. in those studies was exacerbated by variation among the
few individual berries plated per bunch, among bunches, and among seasons
(Battilani et al., 2003a). Given these constraints, it has been difficult to study the
survival and growth of naturally occurring OA-producers within the bunch ecosystem.
Some of these factors were addressed in the trials described in this chapter by
inoculating A. carbonarius directly onto bunches on the vine. Incidence and
distribution of black Aspergillus spp., and their growth and toxin production on intact
and damaged berries, were examined for cultivars grown in Australian viticultural
conditions.
5.2 Natural occurrence of black Aspergillus spp. on grapes in Australia
5.2.1 Methods
5.2.1.1 Location of vineyard trials
In 2001 and 2002, trials were conducted in vineyards in the Sunraysia region centred
around Mildura, Victoria. In 2003 and 2004, trials were conducted in the Hunter
Valley, New South Wales (Table 5.1).

Table 5.1: Sites of vineyard trials
Cultivar Trellis Irrigation Pruning; Cultivation, where known 2001, 2002a Vineyard A, Commercial, Sunraysia, Victoria Riesling 2-wire vertical overhead Chardonnaya (Schwarzmann; 8 yr)b Semillona (Ramsay; 8 yr) Cabernet Sauvignona (Schwarzmann; 7 yr) Merlot Shiraza (Schwarzmann; 7 yr)
2-wire V drip; 4-5 h every 1 - 3 d to maintain berry turgor
mechanically hedged; stubble direct-drilled inter-row, herbicide
2001 Vineyard B, Research / Cultivar collection, Sunraysia, Victoria Chardonnay Riesling Cabernet Sauvignon Merlot Pinot Noir Shiraz
2-wire vertical under-vine sprinklers spur
2002 Vineyard C, Commercial, Sunraysia, Victoria Chardonnay (Ramsay; 8 yr) Cabernet Sauvignon (Ramsay; 8 yr) Shiraz (own roots; 8 yr)
2-wire vertical overhead; 10 h when soil had dried out, as indicated by soil moisture probe, usually every 7-9 d
mechanically hedged; regular cultivation with rotary-hoe
2003, 2004 Vineyard D, Commercial, Hunter Valley, New South Wales Chardonnay (> 25 yr) Semillon (> 25 yr) Shiraz (> 25 yr)
2-wire vertical drip; 2-3 h twice weekly cane
a cultivars included in trials in 2002 b where known, rootstock and age of vines in parenthesis
- 115 -
- 116 -
5.2.1.2 Assessment of incidence of black Aspergillus spp. on grapes
5.2.1.2.1 2001, 2002 - Cultivar and vineyard management
In 2001, the effect of cultivar on incidence of black Aspergillus spp. was examined.
From Vineyards A and B (Table 5.1), five bunches were collected from each cultivar
before harvest. Each bunch was treated as a replicate and the following measurements
were taken to specify bunch size, architecture and maturity: bunch weight, bunch
length and width, weight of 10 berries, total soluble solids (measured in °Brix using
an Atago PR-32 refractometer, Tokyo, Japan), pH and titratable acidity (as assessed
by titration to pH 8.2; Iland et al. (2000)). The latter three measurements were taken
on juice from homogenised berries. Before analysis, the juice was clarified by
filtration through muslin or by centrifugation.
Each bunch was shaken vigorously in a zip lock bag with 500 mL distilled water
containing Citowett (BASF Australia Ltd, Vic, Australia) as a wetting agent for 1 min.
To assess the surface mycoflora of bunches, serial dilutions of the rinsings were
performed and plated onto DRBC in duplicate as described in section 2.1. The excess
water was decanted, after which the berries were clipped from the bunch and surface
disinfected in 10% domestic bleach solution (final concentration 0.2% active chlorine)
for 2 min. The berries were rinsed three times in tap water and homogenised in a
standard domestic blender (Philips HR2835/AB). The blender bowl was rinsed with
95% ethanol between samples to minimise cross-contamination by fungal spores.
Serial dilutions of this homogenate were plated onto DRBC in triplicate to assess the
internal mycoflora of the berries. Black Aspergillus spp. were enumerated as
described in section 2.1.
Logarithmically transformed total counts (sum of external and internal counts; cfu/g)
of black Aspergillus spp. were analysed by pairwise comparison (Genstat, 6th Edition,
Lawes Agricultural Trust, Rothamsted, UK) with bunch parameters from Table 5.2.
In 2002, the effect of cultivar and aspects of vineyard management on incidence of
black Aspergillus spp. was assessed. Vineyards A and C (Table 5.1), situated in the
same area, were selected, as the same three cultivars (Chardonnay, Cabernet
- 117 -
Sauvignon, Shiraz) were grown in close proximity in each. Semillon from Vineyard A
was also examined; however, it was not grown in Vineyard C. The age of vines was
similar in both vineyards and, within each vineyard, the cultivars were managed
identically. Three primary differences existed between the vineyards, namely, type of
irrigation (drip vs overhead), floor management (cover crop vs regular tillage) and
type of trellis (V vs vertical).
At harvest, 10 replicates, each comprising five randomly selected bunches, were
collected for every cultivar. Samples were placed in zip lock bags and weighed.
Surface and internal mycoflora were examined as described above, with the following
amendments: the volume for rinsing bunches was 1 L for the five bunches pooled into
a single sample, the bunches were not surface sterilised before homogenisation, and
homogenates were plated in duplicate.
Data were analysed as described in section 2.6.
5.2.1.2.2 2003, 2004 - Cultivar and berry maturity
In 2003 and 2004, the effect of cultivar and berry maturity on incidence of black
Aspergillus spp. was examined in Vineyard D (Table 5.1). All three cultivars were
assessed in 2003, whereas in 2004, the trial was conducted with Chardonnay and
Shiraz only. Samples were collected at pre-bunch closure (berries green and pea size),
veraison, 11-24 d pre-harvest and at harvest. The rationale for assessing the natural
incidence of black Aspergillus spp. in bunches was to establish a baseline against
which the population of A. carbonarius, artificially inoculated onto bunches, could be
compared (section 5.4). The trial comprised three replicate rows. Six samples, each
comprising two bunches, were collected per replicate in 2003, and two samples
(single bunches) were collected per replicate in 2004. Bunches were weighed, then
homogenised in a stomacher (BagMixer, Interscience, France), with the addition of
sterile distilled water roughly equivalent to the sample weight, for 3 min. Black
Aspergillus spp. in the homogenate were enumerated as described in section 2.1. The
mean berry weight at each growth stage was calculated by counting the total number
of berries in representative bunches of known weight. The number of A. carbonarius
colonies was expressed as cfu per berry (cfu/berry), to facilitate comparison of
samples of different berry maturity and weight. The presence of Alternaria spp.,

- 118 -
Cladosporium spp. and yeasts was also noted, as these fungi are frequently isolated
from grapes.
Several samples did not yield detectable black Aspergillus counts, hence data were not
amenable to statistical analysis. Logarithmically transformed data (cfu/berry) for
Alternaria spp., Cladosporium spp. and yeasts enumerated in 2004 were analysed as
described in section 2.6.
5.2.2 Results
5.2.2.1 Effect of cultivar and vineyard management on incidence of
black Aspergillus spp. at harvest
Among the black aspergilli, the predominant species isolated was A. niger. A.
aculeatus was isolated from two of 30, and three of 30 bunches from Vineyards A and
B, respectively, and A. carbonarius was isolated from five of 30 and 12 of 30 bunches
from those vineyards. However, the populations of these latter two species were
typically less than 100 cfu/g in 61% of bunches from which they were isolated. Hence,
the results reported in Table 5.2 primarily represent contamination with A. niger.
Surface contamination was generally greater than internal contamination. White and
red cultivars did not display consistent differences. Whereas Chardonnay and Shiraz
from Vineyard B, and Riesling from Vineyard A were contaminated to a greater
extent than other cultivars, no single cultivar showed increased contamination in both
vineyards simultaneously. In comparing the cultivars and sites, the greatest
contamination was observed in Shiraz from Vineyard B, in which bunches were also
heavier than the other cultivars. During pairwise comparison, logarithmically
transformed total counts of black Aspergillus spp. yielded correlations of 0.32 and
0.31 with bunch weight and titratable acidity, respectively.

Table 5.2: Frequency of contamination with black Aspergillus spp. in 2001 - number of bunches within certain ranges of contamination
Meanb ± standard error of the mean Surface contamination (cfu/g) Internal contamination (cfu/g)
Cva
Vin
eyar
d
Total soluble solids (°Brix)
Bunch weight (g)
Berry weight (g)
Bunch length (cm)
Bunch width (cm)
pH
Titra-table acidity (g/L)
< 10
10-102
102-103
103-104
> 104
< 10
10-102
102-103
103-104
> 104
A 22.6 ± 0.3 105.7 ± 13.4 1.30 ± 0.06 15.3 ± 1.3 7.5 ± 1.1 3.9 ± 0.1 5.1 ± 0.1 3 2 -c - - 4 1 - - - Ch
B 22.1 ± 0.5 88.0 ± 24.3 1.06 ± 0.05 9.4 ± 0.7 5.9 ± 0.7 4.0 ± 0.1 5.2 ± 0.2 - - - 3 2 - 3 1 - 1
A 17.0 ± 0.6 96.0 ± 12.6 0.76 ± 0.06 10.5 ±0.7 6.1 ±0.3 3.7 ± 0.0 4.6 ± 0.0 3 - 1 - 1 3 1 - - 1 Rs
B 17.9 ± 0.4 73.7 ± 10.9 0.94 ± 0.04 10.9 ± 0.5 7.0 ± 0.2 3.8 ± 0.0 4.1 ± 0.1 1 3 - 1 - 4 1 - - -
Sm A 23.9 ± 1.2 122.7 ± 22.4 1.49 ± 0.10 16.5 ± 1.0 8.4 ± 0.2 4.0 ± 0.0 3.6 ± 0.1 3 2 - - - 3 2 - - -
A 20.9 ± 0.9 128.9 ± 16.8 1.50 ± 0.11 20.5 ± 1.3 8.1 ± 0.8 3.9 ± 0.1 4.3 ± 0.2 3 2 - - - 5 - - - - Sh
B 23.8 ± 0.3 241.0 ± 24.9 1.69 ± 0.08 19.2 ± 1.0 11.0 ± 0.6
4.2 ± 0.0 4.6 ± 0.2 - - 1 - 4 - 1 - - 4
A 23.4 ± 0.6 166.0 ± 29.2 1.19 ± 0.08 19.7 ± 0.5 10.3 ± 0.7
4.1 ± 0.0 3.7 ± 0.1 3 2 - - - 5 - - - - Mr
B 21.6 ± 0.2 90.5 ± 12.2 1.16 ± 0.08 13.6 ± 1.0 5.4 ± 0.6 4.2 ± 0.0 3.4 ± 0.1 3 2 - - - 5 - - - -
A 21.5 ± 0.7 124.1 ± 24.4 1.14 ± 0.04 17.5 ± 0.6 7.6 ± 0.5 4.0 ± 0.0 4.5 ± 0.1 2 3 - - - 5 - - - - CbS
B 20.7 ± 0.6 107.2 ± 9.1 1.03 ± 0.03 14.3 ± 1.0 6.1 ± 0.9 4.0 ± 0.0 5.6 ± 0.2 1 4 - - - 1 4 - - -
Pn B 25.6 ± 1.6 66.9 ± 12.9 0.95 ± 0.07 9.2 ± 0.6 5.1 ± 0.3 4.4 ± 0.0 3.7 ± 0.2 2 2 1 - - 5 - - - -
a Cv: cultivar; Ch: Chardonnay; Rs: Riesling; Sm: Semillon; Sh: Shiraz; Mr: Merlot; CbS: Cabernet Sauvignon; Pn: Pinot noir b mean of five bunches c - = nil bunches within that contamination range
- 119 -

- 120 -
Total soluble solids (°Brix), mean berry and bunch weight for samples collected in
2002 are reported in Table 5.5 as part of the trial with inoculated bunches (described
in section 5.3.1.2). A. niger was the most abundant species on bunches although,
overall, black Aspergillus spp. were not commonly isolated (Fig. 5.1).
Significant differences were not observed among vineyards and cultivars in 2002;
however, the following trends were evident. The natural incidence of the black
aspergilli was greater on white cultivars than on red cultivars. Cool weather delayed
the ripening of the white cultivars, hence bunches nearing maturity remained on the
vine for an extended period. The greatest black Aspergillus counts were observed on
Chardonnay from Vineyard C, in which damage due to vinegar fly (Drosophila
melanogaster) was noted. Among red cultivars, incidence was greatest in Cabernet
Sauvignon from Vineyard A and Shiraz from Vineyard C.
1
10
100
1,000
10,000
100,000
- Sm (A) - - Ch (A) - - Ch (C) - - Cb (A) - - Cb (C) - - Sh (A) - - Sh (C) -
Figure 5.1: Natural incidence of black Aspergillus spp. on grapes at harvest, 2002. Each symbol represents the count (cfu/g) from five bunches (pooled); red circles = Aspergillus carbonarius, blue diamonds = A. niger, orange triangles = A. aculeatus. Samples in which black Aspergillus spp. were not detected are plotted at 2.5 cfu/g, half the limit of detection. Sm: Semillon, Ch: Chardonnay, Cb: Cabernet Sauvignon, Sh: Shiraz; vineyard in parenthesis
Bla
ck A
sperg
illus c
ount
(cfu
/g)

- 121 -
5.2.2.2 Effect of cultivar and berry maturity on fungal populations on
grapes
Black Aspergillus spp. were seldom isolated at pre-bunch closure or veraison,
and, if present, occurred at low levels (Table 5.3). Incidence of infection increased
nearing harvest, and increased A. niger counts were observed in certain bunches.
Logarithmically transformed counts (cfu/berry) for other commonly isolated fungi
showed a significant three-way interaction (cultivar x stage x species; P < 0.001), as
demonstrated by the absence of trends observed for isolation of Alternaria or
Cladosporium spp. in 2004 (Fig. 5.2). When examined following a separate ANOVA,
the number of yeasts isolated per berry appeared to increase nearing harvest; however,
the interaction between cultivar and stage was again significant (P < 0.001).
Table 5.3: Natural incidence of black Aspergillus spp. on wine grapes from pre-bunch closure until harvest in 2003 and 2004
Presence of black Aspergillus species Black Aspergillus
spp. presenta / No. tested
No. of samples within concentration range for black Aspergillus spp. (cfu/berry)
Cul
tiva
r
Stage
Sea
son
Samples 5-100 100-1000 103-104 > 104 2003 0/18
Pre-bunch closure 2004 0/6
2003 0/18 Veraison 2004 0/6 2003 3/18 2 nb 1 n Pre-harvest 2004 2/6 1 cb 1 n
2003 5/18 3 c
2 n
1 c Cha
rdon
nay
Harvest
2004 0/6 Pre-bunch closure
2003 2/27 1 a
1 n
Pre-harvest 2003 2/27 1 c
1 n
Sem
illo
n
Harvest 2003 9/27 6 c 1 ab 3 n
2003 2/18 1 c
1 n
Pre-bunch closure
2004 0/6 2003 0/18 Veraison 2004 0/6 2003 6/18 4 c 1 c 1 c Pre-harvest 2004 0/6
2003 3/18 1 n 1 c 1 c
Shi
raz
Harvest 2004 2/6 1 n 1 n
a limit of detection 5 cfu/berry b n: no. of samples from which A. niger was isolated; c: A. carbonarius; a: A. aculeatus

- 122 -
0
5,000
10,000
15,000
20,000
25,000Pre-bunch closure
Veraison
Pre-harvest
Harvest
Alternaria Cladosporium Yeasts Alternaria Cladosporium Yeasts
spp. spp. spp. spp.
--------------- Chardonnay --------------- ------------------- Shiraz --------------------
Figure 5.2: Fungi other than black Aspergillus spp. commonly isolated from wine grapes, from pre-bunch closure until harvest, 2004. Error bars denote the standard error of the mean of six replicates
5.3 Significance of berry damage and inoculum coverage in the development of Aspergillus rot
5.3.1 Methods
5.3.1.1 Inoculation of bunches in vineyards
This trial was conducted in 2002 in Vineyards A and C (Table 5.1). A spore
suspension of A. carbonarius strains previously isolated from Sunraysia (FRR 5374,
FRR 5573, FRR 5574) was prepared as described in section 2.3. The suspension was
diluted in sterile Citowett solution to a concentration of approximately 3 x 10⁵
spores/mL. The inoculum was prepared in the morning and kept on ice for use the
same day. After use, the viable count of A. carbonarius in the remaining inoculum
was determined by dilution plating (section 2.1). Bunches from white cultivars were
inoculated on the same day with a suspension of viable propagules estimated at 2.7 x
105 cfu/mL. The red cultivars were inoculated 20 d later with a fresh spore suspension
(1.2 x 10⁵ cfu/mL).
Fungal count
(cfu
/berr
y)

- 123 -
For each cultivar, a seven row x 26 vine plot was selected for the trial, comprising
three trial rows, each with a buffer row on either side. Twenty four treatment vines
and 24 control vines, the latter being the source of bunches described in section
5.2.1.1.2, were distributed among the three trial rows, with two buffer vines between
treated and control vines. On each vine, 3-4 bunches from different parts of the
canopy were tagged to give a total of 80 treated bunches. Bunches were selected from
the side of the vine exposed to afternoon sun, to represent the harshest conditions for
spore survival on berries. Each treated bunch was inoculated 1-3 weeks before harvest
by spraying the surface three to four times with spore suspension from a hand-
triggered spray bottle – the total volume of spray was approximately 4 mL per bunch.
5.3.1.2 Development of Aspergillus rot in vineyards
At harvest, black Aspergillus spp. were enumerated in inoculated bunches (10
replicates, each comprising five bunches randomly pooled from vines within the plot)
as described for uninoculated bunches in section 5.2.1.1.2, to assess if the spores had
survived on the berry surface and/or if berry infection had occurred.
Logarithmically transformed data (cfu/berry) were analysed as described in section
2.6.
5.3.1.3 Development of Aspergillus rot in vitro
At harvest, sets comprising 10 uninoculated or inoculated bunches were collected in
individual zip lock bags and were either slit with a sterile scalpel to mimic splitting of
the berries, or were submerged in distilled water for 24 h. Preliminary experiments
(data not shown) had suggested that submersion in distilled water was a suitable
method to induce splitting similar to that caused by rain in susceptible cultivars
(Clarke et al., 2003). Some bunches, not inoculated previously, were inoculated after
damage by immersion in a suspension of A. carbonarius spores at ca 1-2 x 10⁵
cfu/mL. The treatments are shown in Table 5.4.

- 124 -
Table 5.4: Bunch treatments - inoculation with Aspergillus carbonarius and damage to bunches
Pre-damage treatment Type of damage Post-damage treatment nil berries slit with sterile
scalpel nil
nil bunches submerged in distilled water (24 h) to induce berry splitting
nil
nil berries slit with sterile scalpel
bunches immersed in a suspension of A.
carbonarius spores nil bunches submerged in
distilled water (24 h) to induce berry splitting
bunches immersed in a suspension of A.
carbonarius spores inoculation with A.
carbonarius on the vine berries slit with sterile scalpel
nil
inoculation with A.
carbonarius on the vine bunches submerged in distilled water (24 h) to induce berry splitting
nil
Excess moisture was drained from the bunches, and bags were opened to dry
overnight. Slightly damp paper towel was placed in the bag to increase humidity and
to absorb juice from damaged berries. The bags were sealed and incubated at room
temperature for 6-8 d, after which bunches were inspected for splitting and/or mould.
The percentage of infected berries in each bunch was scored according to the key
shown in Fig. 5.3, and the degree of sporulation classified as sparse, moderate or
abundant. For bunches that were slit and inoculated either before or after damage, the
percentage of infected berries was directly related to the number of slit berries, rather
than being indicative of fungal incidence and severity of infection. Disease severity
according to the key shown in Fig. 5.3 was not assessed for such bunches; degree of
sporulation and incidence of infection (number of bunches affected) were noted.
Some bunches were incubated for an additional 7-20 d to monitor further mould
development.
Data on incidence and severity of infection with black Aspergillus spp. were
expressed in various forms appropriate to each treatment, thus were not amenable to
statistical analysis.

- 125 -
(0%) (3%) (9.3%) (18.8%) 0 1 2 3
(18.8%) (37.5%) (62.5%) (87.5%) 3 4 5 6
Figure 5.3: Diagrammatic key for the assessment of disease severity on grape bunches based on proportion of surface area affected (R.W. Emmett, pers. comm. 29/01/02)
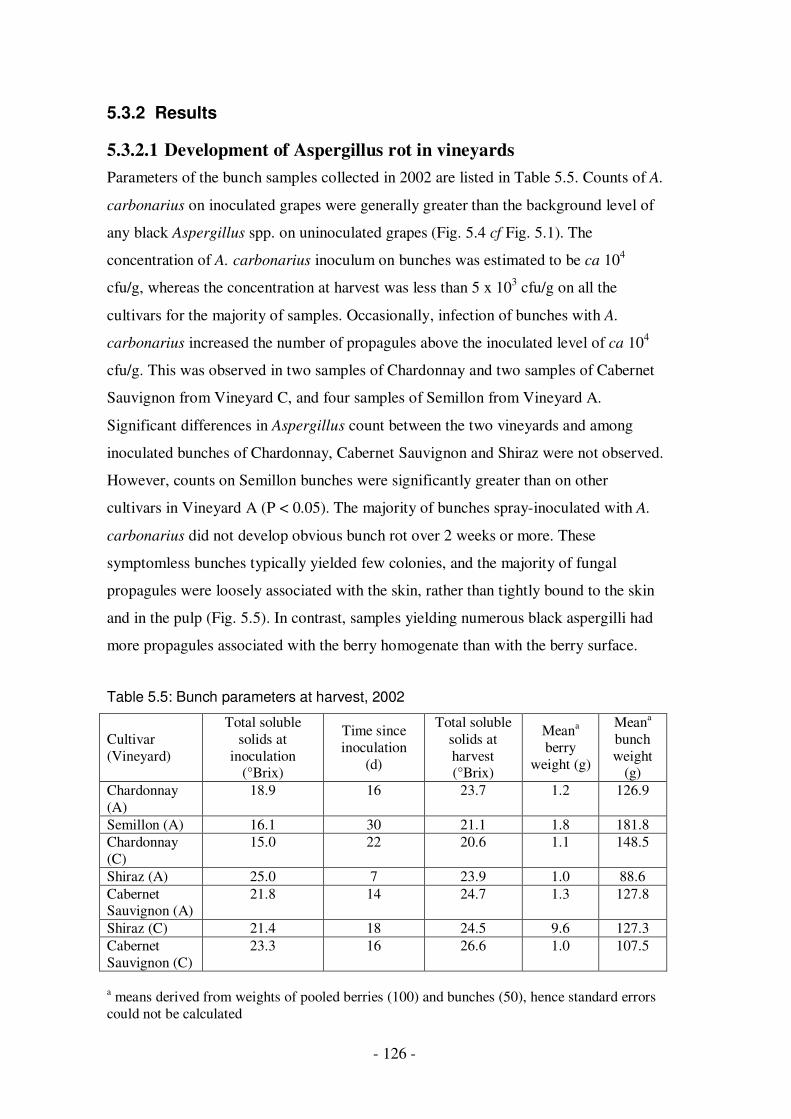
- 126 -
5.3.2 Results
5.3.2.1 Development of Aspergillus rot in vineyards
Parameters of the bunch samples collected in 2002 are listed in Table 5.5. Counts of A.
carbonarius on inoculated grapes were generally greater than the background level of
any black Aspergillus spp. on uninoculated grapes (Fig. 5.4 cf Fig. 5.1). The
concentration of A. carbonarius inoculum on bunches was estimated to be ca 104
cfu/g, whereas the concentration at harvest was less than 5 x 10³ cfu/g on all the
cultivars for the majority of samples. Occasionally, infection of bunches with A.
carbonarius increased the number of propagules above the inoculated level of ca 104
cfu/g. This was observed in two samples of Chardonnay and two samples of Cabernet
Sauvignon from Vineyard C, and four samples of Semillon from Vineyard A.
Significant differences in Aspergillus count between the two vineyards and among
inoculated bunches of Chardonnay, Cabernet Sauvignon and Shiraz were not observed.
However, counts on Semillon bunches were significantly greater than on other
cultivars in Vineyard A (P < 0.05). The majority of bunches spray-inoculated with A.
carbonarius did not develop obvious bunch rot over 2 weeks or more. These
symptomless bunches typically yielded few colonies, and the majority of fungal
propagules were loosely associated with the skin, rather than tightly bound to the skin
and in the pulp (Fig. 5.5). In contrast, samples yielding numerous black aspergilli had
more propagules associated with the berry homogenate than with the berry surface.
Table 5.5: Bunch parameters at harvest, 2002
Cultivar (Vineyard)
Total soluble solids at
inoculation (°Brix)
Time since inoculation
(d)
Total soluble solids at harvest (°Brix)
Meana berry
weight (g)
Meana bunch weight
(g) Chardonnay (A)
18.9 16 23.7 1.2 126.9
Semillon (A) 16.1 30 21.1 1.8 181.8 Chardonnay (C)
15.0 22 20.6 1.1 148.5
Shiraz (A) 25.0 7 23.9 1.0 88.6 Cabernet Sauvignon (A)
21.8 14 24.7 1.3 127.8
Shiraz (C) 21.4 18 24.5 9.6 127.3 Cabernet Sauvignon (C)
23.3 16 26.6 1.0 107.5
a means derived from weights of pooled berries (100) and bunches (50), hence standard errors could not be calculated
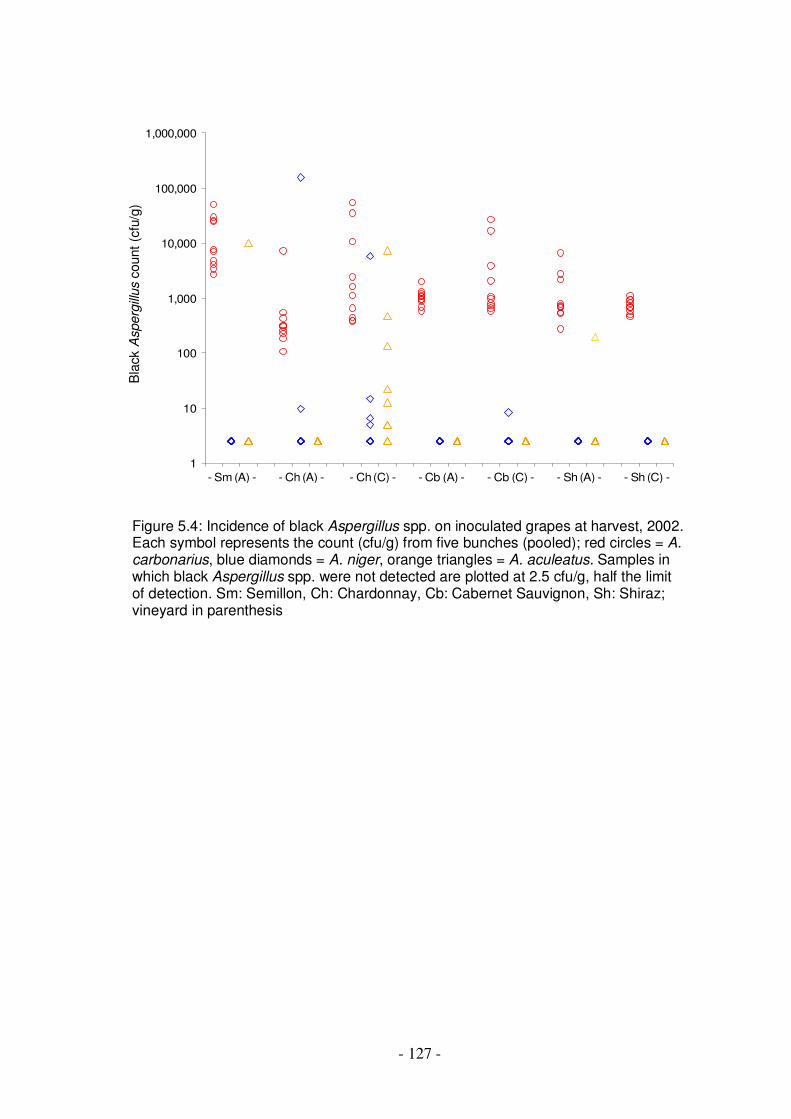
- 127 -
1
10
100
1,000
10,000
100,000
1,000,000
- Sm (A) - - Ch (A) - - Ch (C) - - Cb (A) - - Cb (C) - - Sh (A) - - Sh (C) -
Figure 5.4: Incidence of black Aspergillus spp. on inoculated grapes at harvest, 2002. Each symbol represents the count (cfu/g) from five bunches (pooled); red circles = A. carbonarius, blue diamonds = A. niger, orange triangles = A. aculeatus. Samples in which black Aspergillus spp. were not detected are plotted at 2.5 cfu/g, half the limit of detection. Sm: Semillon, Ch: Chardonnay, Cb: Cabernet Sauvignon, Sh: Shiraz; vineyard in parenthesis
Bla
ck A
sperg
illus c
ount
(cfu
/g)

- 128 -
0
20,000
40,000
60,000
80,000
100,000
120,000
140,000
160,000
Bound
Dislodged
Bla
ck A
sperg
illus c
oun
t (c
fu/g
) P
erc
enta
ge o
f bla
ck A
sp
erg
illus s
pp.
boun
d o
r dis
lodg
ed fro
m b
err
ies
0%
20%
40%
60%
80%
100%
------------------- White ----------------------- -------------------------- Red --------------------------
Figure 5.5: Comparison of propagules of black Aspergillus spp. bound to the surface or in the pulp of homogenised berries (Bound), with those dislodged from the surface of berries by vigorous shaking in water (Dislodged), for white (Chardonnay and Semillon) and red (Cabernet Sauvignon and Shiraz) cultivars. Results from uninoculated and inoculated fruit showing significant levels of black Aspergillus spp. are shown, significant levels being defined as more than five colonies of black Aspergillus spp. on the lowest dilution when plated out. Below this, differences due to a single additional colony rendered the relative proportions meaningless

- 129 -
5.3.2.2 Development of Aspergillus rot in vitro
After moist incubation of bunches for several days, visible growth of A. carbonarius
was observed on nearly all inoculated bunches, regardless of the time and method of
inoculation, method of damage and cultivar (Table 5.6a,b,d,e) . The exception to this
was Chardonnay from Vineyard B, in which the incidence of infection was 40-90%.
For this set of bunches, damaged berries, yeast-like odours, and the presence of
vinegar flies in the vineyard suggested that yeast populations had increased. These
yeasts outcompeted A. carbonarius in the inoculated samples and, even where A.
carbonarius grew, sporulation was impeded (Fig. 5.6).
Figure 5.6: Yeast growth on Chardonnay berries slit with a scalpel and moist incubated at room temperature for 8 d; (a) uninoculated berries; (b) berries inoculated by immersion in a suspension of Aspergillus carbonarius spores after slitting, demonstrating poor sporulation by the mould
Bunches that had been spray-inoculated with A. carbonarius 14-30 d before harvest
showed little mould, even though spores on the surface of these bunches were still
viable (section 5.3.2.1). However, once these bunches were slit, profuse growth and
sporulation were observed (Table 5.6b). Little variation in degree of sporulation was
observed between bunches that had been spray-inoculated before slitting, and bunches
that had been immersion-inoculated after slitting. The latter can be assumed to
represent the maximum growth and sporulation potential of A. carbonarius spores in
the conditions tested, as indicated by the rapid sporulation observed within 4 d.
The primary difference between bunches that had been inoculated pre- and post-
slitting was in the proportion of the bunch infected, termed the “severity” of infection.
Inoculation by immersion ensured greater coverage of the bunch by the spores, and
a b

- 130 -
hence all the slits were infected (Fig. 5.7). In comparison, where bunches had been
spray-inoculated, some slits showed no fungal growth at all, or growth of fungi other
than A. carbonarius. This general difference between inoculation pre- and post-
damage was also observed where the damage was simulated rain damage rather than
slitting.
Figure 5.7: Effect of damage and inoculation with Aspergillus carbonarius on Chardonnay bunches moist incubated at room temperature for 8 d. Bunches were damaged (1) by slitting with a scalpel or (2) by simulated rain damage; (a) uninoculated control; (b) spray-inoculation on the vine pre-harvest; (c) immersion-inoculation post-damage
The incidence of infection with the black aspergilli was always less than 100% in sets
of uninoculated bunches, even when bunches were incubated for extended periods
(Table 5.6c,f). Similarly, the severity of infection in uninoculated bunches was
typically less than 50% of the bunch. All three species of the black aspergilli were
isolated. Other fungi commonly isolated included B. cinerea, Cladosporium spp.,
Penicillium spp. and Rhizopus spp.
1a 1b 1c
2a 2b 2c
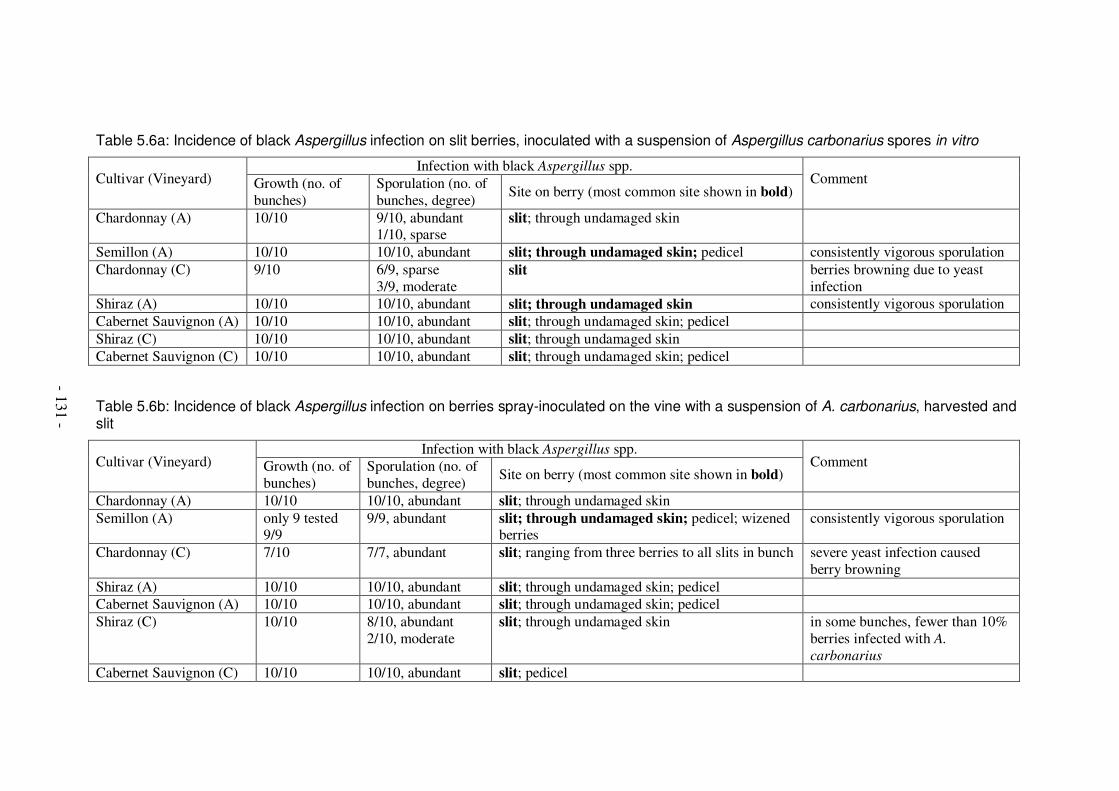
Table 5.6a: Incidence of black Aspergillus infection on slit berries, inoculated with a suspension of Aspergillus carbonarius spores in vitro
Infection with black Aspergillus spp. Cultivar (Vineyard) Growth (no. of
bunches) Sporulation (no. of bunches, degree)
Site on berry (most common site shown in bold) Comment
Chardonnay (A) 10/10 9/10, abundant 1/10, sparse
slit; through undamaged skin
Semillon (A) 10/10 10/10, abundant slit; through undamaged skin; pedicel consistently vigorous sporulation Chardonnay (C) 9/10 6/9, sparse
3/9, moderate slit berries browning due to yeast
infection Shiraz (A) 10/10 10/10, abundant slit; through undamaged skin consistently vigorous sporulation Cabernet Sauvignon (A) 10/10 10/10, abundant slit; through undamaged skin; pedicel Shiraz (C) 10/10 10/10, abundant slit; through undamaged skin Cabernet Sauvignon (C) 10/10 10/10, abundant slit; through undamaged skin; pedicel
Table 5.6b: Incidence of black Aspergillus infection on berries spray-inoculated on the vine with a suspension of A. carbonarius, harvested and slit
Infection with black Aspergillus spp. Cultivar (Vineyard) Growth (no. of
bunches) Sporulation (no. of bunches, degree)
Site on berry (most common site shown in bold) Comment
Chardonnay (A) 10/10 10/10, abundant slit; through undamaged skin Semillon (A) only 9 tested
9/9 9/9, abundant slit; through undamaged skin; pedicel; wizened
berries consistently vigorous sporulation
Chardonnay (C) 7/10 7/7, abundant
slit; ranging from three berries to all slits in bunch severe yeast infection caused berry browning
Shiraz (A) 10/10 10/10, abundant slit; through undamaged skin; pedicel Cabernet Sauvignon (A) 10/10 10/10, abundant slit; through undamaged skin; pedicel Shiraz (C) 10/10 8/10, abundant
2/10, moderate slit; through undamaged skin in some bunches, fewer than 10%
berries infected with A.
carbonarius Cabernet Sauvignon (C) 10/10 10/10, abundant slit; pedicel
- 131 -

Table 5.6c: Incidence and severity of black Aspergillus infection on uninoculated berries, harvested and slit
Infection with black Aspergillus spp. Mean severity (% area diseased ± standard error of the mean)a
Cultivar
(Vineyard) In
cuba
tion
(d)
No. of bunches infected of infected
bunches of all bunches
Sporulation (no. of bunches, degree)
Site on berry (most common site shown in bold)
Commentb
8 2/10 0.7 ± 0.1 0.1 ± 0.1 2/2, sparse slit A. carbonarius present Chardonnay (A) 14 7/10 2.7 ± 0.1 1.9 ± 0.6 Semillon (A) 7 10/10 3.9 ± 1.4 3.9 ± 1.4 9/10, abundant
1/10, sparse slit; wizened berries
8 1/10 0.5 0.1 ± 0.1 1/1, moderate slit yeasts Chardonnay (C) 11 2/10 0.7 ± 0.1 0.1 ± 0.1
8 5/10 1.3 ± 0.3 0.7 ± 0.3 3/5, moderate 2/5, sparse
slit; wizened berries A. carbonarius and A. niger present Cabernet Sauvignon (A) 14 6/10 9.1 ± 3.9 5.4 ± 2.7 Shiraz (A) 7 9/10 2.9 ± 0.5 2.6 ± 0.5 9/9, abundant slit; through undamaged skin A. carbonarius present
6 3/10 1.1 ± 0.6 0.7 ± 0.4 4/4, abundant slit A. carbonarius and A. niger present Cabernet Sauvignon (C)
25 9/10 9.7 ± 3.9 8.7 ± 3.6
6 2/10 1.2 ± 0.5 0.2 ± 0.2 2/2, moderate
slit A. aculeatus and A. carbonarius present
Shiraz (C)
27 8/10 16.4 ± 5.4 13.1 ± 4.8 a assessed according to Fig. 5.3
b conidia of black Aspergillus spp. from certain samples were mounted on slides and identified by microscopy. This is not indicative of their incidence on the bunches, as the number of slides examined was not proportional to the infection observed
- 132 -

Table 5.6d: Incidence and severity of black Aspergillus infection on bunches subjected to simulated rain damage, followed by inoculation with a suspension of A. carbonarius spores in vitro
Infection with black Aspergillus spp. No. of bunches within category
rangea
Cultivar
(Vineyard)
0.5-1.5
2-3 3.5-4.5
Mean severity (% area diseased ± standard error of the mean)a
Sporulation (no. of bunches, degree)
Site on berry (most common site shown in bold)
Comment
Chardonnay (A)
2 6 2 16.2 ± 0.1 10/10, abundant pedicel; through undamaged skin
Semillon (A) 0 5 5 26.9 ± 4.5 9/10, abundant 1/10, moderate
through undamaged skin; split; pedicel
Chardonnay (C)
1 2 3 11.3 ± 4.5 (mean of six infected bunches, 20.3 ± 5.3)
3/6, abundant 2/6, moderate 1/6, sparse
through undamaged skin severe yeast infection observed
Cabernet Sauvignon (A)
0 0 10 32.5 ± 2.8 10/10, abundant split; through undamaged skin significant splitting of berries observed
Shiraz (A) 0 3 7 29.4 ± 3.8 10/10, abundant through undamaged skin; pedicel Cabernet Sauvignon (C)
1 7 2 16.2 ± 2.1 8/10, abundant 2/10, sparse
through undamaged skin
Shiraz (C) 0 2 8 27.5 ± 2.3 10/10, abundant through undamaged skin; pedicel a assessed according to Fig. 5.3
- 133 -

Table 5.6e: Incidence and severity of black Aspergillus infection on berries spray-inoculated on the vine with a suspension of A. carbonarius spores, harvested and subjected to simulated rain damage
Infection with black Aspergillus spp. No. of bunches within category rangea
Cultivar
(Vineyard)
0.5-1.5
2-3 3.5-4.5
Mean severity (% area diseased ± standard error of the mean)a
Sporulation (no. of bunches, degree)
Site on berry (most common site shown in bold)
Comment
Chardonnay (A)
2 8 0 12.8 ± 2.0 8/10, abundant 2/10, moderate
pedicel; through undamaged skin
Semillon (A) 3 7 0 9.9 ± 1.4 10/10, abundant especially on wizened and shrivelled berries
Chardonnay (C)
4 0 0 1.7 ± 0.7 (mean of four infected bunches, 3.8 ± 0.8)
3/4, abundant 1/4, moderate
wizened berries
Cabernet Sauvignon (A)
0 5 5 25.7 ± 2.7 10/10 abundant split berry splitting observed
Shiraz (A) 2 3 5 20.0 ± 3.1 10/10, abundant through undamaged skin; wizened berries; cap scar
Cabernet Sauvignon (C)
2 8 0 9.6 ± 1.0 6/10, abundant 1/10, moderate 3/10, sparse
wizened berries; through undamaged skin
some splitting observed
Shiraz (C) 2 8 0 12.5 ± 1.6 3/10, abundant 7/10, moderate
cap scar; stem; wizened berries some splitting observed
a assessed according to Fig. 5.3
- 134 -

Table 5.6f: Incidence and severity of black Aspergillus infection on uninoculated bunches, harvested and subjected to simulated rain damage
Infection with black Aspergillus spp. Mean severity (% area diseased ± standard error of the mean)a
Cultivar
(Vineyard)
Incu
bati
on (
d)
No. of bunches infected
of infected bunches
of all bunches
Sporulation (no. of bunches, degree)
Site on berry (most common site shown in bold)
Commenta
8 0/10 0 0 not noted Chardonnay (A) 14 4/10 2.3 ± 0.4 0.9 ± 0.4 3/3, sparse 7 5/10 1.5 ± 0.6 0.75 ± 0.4 2/5, abundant
3/5, moderate A. niger present Semillon (A)
14 8/10 1.7 ± 0.4 1.3 ± 0.4 Chardonnay (C) 11 0/10 0 0 no black Aspergillus spp.; severe
yeast infection observed 8 1/10 3.9 0.4 1/1 including wizened berry A. aculeatus and A. carbonarius
present Cabernet Sauvignon (A)
14 4/10 1.8 ± 0.7 0.7 ± 0.4 8 2/10 0.9 ± 0.1 0.2 ± 0.1 2/2 not noted A. niger present Shiraz (A) 29 6/10 5.9 ± 1.4 3.5 ± 1.2 6 1/10 0.8 0.1 1/1, sparse aborted wizened berries Cabernet
Sauvignon (C) 25 5/10 1.7 ± 0.4 0.8 ± 0.3 6 2/10 2.0 ± 0.3 0.4 ± 0.3 1/2, not noted
1/1, sparse aborted wizened berries A. niger present Shiraz (C)
27 5/10 2.3 ± 0.8 1.2 ± 0.6 a assessed according to Fig. 5.3
- 135 -

- 136 -
For harvested bunches subjected to simulated rain damage by submersion in distilled
water for 24 h, splitting was observed in more than 22 of 30 Cabernet Sauvignon
bunches from Vineyard A. Splitting was not observed in Chardonnay and Shiraz from
Vineyard A, and was observed in less than 3 of 30 bunches for other cultivar sets,
including Cabernet Sauvignon from Vineyard C, where bunches contained the
greatest total soluble solids (Table 5.5). Splitting in Shiraz bunches was infrequent,
because several of the berries had shrivelled slightly, hence, were not at maximum
turgor.
A direct comparison between white cultivars in terms of in vitro infection with A.
carbonarius was not possible since Semillon was not grown in Vineyard C. However,
it was observed that the incidence and severity of infection in Semillon from Vineyard
A was worse than Chardonnay from both vineyards for nearly all the bunch treatments.
During experimentation, it was also noted that Semillon berries were loosely attached
to the pedicel, the pedicel being a common site of prolific sporulation (Table 5.6a,b,d).
Wizened berries, common in Semillon, were another site of sporulation (Fig. 5.8).
Figure 5.8: Wizened berries (a) in Semillon bunches on the vine and (b) growth of black Aspergillus spp. on aborted and wizened Cabernet Sauvignon berry in moist incubation conditions
Among the red cultivars examined, the most vigorous growth of A. carbonarius was
observed in inoculated bunches of Cabernet Sauvignon from Vineyard A (Fig. 5.9).
The splitting induced in these bunches by submersion was also the worst among the
cultivars examined. However, no consistent differences were observed between
Cabernet Sauvignon and Shiraz from both Vineyards A and C.
b a
wizened berries
Aspergillus sporulation on aborted berry

- 137 -
Figure 5.9: Berry splitting and fungal growth (a) on Cabernet Sauvignon grapes spray-inoculated with Aspergillus carbonarius on the vine pre-harvest and subjected to simulated rain damage, followed by moist incubation at room temperature for 8 d; (b) splitting of, and sporulation on, a single berry
5.4 Survival and growth of Aspergillus carbonarius on wine grapes before harvest
5.4.1 Methods
This trial was conducted in 2003 and 2004 in Vineyard D (Table 5.1). Three rows
were used per cultivar (Chardonnay and Shiraz). A spore suspension at 2-4 x 10⁵
spores/mL of A. carbonarius strains FRR 5682 and FRR 5683, previously isolated
from Vineyard D, was prepared as described in section 2.3.
Bunches on both sides of the vine were inoculated by immersion in 1 L of spore
suspension contained within a polyethylene bag. The same inoculum was used for up
to 40 bunches without a detectable decrease in the spore concentration (assessed by
plating on DRBC as described in section 2.1, data not shown). Bunches in each row
were inoculated at pre-bunch closure (berries green and pea size), veraison and 11-24
d pre-harvest. After the inoculum had dried, bunches were sampled to quantify the
initial A. carbonarius spore load. To assess the spore load over time, inoculated
bunches were sampled at each of the subsequent stages and at harvest. A sample
comprised two bunches combined into a single sample in 2003, and single bunches in
2004. Six samples were collected per replicate row, resulting in 18 samples for
analysis at each stage. A set of uninoculated samples was also collected at every stage,
described in section 5.2.1.2.2.
b a
splitting
sporulation

- 138 -
Samples were homogenised and black Aspergillus spp. enumerated as described in
section 5.2.1.2.2. The number of viable propagules of A. carbonarius was expressed
as cfu/berry to facilitate comparison of samples of different berry maturity and weight.
A similar trial was conducted in 2003 with Semillon vines, to examine the effect of
two fungicide spray programs on A. carbonarius spore survival and development of
Aspergillus rot. The trial was replicated over three blocks. In one section of each
block, rows were sprayed with the grower’s standard program and, in another section,
sprays were substituted with those provided by Syngenta Crop Protection Pty Ltd
(Switzerland) (Appendix E). As a control, sprays for two rows were omitted after
flowering. Inoculation and sampling were performed as described for the trials with
cultivars Chardonnay and Shiraz, with the amendment that the veraison sample was
omitted, that is, samples were taken at pre-bunch closure, 21 d pre-harvest and at
harvest.
Logarithmically transformed data (cfu/berry) for the Chardonnay and Shiraz trial, and
percentage of berries infected per bunch for the Semillon trial, were analysed as
described in section 2.6.
5.4.2 Results
All colonies of A. carbonarius recovered from inoculated bunches by this technique
were assumed to be solely the result of inoculation, as the natural incidence of A.
carbonarius (Table 5.3) was deemed unlikely to inflate the colony count. Fungi other
than A. carbonarius were seldom isolated from inoculated bunches, as they were
present at levels below that of the inoculum. Bunch and berry weights are listed in
Table 5.7, and were greater in 2004 than in 2003.
Four-way ANOVA (factors: year, time of inoculation, time of harvest, cultivar) of
data demonstrated a significant three-way interaction between year x time of
inoculation x time of harvest (P < 0.001). Although cultivar was not present in this
higher order interaction, significant two-way interactions were demonstrated for
cultivar x time of inoculation, and cultivar x time of harvest. The presence of so many
significant interactions in this trial precludes comment on the statistical significance
of main effects, such as cultivar, when tested independently. However, the following

- 139 -
trends were noted. A decrease in counts of A. carbonarius was consistently observed
between pre-bunch closure and veraison (Fig. 5.10a), but from veraison to pre-harvest,
mean A. carbonarius counts increased (Fig. 5.10a,b). Sporulation on berries was
visible in a proportion of these bunches (data not shown). Abundant sporulation
within bunches was often associated with foci of insect damage (Fig. 5.11).
Mean counts of A. carbonarius between pre-harvest and harvest stages did not show
consistent trends, with increases observed in seven cases, and decreases or no change
in five cases (Fig. 5.10a,b,c). Strong year and cultivar effects were observed during
this stage. The strongest effect of year was evident in the results for Chardonnay in
2003 and 2004. In 2004, A. carbonarius counts increased between veraison and
harvest, regardless of time of inoculation, and these increases were greater than those
observed in 2003. Chardonnay bunches comprised 26% more berries in 2004 than in
2003, and were 44% heavier at harvest (Table 5.7). Drought conditions preceding the
growing season for the 2003 vintage led to sparse canopies and smaller bunches in
both Chardonnay and Shiraz. Differences between these two cultivars were observed
from pre-harvest till harvest in 2004: counts on Chardonnay bunches always increased
from pre-harvest till harvest, whereas counts on Shiraz increased to a lesser degree or
even decreased (Fig. 5.10b). It was noted that during this period, Chardonnay vines
were sprayed with potassium metabisulphite, whereas Shiraz vines were sprayed with
procymidone (Appendix E, Table E.2), a compound which severely restricted growth
of A. carbonarius when incorporated into CYA at 10 ppm (data not shown). No
sprays were applied between 11-16 d pre-harvest and harvest in 2003 (Appendix E,
Table E.1).
Whereas the mean counts of A. carbonarius at pre-harvest and harvest were generally
greater than at veraison, it is important to note the presence of some samples with
counts lower than 100 cfu/berry at both pre-harvest and harvest (Fig. 5.10). These
represent bunches in which the spore load decreased from the initial inoculum of
1,000-10,000 cfu/berry.
The overall trend for increased counts at pre-harvest and harvest was also observed in
the Semillon trial for bunches with and without fungicides applied after flowering
(Fig. 5.12). Sprays applied after flowering appeared to inhibit the increase in fungal

- 140 -
infection slightly compared with the unsprayed control; however, the differences in
severity of rot measured as percentage of berries infected (Fig. 5.13) were not
significant. From inoculation at pre-bunch closure until harvest, the sprays applied in
the program designed by Syngenta Pty Ltd (Switzerland) and in the grower’s standard
program were virtually identical. The residual effect of fungicides in the Syngenta
program applied until flowering (Appendix E, Table E.1) appeared to suppress fungal
growth from pre-bunch closure until pre-harvest, whereas this suppression was not
observed for bunches that received the grower’s standard program (Fig. 5.12a). This
suppression did not continue until harvest, and counts from bunches that received the
Syngenta program were slightly greater than those from bunches that received the
grower’s standard program. Delfin® WG (Bacillus thuringiensis var. kurstacki;
Thermo Trilogy, Columbia, USA) was the only treatment applied between pre-harvest
and harvest, and this was applied to vines under both the Syngenta and standard
programs.

Table 5.7: Mean bunch and berry weights of grapes at designated growth stages, 2003 and 2004
Chardonnay Shiraz Semillon Stage Weight (g)
2003 2004 2003 2004 2003 Bunch 29.2 ± 1.7a
n = 36 49.5 ± 4.0
n = 24 43.5 ± 2.7
n = 36 56.1 ± 4.6
n = 24 60.8 ± 2.7
n = 54 Pre-bunch closure
Berry 0.33b 0.44 ± 0.05 n = 3b
0.28 0.34 ± 0.01 n = 3
0.40
Bunch 43.3 ± 2.0 n = 54
80.7 ± 3.9 n = 42
69.7 ± 2.8 n = 54
138.7 ± 9.3 n = 42
not assessed Veraison
Berry 0.52 0.66 ± 0.07 n = 3
0.51 0.88 ± 0.06 n = 3
not assessed
Bunch 81.3 ± 3.2 n = 72
117.4 ± 5.4 n = 60
131.3 ± 4.7 n = 72
148.4 ± 7.4 n = 60
159.3 ± 7.9 n = 81
Pre-harvest
Berry 0.84 1.03 ± 0.06 n = 3
1.02 1.20 ± 0.04 n = 3
0.80
Bunch 81.8 ± 3.6 n = 72
118.2 ± 6.5 n = 60
127.7 ± 4.1 n = 72
143.2 ± 8.6 n = 60
181.0 ± 7.6 n = 81
Harvest
Berry 0.88 1.06 ± 0.17 n = 3
0.90 0.94 ± 0.07 n = 3
1.39
No. of berries per bunch (mean calculated over no. of growth stages)
91 ± 3 n = 4
115 ± 3 n = 4
141 ± 6 n = 4
149 ± 9 n = 4
161 ± 20 n = 3
a standard error of the mean derived from the no. of samples denoted by “n” b In 2003, mean berry weight calculated by counting the number of berries in two bunches weighed as a single sample. In 2004, mean berry weight calculated by counting the number of berries in three individual bunches weighed separately
- 141 -

- 142 -
1
10
100
1,000
10,000
100,000
1,000,000
10,000,000
100,000,000 Ch: mean, 03
Ch: 03
Sh: mean, 03
Sh: 03
Ch: mean, 04
Ch: 04
Sh: mean, 04
Sh: 04
Pre-bunch closure Veraison Pre-harvest Harvest
1
10
100
1,000
10,000
100,000
1,000,000
10,000,000
Veraison Pre-harvest Harvest
1
10
100
1,000
10,000
100,000
1,000,000
10,000,000
Pre-harvest Harvest
Figure 5.10: Counts of Aspergillus carbonarius in 2003 and 2004 following immersion-inoculation of grapes at (a) pre-bunch closure, (b) veraison and (c) pre-harvest. Symbols show individual sample results, means of six samples denoted by lines
A.
carb
onarius c
ount
(cfu
/berr
y)
A.
carb
onarius c
ount
(cfu
/berr
y)
A.
carb
onarius c
ount
(cfu
/berr
y)
a
b
c
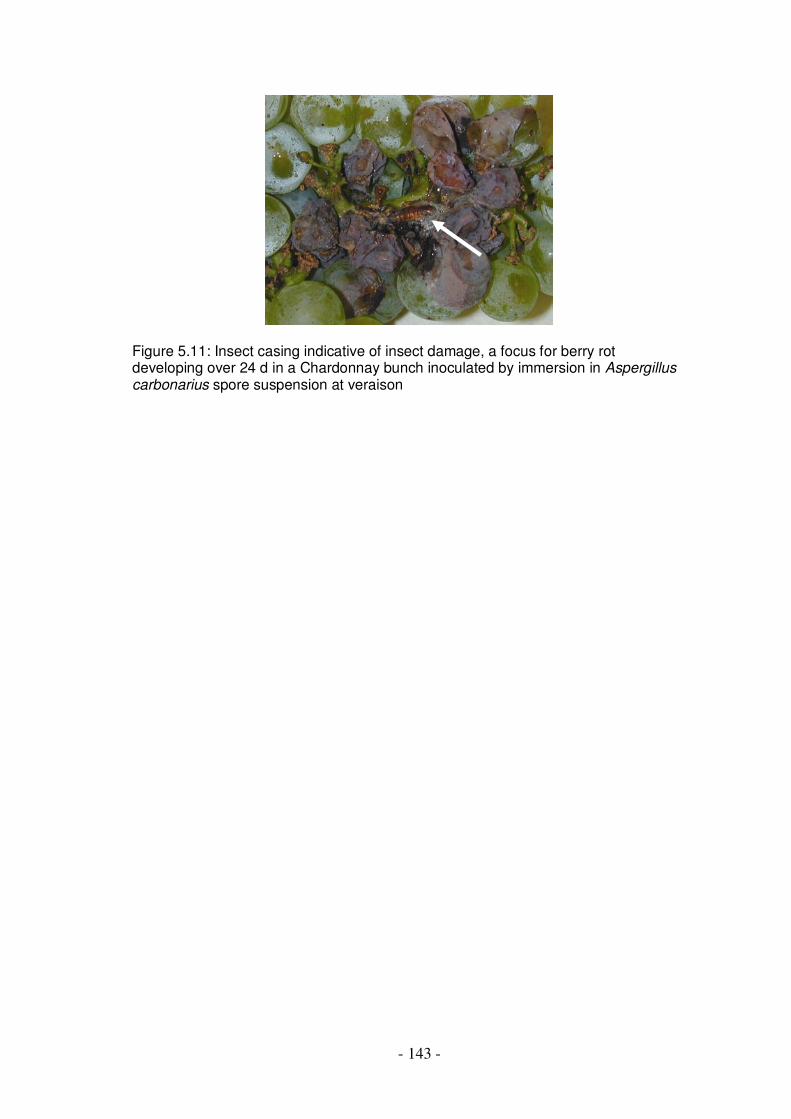
- 143 -
Figure 5.11: Insect casing indicative of insect damage, a focus for berry rot developing over 24 d in a Chardonnay bunch inoculated by immersion in Aspergillus carbonarius spore suspension at veraison

- 144 -
1
10
100
1,000
10,000
100,000
1,000,000
10,000,000 Syngenta: mean
Syngenta
Standard: mean
Standard
None: mean
None
Pre-bunch closure Pre-harvest Harvest
1
10
100
1,000
10,000
100,000
1,000,000
10,000,000
Pre-bunch closure Pre-harvest Harvest
Figure 5.12: Effect of Syngenta Crop Protection Pty Ltd (Switzerland) and grower’s standard spray programs on survival of Aspergillus carbonarius spores immersion-inoculated onto Semillon bunches at (a) pre-bunch closure and (b) pre-harvest, and subsequent growth. Sprays were withheld after flowering on control vines (None). Symbols show individual sample results, means of nine samples denoted by lines
a A
. carb
onarius c
ount
(cfu
/berr
y)
A.
carb
onarius c
ount
(cfu
/berr
y)
b

- 145 -
0%
2%
4%
6%
8%
10%
Syngenta Standard None
Inoc. pre-bunch closure
Inoc. pre-harvest
(7) (7) (4) (6) (8) (6)
Figure 5.13: Effect of Syngenta Crop Protection Pty Ltd (Switzerland) and grower’s standard spray programs on development of bunch rot caused by Aspergillus carbonarius spores immersion-inoculated onto Semillon bunches at pre-bunch closure and pre-harvest. Sprays were withheld after flowering on control vines (None). Severity of rot at harvest based on the number of visibly mouldy berries expressed as a percentage of the estimated total number of berries per bunch. Error bars denote the standard error of the mean of 18 bunches. Numbers in parenthesis beneath the x-axis denote the number of bunches displaying visible mould
5.5 Effect of damage and berry maturity on Aspergillus rot and ochratoxin A formation in Semillon bunches
5.5.1 Methods
This trial was conducted in 2004 with three rows (replicates) of Semillon vines in
Vineyard D (Table 5.1). Approximately one month before harvest, bunches were
inoculated by immersion in a suspension of A. carbonarius spores as described in
section 5.4.1. Inoculation of additional samples was performed at 20 and 10 d pre-
harvest. Each set of samples comprised six bunches, namely, two inoculated bunches;
two inoculated bunches in which the majority of berries were damaged by puncturing
with a pin; one control bunch immersed in distilled water; and one control bunch
immersed in distilled water and in which berries were punctured with a pin. Sufficient
sets of samples were inoculated such that one set could be collected at each 10 d
interval until harvest.
At each sampling point, bunches were weighed and examined for berry discoloration
typical of Aspergillus infection. The number of mouldy berries was noted and the
Perc
enta
ge o
f berr
ies infe
cted p
er
bunch

- 146 -
bunch given a score for mould severity (Fig. 5.3). Berries were carefully removed
from the bunch with scissors to examine the extent of internal rot. The number and
weight of infected berries was noted. Each bunch was stored at -20 °C until analysis
for OA as described in section 2.5.
Ten days before harvest, a total of four additional bunches were inoculated by
immersion in a suspension of A. carbonarius spores as described in section 5.4.1.
Harvested bunches were stored at 1 °C until examination as described above, with the
following modification. Berries were visually sorted into four categories; namely,
healthy berries, berries showing slight discolouration of unknown origin, plump
berries partially discoloured in the manner typically associated with infection with A.
carbonarius, and berries heavily infected with A. carbonarius as indicated by
complete discolouration of the berry, with or without visible sporulation of A.
carbonarius (Fig. 5.14). For every bunch, each category of berries was analysed for
OA as described in section 2.5. The rachides from these bunches were also pooled and
analysed for OA by the same method.
Figure 5.14: Four categories of berries from a single Semillon bunch immersion-inoculated with a suspension of Aspergillus carbonarius spores 10 d before harvest; (a) healthy berries, (b) partially discoloured berries, (c) partially discoloured berries showing some evidence of infection with A. carbonarius, and (d) discoloured berries heavily infected with A. carbonarius
The following variables were examined by pairwise comparison: bunch weight,
number of days between inoculation and sample collection, weight of berries
displaying visible infection with black Aspergillus spp., number of berries displaying
visible infection and total OA per bunch. Multiple linear regression was also
performed with the response variable total OA per bunch. The backward elimination
method was used, with elimination of insignificant variables at P < 0.05 and omitting
five points of high leverage.
a b c d

- 147 -
5.5.2 Results
Bunches that were not inoculated with A. carbonarius spore suspension did not show
visible signs of Aspergillus rot, even when berries were damaged (Fig. 5.15a).
Aspergillus bunch rot (Fig. 5.15c) was observed in 55 of 72 inoculated bunches. All
bunches inoculated at 30, 20 and 10 d before harvest that were damaged by
puncturing with a pin developed Aspergillus rot, whereas some bunches that were
inoculated with A. carbonarius spores but undamaged did not display symptoms of
infection (Fig. 5.15b). The severity of rot was greater when estimated by visual
inspection than by weight of mouldy berries - this overestimation occurred in 46 of 55
infected bunches.
Figure 5.15: Development of Aspergillus rot in Semillon bunches inoculated by immersion in Aspergillus carbonarius spore suspension 20 d pre-harvest. Control (a) immersion in distilled water and damaged by puncturing with a pin; (b) immersion in spore suspension; (c) immersion in spore suspension and damaged by puncturing with a pin
Severity of Aspergillus rot (Fig. 5.16a), as well as incidence, was increased by
damage to inoculated bunches. Susceptibility to rot increased towards harvest, as rot
was more severe in bunches inoculated at 20 and 10 d pre-harvest than at 30 d
preharvest and, in undamaged bunches, rot developed when inoculated 10 d pre-
harvest. Rot appeared to be self-limiting within the bunch, as, after the initial infection
(ca 5% and 23% of bunches inoculated at 30 d and 20 d pre-harvest, respectively), the
proportion of infected berries did not continue to increase at the same rate over the
course of the trial.
a b c
Berry discolouration and black sporulation

- 148 -
0%
5%
10%
15%
20%
25%
30%
30 d pre-harvest
9.6 °Brix
20 d pre-harvest
12.3 °Brix
10 d pre-harvest
15.5 °Brix
harvest
18.6 °Brix
Inoc. 30 d pre-harvest
Inoc. + damage 30 d pre-harvest
Inoc. 20 d pre-harvest
Inoc. + damage 20 d pre-harvest
Inoc. 10 d pre-harvest
Inoc. + damage 10 d pre-harvest
a
0
200
400
600
800
1000
1200
1400
1600
1800
30 d pre-harvest
9.6 °Brix
20 d pre-harvest
12.3 °Brix
10 d pre-harvest
15.5 °Brix
harvest
18.6 °Brixb
Perc
enta
ge b
unch infe
cte
d b
y w
eig
ht
OA
(µ
g/k
g)
Figure 5.16: Severity of infection (a) and (b) ochratoxin A in Semillon bunches inoculated by immersion in Aspergillus carbonarius spore suspension before harvest, with and without berry damage. Infection and OA were assigned zero values at inoculation. Error bars denote the standard error of the mean of six bunches

- 149 -
At 20 d and 10 d pre-harvest and at harvest, OA was assayed for a representative
selection of control bunches that had not been inoculated with A. carbonarius spores,
including both undamaged and damaged bunches. OA was not detected in five of
twelve bunches, and was present only at low concentrations in the remaining seven
(mean ± standard error of the mean 0.63 ± 0.34 µg/kg, maximum 2.26 µg/kg).
Nineteen inoculated, undamaged bunches did not display clear indications of berry
infection with A. carbonarius, that is, no berries with visible infection were
segregated and weighed. Of these, OA was not detected in two bunches. An additional
10 bunches were contaminated at concentrations below 0.5 µg/kg (mean 0.2 µg/kg)
and a single bunch contained 12 µg/kg OA. The remaining six bunches were
contaminated within the range 0.3-22 µg/kg, and it was noted that discoloured berries,
initially not attributed to infection with A. carbonarius, had been observed in these
bunches.
These relatively low OA concentrations in inoculated, undamaged bunches resulted in
lower overall means than those of inoculated, damaged bunches (Fig. 5.16b). As
observed for severity of Aspergillus rot (Fig. 5.16a), the period between 20 and 10 d
before harvest appeared to be optimum for the formation of OA in bunches inoculated
and damaged at 30 and 20 d pre-harvest. For bunches inoculated and damaged at 20 d
pre-harvest, OA increased until harvest. Bunches inoculated and damaged at 10 d pre-
harvest did not reach high OA concentrations despite the rapid development of rot
(Fig. 5.16b cf 5.16a).
Pairwise comparison with total OA per bunch yielded correlations of 0.86 and 0.71
with number and weight of Aspergillus-infected berries, respectively. The relationship
between total OA per bunch and the number of infected berries is shown in Fig. 5.17.
The model generated by multiple linear regression, with variables, number and weight
of Aspergillus-infected berries (Table 5.8), accounted for 82% of the variance.

- 150 -
0
50
100
150
200
250
300
350
400
0 20 40 60 80 100 120 140 160
Number of berries per bunch displaying visible infection
10-0 Damaged 20-0 Damaged
20-10 Damaged 30-0 Damaged
30-10 Damaged 30-20 Damaged
10-0 Undamaged 20-0 Undamaged
20-10 Undamaged 30-0 Undamaged
30-10 Undamaged 30-20 Undamaged
Figure 5.17: Relationship between ochratoxin A in Semillon bunches inoculated by immersion in Aspergillus carbonarius spore suspension before harvest and number of berries displaying visible infection with black Aspergillus spp. In the figure legend, the first and second numerals refer to the inoculation and sample collection times, respectively, in days before harvest. “Damaged” refers to bunches in which berries were punctured with a pin after inoculation
Table 5.8: Multiple linear regression model describing the total ochratoxin A per bunch (µg) for Semillon bunches inoculated by immersion in Aspergillus carbonarius spore suspension during the 30 d before harvest, 2004
Source of variation Degrees of freedom Mean of squares F probability Regression 2 182099 < 0.001 Residual 69 1674 Total 71 6757
Estimate of parameters Standard error t probability Constant -1.83 3.4 0.592 No. of visibly infected berries
3.768 0.317 < 0.001
Weight of visibly infected berries (g)
-2.974 0.495 < 0.001
Tota
l O
A (
µg p
er
bunch)

- 151 -
When berries from inoculated bunches were segregated and analysed separately, OA
contamination was observed to increase with severity of mould, from healthy and
discoloured berries to those displaying evidence of slight and severe mould; the mean
OA concentrations (± standard error of the mean of four bunches) were 1.4 ± 0.1
µg/kg, 3.6 ± 0.6 µg/kg, 27.4 ± 9.5 µg/kg and 1890 ± 194 µg/kg for the four categories
of berries. Thus the berries displaying severe mould were the source of nearly all the
OA in the bunch, even though these berries comprised less than 20% of the bunch
weight (Fig. 5.16). OA in the single sample of pooled rachides was estimated to be 93
µg/kg.
0%
10%
20%
30%
40%
50%
60%
70%
80%
90%
100%
Severe mould
Slight mould
Discoloured
Healthy
280 µg/kg 286 µg/kg 238 µg/kg 290 µg/kg
Figure 5.18: Ochratoxin A in berries visually sorted from four Semillon bunches inoculated by immersion in a suspension of Aspergillus carbonarius spore suspension 10 d before harvest. The relative OA contribution weight of each berry category is given in the left column of each pair, and the relative weight contribution of each category, in the right column (diagonal stripes). The estimated OA concentration for each bunch was calculated based on the OA concentration and weight of each berry category, and is given on the x-axis
Rela
tive c
ontr
ibution t
o t
ota
l OA
(solid
) or
bunch w
eig
ht
(shaded)

- 152 -
5.6 Discussion
5.6.1 Occurrence of black Aspergillus spp. on bunches and development of Aspergillus rot
The incidence of A. niger occurring naturally on grape bunches was typically greater
than that of both A. carbonarius and A. aculeatus (section 5.1.1), as noted for grapes
grown in Europe and South America, and for soils from Australian viticultural regions
(discussed in sections 3.1.1 and 3.4.1). Black Aspergillus spp. were not universally
associated with all berries of all bunches, as indicated by incidence and severity of
infection below 100% and 50%, respectively, observed for a range of cultivars with
induced berry damage (Table 5.6c,f). These fungi were generally present on the berry
surface without invading the pulp, hence were isolated less frequently after surface
sterilisation of the berries (Table 5.2). Magnoli et al. (2003), Bau et al. (2005a) and
Serra et al. (2005b), likewise, reported infrequent isolation of black Aspergillus spp.
from surface sterilised berries or from seeds plated aseptically.
No obvious association between cultivar and incidence of black Aspergillus spp. was
observed; however, counts of these fungi were greater on white cultivars examined in
2002 than on red cultivars (Fig. 5.1). This may have been an effect of climate rather
than cultivar, as cool weather extended the ripening time for white, but not red,
cultivars during that season. Delayed ripening may, in turn, have increased the
probability of fungal contamination from vineyard soil and the potential for berry
damage. The increased counts of black Aspergillus spp. observed on Chardonnay
grapes from Vineyard C were likely to have been a result of vinegar flies (D.
melanogaster) spreading fungal spores throughout damaged grapes left on the vine for
extended periods during ripening (Buchanan and Amos, 1992); other insect vectors
have also been implicated in the spread of A. carbonarius (Lataste et al., 2004).
Battilani et al. (2005b), likewise, noted that seasonal variations affecting ripening
periods overrode associations observed in vitro between cultivar and infection with A.
carbonarius.
Although significant differences in incidence of Aspergillus were not observed
between Vineyards A and C, differences were observed for certain cultivars. Counts
of black Aspergillus spp. appeared to be greater on Chardonnay and Shiraz grapes

- 153 -
grown in Vineyard C under overhead irrigation and with frequent soil tillage, than on
those cultivars grown in Vineyard A under drip irrigation and with minimal tillage
(Fig. 5.1). This may be explained by the more frequent isolation of A. carbonarius
from vineyard soil that was tilled regularly (Kazi et al., 2004) and from grapes grown
under overhead irrigation (N. Bellí, pers. comm. 23/09/03). However, no clear
differences were observed between incidence and severity of infection by black
Aspergillus spp. for Cabernet Sauvignon grown in either vineyard.
The frequency of isolation of black Aspergillus spp. increased with berry maturity in
2003 and 2004 (Table 5.3), as reported by other authors (section 5.1). Other fungi
commonly isolated from grapes included Alternaria spp., Cladosporium spp. and
yeasts, also reported by Da Rocha Rosa et al. (2002), Sage et al. (2002), Magnoli et al.
(2003), Bellí et al. (2004c), Sage et al. (2004) and Bau et al. (2005a). Data from the
Hunter Valley trial in 2004 suggested that yeasts increased with berry maturity (Fig.
5.2), supporting the findings of Bellí et al. (2005a) and Duncan et al. (1995) and, at
harvest, yeasts were more abundant than the other two genera, a finding reported by
Da Rocha Rosa et al. (2002) and Duncan et al. (1995) for grapes from certain areas
but not others. In contrast, Bellí et al. (2005a) reported that Alternaria spp. infected
the greatest proportion of berries in Spanish grapes, followed by yeasts, whereas
Cladosporium spp. were isolated infrequently. For grapes from the Hunter Valley trial,
Cladosporium spp. were generally more abundant than Alternaria spp., a finding
which mirrors data of Abrunhosa et al. (2001) for Portuguese grapes and Duncan et al.
(1995) for Californian grapes. However, in other studies on Portuguese and Spanish
grapes, little difference in the extent of infection with Alternaria spp. and
Cladosporium spp. was reported (Bau et al., 2005a; Serra et al., 2005a). Some authors
have reported decreases in infection with these two species towards harvest (Bau et al.,
2005a; Bellí et al., 2005a), whereas others have not observed any clear trends (Serra et
al., 2005a), as was apparent for data obtained from the Hunter Valley in this study.
Conflicting data for grapes from different seasons and regions in a single country
suggest that local conditions may affect the incidence of these fungi.
Inoculation of bunches in 2002 by spraying with a suspension of A. carbonarius
spores, in most cases, did not lead to development of Aspergillus rot. Rather, there
appeared to be a slight decrease in counts from the estimated inoculum concentration
- 154 -
(104 cfu/g fruit; Fig. 5.4); this is likely to be due to overestimation of the initial
inoculum, as a proportion of spores in the diffuse spray would not have become
attached to berries. In these symptomless bunches, spores were loosely associated
with the surface of berries, whereas in bunches showing elevated Aspergillus counts,
a greater proportion of spores was bound to the berry skin and pulp. This suggested
that elevated counts were associated with fungal penetration and infection within the
berry.
Given the absence of infection from a large number of both uninoculated and
inoculated bunches at harvest, two factors may mediate this fungal penetration and
infection, namely, damage to the berry skin and the presence of spores at the wound.
Indeed, these two factors affected severity of infection in the in vitro damage-
inoculation trial: first, damage by slitting was greater than the slight splitting induced
by submerging the bunches in water and, second, inoculation by immersion provided
better coverage of the berry surfaces than spraying, thus ensuring the presence of
spores at the wound site. The observed ranking of the treatments in increasing order of
severity of infection was: uninoculated then simulated rain damage < uninoculated
then slit < inoculated then simulated rain damage < simulated rain damage then
inoculated < inoculated then slit ≈ slit then inoculated.
This ranking demonstrated that the primary determining factor for severity of
infection was damage, with spore coverage being the secondary factor. The
importance of damage to infection was also reported by Leong et al. (2004) and
Battilani et al. (2004). The sites susceptible to infection were wounds where the
berries had been slit or where submersion had induced splitting, the latter particularly
observed in Cabernet Sauvignon bunches from Vineyard A (Fig. 5.9), in which a
relatively large proportion of berries split. It is also of note that degree of sporulation
on bunches that had been spray-inoculated on the vine 1-3 weeks before slitting was
equivalent to that of bunches inoculated with a fresh suspension of spores after slitting.
This abundant sporulation observed in both treatments suggested that the environment
on the surface of bunches had not injured the spores nor diminished their potential for
vigorous growth when the berry skin was breached.

- 155 -
Of the two white cultivars examined in 2002, consistently high infection levels were
noted for Semillon in both uninoculated (Fig. 5.1, Table 5.6c,f) and inoculated
samples (Fig. 5.4, Table 5.6a,b,d,e). Shrivelled and wizened Semillon berries (Fig.
5.8a), a common site of infection in uninoculated bunches, may represent a specific
niche for saprophytic black aspergilli in the bunch (Fig. 5.8b). The base of the pedicel
was another common site of infection, and cultivars, such as Semillon, in which the
pedicel is loosely attached may be more susceptible to fungal infection at this site
(Sarig et al., 1998). No consistent differences between infection of Cabernet
Sauvignon and Shiraz were observed, apart from those associated with the greater
splitting induced in Cabernet Sauvignon from Vineyard A. Cabernet Sauvignon from
Vineyard C was harvested when more mature; however, it did not show the same
extent of splitting. Hence, berry maturity is possibly only one factor in susceptibility
to splitting. Cabernet Sauvignon was one cultivar reported to be particularly
susceptible to A. carbonarius infection in the in vitro trials of Battilani et al. (2004).
Those authors observed differences in susceptibility to A. carbonarius infection and
OA production among cultivars grown in Italy; however, no associations between
susceptibility to infection and grape colour, bunch structure or thickness of berry skin
were observed.
During inoculation trials in 2003 and 2004, it was assumed that, once present on the
berry surface, A. carbonarius spores would not be dislodged easily by wind or rain,
due to the strong hydrophobic interactions between the tuberculate spores and the
waxy cuticle of the berry. Thus the decreases in A. carbonarius counts observed
between pre-bunch closure and veraison (Fig. 5.10a) suggested that berries during
early stages of development provided a hostile environment for the survival of
Aspergillus spores. This interpretation is supported by findings of Abdelal et al.
(1980), who demonstrated that juice from immature berries inhibited germination of A.
niger spores, and that infection did not develop even when such berries were wounded;
however, Battilani et al. (2001) presented data contrary to those findings,
demonstrating that A. carbonarius could grow on wounded pea size berries in vitro.
The decrease in spore load which continued on selected bunches until harvest could
have been due, in part, to the sporocidal effect of UV radiation in sunlight upon
exposed, intact berries (section 4.2.2.2). Such changes could be detected by this

- 156 -
method, which was more sensitive than simple measurements of incidence of
infection and degree of sporulation reported in Table 5.6a,b.
Susceptibility to Aspergillus rot appeared to commence at or after veraison (Fig. 5.10),
an observation mirrored by the increased frequency of isolation of black Aspergillus
spp. from maturing berries (section 5.1). Increased susceptibility to infection may be
mediated by a number of factors, including promotion of spore germination and
fungal growth by juice of ripe berries (Abdelal et al., 1980) and, as berries mature,
decreased production of compounds, such as phytoalexins (Jeandet et al., 2002) and
phenolics (Goetz et al., 1999; Kortekamp and Zyprian, 2003), involved in resistance
to fungal pathogens. Barbetti (1980) noted an association between increased bunch
weight and severity of bunch rot. The large, compact Chardonnay bunches in 2004
would be susceptible to berry splitting within the humid environment of a dense
canopy (Duncan et al., 1995) and, thus, susceptible to development of Aspergillus rot.
The fungicidal sprays applied to Semillon bunches in 2002 in the program designed
by Syngenta Pty Ltd (Switzerland) and in the grower’s standard program did not
significantly reduce the severity of Aspergillus rot at harvest in inoculated bunches,
compared with bunches where sprays were withheld after flowering (Fig. 5.13). As
the differences between the Syngenta and grower’s standard programs concerned
sprays applied before bunch closure (Appendix E, Table E.1), the relatively low
counts at pre-harvest from the bunches that received the Syngenta program (Fig. 5.12a)
could, perhaps, be attributed to the residual effect of the Syngenta sprays applied at
80% flowering, some 38 d before inoculation. Switch® (cyprodinil + fludioxonil;
Syngenta Pty Ltd, Switzerland) was applied at that stage, and has been shown to be
active against Aspergillus rot (Tjamos et al., 2004; Battilani et al., 2005b); however,
application of Switch® to Chardonnay and Shiraz in 2004 between pre-bunch closure
and veraison did not appear to reduce counts to a greater extent than in 2003, when
Switch® was not applied (Fig. 5.10a). From pre-harvest until harvest, the mean count
from bunches sprayed with B. thuringiensis var. kurstaki was slightly less than that
from unsprayed bunches. Bae et al. (2004) demonstrated that, although applied to
vines as a biological insecticide, B. thuringiensis was also antagonistic to A.
carbonarius. Whereas this antagonism may have decreased counts slightly in this
study, it was not strong enough to reduce the development of berry rot (Fig. 5.13). B.

- 157 -
thuringiensis applied 2 d after fungal inoculation did not appear to have any effect on
Shiraz in 2004 between veraison and pre-harvest (Fig. 5.10b). Application of
procymidone (Spiral Aquaflow, Farmoz Pty Ltd, St Leonards, NSW, Australia) to
Shiraz but not to Chardonnay between pre-harvest and harvest in 2004 may explain
the apparent differences between the cultivars during this period, namely, that counts
on Chardonnay increased, whereas, counts on Shiraz decreased or increased to a
lesser extent (Fig. 5.10). It should be noted that the increases in counts observed
during this stage in 2003 were still less than in 2004, despite the absence of spray
application in 2003. Thus the sparse canopy in 2003, which facilitated air movement
and decreased relative humidity around bunches, was possibly a stronger determining
factor for reduced fungal infection than application of fungicides. A correlation
between an open canopy and reduction in Aspergillus count was reported by Duncan
et al. (1995).
The importance of berry damage (Battilani et al., 2004; Leong et al., 2004) for the
development of Aspergillus rot in Semillon bunches during the month before harvest
was again demonstrated in Fig. 5.16a. Berry maturity also appeared strongly to
increase the potential for development of rot, with rot beginning to develop even in
undamaged bunches in the 10 d before harvest. The slow development of rot on
bunches inoculated 30 d pre-harvest could be attributed either to decreased
susceptibility to infection of immature berries, or application of B. thuringiensis 2 d
after inoculation. Given that A. carbonarius counts on Shiraz berries still increased
after the same spray application (discussed above), it is likely that berry maturity
played a greater role in limiting berry rot. However, the antagonism between B.
thuringiensis and A. carbonarius may have reduced the number of infective
propagules somewhat, and thus slightly reduced the incidence of berry infection
(measured for the Semillon trial), if not the final degree of sporulation (measured for
the Shiraz trial); this is an area for further investigation. Procymidone applied 9 d pre-
harvest, i.e. 1 d after the final inoculation, did not hinder development of rot in
damaged bunches. Apparent decreases in mean severity of rot observed for certain
treatments during the 10 d before harvest may be due to shrivelling of infected berries,
thus reducing their proportional representation by weight. Shrivelling of infected
berries probably also contributed to the overestimation of rot by visual assessment
compared with the proportion of infected berries by weight.
- 158 -
Shrivelling concentrated OA in berries displaying severe mould (Fig. 5.14d, 5.18a),
such berries being the primary source of OA in the bunch. It is unclear whether the
increase in OA displayed during the 10 d before harvest in bunches inoculated and
damaged 20 d pre-harvest (Fig. 5.16b) was due to continued formation of OA or
concentration of OA as berries shrivelled, or both effects simultaneously; a role for
berry shrivelling is supported by the decrease in proportional weight of infected
berries (Fig. 5.16a). A bunch with slightly mouldy, non-shrivelled (heavy) berries
would hypothetically contain less OA than a bunch with severely mouldy, shrivelled
(light) berries. This effect could explain apparent discrepancies between rot and OA in
bunches inoculated with and without damage 10 d before harvest, whereby OA
content of damaged and undamaged bunches was similar (Fig. 5.16b), although
infected berries comprised 14% more of the bunch weight in damaged than in
undamaged bunches (Fig. 5.16a). Perhaps the number of severely infected berries was
similar in damaged and undamaged bunches; however, damaged bunches also
contained several discoloured (heavy) berries which inflated the severity of rot. The
multiple linear regression model (Table 5.8) was able to account for the effect of
severely infected (shrivelled) berries by offsetting the positive parameter, number of
infected berries, with the smaller negative parameter, weight of infected berries. For
example, for a bunch with 20 infected berries (positive parameter 3.768 x 20 berries),
the weight parameter might be -2.974 x 10 g for slightly infected (heavy) berries, but
-2.974 x 5 g for severely infected (shrivelled, light) berries, resulting in OA
contamination of 44 µg or 58 µg in the slightly or severely infected bunches,
respectively.
The data presented in Fig. 5.16b suggested that the potential for OA formation
increased in berries at greater than 12.3 °Brix. This effect was particularly noticeable
in berries inoculated and damaged 30 d pre-harvest, as infection was present at 12.3
°Brix, yet the largest increase in OA occurred after this point. Roset (2003) and
Lataste et al. (2004) warned of the increased risk of OA formation with increasing
berry maturity, as occurs with the late harvest of grapes; however, Serra et al. (2005b)
presented data contrary to this finding, demonstrating that OA in berries was typically
greater at early veraison than at harvest. In that study, OA was also detected in some
berries at the green pea size stage, whereas the data here suggested that this stage was
- 159 -
hostile for the survival of A. carbonarius spores on berry surfaces. Serra et al. (2005b)
further demonstrated that grapes collected at early veraison, homogenised and
inoculated with A. carbonarius, supported greater OA production than similar grapes
collected at ripeness; grapes homogenised at 4 °Brix and 11 °Brix supported the
greatest OA formation (2892 µg/kg and 5781 µg/kg, respectively). Even more
surprising was the greatest formation of OA on homogenised grapes at the pea size
stage, in the presence of low pH and little available sugar for growth. These
conflicting data highlight the complexity of studying OA production at various stages
of berry maturity, with changes in pH (Esteban et al., 2005a), sugar content and thus
water activity (section 4.4.3), and phytoalexins (Bavaresco et al., 2003), all known to
affect both fungal growth and OA production. The wide range of conditions
encountered in vineyards, such as temperature fluctuations, combined with the
possibility of fungal remetabolism of OA (section 4.4.3) add further layers of
complexity.
Another set of puzzling results arose from symptomless bunches. As expected, many
symptomless bunches, both uninoculated and inoculated but undamaged, contained no
or little OA, confirming that A. carbonarius is not strongly pathogenic; rather, it
typically requires berry damage for rot to develop and for subsequent formation of
OA. Yet OA was detected in some symptomless bunches, and Serra et al. (2005b)
even detected OA in samples from which no ochratoxigenic fungi were detected once
berries were surface sterilised. It is not clear if the source of OA in these bunches was
the same berry infection, albeit at a much earlier stage before symptoms occurred, that
eventually would have led to rot. Perhaps symptoms were delayed due to a
phytoalexin response to fungal invasion of berries, and these phytoalexins, in turn,
stimulated OA production (Bavaresco et al., 2003), even though fungal growth was
limited. Alternatively, the preliminary findings of Serra et al. (2005b) may point to a
yet to be defined mode of hyphal growth and OA production on berry surfaces,
whereby fungi could still be removed by surface sterilisation after OA production;
fungal isolation and OA assays were not performed on identical berry samples, thus,
this association requires further investigation. The detection of OA in the pooled
samples of rachides of infected bunches also raised the prospect of direct infection of
and OA formation in rachides, or, of the translocation of OA between berries,

- 160 -
although this would require verification with additional samples. Translocation of
radiolabelled OA within coffee plants was reported by Mantle (2000).
5.6.2 Significance
The relatively infrequent occurrence of black Aspergillus spp., in particular, toxigenic
A. carbonarius strains, on grapes in Sunraysia and the Hunter Valley suggested that
the development of Aspergillus bunch rot and formation of OA are unlikely to be
widespread in Australian vineyards. This finding is further supported by the
infrequent detection of OA in Australian wines (Fig. 1.2). A rapid increase in the
population of black Aspergillus spp. occurred whenever berries were damaged. In
vineyards, modes of berry damage directly associated with Aspergillus rot have
included berry splitting due to summer rain (section 1.5; Leong et al. (2004)) and
insect damage (Fig. 5.11; Lataste et al. (2004); Cozzi et al. (2005)). Clearly,
minimising damage to berries is the primary strategy for decreasing the risk of
Aspergillus rot and OA formation. Data presented here and elsewhere (Battilani et al.,
2003a; Roset, 2003; Lataste et al., 2004) suggest that it is critical to prevent these rots
from early veraison until harvest, as this is the likely period for OA formation. A
secondary strategy for decreasing the incidence of Aspergillus rot is related to the
second ranking factor for rot development identified in this study, namely, spore
coverage. As soil is the primary reservoir of black Aspergillus spp. in vineyards,
reducing the concentration of these fungi in soil through mulching, minimal tillage
and moisture management (Kazi et al., 2003a,b, 2004) should also reduce the number
of spores blown from soil onto berries.
Insecticides and fungicides may have a role in both these strategies: first, by
minimising damage to berries caused by insects or fungi such as B. cinerea and the
mildew pathogens (Lataste et al., 2004) and, second, by potentially reducing the
viability of black Aspergillus spores on berry surfaces even when applied before the
critical period for OA formation (Bae et al., 2004; Tjamos et al., 2004). Application of
certain fungicides, such as a combination of fludioxonil and cyprodinil, during the
critical period after veraison was effective in reducing fungal infection (Tjamos et al.,
2004) and OA (Lataste et al., 2004) in grapes; however, application during the period
leading up to harvest is currently not permitted in Australian viticulture (Bell and
Daniel, 2004).

- 161 -
These findings jointly support the concept that much can be achieved through careful
vineyard management to mitigate the risk of OA formation in grapes. Brera et al.
(2005) directly associated the decreased extent of OA contamination of Italian wines
with vineyard management regulations introduced by the Italian government in 2000
to minimise OA.

- 162 -
6 Fate of ochratoxin A during vinification
6.1 Introduction
OA production in grapes ceases at the commencement of processing, typically a
pasteurisation step in industrial juice production and sulphiting in wine production
(Roset, 2003). Fernandes et al. (2005) also demonstrated that OA is not produced
during vinification. Hence the concentration of OA in the final product is a function of
the initial concentration in the grapes and the effect of processing. Processes which
reduce OA can be classified into two groups, physical removal and degradation.
Physical removal of OA first involves removing the site where OA has been produced,
for example, the removal of visibly mouldy berries from table grapes. It is not well
understood if OA is associated primarily with the skin, pulp or juice of grape berries.
However, a strong association with the skin or pulp would suggest that a relatively
small proportion of OA remains in the finished beverage. The high water content of
grape berries may lead to the migration of OA from the zone of fungal growth to other
parts of the berry (Engelhardt et al., 1999).
A second aspect of physical removal of OA is the partitioning of the toxin between
solid and liquid phases during processing. Fernandes et al. (2003, 2005) conducted
microvinification trials with grapes artificially contaminated with OA, and observed
that the greatest reductions resulted from solid:liquid separation steps, such as
pressing the juice or wine from the skins, or decanting the wine from precipitated
solids. Many of the solids present in grape juice have an affinity for OA and will
loosely bind and precipitate the toxin from solution (Roset, 2003), as do some fining
agents added during winemaking, such as activated charcoal (Dumeau and Trione,
2000; Castellari et al., 2001; Silva et al., 2003).
Little is known about the degradation of OA by wine yeasts during fermentation,
though this has been demonstrated during beer fermentation (Baxter et al., 2001).
Bejaoui et al. (2004) noted that decreases in OA during fermentation were affected by
choice of yeast strain. They postulated that these decreases occurred due to binding of
OA to yeast cells, rather than degradation by the yeasts, as no degradation products
- 163 -
were observed. The fate of radiolabelled OA during fermentation supports this
hypothesis (Lataste et al., 2004). Silva et al. (2003) reported reduction in OA content
by lactic acid bacteria during malolactic fermentation which may follow the
completion of primary (yeast) fermentation. However, Fernandes et al. (2003) argued
that this is not a true degradation, rather, bacterial biomass bound OA that later settled
out of the wine. The addition of sulphur dioxide has little effect on OA (Roset, 2003;
Ratola et al., 2005).
This chapter reports on the fate of OA during vinification of white and red grapes,
using methods, where possible, based on current Australian oenological practice.
Difficulties in obtaining sufficient naturally-contaminated grapes for vinification
(Fernandes et al., 2003, 2005) were overcome by inoculation of grapes on the vine
with A. carbonarius, in order to simulate natural contamination.
6.2 Methods
6.2.1 Inoculation of grapes, incubation and harvest
Berries were inoculated before harvest with a suspension of A. carbonarius spores
(prepared as described in section 2.3) at approximately 107 cfu/mL. Strains selected
for inoculation were local to the region of the experimental vineyard, and were strong
producers of OA when screened on CCA as described in section 3.2.1.2. Several
inoculation techniques were employed, all involving puncture damage to the berry
skin and subsequent contact with the spore suspension. In addition to the primary
inoculation, a supplementary inoculation of additional fruit was often performed
towards harvest to ensure sufficient fruit for vinification. At harvest, inoculated and
uninoculated fruit were mixed to simulate high, intermediate and low levels of or nil
OA in fruit. The intermediate and low or nil OA were omitted in 2004. Table 6.1
summarises the details of inoculation, incubation and harvest. Although the initial
vinification trial was conducted in Mildura, in the Sunraysia region of Victoria, in
subsequent vintages, grapes were sourced from the Hunter Valley due to proximity to
other trials in progress at that vineyard and to Food Science Australia. Substitution of
vineyards necessitated the change from Chardonnay to Semillon grapes for white
vinification. In this chapter, data from weighing grapes and products during
vinification are reported as mass (kg), according to standard food processing
terminology.

- 164 -
Table 6.1: Preparation of ochratoxin A-contaminated grapes for winemaking
Location Research Vineyard, Mildura, Victoria
Vineyard D (see Table 5.1), Hunter Valley, New South Wales
Aspergillus
carbonarius isolates
FRR 5374a, FRR 5573, FRR 5574
FRR 5682, FRR 5683
Vintage 2002 2003 2004 Grape cultivar Chardonnay Shiraz Semillon Shiraz Semillon Shiraz Method of inoculation
Berries injected using syringe {berries injected using syringe}b
Berries injected using syringe {skin scored using grater and sprayed with spore suspension}
Berries punctured with a bed of pins dipped in spore suspension {berries injected using syringe}
Berries injected using syringe
Berries injected using syringe
Berries injected using syringe
Period from primary inoculation until harvest
21 d {4 d}b 14 d {13 d} 9 d {3 d} 8 d 9 d 15 d
High OA wine: mass of grapes
53 kg inoc.c 120 kg inoc. 25 kg inoc. 28 kg inoc. 42 kg inoc. + 6 kg uninoc.c
26 kg inoc. + 11 kg uninoc.
Intermediate OA wine: mass of grapes
34 kg inoc. + 23 kg uninoc.
46 kg inoc. + 73 kg uninoc.
15 kg inoc. + 13 kg uninoc.
11 kg inoc. + 16 kg uninoc.
not performed
Control wine: mass of grapes
51 kg uninoc.
118 kg uninoc.
32 kg uninoc. 27 kg uninoc.
not performed
Volume of ferment
4 L 16 Ld 2 L 4 Ld 2 L 4 Ld
a FRR: Culture collection of Food Science Australia, North Ryde, NSW, Australia b{} bracketed text refers to supplementary inoculation of additional fruit c inoc.: grapes inoculated with A. carbonarius; uninoc.: control grapes, not inoculated with A. carbonarius d including pomace (skins, pulp and seeds)
6.2.2 Vinification - 2002, 2003
Harvested bunches were chilled at 4 °C before crushing in a crusher / destemmer at 1
tonne/h (Winery Supplies, Knoxfield, Vic, Australia). In subsequent descriptions,
“must” refers to crushed grapes including liquid, skins and seeds before or during
fermentation. Musts were pressed with a basket press (160 L, ratchet mechanism,
Winery Supplies, Knoxfield, Vic, Australia) in 2002 and through 50% shadecloth
(Mitre 10, Gordon, NSW, Australia) in a hydraulic press (S. Stowe & Sons, Bristol,
UK; Fig. 6.1) in 2003.
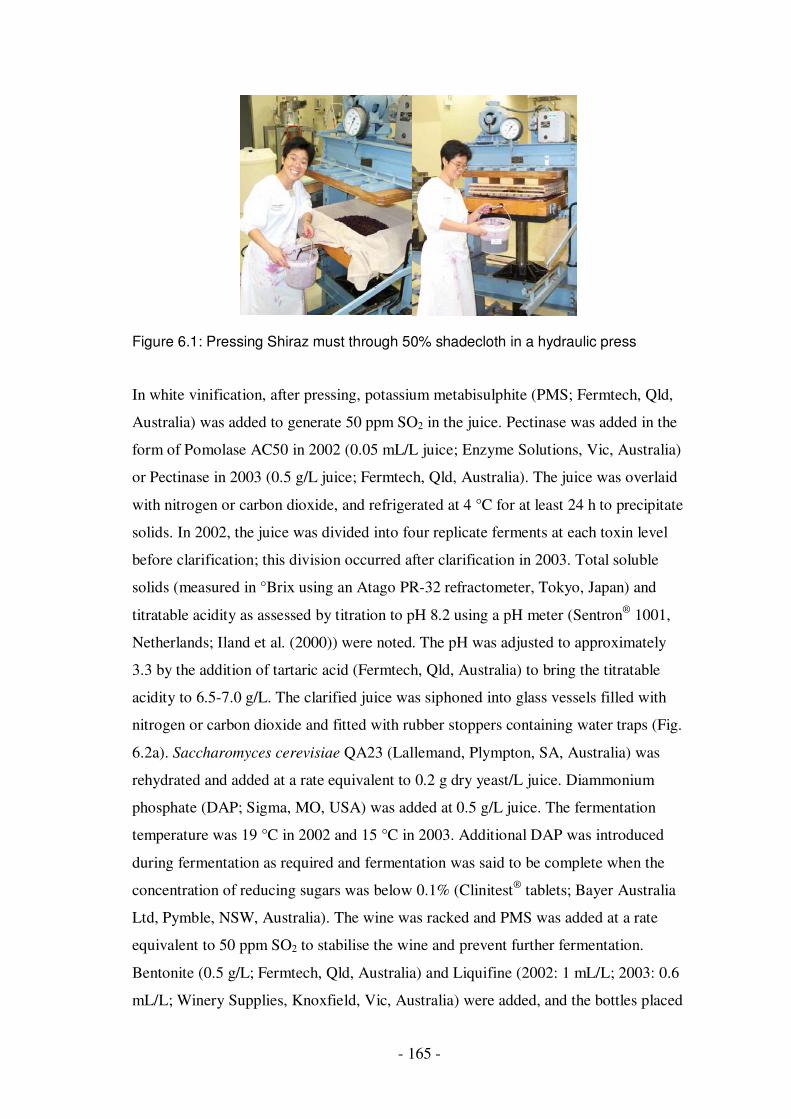
- 165 -
Figure 6.1: Pressing Shiraz must through 50% shadecloth in a hydraulic press
In white vinification, after pressing, potassium metabisulphite (PMS; Fermtech, Qld,
Australia) was added to generate 50 ppm SO2 in the juice. Pectinase was added in the
form of Pomolase AC50 in 2002 (0.05 mL/L juice; Enzyme Solutions, Vic, Australia)
or Pectinase in 2003 (0.5 g/L juice; Fermtech, Qld, Australia). The juice was overlaid
with nitrogen or carbon dioxide, and refrigerated at 4 °C for at least 24 h to precipitate
solids. In 2002, the juice was divided into four replicate ferments at each toxin level
before clarification; this division occurred after clarification in 2003. Total soluble
solids (measured in °Brix using an Atago PR-32 refractometer, Tokyo, Japan) and
titratable acidity as assessed by titration to pH 8.2 using a pH meter (Sentron® 1001,
Netherlands; Iland et al. (2000)) were noted. The pH was adjusted to approximately
3.3 by the addition of tartaric acid (Fermtech, Qld, Australia) to bring the titratable
acidity to 6.5-7.0 g/L. The clarified juice was siphoned into glass vessels filled with
nitrogen or carbon dioxide and fitted with rubber stoppers containing water traps (Fig.
6.2a). Saccharomyces cerevisiae QA23 (Lallemand, Plympton, SA, Australia) was
rehydrated and added at a rate equivalent to 0.2 g dry yeast/L juice. Diammonium
phosphate (DAP; Sigma, MO, USA) was added at 0.5 g/L juice. The fermentation
temperature was 19 °C in 2002 and 15 °C in 2003. Additional DAP was introduced
during fermentation as required and fermentation was said to be complete when the
concentration of reducing sugars was below 0.1% (Clinitest® tablets; Bayer Australia
Ltd, Pymble, NSW, Australia). The wine was racked and PMS was added at a rate
equivalent to 50 ppm SO2 to stabilise the wine and prevent further fermentation.
Bentonite (0.5 g/L; Fermtech, Qld, Australia) and Liquifine (2002: 1 mL/L; 2003: 0.6
mL/L; Winery Supplies, Knoxfield, Vic, Australia) were added, and the bottles placed

- 166 -
at 19 °C (2002) or 15 °C (2003) to allow precipitation of solids. A second racking was
performed for all bottles, and PMS was added to bring the free SO2 to 20 ppm.
Analysis of free and bound SO2 was performed by the aspiration method (Iland et al.,
2000). The bottles were held below 4 °C for cold stabilisation for at least 30 d. The
wine was filtered through a 0.2 µm filter (Enolmatic tandem bottle-filler, Winery
Supplies, Knoxfield, Vic, Australia) into 375 mL glass bottles with cork closures.
In red vinification, the must was divided into four replicate fermentations at each
toxin level. Fermentation was performed in food-grade plastic buckets (The Bottle
People, NSW, Australia) fitted with water traps (Fig. 6.2b). PMS was added to
generate 50 ppm SO2 in the must, DAP was added at 0.5 g/L must, and tartaric acid
was added to bring the titratable acidity to 6.5 g/L. S. cerevisiae D254 (Lallemand,
Plympton, SA, Australia) was rehydrated and added at approximately 0.3 g/L must.
The cap was plunged 2-3 times daily. The must was pressed after 4 d of fermentation
at room temperature in 2002 (ca 24 °C), and after 6 d of fermentation at
approximately 20 °C in 2003. The pressed wine was held in bottles at ca 22 °C until
completion of fermentation, as defined by a concentration of reducing sugars less than
0.25% (Clinitest® tablets, Bayer Australia Ltd, Pymble, NSW, Australia). During the
first racking, 50 ppm SO2 was added, after which the wine was held at 19 °C (2002)
or 15 °C (2003) to precipitate yeast cells and other solids. At the second racking, SO2
was added to maintain a final concentration of 50 ppm. The wine was held below 2 °C
for cold stabilisation for at least 30 d, after which the pH was adjusted to 3.5 and the
wine bottled through a filtration line as described above.
Bottles were cellared at ca 22 °C in 2002, and at 15 °C in 2003, in order to assess the
OA content after approximately 1 year of storage.
Figure 6.2: Fermentation vessels (a) for Semillon juice and (b) Shiraz must, 2003 and 2004
a b

- 167 -
6.2.3 Sampling - 2002, 2003
After crushing, eight samples of must from each toxin level were collected in order to
establish the initial total OA present in the berries. These samples were homogenised
in a blender (Philips HR2835/AB) and assessed for the presence of A. carbonarius as
described in section 2.1.
Juice or wine samples were collected for OA analysis after pressing, after the first and
second racking, and after storage for approximately 1 year. These data were not
amenable to statistical analysis, due to the much greater variability observed for non-
homogenous must replicates than for homogeneous juice and wine samples. However,
data regarding OA during storage were analysed as described in section 2.6, setting
the OA concentration at bottling as 100%, with model: cultivar/(stage x level). High
OA (2002), intermediate OA (2002), high OA (2003) and intermediate OA (2003)
each constituted a different level according to initial OA concentration.
In white vinification, samples for OA analysis were also collected before and after
juice clarification.
6.2.4 Effect of enzymes and bentonite during white juice clarification, 2004
As described in section 6.2.2 for white vinification in 2003, Semillon grapes were
crushed and PMS added. The must was mixed and divided into 3.5 kg portions. A
subsample of each portion was collected in order to establish the initial OA present.
Portions were treated in triplicate with Ultrazyme CP-L (0.8 mL/L; Novozymes A/S,
Dittingen, Switzerland) or Lallzyme HC (0.1 g/L; Lallemand, Plympton, SA,
Australia) at the upper limit of rates recommended by the manufacturer, or were left
untreated as controls. After incubation at room temperature for 2 h, the must was
pressed, after which the compressed marc was mixed by hand, re-wrapped in the
shadecloth, and pressed again. Samples of juice and marc were collected for OA
analysis, and the remainder of the juice held at 1 °C for 4 d. The clarified juice was
siphoned from the surface. Samples of clarified juice and lees were collected for OA
analysis.

- 168 -
One additional control treatment (i.e. enzymes not added) was prepared to assess the
efficacy of bentonite for the removal of OA during juice fining. After pressing, juice
was divided into triplicate 450 g portions, with or without addition of bentonite at 0.1
g/L (Fermtech, Qld, Australia). Samples were collected before and after settling at 1
°C for 4 d.
Data were analysed according to the model treatment x stage, as described in section
2.6.
6.2.5 Ochratoxin A during fermentation, 2004
6.2.5.1 Semillon
Clarified juice from treatments described in section 6.2.4 was pooled, and
fermentation was carried out as in 2003, described in section 6.2.2. At approximately
17, 15, 11, 8 and 6 °Brix (Atago PR-32 refractometer, Tokyo, Japan), vessels were
swirled to resuspend flocculated yeasts, and samples collected for OA analysis.
Samples of wine and lees after racking were also retained for OA analysis. Four
replicate fermentations were conducted. Data were analysed as described in section
2.6.
6.2.5.2 Shiraz - static vs rotary fermentation
As described in section 6.2.2 for red vinification in 2003, Shiraz grapes were crushed
and PMS added. Fermentation was modified from 2003 as follows: the fermentation
temperature was monitored and maintained at 25-30 °C over 4 d. To mimic static
fermentation, the cap was gently plunged three times daily, whereas to mimic rotary
fermentation, must in the buckets was shaken vigorously at the same intervals. Four
replicate fermentations of each treatment were conducted. Samples of must were
collected before fermentation, to establish the amount of OA initially present. Juice
samples were collected at various stages throughout fermentation and centrifuged at
3000 rpm for 15 min (Orbital 420, Clements Medical Equipment Pty Ltd, Somersby,
NSW, Australia) before analysis for OA. After the first pressing, a sample of free run
wine was collected. The compressed marc was mixed by hand, re-wrapped in the
shadecloth, and pressed a second time; however, the mass of pressings (additional
wine) was negligible. A sample of marc was retained for OA analysis. Free run wine
and pressings were combined, and fermentation completed in glass bottles. Samples
- 169 -
of wine and lees were collected after the first racking. Data were analysed as
described in section 2.6.
6.2.6 Recovery of juice and wine from lees, 2004
Samples (40 mL) of juice lees from white juice clarification and gross lees after the
first racking stage of white and red vinifications were centrifuged at 3000 rpm for 5
min (Orbital 420, Clements Medical Equipment Pty Ltd, Somersby, NSW, Australia)
to assess the OA potentially present in juice or wine recovered from lees by
centrifugation. OA in the compacted lees was also assessed.
The OA concentrations in racked and centrifuged juice / wine were compared as
described in section 2.6. Semillon juice lees, Semillon gross lees and Shiraz gross lees
were each treated in a separate ANOVA.
6.2.7 Effect of fining agents on removal of ochratoxin A
Semillon wines from the trial described in section 6.2.5.1 were pooled after the first
racking; likewise, Shiraz wines were pooled from the trial described in section 6.2.5.2.
A sample of each pooled wine was collected for OA analysis. Wines (100 mL) were
dispensed into glass vessels and fining agents added while the wine was mixed
continuously with a magnetic stirrer to ensure even distribution. Wines were held at
room temperature (ca 22 °C) for 2 d (Ruediger et al., 2004), after which a sample of
clear wine was decanted and centrifuged at 3000 rpm for 15 min (Orbital 420,
Clements Medical Equipment Pty Ltd, Somersby, NSW, Australia). A 10 g subsample
of this centrifuged wine was weighed and analysed for OA as described in section
6.2.8.1. Fining agents were not added to the control wine. Treatments were conducted
in triplicate. Fining agents were tested twice: first, at a rate representing the low to
normal range of current Australian practice and, subsequently, at a higher rate
representing the upper boundary (Rankine, 1989; Iland et al., 2000). Fining agents
tested included bentonite (0.5 g/L, 2.5 g/L; Fermtech, Qld, Australia), potassium
caseinate (K-caseinate; 0.1 g/L, 0.25 g/L; Winery Supplies, Knoxfield, Vic, Australia),
gelatin (0.05 g/L, 0.15 g/L; Sigma, MO, USA), isinglass (0.016 g/L, 0.10 g/L; Biofine
1499, Deltagen, Boronia, Vic, Australia) and polyvinyl-polypyrrolidone (PVPP; 0.2
g/L, 0.8 g/L; Fluka, Switzerland) for white wine, and egg white (0.4 g/L, 0.6 g/L),

- 170 -
gelatin (0.05 g/L, 0.15 g/L) and yeast hulls (2.0 g/L, 5.0 g/L; Lallemand, Plympton,
SA, Australia) for red wine.
Statistical analysis was performed by Colleen Hunt (BiometricsSA, Glen Osmond, SA,
Australia). Data were analysed as described in section 2.6 according to the model
cultivar/(fining agent x rate).
Proteins in the unfined wines were analysed at the Australian Wine Research Institute,
Glen Osmond by the method described by Girbau et al. (2004) after centrifugation
(4000 rpm, 15 min) and filtration through a 0.45 µm membrane.
Wines made in 2004 were not bottled for subsequent OA analysis after 1 year, as
sampling would have extended beyond the completion date of this study.
6.2.8 Ochratoxin A extraction
6.2.8.1 Liquids
Samples (10 g) were mixed by vortexing with methanol (1.5 mL) and hydrochloric
acid (10 N, ca 0.15 mL). The mixture was centrifuged at 2500 rpm for 15 min
(Orbital 420, Clements Medical Equipment Pty Ltd, Somersby, NSW, Australia). A
900 mg C18 solid phase extraction cartridge (Maxi-Clean™, Alltech, Deerfield, USA)
was conditioned with 5 mL acetonitrile followed by 5 mL water, and the supernatant
was passed dropwise through this cartridge under vacuum (Vacuum manifold, Alltech,
Deerfield, USA). The pellet was resuspended in 10% methanol (10 mL), then
centrifuged at 2500 rpm for a further 15 min. This supernatant was also passed
through the C18 cartridge.
A 200 mg aminopropyl cartridge (4 mL Extract-Clean™, Alltech, Deerfield, USA)
was conditioned with 3 mL methanol. The C18 and aminopropyl cartridges were
attached in series, and the sample was eluted from the C18 cartridge onto the
aminopropyl cartridge with the addition of 10 mL methanol. The sample was eluted
from the aminopropyl cartridge with 10 mL 35% ethyl acetate in cyclohexane
containing 0.75% formic acid.

- 171 -
The eluate was dried under reduced pressure at 45 °C and was resuspended in 1 mL
35% acetonitrile containing 0.1% acetic acid for analysis by HPLC (section 6.2.8.3).
The recovery for this method was > 98% for bottled wine (Giannikopoulos et al.,
2004).
Certain liquid matrices containing substantial amounts of particulate matter thought to
bind OA were analysed by the stable isotopic dilution method and LC-MS (section
2.5). Such matrices included white grape juice before clarification, white juice lees,
white juice during fermentation containing yeast cells, white gross lees, red wine
immediately after pressing, and red gross lees. In a modification to the method
described in section 2.5.1, samples (10 g) were extracted with methanol (1.5 mL) and
hydrochloric acid (10 N, ca 0.05 mL). White, unclarified grape juice was assessed
during the 2002, 2003 and 2004 vintages; however, other matrices were only assessed
during 2004 due to cost and time constraints.
6.2.8.2 Solids
OA in grape must and marc (skins and seeds after pressing) was extracted and
analysed by LC-MS as described in section 2.5. Grape must was assessed during the
2002, 2003 and 2004 vintages; however, marc was assessed only during 2004 due to
cost and time constraints, and the limited volume of isotopically-labelled internal
standard available.
6.2.8.3 HPLC analysis
The HPLC method for analysis was similar to that reported in section 2.4.2, with the
following modifications: the mobile phase consisted of acetonitrile:water:acetic acid
(50:49:1, v/v) and was delivered at a flow of 1.3 mL/min, with post-column addition
of ammonia (12.5% w/w, 0.2 mL/min). The injection volume was 3-30 µL. Samples
which yielded OA concentrations that exceeded the scale on the detector were diluted
in 35% acetonitrile containing 0.1% acetic acid and re-injected.
6.2.9 Other analyses
In 2003, a sample of Semillon juice obtained after crushing of high OA (inoculated)
grapes was analysed for the presence of organic acids by the Analytical Services
Group at the Australian Wine Research Institute, Glen Osmond, SA, Australia.

- 172 -
Likewise, Semillon and Shiraz juice samples from uninoculated and inoculated fruit
were analysed in 2004.
In 2004, the moisture content of marc and lees was determined by drying a subsample
at 90 °C overnight.
6.3 Results
6.3.1 Effect of Aspergillus carbonarius infection on appearance, total soluble solids and titratable acidity of wine grapes
A. carbonarius was isolated from uninoculated fruit at 2-130 cfu/g, and from
inoculated fruit at 3.6 x 10⁴-4.6 x 10⁵ cfu/g. Counts of black Aspergillus spp. from
musts made from mixtures of inoculated and uninoculated fruit (intermediate OA)
were approximately half those from inoculated fruit. A. niger and A. aculeatus were
also isolated from must.
Inoculated berries became discoloured starting at the point of inoculation, shrivelled,
and often fell to the ground (Fig. 6.3). Upon crushing, it was noted that the berry pulp
was macerated due to fungal growth. This was particularly noticeable in Shiraz must,
where the juice of inoculated berries was heavily pigmented compared with that of
uninoculated fruit (Fig. 6.4). Shrivelling of inoculated berries increased the total
soluble solids compared with uninoculated fruit (Table 6.2). Inoculated fruit also
displayed increased titratable acidity to an extent greater than that attributable to berry
shrivelling alone. Data from 2004 demonstrated increases in malic and tartaric acid of
approximately 60% and 14%, respectively; however citric acid in inoculated fruit
increased to over 450% of the concentration in uninoculated fruit.
OA appeared to be higher in inoculated fruit during seasons when the time between
inoculation and harvest was less than 10 d (Fig. 6.5).

- 173 -
Figure 6.3: Shrivelling of Chardonnay berries inoculated with Aspergillus carbonarius before harvest, 2002, showing (a) berry discolouration at inoculation point, (b) shrivelling of inoculated berries, (c) sporulation and (d) bunch shatter
Figure 6.4: Shiraz must from (a) fruit inoculated with Aspergillus carbonarius before harvest, (b) a mixture of inoculated and uninoculated fruit (c) uninoculated fruit only, 2003
a
bc
d
a b c
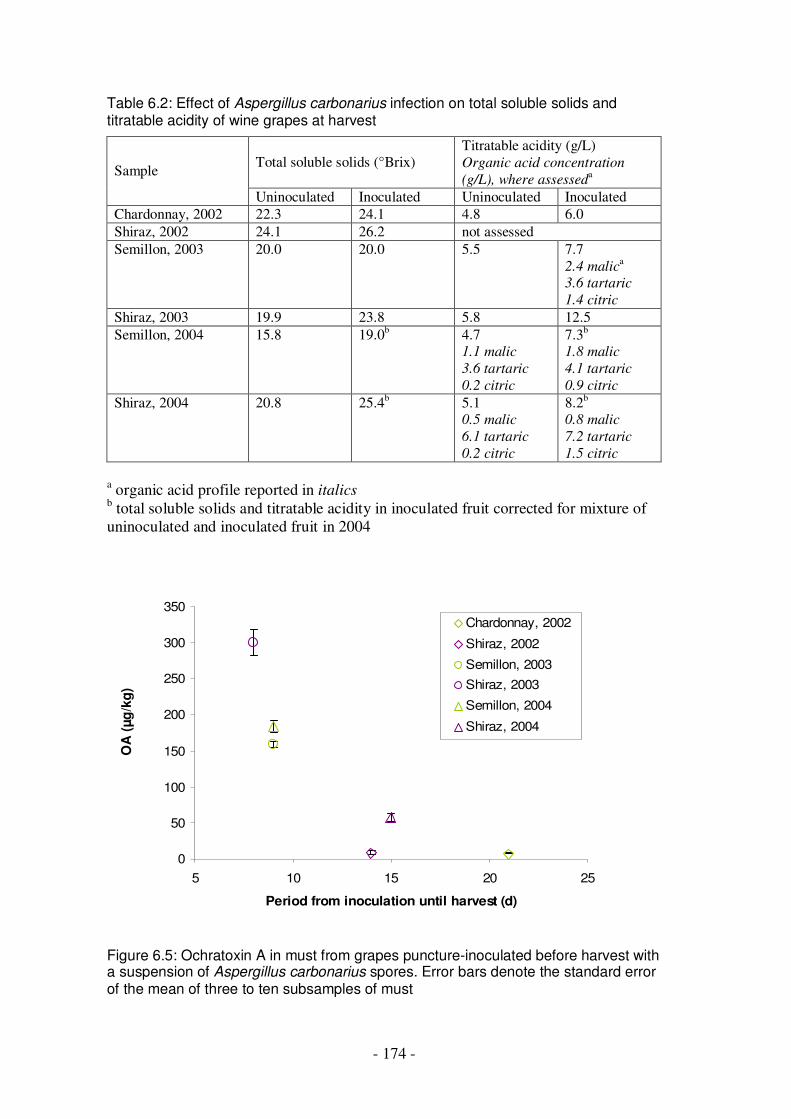
- 174 -
Table 6.2: Effect of Aspergillus carbonarius infection on total soluble solids and titratable acidity of wine grapes at harvest
Total soluble solids (°Brix) Titratable acidity (g/L) Organic acid concentration
(g/L), where assesseda
Sample
Uninoculated Inoculated Uninoculated Inoculated Chardonnay, 2002 22.3 24.1 4.8 6.0 Shiraz, 2002 24.1 26.2 not assessed Semillon, 2003 20.0 20.0 5.5 7.7
2.4 malica
3.6 tartaric
1.4 citric Shiraz, 2003 19.9 23.8 5.8 12.5 Semillon, 2004 15.8 19.0b 4.7
1.1 malic
3.6 tartaric
0.2 citric
7.3b 1.8 malic
4.1 tartaric
0.9 citric Shiraz, 2004 20.8 25.4b 5.1
0.5 malic
6.1 tartaric
0.2 citric
8.2b 0.8 malic
7.2 tartaric
1.5 citric a organic acid profile reported in italics b total soluble solids and titratable acidity in inoculated fruit corrected for mixture of uninoculated and inoculated fruit in 2004
0
50
100
150
200
250
300
350
5 10 15 20 25
Period from inoculation until harvest (d)
Chardonnay, 2002
Shiraz, 2002
Semillon, 2003
Shiraz, 2003
Semillon, 2004
Shiraz, 2004
Figure 6.5: Ochratoxin A in must from grapes puncture-inoculated before harvest with a suspension of Aspergillus carbonarius spores. Error bars denote the standard error of the mean of three to ten subsamples of must
OA
(µg
/kg
)
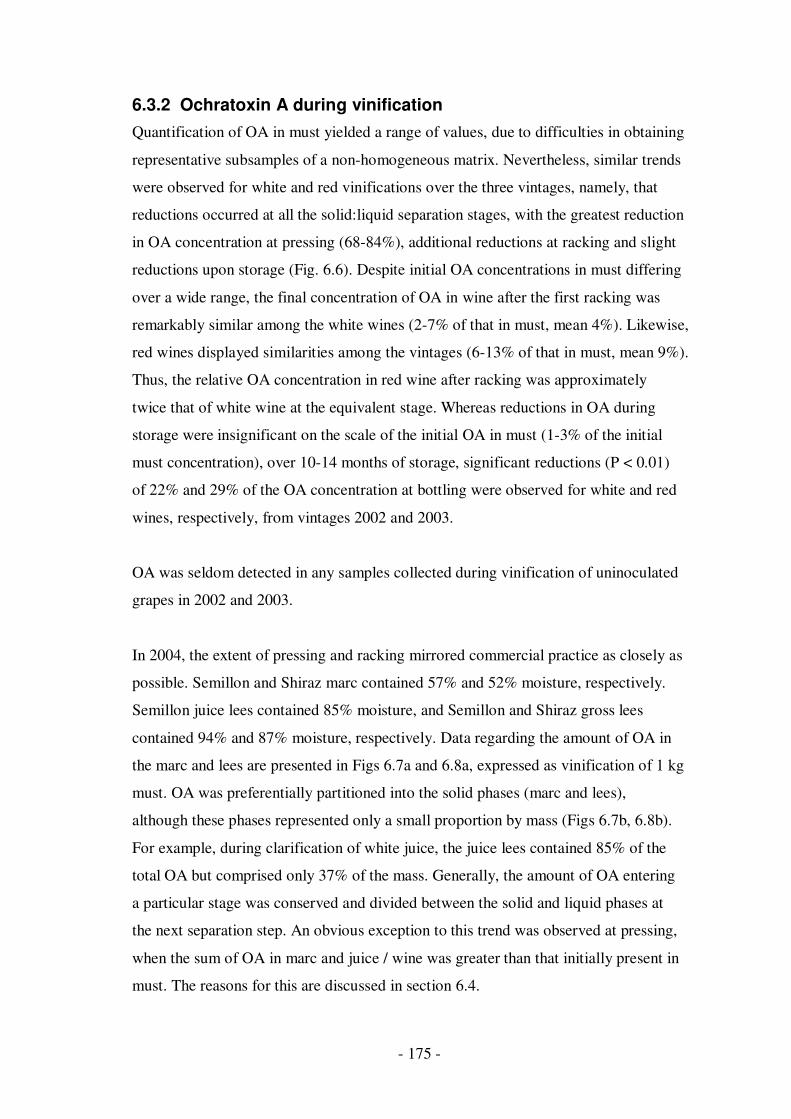
- 175 -
6.3.2 Ochratoxin A during vinification
Quantification of OA in must yielded a range of values, due to difficulties in obtaining
representative subsamples of a non-homogeneous matrix. Nevertheless, similar trends
were observed for white and red vinifications over the three vintages, namely, that
reductions occurred at all the solid:liquid separation stages, with the greatest reduction
in OA concentration at pressing (68-84%), additional reductions at racking and slight
reductions upon storage (Fig. 6.6). Despite initial OA concentrations in must differing
over a wide range, the final concentration of OA in wine after the first racking was
remarkably similar among the white wines (2-7% of that in must, mean 4%). Likewise,
red wines displayed similarities among the vintages (6-13% of that in must, mean 9%).
Thus, the relative OA concentration in red wine after racking was approximately
twice that of white wine at the equivalent stage. Whereas reductions in OA during
storage were insignificant on the scale of the initial OA in must (1-3% of the initial
must concentration), over 10-14 months of storage, significant reductions (P < 0.01)
of 22% and 29% of the OA concentration at bottling were observed for white and red
wines, respectively, from vintages 2002 and 2003.
OA was seldom detected in any samples collected during vinification of uninoculated
grapes in 2002 and 2003.
In 2004, the extent of pressing and racking mirrored commercial practice as closely as
possible. Semillon and Shiraz marc contained 57% and 52% moisture, respectively.
Semillon juice lees contained 85% moisture, and Semillon and Shiraz gross lees
contained 94% and 87% moisture, respectively. Data regarding the amount of OA in
the marc and lees are presented in Figs 6.7a and 6.8a, expressed as vinification of 1 kg
must. OA was preferentially partitioned into the solid phases (marc and lees),
although these phases represented only a small proportion by mass (Figs 6.7b, 6.8b).
For example, during clarification of white juice, the juice lees contained 85% of the
total OA but comprised only 37% of the mass. Generally, the amount of OA entering
a particular stage was conserved and divided between the solid and liquid phases at
the next separation step. An obvious exception to this trend was observed at pressing,
when the sum of OA in marc and juice / wine was greater than that initially present in
must. The reasons for this are discussed in section 6.4.

- 176 -
0%
20%
40%
60%
80%
100%
120%
140%
4 µg/kg 9 µg/kg 110 µg/kg 300 µg/kg 58 µg/kg
b 2002 2003 2004
OA
re
lative
to
co
nce
ntr
atio
n in
mu
st
0%
20%
40%
60%
80%
100%
120%
4 µg/kg 8 µg/kg 49 µg/kg 159 µg/kg 184 µg/kg
Must
After pressing
After first racking
After second racking
At bottling
After 10-14 months storage
After 22 months storage
a Chardonnay, 2002 Semillon, 2003 Semillon, 2004
OA
re
lative
to
co
nce
ntr
atio
n in
mu
st
Figure 6.6: Summary of the fate of ochratoxin A during (a) white (Chardonnay and Semillon) and (b) red (Shiraz) vinification over three vintages. The concentration of OA initially present in must, designated as 100%, is given on the x-axis. OA in subsequent samples (µg/kg) is expressed relative to this initial concentration. Error bars denote the standard error of the mean of two to ten (typically four) subsamples or replicate fermentations. Samples after the first racking were not collected in 2004. Samples collected “after pressing” during red vinification in 2002 and 2003 contained much particulate matter, thus data presented here were corrected for a recovery of 54% by HPLC analysis. Equivalent samples in 2004 were analysed by stable isotopic dilution and LC-MS, hence no correction factor was necessary
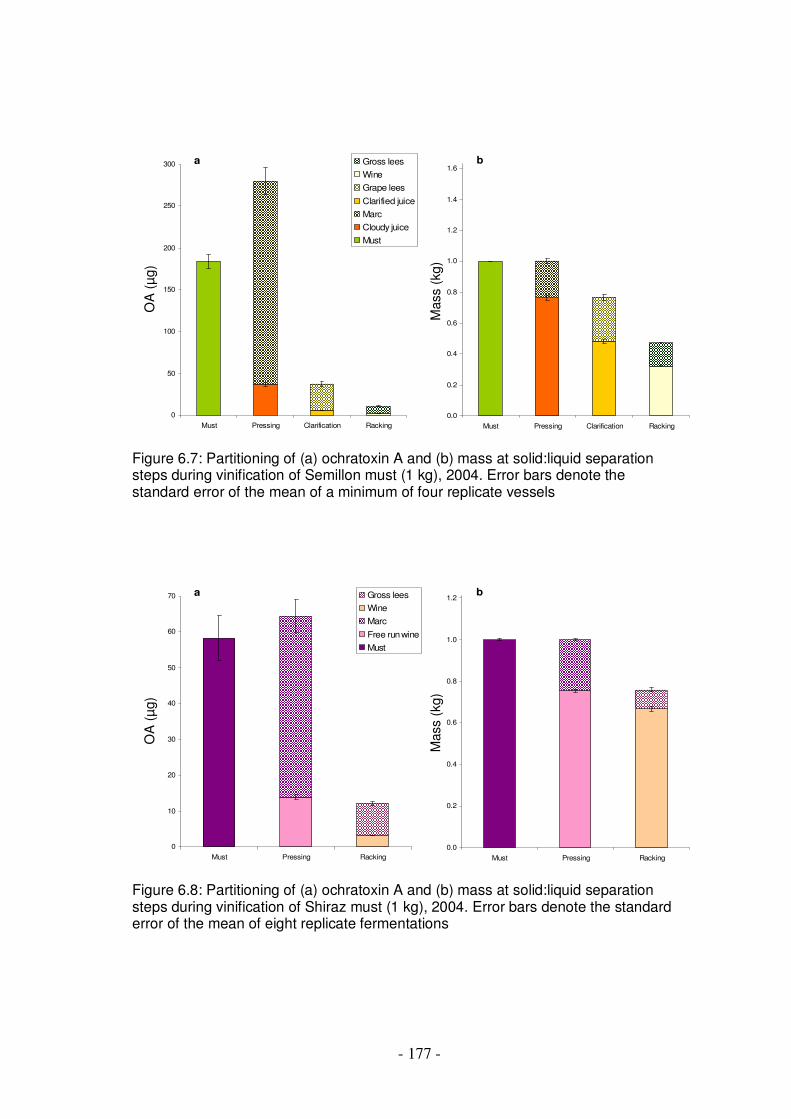
- 177 -
Figure 6.7: Partitioning of (a) ochratoxin A and (b) mass at solid:liquid separation steps during vinification of Semillon must (1 kg), 2004. Error bars denote the standard error of the mean of a minimum of four replicate vessels
Figure 6.8: Partitioning of (a) ochratoxin A and (b) mass at solid:liquid separation steps during vinification of Shiraz must (1 kg), 2004. Error bars denote the standard error of the mean of eight replicate fermentations
0.0
0.2
0.4
0.6
0.8
1.0
1.2
1.4
1.6
Must Pressing Clarification Racking
b
0
50
100
150
200
250
300
Must Pressing Clarification Racking
Gross lees
Wine
Grape lees
Clarified juice
Marc
Cloudy juice
Must
aO
A (
µg)
Mass (
kg)
0
10
20
30
40
50
60
70
Must Pressing Racking
Gross lees
Wine
Marc
Free run wine
Must
a
0.0
0.2
0.4
0.6
0.8
1.0
1.2
Must Pressing Racking
b
OA
(µ
g)
Mass (
kg)
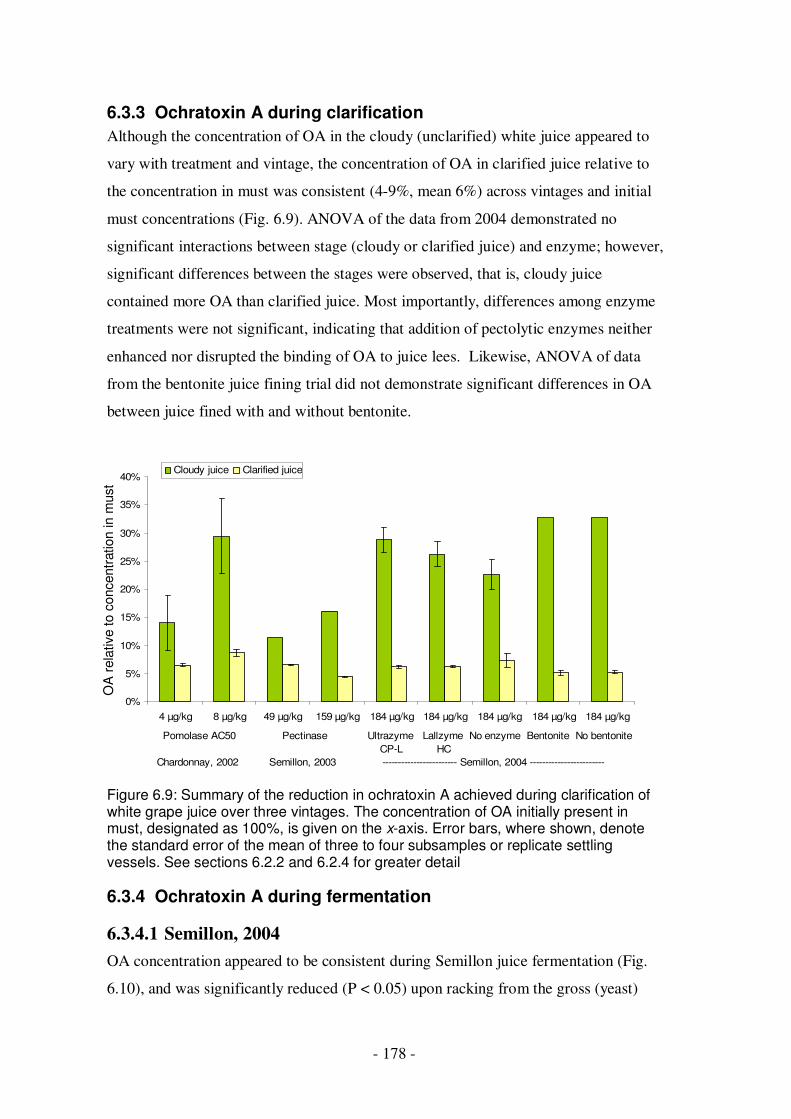
- 178 -
6.3.3 Ochratoxin A during clarification
Although the concentration of OA in the cloudy (unclarified) white juice appeared to
vary with treatment and vintage, the concentration of OA in clarified juice relative to
the concentration in must was consistent (4-9%, mean 6%) across vintages and initial
must concentrations (Fig. 6.9). ANOVA of the data from 2004 demonstrated no
significant interactions between stage (cloudy or clarified juice) and enzyme; however,
significant differences between the stages were observed, that is, cloudy juice
contained more OA than clarified juice. Most importantly, differences among enzyme
treatments were not significant, indicating that addition of pectolytic enzymes neither
enhanced nor disrupted the binding of OA to juice lees. Likewise, ANOVA of data
from the bentonite juice fining trial did not demonstrate significant differences in OA
between juice fined with and without bentonite.
0%
5%
10%
15%
20%
25%
30%
35%
40%
4 µg/kg 8 µg/kg 49 µg/kg 159 µg/kg 184 µg/kg 184 µg/kg 184 µg/kg 184 µg/kg 184 µg/kg
Cloudy juice Clarified juice
Pomolase AC50 Pectinase Ultrazyme Lallzyme No enzyme Bentonite No bentonite
CP-L HC
Chardonnay, 2002 Semillon, 2003 ------------------------ Semillon, 2004 ------------------------
Figure 6.9: Summary of the reduction in ochratoxin A achieved during clarification of white grape juice over three vintages. The concentration of OA initially present in must, designated as 100%, is given on the x-axis. Error bars, where shown, denote the standard error of the mean of three to four subsamples or replicate settling vessels. See sections 6.2.2 and 6.2.4 for greater detail
6.3.4 Ochratoxin A during fermentation
6.3.4.1 Semillon, 2004
OA concentration appeared to be consistent during Semillon juice fermentation (Fig.
6.10), and was significantly reduced (P < 0.05) upon racking from the gross (yeast)
OA
rela
tive to c
oncentr
ation in m
ust
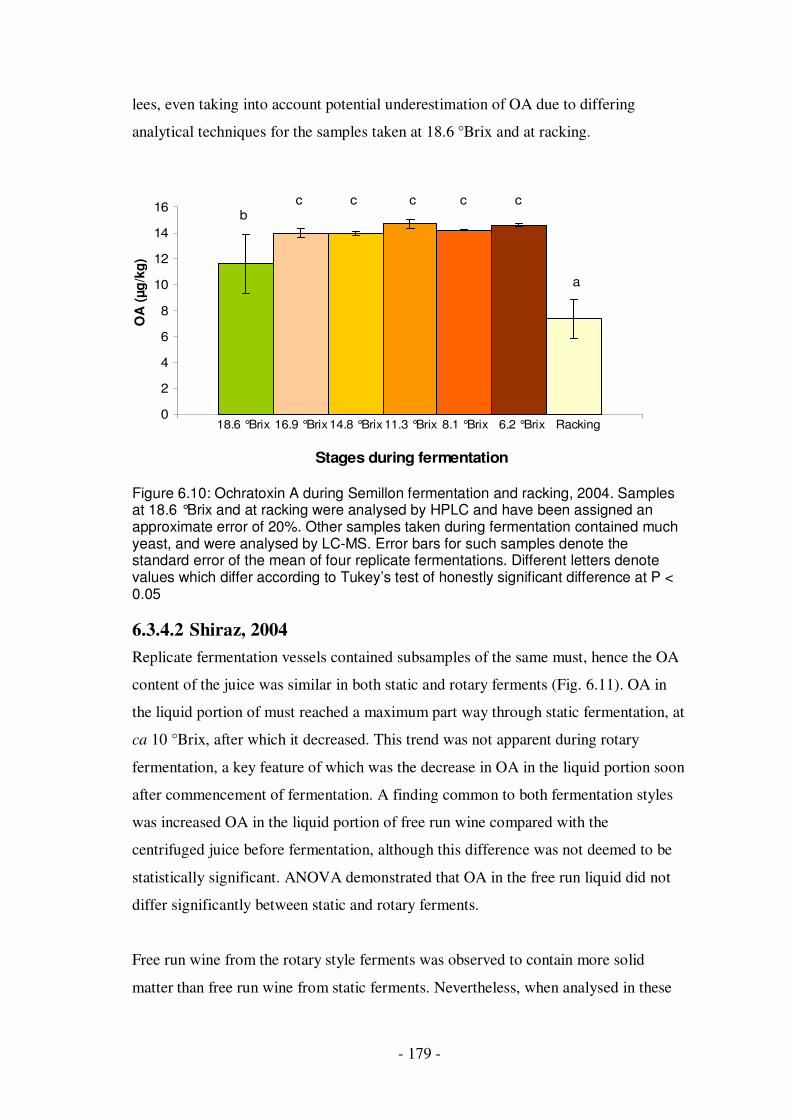
- 179 -
lees, even taking into account potential underestimation of OA due to differing
analytical techniques for the samples taken at 18.6 °Brix and at racking.
0
2
4
6
8
10
12
14
16
Stages during fermentation
18.6 °Brix 16.9 °Brix 14.8 °Brix 11.3 °Brix 8.1 °Brix 6.2 °Brix Racking
bc c c c c
a
Figure 6.10: Ochratoxin A during Semillon fermentation and racking, 2004. Samples at 18.6 °Brix and at racking were analysed by HPLC and have been assigned an approximate error of 20%. Other samples taken during fermentation contained much yeast, and were analysed by LC-MS. Error bars for such samples denote the standard error of the mean of four replicate fermentations. Different letters denote values which differ according to Tukey’s test of honestly significant difference at P < 0.05
6.3.4.2 Shiraz, 2004
Replicate fermentation vessels contained subsamples of the same must, hence the OA
content of the juice was similar in both static and rotary ferments (Fig. 6.11). OA in
the liquid portion of must reached a maximum part way through static fermentation, at
ca 10 °Brix, after which it decreased. This trend was not apparent during rotary
fermentation, a key feature of which was the decrease in OA in the liquid portion soon
after commencement of fermentation. A finding common to both fermentation styles
was increased OA in the liquid portion of free run wine compared with the
centrifuged juice before fermentation, although this difference was not deemed to be
statistically significant. ANOVA demonstrated that OA in the free run liquid did not
differ significantly between static and rotary ferments.
Free run wine from the rotary style ferments was observed to contain more solid
matter than free run wine from static ferments. Nevertheless, when analysed in these
OA
(µg
/kg
)
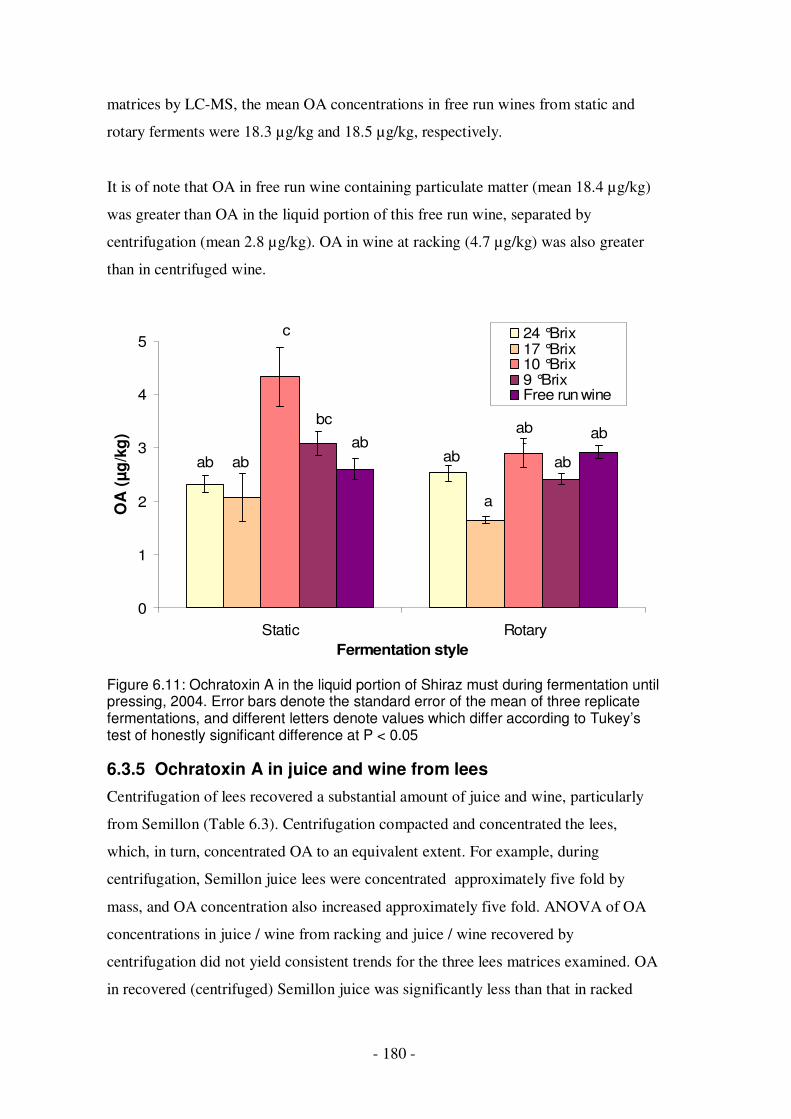
- 180 -
matrices by LC-MS, the mean OA concentrations in free run wines from static and
rotary ferments were 18.3 µg/kg and 18.5 µg/kg, respectively.
It is of note that OA in free run wine containing particulate matter (mean 18.4 µg/kg)
was greater than OA in the liquid portion of this free run wine, separated by
centrifugation (mean 2.8 µg/kg). OA in wine at racking (4.7 µg/kg) was also greater
than in centrifuged wine.
0
1
2
3
4
5
Static Rotary
Fermentation style
24 °Brix17 °Brix10 °Brix9 °BrixFree run wine
c
bc
ab
abab
a
ab
cab
ab
ab
Figure 6.11: Ochratoxin A in the liquid portion of Shiraz must during fermentation until pressing, 2004. Error bars denote the standard error of the mean of three replicate fermentations, and different letters denote values which differ according to Tukey’s test of honestly significant difference at P < 0.05
6.3.5 Ochratoxin A in juice and wine from lees
Centrifugation of lees recovered a substantial amount of juice and wine, particularly
from Semillon (Table 6.3). Centrifugation compacted and concentrated the lees,
which, in turn, concentrated OA to an equivalent extent. For example, during
centrifugation, Semillon juice lees were concentrated approximately five fold by
mass, and OA concentration also increased approximately five fold. ANOVA of OA
concentrations in juice / wine from racking and juice / wine recovered by
centrifugation did not yield consistent trends for the three lees matrices examined. OA
in recovered (centrifuged) Semillon juice was significantly less than that in racked
OA
(µ
g/k
g)

- 181 -
juice (P < 0.01); the interaction between enzyme treatment and juice type (racked or
centrifuged) was not significant, neither was the effect of enzyme treatment. Likewise,
OA in Shiraz wine recovered from the lees was significantly less than OA in racked
wine (P < 0.001); the interaction between fermentation style and wine type (racked or
centrifuged) was not significant, neither was fermentation style. In contrast, the OA
concentration of Semillon wine recovered from lees was approximately 11% greater
than that of racked wine (P < 0.01).
Table 6.3: Ochratoxin A concentration (µg/kg) in juice and wine recovered from lees by centrifugation, 2004
Juice / wine after racking
Juice / wine recovered from lees
Stage / Treatment OA
% by mass
OA Additional % by mass recovered
OA in lees
OA in compacted lees after centrifugation
Ultrazyme CP-L
11.4 ± 0.6a
60 ± 3 10.0 ± 0.3
33 ± 3
Lallzyme HC
11.5 ± 0.4
61 ± 2 10.6 ± 0.1
31 ± 4
Sem
illo
n ju
ice
clar
ific
atio
n
No enzyme
11.2 ± 0.3
68 ± 5 8.9 ± 0.9
27 ± 1
109.7 ± 3.8
502.3 ± 28.0
Semillon racking 1 7.3 ± 0.0
68 ± 0 8.1 ± 0.1
23 ± 1 55.4 ± 1.9
175.8 ± 13.4
Static ferment
4.6 ± 0.1
91 ± 1 3.0 ± 0.1
5 ± 0
Shi
raz
rack
ing
1
Rotary ferment
4.8 ± 0.1
86 ± 1 3.0 ± 0.0
9 ± 1
103.8 ± 7.7
230.0 ± 15.4
a standard error of the mean of three to four replicate vessels
6.3.6 Removal of ochratoxin A by fining agents
Bentonite was the fining agent most effective for the removal of OA from Semillon
wine (initial concentration ca 8 µg/kg), reducing OA significantly (P < 0.05) at both
low and high rates of addition (Fig. 6.12). K-caseinate also reduced OA but only at
the high rate of addition. For the Shiraz wine (initial OA concentration ca 5 µg/kg),
yeast hulls reduced OA significantly at both low and high rates of addition, whereas
gelatin was only effective at the high rate of addition. Other agents did not
significantly reduce OA.

- 182 -
The unfined Semillon contained 56 mg/L total proteins, comprising 33 mg/L PR4
proteins, 20 mg/L thaumatin-like proteins and 3 mg/L chitinases. In contrast, the
unfined Shiraz did not contain detectable proteins.
0%
10%
20%
30%
40%
50%
60%
70%
No f
inin
g
Bento
nite:
0.5
, 2.5
K-c
asein
ate
: 0.1
, 0.2
5
Gela
tin:
0.0
5,
0.1
5
Isin
gla
ss:
0.0
16,
0.1
0
PV
PP
: 0.2
, 0.8
No f
inin
g
Egg w
hite:
0.4
, 0.6
Gela
tin:
0.0
5,
0.1
5
Yeast
hulls
: 2.0
, 5.0
Low rate High rate
Semillon Shiraz
*
*
**
*
*
Figure 6.12: Effect of fining agents (g/L) added at two rates to wine containing ochratoxin A; Semillon ca 8 µg/kg, Shiraz ca 5 µg/kg. K-caseinate: potassium caseinate; PVPP: polyvinyl-polypyrrolidone. Error bars denote the standard error of the mean of three replicates. Asterisks denote treatments which conferred a reduction in OA significantly greater than that observed in the controls with no fining agent added, when analysed by Tukey’s test of honestly significant difference (P < 0.05)
6.4 Discussion
Some of the effects of berry infection with black Aspergillus spp., such as
discolouration and shrivelling, have been discussed in chapter 5. A notable feature
observed during winemaking was the maceration of the pulp of infected berries,
resulting in a greater extraction of grape pigments (Fig. 6.4). As members of
Aspergillus section Nigri are potent producers of pectinase (Raper and Fennell, 1965),
pectolytic activity could explain this observation. The increase in titratable acidity in
infected fruit was primarily due to the increase in citric acid and, to a lesser extent, to
berry shrivelling. The fungus, rather than the berry, was the likely source of this
additional citric acid. Strains of A. niger are used commercially in the production of
citric acid (Raper and Fennell, 1965), and it is probable that A. carbonarius, a closely
Red
ucti
on
in
OA

- 183 -
related species, also produces this acid. The observation that grapes harvested less
than 10 d after inoculation often contained more OA than grapes incubated for longer
periods may reflect fungal remetabolism of the toxin (section 4.4.3). However,
seasonal variation is likely to be important, as conflicting trends were noted in the
Semillon trial described in section 5.5, in which OA in bunches typically increased
markedly 10 d after inoculation.
Data on reductions in OA achieved during vinification emphasised the importance of
solid:liquid separation steps, first at pressing and, subsequently, after fermentation and
racking from the gross lees; extent of reduction at these stages was in broad
agreement with that reported by Fernandes et al. (2003, 2005) (Table 6.4). This study
demonstrated that, during storage for 10-14 months, OA decreased by 22% and 29%
of the concentration at bottling for white and red wines, respectively. Likewise,
Garcia Moruno et al. (2005) reported an 8% reduction in OA added to red wine,
mixed, and held at room temperature for 55 d, and a 10% reduction after 80 d. In
contrast, Lopez de Cerain et al. (2002) did not report a decrease in OA concentration
after storage of wine for 12 months. Perhaps these conflicting data arose due to
bottling at a later stage of the wine maturation process, after which some precipitation
had already occurred. The apparent greater reduction observed upon storage of red
wines than of white wines in this study, could be associated with the more complex
matrix in red wines, representing a greater potential for binding OA during
polymerisation of various molecules and settling of those aggregates.
Table 6.4: Comparison of reduction in ochratoxin A during vinification achieved in this and two related studies
OA relative to concentration in must (crushed grapes)
Citation Vinification Initial OA concentration in grapes (µg/kg) After pressing
After first racking
White 4-184 mean 20% mean 4% This study Red 4-300 mean 25% mean 9% White with maceration
7 15% 11%
White without maceration
7 45% 30-33%
Fernandes et al. (2003)
Red 9 8% 6% Red 0.4-7 mean 42% mean 17% Fernandes et
al. (2005) Port 0.1-5 (in juice) mean 8% relative to juice
not reported

- 184 -
Regarding mass transfer of OA throughout white and red vinification (Figs 6.7, 6.8),
the amount of OA in marc was probably overestimated, which led to the sum of OA in
marc and juice / wine being greater than that initially present in must. The reason for
overestimation lay in the difficulty of obtaining homogeneous samples of marc and,
more specifically, in homogenisation of this marc subsample with sufficient quantities
of water to bring the OA concentration within a range suitable for analysis by stable
isotopic dilution. Despite mixing, heavier seed particles settled immediately, whereas
lighter skin particles remained suspended in the homogenate. Thus a 15 g sample of
homogenate was biased towards sampling the skins, which often contain a greater
concentration of OA than pulp (Battilani et al., 2001), and biased against sampling the
seeds, which are sterile (Bau et al., 2005a) and thus unlikely to contain OA. Data for
mass transfer at subsequent stages demonstrated a clear passage of OA with no
substantial losses, suggesting that OA was not degraded during vinification; rather, it
was partitioned between solid and liquid phases, and thus discarded with the solids.
During red vinification, 24% of the total amount of OA in grapes was present in red
wine after pressing, and 5% after the first racking. Fernandes et al. (2005) reported
similar values (32% and 11% after pressing and racking, respectively). The lower
values observed for white vinification in this study (20% and 1% after pressing and
racking, respectively) could be attributed to two fundamental differences between red
and white vinification. First, pressing of white grapes occurred before fermentation,
hence, in the absence of alcohol, OA was poorly soluble in the liquid phase. Second,
white juice clarification before fermentation reduced OA to 3% of the amount in must,
and this removal of grape proteins to which OA was bound may have enhanced the
competitive binding of OA to yeast during fermentation. OA bound efficiently to
white grape lees and red gross lees after fermentation, hence it was possible to
concentrate these lees by centrifugation and recover additional juice or wine, without
liberating OA into solution (Table 6.3). In fact, the OA concentration in recovered
(centrifuged) Semillon juice and Shiraz wine was lower than in racked juice / wine,
possibly as centrifugation, in addition to concentrating the lees, removed particulate
matter from the juice / wine. The binding to white gross lees did not appear to be as
strong, as OA in the recovered (centrifuged) wine was 11% greater than in the racked
wine. Garcia Moruno et al. (2005) mentioned that binding of OA to yeast during
white fermentation did not appear to be as strong as during red fermentation. Given

- 185 -
the small number of replicates (n = 3) in this study and the similarities in
concentration between racked and recovered juice / wine, further investigation is
required to determine if the practice of recovering juice and wine from lees, which
may be beneficial economically, increases the risk of OA contamination. Of greater
concern is the potential use of waste streams, such as rachides after crushing (section
5.5.2), marc and lees, for production of grape alcohol, or extraction of tartaric acid,
tannins or grapeseed oil. OA is fairly heat stable (Roset, 2003; Arici et al., 2004) and
little is known about the fate of OA during these processes, although OA has not been
detected to date in grape alcohol distilled from such streams (Tarac Technologies,
pers. comm. 28/07/04).
The linear decrease in OA observed by Lataste et al. (2004) during juice fermentation
appears to be due to binding of OA to the increasing yeast biomass, rather than
degradation. When this biomass was included in the analysis (Fig. 6.10), OA
concentration was constant throughout white juice fermentation, and only decreased
after the yeast cells precipitated and the wine was decanted from the gross lees. These
data are supported by the findings of Bejaoui et al. (2004) and Lataste et al. (2004)
discussed in section 6.1. It is, likewise, likely that OA is not degraded during red must
fermentation; however, meaningful repeated sampling of homogeneous must from
small-scale fermentation vessels is difficult. Nevertheless, sampling the liquid portion
alone indicated the complex partitioning of OA during red must fermentation, as
potentially two competing effects existed. As for juice fermentation, the increase in
yeast biomass would bind OA; however, increasing alcohol concentration may have
increased extraction of OA from the skins and pulp into the liquid phase. The
fluctuations in OA in the liquid phase during static and rotary fermentations of red
must (Fig. 6.11) were likely to result from these competing effects. For example, the
maximum OA concentration observed partway through static fermentation could
hypothetically be due to alcohol increasing the solubility of the toxin; however at later
phases, yeast biomass increased to bind this OA again. Greater maceration of pulp by
rotary fermentation may have bound more OA during the early to middle stages of
fermentation, most notably at 17 °Brix. Given these differences in the amount of
particulate matter generated by these fermentation styles, it is of note that the OA
concentration in free run wine at pressing did not differ significantly between styles,
when considering either the liquid portion of wine, or the total wine including

- 186 -
suspended particulate matter. Perhaps an equilibrium of OA between the solid and
liquid phases was reached upon completion of must fermentation, as the amount of
OA, alcohol, yeast, and grape solids would be the same for both fermentation styles,
even though the grape solids from rotary fermentation would be, on average, of
smaller particle size than those from static fermentation. The process of draining and
then pressing the free run juice through the marc would allow the solid and liquid
phases to equilibrate rapidly. OA was strongly associated with solids in free run wine
and even wine after racking, as the centrifuged liquid portion of free run wine
contained much less OA than the former substrates (2.8 µg/kg cf 18.4 µg/kg and 4.7
µg/kg in free run wine and racked wine, respectively)
Two stages other than fermentation during which OA was reduced were clarification
and racking, and these were examined to ascertain the effect of commonly used
adjuvants on removal of OA. Pectolytic enzymes are commonly added to grapes at
crushing to enhance the recovery of juice during pressing (Rankine, 1989). No clear
trends emerged regarding the effect of enzymes on OA in cloudy juice compared with
that in crushed grapes (must) (Fig. 6.9), possibly due to slight differences in pressing
between the different vintages and treatments. However, regardless of the presence
and type of enzyme added, the concentration of OA in clarified juice (4-9% of initial
concentration in must) was remarkably consistent over the three vintages with initial
concentrations 4-184 µg/kg OA in must. Addition of pectolytic enzymes, thus, did not
appear to enhance or disrupt the binding of OA to grape solids. It should be noted that
fungal pectinases potentially present in infected fruit (activity postulated in Fig. 6.4
for Shiraz must) may have contributed substantial pectolytic activity above that of the
enzymes added. These data suggested that the nature and amount of grape solids to
which OA was initially bound in white juice, were the primary determinant of the
extent of reduction in OA and, furthermore, that the presence of these grape solids
was fairly consistent across cultivar and vintage. Whereas the addition of bentonite to
cloudy juice may have compacted lees, it did not, itself, bind additional OA; neither
did it increase the net amount of lees, on a wet or dry weight basis (data not shown),
to which OA was bound. Hence, as observed for pectinases, addition of bentonite also
did not enhance precipitation of OA with grape solids beyond that which occurred due
to natural settling. The relatively poor ability of bentonite directly to bind and
precipitate OA was reported by Castellari et al. (2001) during a wine fining trial.

- 187 -
These authors found that bentonite was an efficient adsorbent of OA per unit surface
area; however, at concentrations used in wine fining, the active surface area was small
and limited its efficacy compared with agents such as activated charcoal.
Data from the trial of various fining agents used in Australia are compared with
published results for those agents in Table 6.5. It should be noted that the wine matrix
after racking from the gross lees is markedly different from juice, in that OA is more
soluble in wine than juice, due to the presence of alcohol and, furthermore, the
molecules to which OA may already be bound are also likely to be soluble in wine.
Thus removal of OA at this stage involves more than simple precipitation or filtration
of solids. Rather, it requires either direct binding and precipitation of OA, or binding
and precipitation of molecules to which OA is already bound. The significant
reduction in OA achieved through addition of bentonite to Semillon wine (Fig. 6.12)
was similar to that reported by Fernandes et al. (2005), and stands in marked contrast
to its lack of efficacy as a juice fining agent (section 6.3.3) or as a wine fining agent
reported by Castellari et al. (2001). Castellari et al. (2001) noted that bentonite was
typically used to bind and precipitate proteins in wine, and postulated that proteins
would compete with OA for binding sites on bentonite particles. The data in this study
suggested that “sandwich” rather than competitive binding occurred; that is, OA was
bound by ionic interactions (Valenta, 1998) to grape-derived proteins present at 56
mg/L wine, which, in turn, were bound to bentonite and precipitated from the wine.
Indirect support for the hypothesis that OA was already bound to proteins in wine was
present in the form of relatively poor reductions in OA achieved with gelatin and K-
caseinate, both proteinaceous agents which were reported by Castellari et al. (2001) to
be more effective than bentonite for the removal of OA. These proteins would have
competed with proteins already present for binding OA, while only slightly enhancing
the precipitation of various protein aggregates. This model is supported by data from
Lataste et al. (2004), who demonstrated that a combination of gelatin (to bind OA)
and bentonite (to bind and precipitate the gelatin) was more effective for reducing OA
than combinations of gelatin and silica gel or gelatin and gallotannins. These authors
also demonstrated that filtration after fining to remove fine particles and flocs further
reduced OA. PVPP was not an effective fining agent for removal of OA, as previously
demonstrated (Table 6.5); neither was isinglass, in this, the first test of its efficacy for
toxin reduction.

- 188 -
The Shiraz wine in this trial did not contain detectable proteins; hence, proteinaceous
fining agents such as gelatin and egg white both reduced OA slightly more than
observed in the control wine with no agent added. This reduction was significant for
gelatin at the higher fining rate. Gelatin achieved a greater OA reduction in the Shiraz
than the Semillon wine, in terms of both amount and proportion of toxin removed. In
the absence of proteins in the Shiraz wine, OA was likely to be present in wine in a
freely-soluble form, thus readily bound to the gelatin, whereas in the Semillon wine,
other proteins already present may have competed with gelatin for the binding of OA.
These suggestions contradict the hypothesis of Castellari et al. (2001), who proposed
that polyphenols in red wine would compete with OA for binding sites on gelatin,
hence predicting that gelatin would be less effective in red than in white wine. The
competitive interactions between OA, fining agent, proteins in wine and polyphenols,
are evidently complex. The efficacy of yeast hulls added as a fining agent to bind OA
has been demonstrated in this study, and is supported by findings on the binding
properties of yeast material during fermentation as discussed above, or when added as
a preparation of live or inactivated yeasts, or even as yeast lees after fermentation
(Table 6.5; Bejaoui et al. (2004), Garcia Moruno et al. (2005)). Data from this and
other fining trials have highlighted that no single fining agent, apart from, perhaps,
activated charcoal (as reported in section 6.1), uniformly delivers the maximum
reduction in OA in every type of wine. Rather, in the future it will be necessary to
identify which constituents of wine, such as proteins or polyphenols, interact critically
with OA and with the fining agents. After measuring these key parameters, it may
then be possible to select the fining agent or combination of agents, and rates of
addition, most likely to reduce OA while minimising impact on the wine sensory
attributes.
This study has demonstrated that the majority of OA present in grapes is removed
during vinification, regardless of the initial severity of contamination of the grapes,
brought about, in this instance, by direct inoculation with A. carbonarius. Natural OA
contamination of grapes at harvest appears be relatively infrequent (Sage et al., 2002;
Bellí et al., 2004c; Sage et al., 2004). Battilani et al. (2005b) and Serra et al. (2005b)
reported maximum OA concentrations in grapes at harvest of only 0.65 µg/kg in 2003,
and 0.06 µg/kg in 2002, respectively. The highest concentration of OA occurring

- 189 -
naturally in grapes at harvest reported to date is 13 µg/kg, from an Italian vineyard in
1999 (Battilani et al., 2003a). An 85% reduction in OA concentration during
vinification would be required for wine made from such grapes to meet the European
limit of 2 µg/L (European Commission, 2005), and this extent of reduction seems
achievable based on vinification data (Table 6.4). Infrequent or low levels of OA
contamination, coupled with removal of OA during winemaking, are likely to have
led to the relatively infrequent incidence of OA contamination of wine (Fig. 1.2).

Table 6.5: Efficacy of fining agents in this study for the reduction of ochratoxin A, compared with related studies
Citation This study Castellari et al. (2001)
Dumeau and Trione (2000)
Silva et al. (2003) Fernandes et al. (2005)
Wine type White (Semillon)
Red (Shiraz) Red Red Red White Red
OA source wine made from OA contaminated grapes
OA naturally occurring in unclarified wine
OA added to wine
OA naturally occurring in wine
OA added to crushed grapes before vinification
Initial OA concentration in wine
7.6 µg/kg 8.0 µg/kg
5 µg/kg
3.78 µg/L 1.5 µg/L
2 µg/L 1.9 µg/L 1.68 µg/L 0.64 µg/L
not stated > 0.56 µg/La > 0.73 µg/La
Volume 100 mL 100 mL 50 mL not stated 500 mL not stated not stated Fining incubation > 48 h at room
temperature > 48 h at room temperature
12 h at 4 °C 48 h 25 °C, time not stated
not stated not stated
Removal of fining agent
centrifugation, 3000 rpm x 15 min
centrifugation, 3000 rpm x 15 min
2900 g x 15 min filtration centrifugation, 5000 rpm x 15 min, then filtration
not stated not stated
Fining agent addition rate; reduction in OA compared with initial concentration in wine No agent 3-7% 3-5% not tested not tested not tested 29% not stated Gelatin white, 0.015-0.12 g/Lb red, 0.03-0.3 g/Lb
0.05 g/L; 2% 0.15 g/L; 11%
0.05 g/L; 12% 0.15 g/L; 21%
1 g/L; 17-30% not tested not tested not tested 0.1 mL/L; 8-21% more than controlc
Bentonite 0.5-3.0 g/Lb
0.5 g/L; 37% 2.5 g/L; 67%
not tested 1 g/L; 8% not tested not tested 0.5 g/L; 40% (7-17% more than controlc)
not tested
Potassium caseinate 0.05-0.25 g/Lb
0.1 g/L; 2% 0.25 g/L; 17%
not tested 1 g/L; 24-35% not tested not tested Casein, 0.4 g/L; 0-13% more than controlc
not tested
- 190 -

PVPP 0.1-0.8 g/Lb
0.2 g/L; 8% 0.8 g/L; 12%
not tested 1 g/L; < 1-6% not tested not tested 0.16 g/L; 0-27% more than controlc
not tested
Egg white 0.3-0.6 g egg white/Lb
not tested 0.4 g/L (ca 0.16 g protein/L); 8% 0.6 g/L; 12%
1 g/L; 40-42% not tested not tested not tested 0.1 g/L; 22-34% more than controlc
Yeast hulls 1-5 g/Ld
not tested 2 g/L; 28% 5 g/L; 43%
not tested 0.5 g/L; 13%
0.5 g/L; 13% 1.0 g/L; 32%
not tested not tested
a concentration after settling with no fining agent b ranges for rates of addition in common use in Australian viticulture, taken from Iland et al. (2000) c reduction in OA reported relative to control, to which no fining agent was added d range in common use in Australian viticulture (A. Markides, pers. comm. 21/01/04)
- 191 -

- 192 -
7 General Discussion
7.1 Strategies to minimise ochratoxin A in grapes and wine
7.1.1 Viticulture
Strategies to minimise OA in grapes can be classified into two categories: those that
can be implemented as part of general vineyard management, and those more
specifically targeted towards grapes at risk of OA contamination.
Damage to grapes and, to a lesser extent, spore coverage, were shown to affect the
severity of Aspergillus rot. These risk factors may be reduced through vigilant
vineyard management. The importance of prophylactic application of insecticides to
minimise damage to grapes and subsequent OA formation was highlighted by Lataste
et al. (2004). Application of both fungicidal and insecticidal sprays to minimise berry
damage and bunch rot already forms the basis of most Australian vineyard
management programs. Manipulation of irrigation, canopy density and bunch
architecture, to reduce the risk of berry splitting and subsequent rot development
associated with large, compact bunches within dense canopies, further reduces the risk
of OA formation. As soil is the main reservoir of black Aspergillus spp. in vineyards
(Kazi et al., 2004), reducing such species in soil, in turn, reduces the number of spores
that may be blown onto bunches, that is, the extent of spore coverage. Practices such
as minimal soil tillage, irrigation to increase soil moisture and certain types of mulch,
were shown to decrease A. carbonarius in soils (Kazi et al., 2004; Leong et al., 2005a).
Some conflicting observations between those studies and the simple water activity x
temperature model examined in chapter 4 serve to highlight the complex interactions
in soil which determine the long-term viability of fungal propagules. Perhaps the wide
implementation of such vineyard and soil management practices in the large-scale,
technology-driven viticulture associated with “new world” wine-producers,
contributes to infrequent OA contamination of those wines.
In the long term, alternative management strategies could involve genetic
manipulation of grapevines to increase production of pathogenesis-related (PR)
proteins and phytoalexins, which confer resistance to a range of fungal pathogens.
Genetic manipulation may involve plant breeding or genetic modification, the latter

- 193 -
requiring consumer acceptance to proceed. PR proteins and phytoalexins are produced
constitutively at well defined stages of berry development, and are also induced in
response to fungal infection (Jacobs et al., 1999; Tattersall et al., 2001; Jeandet et al.,
2002). However, a conundrum arises. PR proteins may protect the vine from fungal
infection, but these molecules resist degradation during vinification and thus cause the
development of haze in white wines upon storage; methods for their removal often
detrimentally alter wine quality (Ferreira et al., 2004). In contrast, phytoalexins appear
to be ideal candidates for increased production through genetic manipulation, as, in
addition to limiting fungal growth, the phytoalexin, resveratrol, may have positive
effects on human health (Jeandet et al., 2002). Infection by A. carbonarius stimulated
production of certain phytoalexins in berries and, in turn, these compounds
incorporated into culture media restricted growth of this species (Bavaresco et al.,
2003). Whereas growth was restricted by phytoalexins in those media, OA production
was stimulated. Further study of the interaction of these compounds with a wide range
of fungi is essential.
Targeted management strategies require prior identification of vineyards or regions in
which grapes and wine are at risk of OA contamination. Several researchers in Europe
report increased isolation of black Aspergillus spp. in warm climates, either resulting
from geographic or seasonal variation (section 5.1). Increased rainfall and humidity
were associated with decreasing isolation of Aspergillus in Italy and Portugal (Serra et
al., 2003; Battilani et al., 2005b) but had no obvious effect in Spain (Bellí et al.,
2005a). These and other data were incorporated into a model for incidence of black
Aspergillus contamination of grapes in southern Europe (Battilani et al., 2005a). The
critical parameters for this model were determined to be the summation of daily
temperatures (positive term) and rainfall (negative term) during August; that is, the
period from early veraison to berry ripeness. Increased contamination by Aspergillus
in warm conditions is likely to be associated with optimum temperatures for growth
above 35 °C for A. niger, the most commonly isolated species, and around 30 °C for A.
carbonarius. The optima appear to be similar for European isolates and those from
Australia examined in this study. Increased Aspergillus contamination in dry
conditions could be associated with prolonged survival, particularly in soil (Kazi et al.,
2004), as well as the general ability of black Aspergillus species to compete with other
fungi at reduced water activities, hence their frequent isolation from dried foods (Pitt

- 194 -
and Hocking, 1997). Temperature was observed to exert a greater influence than
water activity on growth rate in this study; likewise, the model of Battilani et al.
(2005a) demonstrated that the effect of temperature on incidence of Aspergillus was
stronger than the effect of rainfall. Those authors also noted that humidity was
influenced by proximity to the sea, as well as rainfall. Most importantly, they strongly
cautioned against assuming a direct correlation between incidence of Aspergillus spp.
and OA contamination, in keeping with the findings of Battilani et al. (2005b) and
Bellí et al. (2005a). This is apparent when considering that Aspergillus spp. increased
in dry conditions, as discussed above, but OA in grapes increased in humid (Roset,
2003) and wet conditions (Battilani et al., 2003a). Humid and wet conditions may
facilitate OA formation through increase in damage to berries and thus Aspergillus rot.
However, such damage may involve a number of related mechanisms, such as
increased canopy density, increased bunch weights, increased susceptibility to
mildews or primary Botrytis rots, or even direct berry splitting following summer rain.
Predictive modelling of OA contamination is complex, due to several competing
effects (Fig. 7.1). For example, warm temperatures increase the incidence of
Aspergillus; however, cool temperatures extend ripening periods, and thus increase
the potential for berry damage through infection by B. cinerea or insect infestation,
both of which can lead to subsequent development of Aspergillus rot and OA
formation. Likewise, black Aspergillus spp. infecting berries from veraison onwards
may produce more OA below 20 °C, but grow faster and may remetabolise OA more
rapidly above 30 °C. It seems unlikely that warm regions with a high initial incidence
of Aspergillus contamination would experience the extended periods below 20 °C
before harvest that are favourable for OA production; thus, the significance of cooler
temperatures overnight requires further examination. It is possible that climate and
related effects influence OA formation even more than cultivar (Battilani et al., 2004;
Battilani et al., 2005b). Current models to predict incidence of Aspergillus could
identify particular regions and seasons in which grapes were at risk for OA
contamination. However, sophisticated monitoring would then be necessary to
implement measures specifically to minimise OA formation in those vineyards.
Tools for monitoring the incidence of toxigenic black Aspergillus spp. include the
simple lateral flow immuno-assay (Danks et al., 2003) to test for OA production by
- 195 -
fungi grown on standard culture media. This technique does not require identification
to the species level. Alternatively, PCR-based methods can identify species such as A.
carbonarius (Perrone et al., 2004), in which the majority of strains are toxigenic.
Development of PCR-based methods for the detection of toxigenic A. niger strains is
likely to be hampered by the close genetic relationship between non-toxigenic and
toxigenic strains, as demonstrated in this study. In addition, such a method may not be
useful for vineyard monitoring, as only a small proportion of A. niger strains are
toxigenic and, thus, such strains probably contribute infrequently to OA
contamination.
If toxigenic black Aspergillus spp. were frequently identified in a vineyard in the
months before harvest, application of fungicidal sprays, such as those containing the
combination, cyprodinil and fludioxonil, may reduce the incidence of Aspergillus rot
and OA contamination (Lataste et al., 2004; Tjamos et al., 2004; Battilani et al.,
2005b). In this study, fungicidal sprays did not appear to hinder development of
Aspergillus rot in bunches which were artificially inoculated; however, Lataste et al.
(2004) noted that fungicides which had no apparent effect on artificially inoculated
bunches were, nevertheless, useful in reducing naturally occurring infection. It is not
clear if data from fungicide trials in one region would be applicable to other regions or
countries, given differences in factors such as climate, cultivar, canopy management
and general microbiota. However, black Aspergillus strains characterised in chapter 3
from various regions and, indeed, substrates, appear to be interrelated at the molecular
level, thus may respond to fungicides in a similar manner. The only exception to these
data was the slight clustering of A. carbonarius strains from Queensland, one of
which (FRR 5692) also grew faster and produced more OA than strains from other
regions. If these physiological traits are shared by other strains in the cluster, this
association between strain relatedness, physiology and location would warrant further
investigation and, in turn, may require regionally-specific management strategies.
Approaches other than fungicidal sprays, which may reduce the potential for
Aspergillus rot, include leaf removal (Duncan et al., 1995), which improves aeration
within the canopy. It should be noted that these management techniques target
formation of OA during visible infection with black Aspergillus spp. after veraison.
The relative importance of OA production resulting from asymptomatic infection and

- 196 -
OA production in immature, pea size berries, the latter observed in both natural and
inoculated settings (Battilani et al., 2001; Serra et al., 2005b), is yet to be established.
Such modes of OA formation, if significant, could require alternative measures to
minimise OA.
Vineyards identified as at risk of OA contamination would require careful monitoring
during the period for Aspergillus rot development and OA formation between
veraison and harvest, when berries are at aw 0.98-0.95. In a vineyard with a high
proportion of toxigenic isolates, bunches or clusters displaying severe Aspergillus rot
could, if necessary, be removed by hand, as OA appears to be concentrated in severely
diseased berries. Such visual inspection typically occurs during harvest of table grapes,
possibly leading to the infrequent OA contamination in that commodity. However,
mouldy grapes are usually discarded onto the vineyard floor, thus potentially
contributing to the reservoir of Aspergillus spp. in the soil, as observed for table grape
vineyards in Queensland.
Rapid methods for the detection of OA in grapes are required for monitoring OA
contamination in vineyards and also at receival at the winery. Opportunities and
limitations for PCR-based methods in this setting are discussed in chapter 3. Current
methods for quantification of OA in grapes and wine rely on HPLC, which is
relatively time-consuming. Immunological assays have been hampered by compounds
in grapes and wine which inhibit antibody binding (Ngundi et al., 2005). A system for
representative sampling of grapes both in the vineyard and at receival, coupled with a
semi-quantitative analytical method to detect OA in grape juice on site, would be of
immense value. The tube immunoassay format (Dewey and Meyer, 2004) described
for screening fungal antigens in grape juice at receival shows some promise.
Detection of OA in the weeks before harvest could prompt implementation of some of
the strategies described above, whereas detection of OA at receival would provide
wineries with vital information for rejecting the load.

Figure 7.1: Factors which may affect the incidence and growth of black Aspergillus spp. in vineyards and formation of ochratoxin A in grapes, in particular, changes in temperature (Temp.) and water activity (aw) or relative humidity (R.H.). ↑ = increase; ↓ = decrease
Be
rrie
s
B
un
ch
es V
ine
s
V
ine
ya
rds
Dormancy Berry set Veraison Harvest Drying
aw ↓: better survival of A. carbonarius in soil
Rainfall ↓: dry, Aspergillus spp. ↑ (compete effectively)
Rainfall ↑: canopy density ↑, bunch weight ↑
Temp. 25 °C: better survival of A. carbonarius in soil
Temp. ↑: Aspergillus spp. ↑ (compete effectively, growth rate ↑)
Rainfall ↑: Summer rain, berry splitting ↑, Aspergillus rot ↑
R.H.↑: Botrytis and other bunch rots ↑, mildews ↑, Aspergillus rot ↑
Temp. ↓: extended ripening, potential for Botrytis ↑, insect damage ↑, Aspergillus rot ↑
Temp. ↑: Aspergillus spp. growth rate↑
Temp. 15-20 °C (optimum): OA↑
----- UV light causes spore death? -----
aw 0.98-0.95 (optimum): OA ↑
aw < 0.95: Aspergillus spp.
growth rate ↓, OA ↓
Temp. ↑: rapid drying aw ↑: OA produced in pea size berries? ↑
------------------------------------ pH ?-----------------------------------
------------------------------------ Phytoalexins ?-------------------------------
---------------------------------------------------------------- Soil tillage ↓: Aspergillus spp. ↓ -----------------------------------------------------------
- 197 -
- 198 -
7.1.2 Dried vine fruit production
In addition to the strategies proposed for viticulture, rapid drying of fruit to below
0.92 aw would minimise the risk for OA formation, given that toxin production
decreases markedly between 0.95 and 0.92 aw, especially at 25 °C and above. The
finding that severely infected, discoloured berries were the primary source of OA in
Semillon bunches inoculated with A. carbonarius supports a previous report that dried
berries, darkened as a result of berry splitting and/or natural fungal infection,
displayed greater black Aspergillus counts and OA contamination than golden berries
(Leong et al., 2005a). Further refinements in laser and colour sorting technology may
prove useful for removing dark amber berries and thus reducing the overall OA
concentration in contaminated loads.
7.1.3 Oenology
The greatest reduction in OA was achieved during pressing of grapes, and additional
reductions may be achieved through manipulation of subsequent solid:liquid
separation stages. However, trials reported in chapter 6 demonstrated that certain
variations in common Australian oenological practice had neither detrimental nor
positive effects on OA reduction. Such practices included pectolytic enzyme treatment
of white must, bentonite fining of white juice, static or rotary fermentation of red must,
and recovery of juice from white grape lees or wine from red gross lees by
centrifugation.
The primary mode of removal of OA during vinification was adsorption to solids and
proteins, rather than degradation. In particular, binding of OA to yeast cells during
fermentation appeared to play an important role in OA reduction, one that is not
possible in grape juice production, leading to the observation in chapter 1 that
contamination in juice was often greater than in wine in the same studies. Bejaoui et
al. (2004) proposed that this adsorptive capacity of yeasts could be exploited to bind
OA in synthetic and commercial grape juices. In those trials, heat- or acid-treated
yeast cells removed more OA than viable cells, as the treatments denatured yeast
proteins and created more binding sites; acidic conditions also enhanced binding of
OA to yeast cells via protonation of the molecule. Heat-treated yeast cells bound OA
more rapidly than commercially available yeast hulls, though both completely

- 199 -
removed OA from red grape juice (10 µg/L) within 15 min. In vinification, treated
yeast cells could be added to juice or must at the start of fermentation to bind OA, in
keeping with the occasional practice of adding yeast hulls to activate fermentation
through the release of essential fatty acids and vitamins. This would increase the
amount of OA removed by increasing the adsorptive biomass. Furthermore,
fermentative yeast strains could be chosen based on efficiency in adsorbing OA
(Bejaoui et al., 2004). Differences among strains of lactic acid bacteria, in terms of
OA removal during malolactic fermentation (Silva et al., 2003), may also be exploited,
although it is unclear whether these differences arise from differing efficiencies in
converting malic acid into biomass to bind OA or if strains possess enzymes which
degrade OA. Nearly equivalent amounts of OA present in wine before, and in wine
and lees after, malolactic fermentation (Fernandes et al., 2005) would suggest that
removal of OA occurred due to adsorption rather than degradation.
During post-fermentation fining, the adsorptive properties of yeast hulls may again be
useful for reducing OA in red wines. Analysis of the initial protein content in wine
may also guide the selection of a suitable fining agent or combination of agents.
Agents such as bentonite may remove proteins to which OA is already bound,
whereas agents such as gelatin may provide proteinaceous material to which OA can
bind; these may also be used in combination. A novel technique to exploit the
excellent OA-binding properties of activated charcoal (Dumeau and Trione, 2000;
Castellari et al., 2001; Silva et al., 2003) has been proposed (Summary Year 3;
http://www.ochra-wine.com, accessed 24/03/05), which also takes into account the
tendency of charcoal to remove most of the wine pigments. A proportion of red juice
was set aside before fermentation, fined with charcoal to remove OA, then added back
into the fermentation vessel to extract pigments from the pomace. However, given
current OA contamination levels in Australian wines, such a technique is probably not
warranted in this country.
Multiple methods exist for the screening of finished wines for OA before release to
the domestic market or for export; some methods are amenable to automation (Brera
et al., 2003). Of note is the development, for this study, of a stable isotopic dilution
method for OA analysis, suitable for a wide range of substrates because the internal

- 200 -
standard corrects for variations in recovery. Such a method will be useful to study the
suitability of marc and lees, in which is OA concentrated, for subsequent processing.
7.2 Concluding remarks
Much progress has been made over the past 10 years since the first reports of OA in
wine, in terms of identifying the source of contamination, conditions associated with
the development of Aspergillus rot and toxin production, and the binding of OA to
solids during vinification. Strategies applicable to both wine and dried vine fruit
vineyards are being formulated for reducing the incidence of toxigenic Aspergillus
spp. in vineyards, predicting regions in which grapes are at risk of OA contamination
and controlling rots using fungicide application programs. Research to clarify whether
the primary mode of infection is opportunistic, latent, or otherwise, is still required, as
is information on toxin production and degradation with regard to berry maturity.
Identifying the genes for OA production by black Aspergillus spp. and elucidating
their regulation at a molecular level may yield tools for understanding the complex
interactions between the fungus, environment and substrate. Extensive surveys of
wines produced worldwide have demonstrated that OA is seldom present at
concentrations above the 2 µg/L limit recently introduced by the European Union
(European Commission, 2005); thus, it appears unlikely that this limit will restrict
trade in the international wine export market, worth over US$17 billion in 2003.
However, a better understanding of factors affecting OA contamination in vineyards
and during winemaking will provide the grape industry with tools to manage future
challenges. Such challenges may arise due to planting grapes in new regions,
introduction of new cultivars, moves towards organic viticulture, or even climate
change. Continued vigilance is necessary to minimise OA contamination of grapes
and wine.

- 201 -
Appendices
A Mycological media Inorganic reagents were of analytical grade or better and were obtained from APS (Seven Hills, NSW, Australia), BDH (Merck, Kilsyth, Vic, Australia) or Sigma (St Louis, MO, USA). Unless otherwise stated, glucose was obtained from Scalzo Food Industries (as dextrose monohydrate from wheat; Kensington, Vic, Australia), sucrose from Woolworths (Homebrand white sugar; Yennora, NSW, Australia); yeast extract and peptone from Amyl Media (Dandenong, Vic, Australia) and agar from Gelita (Beaudesert, Qld, Australia). Coconut Cream Agar (Dyer and McCammon, 1994) Coconut Cream 500 mL (Trident, Thailand) Agar 15 g RO water 500 mL Sterilise by autoclaving at 115 °C for 15 min. Czapek Yeast extract Agar (Pitt and Hocking, 1997) KH2PO4 1 g Czapek concentratea 10 mL Trace metal solutionb 1 mL Yeast extract, powdered 5 g Sucrose 30 g Agar 15 g RO water 1 L Sterilise by autoclaving at 121 °C for 15 min. aCzapek concentrate
KCl 25 g NaNO3 150 g MgSO4.7H2O 25 g FeSO4.7H2O 0.5 g RO water 500 mL bTrace metal solution
CuSO4.5H2O 0.5 g ZnSO4.7H2O 1 g RO water 100 mL

- 202 -
Dichloran Rose Bengal Chloramphenicol agar (Pitt and Hocking, 1997) Glucose 10 g Peptone, bacteriological 5 g KH2PO4 1 g MgSO4.7H2O 0.5 g Agar 15 g Rose Bengal 25 mg (5% w/v in water, 0.5 mL) Dichloran 2 mg (0.2% w/v in ethanol, 1 mL) RO water 1 L Sterilise by autoclaving at 121 °C for 15 min. Isotopically-labelled glucose medium
KCl 0.5 g NaNO3 3 g MgSO4.7H2O 0.5 g FeSO4.7H2O 0.01 g CuSO4.5H2O 0.005 g ZnSO4.7H2O 0.01 g K2HPO4 1 g Yeast extract 2 g Glucose 20 g RO water 1 L pH adjusted to 6 with 10 M HCl. All the constituents apart from the glucose were sterilised by autoclaving for 121 °C for 15 min. U13-C D-glucose was obtained from Cambridge Isotope Laboratories, Inc. (Andover, MA, USA). The glucose was made up as a 20% w/v solution in RO water and sterilised by filtration through a 0.2 µm membrane (Millipore, Billerica, MA, USA). It was added to the medium prior to inoculation (see Appendix B). Spezielle Nahstoffarmer Agar medium (modified from Nirenberg (1976)) KH2PO4 1.0 g KNO3 1.0 g MgSO4.7H2O 0.5 g KCl 0.5 g Glucose 2.0 g Sucrose 2.0 g Yeast extract 1.0 g RO water 1 L Sterilise by autoclaving at 121 °C for 15 min.

- 203 -
Synthetic Grapejuice Medium (modified from Mitchell et al. (2003); Bellí et al. (2004b)) D(+) Glucosea 70 g D(-) Fructoseb 30 g L(+) Tartaric Acida 7 g L(-) Malic acida 10 g (NH4)2SO4 0.67 g (NH4)2HPO4 0.67 g KH2PO4 1.5 g MgSO4.7H2O 0.75 g NaCl 0.15 g CaCl2 0.15 g CuCl2 0.0015 g FeSO4.7H2O 0.021 g ZnSO4 0.0075 g (+) Catechina 0.05 g Made up to 1 L with RO water. pH adjusted to 4.2 with 10 M NaOH. Agar 25 g Sterilise by autoclaving at 100 °C for 30 min. a Sigma, St Louis, MO, USA b Univar, APS, Seven Hills, NSW, Australia
Yeast Extract Sucrose agar (modified from Samson et al. (2000)) Yeast extract 20 g Sucrose 150 g Trace metal solutionb 1 mL (as for Czapek Yeast Agar) Agar 15 g RO water 1 L Sterilise by autoclaving at 121 °C for 15 min.

- 204 -
B Preparation of isotopically-labelled ochratoxin A A few spores from a culture of Aspergillus ochraceus FRR 3846, isolated from Australian soybeans, grown on CYA at 25 °C for 7 d, were gently collected on the point of a sterile inoculating wire under a stereomicroscope, and carefully inoculated into isotopically-labelled glucose medium (10 mL x 16; Appendix A) in 100 mL conical flasks, with minimal disturbance to the liquid. Flasks were stoppered with cotton wool bungs, and incubated at 25 °C in the dark for 7 d, after which the liquid was harvested with a pasteur pipette. Purification and characterisation of the isotopically-labelled standard were performed by Peter Varelis and Georgina Giannikopoulos of the Analytical Chemistry section, Food Science Australia. Briefly, the liquid and biomass from the flasks were combined and OA quantitatively extracted first with 75 mL diethyl ether, then with 75 mL 1% sodium bicarbonate. For purification, the aqueous extract was extracted into 50 mL ether, then 50 mL cyclohexane. This layer was then acidified using HCl (10 N) before repeated extraction into ether (3 x 75 mL). The aqueous layer was purified using 900 mg C18 solid phase extraction cartridges (Maxi-Clean™, Alltech, Deerfield, USA). The cartridges were washed with methanol and then eluted with acetonitrile. All organic extracts were combined and dried under vacuum at 40 °C to yield an orange solid with a caramelised odour. The solid was dissolved in 1.5 mL 50% ethyl acetate in cyclohexane and the analyte was purified from other metabolites using a Chromatotron® (under argon; 55% ethyl acetate in cyclohexane, 0.1% formic acid, 1 ml/min; Harrison Research, Palo Alto, CA, USA). All extracts containing a high content of OA were combined, and the flask dried under vacuum at room temperature. The analyte was reconstituted in methanol and analysed by LC-MS (Figure B.1). The chromatogram demonstrates the presence of pure OA and the mass spectrum shows the presence of 13C11-OA (70% yield) and 13C20-OA (30% yield) and their corresponding sodium adducts. The effective concentration of isotopically-labelled OA was approximately 1.6 µg/mL.
Figure 0.1: Chromatogram of (a) 13C-ochratoxin A and (b) the corresponding mass spectrum
RT: 0.00 - 6.00
0.0 0.5 1.0 1.5 2.0 2.5 3.0 3.5 4.0 4.5 5.0 5.5
Tim e (min)
0
2000000
4000000
6000000
8000000
10000000
12000000
14000000
16000000
18000000
20000000
22000000
24000000
26000000
28000000
30000000
32000000
34000000
36000000
38000000
40000000
42000000
Inte
nsity
3.31
3.723.92 4.604.162.44 2.761.74 4.791.59 5.252.37 5.57 5.910.770.09 0.59 1.22
NL:
4.24E7
m /z=
414.96173-
415.16173
MS
UL-
13C_OTA0
3
UL-13C_OTA03 #195 RT: 3.31 AV: 1 SB: 60 2.00-3.00 NL: 4.22E7
T: + c s id=-22.00 Q1MS [ 400.00-450.00]
400 405 410 415 420 425 430 435 440 445 450
m /z
0
2000000
4000000
6000000
8000000
10000000
12000000
14000000
16000000
18000000
20000000
22000000
24000000
26000000
28000000
30000000
32000000
34000000
36000000
38000000
40000000
42000000
Inte
nsity
415.09324
424.12955
414.08954
413.08862
412.08275
423.12770
437.08348416.09550
426.12630
436.07515 446.11058411.08792
421.11698410.08192
434.06735 445.11006439.07491
448.10030404.06041433.06257
443.10722409.06827
431.04686
b

- 205 -
C Molecular biology reagents Unless otherwise stated, reagents were obtained from Promega (Madison, WI, USA) or Sigma (St Louis, MO, USA). DNA extraction buffer Tris-HCl 100 mM, pH 8.0 Ethylenediamine 20 mM tetraacetic acid (EDTA) NaCl 0.5 M Sodium dodecyl sulfate 1 % w/v (SDS) Dissolve 2.42 g Tris in 100 mL Milli-Q water, checking that the pH is 8.0. Then add 8.0 mL of 0.5 M EDTA, 5.8 g NaCl and 2.0 g SDS. Make up to 200 mL with water, autoclave. Warm the solution in the microwave for a few seconds to dissolve the precipitate before use. Protein Precipitating Solution Potassium acetate 3 M Glacial Acetic Acid 4 % (approximately) Slowly add 29.45 g potassium acetate to 60 mL Milli-Q water while stirring. Adjust to pH 5.5 with glacial acetic acid. Make up to 100 mL with water, autoclave. Binding matrix (1/5 strength)
Binding matrix 66 mL (BIO 101, Inc., Carlsbad, CA, USA, ordered from Integrated Sciences, Willoughby, NSW, Australia) Guanidine isothiocyanate 6 M Dissolve 187.2 g guanidine isothiocyanate in 264 mL sterile Milli-Q water. Add 66 mL Binding Matrix (one bottle) and mix. Salt Ethanol Wash Solution
Sodium acetate 100 mM Ethanol 70 % v/v Dissolve 4.1 g sodium acetate in 130 mL Milli-Q water, add 370 mL 95% ethanol. Tris-EDTA buffer, pH 8
Tris 10 mM EDTA 1 mM

- 206 -
Tris-Borate EDTA buffer, pH 8.3 Tris-Borate 45 mM EDTA 1 mM Agarose gels
Agarose 2 % w/v Make up in TBE buffer.

D Molecular data
Table D.1: Presence or absence of bands scored in the analysis of ERIC-PCR amplification of black Aspergillus spp.
Presence / absencea of bands at loci 1 - 16 Species Accession no.
Order on gel, Fig. 3.4 1 2 3 4 5 6 7 8 9 10 11 12 13 14 15 16
A. niger A-75b 1 1 0 1 0 0 0 1 0 0 0 1 1 0 0 1 0 A. niger A-136 2 1 1 1 0 0 0 1 0 0 0 1 1 0 0 1 0 A. niger A-942 3 1 1 1 0 0 0 1 0 0 1 1 0 0 0 0 0 A. niger A-943 4 1 1 0 1 0 0 1 0 1 0 0 1 0 0 1 1 A. niger CBS 139.52b 5 0 0 1 0 0 0 1 0 0 0 1 0 0 0 0 1 A. aculeatus A-1122 6 0 1 1 1 0 0 0 1 0 0 0 0 0 0 0 1 A. aculeatus A-1325 7 0 1 1 0 0 0 0 1 1 0 1 1 0 0 0 0 A. aculeatus A-1355 8 0 0 1 1 0 0 0 1 1 0 0 0 0 0 1 1 A. carbonarius NRRL67b 9 0 0 0 0 0 0 1 0 1 0 0 1 0 0 1 0 A. carbonarius CBS 127.49 10 0 0 0 0 0 0 1 0 1 0 0 1 0 0 1 0 A. carbonarius A-941 11 0 0 0 0 0 0 1 1 1 0 0 1 0 0 1 0 A. carbonarius A-881 12 0 1 0 0 0 0 1 1 1 0 0 1 0 0 1 0 A. niger FRR 2522b 13 0 1 1 0 0 0 1 0 0 0 1 0 1 1 0 0 A. niger FRR 333 14 0 1 1 0 0 0 1 0 1 0 1 0 1 1 0 0 A. carbonarius FRR 5374 15 0 0 0 1 0 0 1 0 1 0 0 1 0 0 1 0 A. carbonarius FRR 5573 16 0 0 0 1 0 0 1 1 1 0 0 1 0 0 1 0 A. carbonarius FRR 5574 17 0 0 0 1 0 0 1 1 1 0 0 1 0 0 1 0 A. carbonarius FRR 5682 18 0 0 0 0 0 0 1 1 1 0 0 1 0 0 1 0 A. carbonarius FRR 5683 19 0 0 0 0 0 0 1 1 1 0 0 1 0 0 1 0 A. carbonarius FRR 5696 20 0 0 0 0 0 0 1 1 1 0 0 1 0 0 1 0 A. carbonarius FRR 5693 21 0 0 1 0 0 0 1 1 1 0 0 1 0 0 1 0 A. carbonarius FRR 5697 22 0 0 0 0 0 0 1 0 0 0 0 1 0 0 1 0 A. carbonarius FRR 5698 23 0 0 0 0 0 0 1 0 0 0 0 1 0 0 1 0 A. niger CBS 618.78 24 1 1 0 1 1 0 1 0 0 0 1 1 0 0 1 0 A. niger CECT 2088b 25 0 0 1 0 0 0 0 1 0 0 1 1 0 0 0 1
- 207 -

Table D.1 (cont.) Presence / absencea of bands at loci 1 - 16
Species Accession no. Order on gel, Fig. 3.4 1 2 3 4 5 6 7 8 9 10 11 12 13 14 15 16
A. niger CBS 554.65 26 1 0 1 0 0 0 0 1 0 0 1 1 0 0 0 1 A. niger A-946 27 1 1 1 0 0 0 1 0 0 0 1 1 0 0 1 0 A. niger CBS 134.48 28 1 1 0 0 0 0 1 0 0 0 0 1 0 0 1 0 A. niger CBS 121.55 29 0 0 1 0 0 0 1 1 0 0 1 0 0 0 1 1 A. niger A-947 30 1 1 0 0 0 0 0 1 0 0 0 1 0 0 1 0 A. niger A-1241 31 0 0 0 1 0 0 0 1 0 0 1 0 0 0 0 0 A. niger A-220 32 0 0 0 1 0 0 0 1 0 0 1 1 0 0 1 0 A. niger w-148b 33 1 0 1 0 1 0 0 0 0 0 0 1 0 0 1 1 A. niger A-655 34 1 0 1 0 1 0 0 0 0 0 0 1 0 0 1 1 A. niger A-487 35 1 0 0 0 0 0 1 0 0 0 0 1 0 0 1 0 A. niger A-615 36 1 0 1 0 0 0 1 0 0 0 0 1 0 0 0 1 A. niger A-656 37 0 0 0 0 0 0 1 0 0 0 0 1 0 0 0 1 A. carbonarius CBS 110.49 38 0 0 0 0 0 0 1 1 0 0 0 1 0 0 0 0 A. carbonarius A-642 39 0 0 0 0 0 0 1 1 1 1 0 1 0 0 1 0 A. carbonarius A-1040 40 0 0 0 0 0 0 1 1 1 1 0 1 0 0 1 0 A. carbonarius A-1070 41 0 0 0 0 0 0 1 1 1 0 0 1 0 0 1 0 A. carbonarius A-1477 42 0 0 0 0 0 0 1 1 1 0 0 1 0 0 1 0 A. carbonarius A-1500 43 0 0 0 0 0 0 1 1 1 0 0 1 0 0 1 0 A. aculeatus A-1356 44 0 1 0 0 0 0 0 0 1 0 0 0 0 0 0 1 A. carbonarius FRR 5699 45 0 0 0 0 0 0 1 1 1 0 0 1 0 0 1 0 A. carbonarius FRR 5700 46 0 0 0 0 0 0 1 1 1 0 0 1 0 0 1 0 A. carbonarius FRR 5690 47 0 0 0 0 0 0 1 1 1 0 0 1 0 0 1 0 A. carbonarius FRR 5702 48 0 0 0 0 0 0 1 1 1 0 0 1 0 0 1 0 A. carbonarius FRR 5703 49 0 0 1 0 0 0 1 1 1 0 0 1 0 0 1 0 A. carbonarius FRR 5704 50 0 0 0 0 0 0 1 1 1 1 0 1 0 0 1 0 A. carbonarius FRR 5705 51 0 0 0 0 0 0 1 1 1 1 0 1 0 0 1 0 A. carbonarius FRR 5706 52 0 0 0 0 0 0 1 1 1 1 0 1 0 0 1 0 A. carbonarius FRR 5707 53 0 0 0 0 0 0 1 1 1 1 0 1 0 0 1 0
- 208 -

A. carbonarius FRR 5708 54 0 0 0 0 0 0 1 1 1 0 0 1 0 0 1 0 A. carbonarius FRR 5709 55 0 0 0 0 0 0 1 1 1 1 0 1 0 0 1 0 A. carbonarius FRR 5710 56 0 0 0 0 0 0 1 1 1 0 0 1 0 0 1 0 A. carbonarius FRR 5711 57 0 0 0 0 0 0 1 1 1 0 0 1 0 0 1 0 A. carbonarius FRR 5691 58 0 0 0 0 0 0 1 1 1 1 0 1 0 0 1 0 A. carbonarius FRR 5712 59 0 0 0 0 0 0 1 1 1 0 0 1 0 0 1 0 A. carbonarius FRR 5713 60 0 0 0 0 0 0 1 1 1 0 0 1 0 0 1 0 A. carbonarius FRR 5714 61 0 0 0 0 0 0 1 1 1 0 0 1 0 0 1 0 A. carbonarius FRR 5715 62 0 0 0 0 0 0 1 1 1 0 0 1 0 0 1 0 A. carbonarius FRR 5716 63 0 0 0 0 0 0 1 1 0 0 0 1 0 0 1 0 A. carbonarius FRR 5717 64 0 0 0 0 0 0 1 1 1 0 0 1 0 0 1 0 A. carbonarius FRR 5718 65 0 0 0 0 0 0 1 1 1 0 0 1 0 0 1 0 A. carbonarius FRR 5692 66 1 0 0 0 0 0 1 1 1 0 0 1 0 0 1 0 A. carbonarius FRR 5719 67 0 0 0 0 0 0 1 0 1 0 0 1 0 0 1 0 A. niger FRR 5694 68 1 1 1 0 0 0 0 0 0 0 0 0 1 1 0 0 A. niger FRR 5695 69 0 0 0 0 0 0 0 0 0 0 0 0 0 0 1 0 A. niger FRR 5720 70 1 1 0 0 0 0 1 0 0 0 0 0 0 0 0 0 A. niger FRR 5721 71 1 0 0 0 0 0 0 1 0 0 0 0 0 0 0 0 A. niger FRR 5722 72 1 0 1 0 0 0 0 0 0 0 1 0 0 0 0 0
a presence of the band scored as 1, absence scored as 0 b A and w: isolates from the collection of the Autonomous University of Barcelona, Veterinary Faculty, Bellaterra, Barcelona, Spain. CBS: Centraalbureau voor Schimmelcultures, Utrecht, Netherlands. NRRL: Agricultural Research Service Culture Collection, Peoria, IL, USA. FRR: Food Science Australia, North Ryde, NSW, Australia. CECT: Coleccion Espanola de Cultivos Tipo, Burjassot, Valencia, Spain
- 209 -

Table D.2: Polymorphism in allele size at six microsatellite loci in black Aspergillus spp.
Locus Allele size (bp)
Species Accession no.
ACNM1 ACNM2 ACNM3 ACNM5 ACNM6 ACNM7 A. niger A-75a 475 428 195 164 452 402 A. niger A-136 485 428 192 164 455 405 A. niger A-220 485 428 192 164 455 405 A. niger A-487 473 null 186 164 null 387 A. niger A-615 475 418 181 164 null 378 A. niger A-655 473 409 184 166 431 387 A. niger A-656 474 418 181 163 null 399 A. niger A-942 509 418 189 163 431 399 A. niger A-943 null 409 184 163 431 387 A. niger A-946 490 446 186-195 204 449 388 A. niger A-947 474 null 181 164 null 382 A. niger A-1241 483 428 195 164 446 388 A. niger w-148a 473 418 189 166 431 387 A. niger CECT 2088a 490 428 215 201 455 402 A. niger CBS 134.48a 474 null 186 164 null 382 A. niger CBS 121.55 477 416 184 163 450 387 A. niger CBS 139.52 483 428 195 164 446 388 A. niger CBS 554.65 485 428 192 190 452 388 A. niger CBS 618.78 487 428 192 193 446 402 A. niger FRR 2522a 490 418 184 163 429 390 A. niger FRR 333 477 416 184 163 429 387 A. niger FRR 5694 null not analysed 190 163 431 387 A. niger FRR 5695 467 not analysed 177 167 431 468 A. niger FRR 5720 473 null 181 164 null 382 A. niger FRR 5721 473 null 181 164 null 382 A. niger FRR 5722 475 446 198 201 458 405
- 210 -

A. carbonarius A-1040 null 413 189 null null null A. carbonarius A-1070 null 413 189-192 null null null A. carbonarius A-1477 null 413 189-192 null null null A. carbonarius A-1500 null 413 190 null null null A. carbonarius A-642 null 413 189-192 null null null A. carbonarius A-881 null null 189 null null null A. carbonarius A-941 null null 189-192 null null null A. carbonarius CBS 110.49 null 413 189-192 null null null A. carbonarius CBS 127.49 null null 189-192 null null null A. carbonarius FRR 5374 466 null 189 164 null 399 A. carbonarius FRR 5573 null null 189-192 163 null null A. carbonarius FRR 5574 null null 189-192 null null null A. carbonarius FRR 5682 null null 189-192 null null null A. carbonarius FRR 5683 null 413 189-192 null null null A. carbonarius FRR 5690 null 413 189-192 null null null A. carbonarius FRR 5691 null 413 189-192 null null null A. carbonarius FRR 5692 466 413 189-192 null null null A. carbonarius FRR 5693 null 413 189-192 null null null A. carbonarius FRR 5696 null 413 189-192 null null null A. carbonarius FRR 5697 466 413 189-192 null null null A. carbonarius FRR 5698 466 413 189-192 null null null A. carbonarius FRR 5699 null null 189-192 null null null A. carbonarius FRR 5700 null 413 189,192,194 null null null A. carbonarius FRR 5702 null 413 192 null null null A. carbonarius FRR 5703 null 413 189-192 null null null A. carbonarius FRR 5704 null 413 189-192 null null null A. carbonarius FRR 5705 null null 189 null null 387 A. carbonarius FRR 5706 466 null 189-192 null null null A. carbonarius FRR 5707 null 413 189-191 null null 387 A. carbonarius FRR 5708 null null 189-192 null null null A. carbonarius FRR 5709 null 413 189-192 null null 387
- 211 -

Table D.2 (cont.) Locus
Allele size (bp) Species Accession no. ACNM1 ACNM2 ACNM3 ACNM5 ACNM6 ACNM7
A. carbonarius FRR 5710 null 413 189-192 null null null A. carbonarius FRR 5711 null 413 189-192 null null null A. carbonarius FRR 5712 466 413 189-192 null null 387 A. carbonarius FRR 5713 null 413 189-192 null null null A. carbonarius FRR 5714 null 413 189 null null null A. carbonarius FRR 5715 466 413 189-192 163 null 399 A. carbonarius FRR 5716 466 413 189-192 null null null A. carbonarius FRR 5717 466 413 189-192 null null null A. carbonarius FRR 5718 null null 189-192 null null null A. carbonarius FRR 5719 null 413 151,181,190,192 null null null A. carbonarius NRRL67a null null 189-192 164 null null A. aculeatus A-1122 464 null 189-192 null null null A. aculeatus A-1325 465 null 189-192 null null null A. aculeatus A-1355 465 null 189-192 null null null A. aculeatus A-1356 465 null 189-192 null null null
a A and w: isolates from the collection of the Autonomous University of Barcelona, Veterinary Faculty, Bellaterra, Barcelona, Spain. CECT: Coleccion Espanola de Cultivos Tipo, Burjassot, Valencia, Spain. CBS: Centraalbureau voor Schimmelcultures, Utrecht, Netherlands. FRR: Food Science Australia, North Ryde, NSW, Australia. NRRL: Agricultural Research Service Culture Collection, Peoria, IL, USA
- 212 -

- 213 -

E Spray application and sampling times in Vineyard D, Hunter Valley
Table E.1: Spray application, 2003
Standard program (applied to Chardonnay, Semillon and Shiraz)
Syngenta program (applied to Semillon only) Spray dates for Semillon + Shiraz (approximate dates for Chardonnay in brackets)
Producta Rate (g or mL/100L) Producta Rate (g or mL/100L) 16/09/2002: bud burst (Chardonnay, 9/09/02)
Thiovit Jet 500 Thiovit Jet 500
27/09/2002 (Chardonnay, 20/09/02)
Delan 700 WG Delfin WG Topas 100 EC Thiovit Jet
50 12.5 12.5 300
Delan 700 WG Delfin WG Topas 100 EC Thiovit Jet
50 12.5 12.5 300
18/10/2002: 10% flower (Chardonnay, 11/10/02)
Bravo 1L/ha
21/10/2002: 10% flower Amistar WG 50 28/10/2002: 80% flower (Chardonnay, 21/10/02)
Scala 400 EC Mancozeb Thiovit Jet
200 200 300
Switch Mancozeb Thiovit Jet
80 200 300
19/11/2002: bunch closure (Chardonnay, 12/11/02)
Fortress 500 75 Fortress 500 75
Shiraz, inoculation at pre-bunch closure (20/11/02) 23/11/2002 (Chardonnay, 16/11/02)
Copper oxychloride Thiovit Jet Success Naturalyte
200 300 40
Copper oxychloride Thiovit Jet Success Naturalyte
200 300 40
Chardonnay, inoculation at pre-bunch closure (20/11/02) Semillon, inoculation at pre-bunch closure (5/12/02) 16/12/2002 (Chardonnay, 9/12/02)
Thiovit Jet Copper oxychoride
300 200
Thiovit Jet Copper oxychloride
300 200
Chardonnay, inoculation at veraison (17/12/02) Shiraz, inoculation at veraison (17/12/02) 28/12/2002: veraison (Chardonnay, 21/12/02)
Crop Care Captan WG Thiovit Jet
125 300
Thiovit Jet 300
Semillon, inoculation at pre-harvest (6/01/03) 15/01/2003 Delfin WG 12.5 Delfin WG 12.5
- 214 -

(Chardonnay, 8/01/03) Chardonnay, inoculation at pre-harvest (13/01/03) Shiraz, inoculation at pre-harvest (21/01/03) Chardonnay, harvested 24/01/2003 Semillon, harvested 27/01/2003 Shiraz, harvested 6/02/2003 a active constituent bracketed: Amistar WG (azoxystrobin), Bravo (chlorothalonil), Crop Care Captan WG (captan), Delan 700 WG (dithianon), Delfin WG (Bacillus
thuringiensis var. kurstaki), Fortress 500 (procymidone), Mancozeb (mancozeb), Thiovit Jet (sulfur), Topas 100 EC (penconazole), Scala 400 EC (pyrimethanil), Success Naturalyte (spinosad), Switch (cyprodinil + fludioxonil)
- 215 -

Table E.2: Spray application, 2004
Standard program Cultivar, spray date Producta Rate (g or mL/100L)
Chardonnay, 29/08/2003 Semillon + Shiraz, 2/09/2003
Thiovit Jet 500
Chardonnay, 8/09/2003 Semillon + Shiraz, 10/9/2003
Thiovit Jet Full-Bac WDG
250 12.5
Chardonnay, 22/09/2003 Semillon + Shiraz, 26/09/2003
Delan 700 WG Full-Bac WDG Topas 100 EC Thiovit Jet
50 12.5 12.5 250
Chardonnay, 29/09/2003
Dipel DF Dithane 750 DF Kumulus DF Topas 100 EC
12.5 200 200 12.5
Chardonnay, 15/10/2003 Semillon + Shiraz, 14/10/2003
Bugmaster Flowable Dithane 750 DF Kumulus DF (Chardonnay) Mancozeb (Semillon + Shiraz)
150 200 200 200
Chardonnay, 20/10/2003 Semillon + Shiraz, 21/10/2003
Barrack 720 180
Chardonnay, 24/10/2003 Semillon + Shiraz, 28/10/2003
Kumulus DF Legend Scala 400 EC
200 20 200
Chardonnay, 5/11/2003 Semillon + Shiraz, 19/11/2003
Dithane Rainshield Kumulus DF Full-Bac WDG (Semillon + Shiraz)
200 300 12.5
Shiraz, inoculation at pre-bunch closure (25/11/2003) Chardonnay, 19/11/2003 Semillon + Shiraz, 28/11/2003
Dithane Rainshield (Chardonnay) Kumulus DF Success Naturalyte Country Copper Oxychloride 500 WP (Semillon + Shiraz)
300 300 20 400
Chardonnay, inoculation at pre-bunch closure (25/11/2003)
- 216 -
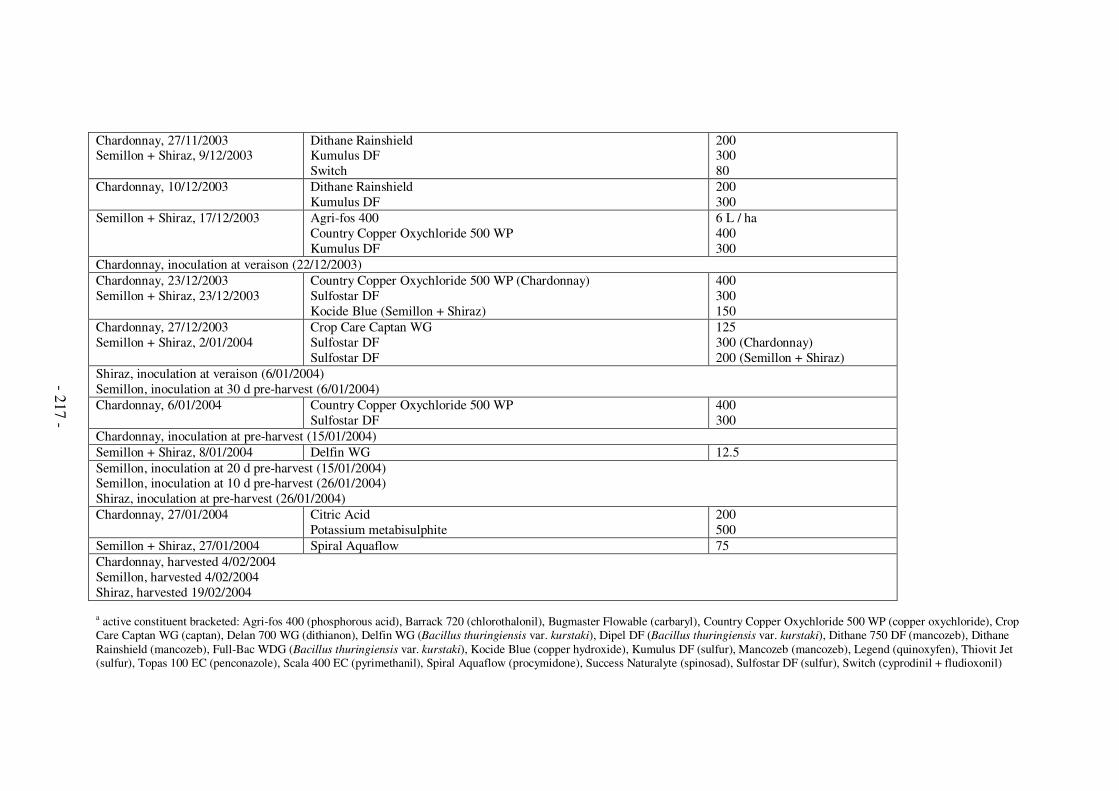
Chardonnay, 27/11/2003 Semillon + Shiraz, 9/12/2003
Dithane Rainshield Kumulus DF Switch
200 300 80
Chardonnay, 10/12/2003 Dithane Rainshield Kumulus DF
200 300
Semillon + Shiraz, 17/12/2003 Agri-fos 400 Country Copper Oxychloride 500 WP Kumulus DF
6 L / ha 400 300
Chardonnay, inoculation at veraison (22/12/2003) Chardonnay, 23/12/2003 Semillon + Shiraz, 23/12/2003
Country Copper Oxychloride 500 WP (Chardonnay) Sulfostar DF Kocide Blue (Semillon + Shiraz)
400 300 150
Chardonnay, 27/12/2003 Semillon + Shiraz, 2/01/2004
Crop Care Captan WG Sulfostar DF Sulfostar DF
125 300 (Chardonnay) 200 (Semillon + Shiraz)
Shiraz, inoculation at veraison (6/01/2004) Semillon, inoculation at 30 d pre-harvest (6/01/2004) Chardonnay, 6/01/2004 Country Copper Oxychloride 500 WP
Sulfostar DF 400 300
Chardonnay, inoculation at pre-harvest (15/01/2004) Semillon + Shiraz, 8/01/2004 Delfin WG 12.5 Semillon, inoculation at 20 d pre-harvest (15/01/2004) Semillon, inoculation at 10 d pre-harvest (26/01/2004) Shiraz, inoculation at pre-harvest (26/01/2004) Chardonnay, 27/01/2004 Citric Acid
Potassium metabisulphite 200 500
Semillon + Shiraz, 27/01/2004 Spiral Aquaflow 75 Chardonnay, harvested 4/02/2004 Semillon, harvested 4/02/2004 Shiraz, harvested 19/02/2004 a active constituent bracketed: Agri-fos 400 (phosphorous acid), Barrack 720 (chlorothalonil), Bugmaster Flowable (carbaryl), Country Copper Oxychloride 500 WP (copper oxychloride), Crop Care Captan WG (captan), Delan 700 WG (dithianon), Delfin WG (Bacillus thuringiensis var. kurstaki), Dipel DF (Bacillus thuringiensis var. kurstaki), Dithane 750 DF (mancozeb), Dithane Rainshield (mancozeb), Full-Bac WDG (Bacillus thuringiensis var. kurstaki), Kocide Blue (copper hydroxide), Kumulus DF (sulfur), Mancozeb (mancozeb), Legend (quinoxyfen), Thiovit Jet (sulfur), Topas 100 EC (penconazole), Scala 400 EC (pyrimethanil), Spiral Aquaflow (procymidone), Success Naturalyte (spinosad), Sulfostar DF (sulfur), Switch (cyprodinil + fludioxonil)
- 217 -

- 218 -
References
Aarts, H., Keijer, J., 1999. Genomic fingerprint of microorganisms by automatic laser fluorescence analysis (AFLP™). In: Akkermans, A.D.L., van Elsas, J.D., Bruijn, F.J. (Eds), Molecular Microbial Ecology Manual. Kluwer Academic Publishers, Dordrecht, Netherlands, pp. 1-10.
Abarca, M.L., Accensi, F., Bragulat, M.R., Cabañes, F.J., 2001. Current importance of ochratoxin A-producing Aspergillus spp. Journal of Food Protection 64, 903-906.
Abarca, M.L., Accensi, F., Bragulat, M.R., Castellà, G., Cabañes, F.J., 2003. Aspergillus carbonarius as the main source of ochratoxin A contamination in dried vine fruits from the Spanish market. Journal of Food Protection 66, 504-506.
Abarca, M.L., Accensi, F., Cano, J., Cabañes, F.J., 2004. Taxonomy and significance of black aspergilli. Antonie van Leeuwenhoek 86, 33-49.
Abarca, M.L., Bragulat, M.R., Castellá, G., Cabañes, F.J., 1994. Ochratoxin A production by strains of Aspergillus niger var. niger. Applied and Environmental Microbiology 60, 2650-2652.
Abdelal, H.R., El-Fahl, A.M., Ibrahim, A.N., Badawi, M.F., 1980. The source and nature of resistance in vine fruit stages to grape rot disease. Agricultural Research Review 58, 163-172.
Abdel-Sater, M.A., Saber, S.M., 1999. Mycoflora and mycotoxins of some Egyptian dried fruits. Bulletin of the Faculty of Science, Assiut University 28, 91-107.
Abdulkadar, A.H.W., Al-Ali, A.A., Al-Kildi, A.M., Al-Jedah, J.H., 2004. Mycotoxins in food products available in Qatar. Food Control 15, 543-548.
Abrunhosa, L., Paterson, R.R.M., Kozakiewicz, Z., Lima, N., Venâncio, A., 2001. Mycotoxin production from fungi isolated from grapes. Letters in Applied Microbiology 32, 240-242.
Abrunhosa, L., Serra, R., Lima, N., Venâncio, A., 2003. Ochratoxin A risk assessment in Portuguese wines: a one-year case study. Le Bulletin de l’OIV 76, 618-634.
Abrunhosa, L., Serra, R., Venâncio, A., 2002. Biodegradation of ochratoxin A by fungi isolated from grapes. Journal of Agricultural and Food Chemistry 50, 7493-7496.
Accensi, F., Abarca, M.L., Cabañes, F.J., 2004. Occurrence of Aspergillus species in mixed feeds and component raw materials and their ability to produce ochratoxin A. Food Microbiology 21, 623-627.
Accensi, F., Abarca, M.L., Cano, J., Figuera, L., Cabañes, F.J., 2001. Distribution of ochratoxin A producing strains in the A. niger aggregate. Antonie van Leeuwenhoek 79, 365-370.
Accensi, F., Cano, J., Figuera, L., Abarca, M.L., Cabañes, F.J., 1999. New PCR method to differentiate species in the Aspergillus niger aggregate. FEMS Microbiology Letters 180, 191-196.
Alldrick, A.J., 1996. The effects of processing on the occurrence of ochratoxin A in cereals. Food Additives and Contaminants 13, 27-28.
Amerine, M.A., Berg, H.W., Kunkee, R.E., Ough, C.S., Singleton, V.L., Webb, A.D., 1980. The Technology of Wine Making. The AVI Publishing Company Inc., Westport, Connecticut, USA.
ANZFA, 1996. The 1994 Australian Market Basket Survey. Australia New Zealand Food Authority, Canberra, Australia.
Arici, M., Gümüs, T., Karah, F., 2004. The fate of ochratoxin A during the Pekmez production from mouldy grapes. Food Control 15, 597-600.

- 219 -
Armstrong, J., Gibbs, A., Peakall, R., Weiller, G.F., 1994. RAPDistance: random amplified polymorphic DNA analysis. Australian National University, Canberra, Australia.
Arora, D.A., Hirsch, P.R., Kerry, B.R., 1996. PCR-based molecular discrimination of Verticillium chlamydosporum isolates. Mycological Research 100, 801-809.
Australian Dried Fruits Association Inc., 1998. ADFA Dried Vine Fruit Manual. Mildura, Victoria, Australia.
Ayerst, G., 1969. The effects of moisture and temperature on growth and spore germination in some fungi. Journal of Stored Product Research 5, 127-141.
Aziz, N.H., Moussa, L.A.E., 1997. Influence of white light, near-UV irradiation and other environmental conditions on production of aflatoxin B1 by Aspergillus
flavus and ochratoxin A by Aspergillus ochraceus. Nahrung 41, 150-154. Bacon, C.W., Sweeney, J.G., Robbins, J.D., Burdick, D., 1973. Production of
penicillic acid and ochratoxin A on poultry feed by Aspergillus ochraceus: temperature and moisture requirements. Applied Microbiology 26, 155-160.
Bae, S., Fleet, G.H., Heard, G.M., 2004. Occurrence and significance of Bacillus
thuringiensis on wine grapes. International Journal of Food Microbiology 94, 301-312.
Barbetti, M.J., 1980. Bunch rot of Rhine Riesling grapes in the lower south-west of Western Australia. Australian Journal of Experimental Agriculture and Animal Husbandry 20, 247-251.
Battilani, P., Barbano, C., Marín, S., Sanchis, V., Kozakiewicz, Z., Magan, N., 2005a. Mapping of Aspergillus section Nigri in Southern Europe and Israel based on geostatistical analysis. International Journal of Food Microbiology, in press.
Battilani, P., Giorni, P., Bertuzzi, T., Formenti, S., Pietri, A., 2005b. Black Aspergilli and ochratoxin A in grapes in Italy. International Journal of Food Microbiology, in press.
Battilani, P., Giorni, P., Bertuzzi, T., Pietri, A., 2001. Preliminary results on ochratoxin A production by fungi invading grape berries. In: 11 Congress of Mediterranean Phytopathological Union and 3rd Congress of Sociedade Portuguesa de Fitopatologia. Evora, Portugal, pp. 120-122.
Battilani, P., Giorni, P., Pietri, A., 2003a. Epidemiology of toxin-producing fungi and ochratoxin A occurrence in grape. European Journal of Plant Pathology 109, 715-722.
Battilani, P., Logrieco, A., Giorni, P., Cozzi, G., Bertuzzi, T., Pietri, A., 2004. Ochratoxin A production by Aspergillus carbonarius on some grape varieties grown in Italy. Journal of the Science of Food and Agriculture 84, 1736-1740.
Battilani, P., Pietri, A., Bertuzzi, T., Languasco, L., Giorni, P., Kozakiewicz, Z., 2003b. Occurrence of ochratoxin A-producing fungi in grapes grown in Italy. Journal of Food Protection 66, 633-636.
Battilani, P., Pietri, A., Giorni, P., Bertuzzi, T., Barbano, C., 2003c. Growth and ochratoxin A production of Aspergillus section Nigri isolates from Italian grapes. Aspects of Applied Biology 68, 175-180.
Bau, M., Bragulat, M.R., Abarca, M.L., Minguez, S., Cabañes, F.J., 2005a. Ochratoxigenic species from Spanish wine grapes. International Journal of Food Microbiology 98, 125-130.
Bau, M., Castellà, G., Bragulat, M.R., Cabañes, F.J., 2005b. DNA-based characterization of ochratoxin-A-producing and non-producing Aspergillus
carbonarius strains from grapes. Research in Microbiology 156, 375-381.

- 220 -
Bavaresco, L., Vezzulli, S., Battilani, P., Giorni, P., Pietri, A., Bertuzzi, T., 2003. Effect of ochratoxin-A producing Aspergilli on stilbenic phytoalexin synthesis in grapes. Journal of Agricultural and Food Chemistry 51, 6151-6157.
Baxter, D.E., Shielding, I.R., Kelly, B., 2001. Behaviour of ochratoxin A in brewing. Journal of the American Society of Brewing Chemists 59, 98-100.
Bejaoui, H., Mathieu, F., Taillandier, P., Lebrihi, A., 2005. Fungal flora and ochratoxin A production during wine grape maturation in French vineyards during three years. International Journal of Food Microbiology, in press.
Bejaoui, H., Mathieu, F., Taillandier, P., Lebrihi, A., 2004. Ochratoxin A removal in synthetic and natural grape juices by selected oenological Saccharomyces
strains. Journal of Applied Microbiology 97, 1038-1044. Bell, S.-J., Daniel, C., 2004. Agrochemicals registered for use in Australian viticulture
2004/2005. The Australian Wine Research Institute, Glen Osmond, South Australia, Australia.
Bellí, N., Marín, S., Duaigües, A., Ramos, A.J., Sanchis, V., 2004a. Ochratoxin A in wines, musts and grapes juices from Spain. Journal of the Science of Food and Agriculture 84, 591-594.
Bellí, N., Marín, S., Sanchis, V., Ramos, A.J., 2004b. Influence of water activity and temperature on growth of isolates of Aspergillus section Nigri obtained from grapes. International Journal of Food Microbiology 96, 19-27.
Bellí, N., Marín, S., Sanchis, V., Ramos, A.J., 2002. Ochratoxin A (OTA) in wines, musts and grape juices: occurrence, regulations and methods of analysis. Food Science and Technology International 8, 325-335.
Bellí, N., Mitchell, D., Marín, S., Alegre, I., Ramos, A.J., Magan, N., Sanchis, V., 2005a. Ochratoxin A-producing fungi in Spanish wine grapes and their relationship with meteorological conditions. European Journal of Plant Pathology, 113, 233-239.
Bellí, N., Pardo, E., Marín, S., Farré, G., Ramos, A.J., Sanchis, V., 2004c. Occurrence of ochratoxin A and toxigenic potential of fungal isolates from Spanish grapes. Journal of the Science of Food and Agriculture 84, 541-546.
Bellí, N., Ramos, A.J., Coronas, I., Sanchis, V., Marín, S., 2005b. Aspergillus
carbonarius growth and ochratoxin A production on a synthetic grape medium in relation to environmental factors. Journal of Applied Microbiology 98, 839-844.
Bellí, N., Ramos, A.J., Sanchis, V., Marín, S., 2004d. Incubation time and water activity effects on ochratoxin A production by Aspergillus section Nigri strains isolated from grapes. Letters in Applied Microbiology 38, 72-77.
Berente, B., Móricz, Á., Otta, K.H., Záray, G., Lékó, L., Rácz, L., 2005. Determination of ochratoxin A in Hungarian wines. Microchemical Journal 79, 103-107.
Blanc, M., Pittet, A., Muñoz-Box, R., Viani, R., 1998. Behaviour of ochratoxin A during green coffee roasting and soluble coffee manufacture. Journal of Agricultural and Food Chemistry 46, 673-675.
Blesa, J., Soriano, J.M., Moltó, J.C., Mañes, J., 2004. Concentration of ochratoxin A in wines from supermarkets and stores of Valencian community (Spain). Journal of Chromatography A 1054, 397-401.
Bragulat, M.R., Abarca, M.L., Cabañes, F.J., 2001. An easy screening method for fungi producing ochratoxin A in pure culture. International Journal of Food Microbiology 71, 139-144.

- 221 -
Brera, C., Grossi, S., De Santis, B., Miraglia, M., 2003. Automated HPLC method for the determination of ochratoxin A in wine samples. Journal of Liquid Chromatography & Related Technologies 26, 119-133.
Brera, C., Soriano, J.M., Debegnach, F., Miraglia, M., 2005. Exposure to assessment to ochratoxin A from the consumption of Italian and Hungarian wines. Microchemical Journal 79, 109-113.
Bresch, H., Urbanek, M., Nusser, M., 2000. Ochratoxin A in food containing liquorice. Nahrung 44, 276-278.
Brownstein, M.J., Carpten, J.D., Smith, J.R., 1996. Modulation of non-templated nucleotide addition by Taq DNA polymerase: primer modifications that facilitate genotyping. Biotechniques 20, 1004-1010.
Buchanan, G.A., Amos, T.G., 1992. Grape pests. In: Coombe, B.G., Dry, P.R. (Eds), Viticulture. Volume 2. Practices. Winetitles, Adelaide, Australia, pp. 209-231.
Bucheli, P., Kanchanomi, C., Meyer, I., Pittet, A., 2000. Development of ochratoxin A during Robusta (Coffea canephora) coffee cherry drying. Journal of Agricultural and Food Chemistry 48, 1358-1362.
Burdaspal, P.A., Legarda, T.M., 1999. Ocratoxina a en vinos, mostos y zumos de uva elaborados en España y en otros paises europeos. Alimentaria 299, 107-113.
Cabañes, F.J., Accensi, F., Bragulat, M.R., Abarca, M.L., Castellá, G., Minguez, S., Pons, A., 2002. What is the source of ochratoxin A in wine? International Journal of Food Microbiology 79, 213-215.
Carter, D.A., Tran-Dinh, N., Marra, R.E., Vera, R.E., 2004. The development of genetic markers from fungal genome initiatives. In: Arora, D.A., Khachatourians, G.G. (Eds), Applied Mycology & Biotechnology. Elsevier Science, Amsterdam, Netherlands, pp. 1-27.
CAST (Council for Agricultural Science and Technology), 2003. Mycotoxins, risks in plants, animal and human systems. CAST, Ames, Iowa, USA.
Castegnaro, M., Wild, C.P., 1995. IARC activities in mycotoxin research. Natural Toxins 3, 327-331.
Castellà, G., Larsen, T.O., Cabañes, F.J., Schmidt, H., Alboresi, A., Niessen, L., Färber, P., Geisen, R., 2002. Molecular characterization of ochratoxin A producing strains of the genus Penicillium. Systematic and Applied Microbiology 25, 74-83.
Castellari, M., Fabbri, S., Fabiani, A., Amati, A., Galassi, S., 2000. Comparison of different immunoaffinity clean-up procedures for high-performance liquid chromatographic analysis of ochratoxin A in wines. Journal of Chromatography A 888, 129-136.
Castellari, M., Versari, A., Fabiani, A., Parpinello, G.P., Galassi, S., 2001. Removal of ochratoxin A in red wines by means of adsorption treatments with commercial fining agents. Journal of Agricultural and Food Chemistry 49, 3917-3921.
Cholmakov-Bodechtel, C., Wolff, J., Gareis, M., Bresch, H., Engel, G., Majerus, P., Rosner, H., Schneider, R., 2000a. Ochratoxin A: contamination of foods and consumer exposure final evaluation. Archiv für Lebensmittelhygiene 51, 115-117.
Cholmakov-Bodechtel, C., Wolff, J., Gareis, M., Bresch, H., Engel, G., Majerus, P., Rosner, H., Schneider, R., 2000b. Ochratoxin A: representative food consumption survey and epidemiological analysis. Archiv für Lebensmittelhygiene 51, 111-115.
Clarke, K., Emmett, R.W., Kazi, B.A., Nancarrow, N., Leong, S., 2003. Susceptibility of dried grape varieties to berry splitting and infection by Aspergillus

- 222 -
carbonarius. In: 8th International Congress of Plant Pathology (abstract). Christchurch, New Zealand, p. 140.
Clarke, K., Kazi, B.A., Emmett, R.W., Nancarrow, N., Leong, S., Mebalds, M., 2004. Incidence of black Aspergillus spp. in vineyards. In: Fungal Contaminants and their impact on wine quality. Grape and Wine Research and Development Corporation, Glen Osmond, South Australia, Australia, pp. 132-142.
Considine, J.A., Kriedemann, P.E., 1972. Fruit splitting in grapes: determination of the critical turgor pressure. Australian Journal of Agricultural Research 23, 17-24.
Cozzi, G., Pascale, M., Perrone, G., Visconti, A., Logrieco, A., 2005. Effect of Lobesia botrana damages on black aspergilli rot and ochratoxin A content in grapes. International Journal of Food Microbiology, in press.
Creppy, E.E., 1999. Human ochratoxicosis. Journal of Toxicology - Toxin Reviews 18, 277-293.
Czerwiecki, L., Wilczynska, G., Kwiecien, A., 2005. Ochratoxin A: an improvement clean-up and HPLC method used to investigate wine and grape juice on the Polish market. Food Additives and Contaminants 22, 158-162.
Da Rocha Rosa, C.A., Palacios, V., Combina, M., Fraga, M.E., De Oliveira Rekson, A., Magnoli, C.E., Dalcero, A.M., 2002. Potential ochratoxin A producers from wine grapes in Argentina and Brazil. Food Additives and Contaminants 19, 408-414.
Dalcero, A.M., Magnoli, C.E., Hallak, C., Chiacchiera, S.M., Palacio, G., Rosa, C.A.R., 2002. Detection of ochratoxin A in animal feeds and capacity to produce this mycotoxin by Aspergillus section Nigri in Argentina. Food Additives and Contaminants 19, 1065-1072.
Danks, C., Ostoja-Starzewska, S., Flint, J., Banks, J.N., 2003. The development of a lateral flow device for the discrimination of OTA producing and non-producing fungi. Aspects of Applied Biology 68, 21-28.
Deberghes, P., Betbeder, A.-M., Boisard, F., Blanc, R., Delaby, J.F., Krivobok, S., Steiman, R., Seigle-Murandi, F., Creppy, E.E., 1995. Detoxification of ochratoxin A, a food contaminant: prevention of growth of Aspergillus
ochraceus and its production of OA. Mycotoxin Research 11, 37-47. Dewey, F.M., Meyer, U., 2004. Rapid, quantitative tube immunoassays for on-site
detection of Botrytis, Aspergillus and Penicillium antigens in grape juice. Analytica Chimica Acta 513, 11-19.
Di Paolo, N., Guarnieri, A., Garosi, G., Sacchi, G., Mangiarotti, A.M., Di Paolo, M., 1994. Inhaled mycotoxins lead to acute renal failure. Nephrology Dialysis Transplantation 4, 166-120.
Dice, L.R., 1945. Measures of the amount of ecological association between species. Ecology 26, 297-302.
Dumeau, F., Trione, D., 2000. Trattamenti e "ochratossina A" nei vini. Vignevini 9, 79-81.
Duncan, R.A., Stapleton, J.J., Leavitt, G.M., 1995. Population dynamics of epiphytic mycoflora and occurrence of bunch rots of wine grapes as influenced by leaf removal. Plant Pathology 44, 956-965.
Dyer, S.K., McCammon, S., 1994. Detection of toxigenic isolates of Aspergillus
flavus and related species on coconut cream agar. Journal of Applied Bacteriology 76, 75-78.
Edel, V., Steinberg, C., Avelange, I., Languerre, G., Alabouvett, C., 1995. Comparison of three molecular methods for the characterization of Fusarium
oxysporum strains. Phytopathology 85, 579-585.

- 223 -
Eder, R., Parr, E., Edinger, W., Lew, H., 2002. Untersuchungen über den Gehalt an Ochratoxin A (OTA) in Weinen, insbesondere Prädikatsweinen aus Österreich. Mitteilungen Klosternburg 52, 125-131.
Edwards, S.G., O'Callaghan, J., Dobson, A.D.W., 2002. PCR-based detection and quantification of mycotoxigenic fungi. Mycological Research 106, 1005-1025.
Emmett, R.W., Harris, A.R., Taylor, R.H., McGechan, J.K., 1992. Grape diseases and vineyard protection. In: Coombe, B.G., Dry, P.R. (Eds), Viticulture. Volume 2. Practices. Winetitles, Adelaide, Australia, pp. 232-278.
Engel, G., 2000. Ochratoxin A in sweets, oil seeds and dairy products. Archiv für Lebensmittelhygiene 51, 98-101.
Engelhardt, G., Ruhland, M., Wallnöffer, P.R., 1999. Occurrence of ochratoxin A in moldy vegetables and fruits analysed after removal of rotten tissue parts. Advances in Food Sciences (CMTL) 21, 88-92.
Esteban, A., Abarca, M.L., Bragulat, M.R., Cabañes, F.J., 2004. Effects of temperature and incubation time on production of ochratoxin A by black aspergilli. Research in Microbiology 155, 861-866.
Esteban, A., Abarca, M.L., Bragulat, M.R., Cabañes, F.J., 2005a. Influence of pH and incubation time on ochratoxin A production by Aspergillus carbonarius in culture media. Journal of Food Protection 68, 1435-1440.
Esteban, A., Leong, S.L., Tran-Dinh, N., 2005b. Application of three molecular techniques to characterise strains of the Aspergillus niger aggregate. In: 23rd Fungal Genetics Conference at Asilomar (abstract). Pacific Grove, California, USA.
Esteban, A., Leong, S.L., Tran-Dinh, N., 2005c. Isolation and characterization of six polymorphic microsatellite loci in Aspergillus niger. Molecular Ecology Notes 5, 375-377.
European Commission, 2002. Commission regulation (EC) No 472/2002 of 12 March 2002 amending regulation (EC) No 466/2001 setting maximum levels for certain contaminants in foodstuffs. Official Journal of the European Communities 75, 18-20, 42.
European Commission, 2005. Commission Regulation (EC) No 123/2005 of 26 January 2005 amending Regulation (EC) No 466/2001 as regards ochratoxin A. Official Journal of the European Union L25, 3-5.
Färber, P., Geisen, R., 2004. Analysis of differentially-expressed ochratoxin A biosynthesis genes of Penicillium nordicum. European Journal of Plant Pathology 110, 661-669.
Felsenstein, J., 1989. Hennig 86: A PC-DOS program for phylogenetic analysis. PHYLIP. Cladistics 5, 163-166.
Fernandes, A., Ratola, N., Alves, A., Venâncio, A., 2005. Fate of ochratoxin A during Port wine and Vinho Verde vinifications. International Journal of Food Microbiology, in press.
Fernandes, A., Venâncio, A., Moura, F., Garrido, J., Cerdeira, A., 2003. Fate of ochratoxin A during a vinification trial. Aspects of Applied Biology 68, 73-80.
Ferreira, R.B., Monteiro, S.S., Piçarra-Pereira, M.A., Teixeira, A.R., 2004. Engineering grapevine for increased resistance to fungal pathogens without compromising wine quality. Trends in Biotechnology 22, 168-173.
Festas, I., Herbert, P., Santos, L., Cabral, M., Barros, P., Alves, A., 2000. Ochratoxin A in some Portuguese wines: method validation and screening in port wine and Vinho Verde. American Journal of Enology and Viticulture 51, 150-154.
- 224 -
Filali, A., Ouammi, L., Betbeder, A.-M., Baudrimont, I., Soulaymani, R., Benayada, A., Creppy, E.E., 2001. Ochratoxin A in beverages from Morocco: a preliminary survey. Food Additives and Contaminants 18, 565-568.
Fungaro, M.H.P., Magnani, M., Vilas-Boas, L.A., Vissotto, P.C., Furlaneto, M.C., Vieira, M.L.C., Taniwaki, M.H., 2004a. Genetic relationships among Brazilian strains of Aspergillus ochraceus based on RAPD and ITS sequences. Canadian Journal of Microbiology 50, 985-988.
Fungaro, M.H.P., Vissotto, P.C., Sartori, D., Vilas-Boas, L.A., Furlaneto, M.C., Taniwaki, M.H., 2004b. A molecular method for detection of Aspergillus
carbonarius in coffee beans. Current Microbiology 49, 123-127. Garcia Moruno, E., Sanlorenzo, C., Boccaccino, B., Di Stefano, R., 2005. Treatment
with yeast to reduce the concentration of ochratoxin A in red wine. American Journal of Enology and Viticulture 56, 73-76.
Geisen, R., 2004. Molecular monitoring of environmental conditions influencing the induction of ochratoxin A biosynthesis genes in Penicillium nordicum. Molecular Nutrition and Food Research 48, 532-540.
Ghosal, S., Biswas, K., Chakrabati, D.K., 1979. Toxic naphtho-gamma-pyrones from Aspergillus niger. Journal of Agricultural and Food Chemistry 27, 1347-1351.
Giannikopoulos, G., Zabaras, D., Varelis, P., 2004. New analytical methods for the detection of ochratoxin A in food. In: Interact 2004 (abstract). Gold Coast, Queensland, Australia.
Gillings, M., Holley, M., 1997. Amplification of anonymous DNA fragments using pairs of long primers generates reproducible DNA fingerprints that are sensitive to genetic variation. Electrophoresis 18, 1512-1518.
Girbau, T., Stummer, B.E., Pocock, K.F., Baldock, G.A., Scott, E.S., Waters, E.J., 2004. The effect of Uncinula necator (powdery mildew) and Botrytis cinerea infection of grapes on levels of haze-forming pathogenesis-related proteins in grape juice and wine. Australian Journal of Grape and Wine Research 10, 125-133.
Goetz, G., Fkyerat, A., Mètais, N., Kunz, M., Tabacchi, R., Pezet, R., Pont, V., 1999. Resistance factors to grey mould in grape berries: identification of some phenolic inhibitors to Botrytis cinerea stilbene oxidase. Phytochemistry 52, 759-767.
Greaves, J.E., Jones, L.W., 1944. The influence of temperature on the microflora of the soil. Soil Science 58, 377-387.
Greenspan, L., 1977. Humidity fixed points of binary saturated aqueous solutions. Journal of Research of the National Bureau of Standards - A. Physics and Chemistry 81A, 89-96.
Grncarevic, M., Hawker, J., 1971. Browning of Sultana grape berries during drying. Journal of the Science of Food and Agriculture 22, 270-272.
Gupta, S.L., 1956. Occurrence of Aspergillus carbonarius (Bainier) Thom causing grape rot in India. Science and Culture 22, 167-168.
Guzev, L., Danshin, A., Ziv, S., Lichter, A., 2005. Occurrence of ochratoxin A producing fungi in wine and table grapes in Israel. International Journal of Food Microbiology, in press.
Häggblom, P.E., 1982. Production of ochratoxin A in barley by Aspergillus ochraceus and Penicilllium viridicatum: effect of fungal growth, time, temperature, and inoculum size. Applied and Environmental Microbiology 43, 1205-1207.
Harris, J.P., Mantle, P.G., 2001. Biosynthesis of ochratoxins by Aspergillus ochraceus. Phytochemistry 58, 709-716.

- 225 -
Heenan, C.N., Shaw, K.J., Pitt, J.I., 1998. Ochratoxin A production by Aspergillus
carbonarius and A. niger and detection using coconut cream agar. Journal of Food Mycology 1, 67-72.
Hewitt, W.B., 1988. Berry rots and raisin moulds. In: Pearson, R.G., Goheen, A.C. (Eds), Compendium of Grape Diseases. The American Phytopathological Society, Minnesota, USA, pp. 26-28.
Hocking, A.D., Varelis, P., Pitt, J.I., Cameron, S., Leong, S., 2003. Occurrence of ochratoxin A in Australian wine. Australian Journal of Grape and Wine Research 9, 72-78.
Hong, T.D., Ellis, R.H., Moore, D., 1997. Development of a model to predict the effect of temperature and moisture on fungal spore longevity. Annals of Botany 79, 121-128.
Horie, Y., 1995. Productivity of ochratoxin A of Aspergillus carbonarius in Aspergillus section Nigri. Nippon Kingakukai Kaiho 36, 73-76.
Hunt, D.C., McConnie, B.R., Crosby, N.T., 1979. Confirmation of ochratoxin A by chemical derivatisation and high-performance liquid chromatography. Analyst 105, 89-90.
Hunter, P.R., 1991. A critical review of typing methods for Candida albicans and their applications. Critical Reviews in Microbiology 17, 417-434.
Iavicoli, I., Brera, C., Carelli, G., Caputi, R., Marinaccio, A., Miraglia, M., 2002. External and internal dose in subjects occupationally exposed to ochratoxin A. International Archives of Occupational and Environmental Health 75, 381-386.
Iland, P., Ewart, A., Sitters, J., Markides, A., Bruer, N., 2000. Techniques for chemical analysis and quality monitoring during winemaking. Patrick Iland Wine Promotions, Campbelltown, South Australia, Australia.
Jacobs, A.K., Dry, I.B., Robinson, S.P., 1999. Induction of different pathogenesis-related cDNAs in grapevine infected with powdery mildew and treated with ethephon. Plant Pathology 48, 325-336.
Jarvis, W.R., Traquair, J.A., 1984. Bunch rot of grapes caused by Aspergillus
aculeatus. Plant Disease 68, 718-719. Jeandet, P., Douillet-Breuil, A.-C., Bessis, R., Debord, S., Sbaghi, M., Adrian, M.,
2002. Phytoalexins from the Vitaceae: biosynthesis, phytoalexin gene expression in transgenic plants, antifungal activity, and metabolism. Journal of Agricultural and Food Chemistry 50, 2731-2741.
Jeswal, P., 1998. Antidotal effect of grape juice (Vitis vinifera) on ochratoxin A caused hepatorenal carcinogenesis in mice (Mus musculus). Cytobios 93, 123-128.
Joosten, H.M.L.J., Goetz, J., Pittet, A., Schellenberg, M., Bucheli, P., 2001. Production of ochratoxin A by Aspergillus carbonarius on coffee cherries. International Journal of Food Microbiology 65, 39-44.
Jurjevic, A., Solfrizzo, M., Cvjetkovic, B., Avantaggiato, G., Visconti, A., 1999. Ochratoxin A and fumonisins (B1 and B2) in maize from Balkan nephropathy endemic and non endemic areas of Croatia. Mycotoxin Research 15, 67-80.
Kazi, B.A., Emmett, R.W., Clarke, K., Nancarrow, N., 2003a. Black Aspergillus mould in Australia. In: 8th International Congress of Plant Pathology (abstract). Christchurch, New Zealand, p. 140.
Kazi, B.A., Emmett, R.W., Nancarrow, N., Clarke, K., 2003b. Effects of temperature, moisture and/or irrigation on the survival of Aspergillus carbonarius in soil. In: 8th International Congress of Plant Pathology (abstract). Christchurch, New Zealand, p. 140.

- 226 -
Kazi, B.A., Emmett, R.W., Nancarrow, N., Clarke, K., 2004. Incidence of Aspergillus
carbonarius in Australian vineyards. In: Ophel-Keller, K., Hall, B. (Eds), 3rd Australasian Soil-borne Disease Symposium. Tanunda, South Australia, Australia, pp. 75-76.
Kevei, F., Hamari, Z., Varga, J., Kozakiewicz, Z., Croft, J.H., 1996. Molecular polymorphism and phenotypic variation in Aspergillus carbonarius. Antonie van Leeuwenhoek 70, 59-66.
Kiss, T., Kiss, L., 2000. Purification and characterization of an extracellular beta-D-xylosidase from Aspergillus carbonarius. World Journal of Microbiology and Biotechnology 16, 465-470.
Klich, M.A., Pitt, J.I., 1988. A Laboratory Guide to Common Aspergillus species and their Teleomorphs. Commonwealth Scientific and Industrial Research Organisation, Division of Food Processing, North Ryde, New South Wales, Australia.
Kortekamp, A., Zyprian, E., 2003. Characterization of Plasmopara-resistance in grapevine using in vitro plants. Journal of Plant Physiology 160, 1393-1400.
Krogh, P., Hald, B., Pederen, E.J., 1973. Occurrence of ochratoxin A and citrinin in cereals associated with mycotoxic porcine nephropathy. Acta Pathologia and Microbiologia Scandinavica Section B 81, 689-695.
Kuiper-Goodman, T., 1996. Risk assessment of ochratoxin A: an update. Food Additives and Contaminants 13, 53-57.
Lang, A., During, H., 1990. Grape berry splitting and some mechanical properties of the skin. Vitis 29, 61-70.
Larsen, T.O., Svendsen, A., Smedsgaard, J., 2001. Biochemical characterization of ochratoxin A-producing strains of the genus Penicillium. Applied and Environmental Microbiology 67, 3630-3635.
Lataste, C., Guérin, L., Solanet, D., Berger, J.L., Cottereau, P., Molot, B., 2004. Évolution de la contamination en ochratoxine A: du vignoble Français au vin. Progrès Agricole et Viticole 121, 57-64.
Lee, H.B., Magan, N., 2000. Impact of environment and interspecific interactions between spoilage fungi and Aspergillus ochraceus on growth and ochratoxin production in maize grain. International Journal of Food Microbiology 61, 11-16.
Leong, S., Hocking, A.D., Pitt, J.I., 2004. Occurrence of fruit rot fungi (Aspergillus
section Nigri) on some drying varieties of irrigated grapes. Australian Journal of Grape and Wine Research 10, 83-88.
Leong, S.L., Hocking, A.D., Pitt, J.I., Kazi, B.A., Emmett, R.W., Scott, E.S., 2005a. Australian research on ochratoxigenic fungi and ochratoxin A. International Journal of Food Microbiology, in press.
Leong, S.L., Hocking, A.D., Pitt, J.I., Kazi, B.A., Emmett, R.W., Scott, E.S., 2005b. Black Aspergillus spp. in Australian vineyards: from soil to ochratoxin A in wine. In: Hocking, A.D., Pitt, J.I., Samson, R.A., Thrane, U. (Eds), Advances in Food Mycology. Springer, New York, USA, in press.
Lin, L.-C., Chen, P.-C., Fu, Y.-M., Shih, D.Y.-C., 2005. Ochratoxin A contamination in coffees, cereals, red wines and beers in Taiwan. Journal of Food and Drug Analysis 13, 84-92.
Lombaert, G.A., Pellaers, P., Neumann, G., Kitchen, D., Huzel, V., Trelka, R., Kotello, S., Scott, P.M., 2004. Ochratoxin A in dried vine fruits on the Canadian retail market. Food Additives and Contaminants 21, 578-585.

- 227 -
Lopez de Cerain, A., González-Peñas, E., Jiménez, A.M., Bello, J., 2002. Contribution to the study of ochratoxin A in Spanish wines. Food Additives and Contaminants 19, 1058-1064.
MacDonald, S., Wilson, P., Barnes, K., Damant, A., Massey, R., Mortby, E., Shepherd, M.J., 1999. Ochratoxin A in dried vine fruit: method development and survey. Food Additives and Contaminants 16, 253-260.
MAFF (Ministry for Agriculture, Fisheries and Food), 1997. Survey of aflatoxins and ochratoxin A in cereals and retail products. London, UK.
MAFF (Ministry for Agriculture, Fisheries and Food), 1999. 1998 Survey of retail products for ochratoxin A. London, UK.
Magnoli, C., Astoreca, A., Ponsone, L., Combina, M., Palacio, G., Rosa, C.A.R., Dalcero, A.M., 2004. Survey of mycoflora and ochratoxin A in dried vine fruits from Argentina markets. Letters in Applied Microbiology 39, 326-331.
Magnoli, C.E., Violante, M., Combina, M., Palacio, G., Dalcero, A.M., 2003. Mycoflora and ochratoxin-producing strains of Aspergillus section Nigri in wine grapes in Argentina. Letters in Applied Microbiology 37, 179-184.
Majerus, P., Bresch, H., Otteneder, H., 2000. Ochratoxin in wines, fruit juices and seasonings. Archiv für Lebensmittelhygiene 51, 81-128.
Majerus, P., Otteneder, H., 1996. Nachweis und Vorkommen von Ochratoxin A in Wein und Traubsaft. Deutsche Lebensmittel-Rundschau 92, 388-390.
Mantle, P.G., 2000. Uptake of radiolabelled ochratoxin A from soil by coffee plants. Phytochemistry 53, 377-378.
Markarki, P., Delpont-Binet, C., Grosso, F., Dragacci, S., 2001. Determination of ochratoxin A in red wine and vinegar by immunoaffinity high-pressure liquid chromatography. Journal of Food Protection 64, 533-537.
Marquardt, R.R., Frohlich, A., Abramson, D., 1990. Ochratoxin A: an important western Canadian storage mycotoxin. Canadian Journal of Physiology and Pharmacology 68, 991-999.
McGechan, J.K., 1978. Bunch rot of grapes. Farmer's Newsletter 139, 18-22. Megnegneau, B., Debets, F., Hoekstra, R.F., 1993. Genetic variability and relatedness
in the complex group of black Aspergilli based on random amplification of polymorphic DNA. Current Genetics 23, 323-329.
Michailides, T.J., Christensen, P., Morgan, D.P., Felts, D., 2002. First report of Aspergillus vine canker of table grapes caused by Aspergillus niger. Plant Disease 86, 75.
Micheli, A., Negro, C., Tommasi, L., Minoia, E., De Leo, P., 2003. Determination of polyphenols, resveratrol, antioxidant activity and ochratoxin A in wines obtained from organic farming in Southern Apulia (Italy). Le Bulletin de l’OIV 76, 976-997.
Mitchell, D., Aldred, D., Magan, N., 2003. Impact of ecological factors on the growth and ochratoxin A production by Aspergillus carbonarius from different regions of Europe. Aspects of Applied Biology 68, 109-116.
Mitchell, D., Parra, R., Aldred, D., Magan, N., 2004. Water and temperature relations of growth and ochratoxin A production by Aspergillus carbonarius strains from grapes in Europe and Israel. Journal of Applied Microbiology 97, 439-445.
Möller, T.E., Nyberg, M., 2003. Ochratoxin A in raisins and currants: basic extraction procedure used in two small marketing surveys of the occurrence and control of the heterogeneity of the toxins in samples. Food Additives and Contaminants 20, 1072-1076.

- 228 -
Montiel, D., Dickinson, M.J., Lee, H.A., Dyer, P.S., Jeens, D.J., Roberts, I.N., James, S., Fuller, L.J., Matsuchima, K., Archer, D.B., 2003. Genetic differentiation of the Aspergillus section Flavi complex using AFLP fingerprints. Mycological Research 107, 1427-1434.
Morton, C.O., Mauchline, T.H., Kerry, B.R., Hirsch, P.R., 2003. PCR-based DNA fingerprinting indicates host-related genetic variation in the nematophagous fungus Pochonia chlamydosporia. Mycological Research 107, 198-205.
Mühlencoert, E., Mayer, I., Zapf, M.W., Vogel, R.F., Niessen, L., 2004. Production of ochratoxin A by Aspergillus ochraceus. European Journal of Plant Pathology 110, 651-659.
Nair, N.G., 1985. Fungi associated with bunch rot of grapes in the Hunter Valley. Australian Journal of Agricultural Research 36, 435-442.
Nakajima, M., Tsubouchi, H., Miyabe, M., Ueno, Y., 1997. Survey of aflatoxin B1 and ochratoxin A in commercial green coffee beans by high-performance liquid chromatography linked with immunoaffinity chromatography. Food and Agricultural Immunology 9, 77-83.
Nei, M., 1978. Estimation of average heterozygosity and genetic distance from a small number of individuals. Genetics 89, 583-590.
Ng, W., Mankotia, M., Pantazopoulos, P., Neil, R.J., Scott, P.M., 2004. Ochratoxin in wine and grape juice sold in Canada. Food Additives and Contaminants 21, 971-981.
Ngundi, M.M., Shriver-Lake, L.C., Moore, M.H., Lassman, M.E., Ligler, F.S., Taitt, C.R., 2005. Array biosensor for detection of ochratoxin A in cereals and beverages. Analytical Chemistry 77, 148-154.
Niessen, L., Schmidt, H., Mühlencoert, E., Färber, P., Karolewiez, A., Geisen, R., 2005. Advances in the molecular diagnosis of ochratoxin A-producing fungi. Food Additives and Contaminants 22, 324-334.
Nirenberg, H.J., 1976. Untersuchungen uber die mophologische und biologische differenzierung in der Fusarium-Sektion Liseola. Fortstwirschaft, Berlin, Germany.
Northolt, M.D., Van Egmond, H.P., Paulsch, W.E., 1979. Ochratoxin A production by some fungal species in relation to water activity and temperature. Journal of Food Protection 42, 485-490.
O'Brien, E., Dietrich, D.R., 2005. Ochratoxin A: the continuing enigma. Critical Reviews in Toxicology 35, 33-60.
O'Callaghan, J., Caddick, M.X., Dobson, A.D.W., 2003. A polyketide synthase gene required for ochratoxin A biosynthesis in Aspergillus ochraceus. Microbiology 149, 3485-3491.
Okolo, B.N., Ire, F.S., Ezeogu, L.I., Anyanwu, C.U., Odibo, J.C., 2001. Purification and some properties of a novel starch-digesting amylase from Aspergillus
carbonarius. Journal of the Science of Food and Agriculture 81, 329-336. Ono, H., Kataoka, A., Koakutsu, M., Tanaka, K., Kawasugi, S., Wakazawa, M., Ueno,
Y., Manabe, M., 1995. Ochratoxin A producibility by strains of Aspergillus
niger group stored in IFO culture collection. Mycotoxins 41, 47-51. Ospital, M., Cazabeil, J.-M., Betbeder, A.-M., Tricard, C., Creppy, E., Medina, B.,
1998. L'Ochratoxine A dans les vins. Revue Française d'Oenologie 169, 16-18. Otteneder, H., Majerus, P., 2000. Occurrence of ochratoxin A (OTA) in wines:
influence of the type of wine and its geographical origin. Food Additives and Contaminants 17, 793-798.
Ough, C.S., Corison, C.A., 1980. Measurement of patulin in grapes and wines. Journal of Food Science 45, 476-478.

- 229 -
Palacios-Cabrera, H., Taniwaki, M.H., Menezes, H.C., Iamanaka, B.T., 2004. The production of ochratoxin A by Aspergillus ochraceus in raw coffee at different equilibrium relative humidity and under alternating temperatures. Food Control 15, 531-535.
Pardo, E., Marín, S., Sanchis, V., Ramos, A.J., 2004. Prediction of fungal growth and ochratoxin A production by Aspergillus ochraceus on irradiated barley grain as influenced by temperature and water activity. International Journal of Food Microbiology 95, 79-88.
Parenicová, L., Benen, J.A.E., Samson, R.A., Visser, J., 1997. Evaluation of RFLP analysis of the classification of selected black Aspergilli. Mycological Research 7, 810-814.
Parenicová, L., Suykerbuyk, M.E.G., Samson, R.A., Visser, J., 1996. Evaluation of restriction fragment length polymorphism for the classification of Aspergillus
carbonarius. In: Proceedings of the First International Conference on Fungi: Hopes and Challenges. Cairo, Egypt, pp. 13-19.
Patel, S., Hazel, C.M., Winterton, A.G.M., Mortby, E., 1996. Survey of ethnic foods for mycotoxins. Food Additives and Contaminants 13, 833-841.
Patterson, M., Damaglou, A.P., 1986. The effect of water activity and pH on the production of mycotoxins by fungi growing on a bread analogue. Letters in Applied Microbiology 3, 123-125.
Perrone, G., Susca, A., Epifani, F., Mulè, G., 2005. AFLP characterization of Southern Europe population of Aspergillus sect. Nigri from grapes. International Journal of Food Microbiology, in press.
Perrone, G., Susca, A., Stea, G., Mulè, G., 2004. PCR assay for the identification of Aspergillus carbonarius and Aspergillus japonicus. European Journal of Plant Pathology 110, 641-649.
Petzinger, E., Ziegler, K., 2000. Ochratoxin A from a toxicological perspective. Journal of Veterinary Pharmacology and Therapeutics 23, 91-98.
Pfohl-Leszkowicz, A., Petkova-Bocharova, T., Chernozemsky, I.N., Castegnaro, M., 2002. Balkan endemic nephropathy and associated urinary tract tumours: a review on aetiological causes and the potential role of mycotoxins. Food Additives and Contaminants 19, 282-302.
Pietri, A., Bertuzzi, T., Pallaroni, L., Piva, G., 2001. Occurrence of ochratoxin A in Italian wines. Food Additives and Contaminants 18, 647-654.
Pitt, J.I., 1987. Penicillium viridicatum, Penicillium verrucosum and production of ochratoxin A. Applied and Environmental Microbiology 53, 266-269.
Pitt, J.I., Hocking, A.D., 1997. Fungi and Food Spoilage. Blackie Academic and Professional, London, UK.
Pitt, J.I., Tomaska, L., 2002. Are mycotoxins a health hazard in Australia? 2. Ochratoxin A. Food Australia 54, 39-43.
Priestap, H.A., 1984. New naphthopyrones from Aspergillus fonsecaeus. Tetrahedron 40, 3617-3624.
Rankine, B., 1989. Making good wine: a manual of winemaking practice for Australia and New Zealand. Sun Books, Macmillan, South Melbourne, Australia.
Raper, K.B., Fennell, D.I., 1965. The Genus Aspergillus. The Williams & Wilkins Company, Baltimore, USA.
Ratola, N., Abade, E., Simões, T., Venâncio, A., 2005. Evolution of ochratoxin A content from must to wine in Port Wine microvinification. Analytical and Bioanalytical Chemistry 382, 405-411.
Ratola, N., Martins, L., Alves, A., 2004. Ochratoxin A in wines – assessing global uncertainty associated with results. Analytica Chimica Acta 513, 319-324.
- 230 -
Reiss, J., 1986. Schimmelpilze. Lebensweise, Nutzen, Schaden, Bekämpfung. Springer, Berlin, Germany.
Richard, J.L., Plattner, R.D., May, J., Liska, S.L., 1999. The occurrence of ochratoxin A in dust collected from a problem household. Mycopathologia 146, 99-103.
Rosa, C.A.R., Magnoli, C.E., Fraga, M.E., Dalcero, A.M., Santana, D.M.N., 2004. Occurrence of ochratoxin A in wine and grape juice marketed in Rio de Janeiro, Brazil. Food Additives and Contaminants 21, 358-364.
Roset, M., 2003. Survey on ochratoxin A in grape juice. Fruit Processing 13, 167-172. Rotem, J., Aust, H.J., 1991. The effect of ultraviolet and solar radiation and
temperature on survival of fungal propagules. Journal of Phytopathology 133, 76-84.
Ruediger, G.A., Pardon, K.H., Sas, A.N., Godden, P.W., Pollnitz, A.P., 2004. Removal of pesticides from red and white wine by the use of fining and filter agents. Australian Journal of Grape and Wine Research 10, 8-16.
Saez, J.M., Medina, A., Gimeno-Adelantado, J.V., Mateo, R., Jimenez, M., 2004. Comparison of different sample treatments for the analysis of ochratoxin A in must, wine and beer by liquid chromatography. Journal of Chromatography A 1029, 125-133.
Sage, L., Garon, D., Seigle-Murandi, F., 2004. Fungal microflora and ochratoxin A risk in French vineyards. Journal of Agricultural and Food Chemistry 52, 5764-5768.
Sage, L., Krivobok, S., Delbos, É., Seigle-Murandi, F., Creppy, E.E., 2002. Fungal flora and ochratoxin A production in grapes and musts from France. Journal of Agricultural and Food Chemistry 50, 1306-1311.
Samson, R.A., Hoekstra, E.S., Frisvad, J.C., Filtenborg, O., 2000. Introduction to Food- and Airborne Fungi. Centraalbureau voor Schimmelcultures, Utrecht, Netherlands.
Sarig, P., Zutkhi, Y., Lisker, N., Shkelerman, Y., Ben-Arie, R., 1998. Natural and induced resistance of table grapes to bunch rots. Acta Horticulturae 464, 65-70.
Saxena, J., Mehrotra, B.S., 1990. The occurrence of mycotoxins in some dry fruits retail marketed in Naintal district of India. Acta Alimentaria 19, 221-224.
Saxena, J., Munimbazi, C., Bullerman, L.B., 2001. Relationship of mould count, ergosterol and ochratoxin A production. International Journal of Food Microbiology 71, 29-34.
Schmidt, H., Ehrmann, M., Vogel, R.E., Taniwaki, M.H., Niessen, L., 2003. Molecular typing of Aspergillus ochraceus and construction of species specific SCAR-primers based on AFLP. Systematic and Applied Microbiology 26, 138-146.
Schmidt, H., Taniwaki, M.H., Vogel, R.F., Niessen, L., 2004. Utilization of AFLP markers for PCR-based identification of Aspergillus carbonarius and indication of its presence in green coffee samples. Journal of Applied Microbiology 97, 899-909.
Schnerr, H., Vogel, R.F., Niessen, L., 2002. Correlation between DNA of trichothecene-producing Fusarium species and deoxynivalenol concentrations in wheat-samples. Letters in Applied Microbiology 35, 121-125.
Schwartz, G.G., 2002. Hypothesis: does ochratoxin A cause testicular cancer? Cancer Causes & Control 13, 91-100.
Schwenk, S., Altmayer, B., Eichhorn, K.W., 1989. Untersuchungen zur Bedeutung toxischer Stoffwechselprodukte des Pilzes Trichothecium roseum Link ex Fr. für den Weinbau. Zeitschrift für Lebensmittel Untersuchung und Forschung 188, 527-530.
- 231 -
Scott, P.M., 1996. Effects of processing and detoxification treatments on ochratoxin A: introduction. Food Additives and Contaminants 13, 19-21.
Serra, R., Abrunhosa, L., Kozakiewicz, Z., Venâncio, A., 2003. Black Aspergillus species as ochratoxin A producers in Portuguese wine grapes. International Journal of Food Microbiology 88, 63-68.
Serra, R., Braga, A., Venâncio, A., 2005a. Mycotoxin-producing and other fungi isolated from grapes for wine production, with particular emphasis on ochratoxin A. Research in Microbiology 156, 515-521.
Serra, R., Mendonça, A., Venâncio, A., 2005b. Ochratoxin A occurrence and production in Portuguese wine grapes at various stages of maturation. International Journal of Food Microbiology 156, 515-521.
Serra, R., Mendonça, C., Abrunhosa, L., Venâncio, A., 2004. Determination of ochratoxin A in wine grapes: comparison of extraction procedures and method validation. Analytica Chemica Acta 513, 41-47.
Shephard, G.S., Fabiani, A., Stockenström, S., Mshicileli, N., Sewram, V., 2003. Quantitation of ochratoxin A in South African wines. Journal of Agricultural and Food Chemistry 51, 1102-1106.
Siantar, D.P., Halverson, C.A., Kirmiz, C., Peterson, G.F., Hill, N.R., Dugar, S.M., 2003. Ochratoxin A in wine: survey by antibody- and polymeric-based SPE columns using HPLC/fluorescence detection. American Journal of Enology and Viticulture 54, 170-177.
Silva, A., Galli, R., Grazioli, B., Fumi, M.D., 2003. Metodi di riduzione di residui di ocratossina A nei vini. Industrie delle Bevande 32, 467-472.
Simbarashe, S., Devliehgere, F., de Meulenaer, B., Debevere, J., 2005. Effect of water activity and temperature on growth and the relationship between fumonisin production and the radial growth of Fusarium verticillioides and Fusarium
proliferatum on corn. Journal of Food Protection 68, 1054-1059. Sizoo, E.A., Van Egmond, H.P., 2005. Analysis of duplicate 24-hour diet samples for
aflatoxin B-1, aflatoxin M-1 and ochratoxin A. Food Additives and Contaminants 22, 163-172.
Skaug, M.A., Eduard, W., Størmer, F.C., 2000. Ochratoxin A in airborne dust and fungal conidia. Mycopathologia 151, 93-98.
Smith-White, J.L., Gunn, L.V., Summerell, B.A., 2001. Analysis of diversity within Fusarium oxysporum populations using molecular and vegetative compatibility grouping. Australasian Plant Pathology 30, 153-157.
Sneath, P.H.A., Sokal, R.R., 1973. Numerical Taxonomy: The principles and practice of numerical classification. W.H. Freeman and Co., San Francisco, USA.
Snow, D., 1949. The germination of mould spores at controlled humidities. Applied Biology 36, 1-13.
Snowdon, A.L., 1990. A Colour Atlas of Post-harvest Diseases and Disorders of Fruit and Vegetables. I. General introduction and fruits. Wolfe Scientific, London, UK.
Soleas, G.J., Yan, J., Goldberg, D.M., 2001. Assay of ochratoxin A in wine and beer by high-pressure liquid chromatography photodiode array and gas chromatography mass selective detection. Journal of Agricultural and Food Chemistry 49, 2733-2740.
Soufleros, E.H., Tricard, C., Bouloumpasi, E.C., 2003. Occurrence of ochratoxin A in Greek wines. Journal of the Science of Food and Agriculture 83, 173-179.
Stander, M.A., Bornscheuer, U.T., Henke, E., Steyn, P.S., 2000. Screening of commercial hydrolases for the degradation of ochratoxin A. Journal of Agricultural and Food Chemistry 48, 5736-5739.

- 232 -
Stander, M.A., Steyn, P.S., 2002. Survey of ochratoxin A in South African wines. South African Journal of Enology and Viticulture 23, 9-13.
Stefanaki, I., Foufa, E., Tsatsou-Dritsa, A., Dais, P., 2003. Ochratoxin A concentrations in Greek domestic wines and dried vine fruits. Food Additives and Contaminants 20, 74-83.
Størmer, F.C., Høiby, E.A., 1996. Citrinin, ochratoxin A and iron. Possible implications for their biological function and induction of nephropathy. Mycopathologia 134, 103-107.
Suárez-Quiroz, M., González-Rios, O., Barel, M., Guyot, B., Schorr-Galindo, S., Guiraud, J.-P., 2004. Study of ochratoxin A-producing strains in coffee processing. International Journal of Food Science and Technology 39, 501-507.
Subirade, I., 1996. Fate of ochratoxin A during breadmaking. Food Additives and Contaminants 13, 25-26.
Swift, J.G., May, P., Lawton, E.A., 1974. Concentric cracking of grape berries. Vitis 13, 30-35.
Taniwaki, M.H., Pitt, J.I., Teixeira, A.A., Iamanaka, B.T., 2003. The source of ochratoxin A in Brazilian coffee and its formation in relation to processing methods. International Journal of Food Microbiology 82, 173-179.
Taniwaki, M.H., Pitt, J.I., Urbano, G.R., Teixeira, A.A., Leitão, M.F.d.F., 1999. Fungi producing ochratoxin A in coffee. In: 18th International Scientific Colloquium on Coffee. Association Scientifique Internationale du Café, Helsinki, Finland, pp. 239-247.
Tateo, F., Bononi, M., 2001. Survey of Ochratoxin A in wines. First data concerning a sampling of bottled red wines. Le Bulletin de l’OIV 74, 772-780.
Tateo, F., Bononi, M., 2003. Survey on ochratoxin A in wine. More data concerning bottled red wines. Le Bulletin de l’OIV 76, 766-778.
Tateo, F., Bononi, M., Fuso-Nerini, A., Lubian, E., Martello, S., 1999. Ricerca e determinazione dell'ocratossina a nei vini. Industrie delle Bevande 28, 592-596.
Tateo, F., Bononi, M., Lubian, E., 2000. Survey on Ochrotoxin A in wines. Data concerning the market of table wines in brik. Le Bulletin de l’OIV 73, 772-783.
Tattersall, D.B., Pocock, K.F., Hayasaka, Y., Adams, K., van Heeswijck, R., Waters, E.J., Høj, P.B., 2001. Pathogenesis related proteins - their accumulation in grapes during berry growth and their involvement in white wine heat instability. In: Roubelakis-Angelakis, K.A. (Ed.), Molecular Biology & Biotechnology of the Grapevine. Kluwer Academic Publishers, Dordrecht, Netherlands, pp. 183-201.
Téren, J., Palágyi, A., Varga, J., 1997. Isolation of ochratoxin producing aspergilli from green coffee beans of different origin. Cereal Research Communications 25, 303-304.
Téren, J., Varga, J., Hamari, Z., Rinyu, E., Kevei, F., 1996. Immunochemical detection of ochratoxin A in black Aspergillus strains. Mycopathologia 134, 171-176.
Tjamos, S.E., Antoniou, P.P., Kazantzidou, A., Antonopoulos, D.F., Papageorgiou, I., Tjamos, E.C., 2004. Aspergillus niger and Aspergillus carbonarius in Corinth raisin and wine-producing vineyards in Greece: population composition, ochratoxin A production and chemical control. Journal of Phytopathology 152, 250-255.
Tjamos, S.E., Antoniou, P.P., Tjamos, E.C., 2005. Aspergillus spp., distribution, population composition and ochratoxin A production in wine-producing vineyards in Greece. International Journal of Food Microbiology, in press.

- 233 -
Tran-Dinh, N., Carter, D.A., 2000. Characterization of microsatellite loci in the aflatoxigenic fungi Aspergillus flavus and Aspergillus parasticus. Molecular Ecology Primer Notes 9, 2155-2234.
Trucksess, M.W., Maragos, C.M., 2001. Joint Mycotoxin Committee. Journal of AOAC International 84, 303-308.
Ueno, Y., 1998. Residue and risk of ochratoxin A in human plasma and beverages in Japan. Mycotoxins 47, 25-32.
Urbano, G.R., Taniwaki, M.H., Leitão, M.F.d.F., Vicentini, M.C., 2001. Occurrence of ochratoxin A-producing fungi in raw Brazilian coffee. Journal of Food Protection 64, 1226-1230.
Valenta, H., 1998. Chromatographic methods for the determination of ochratoxin A in animal and human tissues and fluids. Journal of Chromatography A 815, 75-92.
Valero, A., Marín, S., Ramos, A.J., Sanchis, V., 2005. Ochratoxin A-producing species in grapes and sun-dried grapes and their relation to ecophysiological factors. Letters in Applied Microbiology 41, 196-201.
van der Merwe, K.J., Steyn, P.S., Fouri, L., 1965. Ochratoxin A, a toxic metabolite produced by Aspergillus ochraceus Wilh. Nature 205, 1112-1113.
Varga, J., Juhász, Á., Kevei, F., Kozakiewicz, Z., 2004a. Molecular diversity of agriculturally important Aspergillus species. European Journal of Plant Pathology 110, 627-640.
Varga, J., Kevei, É., Tóth, B., Kozakiewicz, Z., Hoekstra, R.F., 2000a. Molecular analysis of variability within the toxigenic Aspergillus ochraceus species. Canadian Journal of Microbiology 46, 593-599.
Varga, J., Kevei, F., Fekete, C., Coenen, A., Kozakiewicz, Z., Croft, J.H., 1993. Restriction fragment length polymorphisms in the mitochondrial DNAs of the Aspergillus niger aggregate. Mycological Research 97, 1207-1212.
Varga, J., Kevei, F., Hamari, Z., Tóth, B., Téren, J., Croft, J.H., Kozakiewicz, Z., 2000b. Genotypic and phenotypic variability among black Aspergilli. In: Samson, R.A., Pitt, J.I. (Eds), Integration of Modern Taxonomic Methods for Penicillium and Aspergillus Classification. Harwood Academic Publishers, Amsterdam, Netherlands, pp. 397-411.
Varga, J., Kevei, F., Vriesema, A., Debets, F., Kozakiewicz, Z., Croft, J.H., 1994. Mitochondrial DNA restriction fragment length polymorphisms in field isolates of the Aspergillus niger aggregate. Canadian Journal of Microbiology 40, 612-621.
Varga, J., Rigó, K., Lamper, C., Téren, J., Szabó, G., 2002. Kinetics of ochratoxin A production in different Aspergillus species. Acta Biologica Hungarica 53, 381-388.
Varga, J., Rigó, K., Téren, J., 2000c. Degradation of ochratoxin A by Aspergillus species. International Journal of Food Microbiology 59, 1-7.
Varga, J., Rigó, K., Téren, J., Mesterházy, Á., 2001a. Recent advance in ochratoxin research II. Biosynthesis, mode of action and control of ochratoxins. Cereal Research Communications 29, 93-100.
Varga, J., Rigó, K., Téren, J., Mesterházy, Á., 2001b. Recent advances in ochratoxin research I. Production, detection and occurrence of ochratoxins. Cereal Research Communications 29, 85-92.
Varga, J., Tóth, B., Mesterházy, Á., 2004b. Molecular detection of mycotoxin-producing fungi. Cereal Research Communications 32, 193-200.

- 234 -
Versalovic, J., Koeuth, T., Lupski, J.R., 1991. Distribution of repetitive DNA sequences in eubacteria and application for fingerprinting of bacterial genomes. Nucleic Acid Research 19, 6823-6831.
Viani, R., 1996. Fate of ochratoxin A (OTA) during processing of coffee. Food Additives and Contaminants 13, 29-33.
Visconti, A., Pascale, M., Centonze, G., 1999. Determination of ochratoxin A in wine by means of immunoaffinity column clean-up and high-performance liquid chromatography. Journal of Chromatography A 864, 89-101.
Vos, P., Hogers, R., Bleeker, M., Reijans, M., van der Lee, T., Hornes, M., Fritjers, A., Pot, J., Peleman, J., Kuiper, M., Zabeau, M., 1995. AFLP: a new technique for DNA fingerprinting. Nucleic Acids Research 23, 4407-4414.
Vrabcheva, T., Usleber, E., Dietrich, R., Märtlbauer, E., 2000. Co-occurrence of ochratoxin A and citrinin in cereals from Bulgarian villages with a history of Balkan endemic nephropathy. Journal of Agricultural and Food Chemistry 48, 2483-2488.
White, T.J., Bruns, T., Lee, S., Taylor, J., 1990. Amplification and direct sequencing of fungal ribosomal RNA genes for phylogenetics. In: Innis, M.A., Gelfand, D.H., Sninsky, J.J., White, T.J. (Eds), PCR Protocols. A Guide to Methods and Applications. Academic Press, San Diego, USA, pp. 315-322.
Wicklow, D.T., Dowd, P.F., Alfatafta, A.A., Gloer, J.B., 1996. Ochratoxin A: an antiinsectan metabolite from the sclerotia of Aspergillus carbonarius NRRL 369. Canadian Journal of Microbiology 42, 1100-1103.
Winemakers' Federation of Australia, Australian Wine and Brandy Corporation, 2000. The Marketing Decade. Adelaide, Australia.
Winston, P.W., Bates, D.H., 1960. Saturated solutions for the control of humidity in biological research. Ecology 41, 232-237.
Yokoyama, K., Wang, L., Miyaji, M., Nishimura, K., 2001. Identification, classification and phylogeny of the Aspergillus section Nigri inferred from mitochondrial cytochrome b gene. FEMS Microbiology Letters 200, 241-246.
Young, J.F., 1967. Humidity control in the laboratory using salt solutions - a review. Journal of Applied Chemistry 17, 241-245.
Zahavi, T., Cohen, L., Weiss, B., Schena, L., Daus, A., Kaplunov, T., Zutkhi, J., Ben-Arie, R., Droby, S., 2000. Biological control of Botrytis, Aspergillus and Rhizopus rots on table and wine grapes in Israel. Postharvest Biology and Technology 20, 115-124.
Zimmerli, B., Dick, R., 1996. Ochratoxin A in table wine and grape-juice: occurrence and risk assessment. Food Additives and Contaminants 13, 655-668.