Embed Size (px)
Citation preview
This work is distributed as a Discussion Paper by the
STANFORD INSTITUTE FOR ECONOMIC POLICY RESEARCH
SIEPR Discussion Paper No. 17-03
Black and White: Access to Capital among Minority-Owned Startups
By
Robert Fairlie, Alicia Robb, and David T. Robinson
Stanford Institute for Economic Policy Research Stanford University Stanford, CA 94305
(650) 725-1874
The Stanford Institute for Economic Policy Research at Stanford University supports research bearing on economic and public policy issues. The SIEPR Discussion Paper
Series reports on research and policy analysis conducted by researchers affiliated with the Institute. Working papers in this series reflect the views of the authors and not
necessarily those of the Stanford Institute for Economic Policy Research or Stanford University
ii
“rfr˙vfinance9˙KFS” — 2016/12/15 — 14:20 — page 1 — #1 ii
ii
ii
Black and White:
Access to Capital among Minority-Owned Startups⇤
Robert Fairlie†
Alicia Robb‡
David T. Robinson§
December 15, 2016
Abstract
We use confidential and restricted-access data from the Kauffman Firm Survey (KFS)and Dun & Bradstreet (D&B) to explore whether minority founders face racial biaswhen they raise capital for new businesses. Black-owned businesses are persistentlysmaller and face more difficulty in raising external capital. Large differences in creditworthiness are important for explaining the difference. Even controlling for creditworthiness, persistent differences in perceptions of treatment by banks are also im-portant. Spatial variation in banking conditions and historical attitudes towards raceare consistent with racial bias. In contrast, differences in human capital measures,need for capital, business types, and spatial mismatch in banking and clustering con-tribute relatively little to why black entrepreneurs obtain less financial capital.
Keywords: access to capital, entrepreneurs, minorities, startups.
⇤This draft is dated December 15, 2016. We are grateful for comments and suggestions from ElijahBrewer, Scott Frame, Melinda Petre, Per Stromberg, participants at the AEA meetings, the Society for Gov-ernment Economists meetings, the CESifo Conference on Entrepreneurship and Economics, the FederalReserve Bank of Cleveland and Kauffman Foundation Conference on Entrepreneurial Finance, the Inter-national Conference on Panel Data, the APPAM meetings, as well as seminar participants at the ResearchInstitute of Industrial Economics, Stockholm, Stockholm University, University of Melbourne, Universityof Southern California, and Vanderbilt University.
†University of California, Santa Cruz, Stanford University and NBER. E-mail: [email protected].‡Kauffman Foundation and University of California, Berkeley. E-mail: [email protected].§Fuqua School of Business, Duke University and NBER, E-mail: [email protected].
ii
“rfr˙vfinance9˙KFS” — 2016/12/15 — 14:20 — page 1 — #2 ii
ii
ii
1 Introduction
More than half a century after the passage of the Civil Rights Act, economic differences
between whites and African-Americans continue to be a source of social and political
tension in the United States. The median household income for black families is $37,000
with one out of four black families living in poverty, compared with a median income
of $63,000 and poverty rate of 9 percent for white families (U.S. Census Bureau 2016).
Inequality is even higher for wealth and financial assets. For example, the median house-
hold net worth for black families is fourteen times lower than that of whites and only 6
percent of black families own stocks or mutual funds (U.S. Census Bureau 2014). Lev-
els of home ownership and home equity are also much lower among black families (U.S.
Census Bureau 2014).
Entrepreneurship is often viewed as a mechanism for promoting economic growth,
wealth accumulation and job creation in minority communities, a tool for alleviating these
differences (Boston, 1999, 2006; Bradford 2003). Yet, access to financial capital is a critical
element of new business formation. Given the pronounced differences between whites
and blacks in terms of income and wealth measures, it is important to ask whether they
face different conditions in capital markets, and if so, to explore the causes of these dif-
ferences. This paper provides the first detailed empirical analysis of whether minority
entrepreneurs experience different financing outcomes when they attempt to raise capital
to start new businesses.
To explore racial differences in access to capital for startups, we use the confidential,
restricted-access version of the Kauffman Firm Survey (KFS), which is the only dataset
that provides panel data for startups with detailed information on financing amounts and
sources, as well as a large enough sample size of minority firms. We also obtained special
confidential administrative data on credit ratings from Dun & Bradstreet and matched
these data to all businesses in the restricted-access version of the KFS. For later survey
waves, we also have information on founder net worth. The unprecedented detail of the
KFS data allow us to control for many characteristics that are correlated with race but
1
ii
“rfr˙vfinance9˙KFS” — 2016/12/15 — 14:20 — page 2 — #3 ii
ii
ii
would typically remain unobservable. Moreover, the panel structure of the KFS allows
us to focus on both the initial capital that firms receive in their founding year and new
capital injections secured in the firm’s next seven years of operations. Ultimately this
allows us not only to measure initial differences, but also study whether any differences
in initial capital are diminished as startups build track records or, if instead, they persist
over time.
Our analysis is structured as follows. First, we ask whether African-American en-
trepreneurs experience different financing outcomes, both at founding and as the firm
matures. Here we find that African-American business ventures start smaller in terms of
overall financial capital and invest capital at a slower rate in the years following startup.
This means that black/white funding differences present at the firm’s founding persist
and even worsen over time.
Detailed information on the type of financing used at business founding allow us to
explore the channels through which this persistent difference occurs. Racial differences
in outside debt explain more than half of the disparities in total financial capital. Indeed,
leverage ratios for black-owned startups are persistently below those observed for white-
owned startups. But, the disparities do not end here: black-owned startups also have
lower levels of all other major sources of funding than do white-owned startups. In other
words, they are not able simply to substitute owner equity or debt for bank loans.
Given these findings, our second set of questions asks what factors explain these dif-
ferences. We are particularly interested in examining whether credit scores differ between
black and white startups and whether any existing differences contribute to financing dis-
parities. Surprisingly, there is very little evidence on this question and the only evidence
is from larger, more established and older businesses (Cavalluzzo and Wolken 2005). Us-
ing the KFS, we find large differences between black- and white-owned startups along
many business and owner characteristics, including credit scores. Using decomposition
techniques developed by Blinder (1973) and Oaxaca (1973), we assess how much of the
racial differences in total capital investments can be attributed to differences in these and
2
ii
“rfr˙vfinance9˙KFS” — 2016/12/15 — 14:20 — page 3 — #4 ii
ii
ii
other observable characteristics. The decomposition models indicate that the largest part
of the difference is driven by differences in credit scores between black and white en-
trepreneurs. In contrast, human capital measures (measured by education and previous
experience) explain very little of the differences in financial capital use. Controlling for
wealth and characteristics associated with capital needs have little effect on this result
– we continue to find that credit scores explain a substantial part of the gap, whereas
human capital measures explain very little.
While credit scores account for the bulk of the observable differences in outcomes be-
tween white and black borrowers, part of the difference remains unexplained by busi-
ness and owner characteristics, suggesting that attitudes, expectations and racial bias
in lending may also play a role. To explore this channel, we use detailed questions in
the KFS that measure demand for loans, loan rejections, and the expected fear of denial
among borrowers. Black entrepreneurs apply for bank loans less frequently than white
entrepreneurs, but this stems largely from differences in the fear of rejection. Overall,
black entrepreneurs are about three times more likely to state that they did not apply
for credit when needed for fear of having their loan application denied. Similarly, black-
owned startups are about three times less likely than white-owned startups to report that
their loan requests are always approved. These differences persist even after controlling
for credit scores and net worth. This analysis, combined with the inclusion of industry
and regional controls, suggests that differences in the demand for external financial capi-
tal are unlikely to be the main driver of the differences we observe.
In light of the importance of expectations about credit market outcomes for explain-
ing differences between white and black entrepreneurs, in the final part of the paper we
explore two identification strategies for assessing the degree to which racial bias in lend-
ing practices explains the differences we see. Because local banks are widely thought to
rely more heavily on personal relationships and other types of soft information in making
lending decisions, regional concentration of local banks introduces variation in the use of
soft information in lending. First, we ask whether black perceptions of credit outcomes
3
ii
“rfr˙vfinance9˙KFS” — 2016/12/15 — 14:20 — page 4 — #5 ii
ii
ii
are more or less favorable in markets where soft information is stronger. We find that
areas where local banks are stronger are areas where black-owned businesses generally
borrow less, not more. Second, we explore historical regional variation in racial inequal-
ity. Here we find that blacks are more likely to report lower capital levels and higher
unmet capital needs in areas with higher historical inequality.
Overall, these findings paint a nuanced picture of why racial differences in access to
capital persist. Differences in credit scores mean that on average, black entrepreneurs are
statistically greater credit risks, which means that from a purely objective point of view,
we should expect them to face more difficult borrowing conditions in credit markets.
But this is not the whole story. Even among borrowers with strong credit histories, black
entrepreneurs do not expect to be met with the same success as white entrepreneurs at the
bank’s lending desk. Moreover, there is no evidence that these differences are attenuated
in settings in which soft information would be more plentiful. These results are all the
more stark given the fact that our very research design itself conditions on entry into
entrepreneurship in the first place.
The balance of the paper is organized as follows. In Section 2, we describe the KFS
panel that follows startups from their founding through seven years of operations after
their startup year. In Section 3, we examine the use of financial capital (levels and detailed
sources) among black and white firms at startup and in the years following startup. Sec-
tion 4 explores racial differences in credit scores, a central component of our analysis.
In Section 5, we explore credit score differences and other potential causes of racial dif-
ferences in financial capital. Section 6 explores the potential role of racial bias in capital
markets, while Section 7 concludes.
2 The Kauffman Firm Survey
We use the confidential, restricted access version of the Kauffman Firm Survey (KFS) to
study how startups access capital markets. The KFS is a longitudinal survey of new busi-
nesses in the United States, collecting annual information for a sample of 4,928 firms that
4
ii
“rfr˙vfinance9˙KFS” — 2016/12/15 — 14:20 — page 5 — #6 ii
ii
ii
began operations in 2004. The underlying sample frame for the KFS is Dun and Brad-
street (D&B) data. The D&B data are known to exclude many small scale, non-employer
business activities by individuals. This is important because the results that we present
for the KFS cannot be driven by different rates of ownership of small-scale businesses or
consulting-type activities by black and white entrepreneurs.
The KFS data contain unprecedented detail on the financing patterns of startups, as
well as detailed information on both the firm itself and up to ten business owners of
the firm. In addition to the 2004 baseline year data, we also use the seven years of fol-
low up data covering calendar years 2005 through 2011. Detailed information on the
owners includes race, gender, age, education, previous startup experience, and previous
work experience. Detailed information on the firm includes industry, physical location,
employment, sales, intellectual property, and financial capital used at start-up and over
time. The detailed financing information in the KFS allows us to examine the relative
importance of each source of financing at start up and over time.
The confidential, restricted-access version of the KFS includes credit scores, continu-
ous measures of key variables, such as financing, and more detail on industries and ge-
ographic locations than the publicly-available KFS. To obtain more precise and detailed
measures of credit scores, we obtained a special confidential administrative dataset from
D&B matched to all businesses in the KFS.
The KFS is the only large, nationally representative, longitudinal dataset providing
detailed information on new firms and their financing activities. Most previous research
on the use of financial capital among small businesses has relied on cross-sectional data
on existing businesses. For example, the Survey of Business Owner (SBO) data provide
information on the amount of startup capital, but provide only retrospective information
for surviving businesses and do not provide information on the relative importance of
the different sources of financing. Another commonly-used dataset, the Federal Reserve
Board’s Survey of Small Business Finances (SSBF), provides information on recent financ-
ing, but does not provide information on financing at startup or the early stages of firm
5
ii
“rfr˙vfinance9˙KFS” — 2016/12/15 — 14:20 — page 6 — #7 ii
ii
ii
growth (and was discontinued after 2003). Furthermore, both the SBO and the SSBF are
cross sectional surveys that do not provide information on firm financing over time for
the same sets of firms. Finally, fundraising levels in the KFS are measured annually, and
are thus less prone to recall bias as is the case with both the SBO and the SSBF.
We restrict our attention to the set of firms that either survived over the sample period
or that have been verified as going out of business over the sample period. In most anal-
yses, we condition on survival in that year, but we also conduct robustness checks taking
alternative approaches to addressing survival. Our main results are not sensitive to the
approach, and we discuss the robustness check results below. We also specifically focus
on firms that have a white or black primary owner. These restrictions result in a sample
of 3,551 firms that began operations in 2004 and either continued through the final year
in the sample period (2011) or can be verified to have exited sometime over the period.
We assign owner demographics at the firm level based on the primary owner. For
firms with multiple owners (35 percent of the sample), the primary owner is designated
by having the largest equity share in the business. In cases where two or more owners
owned equal shares, hours worked and a series of other variables are used to create a rank
ordering of owners in order to define a primary owner following the algorithm proposed
in Ballou et al (2008). We include businesses with owners of all races in the regression
analysis, but focus our comparisons on black- and white-owned businesses. Following
standard conventions in the literature, the white category includes only non-Hispanic
whites.
3 Patterns in Financial Capital Use
We first examine whether minority startups invest less capital at startup than non-minority
startups. We also examine whether minority startups catch up or fall further behind in
financial capital investments during the first several years after startup. Figure 1 displays
total capital investments by black and white entrepreneurs at startup and each of the
seven subsequent years after startup. Black entrepreneurs use substantially less startup
6
ii
“rfr˙vfinance9˙KFS” — 2016/12/15 — 14:20 — page 7 — #8 ii
ii
ii
capital than white entrepreneurs - the average level of startup capital among black en-
trepreneurs is $35,205 compared with $106,720 for white entrepreneurs. In the first year
after startup new businesses continue to invest substantial amounts of financial capital.
The average level of investment is $81,697 for white firms. The racial disparities remain
large with black firms investing only an average of $34,462.
As levels of capital investment decline as startups age, black/white disparities in cap-
ital investment also decline. The disparities in capital investment become smaller, but
do not disappear, even by the seventh year after startup. Black-owned businesses are
not raising capital at a differentially faster rate as they gain a track record to compensate
for their smaller initial funding. These patterns imply that the initial funding differences
between black and white businesses persist and even worsen over time.
3.1 Capital Structure Differences
Using the detailed financial capital information in the KFS, we also explore the previ-
ously unanswered question of whether minority and non-minority startups differ in their
early-stage financing structure. For example, are minority entrepreneurs more likely to
substitute personal investments for business debt or substitute credit cards for bank loans
in the face of discrimination (Chatterji and Seamans 2012)? If these differences exist do
they contribute to disparities in the total amounts of financial capital investments?
The KFS contains finely detailed sources of funding for startups, which are reported
along with summary statistics in Appendix Table I. To facilitate an analysis of broad pat-
terns in the data, in most of our analysis we follow Robb and Robinson (2014) and group
the detailed categories into six broad buckets based on the source of capital and the struc-
ture of the capital (reported in Table I). The three alternative sources of capital are owners,
insiders, and outsiders; the two alternative types of capital are debt and equity. The dis-
tinction between sources captures whether the funding source is the founder, informal
channels such as friends or close associates of the founder who are not direct owners of
the business, or formal channels such as banks, venture capital firms, and angel investors.
Robb and Robinson (2014) make distinctions along these lines because the personal bal-
7
ii
“rfr˙vfinance9˙KFS” — 2016/12/15 — 14:20 — page 8 — #9 ii
ii
ii
ance sheets of business owners and the balance sheets of the firms themselves are often
deeply intertwined at the time the business is founded, and therefore there is little practi-
cal distinction between, for instance, a business credit card and a personal credit card, or
a personal bank loan and a business bank loan.
Thus, owner equity reflects the cash and personal savings that the business owners
put into the firm, not including cash that they access through mechanisms like home eq-
uity lines of credit (which would show up as outside debt). Table I shows that racial
differences in owner’s equity are pronounced. In the year the business is founded, black
owners contribute around $19,500 of personal equity, compared with around $34,500 for
white business owners. This difference may reflect large differences in the underlying
average net worth across the two groups. In subsequent years, there is significant conver-
gence in the average amounts of personal equity injected into the business, but this largely
reflects the fact that personal equity injections from white business owners dramatically
decline in the years after founding: the average amount drops to around $11,000 in years
1-3 after startup and to around $4,000 by years 4-7 after startup on average for white-
owned businesses. On average, insider equity (that is, equity injections from friends,
family or other non-business owner acquaintances) is a negligible source of financing for
most firms, but again, black-owned businesses uniformly secure less capital from this
source than do white-owned businesses.
Differences in outside equity—venture capital, angel financing, and the like are more
stark. The average black-owned business has around $500 of outside equity, whereas
the average white-owned business has more than $18,500 from outside equity at found-
ing. Throughout the first eight years of the firms’ existence, outside equity is a negligible
source of funding for black-owned businesses. Because the distribution of outside equity
is highly skewed—most firms never receive any, but the ones that do receive outside eq-
uity receive relatively large amounts—the figures reported in Table II essentially tell us
that VC funding of black-owned businesses is exceedingly rare.
Owner debt includes personal loans extended to the business by the founder. These
8
ii
“rfr˙vfinance9˙KFS” — 2016/12/15 — 14:20 — page 9 — #10 ii
ii
ii
are small on average for both black-owned and white-owned firms, but white-owned
businesses have higher average amounts here as well, often by a factor of five. Patterns
in insider debt between white- and black-owned firms also reveal a relative disadvantage
among black-owned firms.
The largest quantitative difference between white- and black-owned businesses is in
the amount of outside debt they use to finance their businesses. Outside debt includes
personal loans, business loans, personal and business credit cards, as well as other types
of loans made by banks either directly to business owners for the purpose starting their
business or else to the business itself. Robb and Robinson (2014) show that on average,
this is the largest source of financing for firms in the KFS. Here, we see that this is only true
of white-owned firms. At startup, black-owned firms borrow about one-half as much as
they put in of their own capital, whereas white-owned firms borrow about 1.7 times what
they put in of their own capital. In the year of founding, white-owned firms on average
borrow nearly six times as much black-owned firms. Although the amount of outside
debt accessed by black-owned businesses grows steadily over time, average outside debt
for black-owned businesses is substantially lower than that seen among white-owned
firms.
The vast differences in total funding at founding, and the persistent differences in the
overall size of later capital injections, makes it difficult to determine differences in the
relative sources of capital. To address this, we examine the capital structures of startups
at founding as well as the structure of later capital injections by scaling each source of
capital by the total amount of financial capital. Scaling by total capital reveals that black-
owned businesses persistently rely on less outside debt throughout the early years of
the firm’s life: t-tests of the difference in outside debt between white- and black-owned
firms reveal that the difference is highly statistically significant. By and large, this is
compensated by a greater relative reliance on owner equity injections, both at founding
and in the years following. At startup, black-owned businesses are financed by more
than half owner equity, whereas white-owned businesses are financed by less than one-
9
ii
“rfr˙vfinance9˙KFS” — 2016/12/15 — 14:20 — page 10 — #11 ii
ii
ii
third owner equity. Subsequent capital injections in black-owned businesses are around
15-25% owner equity, whereas for white-owned businesses they approach 10-15% owner
equity as the business matures.
Table II digs deeper into the differences in access to debt for minority and white-
owned startups by looking at the specific sources of debt financing. In the founding year,
there are differences between black and white owned businesses across a wide array of
debt sources. Only one percent of black owners obtain business loans, compared with 7%
for white-owned firms. While 30% of white-owned businesses use business credit cards
in their founding year, only 15% of black owned businesses do. Similarly, 18% of white
business owners rely on personal loans for their business in the founding year, while only
14% of black-owned businesses do. All these differences are statistically significant.
What sources offset these differences? It is not the case that black-owned businesses
rely more on personal credit cards. In fact, the opposite is true. Instead, black-owned
businesses appear to rely more on informal borrowing from family members: 14% of
black-owned businesses relied on family loans in their founding year, while only 9% of
white-owned businesses do. Interestingly, the average amounts borrowed from family
and other sources are not statistically different between minority and non-minority busi-
nesses. This could be a reflection of liquidity constraints in the network of family mem-
bers that are stronger for black-owned businesses than for white-owned firms (Fairlie
and Robb 2008). Average amounts of capital from personal bank loans and business bank
loans are statistically smaller for black-owned businesses. Black-owned businesses con-
tinue to rely on family loans to a greater degree than white-owned firms in the three years
following the firm’s founding. This suggests that access to formal debt channels remains
limited for minorities.
All told, the descriptive evidence in Tables I and II suggests that black-owned busi-
nesses have more difficulty in accessing formal credit channels, and they attempt to sub-
stitute by a heavier reliance on informal channels and personal equity, but this substitu-
tion is an imperfect one (perhaps due to less personal and family wealth). This results in
10
ii
“rfr˙vfinance9˙KFS” — 2016/12/15 — 14:20 — page 11 — #12 ii
ii
ii
businesses that start with smaller amounts of financial capital and that do not ”catch up”
over time.
4 Racial Differences in Credit Scores
The next step in our analysis is to try to explain the large differences in financing out-
comes that we observe between black-owned and white-owned startups. While the KFS
contains unprecedented detail on the business formation process, the availability of busi-
ness credit scores allows us to control for many differences in firm characteristics that
would be observable by bank lending personnel but typically unobservable to the econo-
metrician. Because business credit scores are so critical to our analysis, we first describe
the credit scores and examine racial differences in them before examining how they ex-
plain differences in outcomes.
Our administrative data from D&B for all firms in the KFS includes two different mea-
sures of credit scores allowing for the most comprehensive look at racial differences ever
taken in the literature. Credit scores are not available on most surveys, perhaps because
most entrepreneurs do not know readily know what their scores are. To be sure, the SSBF
includes information on credit scores, but only for larger, more established, and older
businesses (Cavalluzo and Wolken 2005).
4.1 Measuring Business Credit Ratings
Particularly for a new firm, having a credit rating inherently reduces the information
asymmetry between loan applicant and lender (Gorton and Winton 2003). A credit score
provides significant information to the lender about the creditworthiness of the applicant,
thereby reducing the information asymmetry dramatically. The KFS contains two mea-
sures of creditworthiness that differ in the way that they are intended to be used: one
is a forward-looking measure of repayment probability, while the other is a backward-
looking measure of past repayment activity. We use both measures in our analysis.
11
ii
“rfr˙vfinance9˙KFS” — 2016/12/15 — 14:20 — page 12 — #13 ii
ii
ii
4.1.1 D&B Commercial Credit Score
The D&B Commercial Credit Score (CCS) predicts a business’s likelihood of becoming
severely delinquent in its payments over the next 12-month period. D&B defines a severely
delinquent company as one that pays its financial obligation 90+ days past terms, obtains
legal relief from creditors, or ceases operations without paying all creditors in full over
the next 12 months (based on the information in D&B’s commercial database).
Panel A of Table III describes how numerical scores are assigned. The commercial
credit score we use takes on five values. Being in risk class 1 corresponds to being in
the top decile of creditworthiness, while risk class 5 corresponds to the lowest decile of
credit worthiness. Risk classes 2 and 4 contain twenty-percent bands of creditworthiness,
while an entrepreneur is assigned to the middle risk class if they lie between the 30th and
70th percentile. A “0” is assigned to businesses designated as open bankruptcy, out of
business at this location, or higher risk.
An important feature of the D&B commercial credit score is the fact that it is a forward-
looking measure. It attempts to predict future default based on observable borrower
characteristics.
4.1.2 PAYDEX Score
Unlike the CCS, which is forward-looking in nature, the PAYDEX score is a unique, dollar-
weighted indicator of payment performance based on payment experiences, as reported
to D&B by trade references. D&B must have 3 or more pieces of trade to calculate a PAY-
DEX score, therefore scores will be unavailable for many firms, especially in the beginning
of their life.
Table III outlines the specific score (between 1–100) and what each means. A score of
100 is assigned to business owners who pay their bills in advance of what is required to
receive the discounts that are implicit in the terms of sale. A score of 90 corresponds to
business owners who pay in time to capture discounts, and a score of 80 corresponds to
those who pay promptly. Scores below 80 reflect differing degrees of tardiness in pay-
ment, with scores of 50 or below corresponding to being more than 30 days late.
12
ii
“rfr˙vfinance9˙KFS” — 2016/12/15 — 14:20 — page 13 — #14 ii
ii
ii
4.2 Summary Statistics on Credit Scores
Summary statistics of both credit scores, tabulated by race, are presented in Table IV. The
top block reports Paydex scores for those with available scores. In the initial year, white
business founders have a score of around 72, while black founders have a score of around
59. This difference is highly statistically significant.
While the top block of numbers points to differences in the average credit score condi-
tional on having a credit score, the second block of numbers reports the fraction of respon-
dents who have Paydex scores, broken out by race. In the initial year, only around 4% of
white business owners and around 1% of black business owners have Paydex scores. This
number jumps considerably after the first survey year for both racial groups, presumably
as more of the required criteria for forming the score are available, but across all sur-
vey years, black business owners have Paydex scores at a lower rate than white business
owners.
The next two blocks of numbers report the percentages of business owners who either
are late (Paydex score < 50%) or prompt (Paydex score> 80%). Between 5% and 9%
of white business owners are delinquent, depending on the survey year, but rates for
black business owners are much higher. Black business owners on average are roughly
five times more likely to be delinquent than white business owners. These differences
are highly statistically significant. A smaller percentage of black business owners than
white business owners pay promptly, but the differences between white owners and black
owners are more more muted for this category.
The final two blocks of rows for Table IV report summary statistics for the Commercial
Credit Score (CCS).1 While the raw differences in the scores by race appear to be less
stark, they are significantly different from one another. Moreover, the CCS has much
more coverage for both racial categories, especially in the early years of the survey.1We report averages of the public-use credit score buckets in this table, not the actual numerical values,
which are confidential. In the regression analysis we are able to work with the confidential values directly.
13
ii
“rfr˙vfinance9˙KFS” — 2016/12/15 — 14:20 — page 14 — #15 ii
ii
ii
5 What Explains Racial Differences in Financial Capital?
In this section we link business credit scores and other business and founder character-
istics to the differences in financial capital reported in Section 3. We begin by examining
the difference in total capital raised across all sources. Given its importance, we then turn
to examining differences in the amount of bank debt. The final step is to examine the
resulting leverage.
5.1 Total Financial Capital
Table V models variation in the natural log of the total amount of capital (from all sources)
based on race, owner characteristics and business characteristics. To parsimoniously cap-
ture variation in the importance of race over time, we break the panel into the initial year
(Year 0), the next three years (Years 1-3), and the final four years of the panel (Years 4-7).
Within each year grouping we include various sets of independent variables. We estimate
all regressions with OLS adjusting for the stratified sampling frame of the KFS.
Industry fixed effects at the two-digit NAICS level are included in all specifications
to capture general differences in capital levels based on types of businesses started. The
inclusion of industry fixed effects partly addresses the concern that black and white busi-
nesses differ in their need for capital. We discuss this issue further below in the decom-
positions.
In column (1) we report the baseline specification for the startup year of the KFS (Year
0). The loading on the black dummy variable illustrates that black-owned businesses
have total capital investments that are are roughly 60 percent lower than the total capi-
tal investments of white-owned businesses, controlling for the main business and owner
characteristics. This result indicates that racial differences in the included owner and
business characteristics cannot explain all of the black-white disparities in financial cap-
ital. We discuss this finding in more detail below when we present the decomposition
estimates, and turn to a discussion of the results for our key explanatory variables.
Credit scores have a large positive effect on the amount of capital raised. Previous
14
ii
“rfr˙vfinance9˙KFS” — 2016/12/15 — 14:20 — page 15 — #16 ii
ii
ii
research focusing on established businesses finds that credit scores have a negative effect
on loan denial rates (Cavalluzzo and Wolken 2005). We find that moving up 10 percentile
points in the credit score distribution is associated with an increase in financial capital by
roughly 20 percent.
In the regression models we also include measures of formal education (in the form of
dummy variables for levels), prior work experience to starting the business (both indus-
try specific and non-industry specific), and previous entrepreneurial experience. These
variables capture the human capital of the entrepreneur. Education and prior work ex-
perience in the same industry have been found to be important determinants of business
success in previous research (Van Praag et al. 2005; Parker 2009). We find some evi-
dence that education is important, but no evidence of important effects for prior work
experience. Previous entrepreneurial experience is positively associated with capital in-
vestments, perhaps due to prior knowledge of finding capital.
In columns (2) and (3) we include a range of detailed additional controls for business
type, growth goals and performance, moving beyond our measures of human capital and
credit scores. In column (2) we add controls for firm characteristics to condition on the
fact that black and white founders may open different types of businesses with differ-
ent capital needs. We include dummies for whether the firm sells a product or service,
whether it is based out of the founder’s home, and whether it has patents or other intel-
lectual property. In column (3) we further add possibly endogeneous measures of firm
goals and performance. We include a dummy for whether the business is full-time or
part-time, its incorporation status, and employment level.
There are two important results from these additional sets of specifications. First,
we find that the remaining black/white differences in capital use not attributable to in-
dustry, human capital, credit score and other differences are also not due to differences
in capital need measured by these additional variables. The inclusion of detailed con-
trols of business types, goals and performance have little affect on the minority loading,
but the controls themselves indicate that home-based businesses invest less capital, and
15
ii
“rfr˙vfinance9˙KFS” — 2016/12/15 — 14:20 — page 16 — #17 ii
ii
ii
product-centered businesses and businesses with intellectual property invest more capi-
tal, as would be expected. When we further add additional controls for firm performance
and growth goals, such as whether the business is full-time or part-time, its incorpora-
tion status, and employment level, the black-founder loading does not change. Although
many of these controls may well be endogenous, the stability of the black-owner loading
across different specifications suggests that remaining black/white differences in capital
use are not primarily driven by differences in firm types, goals and demand for capital.
Second, we find that the addition of these variables does not substantially change
the coefficient estimates on credit scores and human capital measures. This is important
because it suggests that credit scores are not simply proxying for the success or type of
business.
Columns (4)-(6) analyze fundraising in the three years immediately after the startup
year (years 1-3). For this time period, we find a small and statistically insignificant black
coefficient across all of the reported specifications indicating that owner and business
characteristics can explain the entire black/white difference in financial capital. The ef-
fect of credit scores on raising capital continues to be strong for this period. Owner’s
education generally has a positive effect on financial capital investments. Entrepreneurs
with prior business experience also have larger financial capital investments.
Columns (7) and (8) study the next four years (years 4-7) after startup. The effects
of credit scores and human capital measures are generally similar for this time period
(see specification 7). In year 4 the KFS started to include some categorical information on
the net worth of the entrepreneur. Including wealth controls in the regression (Column
(8)) does not affect the coefficients or statistical significance of the credit score or human
capital variables. The black coefficient also remains relatively small and is not statistically
significant. Wealth is generally associated with higher levels of capital investments.
5.2 Decompositions
Estimates from the KFS indicate that black businesses have lower credit scores, less hu-
man capital and differ along several other dimensions (as noted in Appendix Table II).
16
ii
“rfr˙vfinance9˙KFS” — 2016/12/15 — 14:20 — page 17 — #18 ii
ii
ii
The regression estimates also indicate that many of these variables are important deter-
minants of financial capital investments at each of the three time periods. Taken together,
these results suggest that racial differences in business and owner characteristics may
contribute to why black-owned businesses have lower financial investments than white-
owned businesses. The separate impact of each factor on the racial gap in financing,
however, is difficult to summarize without further analysis.
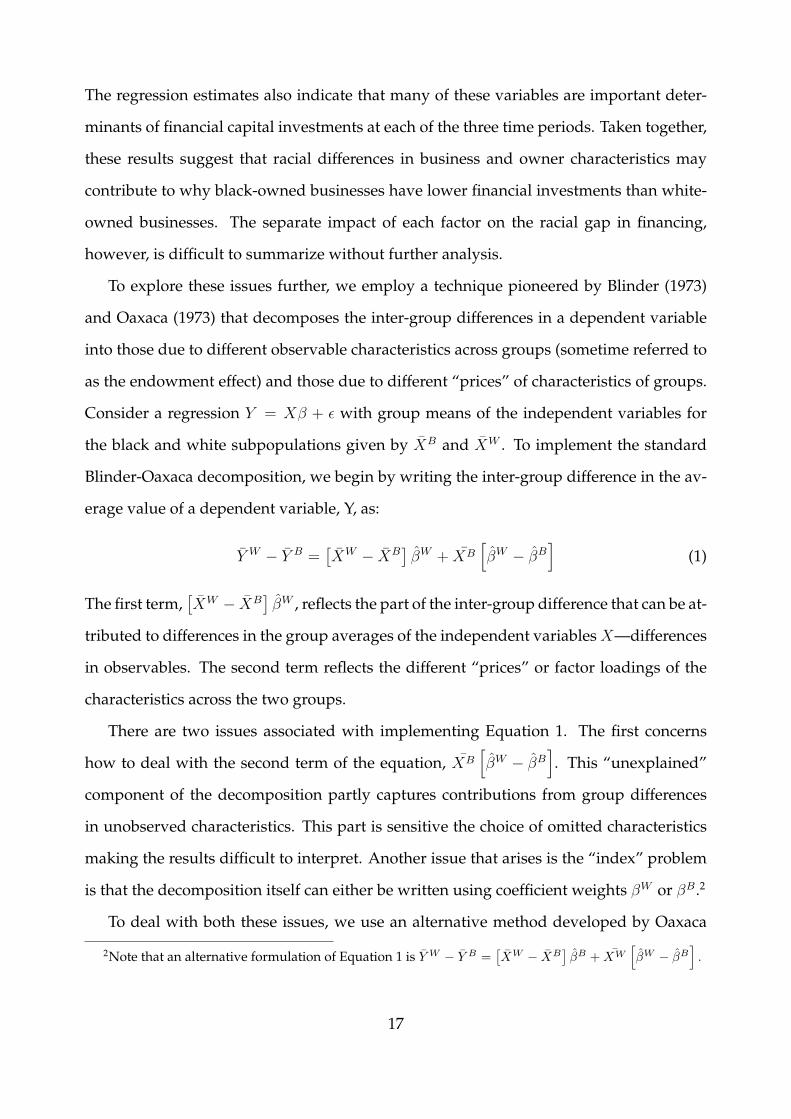
To explore these issues further, we employ a technique pioneered by Blinder (1973)
and Oaxaca (1973) that decomposes the inter-group differences in a dependent variable
into those due to different observable characteristics across groups (sometime referred to
as the endowment effect) and those due to different “prices” of characteristics of groups.
Consider a regression Y = X� + ✏ with group means of the independent variables for
the black and white subpopulations given by XB and XW . To implement the standard
Blinder-Oaxaca decomposition, we begin by writing the inter-group difference in the av-
erage value of a dependent variable, Y, as:
Y W� Y B =
⇥XW
� XB⇤�W + XB
h�W
� �Bi
(1)
The first term,⇥XW
� XB⇤�W , reflects the part of the inter-group difference that can be at-
tributed to differences in the group averages of the independent variables X—differences
in observables. The second term reflects the different “prices” or factor loadings of the
characteristics across the two groups.
There are two issues associated with implementing Equation 1. The first concerns
how to deal with the second term of the equation, XBh�W
� �Bi. This “unexplained”
component of the decomposition partly captures contributions from group differences
in unobserved characteristics. This part is sensitive the choice of omitted characteristics
making the results difficult to interpret. Another issue that arises is the “index” problem
is that the decomposition itself can either be written using coefficient weights �W or �B.2
To deal with both these issues, we use an alternative method developed by Oaxaca
2Note that an alternative formulation of Equation 1 is Y W� Y B =
⇥XW
� XB⇤�B + XW
h�W
� �Bi.
17
ii
“rfr˙vfinance9˙KFS” — 2016/12/15 — 14:20 — page 18 — #19 ii
ii
ii
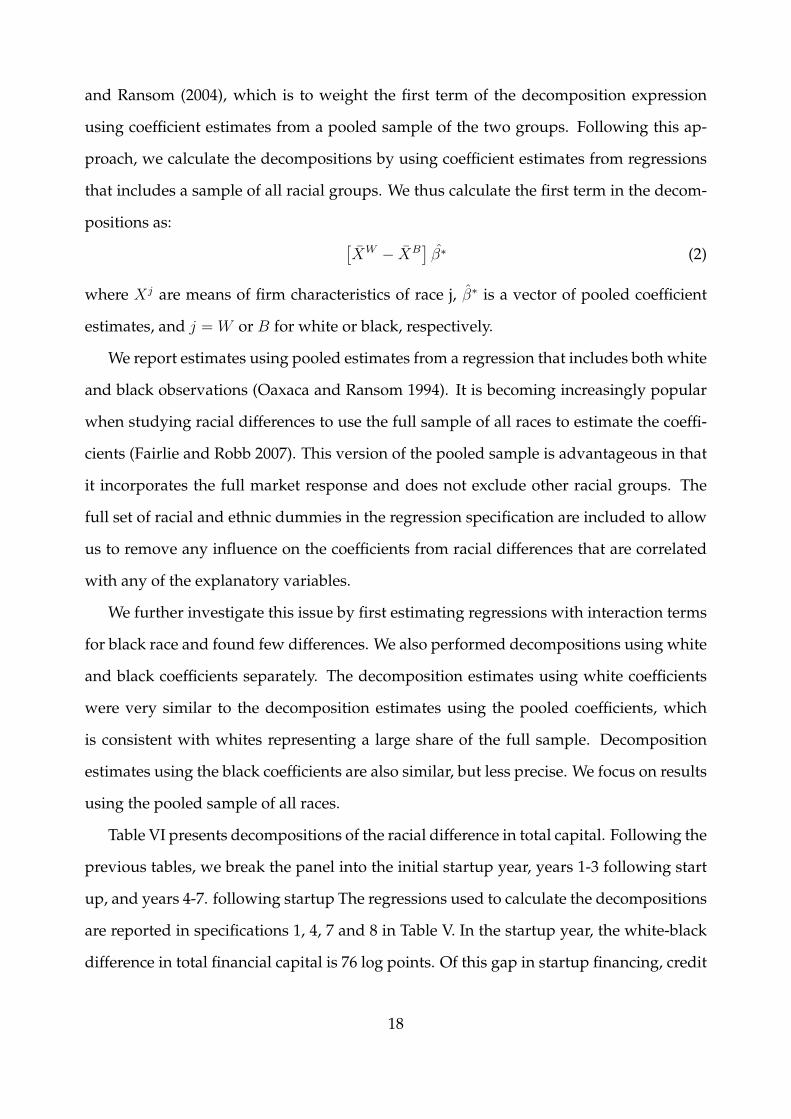
and Ransom (2004), which is to weight the first term of the decomposition expression
using coefficient estimates from a pooled sample of the two groups. Following this ap-
proach, we calculate the decompositions by using coefficient estimates from regressions
that includes a sample of all racial groups. We thus calculate the first term in the decom-
positions as:⇥XW
� XB⇤�⇤ (2)
where Xj are means of firm characteristics of race j, �⇤ is a vector of pooled coefficient
estimates, and j = W or B for white or black, respectively.
We report estimates using pooled estimates from a regression that includes both white
and black observations (Oaxaca and Ransom 1994). It is becoming increasingly popular
when studying racial differences to use the full sample of all races to estimate the coeffi-
cients (Fairlie and Robb 2007). This version of the pooled sample is advantageous in that
it incorporates the full market response and does not exclude other racial groups. The
full set of racial and ethnic dummies in the regression specification are included to allow
us to remove any influence on the coefficients from racial differences that are correlated
with any of the explanatory variables.
We further investigate this issue by first estimating regressions with interaction terms
for black race and found few differences. We also performed decompositions using white
and black coefficients separately. The decomposition estimates using white coefficients
were very similar to the decomposition estimates using the pooled coefficients, which
is consistent with whites representing a large share of the full sample. Decomposition
estimates using the black coefficients are also similar, but less precise. We focus on results
using the pooled sample of all races.
Table VI presents decompositions of the racial difference in total capital. Following the
previous tables, we break the panel into the initial startup year, years 1-3 following start
up, and years 4-7. following startup The regressions used to calculate the decompositions
are reported in specifications 1, 4, 7 and 8 in Table V. In the startup year, the white-black
difference in total financial capital is 76 log points. Of this gap in startup financing, credit
18
ii
“rfr˙vfinance9˙KFS” — 2016/12/15 — 14:20 — page 19 — #20 ii
ii
ii
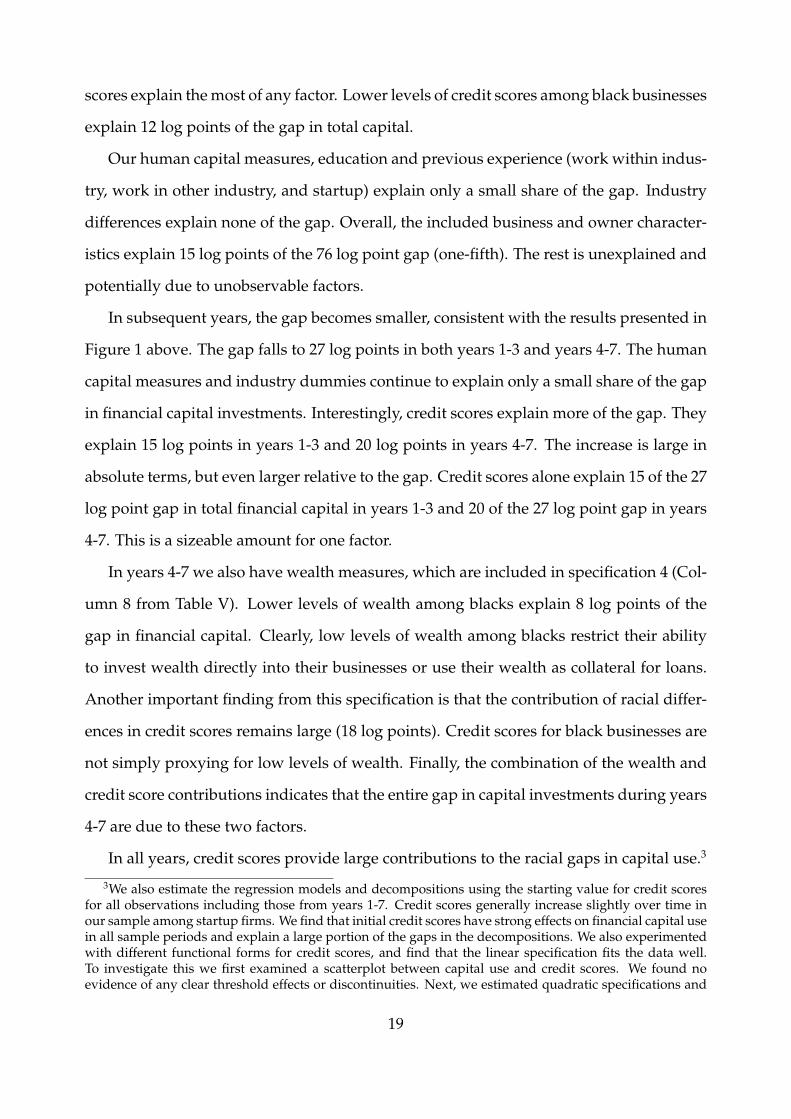
scores explain the most of any factor. Lower levels of credit scores among black businesses
explain 12 log points of the gap in total capital.
Our human capital measures, education and previous experience (work within indus-
try, work in other industry, and startup) explain only a small share of the gap. Industry
differences explain none of the gap. Overall, the included business and owner character-
istics explain 15 log points of the 76 log point gap (one-fifth). The rest is unexplained and
potentially due to unobservable factors.
In subsequent years, the gap becomes smaller, consistent with the results presented in
Figure 1 above. The gap falls to 27 log points in both years 1-3 and years 4-7. The human
capital measures and industry dummies continue to explain only a small share of the gap
in financial capital investments. Interestingly, credit scores explain more of the gap. They
explain 15 log points in years 1-3 and 20 log points in years 4-7. The increase is large in
absolute terms, but even larger relative to the gap. Credit scores alone explain 15 of the 27
log point gap in total financial capital in years 1-3 and 20 of the 27 log point gap in years
4-7. This is a sizeable amount for one factor.
In years 4-7 we also have wealth measures, which are included in specification 4 (Col-
umn 8 from Table V). Lower levels of wealth among blacks explain 8 log points of the
gap in financial capital. Clearly, low levels of wealth among blacks restrict their ability
to invest wealth directly into their businesses or use their wealth as collateral for loans.
Another important finding from this specification is that the contribution of racial differ-
ences in credit scores remains large (18 log points). Credit scores for black businesses are
not simply proxying for low levels of wealth. Finally, the combination of the wealth and
credit score contributions indicates that the entire gap in capital investments during years
4-7 are due to these two factors.
In all years, credit scores provide large contributions to the racial gaps in capital use.3
3We also estimate the regression models and decompositions using the starting value for credit scoresfor all observations including those from years 1-7. Credit scores generally increase slightly over time inour sample among startup firms. We find that initial credit scores have strong effects on financial capital usein all sample periods and explain a large portion of the gaps in the decompositions. We also experimentedwith different functional forms for credit scores, and find that the linear specification fits the data well.To investigate this we first examined a scatterplot between capital use and credit scores. We found noevidence of any clear threshold effects or discontinuities. Next, we estimated quadratic specifications and
19
ii
“rfr˙vfinance9˙KFS” — 2016/12/15 — 14:20 — page 20 — #21 ii
ii
ii
This finding is important because it suggests that black entrepreneurs are limited in the
amount of capital they can raise because they do not have high enough credit ratings
to obtain loans. The finding of little or no effect for industry is also important because
it demonstrates that differences in need based on type of business are not driving the
results. In fact, differences in industry, which are likely to be be first-order correlated
with capital needs, do not contribute to why black entrepreneurs invest less capital than
white entrepreneurs.
5.3 Outside Debt
Given the importance of outside debt illustrated in Section 3, we now turn to exploring
the potential causes of racial differences in access to outside debt, both in terms of overall
dollar amounts and in terms of its share of overall capital. Exploring potential expla-
nations for differences in outside debt may also be useful for shedding further light on
the importance of credit scores and provide a useful consistency check on this variable.
Credit ratings are undoubtedly one of the most important pieces of information used by
banks and other financial institutions in loan determination. Table VII reports regression
results, which follow the same format as Table V, except that the dependent variable is
the log of total outside debt instead of the log of total financial capital.
The results for the determinants and patterns over time for outside debt are fairly sim-
ilar to those for total financial capital. Credit scores exert a strong influence on the abil-
ity of businesses to find outside debt. Even controlling for an extensive list of business
characteristics proxying for need and ability to raise capital (i.e. make products, intellec-
tual property, home-based, part-time, incorporated, and employment) the coefficient on
credit scores is large, positive and statistically significant. The results for human capital
measures are also similar, with previous startup experience demonstrating the strongest
association with outside debt capital, but also some evidence of the influence of educa-
tion and work experience. Wealth is a stronger predictor of outside debt, which may be
higher order polynomials. In all of these cases, we found similar decomposition estimates for black/whitedifferences in credit scores.
20
ii
“rfr˙vfinance9˙KFS” — 2016/12/15 — 14:20 — page 21 — #22 ii
ii
ii
due to the importance of personal wealth as collateral in obtaining loans.
Table VIII reports decomposition results for outside debt. In the decompositions, spec-
ifications 1-4 use coefficients from the regression specifications 1, 4, 7, and 8, respectively.
Credit scores explain roughly the same amount of the gaps in outside debt as they did for
the gaps in total financial capital. Racial differences in the human capital measures and
industry distributions contribute only slightly to the black-white gaps in outside debt.
Lower levels of black wealth provide a large, positive contribution to racial gaps in out-
side debt. However, it is credit scores that explain the largest share of the difference.
5.4 Leverage
Table IX and Table X examine leverage—the ratio of outside debt to total capital. This
measure reflects the amount of borrowing that has occurred, but is ultimately influenced
by the intended scale of the business or the level of personal assets. Studying the leverage
ratio itself allows us to ask whether minority-owned businesses access proportionally
more or less debt than white-owned businesses regardless of their nominal scale. Black
firms are less leveraged than are white firms. At startup, the average leverage ratio is
0.19 for white firms and 0.12 for black firms. Leverage ratios increase over time, but the
black/white gap only increases slightly.
Credit scores explain a substantial portion of the racial gaps in leverage ratios over the
years of observation. In years 1-3, they explain nearly a third of the difference, while in
years 4-7 they explain roughly half of the racial gap in leverage ratios. In the underlying
regressions, credit scores have large estimated effects on leverage. Wealth differences
also explain a substantial portion of the leverage gap. The results reported in the final
specification indicate that lower credit scores and wealth among black startups explain
three-fourths of the sizeable racial gap in leverage. On the other hand, racial differences
in human capital measures explain very little of the gaps in leverage ratios as they are not
strong predictors of leverage ratios.
These results indicate that black-owned firms are not just accessing lower levels of
debt because the firms themselves are smaller. Instead, the evidence indicates that black-
21
ii
“rfr˙vfinance9˙KFS” — 2016/12/15 — 14:20 — page 22 — #23 ii
ii
ii
owned firms rely proportionally less on outside debt, even conditioning on their size.
5.5 Spatial Mismatch, Spatial Clustering and Survival
In this section, we investigate three additional potential explanations for racial differences
in capital investments. One possible factor is that there might be a spatial mismatch be-
tween black entrepreneurs and access to bank credit. To check for this, we repeat our
analysis but include the share of deposits held by local banks as opposed to national
banks. We also examine whether black entrepreneurs are located in areas with less com-
petition in banks (measured by an Herfindahl index). Decompositions do not indicate
that black/white differences in banking availability and competition contribute to the
gaps in capital investments (see Appendix Table III).
Second, spatial clustering more generally might be responsible for our findings. This
could be due to black/white geographical differences in economic conditions, policies
and business climates in addition to differences in spatial mismatch in banking. To inves-
tigate this further, we added state fixed effects to our regressions and decompositions. Al-
though black and white entrepreneurs are geographically concentrated in different states,
the differences do not contribute to gaps in financing (see Appendix Table III).
To push the analysis even further, we estimate a model that includes county fixed ef-
fects. We cannot perform a decomposition with county fixed effects because there are too
many. Instead, we examine how much the black dummy variable changes when mov-
ing from the previous model with state fixed effects and measures of spatial mismatch in
banking to models that instead include county fixed effects. For all three time periods, the
black dummy changes only slightly. Thus, our results do not appear to be driven by the
fact that minority business owners are clustered in areas with less economic opportunity,
thereby making them systematically less attractive businesses to fund.
Third, an important concern with the estimates for the two time periods after startup
is survival bias. All of the reported estimates thus far condition on survival up to that
point in time. If a firm goes out of business it no longer contributes to racial differences in
financial capital, but does count in all years when it was operating. Thus, the estimates are
22
ii
“rfr˙vfinance9˙KFS” — 2016/12/15 — 14:20 — page 23 — #24 ii
ii
ii
similar in spirit to cross-sectional estimates provided in most previous datasets (except
without the concern for recall bias).
We take a number of steps to control for the endogeneity of survival. First, we con-
dition the sample on including only firms surviving through the last year in the survey
(year 7 after startup). Taking this approach, we find similar results (i.e. credit scores ex-
plain a substantial portion of the difference and even larger in this case). We also take an
approach that is in the spirit of a bounds analysis (e.g. Fairlie, Karlan and Zinman 2015).
We estimate the regressions and decompositions assuming as a lower bound that all non-
surviving businesses would have used zero financial capital in that year. The mean dif-
ferences in financial capital are roughly similar, and the explanations do not change for
the gaps. As a potential upper bound we also impute all non-surviving firm observations
as equal to the median level of financial capital among surviving firms. Again, the re-
gression and decomposition results are not sensitive to this imputation. Another piece of
evidence suggesting that our results are not overly sensitive to survival bias is that we
find that racial differences in year dummies have no effect in the decompositions. These
dummies essentially capture differences in survival years.
6 Racial Differences in Credit Market Expectations
The previous analysis indicates that the large fraction of the explainable difference in
access to capital for black- and white-owned startups stems from differences in the un-
derlying creditworthiness of black and white business owners. In this section, we explore
explanations for the part that remains unexplained by our decompositions. Specifically,
we focus on differences in attitudes and expectations about the bank borrowing experi-
ence. To explore this, we use newly available survey information in the KFS that gauges
demand and unmet need for credit among entrepreneurs.
Beginning in 2007, the KFS includes a series of questions gauging borrowing inten-
tions. Access to measures of attitudes towards borrowing among entrepreneurs is ex-
tremely rare. The new questions ask whether the startup business applied for a loan
23
ii
“rfr˙vfinance9˙KFS” — 2016/12/15 — 14:20 — page 24 — #25 ii
ii
ii
that year, and whether it did not apply for a loan that year because of a fear of rejection.
Among those startups that did apply, a follow-up question asked whether they were al-
ways approved, always denied, or sometimes approved and sometimes denied.
Racial differences in responses to these questions are analyzed in Table XI. We re-
port survey-weighted averages by minority ownership status, both for the sample as a
whole, as well as splits based on notable points in the distribution of credit scores. White
entrepreneurs are more likely to apply for loans than black entrepreneurs, which poten-
tially reflects different capital needs, but could also reflect different attitudes and expec-
tations of the loan application process. When we focus on borrowers with below-median
credit scores, there is no statistical difference in the rates of loan application, but among
above-median borrowers, loan application rates are lower for blacks than for whites.
Turning to those who did not apply for loans that year, we also study racial differ-
ences in whether they did not apply for fear of rejection in Table XI.4 There are massive
differences in fear of rejection between white and black business owners. Overall, black
business owners are about three times more likely to not apply for loans because of fear of
rejection than white business owners. This difference is highly statistically significant. Al-
though it is even more pronounced among below-median credit borrowers, even among
credit worthy borrowers we find that blacks are more than twice as likely than whites to
fear rejection. Black business owners whose credit scores are above the 75th percentile for
the entire sample are still more than twice as likely as white business owners of similar
creditworthiness to not apply for a loan for fear of having their loan application denied.5
Another measure of unmet financing needs is whether loans are always approved,
always denied, or sometimes approved and sometimes denied. Results are reported in
Table XI. Here, the results mirror those from the discussion above. Black business owners4Although did not apply for fear of rejection is asked of all respondents, some owners who applied for
loans might have wanted to apply for additional loans, but focus on only those firms who did not apply fora new loan for clarity. The results are unchanged if we examine all responses to this question.
5Bone, Christensen and Williams (2014) conduct field experiments with black and white “mystery shop-pers” at consumer banking institutions and find large racial differences in the way loan officers treat po-tential applicants. Compared to white mystery shoppers, black and hispanic mystery shoppers were lessfrequently offered help to complete the loan application, they were less frequently offered a business cardfrom the loan officer, and they were less frequently offered help with future banking needs.
24
ii
“rfr˙vfinance9˙KFS” — 2016/12/15 — 14:20 — page 25 — #26 ii
ii
ii
are significantly less likely to report that they are always approved for loans. This holds
across different points in the distribution of credit scores.
A useful summary measure of whether a startup experiences unmet captial need com-
bines responses to being denied a loan application and not applying for a loan because of
fear of rejection. Affirmative answers to these two questions imply that the startup did
not obtain all of the capital needed. Using this measure, black startups are much more
likely to face unmet need for capital than are white startups.
Taken together, these results suggest that the lower levels of borrowing that we have
documented above are a reflection of unmet need, stemming at least in part from dif-
ferent attitudes and perceptions of the banking process, and not simply because black
startups need less capital to grow than white startups. To be sure, all of these questions
are subjective, and we do not want to interpret these findings too strongly. But, these new
findings do provide some suggestive evidence that black startups also have a strong need
for capital and that racial differences in capital need are not driving the results.6
Tables XII and XIII place the results from the previous section into a multivariate anal-
ysis. Even controlling for a detailed set of firm and founder characteristics, we still ob-
serve pronounced differences in the fear of denial and loan denial rates based on the
race of the firm founder. Although these findings do not provide conclusive evidence
of discrimination, they provide evidence consistent with racial bias in capital markets.
They are also consistent with previous findings for larger, more established and older
businesses that minority-owned firms experience higher loan denial probabilities and
pay higher interest rates than white-owned businesses even after controlling for differ-
ences in credit-worthiness and other factors (Bostic and Lampani 1999; Cavalluzzo, Cav-
aluzzo and Wolken 2002; Blanchflower, Levine and Zimmerman 2003; Blanchard, Zhao
and Yinger 2008; Bates and Robb, 2014). Finally, these findings also provide evidence that
racial differences in financing patterns are not simply due to lower levels of financing
needs among black startups.6Interestingly, there is no evidence that blacks have less preference for business ownership and in fact
might have a stronger preference (Walstad and Kourilsky 1998; Koellinger and Minniti 2006).
25
ii
“rfr˙vfinance9˙KFS” — 2016/12/15 — 14:20 — page 26 — #27 ii
ii
ii
6.1 Are Racial Differences Correlated with Local Banking Conditions?
To bring us closer to an answer to whether differences in credit market outcomes between
black and white borrowers reflects different attitudes about credit markets among bor-
rowers or different actions among lenders, the final step of our analysis explores how atti-
tudes and access to capital between black and white owned businesses vary with regional
measures of inequality and racial bias. To identify local variation in racial attitudes we
exploit two sources of variation that are potentially exogenous to the credit-worthiness of
any specific entrepreneurial venture.
6.1.1 The Strength of Local Banks
The first potential source of identification is motivated by a long literature in banking
that draws a distinction between soft information and hard information. Hard informa-
tion—like that contained in credit scores—is quantitative and impersonal, and can be
easily transmitted, while soft information is qualitative, and while it may be very precise,
it is difficult to communicate credibly (see Peterson, 2004).
Here, the crux of our identification strategy lies in the fact that large, national banks
have been shown to have an advantage in hard information, while in contrast, small,
opaque firms are more likely to flourish in environments where soft information is in
greater supply (Berger, Miller, Petersen, Rajan, and Stein, 2001; Brickley, Link, and Smith,
2003). We identify whether a borrower is operating in an environment characterized by
strong local banks, in which soft information is more actionable, or whether they operate
in areas dominated by large banks, where soft information is less important. Exploiting
regional variation in the structure of local banking markets allows us to develop variation
in the degree to which hard versus soft information can be used in the lending process. We
can thereby gain insight on whether the differences between lending to black- and white-
owned businesses reflects different attitudes by borrowers about the quality of black-
and white-owned businesses, or whether they instead represent differences in attitudes
by would-be borrowers about how their experiences will play out.
26
ii
“rfr˙vfinance9˙KFS” — 2016/12/15 — 14:20 — page 27 — #28 ii
ii
ii
Specifically, if the differences between black and white borrowing levels reflects the
fact that in the black community, borrowers of heterogeneous quality are pooled in a man-
ner that makes the average black-owned borrower unattractive conditional on their credit
score (hard information), then markets characterized by greater reliance on soft informa-
tion will disproportionately favor black borrowers, because in these markets the greater
reliance on soft information separates the pool of otherwise indistinguishable borrowers
into those of high and low quality.
In Table XIV we estimate regression models that explain variation in reporting that
a respondent did not apply for fear of denial. Given that credit scores, a measure of
hard information on credit-worthiness, are generally lower for black-owned businesses, a
greater reliance on soft information in the lending decision might potentially favor a bor-
rower with lower credit scores if that borrower scored higher along dimensions that were
observable to the lender but not necessarily objectively verifiable. Such environments
would favor black-owned businesses, because the reliance on soft information could sub-
stitute for the lower credit scores and wealth. On the other hand, a greater reliance on soft
information might make lending conditions worse for minority borrowers if the greater
reliance on soft information allowed lenders greater latitude to cater to racial preferences
or biases.
Panel A tests this basic hypothesis by regressing fear of denial on the same controls
from Table IV, but with the addition of local banking variables. In column (2) we add
the share of county bank deposits held by local banks and find that areas with higher
local bank concentration are areas in which new businesses are much less likely to report
that they do not apply for fear of denial.7 This comports with a wide body of evidence
suggesting that small, informationally opaque businesses have an easier time securing
bank loans in areas where local bank concentrations are higher.
Column (3) introduces an interaction term to explore whether black and white-owned
businesses experience different outcomes in high local bank concentration areas. If black-
owned businesses found it easier to borrow in these markets, presumably because of a7Data are from the FDIC Summary of Deposits. See https://www5.fdic.gov/sod/.
27
ii
“rfr˙vfinance9˙KFS” — 2016/12/15 — 14:20 — page 28 — #29 ii
ii
ii
greater ease in acting on soft information, then we would expect the interaction term to
be negative–their reluctance to apply for loans for fear of denial would be attenuated in
these markets.
Instead we find the opposite. The interaction term is positive, indicating that black-
owned businesses are not less afraid of denial in environments where local banking con-
ditions are stronger. Although we cannot rule out the possibility that local banks are
simply acting on better information about the underlying creditworthiness of the firms in
question and acting accordingly, there is certainly no evidence that more soft information
makes it easier for minority businesses to borrow from banks.
Columns (4) and (5) add measures of local bank market power to sharpen the anal-
ysis. If local banking markets are highly competitive, then the franchise value of any
individual banking relationship may be lower, thus diminishing the incentive to collect
soft information in the first place. This may be why we see the results in columns (2)
and (3) that we see. To explore this possibility we add the Herfindahl index of the local
banking market. Areas with high concentrations are ones in which the information rents
are higher; in these markets there is presumably a greater advantage to acting on soft
information.
In Column (4), we find that areas with higher local bank market concentration are
areas where the fear of denial is lower for new business borrowers. This is consistent
with the idea that the high concentration makes it more profitable for the bank to invest
in acquiring information about borrowers. This does not, however, translate into easier
relative banking conditions for black-owned businesses. Minority businesses in these
regions are not less afraid to borrow.
The evidence in Panel A, therefore, speaks against the idea that soft information can
substitute for hard information in a manner that alleviates lending disparities.8
8We also examine results for overall financial capital. We find that the main effects of local bankingconditions have no effect on overall financial capital, which indicates that for the average borrower, sub-stitution into financing alternatives outside the local banking market attenuates any differences in bankingconditions. Yet interactions with minority status indicate that black-owned businesses are restricted overallin obtaining capital as a result of the restricted access to local bank lending. This is important because it in-dicates that blacks cannot simply substitute from other sources when facing racial bias in lending markets.
28
ii
“rfr˙vfinance9˙KFS” — 2016/12/15 — 14:20 — page 29 — #30 ii
ii
ii
To push the analysis further, we ask whether soft information affects unmet need for
capital. This combines loan denials and negative borrowing expectations into a single
measure. In Panel B of XIV, we report a Probit analysis for unmet capital need (as defined
above) on race and interactions with the banking variables. The coefficient estimates
match the spirit of what is reported in Panel A. This confirms that borrower expectations
translate into lending market outcomes: entrepreneurs in areas with stronger local banks
are less likely to be denied or to receive less than they ask for, but this is an effect that is
confined to white borrowers.
6.2 Regional Inequality and Racial Bias
A second source of variation that is useful for identifying racial bias in credit markets
is regional variation in inequality. Because contemporaneous measures of inequality are
likely to be correlated with contemporaneous business conditions, we use a measure of
historical inequality obtained from Braggion, Dwarkasing, and Ongena (2015). In partic-
ular, they instrument current measures of income inequality at the MSA level with data
on the historical distribution of farm plot-sizes in 1890. Braggion, Dwarkasing and On-
gena (2015) show that the historical distribution of plot sizes in 1890 is highly correlated
with current measures of inequality and use this measure to show that more historically
unequal regions have lower rates of self-employment. Based on the fact that areas with
high degree of skewness in the historical size distribution of landholdings are areas in
which slavery was common, we build on their insight and ask whether racial differences
in borrowing attitudes and outcomes are more pronounced in these areas by exploring
interactions of the Gini coefficient with the business owner’s race.
The main idea is to ask whether perceptions of lending outcomes are different in areas
with high historical inequality. The first three columns of Table XV indicate that they are.
In Panel A, we report regression results for the fear of denial on race, the historical Gini
coefficient, and the race/gini interaction, along with all the variables listed in Table IV.
Local areas with high levels of historical inequality have much higher levels of the fear
of denial among black entrepreneurs relative to white entrepreneurs than areas with low
29
ii
“rfr˙vfinance9˙KFS” — 2016/12/15 — 14:20 — page 30 — #31 ii
ii
ii
levels of inequality.
In Panel B of Table XV, we report a probit analysis for unmet capital need on race,
the historical Gini coefficient, and the race/gini interaction. Regions with high levels of
historical inequality have higher average levels of respondents reporting that they have
unmet capital need, and these effects are more pronounced among black borrowers in
areas with high inequality.
Ultimately these measures fall short of separating borrower attitudes from lender at-
titudes. Lender racial perceptions may be the ultimate reason why we see that black-
owned businesses are more reluctant to borrow in areas with high historical inequality.
The fact that banking markets in which soft information is likely to be more important
are not more favorable for black borrowers is also consistent with the idea that black
business owners are suspicious that lenders will tilt lending decisions racially. Anticipat-
ing that they will face racial discrimination, either rightly or wrongly, black borrowers
may opt out of seeking capital. While our tests cannot cleanly separate these two possi-
bilities, they do illustrate the fact that attitudes and outcomes that perpetuate differences
between white and black owned businesses are not ameliorated by the availability of soft
information, and are worse in areas with high historical inequality.
7 Conclusion
This paper uses confidential, restricted-access microdata from the KFS to explore how
minority and non-minority startups differ in terms of their access to capital. The financial
detail available in the KFS and panel data following startups through the first seven years
of existence allow us to establish a number of novel results. Black entrepreneurs start
businesses at a substantially smaller scale than white entrepreneurs. They also obtain less
financial capital in the early years of the firm’s operation than white entrepreneurs. Thus,
initial funding differences do not disappear and instead persist over time. We also find
that black entrepreneurs access less outside debt in the founding year and in the years
that follow, which is by the far the largest cause of disparities in total financial capital.
30
ii
“rfr˙vfinance9˙KFS” — 2016/12/15 — 14:20 — page 31 — #32 ii
ii
ii
Taken together, this implies that leverage ratios for young firms owned by black owners
are persistently below those owned by whites. Black entrepreneurs are also not simply
substituting investments from other sources. We find that black entrepreneurs invest less
from all major sources of capital.
These differences in financial capital use do not appear to be due to differences in the
need for capital between black and white entrepreneurs. Black startups report substan-
tially higher levels of loan denials and overall unmet need for capital than white startups,
even after controlling for differences in credit scores. Moreover, industry differences,
which should represent first-order differences in need for capital if differences in demand
were driving the results, do not explain racial disparities. The inclusion of detailed, po-
tentially endogenous business characteristics including performance, goals for growth,
and type of business also has little effect on the racial differences we find.
Yet the racial differences we find cannot readily be attributed to simple explanations,
such as white lenders looking unfavorably upon black borrowers. There are large differ-
ences in credit worthiness between black and white entrepreneurs. Detailed administra-
tive data on credit ratings linked to all KFS businesses provides the first evidence in the
literature of extensive differences between black and white startups. The relatively low
credit scores for black business owners explain a substantial amount of the gaps in both
financing at startup and in the years after startup. Controlling for founder net worth and
business credit scores essentially explains away the race gap in financing in some years.
Taken together, these results imply that a great deal of the capital investment differences
between black- and white-owned businesses is the result of persistent differences in the
founder’s financial health that are present at the very inception of the firm. This con-
nects our findings to a burgeoning literature in household finance and financial literacy
(see Lusardi and Mitchell, 2009) and suggests interesting connections between household
financial planning, behavioral finance, race and entrepreneurship.
At the same time, although average racial differences in access to startup capital can
be largely explained away by differences in credit worthiness and net worth, our evidence
31

ii
“rfr˙vfinance9˙KFS” — 2016/12/15 — 14:20 — page 32 — #33 ii
ii
ii
clearly indicates an enduring belief among even the most credit-worthy black borrowers
that they will be turned away as borrowrs. The fact that many well-qualified black bor-
rowers do not apply for credit, even when they feel they need it, because they anticipate
being denied credit suggests that overcoming differences between black and white bor-
rowers is not simply a matter of expanding the supply of credit available to lower income
borrowers. Getting to the root cause of racial differences in the way that new businesses
are financed likely requires changes in perceptions and financial planning behaviors as
much as it requires augmenting the supply of credit to traditionally underserved borrow-
ers.
32
ii
“rfr˙vfinance9˙KFS” — 2016/12/15 — 14:20 — page 33 — #34 ii
ii
ii
References[1] Ballou, J., Barton, T., DesRoches, D., Potter, F., Reedy, E.J., Robb, A., Shane, S. Zhao,
Z. (2008). Kauffman Firm Survey: Results from the Baseline and First Follow-UpSurveys. Kauffman Foundation.
[2] Bates, Timothy and Alicia Robb (2014). “Has the Community Reinvestment Act In-creased Loan Availability Among Small Businesses Operating in Minority Neigh-borhoods?” Urban Studies, May, pp. 1-20.
[3] Blanchflower, David G., P. Levine and D. Zimmerman. 2003. ”Discrimination in thesmall business credit market”, Review of Economics and Statistics, November, 85(4),pp. 930-943.
[4] Blanchard, Lloyd, Bo Zhao, and John Yinger. 2008. ”Do lenders discriminate againstminority and woman entrepreneurs?” Journal of Urban Economics 63(2): 467-497.
[5] Blinder, Alan S. 1973. ”Wage Discrimination: Reduced Form and Structural Vari-ables.” Journal of Human Resources 8: 436-455.
[6] Board of Governors of the Federal Reserve System. 2007. Report to the Congress onCredit Scoring and Its Effects on the Availability and Affordability of Credit.
[7] Bone, Sterling A., Glenn Christensen and Jerome Williams. 2014. “Rejected, Shack-led, and Alone: The Impact of Systemic Restricted Choice on Minority ConsumersConstruction of Self” Journal of Consumer Research 41. 451–474.
[8] Bostic, R. W. and K. P. Lampani. 1999. ”Racial Differences in Patterns of Small Busi-ness Finance: The Importance of Local Geography,” Proceedings of the Conferenceon Business Access to Capital and Credit, August, 149-179.
[9] Boston, Thomas D. 1999. “Generating Jobs Through African American Business De-velopment”, in J. Whitehead and C. Harris, eds. Readings in Black Political Economy(Dubuque: Kendall-Hunt)
[10] Boston, Thomas D. 2006. “Black Patronage of Black-owned Businesses and BlackEmployment” in J. Whitehead, J. Stewart and C. Conrad (eds). African Americans inthe United States (Rowman & Littlefield Publishers, Inc).
[11] Bradford, William D. 2003. ”The Wealth Dynamics of Entrepreneurship for Black andWhite Families in the U.S.,” Review of Income and Wealth, 49(1): 89-116.
[12] Cavalluzzo, Ken, Linda Cavalluzzo, and John Wolken. 2002. “Competition, SmallBusiness Financing, and Discrimination: Evidence from a New Survey,” Journal ofBusiness, Vol. 75(4): 641-679.
[13] Cavalluzzo, Ken and John Wolken. 2005. ”Small Business Loan Turndowns, PersonalWealth and Discrimination.” Journal of Business, 78(6): 2153-2177.
[14] Chatterji, Aaron K., and Robert C. Seamans. 2012. ”Entrepreneurial finance, creditcards, and race.” Journal of Financial Economics 106(1): 182-195.
33
ii
“rfr˙vfinance9˙KFS” — 2016/12/15 — 14:20 — page 34 — #35 ii
ii
ii
[15] Fairlie, Robert W., and Alicia M. Robb. 2007. ”Why are Black-Owned BusinessesLess Successful than White-Owned Businesses: The Role of Families, Inheritances,and Business Human Capital,” Journal of Labor Economics, 25(2): 289-323.
[16] Fairlie, Robert W., and Alicia M. Robb. 2008. Race and Entrepreneurial Success:Black-, Asian-, and White-Owned Businesses in the United States, Cambridge: MITPress.
[17] Fairlie, Robert W.,Dean Karlan, and Jonathan Zinman. 2015. ”Behind the GATE Ex-periment: Evidence on Effects of and Rationales for Subsidized EntrepreneurshipTraining,” American Economic Journal: Economic Policy, 7(2): 125-61.
[18] Lusardi, A., Mitchell, O.S., 2009. “How ordinary consumers make complex economicdecisions: Financial literacy and retirement readiness.” National Bureau of EconomicResearch Working Paper 15350.
[19] Oaxaca, Ronald. 1973. ”Male-Female Wage Differentials in Urban Labor Markets,”International Economic Review, 14 (October), 693-709.
[20] Oaxaca, Ronald, and Michael Ransom. 1994. ”On Discrimination and the Decompo-sition of Wage Differentials,” Journal of Econometrics, 61, 5-21.
[21] Parker, Simon C. (2009). The Economics of Entrepreneurship. Cambridge: Cam-bridge University Press.
[22] Koellinger, Phillipp, and Maria Minniti. 2006. ”Not for lack of trying: American en-trepreneurship in black and white,” Small Business Economics 27(1): 59-79.
[23] Walstad, William B. and Marilyn L. Kourilsky. 1998. ”Entrepreneurial Attitudes andKnowledge of Black Youth,” Entrepreneurship Theory & Practice, 23(2): 5-18.
[24] Robb, Alicia and David Robinson, “The Capital Structure Decisions of New Firms.”Review of Financial Studies, Vol 27, No 1, 2014.
[25] U.S. Bureau of Labor Statistics. 2014. Table A-2. Employment status of the civilianpopulation by race, sex, and age, http://www.bls.gov/news.release/empsit.t02.htm
[26] U.S. Census Bureau. 2012. Wealth and Asset Ownership: Table 1. Median Value ofAssets for Households, by Type of Asset Owned and Selected Characteristics: 2011,http://www.census.gov/people/wealth/
[27] U.S. Census Bureau. 2015. 2012 Survey of Business Owners: Company Summary
[28] U.S. Census Bureau. 2016. Income and Poverty in the United States: 2015, In-come and Earnings Summary Measures by Selected Characteristics: 2014 and 2015,http://www.census.gov/library/publications/2016/demo/p60-256.html
[29] U.S. Census Bureau. 2008. Wealth and Asset Ownership, 2002,http://www.census.gov /hhes/www/wealth/2002/wlth02-1.html.
[30] U.S. Census Bureau. 1997. 1992 Economic Census: Characteristics of Business Own-ers. Washington, D.C.: U.S. Government Printing Office.
34

ii
“rfr˙vfinance9˙KFS” — 2016/12/15 — 14:20 — page 35 — #36 ii
ii
ii
[31] van der Sluis, J., van Praag, M., and Vijverberg, W. (2005), ”Education and En-trepreneurship in Industrialized Countries: A Meta-Analysis,” World Bank Eco-nomic Review, 19(2): 225-261.
35

ii
“rfr˙vfinance9˙KFS” — 2016/12/15 — 14:20 — page 36 — #37 ii
ii
ii
36
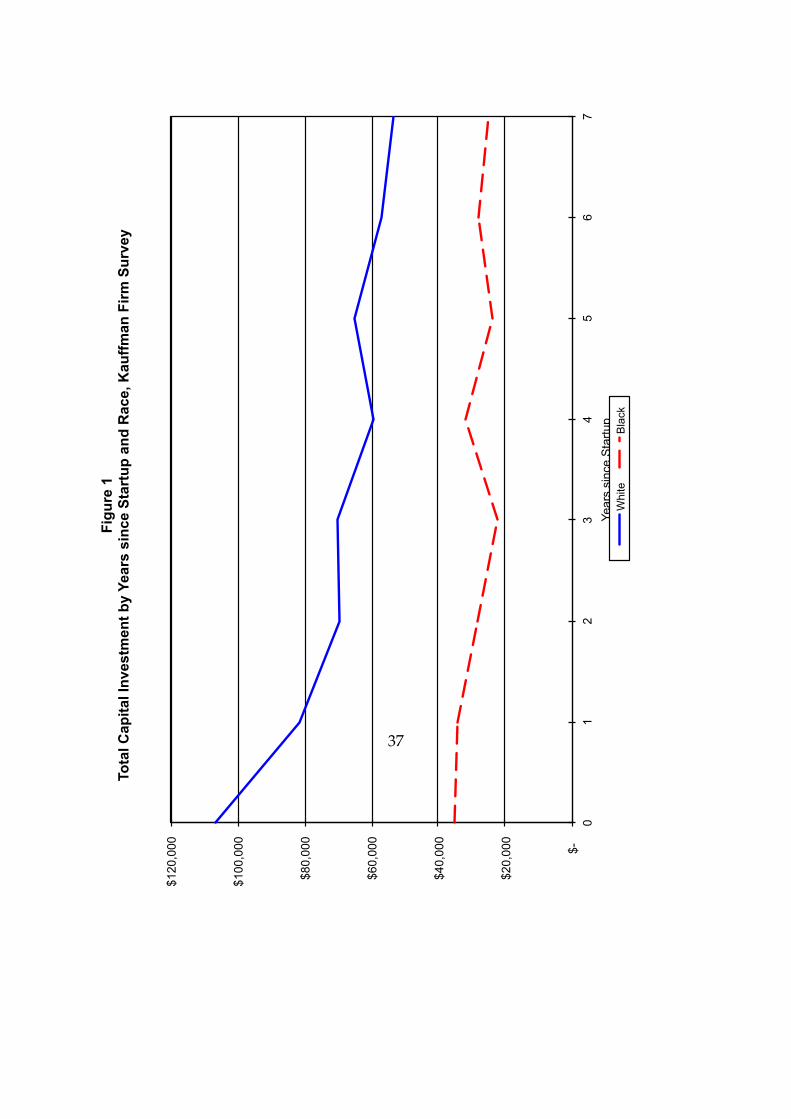
ii
“rfr˙vfinance9˙KFS” — 2016/12/15 — 14:20 — page 37 — #38 ii
ii
ii
$-
$20
,000
$40
,000
$60
,000
$80
,000
$10
0,00
0
$12
0,00
0 0
1 2
3 4
5 6
7 Ye
ars
sinc
e S
tartu
p
Figu
re 1
To
tal C
apita
l Inv
estm
ent b
y Ye
ars
sinc
e S
tart
up a
nd R
ace,
Kau
ffm
an F
irm
Sur
vey
Whi
te
Bla
ck
37
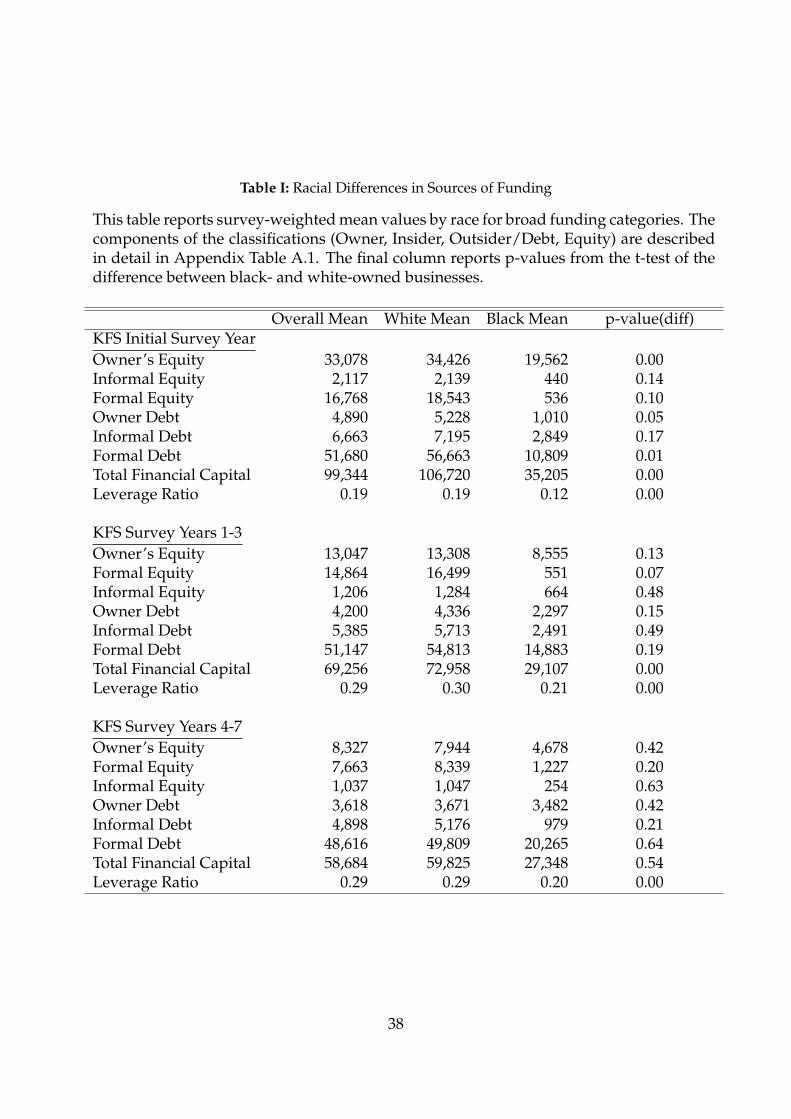
ii
“rfr˙vfinance9˙KFS” — 2016/12/15 — 14:20 — page 38 — #39 ii
ii
ii
Table I: Racial Differences in Sources of Funding
This table reports survey-weighted mean values by race for broad funding categories. Thecomponents of the classifications (Owner, Insider, Outsider/Debt, Equity) are describedin detail in Appendix Table A.1. The final column reports p-values from the t-test of thedifference between black- and white-owned businesses.
Overall Mean White Mean Black Mean p-value(diff)KFS Initial Survey YearOwner’s Equity 33,078 34,426 19,562 0.00Informal Equity 2,117 2,139 440 0.14Formal Equity 16,768 18,543 536 0.10Owner Debt 4,890 5,228 1,010 0.05Informal Debt 6,663 7,195 2,849 0.17Formal Debt 51,680 56,663 10,809 0.01Total Financial Capital 99,344 106,720 35,205 0.00Leverage Ratio 0.19 0.19 0.12 0.00
KFS Survey Years 1-3Owner’s Equity 13,047 13,308 8,555 0.13Formal Equity 14,864 16,499 551 0.07Informal Equity 1,206 1,284 664 0.48Owner Debt 4,200 4,336 2,297 0.15Informal Debt 5,385 5,713 2,491 0.49Formal Debt 51,147 54,813 14,883 0.19Total Financial Capital 69,256 72,958 29,107 0.00Leverage Ratio 0.29 0.30 0.21 0.00
KFS Survey Years 4-7Owner’s Equity 8,327 7,944 4,678 0.42Formal Equity 7,663 8,339 1,227 0.20Informal Equity 1,037 1,047 254 0.63Owner Debt 3,618 3,671 3,482 0.42Informal Debt 4,898 5,176 979 0.21Formal Debt 48,616 49,809 20,265 0.64Total Financial Capital 58,684 59,825 27,348 0.54Leverage Ratio 0.29 0.29 0.20 0.00
38
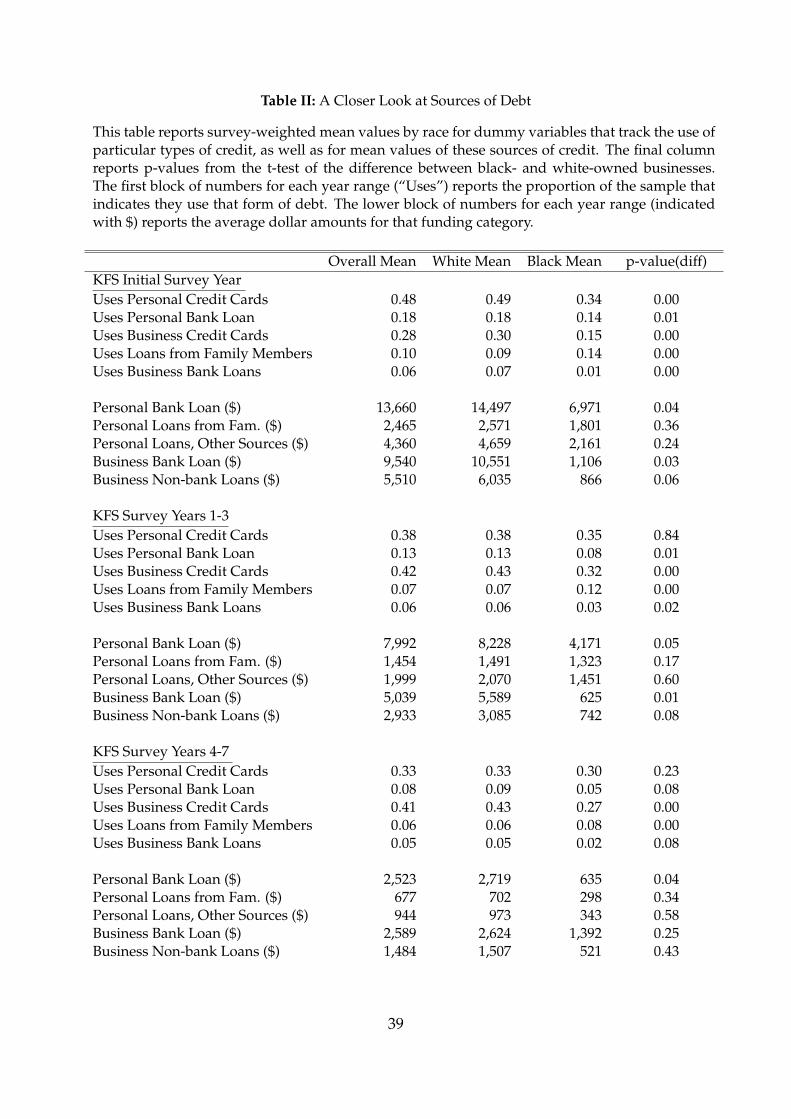
ii
“rfr˙vfinance9˙KFS” — 2016/12/15 — 14:20 — page 39 — #40 ii
ii
ii
Table II: A Closer Look at Sources of Debt
This table reports survey-weighted mean values by race for dummy variables that track the use ofparticular types of credit, as well as for mean values of these sources of credit. The final columnreports p-values from the t-test of the difference between black- and white-owned businesses.The first block of numbers for each year range (“Uses”) reports the proportion of the sample thatindicates they use that form of debt. The lower block of numbers for each year range (indicatedwith $) reports the average dollar amounts for that funding category.
Overall Mean White Mean Black Mean p-value(diff)KFS Initial Survey YearUses Personal Credit Cards 0.48 0.49 0.34 0.00Uses Personal Bank Loan 0.18 0.18 0.14 0.01Uses Business Credit Cards 0.28 0.30 0.15 0.00Uses Loans from Family Members 0.10 0.09 0.14 0.00Uses Business Bank Loans 0.06 0.07 0.01 0.00
Personal Bank Loan ($) 13,660 14,497 6,971 0.04Personal Loans from Fam. ($) 2,465 2,571 1,801 0.36Personal Loans, Other Sources ($) 4,360 4,659 2,161 0.24Business Bank Loan ($) 9,540 10,551 1,106 0.03Business Non-bank Loans ($) 5,510 6,035 866 0.06
KFS Survey Years 1-3Uses Personal Credit Cards 0.38 0.38 0.35 0.84Uses Personal Bank Loan 0.13 0.13 0.08 0.01Uses Business Credit Cards 0.42 0.43 0.32 0.00Uses Loans from Family Members 0.07 0.07 0.12 0.00Uses Business Bank Loans 0.06 0.06 0.03 0.02
Personal Bank Loan ($) 7,992 8,228 4,171 0.05Personal Loans from Fam. ($) 1,454 1,491 1,323 0.17Personal Loans, Other Sources ($) 1,999 2,070 1,451 0.60Business Bank Loan ($) 5,039 5,589 625 0.01Business Non-bank Loans ($) 2,933 3,085 742 0.08
KFS Survey Years 4-7Uses Personal Credit Cards 0.33 0.33 0.30 0.23Uses Personal Bank Loan 0.08 0.09 0.05 0.08Uses Business Credit Cards 0.41 0.43 0.27 0.00Uses Loans from Family Members 0.06 0.06 0.08 0.00Uses Business Bank Loans 0.05 0.05 0.02 0.08
Personal Bank Loan ($) 2,523 2,719 635 0.04Personal Loans from Fam. ($) 677 702 298 0.34Personal Loans, Other Sources ($) 944 973 343 0.58Business Bank Loan ($) 2,589 2,624 1,392 0.25Business Non-bank Loans ($) 1,484 1,507 521 0.43
39
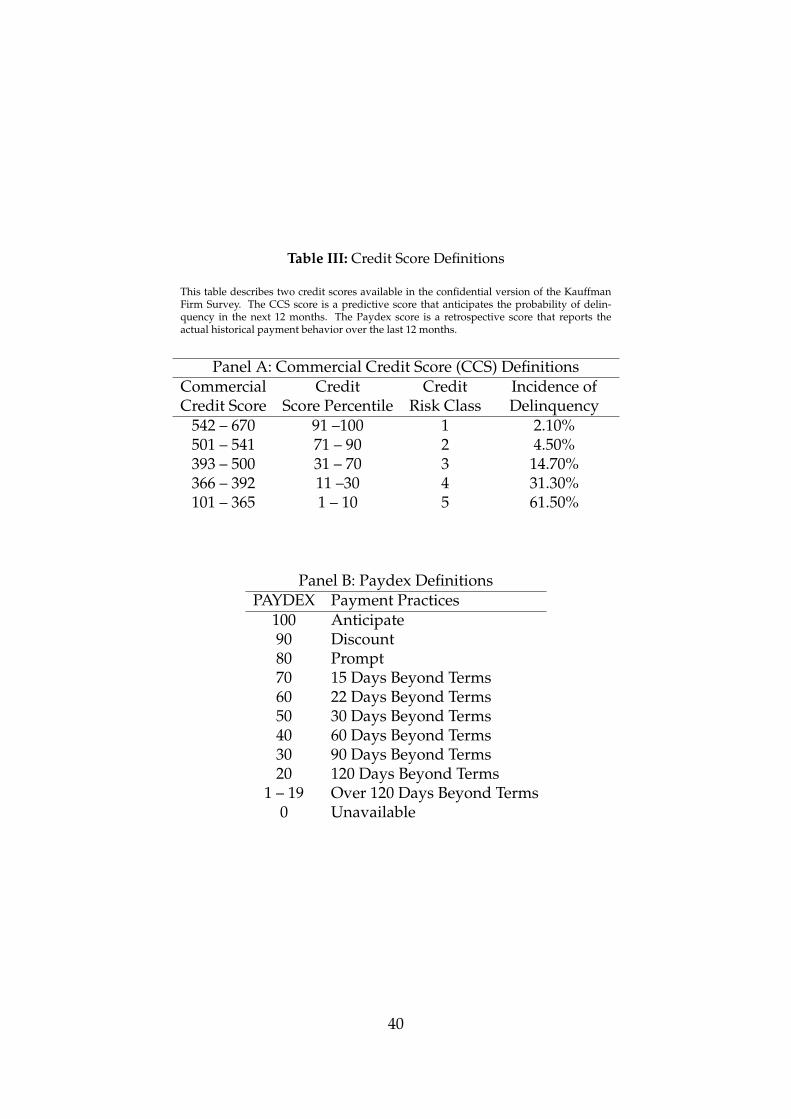
ii
“rfr˙vfinance9˙KFS” — 2016/12/15 — 14:20 — page 40 — #41 ii
ii
ii
Table III: Credit Score Definitions
This table describes two credit scores available in the confidential version of the KauffmanFirm Survey. The CCS score is a predictive score that anticipates the probability of delin-quency in the next 12 months. The Paydex score is a retrospective score that reports theactual historical payment behavior over the last 12 months.
Panel A: Commercial Credit Score (CCS) DefinitionsCommercial Credit Credit Incidence ofCredit Score Score Percentile Risk Class Delinquency
542 – 670 91 –100 1 2.10%501 – 541 71 – 90 2 4.50%393 – 500 31 – 70 3 14.70%366 – 392 11 –30 4 31.30%101 – 365 1 – 10 5 61.50%
Panel B: Paydex DefinitionsPAYDEX Payment Practices
100 Anticipate90 Discount80 Prompt70 15 Days Beyond Terms60 22 Days Beyond Terms50 30 Days Beyond Terms40 60 Days Beyond Terms30 90 Days Beyond Terms20 120 Days Beyond Terms
1 – 19 Over 120 Days Beyond Terms0 Unavailable
40
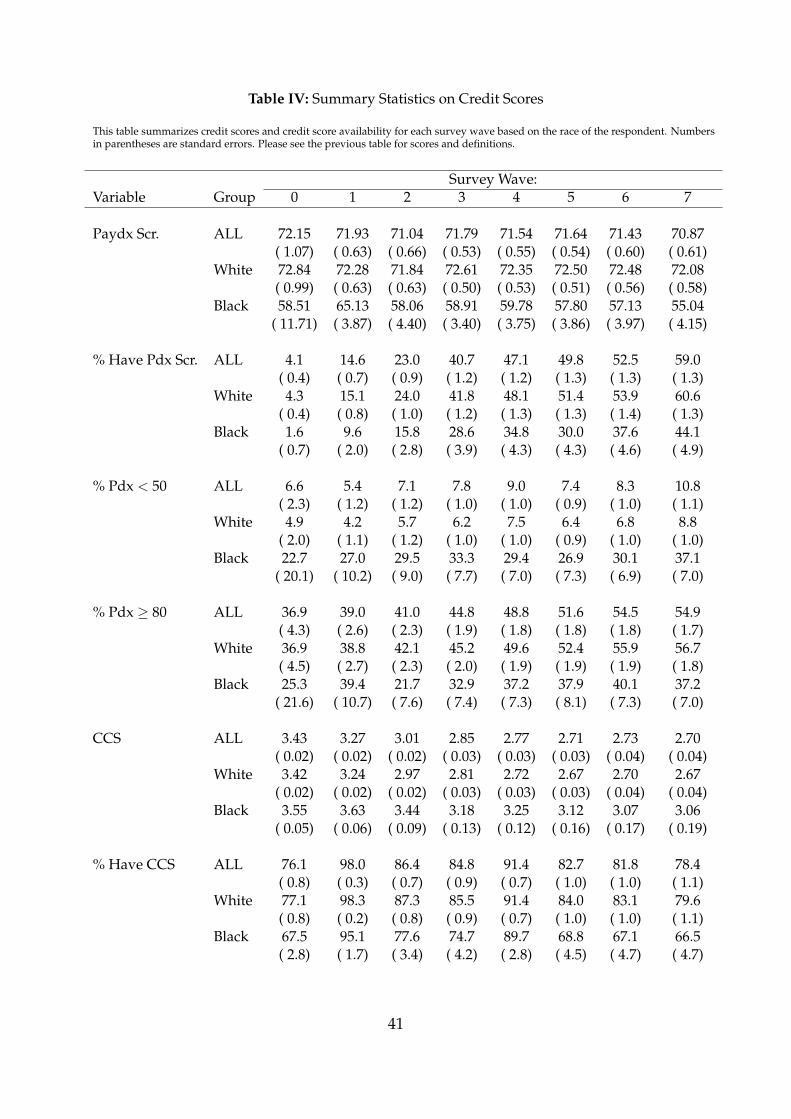
ii
“rfr˙vfinance9˙KFS” — 2016/12/15 — 14:20 — page 41 — #42 ii
ii
ii
Table IV: Summary Statistics on Credit Scores
This table summarizes credit scores and credit score availability for each survey wave based on the race of the respondent. Numbersin parentheses are standard errors. Please see the previous table for scores and definitions.
Survey Wave:Variable Group 0 1 2 3 4 5 6 7
Paydx Scr. ALL 72.15 71.93 71.04 71.79 71.54 71.64 71.43 70.87( 1.07) ( 0.63) ( 0.66) ( 0.53) ( 0.55) ( 0.54) ( 0.60) ( 0.61)
White 72.84 72.28 71.84 72.61 72.35 72.50 72.48 72.08( 0.99) ( 0.63) ( 0.63) ( 0.50) ( 0.53) ( 0.51) ( 0.56) ( 0.58)
Black 58.51 65.13 58.06 58.91 59.78 57.80 57.13 55.04( 11.71) ( 3.87) ( 4.40) ( 3.40) ( 3.75) ( 3.86) ( 3.97) ( 4.15)
% Have Pdx Scr. ALL 4.1 14.6 23.0 40.7 47.1 49.8 52.5 59.0( 0.4) ( 0.7) ( 0.9) ( 1.2) ( 1.2) ( 1.3) ( 1.3) ( 1.3)
White 4.3 15.1 24.0 41.8 48.1 51.4 53.9 60.6( 0.4) ( 0.8) ( 1.0) ( 1.2) ( 1.3) ( 1.3) ( 1.4) ( 1.3)
Black 1.6 9.6 15.8 28.6 34.8 30.0 37.6 44.1( 0.7) ( 2.0) ( 2.8) ( 3.9) ( 4.3) ( 4.3) ( 4.6) ( 4.9)
% Pdx < 50 ALL 6.6 5.4 7.1 7.8 9.0 7.4 8.3 10.8( 2.3) ( 1.2) ( 1.2) ( 1.0) ( 1.0) ( 0.9) ( 1.0) ( 1.1)
White 4.9 4.2 5.7 6.2 7.5 6.4 6.8 8.8( 2.0) ( 1.1) ( 1.2) ( 1.0) ( 1.0) ( 0.9) ( 1.0) ( 1.0)
Black 22.7 27.0 29.5 33.3 29.4 26.9 30.1 37.1( 20.1) ( 10.2) ( 9.0) ( 7.7) ( 7.0) ( 7.3) ( 6.9) ( 7.0)
% Pdx � 80 ALL 36.9 39.0 41.0 44.8 48.8 51.6 54.5 54.9( 4.3) ( 2.6) ( 2.3) ( 1.9) ( 1.8) ( 1.8) ( 1.8) ( 1.7)
White 36.9 38.8 42.1 45.2 49.6 52.4 55.9 56.7( 4.5) ( 2.7) ( 2.3) ( 2.0) ( 1.9) ( 1.9) ( 1.9) ( 1.8)
Black 25.3 39.4 21.7 32.9 37.2 37.9 40.1 37.2( 21.6) ( 10.7) ( 7.6) ( 7.4) ( 7.3) ( 8.1) ( 7.3) ( 7.0)
CCS ALL 3.43 3.27 3.01 2.85 2.77 2.71 2.73 2.70( 0.02) ( 0.02) ( 0.02) ( 0.03) ( 0.03) ( 0.03) ( 0.04) ( 0.04)
White 3.42 3.24 2.97 2.81 2.72 2.67 2.70 2.67( 0.02) ( 0.02) ( 0.02) ( 0.03) ( 0.03) ( 0.03) ( 0.04) ( 0.04)
Black 3.55 3.63 3.44 3.18 3.25 3.12 3.07 3.06( 0.05) ( 0.06) ( 0.09) ( 0.13) ( 0.12) ( 0.16) ( 0.17) ( 0.19)
% Have CCS ALL 76.1 98.0 86.4 84.8 91.4 82.7 81.8 78.4( 0.8) ( 0.3) ( 0.7) ( 0.9) ( 0.7) ( 1.0) ( 1.0) ( 1.1)
White 77.1 98.3 87.3 85.5 91.4 84.0 83.1 79.6( 0.8) ( 0.2) ( 0.8) ( 0.9) ( 0.7) ( 1.0) ( 1.0) ( 1.1)
Black 67.5 95.1 77.6 74.7 89.7 68.8 67.1 66.5( 2.8) ( 1.7) ( 3.4) ( 4.2) ( 2.8) ( 4.5) ( 4.7) ( 4.7)
41

ii
“rfr˙vfinance9˙KFS” — 2016/12/15 — 14:20 — page 42 — #43 ii
ii
ii
Tabl
eV
:Reg
ress
ion
Ana
lysi
sof
the
Log
ofTo
talC
apit
al
This
tabl
em
odel
sva
riat
ion
inth
eam
ount
ofto
tal
capi
tal
from
all
sour
ces,
incl
ude
foun
der,
insi
der
and
outs
ide
debt
and
equi
ty.
All
colu
mns
incl
ude
indu
stry
fixed
effe
cts
and
cont
rols
for
othe
rra
cial
cate
gori
es.C
olum
ns(4
)-(1
0)ar
epo
oled
OLS
with
surv
ey-y
ear
fixed
effe
cts
incl
uded
.
(1)
(2)
(3)
(4)
(5)
(6)
(7)
(8)
(9)
(10)
VAR
IABL
ESYe
ar0
Year
0Ye
ar0
Year
s1-
3Ye
ars
1-3
Year
s1-
3Ye
ars
4-7
Year
s4-
7Ye
ars
4-7
Year
s4-
7
Blac
k-0
.610
5***
-0.5
641*
**-0
.581
0***
-0.0
416
0.01
380.
0537
0.01
320.
0645
0.14
180.
0722
(0.1
09)
(0.1
05)
(0.1
02)
(0.0
89)
(0.0
90)
(0.0
90)
(0.0
93)
(0.0
93)
(0.0
95)
(0.0
95)
Fem
ale
-0.2
828*
**-0
.258
5***
-0.1
486*
*-0
.503
1***
-0.4
663*
**-0
.391
6***
-0.2
997*
**-0
.294
8***
-0.2
338*
**-0
.204
7***
(0.0
80)
(0.0
76)
(0.0
74)
(0.0
63)
(0.0
62)
(0.0
63)
(0.0
65)
(0.0
65)
(0.0
64)
(0.0
65)
Prev
ious
Indu
stry
Expe
rien
ce-0
.002
7-0
.003
5-0
.003
1-0
.002
9-0
.003
6-0
.001
4-0
.001
8-0
.004
7-0
.003
1-0
.001
4(0
.004
)(0
.004
)(0
.004
)(0
.003
)(0
.003
)(0
.003
)(0
.003
)(0
.004
)(0
.003
)(0
.004
)Ex
peri
ence
Out
side
Indu
stry
0.00
470.
0079
**0.
0137
***
-0.0
025
-0.0
005
0.00
50*
-0.0
035
-0.0
056*
-0.0
018
0.00
49(0
.004
)(0
.004
)(0
.003
)(0
.003
)(0
.003
)(0
.003
)(0
.003
)(0
.003
)(0
.003
)(0
.003
)So
me
Col
lege
0.09
060.
0841
0.03
410.
0927
0.05
990.
0003
0.29
73**
*0.
2666
***
0.21
31**
0.19
29**
(0.1
10)
(0.1
06)
(0.1
02)
(0.0
92)
(0.0
93)
(0.0
91)
(0.0
94)
(0.0
94)
(0.0
95)
(0.0
93)
Col
lege
Deg
.0.
2114
*0.
1592
0.07
560.
2140
**0.
1072
0.03
460.
4380
***
0.34
67**
*0.
2455
**0.
2203
**(0
.121
)(0
.118
)(0
.114
)(0
.099
)(0
.100
)(0
.099
)(0
.101
)(0
.102
)(0
.103
)(0
.101
)G
rad.
Deg
.0.
4594
***
0.35
52**
*0.
2433
*0.
3705
***
0.22
25**
0.17
370.
4052
***
0.28
11**
0.13
880.
1226
(0.1
38)
(0.1
35)
(0.1
31)
(0.1
11)
(0.1
10)
(0.1
10)
(0.1
13)
(0.1
16)
(0.1
14)
(0.1
13)
Prev
.Sta
rtup
Exp.
0.29
34**
*0.
1553
**0.
1061
0.43
82**
*0.
2932
***
0.26
04**
*0.
3489
***
0.33
29**
*0.
2123
***
0.20
97**
*(0
.074
)(0
.072
)(0
.069
)(0
.058
)(0
.057
)(0
.057
)(0
.059
)(0
.059
)(0
.058
)(0
.058
)C
redi
tSco
re0.
0207
***
0.01
67**
*0.
0123
***
0.01
50**
*0.
0119
***
0.00
92**
*0.
0104
***
0.00
97**
*0.
0082
***
0.00
67**
*(0
.002
)(0
.002
)(0
.002
)(0
.001
)(0
.001
)(0
.001
)(0
.001
)(0
.001
)(0
.001
)(0
.001
)M
akes
Prod
uct
0.22
43**
*0.
2176
***
0.33
92**
*0.
3368
***
0.29
39**
*0.
2957
***
(0.0
81)
(0.0
77)
(0.0
64)
(0.0
64)
(0.0
66)
(0.0
66)
Inte
l.Pr
oper
ty0.
2022
**0.
0810
0.58
23**
*0.
4984
***
0.45
98**
*0.
3163
***
(0.0
86)
(0.0
82)
(0.0
73)
(0.0
72)
(0.0
76)
(0.0
77)
Hom
e-ba
sed
-1.1
503*
**-0
.733
6***
-0.7
617*
**-0
.478
2***
-0.7
672*
**-0
.504
2***
(0.0
74)
(0.0
75)
(0.0
58)
(0.0
62)
(0.0
59)
(0.0
62)
Part
time
Bus.
-0.8
227*
**-0
.589
3***
-0.4
844*
**(0
.086
)(0
.067
)(0
.066
)In
corp
orat
ed0.
6945
***
0.54
95**
*0.
4868
***
(0.0
71)
(0.0
59)
(0.0
59)
Empl
oym
ent
0.06
13**
*0.
0260
***
0.02
22**
*(0
.012
)(0
.007
)(0
.005
)N
etW
orth
:Mis
sing
0.41
22**
*0.
3735
***
0.26
44**
(0.1
25)
(0.1
26)
(0.1
28)
Net
Wor
th:N
eg.o
rZ
ero
0.40
87**
*0.
4271
***
0.30
41**
(0.1
24)
(0.1
25)
(0.1
23)
Net
Wor
th:$
51,0
00-1
00,0
00-0
.003
70.
0085
-0.0
222
(0.0
94)
(0.0
93)
(0.0
93)
Net
Wor
th:$
100,
001-
250,
000
0.17
71**
0.16
36*
0.06
66(0
.085
)(0
.085
)(0
.085
)N
etW
orth
:$25
0,00
0+0.
4502
***
0.38
16**
*0.
1873
**(0
.085
)(0
.085
)(0
.086
)
Obs
erva
tions
3,97
53,
972
3,84
09,
006
8,84
28,
578
8,46
08,
460
8,42
68,
173
R-s
quar
ed0.
114
0.18
90.
271
0.08
20.
122
0.15
90.
060
0.06
60.
103
0.13
4St
anda
rder
rors
inpa
rent
hese
s**
*p<
0.01
,**p
<0.
05,*
p<0.
1
42
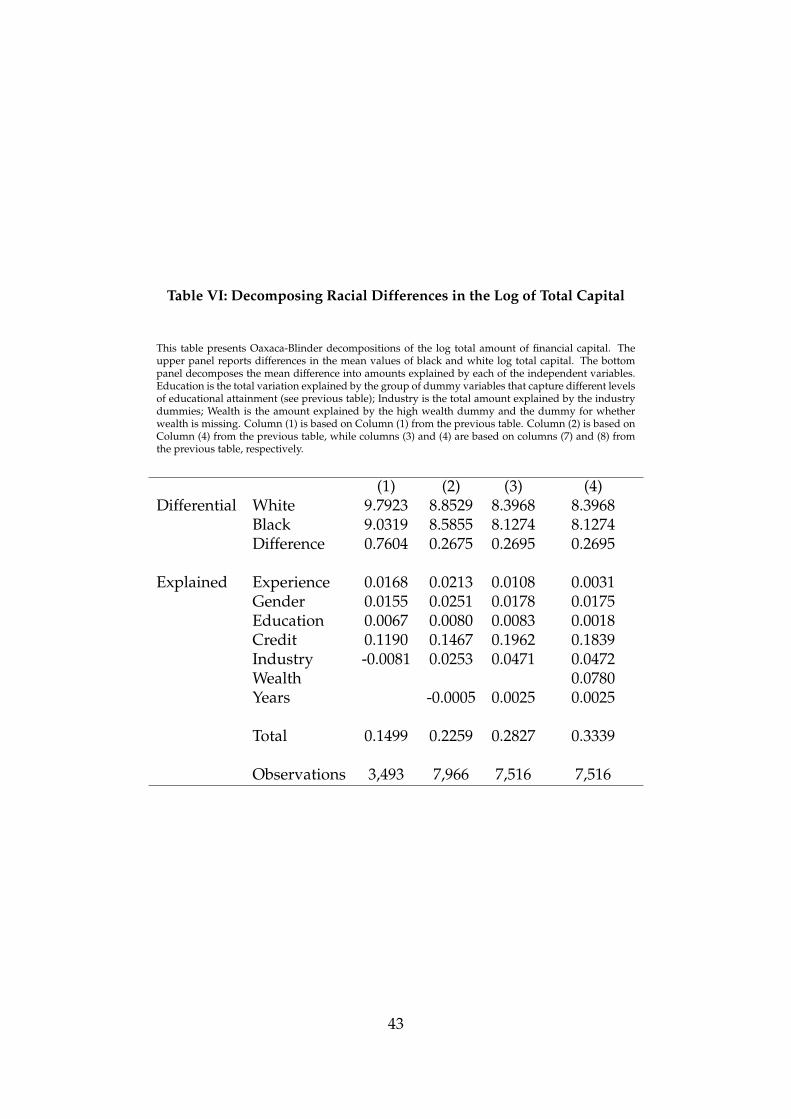
ii
“rfr˙vfinance9˙KFS” — 2016/12/15 — 14:20 — page 43 — #44 ii
ii
ii
Table VI: Decomposing Racial Differences in the Log of Total Capital
This table presents Oaxaca-Blinder decompositions of the log total amount of financial capital. Theupper panel reports differences in the mean values of black and white log total capital. The bottompanel decomposes the mean difference into amounts explained by each of the independent variables.Education is the total variation explained by the group of dummy variables that capture different levelsof educational attainment (see previous table); Industry is the total amount explained by the industrydummies; Wealth is the amount explained by the high wealth dummy and the dummy for whetherwealth is missing. Column (1) is based on Column (1) from the previous table. Column (2) is based onColumn (4) from the previous table, while columns (3) and (4) are based on columns (7) and (8) fromthe previous table, respectively.
(1) (2) (3) (4)Differential White 9.7923 8.8529 8.3968 8.3968
Black 9.0319 8.5855 8.1274 8.1274Difference 0.7604 0.2675 0.2695 0.2695
Explained Experience 0.0168 0.0213 0.0108 0.0031Gender 0.0155 0.0251 0.0178 0.0175Education 0.0067 0.0080 0.0083 0.0018Credit 0.1190 0.1467 0.1962 0.1839Industry -0.0081 0.0253 0.0471 0.0472Wealth 0.0780Years -0.0005 0.0025 0.0025
Total 0.1499 0.2259 0.2827 0.3339
Observations 3,493 7,966 7,516 7,516
43

ii
“rfr˙vfinance9˙KFS” — 2016/12/15 — 14:20 — page 44 — #45 ii
ii
ii
Tabl
eV
II:R
egre
ssio
nA
naly
sis
ofth
eLo
gof
Out
side
Deb
t
This
tabl
em
odel
sva
riat
ion
inth
eam
ount
ofou
tsid
ede
bt.
The
depe
nden
tva
riab
leis
the
natu
ral
log
ofth
eto
tal
outs
ide
debt
rais
edby
the
firm
inth
esp
ecifi
cye
arin
ques
tion.
All
colu
mns
incl
ude
indu
stry
fixed
effe
cts
and
cont
rols
for
othe
rra
cial
cate
gori
es.C
olum
ns(4
)-(1
0)ar
epo
oled
OLS
with
surv
ey-y
ear
fixed
effe
cts
incl
uded
.
(1)
(2)
(3)
(4)
(5)
(6)
(7)
(8)
(9)
(10)
VAR
IABL
ESYe
ar0
Year
0Ye
ar0
Year
s1-
3Ye
ars
1-3
Year
s1-
3Ye
ars
4-7
Year
s4-
7Ye
ars
4-7
Year
s4-
7
Blac
k-0
.525
5***
-0.4
867*
**-0
.500
5***
-0.3
227*
**-0
.296
5***
-0.2
787*
**-0
.234
5***
-0.1
277
-0.0
771
-0.1
382*
(0.1
10)
(0.1
12)
(0.1
08)
(0.0
81)
(0.0
83)
(0.0
84)
(0.0
79)
(0.0
80)
(0.0
80)
(0.0
79)
Fem
ale
-0.2
058*
*-0
.194
0**
-0.0
920
-0.3
898*
**-0
.362
3***
-0.2
919*
**-0
.266
9***
-0.2
628*
**-0
.212
6***
-0.1
903*
**(0
.090
)(0
.089
)(0
.089
)(0
.060
)(0
.061
)(0
.061
)(0
.060
)(0
.060
)(0
.059
)(0
.060
)Pr
evio
usIn
dust
ryEx
peri
ence
0.00
03-0
.000
1-0
.001
4-0
.005
7*-0
.006
0*-0
.004
4-0
.006
7**
-0.0
119*
**-0
.010
5***
-0.0
088*
**(0
.005
)(0
.005
)(0
.004
)(0
.003
)(0
.003
)(0
.003
)(0
.003
)(0
.003
)(0
.003
)(0
.003
)Ex
peri
ence
Out
side
Indu
stry
0.00
75*
0.00
92**
0.01
17**
*-0
.002
8-0
.001
30.
0032
-0.0
087*
**-0
.012
3***
-0.0
087*
**-0
.003
4(0
.004
)(0
.004
)(0
.004
)(0
.003
)(0
.003
)(0
.003
)(0
.003
)(0
.003
)(0
.003
)(0
.003
)So
me
Col
lege
0.10
480.
1070
0.06
150.
1500
*0.
1360
0.07
510.
2747
***
0.21
63**
0.16
36*
0.13
24(0
.125
)(0
.124
)(0
.122
)(0
.088
)(0
.090
)(0
.088
)(0
.086
)(0
.086
)(0
.086
)(0
.084
)C
olle
geD
eg.
0.13
300.
1079
0.01
770.
2415
**0.
1819
*0.
0910
0.43
21**
*0.
2823
***
0.20
07**
0.16
01*
(0.1
36)
(0.1
35)
(0.1
35)
(0.0
95)
(0.0
97)
(0.0
96)
(0.0
93)
(0.0
93)
(0.0
94)
(0.0
93)
Gra
d.D
eg.
0.44
02**
*0.
3875
**0.
2915
*0.
2490
**0.
1504
0.08
190.
3574
***
0.16
010.
0306
0.02
91(0
.156
)(0
.156
)(0
.156
)(0
.107
)(0
.107
)(0
.108
)(0
.104
)(0
.107
)(0
.106
)(0
.105
)Pr
ev.S
tart
upEx
p.0.
2320
***
0.14
88*
0.09
390.
2842
***
0.17
89**
*0.
1384
**0.
2548
***
0.23
84**
*0.
1426
***
0.13
47**
(0.0
83)
(0.0
83)
(0.0
82)
(0.0
57)
(0.0
57)
(0.0
57)
(0.0
55)
(0.0
54)
(0.0
54)
(0.0
54)
Cre
ditS
core
0.01
92**
*0.
0168
***
0.01
39**
*0.
0164
***
0.01
43**
*0.
0116
***
0.01
26**
*0.
0116
***
0.01
03**
*0.
0088
***
(0.0
02)
(0.0
02)
(0.0
02)
(0.0
01)
(0.0
01)
(0.0
01)
(0.0
01)
(0.0
01)
(0.0
01)
(0.0
01)
Mak
esPr
oduc
t0.
2611
***
0.25
65**
*0.
2205
***
0.22
04**
*0.
1032
*0.
1148
*(0
.091
)(0
.091
)(0
.062
)(0
.062
)(0
.061
)(0
.061
)In
tel.
Prop
erty
-0.0
035
-0.1
246
0.33
13**
*0.
2535
***
0.31
73**
*0.
1988
***
(0.1
00)
(0.0
97)
(0.0
74)
(0.0
73)
(0.0
72)
(0.0
73)
Hom
e-ba
sed
-0.6
944*
**-0
.384
8***
-0.5
737*
**-0
.295
0***
-0.6
792*
**-0
.431
0***
(0.0
82)
(0.0
83)
(0.0
56)
(0.0
60)
(0.0
54)
(0.0
57)
Part
time
Bus.
-0.3
272*
**-0
.483
5***
-0.3
616*
**(0
.089
)(0
.064
)(0
.059
)In
corp
orat
ed0.
4842
***
0.58
81**
*0.
4885
***
(0.0
83)
(0.0
57)
(0.0
54)
Empl
oym
ent
0.07
58**
*0.
0268
***
0.02
29**
*(0
.013
)(0
.007
)(0
.005
)N
etW
orth
:Mis
sing
0.30
88**
*0.
2475
**0.
1220
(0.1
13)
(0.1
14)
(0.1
15)
Net
Wor
th:N
eg.o
rZ
ero
0.35
21**
*0.
3587
***
0.24
74**
(0.1
12)
(0.1
12)
(0.1
10)
Net
Wor
th:$
51,0
00-1
00,0
000.
0488
0.06
270.
0342
(0.0
82)
(0.0
82)
(0.0
83)
Net
Wor
th:$
100,
001-
250,
000
0.27
05**
*0.
2601
***
0.18
08**
(0.0
76)
(0.0
76)
(0.0
75)
Net
Wor
th:$
250,
000+
0.66
54**
*0.
6111
***
0.42
86**
*(0
.077
)(0
.077
)(0
.078
)
Obs
erva
tions
3,97
53,
972
3,84
09,
006
8,84
28,
578
8,46
08,
460
8,42
68,
173
R-s
quar
ed0.
074
0.10
00.
151
0.07
30.
095
0.13
30.
071
0.08
40.
112
0.14
4St
anda
rder
rors
inpa
rent
hese
s**
*p<
0.01
,**p
<0.
05,*
p<0.
1
44
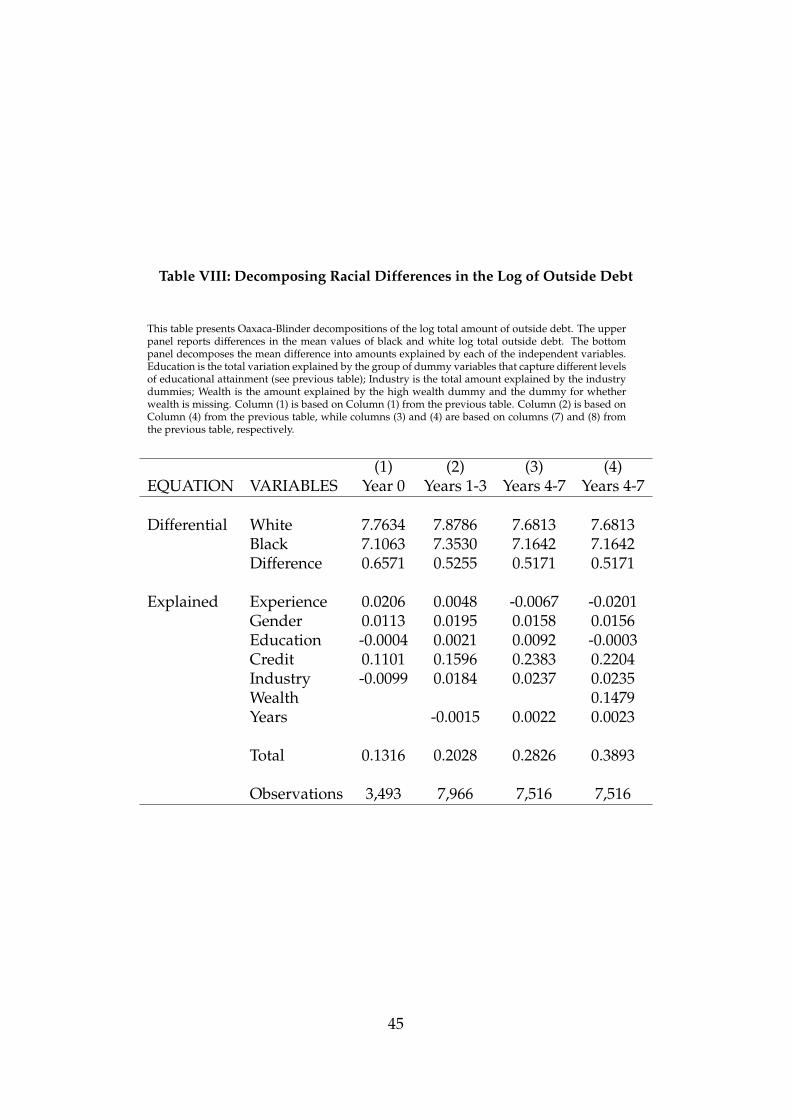
ii
“rfr˙vfinance9˙KFS” — 2016/12/15 — 14:20 — page 45 — #46 ii
ii
ii
Table VIII: Decomposing Racial Differences in the Log of Outside Debt
This table presents Oaxaca-Blinder decompositions of the log total amount of outside debt. The upperpanel reports differences in the mean values of black and white log total outside debt. The bottompanel decomposes the mean difference into amounts explained by each of the independent variables.Education is the total variation explained by the group of dummy variables that capture different levelsof educational attainment (see previous table); Industry is the total amount explained by the industrydummies; Wealth is the amount explained by the high wealth dummy and the dummy for whetherwealth is missing. Column (1) is based on Column (1) from the previous table. Column (2) is based onColumn (4) from the previous table, while columns (3) and (4) are based on columns (7) and (8) fromthe previous table, respectively.
(1) (2) (3) (4)EQUATION VARIABLES Year 0 Years 1-3 Years 4-7 Years 4-7
Differential White 7.7634 7.8786 7.6813 7.6813Black 7.1063 7.3530 7.1642 7.1642Difference 0.6571 0.5255 0.5171 0.5171
Explained Experience 0.0206 0.0048 -0.0067 -0.0201Gender 0.0113 0.0195 0.0158 0.0156Education -0.0004 0.0021 0.0092 -0.0003Credit 0.1101 0.1596 0.2383 0.2204Industry -0.0099 0.0184 0.0237 0.0235Wealth 0.1479Years -0.0015 0.0022 0.0023
Total 0.1316 0.2028 0.2826 0.3893
Observations 3,493 7,966 7,516 7,516
45

ii
“rfr˙vfinance9˙KFS” — 2016/12/15 — 14:20 — page 46 — #47 ii
ii
ii
Tabl
eIX
:Reg
ress
ion
Ana
lysi
sof
Leve
rage
This
tabl
em
odel
sva
riat
ion
inle
vera
ge,
whi
chis
the
ratio
ofou
tsid
ede
btto
tota
lfin
anci
alca
pita
l.A
llco
lum
nsin
clud
ein
dust
ryfix
edef
fect
san
dco
ntro
lsfo
rot
her
raci
alca
tego
ries
.C
olum
ns(4
)-(1
1)ar
epo
oled
OLS
with
surv
ey-y
ear
fixed
effe
cts
incl
uded
.Aco
nsta
ntis
estim
ated
inea
chm
odel
butn
otre
port
edfo
rbr
evity
.One
,tw
oan
dth
ree
aste
risk
sde
note
sign
ifica
nce
atth
e10
,5,a
nd1
perc
entl
evel
,res
pect
ivel
y.
(1)
(2)
(3)
(4)
(5)
(6)
(7)
(8)
(9)
(10)
VAR
IABL
ESYe
ar0
Year
0Ye
ar0
Year
s1-
3Ye
ars
1-3
Year
s1-
3Ye
ars
4-7
Year
s4-
7Ye
ars
4-7
Year
s4-
7
Blac
k-0
.064
7***
-0.0
615*
**-0
.061
2***
-0.0
672*
**-0
.065
4***
-0.0
656*
**-0
.046
7***
-0.0
289
-0.0
226
-0.0
332*
(0.0
17)
(0.0
17)
(0.0
17)
(0.0
16)
(0.0
17)
(0.0
17)
(0.0
18)
(0.0
18)
(0.0
18)
(0.0
18)
Fem
ale
-0.0
072
-0.0
069
0.00
04-0
.053
0***
-0.0
496*
**-0
.043
1***
-0.0
413*
**-0
.040
9***
-0.0
350*
**-0
.033
2***
(0.0
13)
(0.0
13)
(0.0
13)
(0.0
11)
(0.0
12)
(0.0
12)
(0.0
12)
(0.0
12)
(0.0
12)
(0.0
12)
Prev
ious
Indu
stry
Expe
rien
ce-0
.000
4-0
.000
5-0
.000
6-0
.002
1***
-0.0
021*
**-0
.002
0***
-0.0
013*
*-0
.002
0***
-0.0
018*
**-0
.001
7***
(0.0
01)
(0.0
01)
(0.0
01)
(0.0
01)
(0.0
01)
(0.0
01)
(0.0
01)
(0.0
01)
(0.0
01)
(0.0
01)
Expe
rien
ceO
utsi
deIn
dust
ry0.
0006
0.00
070.
0008
-0.0
009*
-0.0
007
-0.0
001
-0.0
019*
**-0
.002
3***
-0.0
019*
**-0
.001
2**
(0.0
01)
(0.0
01)
(0.0
01)
(0.0
01)
(0.0
01)
(0.0
01)
(0.0
01)
(0.0
01)
(0.0
01)
(0.0
01)
Som
eC
olle
ge-0
.007
8-0
.007
0-0
.013
70.
0329
**0.
0343
**0.
0249
0.06
00**
*0.
0519
***
0.04
56**
0.04
20**
(0.0
19)
(0.0
19)
(0.0
19)
(0.0
16)
(0.0
16)
(0.0
16)
(0.0
18)
(0.0
18)
(0.0
18)
(0.0
18)
Col
lege
Deg
.-0
.019
0-0
.020
0-0
.028
20.
0262
0.02
170.
0104
0.06
19**
*0.
0430
**0.
0326
*0.
0284
(0.0
20)
(0.0
20)
(0.0
20)
(0.0
17)
(0.0
17)
(0.0
17)
(0.0
19)
(0.0
19)
(0.0
19)
(0.0
19)
Gra
d.D
eg.
0.00
640.
0040
-0.0
037
0.00
58-0
.003
3-0
.011
90.
0254
0.00
11-0
.016
3-0
.013
3(0
.022
)(0
.022
)(0
.023
)(0
.018
)(0
.019
)(0
.019
)(0
.020
)(0
.020
)(0
.020
)(0
.020
)Pr
ev.S
tart
upEx
p.0.
0087
0.00
320.
0000
0.01
83*
0.00
860.
0071
0.01
690.
0153
0.00
330.
0037
(0.0
12)
(0.0
12)
(0.0
12)
(0.0
10)
(0.0
11)
(0.0
11)
(0.0
11)
(0.0
11)
(0.0
11)
(0.0
11)
Cre
ditS
core
0.00
19**
*0.
0018
***
0.00
16**
*0.
0024
***
0.00
22**
*0.
0018
***
0.00
24**
*0.
0023
***
0.00
21**
*0.
0019
***
(0.0
00)
(0.0
00)
(0.0
00)
(0.0
00)
(0.0
00)
(0.0
00)
(0.0
00)
(0.0
00)
(0.0
00)
(0.0
00)
Mak
esPr
oduc
t0.
0224
*0.
0199
0.01
570.
0138
0.00
540.
0067
(0.0
13)
(0.0
13)
(0.0
11)
(0.0
11)
(0.0
12)
(0.0
13)
Inte
l.Pr
oper
ty-0
.015
5-0
.026
2*0.
0173
0.00
710.
0335
**0.
0173
(0.0
14)
(0.0
14)
(0.0
13)
(0.0
13)
(0.0
14)
(0.0
14)
Hom
e-ba
sed
-0.0
525*
**-0
.026
9**
-0.0
632*
**-0
.027
8**
-0.0
925*
**-0
.057
8***
(0.0
12)
(0.0
12)
(0.0
10)
(0.0
11)
(0.0
11)
(0.0
12)
Part
time
Bus.
-0.0
263*
-0.0
891*
**-0
.074
2***
(0.0
14)
(0.0
12)
(0.0
12)
Inco
rpor
ated
0.03
41**
*0.
0750
***
0.07
63**
*(0
.012
)(0
.011
)(0
.011
)Em
ploy
men
t0.
0065
***
0.00
20**
*0.
0019
***
(0.0
01)
(0.0
01)
(0.0
01)
Net
Wor
th:M
issi
ng0.
0321
0.02
970.
0118
(0.0
23)
(0.0
23)
(0.0
23)
Net
Wor
th:N
eg.o
rZ
ero
0.02
740.
0306
0.01
44(0
.022
)(0
.022
)(0
.022
)N
etW
orth
:$51
,000
-100
,000
0.01
130.
0137
0.01
36(0
.019
)(0
.019
)(0
.019
)N
etW
orth
:$10
0,00
1-25
0,00
00.
0579
***
0.05
64**
*0.
0488
***
(0.0
17)
(0.0
17)
(0.0
17)
Net
Wor
th:$
250,
000+
0.08
62**
*0.
0797
***
0.05
81**
*(0
.016
)(0
.016
)(0
.017
)
Obs
erva
tions
3,97
53,
972
3,84
09,
006
8,84
28,
578
8,46
08,
460
8,42
68,
173
R-s
quar
ed0.
040
0.04
80.
066
0.04
40.
052
0.07
10.
051
0.05
70.
069
0.08
4St
anda
rder
rors
inpa
rent
hese
s**
*p<
0.01
,**p
<0.
05,*
p<0.
1
46
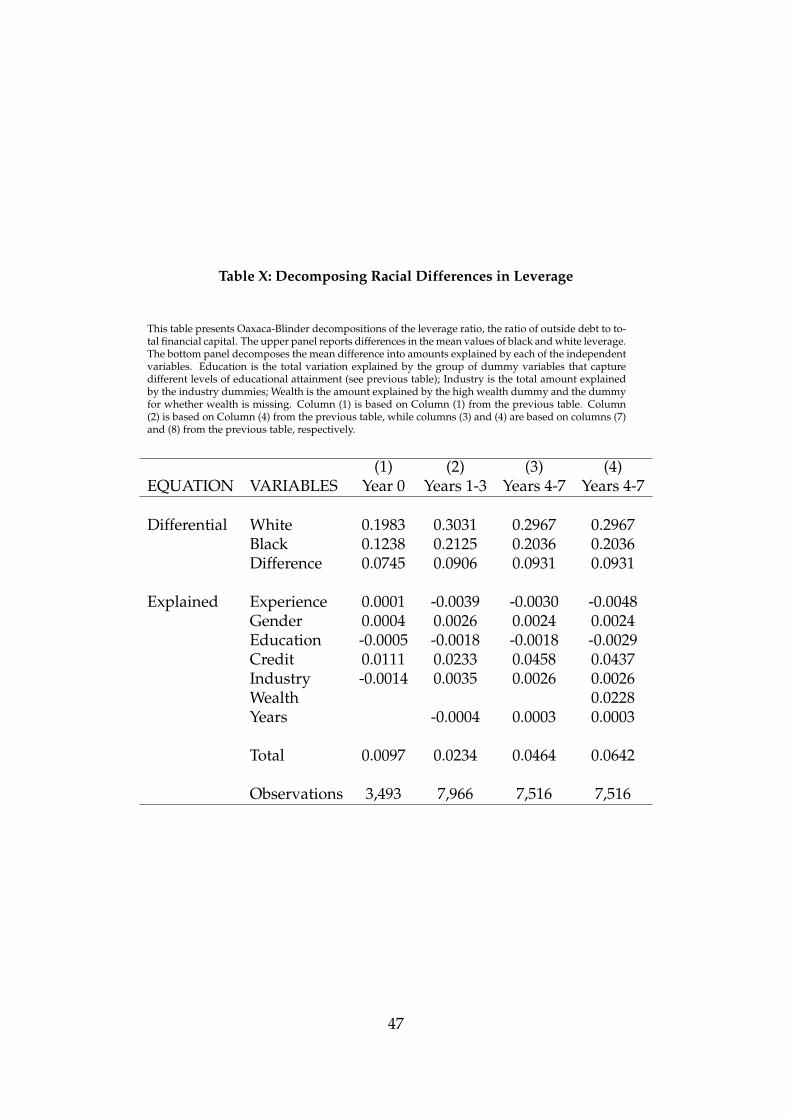
ii
“rfr˙vfinance9˙KFS” — 2016/12/15 — 14:20 — page 47 — #48 ii
ii
ii
Table X: Decomposing Racial Differences in Leverage
This table presents Oaxaca-Blinder decompositions of the leverage ratio, the ratio of outside debt to to-tal financial capital. The upper panel reports differences in the mean values of black and white leverage.The bottom panel decomposes the mean difference into amounts explained by each of the independentvariables. Education is the total variation explained by the group of dummy variables that capturedifferent levels of educational attainment (see previous table); Industry is the total amount explainedby the industry dummies; Wealth is the amount explained by the high wealth dummy and the dummyfor whether wealth is missing. Column (1) is based on Column (1) from the previous table. Column(2) is based on Column (4) from the previous table, while columns (3) and (4) are based on columns (7)and (8) from the previous table, respectively.
(1) (2) (3) (4)EQUATION VARIABLES Year 0 Years 1-3 Years 4-7 Years 4-7
Differential White 0.1983 0.3031 0.2967 0.2967Black 0.1238 0.2125 0.2036 0.2036Difference 0.0745 0.0906 0.0931 0.0931
Explained Experience 0.0001 -0.0039 -0.0030 -0.0048Gender 0.0004 0.0026 0.0024 0.0024Education -0.0005 -0.0018 -0.0018 -0.0029Credit 0.0111 0.0233 0.0458 0.0437Industry -0.0014 0.0035 0.0026 0.0026Wealth 0.0228Years -0.0004 0.0003 0.0003
Total 0.0097 0.0234 0.0464 0.0642
Observations 3,493 7,966 7,516 7,516
47
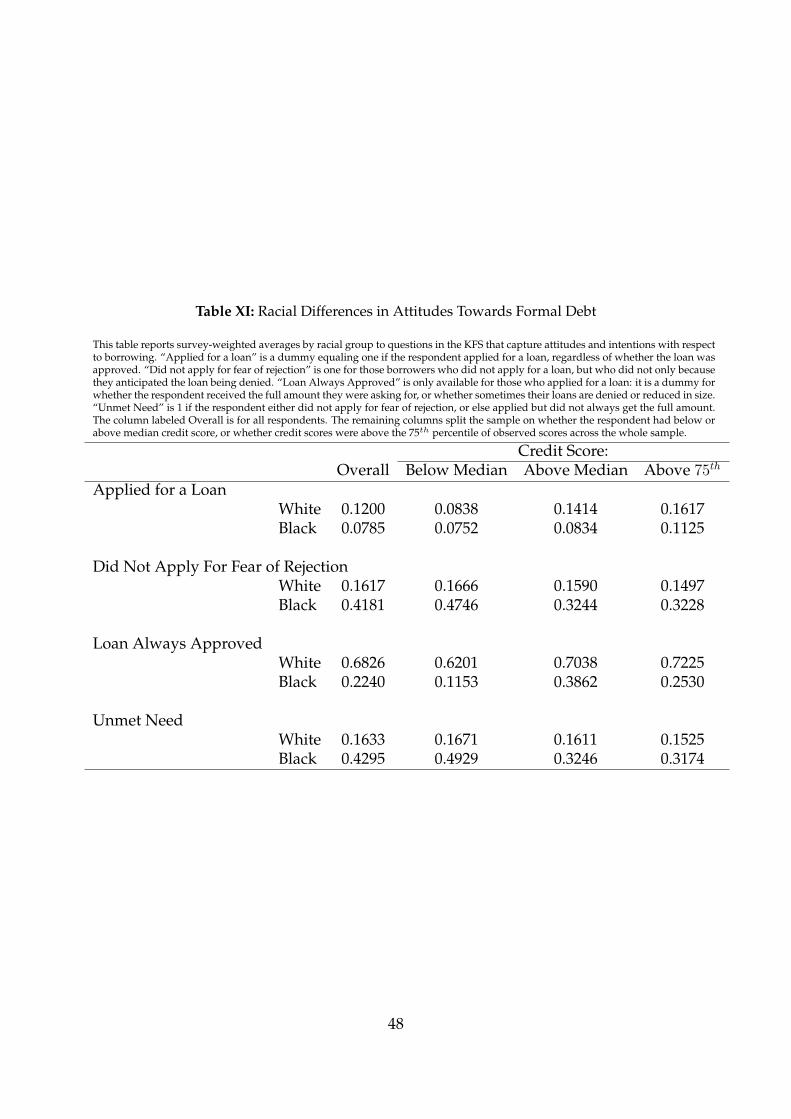
ii
“rfr˙vfinance9˙KFS” — 2016/12/15 — 14:20 — page 48 — #49 ii
ii
ii
Table XI: Racial Differences in Attitudes Towards Formal Debt
This table reports survey-weighted averages by racial group to questions in the KFS that capture attitudes and intentions with respectto borrowing. “Applied for a loan” is a dummy equaling one if the respondent applied for a loan, regardless of whether the loan wasapproved. “Did not apply for fear of rejection” is one for those borrowers who did not apply for a loan, but who did not only becausethey anticipated the loan being denied. “Loan Always Approved” is only available for those who applied for a loan: it is a dummy forwhether the respondent received the full amount they were asking for, or whether sometimes their loans are denied or reduced in size.“Unmet Need” is 1 if the respondent either did not apply for fear of rejection, or else applied but did not always get the full amount.The column labeled Overall is for all respondents. The remaining columns split the sample on whether the respondent had below orabove median credit score, or whether credit scores were above the 75th percentile of observed scores across the whole sample.
Credit Score:Overall Below Median Above Median Above 75th
Applied for a LoanWhite 0.1200 0.0838 0.1414 0.1617Black 0.0785 0.0752 0.0834 0.1125
Did Not Apply For Fear of RejectionWhite 0.1617 0.1666 0.1590 0.1497Black 0.4181 0.4746 0.3244 0.3228
Loan Always ApprovedWhite 0.6826 0.6201 0.7038 0.7225Black 0.2240 0.1153 0.3862 0.2530
Unmet NeedWhite 0.1633 0.1671 0.1611 0.1525Black 0.4295 0.4929 0.3246 0.3174
48
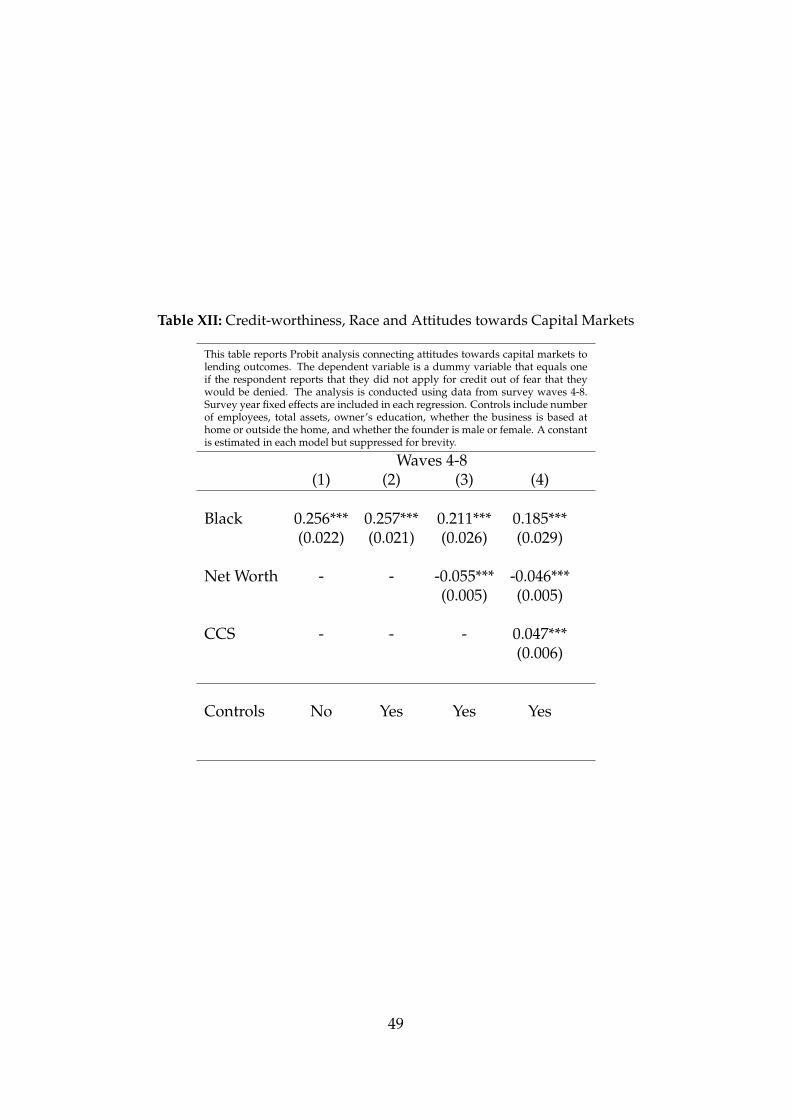
ii
“rfr˙vfinance9˙KFS” — 2016/12/15 — 14:20 — page 49 — #50 ii
ii
ii
Table XII: Credit-worthiness, Race and Attitudes towards Capital Markets
This table reports Probit analysis connecting attitudes towards capital markets tolending outcomes. The dependent variable is a dummy variable that equals oneif the respondent reports that they did not apply for credit out of fear that theywould be denied. The analysis is conducted using data from survey waves 4-8.Survey year fixed effects are included in each regression. Controls include numberof employees, total assets, owner’s education, whether the business is based athome or outside the home, and whether the founder is male or female. A constantis estimated in each model but suppressed for brevity.
Waves 4-8(1) (2) (3) (4)
Black 0.256*** 0.257*** 0.211*** 0.185***(0.022) (0.021) (0.026) (0.029)
Net Worth - - -0.055*** -0.046***(0.005) (0.005)
CCS - - - 0.047***(0.006)
Controls No Yes Yes Yes
49
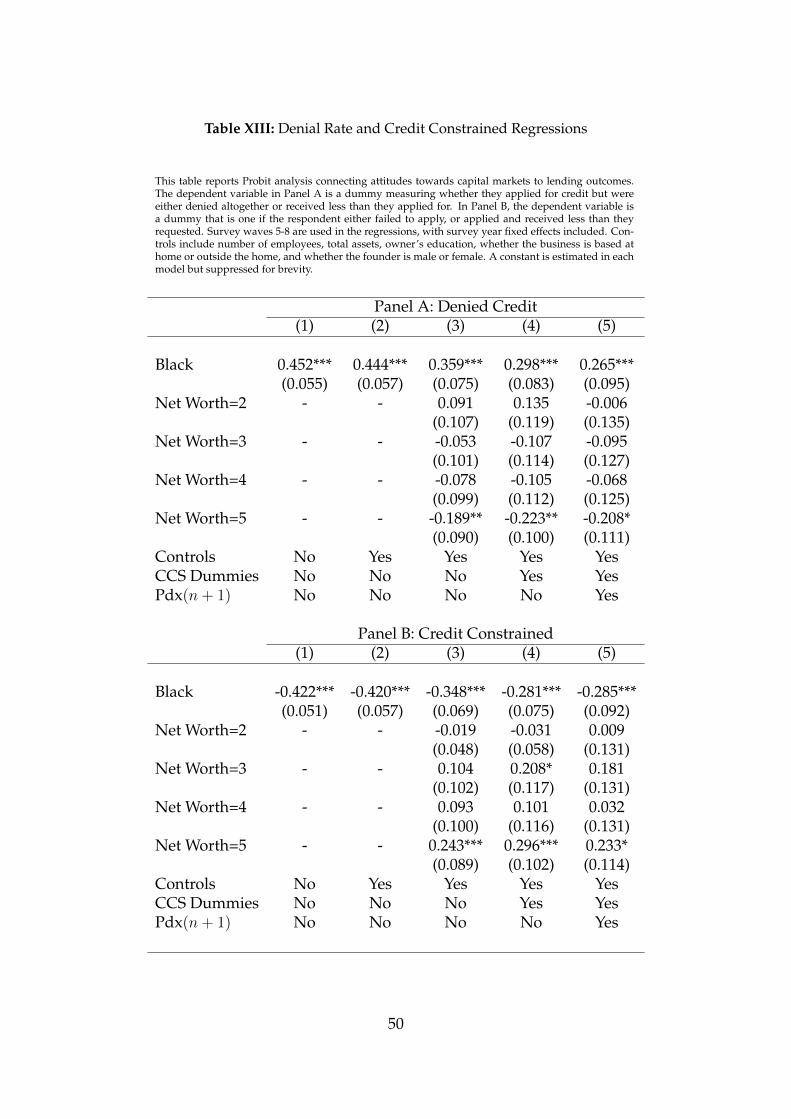
ii
“rfr˙vfinance9˙KFS” — 2016/12/15 — 14:20 — page 50 — #51 ii
ii
ii
Table XIII: Denial Rate and Credit Constrained Regressions
This table reports Probit analysis connecting attitudes towards capital markets to lending outcomes.The dependent variable in Panel A is a dummy measuring whether they applied for credit but wereeither denied altogether or received less than they applied for. In Panel B, the dependent variable isa dummy that is one if the respondent either failed to apply, or applied and received less than theyrequested. Survey waves 5-8 are used in the regressions, with survey year fixed effects included. Con-trols include number of employees, total assets, owner’s education, whether the business is based athome or outside the home, and whether the founder is male or female. A constant is estimated in eachmodel but suppressed for brevity.
Panel A: Denied Credit(1) (2) (3) (4) (5)
Black 0.452*** 0.444*** 0.359*** 0.298*** 0.265***(0.055) (0.057) (0.075) (0.083) (0.095)
Net Worth=2 - - 0.091 0.135 -0.006(0.107) (0.119) (0.135)
Net Worth=3 - - -0.053 -0.107 -0.095(0.101) (0.114) (0.127)
Net Worth=4 - - -0.078 -0.105 -0.068(0.099) (0.112) (0.125)
Net Worth=5 - - -0.189** -0.223** -0.208*(0.090) (0.100) (0.111)
Controls No Yes Yes Yes YesCCS Dummies No No No Yes YesPdx(n+ 1) No No No No Yes
Panel B: Credit Constrained(1) (2) (3) (4) (5)
Black -0.422*** -0.420*** -0.348*** -0.281*** -0.285***(0.051) (0.057) (0.069) (0.075) (0.092)
Net Worth=2 - - -0.019 -0.031 0.009(0.048) (0.058) (0.131)
Net Worth=3 - - 0.104 0.208* 0.181(0.102) (0.117) (0.131)
Net Worth=4 - - 0.093 0.101 0.032(0.100) (0.116) (0.131)
Net Worth=5 - - 0.243*** 0.296*** 0.233*(0.089) (0.102) (0.114)
Controls No Yes Yes Yes YesCCS Dummies No No No Yes YesPdx(n+ 1) No No No No Yes
50
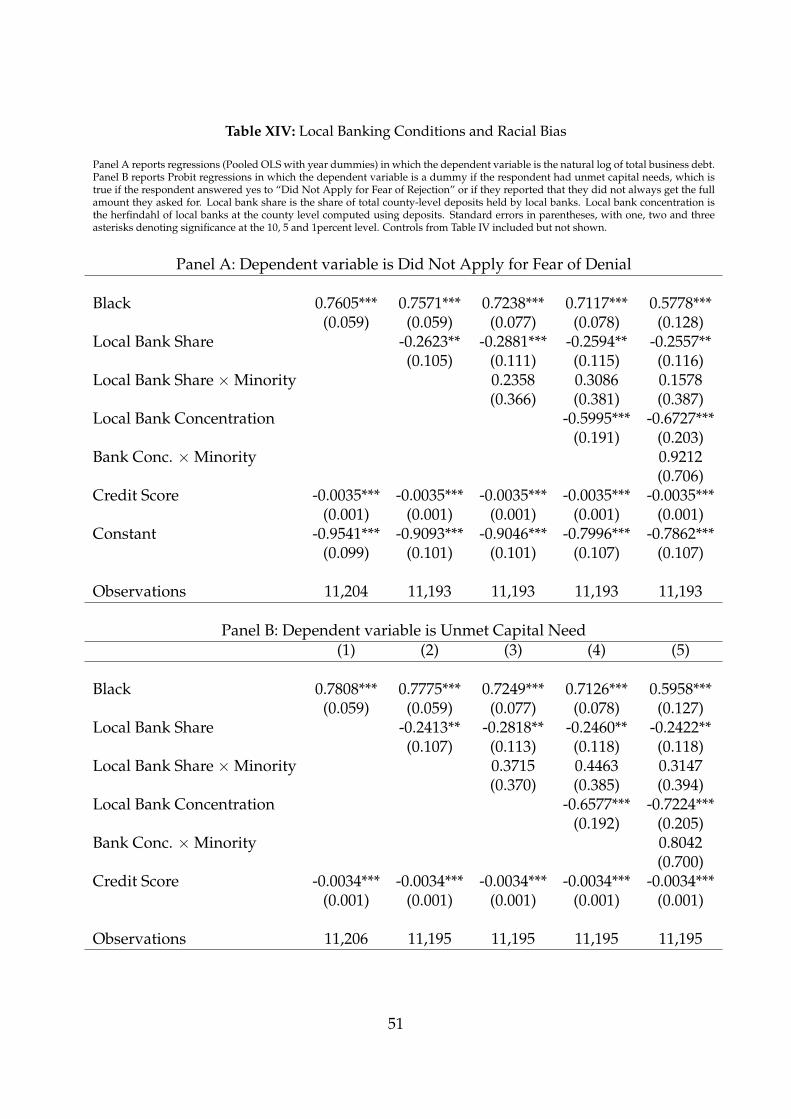
ii
“rfr˙vfinance9˙KFS” — 2016/12/15 — 14:20 — page 51 — #52 ii
ii
ii
Table XIV: Local Banking Conditions and Racial Bias
Panel A reports regressions (Pooled OLS with year dummies) in which the dependent variable is the natural log of total business debt.Panel B reports Probit regressions in which the dependent variable is a dummy if the respondent had unmet capital needs, which istrue if the respondent answered yes to “Did Not Apply for Fear of Rejection” or if they reported that they did not always get the fullamount they asked for. Local bank share is the share of total county-level deposits held by local banks. Local bank concentration isthe herfindahl of local banks at the county level computed using deposits. Standard errors in parentheses, with one, two and threeasterisks denoting significance at the 10, 5 and 1percent level. Controls from Table IV included but not shown.
Panel A: Dependent variable is Did Not Apply for Fear of Denial
Black 0.7605*** 0.7571*** 0.7238*** 0.7117*** 0.5778***(0.059) (0.059) (0.077) (0.078) (0.128)
Local Bank Share -0.2623** -0.2881*** -0.2594** -0.2557**(0.105) (0.111) (0.115) (0.116)
Local Bank Share ⇥ Minority 0.2358 0.3086 0.1578(0.366) (0.381) (0.387)
Local Bank Concentration -0.5995*** -0.6727***(0.191) (0.203)
Bank Conc. ⇥ Minority 0.9212(0.706)
Credit Score -0.0035*** -0.0035*** -0.0035*** -0.0035*** -0.0035***(0.001) (0.001) (0.001) (0.001) (0.001)
Constant -0.9541*** -0.9093*** -0.9046*** -0.7996*** -0.7862***(0.099) (0.101) (0.101) (0.107) (0.107)
Observations 11,204 11,193 11,193 11,193 11,193
Panel B: Dependent variable is Unmet Capital Need(1) (2) (3) (4) (5)
Black 0.7808*** 0.7775*** 0.7249*** 0.7126*** 0.5958***(0.059) (0.059) (0.077) (0.078) (0.127)
Local Bank Share -0.2413** -0.2818** -0.2460** -0.2422**(0.107) (0.113) (0.118) (0.118)
Local Bank Share ⇥ Minority 0.3715 0.4463 0.3147(0.370) (0.385) (0.394)
Local Bank Concentration -0.6577*** -0.7224***(0.192) (0.205)
Bank Conc. ⇥ Minority 0.8042(0.700)
Credit Score -0.0034*** -0.0034*** -0.0034*** -0.0034*** -0.0034***(0.001) (0.001) (0.001) (0.001) (0.001)
Observations 11,206 11,195 11,195 11,195 11,195
51
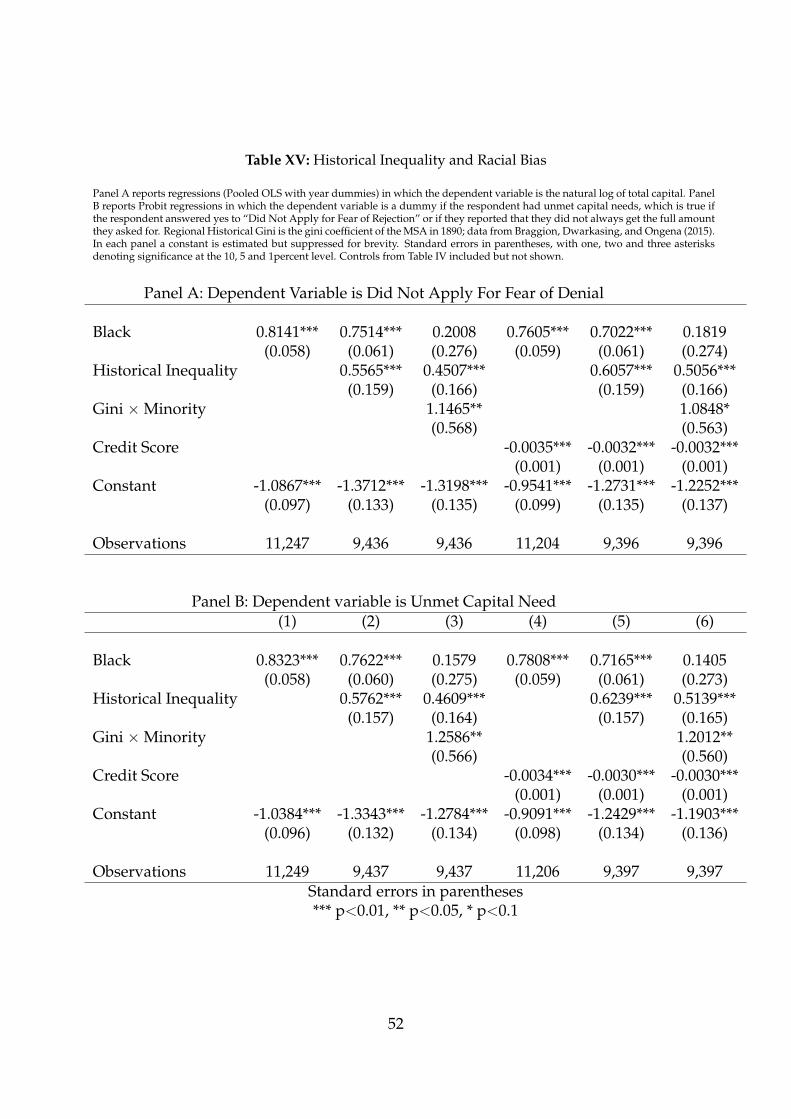
ii
“rfr˙vfinance9˙KFS” — 2016/12/15 — 14:20 — page 52 — #53 ii
ii
ii
Table XV: Historical Inequality and Racial Bias
Panel A reports regressions (Pooled OLS with year dummies) in which the dependent variable is the natural log of total capital. PanelB reports Probit regressions in which the dependent variable is a dummy if the respondent had unmet capital needs, which is true ifthe respondent answered yes to “Did Not Apply for Fear of Rejection” or if they reported that they did not always get the full amountthey asked for. Regional Historical Gini is the gini coefficient of the MSA in 1890; data from Braggion, Dwarkasing, and Ongena (2015).In each panel a constant is estimated but suppressed for brevity. Standard errors in parentheses, with one, two and three asterisksdenoting significance at the 10, 5 and 1percent level. Controls from Table IV included but not shown.
Panel A: Dependent Variable is Did Not Apply For Fear of Denial
Black 0.8141*** 0.7514*** 0.2008 0.7605*** 0.7022*** 0.1819(0.058) (0.061) (0.276) (0.059) (0.061) (0.274)
Historical Inequality 0.5565*** 0.4507*** 0.6057*** 0.5056***(0.159) (0.166) (0.159) (0.166)
Gini ⇥ Minority 1.1465** 1.0848*(0.568) (0.563)
Credit Score -0.0035*** -0.0032*** -0.0032***(0.001) (0.001) (0.001)
Constant -1.0867*** -1.3712*** -1.3198*** -0.9541*** -1.2731*** -1.2252***(0.097) (0.133) (0.135) (0.099) (0.135) (0.137)
Observations 11,247 9,436 9,436 11,204 9,396 9,396
Panel B: Dependent variable is Unmet Capital Need(1) (2) (3) (4) (5) (6)
Black 0.8323*** 0.7622*** 0.1579 0.7808*** 0.7165*** 0.1405(0.058) (0.060) (0.275) (0.059) (0.061) (0.273)
Historical Inequality 0.5762*** 0.4609*** 0.6239*** 0.5139***(0.157) (0.164) (0.157) (0.165)
Gini ⇥ Minority 1.2586** 1.2012**(0.566) (0.560)
Credit Score -0.0034*** -0.0030*** -0.0030***(0.001) (0.001) (0.001)
Constant -1.0384*** -1.3343*** -1.2784*** -0.9091*** -1.2429*** -1.1903***(0.096) (0.132) (0.134) (0.098) (0.134) (0.136)
Observations 11,249 9,437 9,437 11,206 9,397 9,397Standard errors in parentheses*** p<0.01, ** p<0.05, * p<0.1
52
ii
“rfr˙vfinance9˙KFS” — 2016/12/15 — 14:20 — page 53 — #54 ii
ii
ii
A AppendixThis appendix presents detailed raw data on sources of financing for firms in the 2004Kauffman Firm Survey. It is based on Robb and Robinson (2014). The detailed sourcesare grouped into six broad categories, based on the source of the capital and the type ofcapital. These are (owner, informal, formal)⇥(debt, equity).
Table A.1 describes the detailed financing choices in 2004 (the founding year for thefirms in our sample). The first column, labelled “Full KFS”, includes all 4,928 firms in theKauffman Firm Survey. For some of these firms, it cannot be verified that they either wentout of business or remain in operations, therefore in the remaining columns we include3,972 firms that either survived over the 2004–2007 period or were verified as going outof business over the same period. This Column is labelled “Analysis Sample.” These twocolumns report means that include firms with $0 amounts of a particular source of capital.The third column, labelled “Mean if > 0” reports the mean, in dollars, for only firmswith positive amounts of that source of funding. The number of respondents reporting apositive amount of each source of funding is reported in the final column.
Table A.2 provides summary statistics for key variables based on the race of the firmowner.
Table A.3 provides a decomposition of the log of total capital as in the main text, butadds controls for spatial clustering and local banking conditions. In particular, we in-clude measures of local bank market concentration and state fixed effects to the standarddecomposition analysis discussed in the text.
53
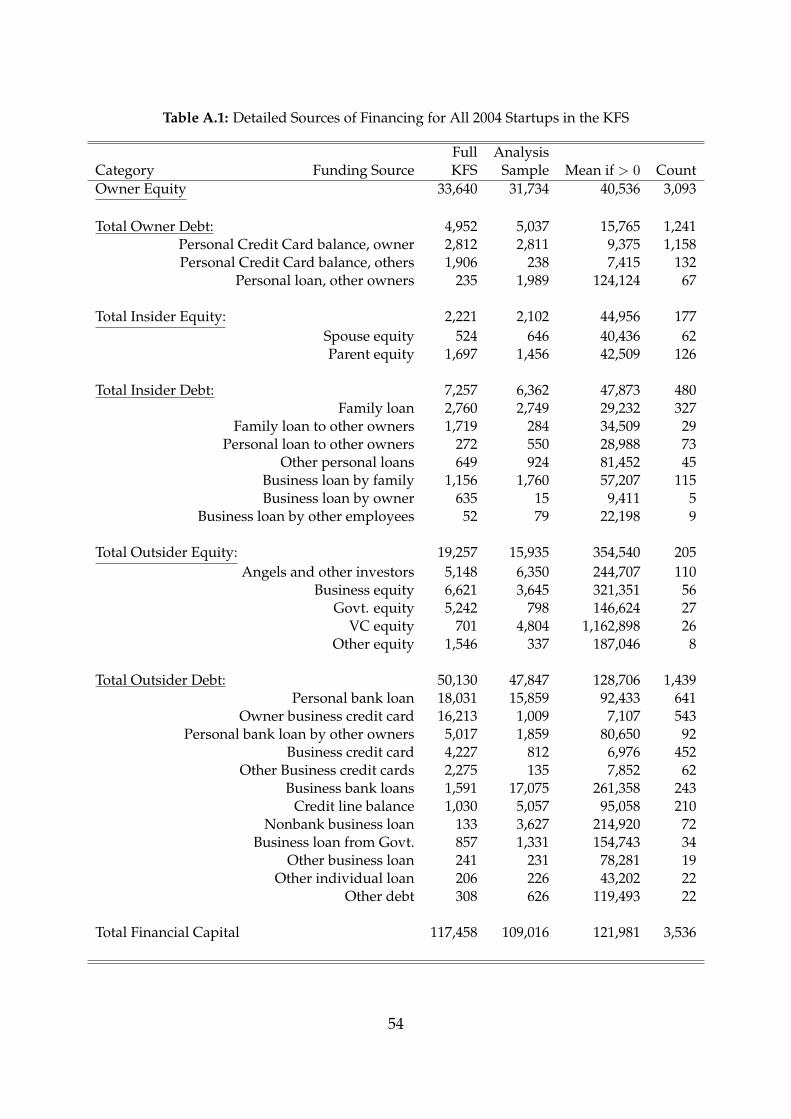
ii
“rfr˙vfinance9˙KFS” — 2016/12/15 — 14:20 — page 54 — #55 ii
ii
ii
Table A.1: Detailed Sources of Financing for All 2004 Startups in the KFS
Full AnalysisCategory Funding Source KFS Sample Mean if > 0 CountOwner Equity 33,640 31,734 40,536 3,093
Total Owner Debt: 4,952 5,037 15,765 1,241Personal Credit Card balance, owner 2,812 2,811 9,375 1,158Personal Credit Card balance, others 1,906 238 7,415 132
Personal loan, other owners 235 1,989 124,124 67
Total Insider Equity: 2,221 2,102 44,956 177Spouse equity 524 646 40,436 62Parent equity 1,697 1,456 42,509 126
Total Insider Debt: 7,257 6,362 47,873 480Family loan 2,760 2,749 29,232 327
Family loan to other owners 1,719 284 34,509 29Personal loan to other owners 272 550 28,988 73
Other personal loans 649 924 81,452 45Business loan by family 1,156 1,760 57,207 115Business loan by owner 635 15 9,411 5
Business loan by other employees 52 79 22,198 9
Total Outsider Equity: 19,257 15,935 354,540 205Angels and other investors 5,148 6,350 244,707 110
Business equity 6,621 3,645 321,351 56Govt. equity 5,242 798 146,624 27
VC equity 701 4,804 1,162,898 26Other equity 1,546 337 187,046 8
Total Outsider Debt: 50,130 47,847 128,706 1,439Personal bank loan 18,031 15,859 92,433 641
Owner business credit card 16,213 1,009 7,107 543Personal bank loan by other owners 5,017 1,859 80,650 92
Business credit card 4,227 812 6,976 452Other Business credit cards 2,275 135 7,852 62
Business bank loans 1,591 17,075 261,358 243Credit line balance 1,030 5,057 95,058 210
Nonbank business loan 133 3,627 214,920 72Business loan from Govt. 857 1,331 154,743 34
Other business loan 241 231 78,281 19Other individual loan 206 226 43,202 22
Other debt 308 626 119,493 22
Total Financial Capital 117,458 109,016 121,981 3,536
54
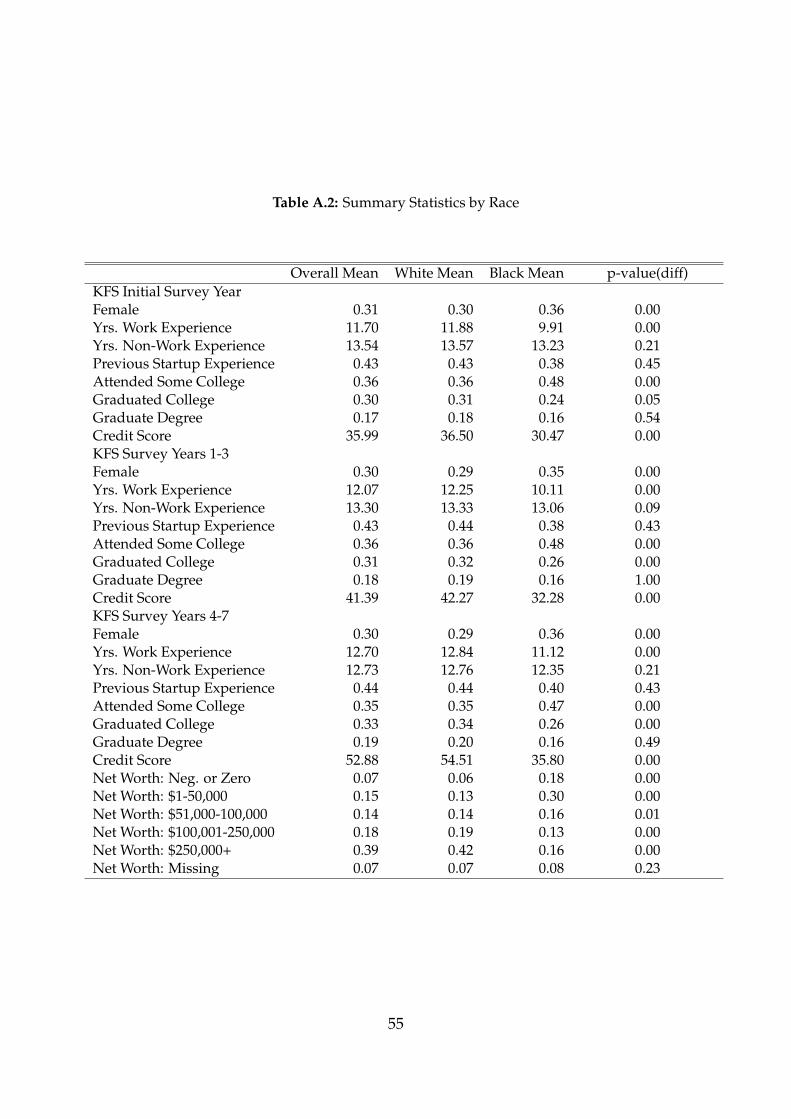
ii
“rfr˙vfinance9˙KFS” — 2016/12/15 — 14:20 — page 55 — #56 ii
ii
ii
Table A.2: Summary Statistics by Race
Overall Mean White Mean Black Mean p-value(diff)KFS Initial Survey YearFemale 0.31 0.30 0.36 0.00Yrs. Work Experience 11.70 11.88 9.91 0.00Yrs. Non-Work Experience 13.54 13.57 13.23 0.21Previous Startup Experience 0.43 0.43 0.38 0.45Attended Some College 0.36 0.36 0.48 0.00Graduated College 0.30 0.31 0.24 0.05Graduate Degree 0.17 0.18 0.16 0.54Credit Score 35.99 36.50 30.47 0.00KFS Survey Years 1-3Female 0.30 0.29 0.35 0.00Yrs. Work Experience 12.07 12.25 10.11 0.00Yrs. Non-Work Experience 13.30 13.33 13.06 0.09Previous Startup Experience 0.43 0.44 0.38 0.43Attended Some College 0.36 0.36 0.48 0.00Graduated College 0.31 0.32 0.26 0.00Graduate Degree 0.18 0.19 0.16 1.00Credit Score 41.39 42.27 32.28 0.00KFS Survey Years 4-7Female 0.30 0.29 0.36 0.00Yrs. Work Experience 12.70 12.84 11.12 0.00Yrs. Non-Work Experience 12.73 12.76 12.35 0.21Previous Startup Experience 0.44 0.44 0.40 0.43Attended Some College 0.35 0.35 0.47 0.00Graduated College 0.33 0.34 0.26 0.00Graduate Degree 0.19 0.20 0.16 0.49Credit Score 52.88 54.51 35.80 0.00Net Worth: Neg. or Zero 0.07 0.06 0.18 0.00Net Worth: $1-50,000 0.15 0.13 0.30 0.00Net Worth: $51,000-100,000 0.14 0.14 0.16 0.01Net Worth: $100,001-250,000 0.18 0.19 0.13 0.00Net Worth: $250,000+ 0.39 0.42 0.16 0.00Net Worth: Missing 0.07 0.07 0.08 0.23
55
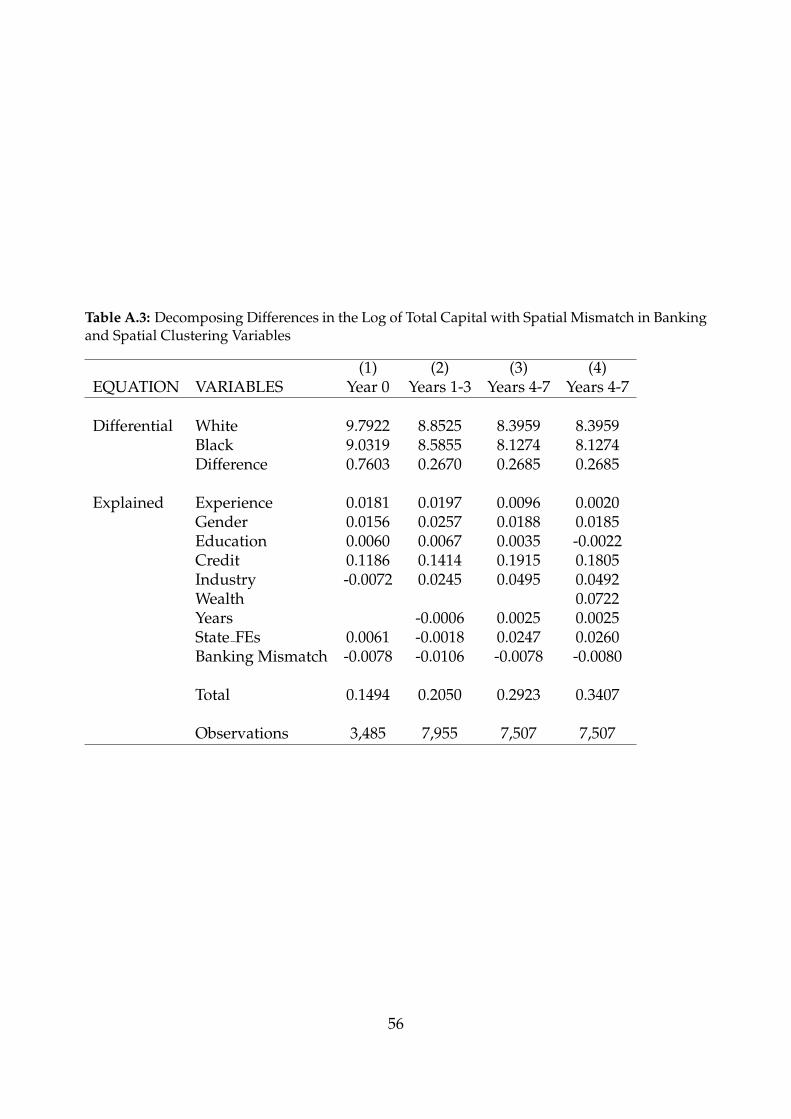
ii
“rfr˙vfinance9˙KFS” — 2016/12/15 — 14:20 — page 56 — #57 ii
ii
ii
Table A.3: Decomposing Differences in the Log of Total Capital with Spatial Mismatch in Bankingand Spatial Clustering Variables
(1) (2) (3) (4)EQUATION VARIABLES Year 0 Years 1-3 Years 4-7 Years 4-7
Differential White 9.7922 8.8525 8.3959 8.3959Black 9.0319 8.5855 8.1274 8.1274Difference 0.7603 0.2670 0.2685 0.2685
Explained Experience 0.0181 0.0197 0.0096 0.0020Gender 0.0156 0.0257 0.0188 0.0185Education 0.0060 0.0067 0.0035 -0.0022Credit 0.1186 0.1414 0.1915 0.1805Industry -0.0072 0.0245 0.0495 0.0492Wealth 0.0722Years -0.0006 0.0025 0.0025State FEs 0.0061 -0.0018 0.0247 0.0260Banking Mismatch -0.0078 -0.0106 -0.0078 -0.0080
Total 0.1494 0.2050 0.2923 0.3407
Observations 3,485 7,955 7,507 7,507
56