Embed Size (px)
Citation preview

Bivariate Regression Bivariate Regression AnalysisAnalysis
The most useful means of discerning causality and significance of variables

Purpose of Regression AnalysisPurpose of Regression Analysis
• Test causal hypotheses
• Make predictions from samples of data
• Derive a rate of change between variables
• Allows for multivariate analysis (multiple causes and control variables)

Goal of RegressionGoal of Regression• Draw a regression line through a sample
of data to best fit.
• This regression line provides a value of how much a given X variable on average affects changes in the Y variable.
• The value of this relationship can be used for prediction and to test hypotheses and provides some support for causality.


ba
eba
Perfect relationship between Y and X: X causes all change in Y
Where a = constant or intercept (value of Y when X= 0 ; B= slope or beta, the value of X
Imperfect relationship between Y and X
E = stochastic term or error of estimation and captures everything else that affects change in Y not captured by X

The InterceptThe Intercept
• The intercept estimate (constant) is where the regression line intercepts the Y axis, which is where the X axis will equal its minimal value.
• In a multivariate equation (2+ X vars) the intercept is where all X variables equal zero.

The InterceptThe Intercept
ba
The intercept operates as a baseline for the estimation of the equation.

The Slope: B coefficientThe Slope: B coefficient
• The slope estimate equals the average change in Y associated with a unit change in X.
• This slope will not be a perfect estimate unless Y is a perfect function of X. If it was perfect, we would always know the exact value of Y if we knew X.
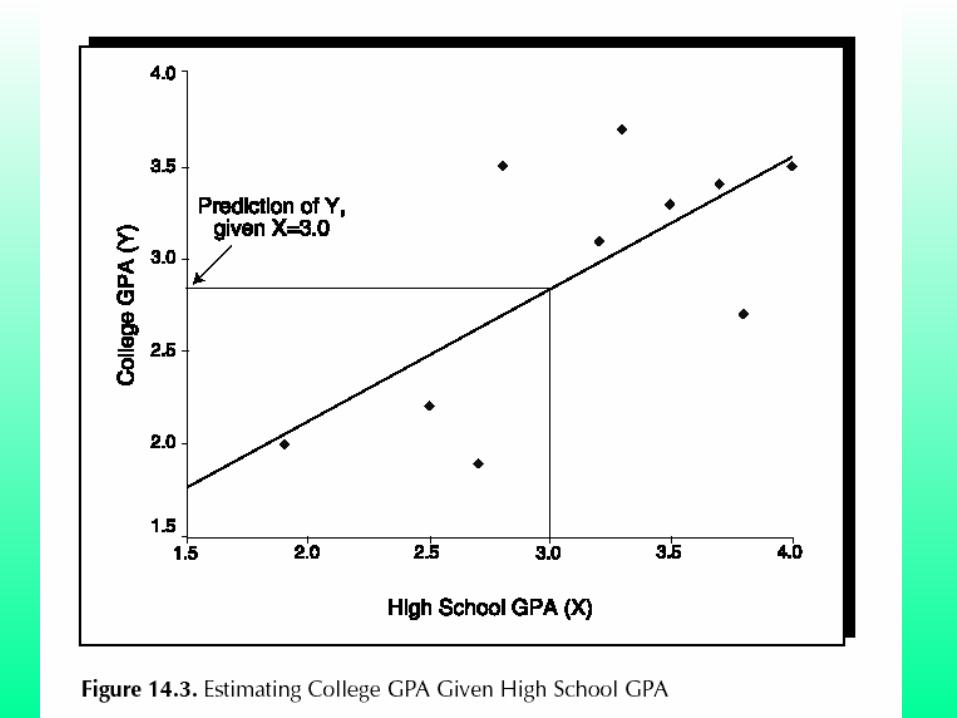

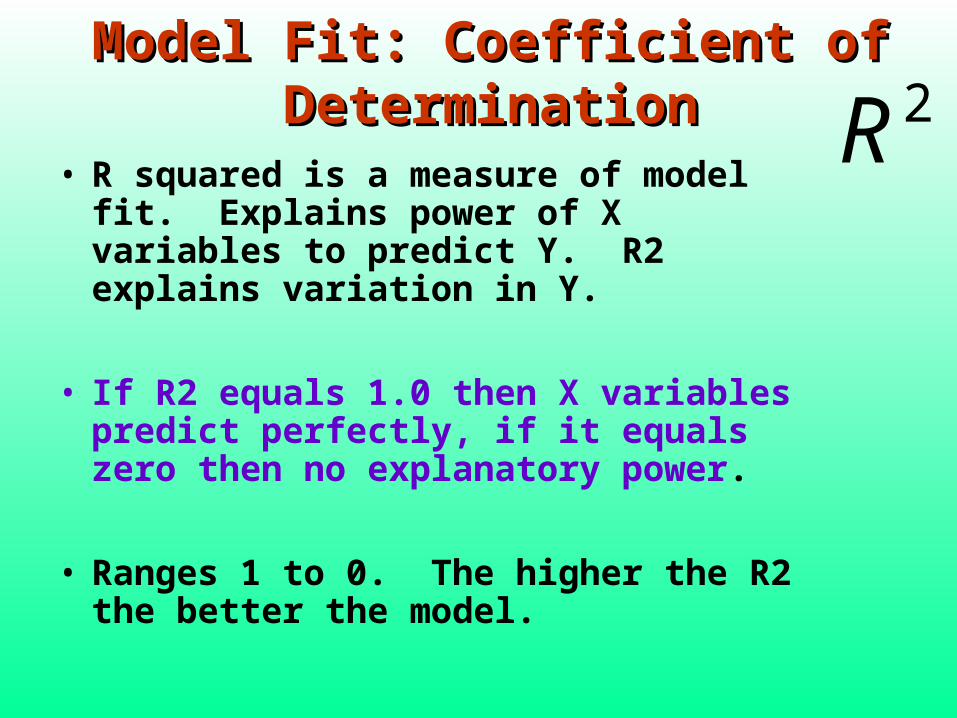
Model Fit: Coefficient of Model Fit: Coefficient of DeterminationDetermination
• R squared is a measure of model fit. Explains power of X variables to predict Y. R2 explains variation in Y.
• If R2 equals 1.0 then X variables predict perfectly, if it equals zero then no explanatory power.
• Ranges 1 to 0. The higher the R2 the better the model.
2R

Significance of VariablesSignificance of Variables
• We can also estimate whether certain variables are important. We do this by ascertaining statistical significance.
• Our key question is: What is the probability that an estimate is produced by random chance and there is no relationship between X and Y variables?

Significance of VariablesSignificance of Variables• We measure statistical significance by
the probability that what we are observing is wrong (generated by random chance).
• A significance level of .05 is conventional. This means that if the significance level is .05, there is a 5 percent chance that our results were generated randomly. A .01 level means there is a 1 percent chance.

Interpreting a Bivariate Interpreting a Bivariate RegressionRegression
Coefficientsa
797.952 45.360 17.592 .000 708.478 887.425
-69.856 6.500 -.615 -10.747 .000 -82.678 -57.034
(Constant)
UNEMP
Model1
B Std. Error
UnstandardizedCoefficients
Beta
StandardizedCoefficients
t Sig. Lower Bound Upper Bound
95% Confidence Interval for B
Dependent Variable: STOCKSa.
• The prior table shows that with an increase in unemployment of one unit (probably measured as a percent), the S&P 500 stock market index goes down 69 points.
• Also, the chance that this result is produced by random chance is less than one in 1,000.

Interpreting a Bivariate Interpreting a Bivariate RegressionRegression
Model Summary
.615a .378 .375 122.85545Model1
R R SquareAdjustedR Square
Std. Error ofthe Estimate
Predictors: (Constant), UNEMPa.
Here, R is the correlation of the two variables and R2 the measure of model fit.
Model Fit: 37.8% of variability of Stocks predicted by change in unemployment figures.
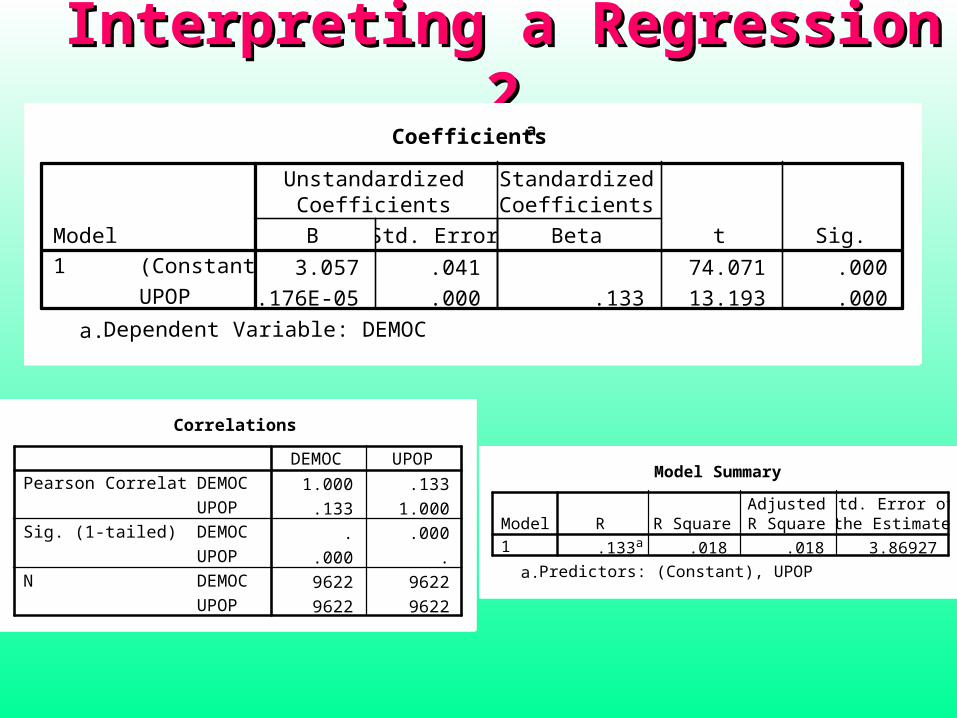
Interpreting a Regression 2Interpreting a Regression 2
Correlations
1.000 .133
.133 1.000
. .000
.000 .
9622 9622
9622 9622
DEMOC
UPOP
DEMOC
UPOP
DEMOC
UPOP
Pearson Correlation
Sig. (1-tailed)
N
DEMOC UPOP Model Summary
.133a .018 .018 3.86927Model1
R R SquareAdjustedR Square
Std. Error ofthe Estimate
Predictors: (Constant), UPOPa.
Coefficientsa
3.057 .041 74.071 .000
4.176E-05 .000 .133 13.193 .000
(Constant)
UPOP
Model1
B Std. Error
UnstandardizedCoefficients
Beta
StandardizedCoefficients
t Sig.
Dependent Variable: DEMOCa.

Interpreting a Regression 2Interpreting a Regression 2
• What can we say about this relationship regarding the effect of X on Y?
• How strongly is X related to Y?
• How good is the model fit?

Interpreting a Regression 2Interpreting a Regression 2• The correlation between X and Y is weak
(.133).
This is reflected in the bivariate correlation coefficient but also picked up in model fit of .018. What does this mean?
• However, there appears to be a causal relationship where urban population increases democracy, and this is a highly significant statistical relationship (sig.= .000 at .05 level)

Interpreting a Regression 2Interpreting a Regression 2• Yet, the coefficient 4.176E-05 means that a
unit increase in urban pop increases democracy by .00004176, which is miniscule!
• This model teaches us a lesson: We need to pay attention to both matters of both statistical significance but also matters of substance. In the broader picture urban population has a rather minimal effect on democracy.

The Inference Made• As with some of our earlier models, when
we interpret the results regarding the relationship between X and Y, we are making an inference based on a sample drawn from a population. The regression equation for the population uses different notation:
Yi = α + βXi + εi