Embed Size (px)
Citation preview

1
Bitcoin: Currency or Asset?
Dirk G. Baur, Kühne Logistics University1
KiHoon Hong, Hongik University College of Business
Adrian D. Lee, UTS Business School
First version: February 2015
This version: November 2015
Abstract
Bitcoin is defined as digital money within a decentralized peer-to-peer payment network. It is a
hybrid between fiat currency and commodity currency without intrinsic value and independent of
any government or monetary authority. This paper analyses the question of whether Bitcoin is
currency or an asset and more specifically, what is its current usage and what usage will prevail in
the future given its characteristics. We analyse the statistical properties of Bitcoin and find that it is
essentially uncorrelated with traditional asset classes such as stocks, bonds and commodities both in
normal times and in periods of financial turmoil. The analysis of transaction data of Bitcoin accounts
shows that Bitcoins are mainly used as a speculative investment and not as an alternative currency
and medium of exchange. Bitcoin is still small relative to the size of other asset classes and thus
does not pose an immediate risk for monetary, financial or economic stability.
Keywords: Bitcoin; digital currency; alternative currency; medium of exchange; asset class
1 Corresponding author. Address: KLU, Grosser Grasbrook 17, 20457 Hamburg, Germany,
email: [email protected]
The authors acknowledge generous research funding from the SWIFT Institute.

2
1. Introduction
According to Nakamoto (2008), Bitcoin is a peer-to-peer electronic cash system which allows
online payments to be sent directly from one party to another without going through a financial
institution. This definition suggests that Bitcoin is mainly used as an alternative currency. However,
Bitcoin can also be used as an asset and thus would serve a different purpose. Whilst currency be
characterized as a medium of exchange, a unit of account and a store of value, an asset does generally
not possess the first two features and can be clearly distinguished from a currency. Hence, this paper
analyses the question of whether Bitcoin is currency or an asset and more specifically, what is its
current usage and what usage will most likely prevail in the future given its characteristics?
If Bitcoin is mainly used as a currency to pay for goods and services, it will compete with fiat
currency such as the US dollar and thus influence its value and ultimately monetary policy. If, on the
other hand, it will mainly be used as an investment, it will compete with other assets such as
government bonds, stocks and commodities among others and potentially influence the financial
system and financial stability. Whether it is currency or an asset, the potential to influence the
economy as a whole depends on the success of Bitcoin or similar alternatives compared to existing
currencies and financial assets.
To answer the question of whether Bitcoin is currency or an asset, we analyse the value of Bitcoins’
financial characteristics relative to a large number of different assets and the usage of Bitcoins; i.e.
are Bitcoins mainly used as an investment or as an alternative currency to pay for goods and services?
We find that Bitcoins are mainly used as a speculative investment despite or due to its high volatility
and large returns. Interestingly, Bitcoin returns are essentially uncorrelated with all major asset
classes which offers large diversification benefits. This low correlation, if stable and constant over
time, would also imply low risk from a macro perspective. For example, if Bitcoins showed bubble-
like characteristics, a significant fall in the value of Bitcoins could be an isolated event if the
correlation remained at zero and thus no other assets would be affected. If, on the other hand, Bitcoin
investments were debt-financed, a significant fall in the value could lead to margin calls and then also
affect other assets (e.g. see Brunnermeier and Pedersen, 2009 and Kyle and Xiong, 2001).
2. Background
Bitcoin is designed as a decentralized peer-to-peer payment system and thus a medium of
exchange. It can be defined as synthetic commodity money (Selgin, 2015) sharing features with both
commodity monies such as gold and fiat monies such as the US dollar. Whilst commodity money is
naturally scarce and has a use other than being a medium of exchange, fiat money is not naturally
3
scarce but issued by a central bank and its main purpose is that of being a medium of exchange. In
addition, both types of money can be used as a store of value.
Bitcoin is a hybrid of commodity money and fiat money. Bitcoin is scarce by design, i.e. its scarcity
is determined by an automatic, deterministic rule fulfilled by competitive mining similar but not equal
to commodity money (e.g. gold) but its value is better characterised by fiat money as Bitcoins have
no “intrinsic” value. Another important similarity of Bitcoin with gold is its non-centrality. The
absence of counterparty risk for gold is, however, not matched by Bitcoin’s peer-to-peer payment
network.
When evaluating the potential future use and acceptance of Bitcoin it is important to analyse the
growth path of Bitcoin supply. The supply of Bitcoins is perfectly predictable and will continue to
increase in decreasing steps until 2040 and remain at the 2040 level ad infinitum. This has strong
implications for the value of Bitcoins and the potential deflationary effects it may entail. Since the
demand for Bitcoins, in contrast to its supply, is unpredictable both in the near future and beyond
2040, it is difficult to forecast the future value and usage of Bitcoins.
However, the deflationary effects that are built into the Bitcoin system make it more likely that
Bitcoins will be used as an investment than as a medium of exchange. If Bitcoins are not viewed as
an alternative currency and not used as a medium of exchange, it will not compete with fiat currency
and thus not affect the effectiveness of monetary policy. If, on the other hand, Bitcoins are seen as a
stable money benchmark and thus a medium of exchange, it may influence the value of fiat currency
and ultimately monetary policy.2
Given the potential influence of Bitcoins on fiat money and thus on monetary policy, central banks
and regulatory authorities carefully monitor the future developments of Bitcoin and other “virtual
currencies”.
3. Data
Our analysis of the return properties of Bitcoin uses daily data between July 2010 and June 2015.
We use the WinkDex data as the daily exchange rate of Bitcoin to US dollar (USD) from the WinkDex
website (https://winkdex.com/). According to the website, the WinkDex is calculated by blending the
trading prices in US dollars for the top three (by volume) qualified Bitcoin Exchanges.
All other return data comes from Bloomberg. We base our analysis on excess returns over the 3-
month Treasury bill rate, which is also obtained from Bloomberg. Table 1 lists the assets that we
2 If Bitcoin prices were stable and thus quasi-fixed to the US dollar, Gresham’s law may become relevant. The law
predicts changes in the relative values of two alternative monies labeled “good money” and “bad money”. Changes in
the relative values can lead to a crowding out effect of the “good money” making the “bad money” a medium of
exchange and the “good money” a store of value.

4
analyse against Bitcoin. These assets include US equities, precious metals, commodities, energy,
bonds and currencies.
[INSERT TABLE 1 HERE]
For the analysis of Bitcoin users, we use Bitcoin transaction data from Kondor et al. (2014) as
available on their website.3 The data are actual transactions originating from the public Bitcoin ledger.
The dataset contains the complete set of individual Bitcoin transactions that have the timestamp,
amount transacted, and sending and receiving address IDs (i.e. the Bitcoin wallet addresses). The data
also consolidates individual wallets to unique users based on when multiple wallets are used to send
Bitcoin.4 We also remove users that only make two trades within an hour with an ending balance of
less than 100 Satoshi5 as these appear to be ‘change addresses’ as Meiklejohn et al. (2013) identify.
The sample period is from the first Bitcoin transaction on 9th January 2009 to 28th December 2013.
4. Bitcoin Returns compared with other Assets
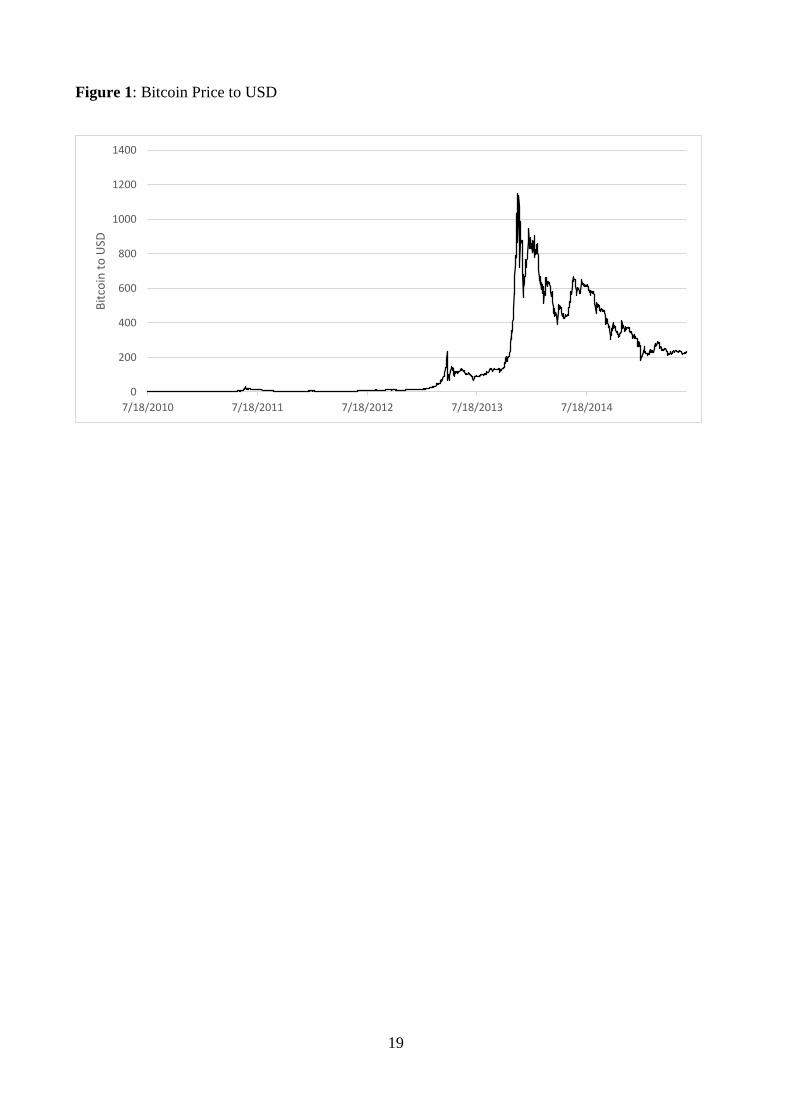
In this section we compare the return properties of Bitcoin to other assets. As a first step, Figure 1
shows the Bitcoin price in USD over the sample period. As can be seen, the Bitcoin has experienced
a dramatic increase from $5.28 at the beginning of the sample period and ending at $388.55. Bitcoin
has been very volatile with several large falls over the sample period. One example is when Bitcoin
hit its peak price of $1150.75 on 30/11/13 and fell to $547.53 on 18/12/13. An even larger magnitude
fall in Bitcoin happened in April 2013.
[INSERT FIGURE 1 HERE]
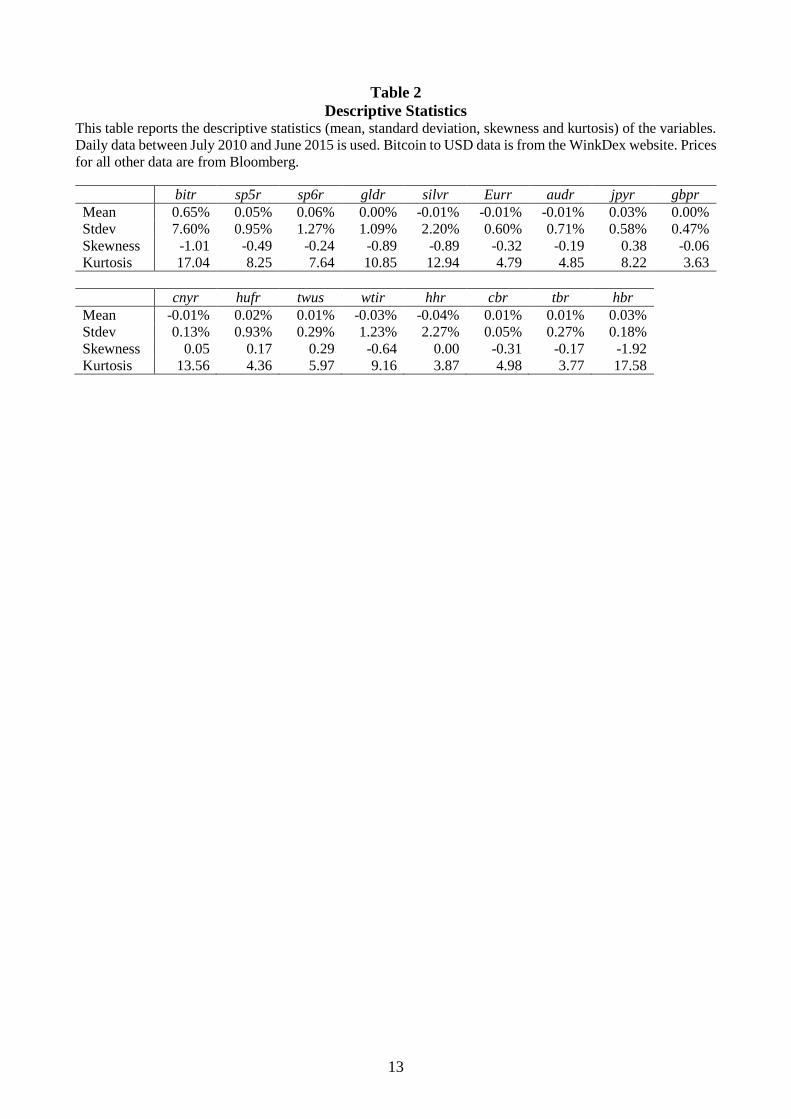
Table 2 reports descriptive statistics for the returns of Bitcoin and other asset classes. We find that
Bitcoin returns exhibit the highest return and standard deviation (or volatility) compared to the returns
of the other 16 assets. As such, the level of historical return and volatility is not comparable to any
other asset. The Bitcoin returns also show very high negative skewness and very high kurtosis. Large
negative skewness is comparable to the skewness of high yield corporate bonds, gold and silver
returns. Such large negative skewness indicates the asymmetric Bitcoin return distribution and that
the tails on the left side of the distribution is longer or fatter than the right side. Moreover, Bitcoin
3 http://www.vo.elte.hu/Bitcoin/default.htm 4 Such consolidation will still overestimate the number of unique users as unrelated wallets may be held by a user. 5 1 Satoshi is 100 millionth of a Bitcoin.

5
returns exhibit extremely high kurtosis compared with other assets. This indicates a greater number
of tail events in Bitcoin returns.
[INSERT TABLE 2 HERE]
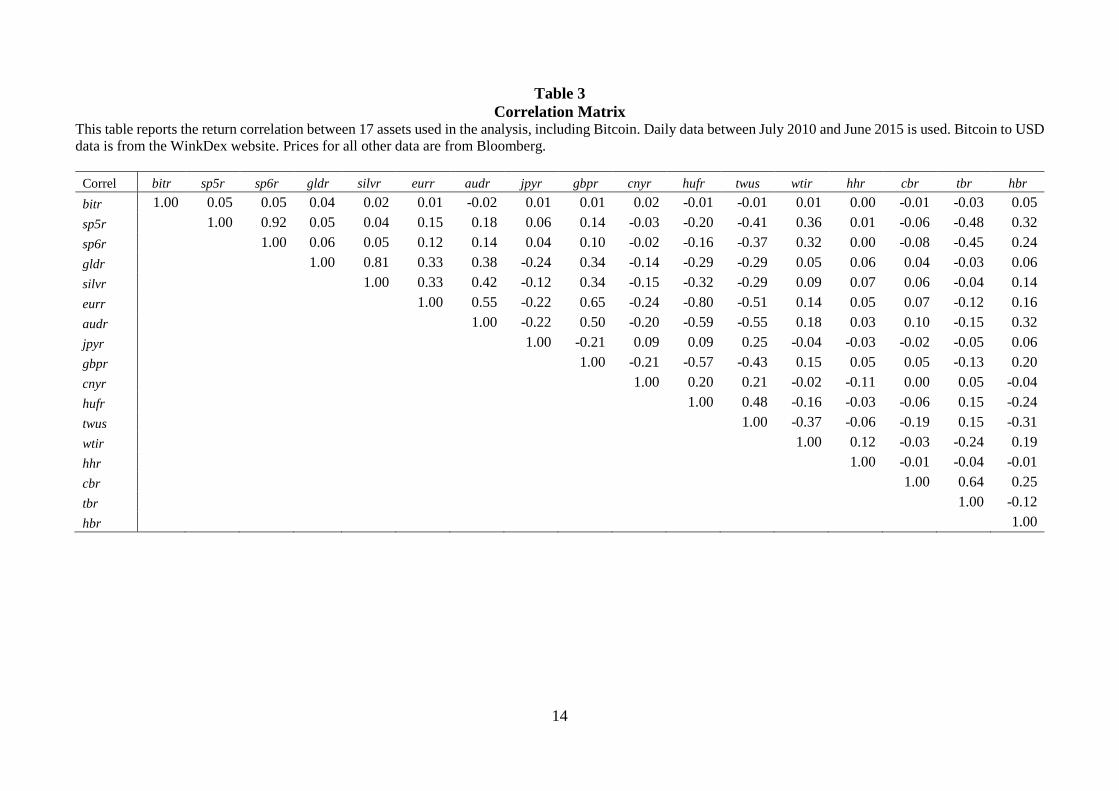
We report correlations between Bitcoin returns and other asset returns in Table 3. Consistent with
Yermack (2013), it is evident that Bitcoin returns are not correlated with any of the analysed asset
returns. Bitcoin displays the largest positive correlation (0.05) with the S&P500 and S&P600 stock
indices and high-yield corporate bonds and the lowest negative correlations at (-0.03) with the US
Treasury Bond index (tbr). No other asset exhibits such weak correlations with other assets across
the board. Overall, we conclude that Bitcoin is different from all traditional assets we investigated.
[INSERT TABLE 3 HERE]
Since Bitcoin is relatively young and volatile, it would not be surprising if Bitcoin returns showed
some predictability and thus potential inefficiencies. Indeed, the Box-Pierce and Ljung-Box tests
show highly significant test statistics at the 1% level indicating the presence of autocorrelation.
Moreover, the first-lag return autocorrelation is 0.058 and statistically different from zero at the 1%
level of significance. Figure 2 presents the 120-day rolling first-lag autocorrelation coefficient and
the associated 10% critical values (grey vertical lines) and shows that Bitcoin return predictability is
time-varying with values regularly above 0.25 and on two occasions even reaching values above 0.8.
The results suggest that there are significant profit opportunities for momentum traders.
[INSERT FIGURE 2 HERE]
Bitcoin is often compared to gold since it shares some crucial characteristics such as the limited
supply and supply growth through mining and the non-centrality and independence of central banks.
Since Bitcoin is segmented from the current fiat money system, it is also possible that it is considered
to be a safe haven against financial turmoil or against the collapse of the financial system despite its
excess volatility compared to other currencies and gold. Arguments for Bitcoin as a safe haven are
that Bitcoin does not yet play an important role in the financial system and thus may be uncorrelated
with extreme negative stock returns and financial system turmoil. Moreover, Bitcoin could function
as an alternative to a rapidly depreciating currency and serve as a temporary store of value.
6
However, the scatter plot of Bitcoin returns and S&P500 returns in Figure 3 indicates that there is
no inverse relationship between negative S&P500 returns and positive Bitcoin returns. More
specifically, for negative or extreme negative S&P500 returns, Bitcoin does not systematically yield
positive returns which renders Bitcoin not a safe haven asset. This conclusion derived from a visual
inspection is confirmed by a regression analysis of Bitcoin returns on S&P500 returns and interaction
terms with dummies for extreme values of S&P500 returns. The estimation results are presented in
Table 4 and show that Bitcoin is both uncorrelated with the S&P500 on average and in periods of
extreme losses. This empirical finding of Bitcoin not being a strong safe haven is also consistent with
the excess volatility of Bitcoin and indications that assets with no history as a safe haven asset are
unlikely to be considered “safe” in an economic or financial crisis.
[INSERT FIGURE 3 HERE]
[INSERT TABLE 4 HERE]
5. Bitcoin User Analysis
In this section we classify Bitcoin users into user types and investigate the wallet characteristics
of these user types. We categorise user types to determine whether Bitcoin is predominantly used for
investing or as a currency. Section 5.1 shows how we classify user types; Section 5.2 reports the total
Bitcoin balance and Section 5.3 reports wallet characteristics of the user types (mean balance, number
of transactions and transaction size).
5.1 Categorising User Types
We define users into four categories by their lifetime activity up to the balance date:
Active investor - More than two transactions and only sends Bitcoin in greater than USD$2,000
transactions.
Receive only investor - More than two transactions and only receives Bitcoin in greater than
USD$100 transaction with no sending of Bitcoin; or has made only one receiving Bitcoin transaction
of greater than USD$100.
Currency user - Makes more than one transaction, has made both sending and receiving
transactions and sending transaction sizes are less than USD$2,000.
Hybrid user - All other users not categorised.
Tester - Makes only one transaction of less than USD$100.

7
Bitcoin transaction sizes in USD use the Bitcoin to USD price on the day of the transaction as per
Mt Gox or WinkDex’s trade-weighted price. Prior to 16th July 2010 we set all transaction as being
worth USD$0 as there is no USD exchange price during this period.
Our categorisation system attempts to distinguish between those users that are investing in Bitcoin
by building up Bitcoin balances over time and either not sending Bitcoin (receive only investor) or
only making large send transactions (active investor). In contrast, users that send small amounts of
Bitcoins are exchanging Bitcoin for goods and services (currency user). We also group users that are
just testing the system and so are neither investors nor currency users (tester) and those that appear
to do both currency and investing (hybrid user).
We take three snapshots of user type balances on 31/12/11, 31/12/12 and 28/12/13 (the end of our
sample period). We use these three snapshots to see whether there are trends in users purely investing
or using Bitcoin as a medium of exchange.
5.2 Total Bitcoin Balances of User Types
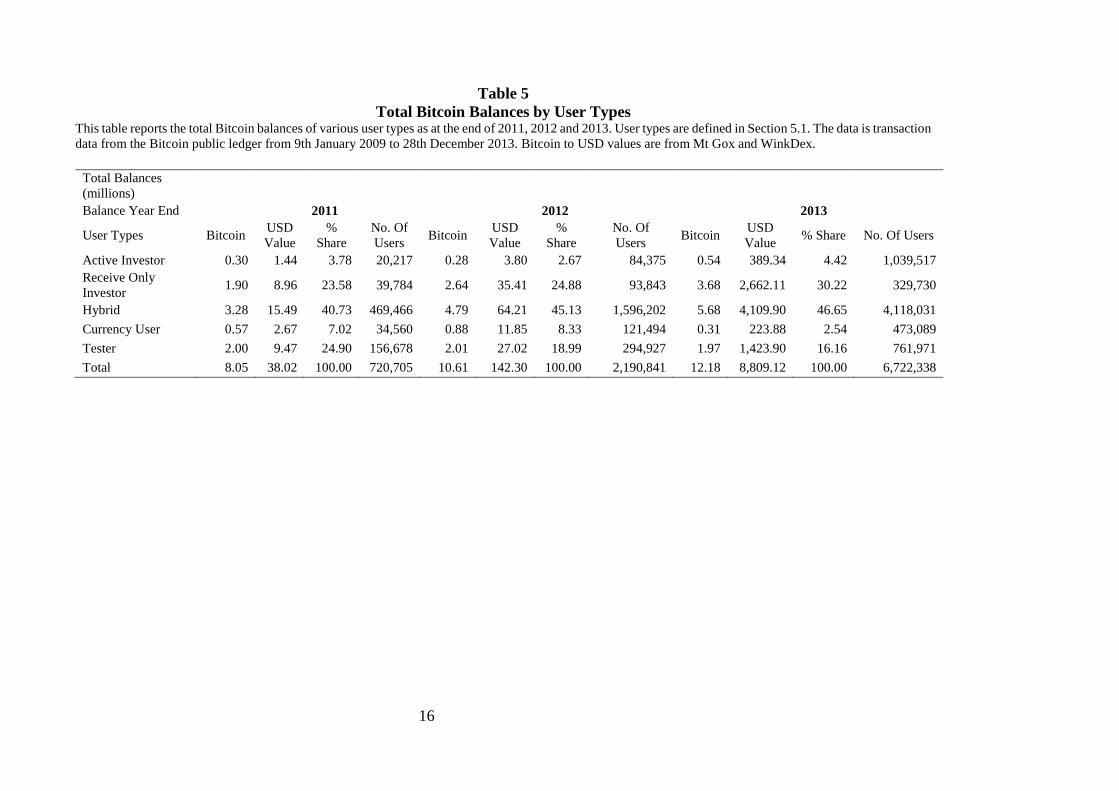
Table 5 reports the total Bitcoin balances in Bitcoin and USD across user types for our three
snapshot dates. Total Bitcoin value in USD has risen dramatically due to the rapid rise in price of
Bitcoin and from the mining of Bitcoin which increases the total number of Bitcoins available. The
total value in USD as at the end of 2013 is $8.8 billion dollars which is small relative to other assets
such as shares where trillions of dollars are invested.
[INSERT TABLE 5 HERE]
We find that the active investor, receive only investor and hybrid user group total holdings have
increased over time while Bitcoin currency user and tester have fallen over time. There has also been
a dramatic increase in users over time from 720,705 users as at the end of 2011 to 6.7 million users
as at the end of 2013. The largest group of users by share of Bitcoin and user numbers are hybrid
from 41% in 2011 to 47% in 2013 which is expected as hybrid users would consist of merchants and
consumers who hold Bitcoin to purchase goods and services.
The second largest user type is receive only investors who hold 30.22% of all Bitcoins as at 2013
end despite being the smallest group by user numbers. The fact that such users remain dominant
strongly suggests that Bitcoin is mainly a vehicle for investment rather than for trade and has
continued to be as such during our sample period.
Tester is a large group although its share of balances has fallen from 24.90% at 2011 end to 16.16%
at the end of 2013. Such a fall is expected as Bitcoin gains recognition over time. However currency

8
user holdings declined from 7.02% of total Bitcoins in 2011 to 2.54% in 2013 which suggests that
Bitcoin’s usage purely for purchasing goods and services has diminished. Whether this is related to
the volatility of Bitcoin in 2013 remains for future research. We conclude that there are very few
users that use Bitcoin purely as a medium of exchange and a dominant group of users that use Bitcoin
purely for investment.
5.3 User Type Bitcoin Wallet Characteristics
In this section we investigate the wallet characteristics of our user group classifications. First, at
the individual user level, we calculate the mean wallet characteristic across all transactions until the
snapshot date. Then we calculate statistics based on the user mean wallet characteristics for each user
type.
Table 6 reports mean and standard deviations of individual user wallet characteristics for various
user types and as at the end of our snapshot periods. The wallet characteristics are user mean Bitcoin
balances in USD (Panel A), user mean number of Bitcoin trades (Panel B) and user mean transaction
size (Panel C).
[INSERT TABLE 6 HERE]
In Table 6 Panel A we find receive only investors have the largest mean and standard deviation of
balances amongst all groups over all time snapshots. Active investors and currency users keep small
balances. Testers keep small balances prior to 2012 although in 2013 their balances are larger
reflecting early adopters who only did one trade when the Bitcoin price was low. Overall we find that
receive only investors while a small group in number, tend to hold large balances compared with other
groups.
In Table 6 Panel B we find that currency users trade the most frequently having a mean of 43.27
trades as at 2013. Active investors trade the least of all groups, even compared with buy only investors.
Combined with evidence in Table 6 Panel A this suggests that active investors appear to be ‘all-in’
investors rather than active traders of Bitcoin. Hybrid users have the largest standard deviation in
number of Bitcoin transactions of up to 4,593.90 as at 2013 end suggesting that some of these users
captured are merchants.
In Table 6 Panel C we find that active investors make large transactions with a mean transaction
size of $18,120 and standard deviation of $156,325.10. This group thus appears to make large
receiving and sending transactions to enter and completely exit out of Bitcoin. Currency users have
the second smallest transaction sizes consistent with consumers making many small transactions in

9
order to purchase goods and services. Hybrid users as at 2011 made larger transactions than receive
only investors although by 2013 the mean and standard deviation of transaction sizes are similar.
Finally, we relate changes in the Bitcoin balances of user types to the past return performance of
Bitcoin and the volatility of Bitcoin returns. Regressions of changes in Bitcoin balances for each user
type on lagged daily returns and their extreme realizations (1%, 5%, 10% and 90%, 95% and 99%
quantiles) and on lagged volatility show that active investors increase their holdings after large
positive returns and reduce their holdings after large negative returns. Lagged volatility also leads to
a reduction of active user holdings. In contrast, the user type receive only investors do not react to
any measure of lagged returns and volatility. All coefficient estimates are statistically insignificant.
Currency users react to positive lagged returns and lagged daily volatility with a reduction in their
holdings. Hybrid users reduce their balance with lagged positive returns and increase their balances
with lagged negative returns. Finally, testers decrease (increase) their holdings with large positive
(negative) returns on the previous day and positive returns in the past week. Lagged daily or weekly
volatility exhibit a positive influence on Bitcoin holdings. These findings lead to the conclusion that
the user groups display wallet characteristics consistent with the user classifications and that Bitcoin
is rather a speculative asset than an alternative currency and money.
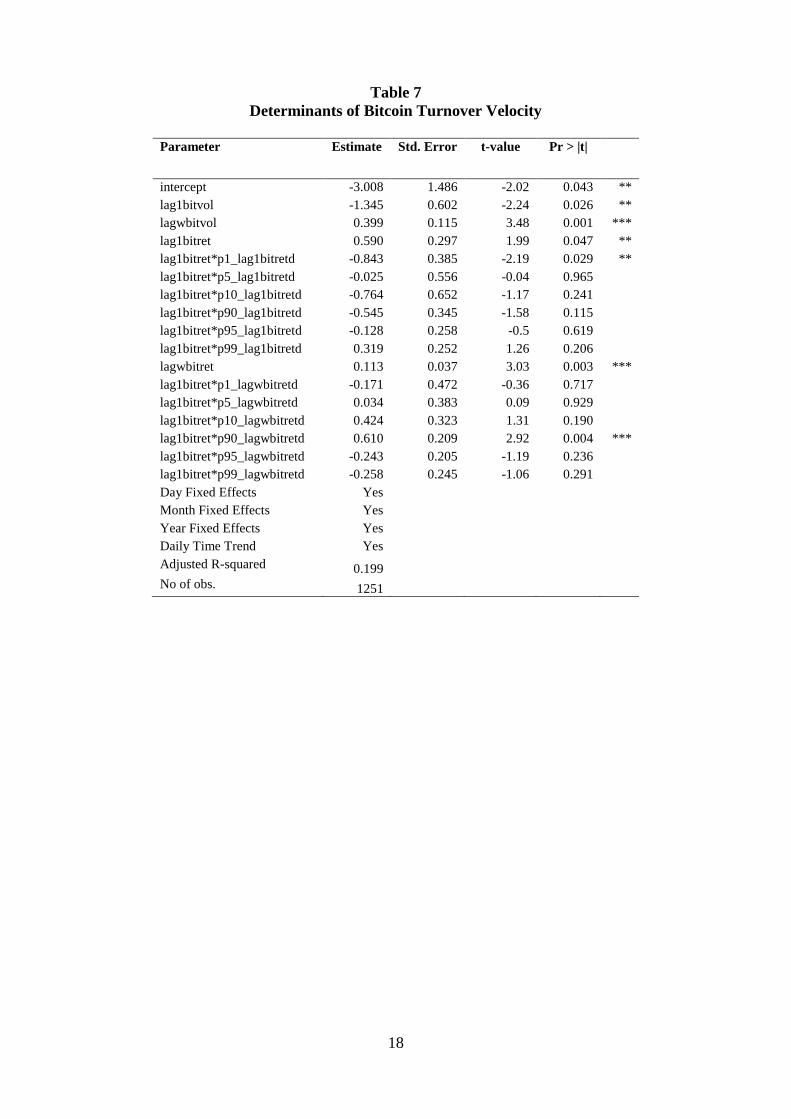
5.4 Turnover velocity
Turnover velocity (TV) is the turnover over the supply of Bitcoin. It is generally used to work out
how often the entire stock market is turned over. Consequently, a high TV means that there is
considerable trading relative to the size of the market. Since the Bitcoin supply grows at a steady pace,
by using TV we adjust for this natural growth by using supply as the denominator.6 TV may be seen
as a measure of liquidity. If the liquidity is positively related to past extreme returns or volatility it
suggests speculative trading rather than transactional motives. In Table 7 we regressed TV on
different realizations of extreme Bitcoin returns on the previous day (one lag) or the previous week.
Both lagged volatility and lagged returns increase the next day’s or next week’s TV pointing to the
dominance of momentum and speculative traders as opposed to users who want to use Bitcoin as a
currency and medium of exchange.
[INSERT TABLE 7 HERE]
6 The average TV varies significantly around the mean of 0.14 with a standard deviation of 0.29 and a maximum value
of 4.46 reached in September 2012.
10
6. Conclusion
Bitcoin’s intended purpose is as a medium of exchange but it may also be used as an asset and
investment. We find Bitcoin return properties are very different from traditional asset classes and thus
offer great diversification benefits. Analysing the Bitcoin public ledger, we find about a third of
Bitcoins are held by investors, particularly users that only receive Bitcoin and never send to others.
A minority of users, both in number and Bitcoin balances, appear to use Bitcoin as a medium of
exchange. This suggests that at present Bitcoins are held for investment purposes rather than being
used for transactions. Whether the evidence towards investment rather than currency and thus a
medium of exchange is due to the volatility of Bitcoin is a matter for future research.
Since the size of Bitcoin investments and transactions can be characterised as small relative to
other assets we do not see an immediate risk or even threat for financial or monetary stability.
However, we believe it is important to emphasise that this conclusion is based on its size. If the
acceptance of Bitcoin or similar “virtual currencies” increased significantly on a global level, it could
affect the behaviour of consumers and producers and as a consequence change the relevance of
monetary policy. Given Bitcoin’s global decentralized nature and independence from any central
bank or supranational authority, regulatory oversight may be difficult and challenging.

11
References
Böhme, R., Christin, N., Edelman, B. and T. Moore (2015). Bitcoin: Economics, Technology, and
Governance, Journal of Economic Perspectives, 29(2), 213-38.
Brunnermeier, M. K., and Pedersen, L. H. (2009). Market Liquidity and Funding Liquidity, Review
of Financial Studies, 22, 2201–2238.
Kondor, D., M. Pósfai, I. Csabai, and G. Vattay, 2014, Do the rich get richer? An empirical analysis
of the Bitcoin transaction network, PloS one 9, e86197.
Kyle, A. S. and Xiong, W. (2001). Contagion as a Wealth Effect, Journal of Finance 56, 1401–1440.
Meiklejohn, S., M. Pomarole, G. Jordan, K. Levchenko, D. McCoy, G. M. Voelker, and S. Savage,
2013, A fistful of Bitcoins: Characterizing payments among men with no names, Proceedings
of the 2013 conference on Internet measurement conference (ACM).
Nakamoto, S., 2008, Bitcoin: A peer-to-peer electronic cash system, Unpublished manuscript,
retrieved from https://Bitcoin.org/Bitcoin.pdf.
Selgin, G., 2015, Synthetic commodity money, Journal of Financial Stability, 17, 92 - 99.
Yermack, D., 2013, Is Bitcoin a real currency? An economic appraisal, Working paper, NBER.

12
Table 1
Variable list This table reports the list of 17 variables, explanation of the variables and the asset classes of the variables
used in this analysis.
Variable Explanation Asset Class
bitr WinkDex (Bitcoin exchange rate index)
sp5r S&P500 (US equity index) Equity
sp6r S&P600 (US equity index) Equity
gldr Gold Spot Precious Metal
silvr Silver Spot Precious Metal
eurr EUR USD (Euro to US Dollar exchange rate) Currency
audr AUD USD (Australian Dollar to US Dollar exchange rate) Currency
jpyr JPY USD (Japanese Yen to US Dollar exchange rate) Currency
gbpr GBP USD (British Pounds to US Dollar exchange rate) Currency
cnyr CNY USD (Chinese Yuen to US Dollar exchange rate) Currency
hufr HUF USD (Hungarian Forint to US Dollar exchange rate) Currency
twus Trade weighted US dollar index Currency
wtir WTI 1 month (Crude oil index) Energy
hhr HH 1 month (Natural gas index) Energy
cbr Bloomberg US Corporate Bond Index Bond
tbr Bloomberg US Treasury Bond Index Bond
hbr Bloomberg USD High Yield Corporate Bond Index Bond
13
Table 2
Descriptive Statistics This table reports the descriptive statistics (mean, standard deviation, skewness and kurtosis) of the variables.
Daily data between July 2010 and June 2015 is used. Bitcoin to USD data is from the WinkDex website. Prices
for all other data are from Bloomberg.
bitr sp5r sp6r gldr silvr Eurr audr jpyr gbpr Mean 0.65% 0.05% 0.06% 0.00% -0.01% -0.01% -0.01% 0.03% 0.00%
Stdev 7.60% 0.95% 1.27% 1.09% 2.20% 0.60% 0.71% 0.58% 0.47%
Skewness -1.01 -0.49 -0.24 -0.89 -0.89 -0.32 -0.19 0.38 -0.06
Kurtosis 17.04 8.25 7.64 10.85 12.94 4.79 4.85 8.22 3.63
cnyr hufr twus wtir hhr cbr tbr hbr
Mean -0.01% 0.02% 0.01% -0.03% -0.04% 0.01% 0.01% 0.03%
Stdev 0.13% 0.93% 0.29% 1.23% 2.27% 0.05% 0.27% 0.18%
Skewness 0.05 0.17 0.29 -0.64 0.00 -0.31 -0.17 -1.92
Kurtosis 13.56 4.36 5.97 9.16 3.87 4.98 3.77 17.58
14
Table 3
Correlation Matrix This table reports the return correlation between 17 assets used in the analysis, including Bitcoin. Daily data between July 2010 and June 2015 is used. Bitcoin to USD
data is from the WinkDex website. Prices for all other data are from Bloomberg.
Correl bitr sp5r sp6r gldr silvr eurr audr jpyr gbpr cnyr hufr twus wtir hhr cbr tbr hbr
bitr 1.00 0.05 0.05 0.04 0.02 0.01 -0.02 0.01 0.01 0.02 -0.01 -0.01 0.01 0.00 -0.01 -0.03 0.05
sp5r 1.00 0.92 0.05 0.04 0.15 0.18 0.06 0.14 -0.03 -0.20 -0.41 0.36 0.01 -0.06 -0.48 0.32
sp6r 1.00 0.06 0.05 0.12 0.14 0.04 0.10 -0.02 -0.16 -0.37 0.32 0.00 -0.08 -0.45 0.24
gldr 1.00 0.81 0.33 0.38 -0.24 0.34 -0.14 -0.29 -0.29 0.05 0.06 0.04 -0.03 0.06
silvr 1.00 0.33 0.42 -0.12 0.34 -0.15 -0.32 -0.29 0.09 0.07 0.06 -0.04 0.14
eurr 1.00 0.55 -0.22 0.65 -0.24 -0.80 -0.51 0.14 0.05 0.07 -0.12 0.16
audr 1.00 -0.22 0.50 -0.20 -0.59 -0.55 0.18 0.03 0.10 -0.15 0.32
jpyr 1.00 -0.21 0.09 0.09 0.25 -0.04 -0.03 -0.02 -0.05 0.06
gbpr 1.00 -0.21 -0.57 -0.43 0.15 0.05 0.05 -0.13 0.20
cnyr 1.00 0.20 0.21 -0.02 -0.11 0.00 0.05 -0.04
hufr 1.00 0.48 -0.16 -0.03 -0.06 0.15 -0.24
twus 1.00 -0.37 -0.06 -0.19 0.15 -0.31
wtir 1.00 0.12 -0.03 -0.24 0.19
hhr 1.00 -0.01 -0.04 -0.01
cbr 1.00 0.64 0.25
tbr 1.00 -0.12
hbr 1.00

15
Table 4
Safe haven Analysis of Bitcoin Returns This table reports the estimation results testing if Bitcoin act as a safe haven if S&P500 stock returns exhibit
extreme negative returns. The results show that Bitcoin returns do not display strong safe haven
characteristics since the lower quantile interaction terms are not significantly different from zero. Bitcoins
are thus uncorrelated with S&P500 returns in normal periods and in periods of extreme negative stock
returns.
Panel A
Coefficient Std. Error t-value p-value
Intercept 0.0073 0.0018 4.16 0.00
S&P500 0.1150 0.2366 0.49 0.63
Interaction Terms
10% of S&P500 -0.0727 0.7706 -0.09 0.92
5% of S&P500 0.4257 0.8735 0.49 0.63
1% of S&P500 -0.1020 0.6361 -0.16 0.87
R-squared 0.0011
F-statistic 0.5079 on 4 and 1788 DF
p-value 0.7299
Panel B
Coefficient Std. Error t-value p-value
Intercept 0.0076 0.0017 4.38 0.00
S&P500 0.0185 0.2239 0.08 0.93
Dummies
10% of S&P500 -0.0007 0.0095 -0.08 0.94
5% of S&P500 -0.0099 0.0133 -0.74 0.46
1% of S&P500O -0.0233 0.0231 -1.01 0.31
R-squared 0.0023
F-statistic 1.0370 on 4 and 1788 DF
p-value 0.3865
16
Table 5
Total Bitcoin Balances by User Types This table reports the total Bitcoin balances of various user types as at the end of 2011, 2012 and 2013. User types are defined in Section 5.1. The data is transaction
data from the Bitcoin public ledger from 9th January 2009 to 28th December 2013. Bitcoin to USD values are from Mt Gox and WinkDex.
Total Balances
(millions)
Balance Year End 2011 2012 2013
User Types Bitcoin USD
Value
%
Share
No. Of
Users Bitcoin
USD
Value
%
Share
No. Of
Users Bitcoin
USD
Value % Share No. Of Users
Active Investor 0.30 1.44 3.78 20,217 0.28 3.80 2.67 84,375 0.54 389.34 4.42 1,039,517
Receive Only
Investor 1.90 8.96 23.58 39,784 2.64 35.41 24.88 93,843 3.68 2,662.11 30.22 329,730
Hybrid 3.28 15.49 40.73 469,466 4.79 64.21 45.13 1,596,202 5.68 4,109.90 46.65 4,118,031
Currency User 0.57 2.67 7.02 34,560 0.88 11.85 8.33 121,494 0.31 223.88 2.54 473,089
Tester 2.00 9.47 24.90 156,678 2.01 27.02 18.99 294,927 1.97 1,423.90 16.16 761,971
Total 8.05 38.02 100.00 720,705 10.61 142.30 100.00 2,190,841 12.18 8,809.12 100.00 6,722,338

17
Table 6
Bitcoin Wallet Characteristics by User Types This table reports the wallet characteristics of various user types as at the end of 2011, 2012 and 2013. User types are
defined in Section 5.1. The data is transaction data from the Bitcoin public ledger from 9th January 2009 to 28th December
2013. Bitcoin to USD values are from Mt Gox and WinkDex. Panel A reports statistics for individual account Bitcoin
balances, Panel B for number of Bitcoin trades and Panel C for transaction size across various user types.
Panel A. Bitcoin Balances in USD of User Types
2011 2012 2013
User Type Mean Std N Users Mean Std N Users Mean Std N Users
Active Investor 71.15 5,649.96 20,217 45.09 2,799.94 84,375 374.54 40,849.14 1,039,517
Receive Only
Investor 225.34 4,673.96 39,784 377.30 9,324.76 93,843 8,073.60 370,268.33 329,730
Hybrid 32.99 1,875.10 469,466 40.23 2,229.50 1596,202 998.02 72,828.99 4,118,031
Currency User 77.22 1,074.72 34,560 97.56 3,115.00 121,494 473.23 58,460.70 473,089
Tester 60.42 114.41 156,678 91.62 249.88 294,927 1,868.71 8,608.79 761,971
Panel B. Number of Bitcoin Trades by User Types
2011 2012 2013
User Type Mean Std N Users Mean Std N Users Mean Std N Users
Active Investor 3.90 39.08 20,217 2.98 6.61 84,375 3.29 18.91 1,039,517
Receive Only
Investor 10.07 30.45 39,784 12.98 57.60 93,843 11.12 39.79 329,730
Hybrid 3.27 70.70 469,466 7.03 2,941.21 1,596,202 9.38 4,593.90 4,118,031
Currency User 38.55 112.83 34,560 68.41 557.22 121,494 43.27 387.85 473,089
Tester 1.00 0.00 156,678 1.00 0.00 294,927 1.00 0.00 761,971
Panel C. Transaction Size by User Types
2011 2012 2013
User Type Mean Std N Users Mean Std N Users Mean Std N Users
Active
Investor 16,202.06 10,4261.97 20,217 8,741.47 54,424.90 84,375 18,120.06 156,325.10 1,039,517
Receive
Only
Investor
97.97 3,303.67 39,784 53.21 993.54 93,843 759.31 36,687.30 329,730
Hybrid 232.36 1,885.73 469,466 242.47 1,197.28 159,6202 672.33 33,865.47 4,118,031
Currency
User
60.01 149.68 34,560 78.20 174.53 121,494 130.14 388.84 473,089
Tester 4.02 24.80 156,678 3.53 16.56 29,4927 7.55 38.87 761,971
18
Table 7
Determinants of Bitcoin Turnover Velocity
Parameter Estimate Std. Error t-value Pr > |t|
intercept -3.008 1.486 -2.02 0.043 **
lag1bitvol -1.345 0.602 -2.24 0.026 **
lagwbitvol 0.399 0.115 3.48 0.001 ***
lag1bitret 0.590 0.297 1.99 0.047 **
lag1bitret*p1_lag1bitretd -0.843 0.385 -2.19 0.029 **
lag1bitret*p5_lag1bitretd -0.025 0.556 -0.04 0.965
lag1bitret*p10_lag1bitretd -0.764 0.652 -1.17 0.241
lag1bitret*p90_lag1bitretd -0.545 0.345 -1.58 0.115
lag1bitret*p95_lag1bitretd -0.128 0.258 -0.5 0.619
lag1bitret*p99_lag1bitretd 0.319 0.252 1.26 0.206
lagwbitret 0.113 0.037 3.03 0.003 ***
lag1bitret*p1_lagwbitretd -0.171 0.472 -0.36 0.717
lag1bitret*p5_lagwbitretd 0.034 0.383 0.09 0.929
lag1bitret*p10_lagwbitretd 0.424 0.323 1.31 0.190
lag1bitret*p90_lagwbitretd 0.610 0.209 2.92 0.004 ***
lag1bitret*p95_lagwbitretd -0.243 0.205 -1.19 0.236
lag1bitret*p99_lagwbitretd -0.258 0.245 -1.06 0.291
Day Fixed Effects Yes
Month Fixed Effects Yes
Year Fixed Effects Yes
Daily Time Trend Yes
Adjusted R-squared 0.199
No of obs. 1251
19
Figure 1: Bitcoin Price to USD
0
200
400
600
800
1000
1200
1400
7/18/2010 7/18/2011 7/18/2012 7/18/2013 7/18/2014
Bit
coin
to
USD

20
Figure 2: Rolling (4-months) autocorrelation of Bitcoin returns

21
Figure 3: Scatter plot Bitcoin returns and S&P500 returns