Embed Size (px)
Citation preview

Bissau and Lisbon Declarations: Global Lusofonia?
Luís Brites PereiraIICT/ATCG&G

What is global lusofonia?• Refers to be CPLP’s contribution to the
global partnership on development, underpinned by its 2006 Bissau declaration, which commits member states to:
1) increased mutual knowledge, so as to identify solutions to common development challenges.
2) greater inter-governmental and regional cooperation, so as to better achieve the MDGs → implies an historical/cultural as well as a geographical notion of cooperation.

…and the Lisbon Declaration?• Refers to the conclusions of the “Science
for Global Development” workshop, held in Lisbon on Sept. 29-30, under the auspices of the CGIAR, UNU and research institutions in Portuguese-speaking countries, which:
1) Recognizes common challenge of learning to use science for sustainable development, through joint endeavors, based on effective governance from inclusive economic globalization.

…and the Lisbon Declaration?
2) Maintains that governance responses to globalization are more likely to promote sustained development if they are rooted in local culture, and that shared values are critical for fostering cooperation based on trust and mutual accountability (cf. MDG8).
• Specific proposals:
a) Encourage countries to reassess their reward structure for talent so as to develop their human capital, within the frame of increased mobility of talent;

…and the Lisbon Declaration?
b) Encourage countries to devise common set of indicators to monitor national Higher Education, Science, Technology and Innovation systems, thereby contributing to more effective national ®ional governance;
c) Advocate the creation of an international forum devoted to S&T for development associating, on a voluntary basis, governmental & non-governmental bodies, and other interested institutions for further insight on these issues.

Sources & challenge• IICT (2008):
– paper & presentation by J. B. Macedo at “Science for Development” workshop;
• IICT (2007):– presented (together with paper by J.-P. Contzen) at
CPLP Development Days,– lists obstacles to six CPLP/ACP reaching the
Millennium Development Goals (MDG).• CPLP (2007):
– Challenge: CPLP remains unknown in member countries - even though it seeks to “deepen the mutual friendship” amongst them.


Response
• Promote “mutual knowledge”
Think, Communicate and Act in Portuguese: 10 years of CPLP (CPLP,
2007), which aims at increasing knowledge among the citizens of
member-states.

Table 1 MDG for CPLPI ndic 1 pov 1 hg 2 schl 3 rat 4 <5m 5 mm 6 dis 7 wat
A B ● ● ● CV ● ● ● GB ●M STP TL ● % sat 28 42 14 42 0 14 28 42
Note: satisfactory=achieved+on course Source: IICT (2007a)
key1 pov % people whose income < $1/ day (goal 1)1 hg % children <5 who suffer from hunger (goal 1)2 schl net primary schooling rate (goal 2)3 rat ratios of girls to boys in primary education (goal 3)4<5m <5 mortality rate (goal 4)5 mm maternal mortality ratio (goal 5) 6 dis prevalence of malaria (A, STP), HIV (GB) or tuberculosis (TL) (goal 6)7 wat % population using an improved drinking water source (goal 7)
achieved ● on course weak progress regressing
WBI governance indicators • Comparative governance indicators have been
widely used in the allocation of Official Development Assistance.
• Table 2 reports six usual ones for CPLP members and their reference group, relating to:
– freedom and accountability (FREE),
– stability and absence of violence (STAB),
– government efficiency (EFFIC),
– quality of regulation (QUAL REG),
– quality of justice (JUST),
– control of corruption (CORR).

Brazil (BRIC)
Angola (SSA)CVerde (SSA)
Guinea-B (SSA)Moz (SSA)STPrínc (SSA)
Timor (APacific)Portugal (EU)
Q REG JUST CORRFREE STAB EF GV
Table 2 Governance indicators in CPLP countries (compared to benchmark)
Note: Blue above, Green below, Yellow positive; Source: IICT (2007a)

Table 5 Governance indicators in fragile statesTotal % CPLP %
Civil War 16 52% A/GB 67%Conflict 7 23% TL 33%
Minor Conflict 8 26% 0%Stability 31 100% 100%Top 20% 14 19% 0%
80% 15 21% M 20%60% 15 21% CV/STP 40%40% 15 21% A 20%
Bottom 20% 14 19% GB 20%Capacity 73 100% 100% Top 20% 15 21% CV/TL/STP 50%
80% 14 19% M 17%60% 15 21% GB 17%40% 14 19% 0%
Bottom 20% 14 19% A 17%Legitimacy 72 100% 100%
Source: IICT (2007a, Annex 3) with data from Weinstein et al (2004)

Fragile and diverse but legitimate• New aid model based on budget support and result
conditionality cannot be applied to countries with weak institutions (often due to actual or latent conflicts).
• Need for new and imaginative use of combined political, technical, financial and sometimes military resources
• Need to engage with civil society and non-state actors• Weinstein et al (2004), in a report to the US Congress,
classified the 6 ACP CPLP countries. • Table 5 shows these as less stable and less
efficient but more legitimate than the average. • Such greater legitimacy cannot be ascribed to the
political and diplomatic dialogue carried out by CPLP in some of these countries because of the lack of mutual knowledge combined with divergence, dispersion and diversity (3D).

Divergence, dispersion, diversity• Figure 1 shows higher volatility in PALOP GDP per
capita (in thousands of 1990 dollars) than in SSA with catching up now being observed.
• The GDP per capita of Portugal, CPLP and world averages from 1950 until 2013, using the forecasts from the latest World Economic Outlook are shown in Figure 2. They show divergence on two counts:– the most impressive growth rate in CPLP has been
Portugal’s, which was the richest to begin with– CPLP overall has grown slower than the world
average. • Figure 3 shows the average distance between capitals
or main city and illustrates the geographical dispersion of CPLP member states.
• Implication: If strength of CPLP is diversity, need mutual knowledge

Figure 1 Volatile PALOP (1990$K)
0,8
0,9
1,0
1,1
1,2
1,3
1,4
1,5
1,6
1,7
1,8
1950
1952
1954
1956
1958
1960
1962
1964
1966
1968
1970
1972
1974
1976
1978
1980
1982
1984
1986
1988
1990
1992
1994
1996
1998
2000
2002
2004
2006
PALOP
SSA

Figure 2 GDP per capita in 1990$ Portugal, CPLP and world average
1000
3000
5000
7000
9000
11000
13000
15000
19
50
19
53
19
56
19
59
19
62
19
65
19
68
19
71
19
74
19
77
19
80
19
83
19
86
19
89
19
92
19
95
19
98
20
01
20
04
20
07
20
10
20
13
world
Portugal
CPLP
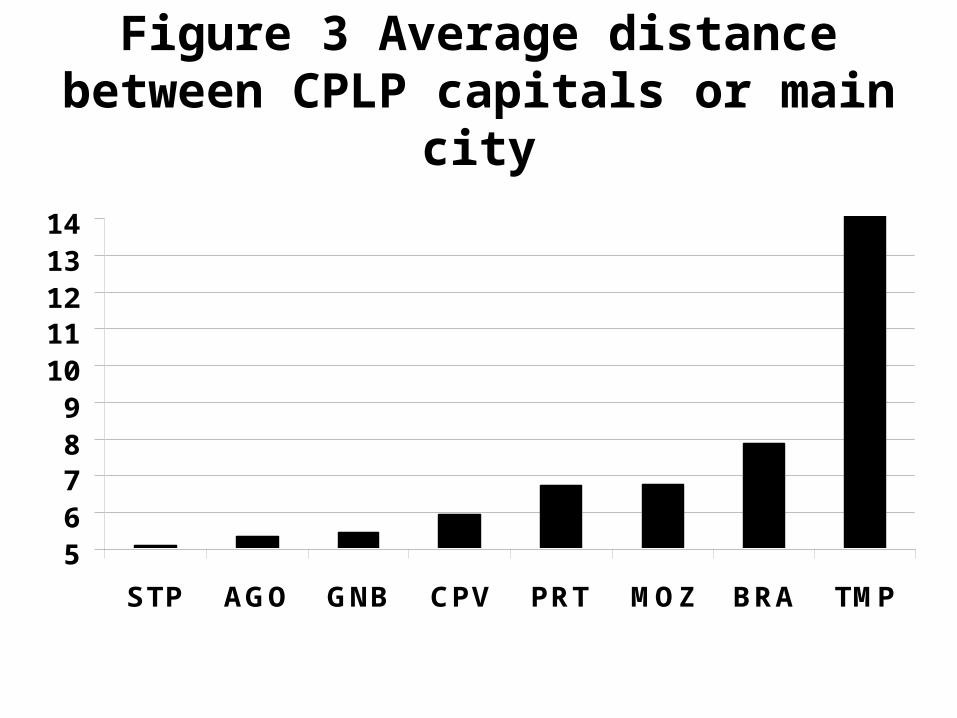
Figure 3 Average distance between CPLP capitals or main city
56789
1011121314
STP AGO GNB CPV PRT MOZ BRA TMP

Moving toward global lusofonia• CPLP has been largely absent in the international
development community, in relation to– Commonwealth – Francophonie
• Even the corresponding expression lusofonia continues to be divisive.
• Q: What is the potential of culture-based multilateralism?
• A: Depends on mutual friendship and mutual knowledge – but more on the latter
• Implication: Need an economic and business dimension, as well as a science one.