Embed Size (px)
Citation preview
BIS Working Papers No 707
Global imbalances from a stock perspective. The asymmetry between creditors and debtors by Enrique Alberola, Ángel Estrada and Francesca Viani
Monetary and Economic Department
March 2018
JEL classification: F32, F34
Keywords: global imbalances, current account, international investment position, external debt
BIS Working Papers are written by members of the Monetary and Economic Department of the Bank for International Settlements, and from time to time by other economists, and are published by the Bank. The papers are on subjects of topical interest and are technical in character. The views expressed in them are those of their authors and not necessarily the views of the BIS.
This publication is available on the BIS website (www.bis.org).
© Bank for International Settlements 2018. All rights reserved. Brief excerpts may be reproduced or translated provided the source is stated.
ISSN 1020-0959 (print) ISSN 1682-7678 (online)
WP707 Global imbalances from a stock perspective. The asymmetry between creditors and debtors 1
Global imbalances from a stock perspective. The asymmetry between creditors and debtors1
Enrique Alberola2 Ángel Estrada3 Francesca Viani3 *
Abstract
After the recent crisis, a reduction was observed in global current account (flow imbalances). Still, global disequilibria as measured in terms of countries’ net foreign assets (stock imbalances), kept increasing. This paper studies whether stock imbalances have a stabilizing or destabilizing impact on countries’ accumulation of external wealth and why. Our results show that in debtor economies the existing stock of net debt is stabilising as it helps to reduce trade imbalances, limit current account deficits and halt future debt accumulation. In creditor countries, instead, the positive stock of net foreign assets contributes – everything else equal – to increase future current account surpluses, as trade balances do not adjust, potentially leading to destabilizing dynamics in wealth accumulation. The asymmetry may have relevant implications for global trade and growth.
Keywords: global imbalances, current account, international investment position, external debt.
JEL classification: F32, F34
1 The authors would like to thank our discussants Cédric Tille and Rúben Silva, seminar and conference participants at the BIS, Banco de España, Central Bank of Chile, Banco de la Republica, Colombia, the 14th Emerging Market Workshop, the European Summer Symposium on International Macroeconomics (ESSIM), the IFABS conference, the IMF and the European Economic Association for comments and suggestions. Lucía Gusano and María Romero provided excellent research assistance. The views expressed in this paper are those of the authors and do not necessarily reflect the views of the Banco de España or the Bank for International Settlements.
2 Bank for International Settlements, Torre Chapultepec, Rubén Darío 281, 11580 México, Mexico City
3 Banco de España, Alcalá 50, 28014 Madrid, Spain.
* Corresponding author: [email protected]
2 WP707 Global imbalances from a stock perspective. The asymmetry between creditors and debtors
Table of contents
Global imbalances from a stock perspective. The asymmetry between creditors and debtors........................................................................................................................................ 1
Abstract .............................................................................................................................................. 1
1. Introduction ............................................................................................................................ 3
2. The accumulation of external wealth: main channels and stylized facts ........ 7
2.1 The main channels of wealth accumulation ........................................................ 7
2.2 Some stylised facts on wealth accumulation ...................................................... 7
3. The impact of stock positions on wealth accumulation: what theory suggests .................................................................................................................................. 13
3.1 Direct impact of stock imbalances on the CA ................................................ 13
3.2. Indirect impacts through exchange rate fluctuations ................................. 17
4. The impact of stock imbalances on the CA: empirical tests .............................. 20
4.1 Through the investment income balance .......................................................... 24
4.2 Through the trade balance ...................................................................................... 25
5. The heterogeneity between advanced and emerging countries ..................... 28
6. Are real exchange rates determined by net foreign assets?.............................. 32
7. Conclusions ........................................................................................................................... 36
Appendix 1. The dataset .................................................................................................................... 37
Appendix 2. Stylised facts on wealth accumulation – figures and tables ....................... 39
Appendix 3. Auxiliary regressions ................................................................................................... 44
Appendix 4. Detailed external balance regressions ................................................................. 46
Appendix 5. Residual balance regressions .................................................................................. 52
Appendix 6. Detailed advanced and emerging markets regressions ............................... 55
Appendix 7. Real Exchange Rate regressions............................................................................. 67
References ................................................................................................................................................ 69
Previous volumes in this series ........................................................................................................ 70
WP707 Global imbalances from a stock perspective. The asymmetry between creditors and debtors 3
1. Introduction
Prior to the Global Financial Crisis, the widening of global imbalances was perceived as one of the main risks to the global economy. While perhaps of a secondary order of importance in triggering the financial crisis, global imbalances constituted a symptom of an unsustainable pattern of global growth (Blanchard and Milesi-Ferretti [2009]) and a source of ample global liquidity and loose financial conditions that were feeding the crisis to come.
Some nine years after the outburst of the crisis, where do we stand? Has the increasing trend in global imbalances been corrected? The answer depends on how we measure them.
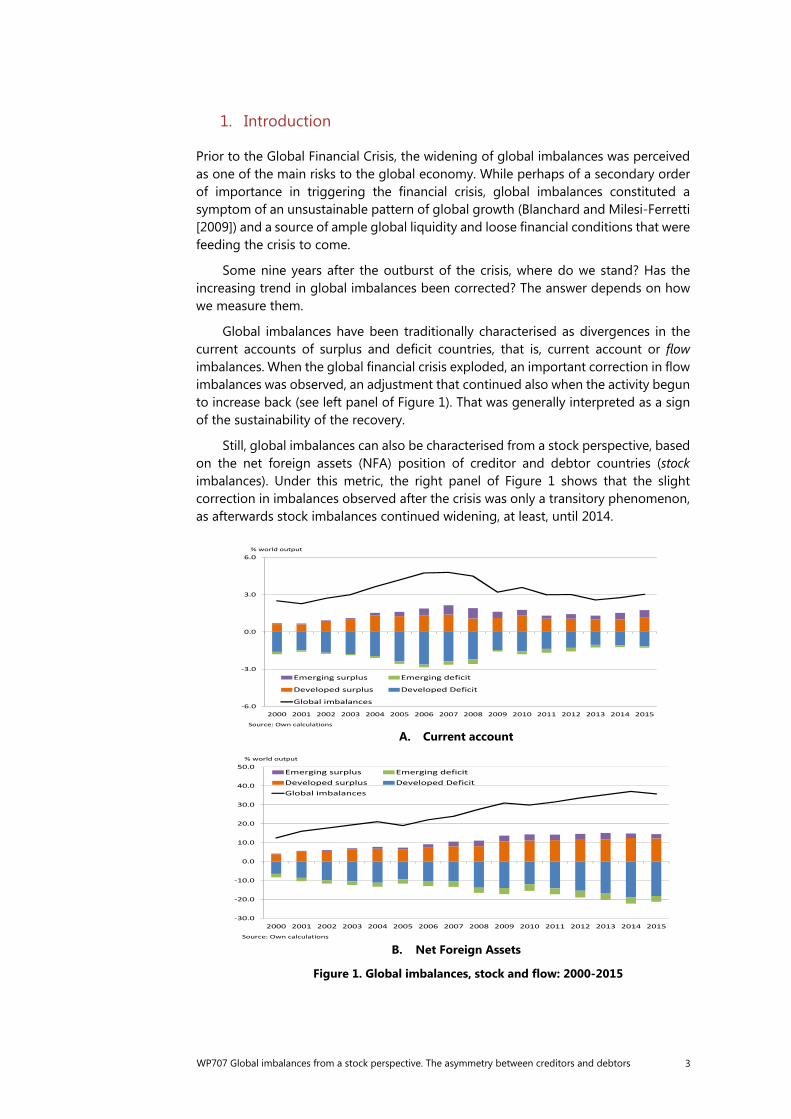
Global imbalances have been traditionally characterised as divergences in the current accounts of surplus and deficit countries, that is, current account or flow imbalances. When the global financial crisis exploded, an important correction in flow imbalances was observed, an adjustment that continued also when the activity begun to increase back (see left panel of Figure 1). That was generally interpreted as a sign of the sustainability of the recovery.
Still, global imbalances can also be characterised from a stock perspective, based on the net foreign assets (NFA) position of creditor and debtor countries (stock imbalances). Under this metric, the right panel of Figure 1 shows that the slight correction in imbalances observed after the crisis was only a transitory phenomenon, as afterwards stock imbalances continued widening, at least, until 2014.
A. Current account
B. Net Foreign Assets
Figure 1. Global imbalances, stock and flow: 2000-2015
-6.0
-3.0
0.0
3.0
6.0
2000 2001 2002 2003 2004 2005 2006 2007 2008 2009 2010 2011 2012 2013 2014 2015
Emerging surplus Emerging deficit
Developed surplus Developed Deficit
Global imbalances
% world output
Source: Own calculations
-30.0
-20.0
-10.0
0.0
10.0
20.0
30.0
40.0
50.0
2000 2001 2002 2003 2004 2005 2006 2007 2008 2009 2010 2011 2012 2013 2014 2015
Emerging surplus Emerging deficitDeveloped surplus Developed DeficitGlobal imbalances
% world output
Source: Own calculations
4 WP707 Global imbalances from a stock perspective. The asymmetry between creditors and debtors
In light of this evidence, the focus of the economic debate both in academia and policy institutions has been broadened from analysing current account imbalances to carry out a closer inspection of the implications that stock imbalances may have for external stability. Among policy institutions, the IMF, in its 2014 World Economic Outlook (IMF [2014a]), alerts against the projected widening of stock imbalances in the next years, which may leave several debtor economies exposed to market sentiments. In its External Sector Reports (IMF [2014b], IMF [2016]) the IMF also suggests the opportunity to monitor and ultimately limit the growth of stock imbalances of both debtor and creditor countries. Forbes et al. (2016) focused on the implications that large net foreign assets positions and their composition may have for the ability of an economy to respond to external shocks. Benetrix et al (2015) showed how the currency composition of countries’ net foreign assets leads them to accumulate or lose wealth through valuation effects due to exchange rate fluctuations.
The aim of this paper is to contribute to the debate on the implications of stock imbalances for external stability. The link between net external debt and the probability of financial crisis has been addressed by Catao and Milesi-Ferretti (2014). They note that high levels of net external debt increase the probability of crisis and that after the crisis there is a reversion of current account imbalances.
Our contribution is more general, exploring the impact of net external positions on their own evolution by answering two related sets of questions.
First, do stock imbalances have a stabilizing or destabilizing impact on the accumulation of external wealth? That is, do creditor countries, by virtue of their positive stock of net foreign assets, keep accumulating– everything else equal— external wealth? Do debtor countries, due precisely to their stock of external debt, keep increasing their net foreign debt over time? If this were the case, stock imbalances would lead creditor (debtors) to accumulate (lose) even more wealth in the future, and may therefore contribute to triggering destabilizing dynamics in the evolution of external wealth, in particular in debtor countries where the potential unsustainability of external positions is more evident.
It is important to note that the analysis only considers the impact of net foreign assets on the current account. While current account is the main driver of wealth accumulation, there are also valuation effects in the dynamics of external wealth which can be substantial. These effect are left aside for reasons of space, but also because, as described below, valuation effects tend to be quite erratic and probably influenced by statistical adjustments, anticipating a less clear relationship with past debt accumulation.
According to economic theory, the impact of the net external position on the current account may come through two direct channels. First, creditors, whose portfolio contains more external assets than liabilities, would tend to receive more revenues from their foreign assets than they pay on their cross-border liabilities, implying a positive income balance. This would lead to –everything else equal—current account surpluses, and to accumulate even more external wealth over time. The opposite might happen for debtor economies, which are likely to end up paying more revenues on their foreign liabilities than they get on their external assets, thus running into income balance and current account deficits and incurring in further wealth losses.
A second channel through which creditor (debtor) positions may lead to future wealth accumulation (losses) is countries’ response to cyclical positive income shocks.
WP707 Global imbalances from a stock perspective. The asymmetry between creditors and debtors 5
In this respect, it has been observed that a cyclical temporary increase in a country’s wealth lead debtor economies to run higher deficits than creditor countries. The literature has identified two mechanisms. Kraay and Ventura (2000) point out that if agents decide to invest the additional income resulting from the shock according to the portfolio they already have –skewed towards foreign assets in the case of creditors and towards domestic ones in the case of debtors— debtor economies would incur in higher current account deficits than creditors. Bussiere et al (2003) observed that if debtor countries were more credit constrained than creditor ones, they would decide to borrow more from abroad once a positive income shock partially releases their constraints, thus generating larger current account deficits.
On the other hand, economic theory also supports the hypothesis that the stock of net foreign assets might have a stabilizing impact on the accumulation of external wealth. Wealth effects should imply that wealthier, creditor countries will end up consuming and therefore importing more than poorer, debtor economies, thus reducing their trade surpluses and current account balances.
Whether stock imbalances have a stabilizing or destabilizing impact on wealth accumulation is therefore essentially an empirical question, which we seek to address in this paper.
A second, related question concerns price fluctuations due to stock imbalances. Namely, are there automatic adjustment mechanisms working through relative price adjustments that can reduce the accumulation or loss of external wealth over time? The indirect impact of stock imbalances on wealth accumulation through exchange rate fluctuations is based on the prediction that wealthier, creditor countries should record, at least in the long run, an appreciation of their exchange rate (Dornbusch and Fischer [1980], Lane and Milesi-Ferretti [2004]). The exchange rate appreciation, in turn, might impact wealth accumulation in several ways. First, it would reduce the competitiveness of creditors’ products, thus implying a shrinking in their trade and current account surplus, with an indirect stabilizing effect on the accumulation of external wealth. Second, it will likely affect the net revenues received through the income balance from the stock of external assets and liabilities, the overall impact depending on the currency composition of a country’s external wealth. Finally, exchange rate fluctuations can cause valuation changes through capital gains or losses on existing gross positions, which may either amplify or reduce a country’s wealth accumulation depending on the currency composition of its portfolio.
The second issue we address in this paper concerns precisely the importance of these adjustment mechanisms. Are they empirically relevant? Are they somewhat hampered in a context in which exchange rates might not freely respond to changes in a country’s net foreign asset position, like, for instance, a common currency area?
We address these questions empirically using Balance of Payments data from 1980 to 2015 for a set of 39 advanced and emerging market economies. As a first step, we inspect the evolution of the wealth accumulation of these countries over the last three decades by decomposing it into its main channels (trade balance and investment income balance, for the current account, and valuation effects), trying to extract some stylized facts. Then we analyse, through panel regressions of the current account and their sub-balances, the links between stock positions (net foreign assets) and the evolution of external flows, considering also other determinants of the current account, in the spirit of IMF (2013). We also check if the results depend on the country’s level of income, by estimating separate regressions for advanced and emerging economies.
6 WP707 Global imbalances from a stock perspective. The asymmetry between creditors and debtors
The results of this analysis unveil a remarkable asymmetry regarding the impact of net foreign assets on wealth accumulation: it is only for creditor countries that stock imbalances lead to destabilizing dynamics. In debtor economies, instead, the existing stock of net debt tends to limit current account deficits and to contain future debt accumulation, with a stabilizing impact. Specifically, debtor countries tend to pay more revenues on their stock of debt, but also consume and import less due to a negative wealth effect, which halts to some extent the accumulation of external debt over time. Creditor countries, instead, due to their positive stock of net foreign assets, have a tendency to run current account surpluses and to keep accumulating external wealth. This seems to be related to a weak wealth effect on imports for these economies. That is, either the marginal propensity to consume or invest out of external wealth of creditor countries is small, or there are other characteristics that do not make their imports react much to increased wealth (for instance, a high propensity to consume domestically-produced goods), and cannot compensate for the increased investment income they receive on their net foreign asset position.
As for the indirect impact through relative prices, the data suggest that the higher the stock of external wealth of creditor countries the more appreciated their exchange rate, which, in turn, should limit the size of their trade surpluses and the accumulation of further wealth. Therefore stock imbalances might have an indirect stabilizing impact on the trade balance through the real exchange rate, but only, as our results show, for creditor countries. Yet this stabilizing relationship, which seems to have been reduced for those economies that joined the Euro Area, is not sufficient to limit creditors’ wealth accumulation.
It should be clear from the onset that the purpose of this paper is purely positive. Namely, we aim at studying the impact of stock imbalances on wealth accumulation, taking also into account their indirect impact through price fluctuations. Finding that stock imbalances lead to destabilizing dynamics in wealth accumulation – as our results seem to suggest for creditor countries – would imply that any desired adjustment in flow imbalances should take this mechanism into account. Moreover, given that stock imbalances are projected to keep rising in the next years, their pattern will likely have implications for the future evolution of flow imbalances as well. However, we do not try to extract any normative conclusion from our results, neither as for the desirable size of stock imbalances nor for wealth accumulation.
Section 2 presents some stylized facts on the channels through which countries accumulate external wealth. Section 3 details the theoretical predictions of the literature regarding the impact that the stock of net foreign assets should have on wealth accumulation through each channel. In section 4 we test the empirical relevance of these effects, by estimating the impact that the stock of net foreign assets has on the current account and its sub-balances. Section 5 highlights the heterogeneity between advanced and emerging market economies. The sixth section focuses on the indirect impact that net foreign assets may have on the current account balance through the real exchange rate. We draw some conclusions in section 7.
WP707 Global imbalances from a stock perspective. The asymmetry between creditors and debtors 7
2. The accumulation of external wealth: main channels and stylized facts
2.1 The main channels of wealth accumulation
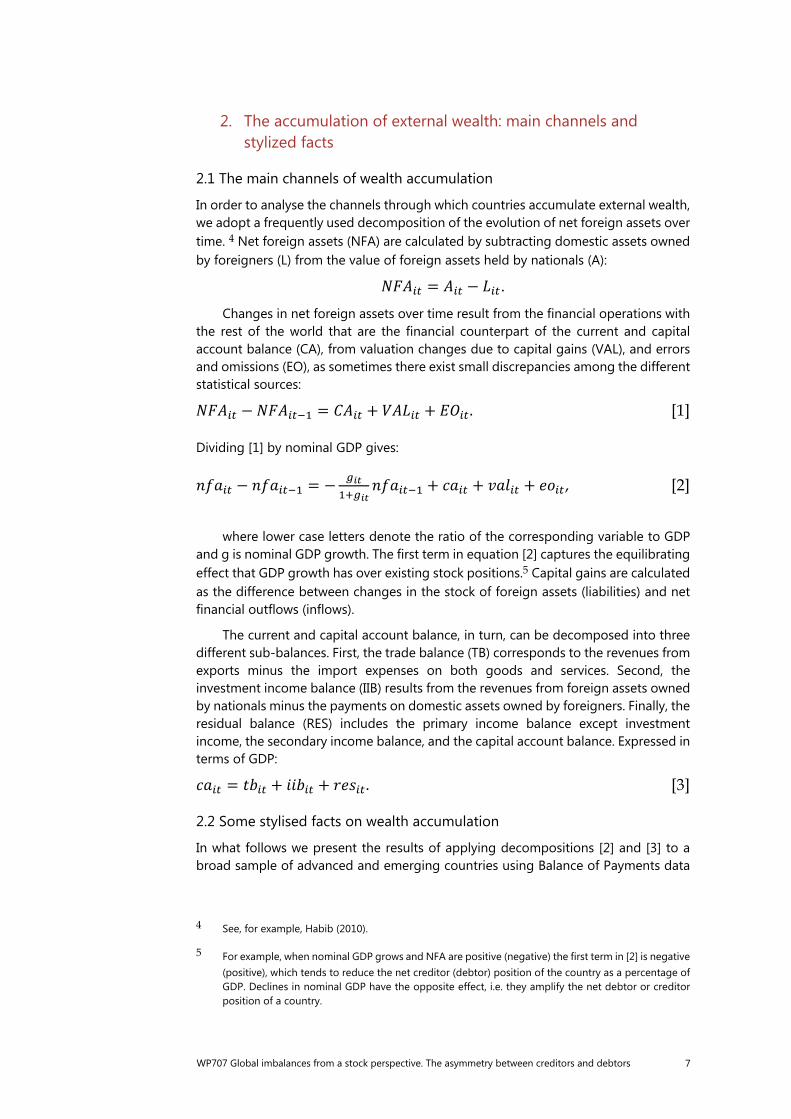
In order to analyse the channels through which countries accumulate external wealth, we adopt a frequently used decomposition of the evolution of net foreign assets over time. 4 Net foreign assets (NFA) are calculated by subtracting domestic assets owned by foreigners (L) from the value of foreign assets held by nationals (A): = − .
Changes in net foreign assets over time result from the financial operations with the rest of the world that are the financial counterpart of the current and capital account balance (CA), from valuation changes due to capital gains (VAL), and errors and omissions (EO), as sometimes there exist small discrepancies among the different statistical sources: − = + + . [1] Dividing [1] by nominal GDP gives: − = − + + + , [2]
where lower case letters denote the ratio of the corresponding variable to GDP and g is nominal GDP growth. The first term in equation [2] captures the equilibrating effect that GDP growth has over existing stock positions.5 Capital gains are calculated as the difference between changes in the stock of foreign assets (liabilities) and net financial outflows (inflows).
The current and capital account balance, in turn, can be decomposed into three different sub-balances. First, the trade balance (TB) corresponds to the revenues from exports minus the import expenses on both goods and services. Second, the investment income balance (IIB) results from the revenues from foreign assets owned by nationals minus the payments on domestic assets owned by foreigners. Finally, the residual balance (RES) includes the primary income balance except investment income, the secondary income balance, and the capital account balance. Expressed in terms of GDP: = + + . [3]
2.2 Some stylised facts on wealth accumulation
In what follows we present the results of applying decompositions [2] and [3] to a broad sample of advanced and emerging countries using Balance of Payments data
4 See, for example, Habib (2010).
5 For example, when nominal GDP grows and NFA are positive (negative) the first term in [2] is negative (positive), which tends to reduce the net creditor (debtor) position of the country as a percentage of GDP. Declines in nominal GDP have the opposite effect, i.e. they amplify the net debtor or creditor position of a country.
8 WP707 Global imbalances from a stock perspective. The asymmetry between creditors and debtors
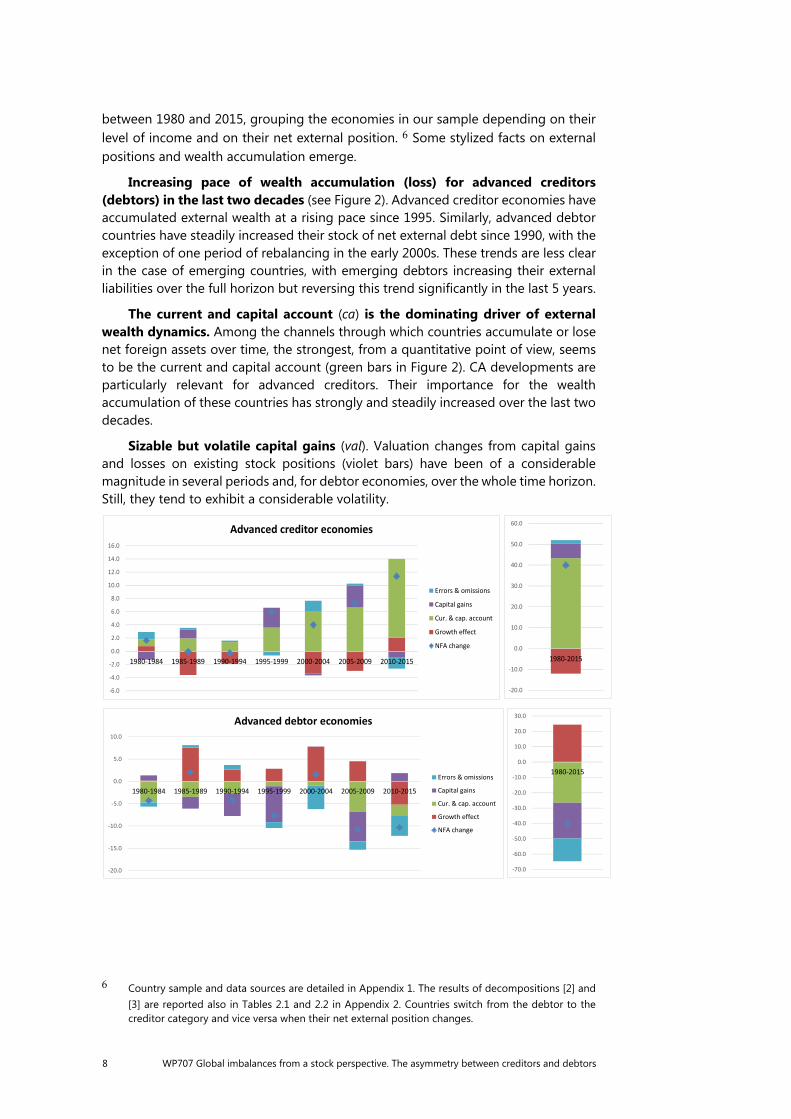
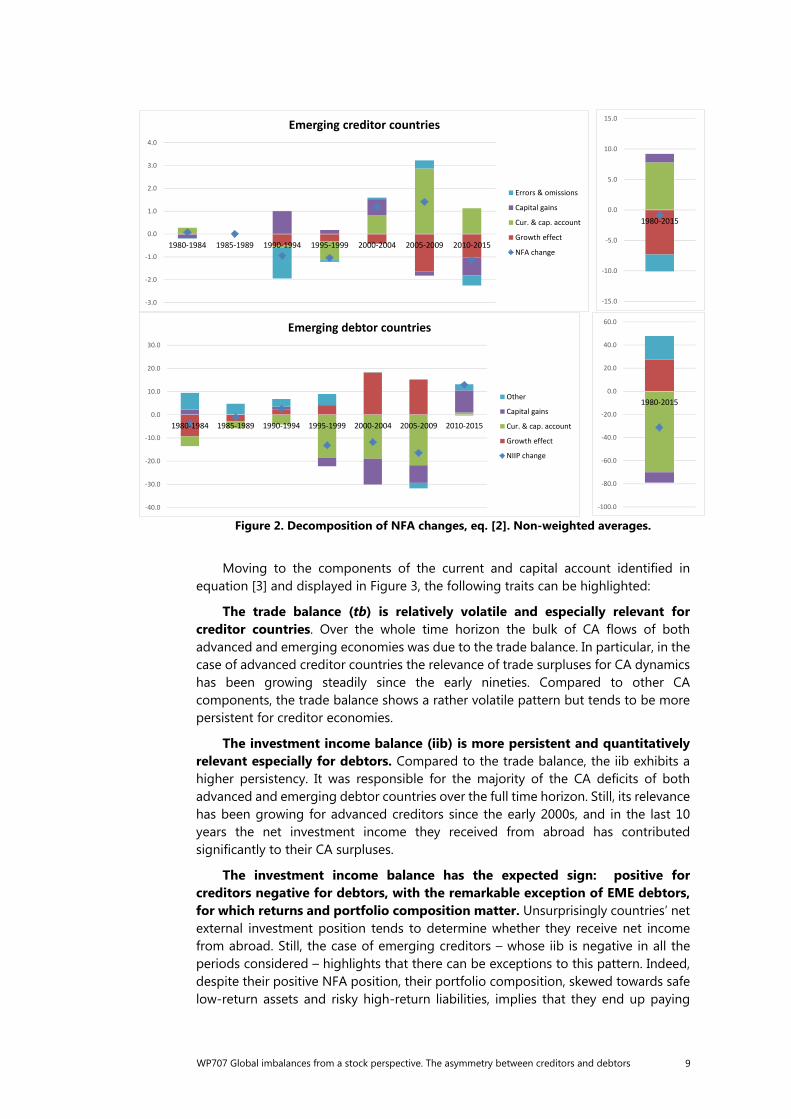
between 1980 and 2015, grouping the economies in our sample depending on their level of income and on their net external position. 6 Some stylized facts on external positions and wealth accumulation emerge.
Increasing pace of wealth accumulation (loss) for advanced creditors (debtors) in the last two decades (see Figure 2). Advanced creditor economies have accumulated external wealth at a rising pace since 1995. Similarly, advanced debtor countries have steadily increased their stock of net external debt since 1990, with the exception of one period of rebalancing in the early 2000s. These trends are less clear in the case of emerging countries, with emerging debtors increasing their external liabilities over the full horizon but reversing this trend significantly in the last 5 years.
The current and capital account (ca) is the dominating driver of external wealth dynamics. Among the channels through which countries accumulate or lose net foreign assets over time, the strongest, from a quantitative point of view, seems to be the current and capital account (green bars in Figure 2). CA developments are particularly relevant for advanced creditors. Their importance for the wealth accumulation of these countries has strongly and steadily increased over the last two decades.
Sizable but volatile capital gains (val). Valuation changes from capital gains and losses on existing stock positions (violet bars) have been of a considerable magnitude in several periods and, for debtor economies, over the whole time horizon. Still, they tend to exhibit a considerable volatility.
6 Country sample and data sources are detailed in Appendix 1. The results of decompositions [2] and [3] are reported also in Tables 2.1 and 2.2 in Appendix 2. Countries switch from the debtor to the creditor category and vice versa when their net external position changes.
-20.0
-15.0
-10.0
-5.0
0.0
5.0
10.0
1980-1984 1985-1989 1990-1994 1995-1999 2000-2004 2005-2009 2010-2015
Advanced debtor economies
Errors & omissions
Capital gains
Cur. & cap. account
Growth effect
NFA change
-70.0
-60.0
-50.0
-40.0
-30.0
-20.0
-10.0
0.0
10.0
20.0
30.0
1980-2015
-6.0
-4.0
-2.0
0.0
2.0
4.0
6.0
8.0
10.0
12.0
14.0
16.0
1980-1984 1985-1989 1990-1994 1995-1999 2000-2004 2005-2009 2010-2015
Advanced creditor economies
Errors & omissions
Capital gains
Cur. & cap. account
Growth effect
NFA change
-20.0
-10.0
0.0
10.0
20.0
30.0
40.0
50.0
60.0
1980-2015
WP707 Global imbalances from a stock perspective. The asymmetry between creditors and debtors 9
Figure 2. Decomposition of NFA changes, eq. [2]. Non-weighted averages.
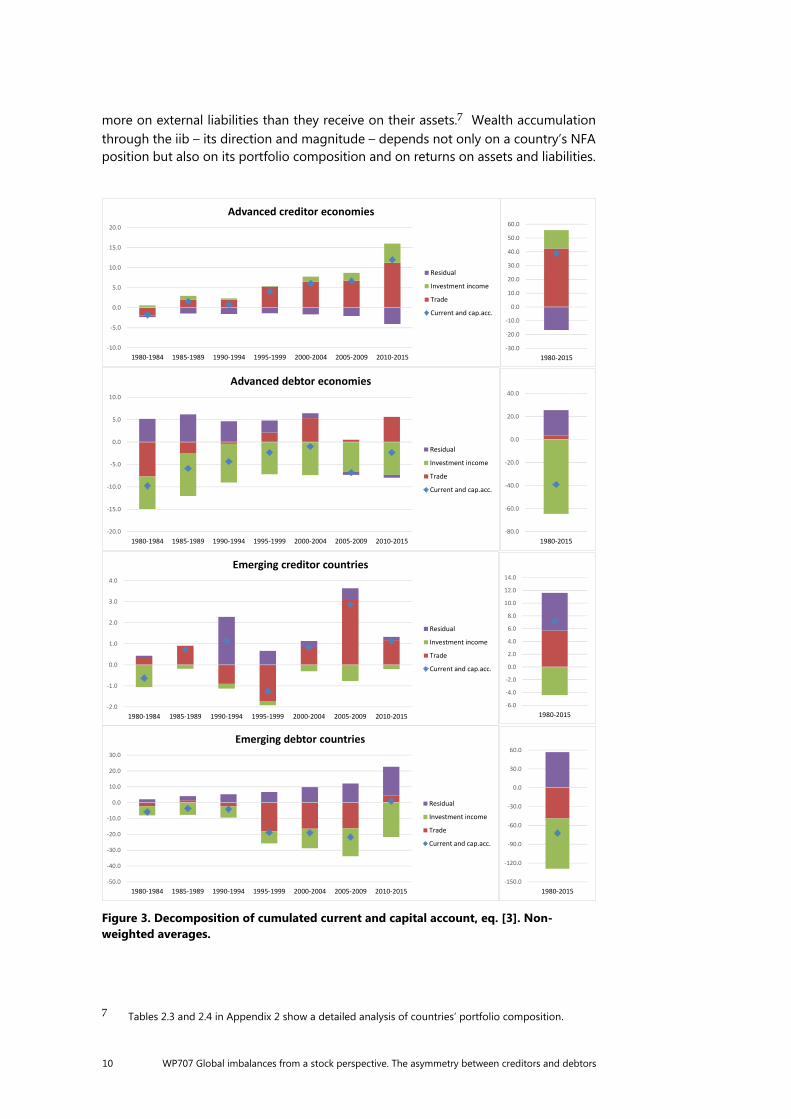
Moving to the components of the current and capital account identified in equation [3] and displayed in Figure 3, the following traits can be highlighted:
The trade balance (tb) is relatively volatile and especially relevant for creditor countries. Over the whole time horizon the bulk of CA flows of both advanced and emerging economies was due to the trade balance. In particular, in the case of advanced creditor countries the relevance of trade surpluses for CA dynamics has been growing steadily since the early nineties. Compared to other CA components, the trade balance shows a rather volatile pattern but tends to be more persistent for creditor economies.
The investment income balance (iib) is more persistent and quantitatively relevant especially for debtors. Compared to the trade balance, the iib exhibits a higher persistency. It was responsible for the majority of the CA deficits of both advanced and emerging debtor countries over the full time horizon. Still, its relevance has been growing for advanced creditors since the early 2000s, and in the last 10 years the net investment income they received from abroad has contributed significantly to their CA surpluses.
The investment income balance has the expected sign: positive for creditors negative for debtors, with the remarkable exception of EME debtors, for which returns and portfolio composition matter. Unsurprisingly countries’ net external investment position tends to determine whether they receive net income from abroad. Still, the case of emerging creditors – whose iib is negative in all the periods considered – highlights that there can be exceptions to this pattern. Indeed, despite their positive NFA position, their portfolio composition, skewed towards safe low-return assets and risky high-return liabilities, implies that they end up paying
-3.0
-2.0
-1.0
0.0
1.0
2.0
3.0
4.0
1980-1984 1985-1989 1990-1994 1995-1999 2000-2004 2005-2009 2010-2015
Emerging creditor countries
Errors & omissions
Capital gains
Cur. & cap. account
Growth effect
NFA change
-15.0
-10.0
-5.0
0.0
5.0
10.0
15.0
1980-2015
-40.0
-30.0
-20.0
-10.0
0.0
10.0
20.0
30.0
1980-1984 1985-1989 1990-1994 1995-1999 2000-2004 2005-2009 2010-2015
Emerging debtor countries
Other
Capital gains
Cur. & cap. account
Growth effect
NIIP change
-100.0
-80.0
-60.0
-40.0
-20.0
0.0
20.0
40.0
60.0
1980-2015
10 WP707 Global imbalances from a stock perspective. The asymmetry between creditors and debtors
more on external liabilities than they receive on their assets.7 Wealth accumulation through the iib – its direction and magnitude – depends not only on a country’s NFA position but also on its portfolio composition and on returns on assets and liabilities.
Figure 3. Decomposition of cumulated current and capital account, eq. [3]. Non-weighted averages.
7 Tables 2.3 and 2.4 in Appendix 2 show a detailed analysis of countries’ portfolio composition.
-10.0
-5.0
0.0
5.0
10.0
15.0
20.0
1980-1984 1985-1989 1990-1994 1995-1999 2000-2004 2005-2009 2010-2015
Advanced creditor economies
Residual
Investment income
Trade
Current and cap.acc.
-30.0
-20.0
-10.0
0.0
10.0
20.0
30.0
40.0
50.0
60.0
1980-2015
-20.0
-15.0
-10.0
-5.0
0.0
5.0
10.0
1980-1984 1985-1989 1990-1994 1995-1999 2000-2004 2005-2009 2010-2015
Advanced debtor economies
Residual
Investment income
Trade
Current and cap.acc.
-80.0
-60.0
-40.0
-20.0
0.0
20.0
40.0
1980-2015
-2.0
-1.0
0.0
1.0
2.0
3.0
4.0
1980-1984 1985-1989 1990-1994 1995-1999 2000-2004 2005-2009 2010-2015
Emerging creditor countries
Residual
Investment income
Trade
Current and cap.acc.
-6.0
-4.0
-2.0
0.0
2.0
4.0
6.0
8.0
10.0
12.0
14.0
1980-2015
-50.0
-40.0
-30.0
-20.0
-10.0
0.0
10.0
20.0
30.0
1980-1984 1985-1989 1990-1994 1995-1999 2000-2004 2005-2009 2010-2015
Emerging debtor countries
Residual
Investment income
Trade
Current and cap.acc.
-150.0
-120.0
-90.0
-60.0
-30.0
0.0
30.0
60.0
1980-2015
WP707 Global imbalances from a stock perspective. The asymmetry between creditors and debtors 11
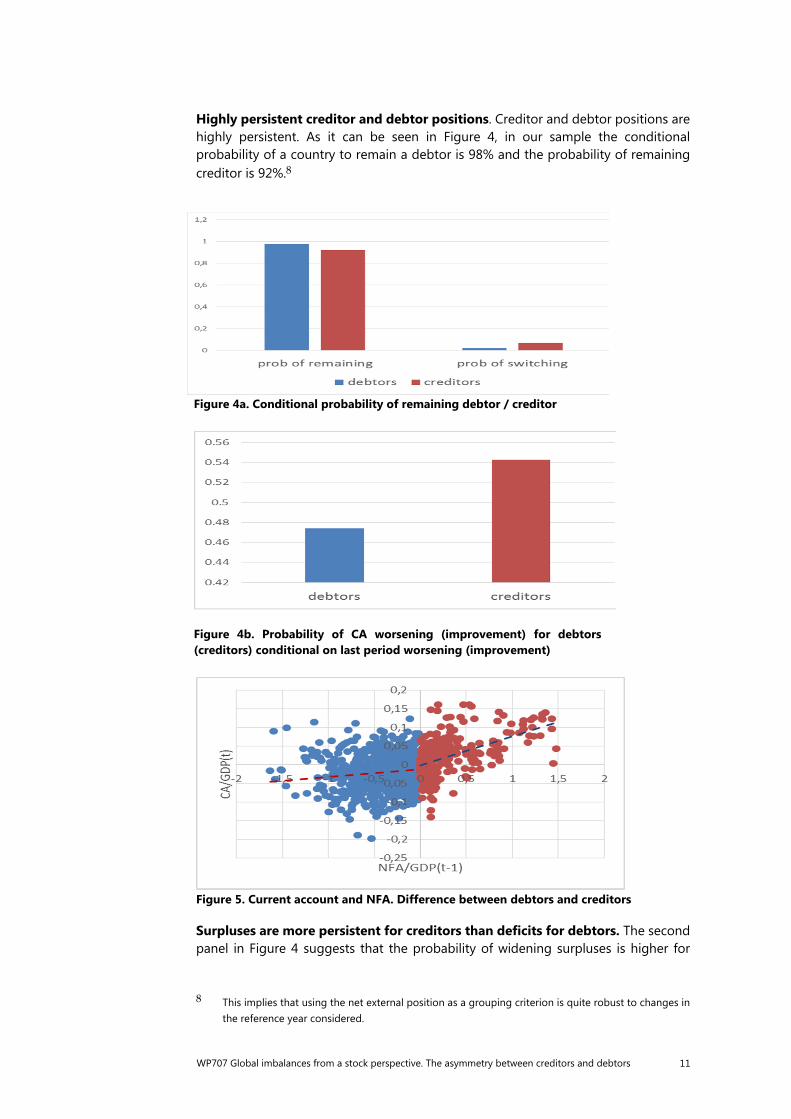
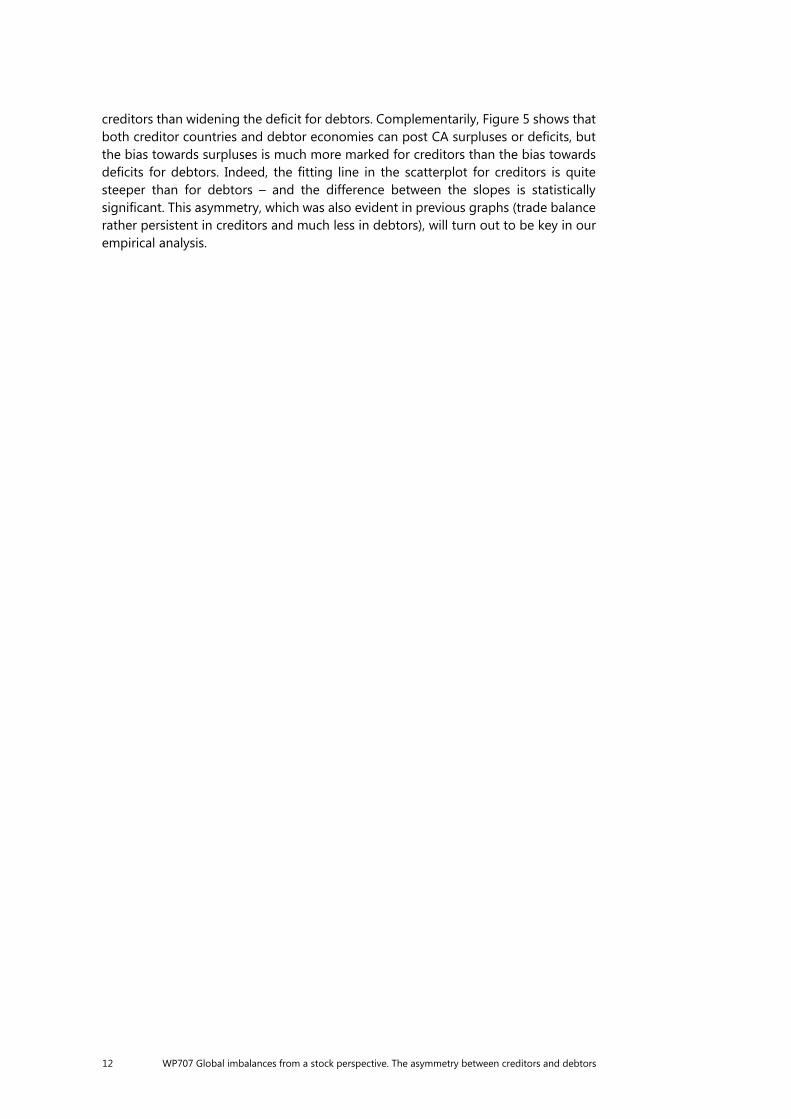
Highly persistent creditor and debtor positions. Creditor and debtor positions are highly persistent. As it can be seen in Figure 4, in our sample the conditional probability of a country to remain a debtor is 98% and the probability of remaining creditor is 92%.8
Figure 4a. Conditional probability of remaining debtor / creditor
Figure 4b. Probability of CA worsening (improvement) for debtors (creditors) conditional on last period worsening (improvement)
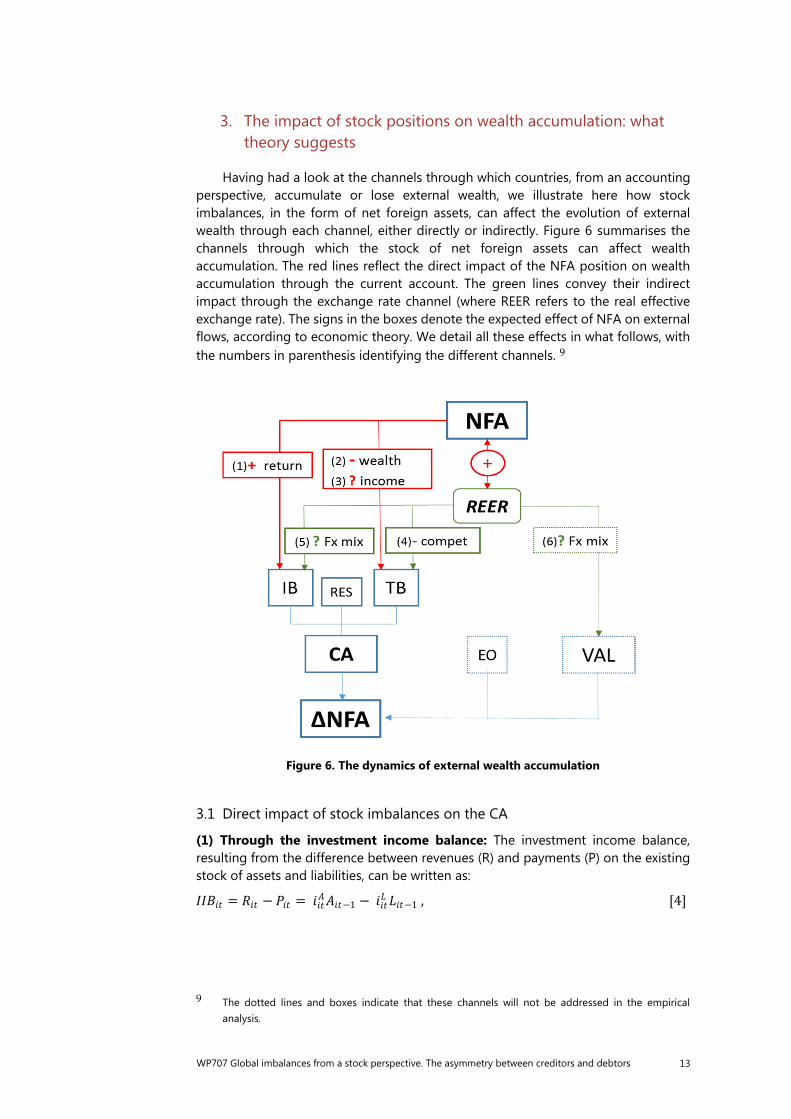
Figure 5. Current account and NFA. Difference between debtors and creditors
Surpluses are more persistent for creditors than deficits for debtors. The second panel in Figure 4 suggests that the probability of widening surpluses is higher for
8 This implies that using the net external position as a grouping criterion is quite robust to changes in the reference year considered.
12 WP707 Global imbalances from a stock perspective. The asymmetry between creditors and debtors
creditors than widening the deficit for debtors. Complementarily, Figure 5 shows that both creditor countries and debtor economies can post CA surpluses or deficits, but the bias towards surpluses is much more marked for creditors than the bias towards deficits for debtors. Indeed, the fitting line in the scatterplot for creditors is quite steeper than for debtors – and the difference between the slopes is statistically significant. This asymmetry, which was also evident in previous graphs (trade balance rather persistent in creditors and much less in debtors), will turn out to be key in our empirical analysis.
WP707 Global imbalances from a stock perspective. The asymmetry between creditors and debtors 13
3. The impact of stock positions on wealth accumulation: what theory suggests
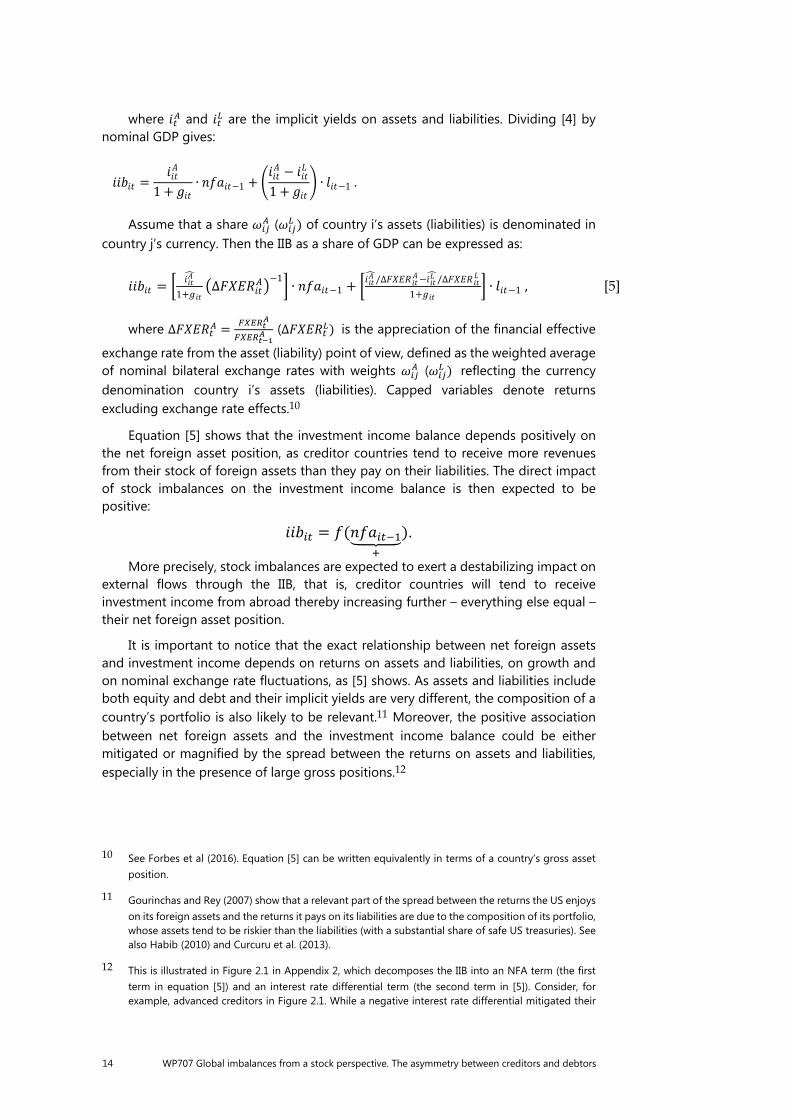
Having had a look at the channels through which countries, from an accounting perspective, accumulate or lose external wealth, we illustrate here how stock imbalances, in the form of net foreign assets, can affect the evolution of external wealth through each channel, either directly or indirectly. Figure 6 summarises the channels through which the stock of net foreign assets can affect wealth accumulation. The red lines reflect the direct impact of the NFA position on wealth accumulation through the current account. The green lines convey their indirect impact through the exchange rate channel (where REER refers to the real effective exchange rate). The signs in the boxes denote the expected effect of NFA on external flows, according to economic theory. We detail all these effects in what follows, with the numbers in parenthesis identifying the different channels. 9
Figure 6. The dynamics of external wealth accumulation
3.1 Direct impact of stock imbalances on the CA
(1) Through the investment income balance: The investment income balance, resulting from the difference between revenues (R) and payments (P) on the existing stock of assets and liabilities, can be written as:
9 The dotted lines and boxes indicate that these channels will not be addressed in the empirical analysis.
= − = −1 − −1 , [4]
14 WP707 Global imbalances from a stock perspective. The asymmetry between creditors and debtors
where and are the implicit yields on assets and liabilities. Dividing [4] by nominal GDP gives:
Assume that a share ( ) of country i’s assets (liabilities) is denominated in
country j’s currency. Then the IIB as a share of GDP can be expressed as:
where ∆ = (∆ ) is the appreciation of the financial effective
exchange rate from the asset (liability) point of view, defined as the weighted average of nominal bilateral exchange rates with weights ( ) reflecting the currency denomination country i’s assets (liabilities). Capped variables denote returns excluding exchange rate effects.10
Equation [5] shows that the investment income balance depends positively on the net foreign asset position, as creditor countries tend to receive more revenues from their stock of foreign assets than they pay on their liabilities. The direct impact of stock imbalances on the investment income balance is then expected to be positive: = ( ).
More precisely, stock imbalances are expected to exert a destabilizing impact on external flows through the IIB, that is, creditor countries will tend to receive investment income from abroad thereby increasing further – everything else equal – their net foreign asset position.
It is important to notice that the exact relationship between net foreign assets and investment income depends on returns on assets and liabilities, on growth and on nominal exchange rate fluctuations, as [5] shows. As assets and liabilities include both equity and debt and their implicit yields are very different, the composition of a country’s portfolio is also likely to be relevant.11 Moreover, the positive association between net foreign assets and the investment income balance could be either mitigated or magnified by the spread between the returns on assets and liabilities, especially in the presence of large gross positions.12
10 See Forbes et al (2016). Equation [5] can be written equivalently in terms of a country’s gross asset position.
11 Gourinchas and Rey (2007) show that a relevant part of the spread between the returns the US enjoys on its foreign assets and the returns it pays on its liabilities are due to the composition of its portfolio, whose assets tend to be riskier than the liabilities (with a substantial share of safe US treasuries). See also Habib (2010) and Curcuru et al. (2013).
12 This is illustrated in Figure 2.1 in Appendix 2, which decomposes the IIB into an NFA term (the first term in equation [5]) and an interest rate differential term (the second term in [5]). Consider, for example, advanced creditors in Figure 2.1. While a negative interest rate differential mitigated their
= 1 + ∙ −1 + −1 + ∙ −1 .
= 1+ ∆ −1 ∙ −1 + /∆ − /∆1+ ∙ −1 , [5]
WP707 Global imbalances from a stock perspective. The asymmetry between creditors and debtors 15
(2) Through the trade balance via wealth effects: Another channel through which stock positions can directly affect the CA is the trade balance. The standard argument in the literature to illustrate this link is the presence of wealth effects, which rely on the notion that domestic absorption should depend positively on the stock of financial wealth, which, in turn, tends to increase with the value of net foreign assets. For the purpose of illustration, assuming quadratic utility and a representative agent, we can write:
where is nominal consumption expenditure, φ households’ discount factor, denotes total financial wealth, the expected present discounted value of
lifetime human wealth, and ndicates the value of total domestic assets.13 Expressing the trade balance as the difference between a country’s exports and
imports and using [6] we can write the trade balance as a share of GDP as:14
Where ≡ denotes the terms of trade expressed as the ratio between the price of country h exports and imports, so that an increase represents an appreciation of the domestic currency and implies a real exchange rate appreciation; is the real effective exchange rate defined as the home CPI in terms of the foreign, and and are positive constants. Equation [7] shows that the trade balance should be negatively related to the stock of net foreign assets, as a creditor position should tend – everything else equal – to raise the value of total financial wealth thereby increasing total domestic absorption (here, consumption) and, therefore, imports (wealth effect). The direct impact of stock imbalances on the trade balance is then expected to be negative: = ( ).
Namely, stock imbalances are expected to have a stabilizing impact on wealth accumulation through the trade balance, as creditor countries should tend to consume and import more, thereby halting the accumulation of external assets. Notice that the relationship above was derived under important simplifying assumptions, such as no investment in physical capital and no preference shocks, and should hold only controlling for any fluctuation in production, growth, labour income and the value of domestic assets.
wealth accumulation through the IIB until 2010, in the recent years the differential turned positive, which magnified wealth accumulation from investment income.
13 Note that = + .
14 To wit, = − , where Ph denotes the GDP deflator and P is the CPI. Equations [6] and [7] can be derived in any standard 2-country 2-good DSGE model assuming, beyond quadratic utility, that consumption is a CES aggregate of a domestic and a foreign-produced variety and that there is no investment in physical capital.
= (1 − ) −1 + = (1 − ) −1 + −1 + , [6]
= 1 + 2( ) (1− ) 1 [ ] −
− 1 + 2( )− (1− )(1 − ) 1 + ∙ −1 + 1 + ∙ −1 + ℎ [7]
16 WP707 Global imbalances from a stock perspective. The asymmetry between creditors and debtors
Notice also that an appreciation of the domestic currency, determining an appreciation of the real exchange rate and of the terms of trade, reduces the international value of foreign absorption and shifts world expenditure towards varieties produced abroad, which – everything else equal – tends to worsen the trade balance.
(3) Through the trade balance, in response to cyclical shocks: The economic literature provides reasons to believe that the trade balance might be influenced by the stock of net foreign assets well beyond the wealth effects described above. Indeed, it has been shown that the CA of creditor and debtor countries reacts differently to cyclical income shocks. Namely, a positive cyclical shock on income, as reflected in a positive output gap, tends to lead to a more pronounced deficit in debtor than in creditor economies (Bussiere et al [2003]).
Two explanations have been related to these findings. First, in the presence of low diminishing asset returns and high risk, agents might not change the composition of their portfolio and invest any additional marginal unit of wealth derived from the shock according to the portfolio they already have. Then debtors will invest more at home leading to a more pronounced CA deficit (Kraay and Ventura [2000]). Another possibility is that debtor economies are more credit constrained than creditor ones. Then a positive cyclical income shock would relax credit constraints more in the debtor economies, which would end up borrowing relatively more from abroad (Bussiere et al [2003]). Notice that, in response to negative cyclical income shocks, the same mechanisms should generate higher surpluses in debtor than in creditor countries.
Whatever the reason why temporary shocks affect differently the CA of creditor and debtor countries, we wish to test for this channel as well in our empirical exercises, which should materialize through the trade balance.15 Then the total direct impact of stock imbalances on the trade balance can be written as:
where the first term represents the wealth effect, the second one the response of the trade balance to positive cyclical income shocks and the third one the response to negative income shocks. Stock imbalances are expected to have a destabilizing impact on external dynamics following positive cyclical income shocks, as they tend to generate higher trade deficits in debtor than in creditor countries. On the other hand, negative cyclical shocks might have a stabilizing impact on the CA, as they should tend to reduce creditors’ surpluses and debtors’ deficits.
Given the relationships derived above, the total direct impact of stock imbalances on the CA can be expressed as: 16
15 Notice that the IIB is entirely determined by past stocks and current asset returns.
16 The residual balance includes both items related to the private and the public sector. Therefore, it is not advisable to pursue a unified theoretical argument to explain them. The stabilizing/destabilizing impact of external stocks on this sub-balance will be a purely empirical question.
= −1− ; −1 ∗ _ ℎ+ ; −1 ∗ _ ℎ− ,
WP707 Global imbalances from a stock perspective. The asymmetry between creditors and debtors 17
where the first term denotes the net impact of the (allegedly positive) investment income effect and the (supposedly negative) wealth effect –its sign being ex-ante undetermined.
3.2. Indirect impacts through exchange rate fluctuations
Yet, stock imbalances can also have an indirect impact on the CA and, more generally, on wealth accumulation, through exchange rate fluctuations. Indeed, economic theory gives reasons to believe that a positive (negative) net foreign asset position should be associated, at least in the long run, with a more appreciated (depreciated) exchange rate. The standard argument in the literature (see, for example, Lane and Milesi-Ferretti [2004] and all the literature on the so-called transfer problem) assumes that a country’s trade balance reacts negatively to exchange rate appreciations, which, as [7] illustrates, tend to shift world demand towards foreign-produced goods. Then, given the standard equation describing wealth accumulation [2], in a long-run equilibrium with a constant net foreign asset position the following must hold:
As [9] shows, a creditor country might afford a lower trade balance in the long run and therefore a more appreciated exchange rate. Moreover, an increase in the net foreign asset position would make the trade balance higher than the right hand side of [9], and an appreciation of the real exchange rate would be required to get back to the equilibrium. Therefore, assuming that the economy tends to the long-run equilibrium or, at least, to preclude explosive NFA dynamics, the relationship above implies that: = ( )
and ∆ = (∆ ),
where is the (log of the) real effective exchange rate. Creditor countries are expected to have a more appreciated exchange rate, and increases in the net foreign asset position are expected to give rise to appreciations. Notice that these relationships have been derived assuming that the economy tends to a stable long-run equilibrium, and that long-run valuation effects, in the form of the spread between returns on assets and liabilities, do not depend on the exchange rate, nor does the investment income balance.
Indirect impact on the current account: The exchange rate, in turn, can affect the CA in two ways, namely through the trade balance and, to the extent that they translate into nominal fluctuations, through the income balance.
(4) Indirect impact via exchange rates on the trade balance: As implied by [7], a real exchange rate appreciation worsens the trade balance. Then:
= + == −1? ; −1 ∗ _ ℎ+ ; −1 ∗ _ ℎ−
= − −1 + ∙ − . [9]
18 WP707 Global imbalances from a stock perspective. The asymmetry between creditors and debtors
where the last term denotes the indirect impact of stock imbalances on the trade balance via the exchange rate level. Through this channel, stock imbalances are expected to have a stabilizing effect on the trade balance as a creditor position should be associated with a more appreciated exchange rate, which, in turn, should correspond –everything else equal— to a lower trade balance, which should hamper the accumulation of external wealth.
(5) Indirect impact via exchange rates on the income balance: Turning to the income balance, an appreciation of the domestic currency in nominal terms tends to reduce both the income from foreign-denominated assets and the payments on foreign-denominated liabilities. As shown in [5], this will have an impact on the income balance through the financial-weighted exchange rate on assets and liabilities, although the net sign of this effect will depend on the currency composition of country i’s portfolio, as well as on interest rates and on the size of gross and net holdings. Therefore:
where ∆ and ∆ denote the change in the (log of the) financial exchange rate on, respectively, assets and liabilities. The existing stock of net foreign assets, , might have an indirect impact on the investment income balance through financial exchange rate appreciations/depreciations, for a given . Also, changes in the stock of net foreign assets can impact the investment income balance to the extent that they contribute to appreciate/depreciate the financial exchange rate. This effect may be stabilizing or destabilizing for the accumulation of external wealth and its sign (the net impact of ∆ and ∆ on the IIB) depends on the currency denomination of assets and liabilities.17
(6) Indirect impact through valuation changes: As shown in [2], the accumulation of external wealth results from both the CA and valuation changes on the existing stock of foreign assets and liabilities. Valuation effects, in turn, are partly due to exchange rate changes via fluctuations in the nominal financial exchange rate and may therefore be affected by existing stock positions, the final sign depending on the currency composition of assets and liabilities.
Summing up, the impact of existing stock imbalances on the accumulation of external wealth can be expressed as:
17 The indirect impact of NFA changes on the IIB will have a stabilizing effect, for example, if a country’s assets are mostly denominated in foreign currency. Then a positive change in NFA, implying an appreciation of the domestic currency, will tend to decrease the domestic-currency value of revenues.
== −1− ; −1 ∗ _ ℎ+ ; −1 ∗ _ ℎ− ; −1+−
= −1+ ; ∆ ∆ −1+− ; ∆ ∆ −1++
, [10]
WP707 Global imbalances from a stock perspective. The asymmetry between creditors and debtors 19
+ ; ∆ ∆?
+ ∆ ∆
? [12]
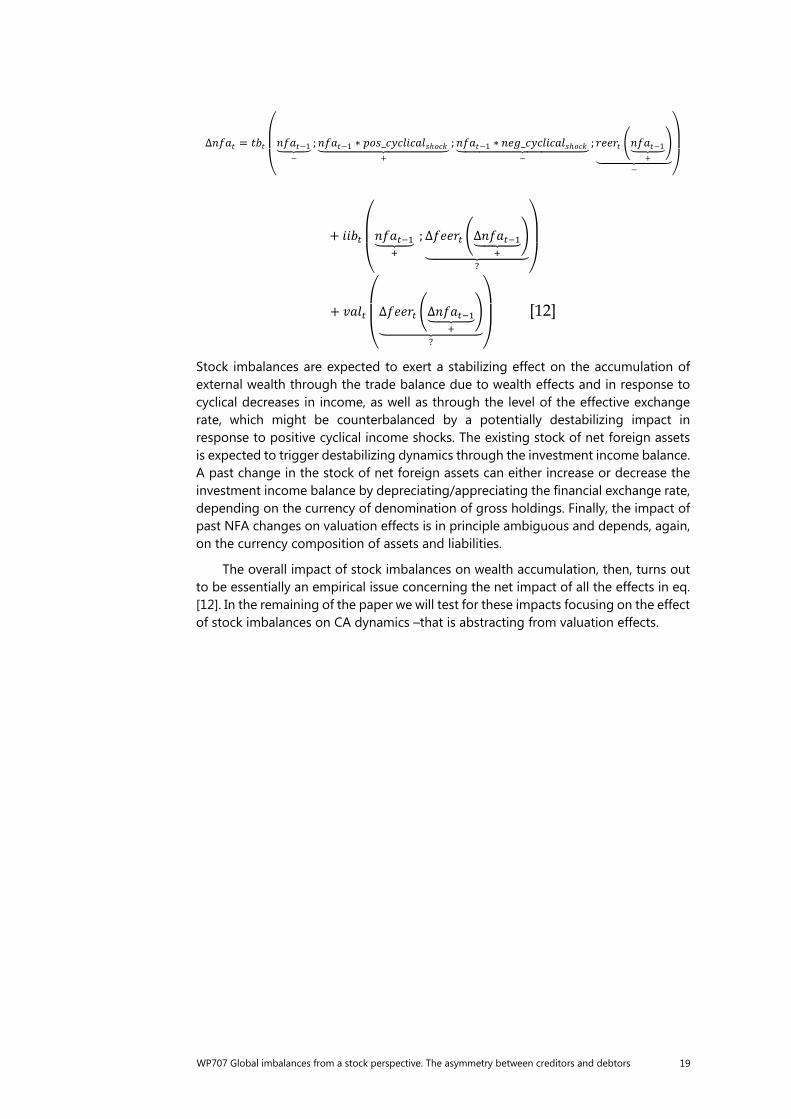
Stock imbalances are expected to exert a stabilizing effect on the accumulation of external wealth through the trade balance due to wealth effects and in response to cyclical decreases in income, as well as through the level of the effective exchange rate, which might be counterbalanced by a potentially destabilizing impact in response to positive cyclical income shocks. The existing stock of net foreign assets is expected to trigger destabilizing dynamics through the investment income balance. A past change in the stock of net foreign assets can either increase or decrease the investment income balance by depreciating/appreciating the financial exchange rate, depending on the currency of denomination of gross holdings. Finally, the impact of past NFA changes on valuation effects is in principle ambiguous and depends, again, on the currency composition of assets and liabilities.
The overall impact of stock imbalances on wealth accumulation, then, turns out to be essentially an empirical issue concerning the net impact of all the effects in eq. [12]. In the remaining of the paper we will test for these impacts focusing on the effect of stock imbalances on CA dynamics –that is abstracting from valuation effects.
∆ = −1− ; −1 ∗ _ ℎ+ ; −1 ∗ _ ℎ− ; −1+−
20 WP707 Global imbalances from a stock perspective. The asymmetry between creditors and debtors
4. The impact of stock imbalances on the CA: empirical tests
In order to test for the empirical relevance of the theoretical impacts illustrated above, we employ panel regressions of the CA (over GDP) and its sub-balances, which allow us to estimate the impact of the stock of NFA on CA fluctuations (as in the first two terms of eq. [12]) controlling for a wide set of possible determinants of external flows.
For its comprehensive perspective, the starting point for this exploration is the analysis performed by the IMF under the multilateral monitoring exercise of external imbalances carried out in the Fund’s External Sector Reports (IMF, 2013). The IMF analysis consists of panel regressions of countries’ CA on a wide set of possible drivers, including countries’ stock of NFA, fundamentals, financial and policy variables. According to IMF estimates, NFA have a statistically significant positive impact on the CA balance. This sign is robust to the inclusion of a multiplicity of variables.
Our empirical analysis generalizes IMF CA regressions under two main aspects. First, differently from the original framework, in estimating the impact of NFA on the CA we distinguish between creditor and debtor countries, motivated by the results obtained in the descriptive section. Second, we also study how NFA influence the CA in response to cyclical income shock, represented as in Bussiere et al (2013) by the output gap, distinguishing between periods of expansion and recessions, and between creditors and debtors.
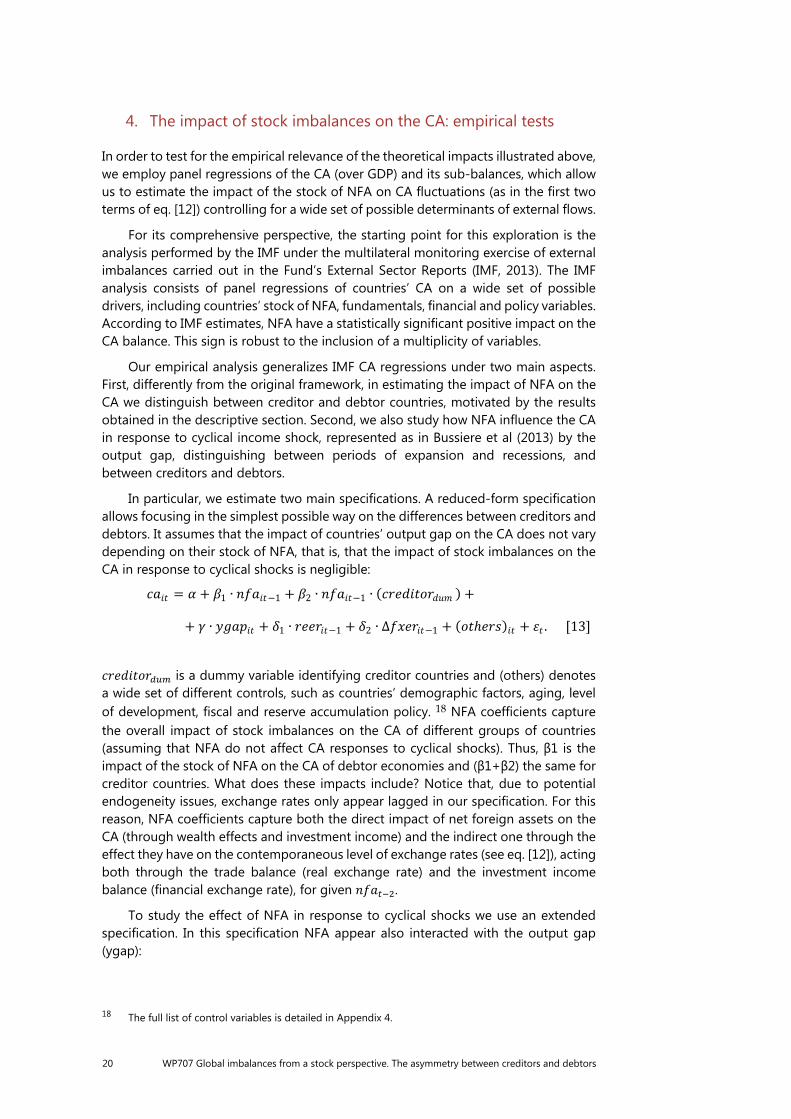
In particular, we estimate two main specifications. A reduced-form specification allows focusing in the simplest possible way on the differences between creditors and debtors. It assumes that the impact of countries’ output gap on the CA does not vary depending on their stock of NFA, that is, that the impact of stock imbalances on the CA in response to cyclical shocks is negligible:
is a dummy variable identifying creditor countries and (others) denotes a wide set of different controls, such as countries’ demographic factors, aging, level of development, fiscal and reserve accumulation policy. 18 NFA coefficients capture the overall impact of stock imbalances on the CA of different groups of countries (assuming that NFA do not affect CA responses to cyclical shocks). Thus, β1 is the impact of the stock of NFA on the CA of debtor economies and (β1+β2) the same for creditor countries. What does these impacts include? Notice that, due to potential endogeneity issues, exchange rates only appear lagged in our specification. For this reason, NFA coefficients capture both the direct impact of net foreign assets on the CA (through wealth effects and investment income) and the indirect one through the effect they have on the contemporaneous level of exchange rates (see eq. [12]), acting both through the trade balance (real exchange rate) and the investment income balance (financial exchange rate), for given .
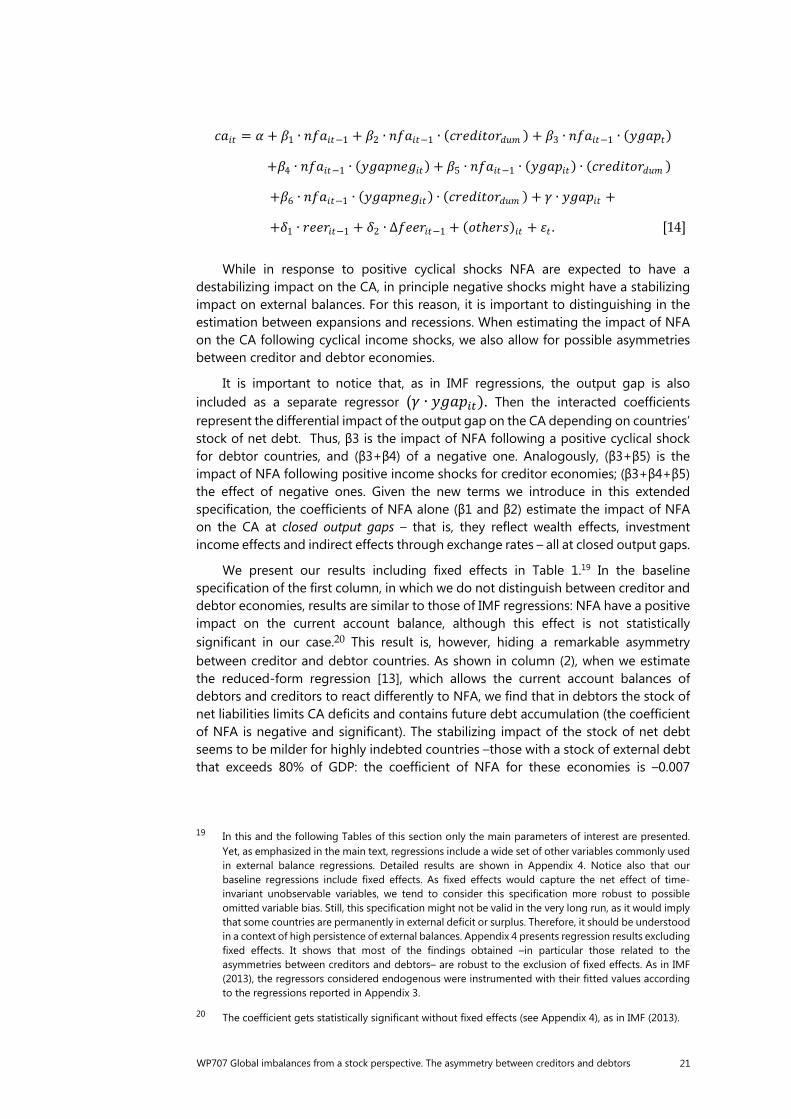
To study the effect of NFA in response to cyclical shocks we use an extended specification. In this specification NFA appear also interacted with the output gap (ygap):
18 The full list of control variables is detailed in Appendix 4.
= + 1 ∙ −1 + 2 ∙ −1 ∙ ( ) + + ∙ + 1 ∙ −1 + 2 ∙ ∆ −1 + ( ℎ ) + . [13]
WP707 Global imbalances from a stock perspective. The asymmetry between creditors and debtors 21
While in response to positive cyclical shocks NFA are expected to have a
destabilizing impact on the CA, in principle negative shocks might have a stabilizing impact on external balances. For this reason, it is important to distinguishing in the estimation between expansions and recessions. When estimating the impact of NFA on the CA following cyclical income shocks, we also allow for possible asymmetries between creditor and debtor economies.
It is important to notice that, as in IMF regressions, the output gap is also included as a separate regressor ( ∙ ). Then the interacted coefficients represent the differential impact of the output gap on the CA depending on countries’ stock of net debt. Thus, β3 is the impact of NFA following a positive cyclical shock for debtor countries, and (β3+β4) of a negative one. Analogously, (β3+β5) is the impact of NFA following positive income shocks for creditor economies; (β3+β4+β5) the effect of negative ones. Given the new terms we introduce in this extended specification, the coefficients of NFA alone (β1 and β2) estimate the impact of NFA on the CA at closed output gaps – that is, they reflect wealth effects, investment income effects and indirect effects through exchange rates – all at closed output gaps.
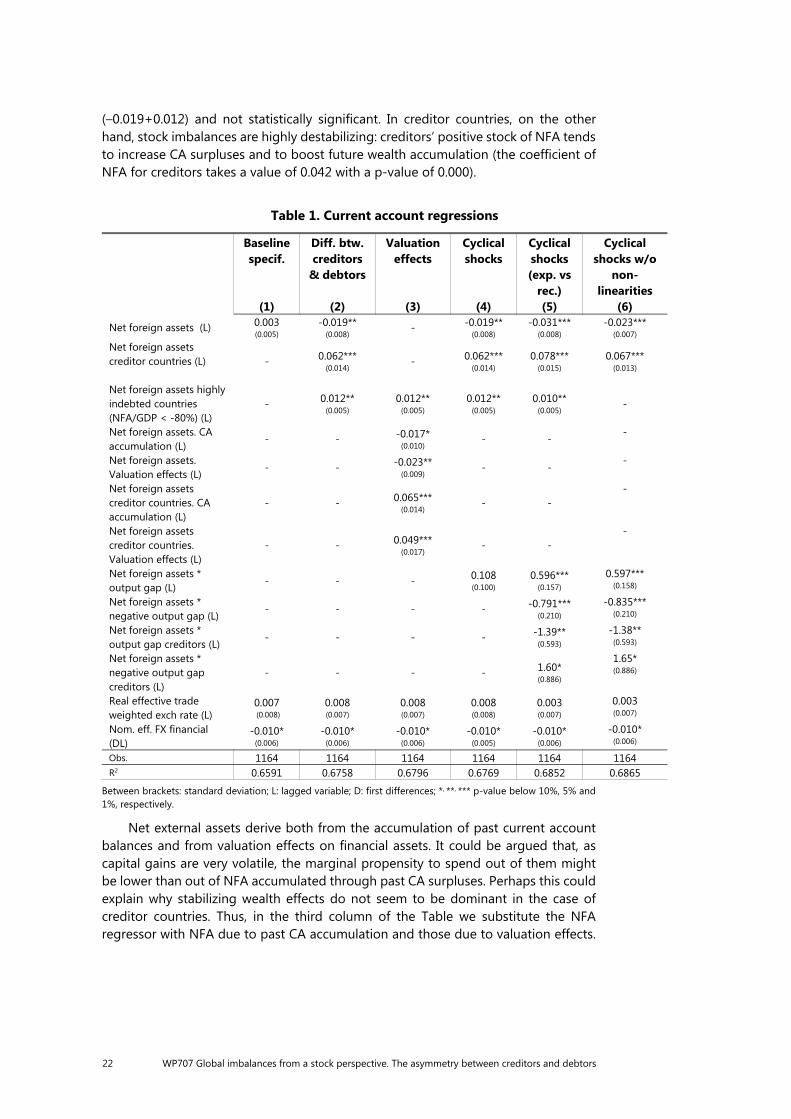
We present our results including fixed effects in Table 1.19 In the baseline specification of the first column, in which we do not distinguish between creditor and debtor economies, results are similar to those of IMF regressions: NFA have a positive impact on the current account balance, although this effect is not statistically significant in our case.20 This result is, however, hiding a remarkable asymmetry between creditor and debtor countries. As shown in column (2), when we estimate the reduced-form regression [13], which allows the current account balances of debtors and creditors to react differently to NFA, we find that in debtors the stock of net liabilities limits CA deficits and contains future debt accumulation (the coefficient of NFA is negative and significant). The stabilizing impact of the stock of net debt seems to be milder for highly indebted countries –those with a stock of external debt that exceeds 80% of GDP: the coefficient of NFA for these economies is –0.007
19 In this and the following Tables of this section only the main parameters of interest are presented.
Yet, as emphasized in the main text, regressions include a wide set of other variables commonly used in external balance regressions. Detailed results are shown in Appendix 4. Notice also that our baseline regressions include fixed effects. As fixed effects would capture the net effect of time-invariant unobservable variables, we tend to consider this specification more robust to possible omitted variable bias. Still, this specification might not be valid in the very long run, as it would imply that some countries are permanently in external deficit or surplus. Therefore, it should be understood in a context of high persistence of external balances. Appendix 4 presents regression results excluding fixed effects. It shows that most of the findings obtained –in particular those related to the asymmetries between creditors and debtors– are robust to the exclusion of fixed effects. As in IMF (2013), the regressors considered endogenous were instrumented with their fitted values according to the regressions reported in Appendix 3.
20 The coefficient gets statistically significant without fixed effects (see Appendix 4), as in IMF (2013).
= + 1 ∙ −1 + 2 ∙ −1 ∙ ( ) + 3 ∙ −1 ∙ ( ) + 4 ∙ −1 ∙ ( ) + 5 ∙ −1 ∙ ( ) ∙ ( ) + 6 ∙ −1 ∙ ( ) ∙ ( ) + ∙ + + 1 ∙ −1 + 2 ∙ ∆ −1 + ( ℎ ) + . [14]
22 WP707 Global imbalances from a stock perspective. The asymmetry between creditors and debtors
(–0.019+0.012) and not statistically significant. In creditor countries, on the other hand, stock imbalances are highly destabilizing: creditors’ positive stock of NFA tends to increase CA surpluses and to boost future wealth accumulation (the coefficient of NFA for creditors takes a value of 0.042 with a p-value of 0.000).
Table 1. Current account regressions
Baseline specif.
(1)
Diff. btw. creditors
& debtors
(2)
Valuation effects
(3)
Cyclical shocks
(4)
Cyclical shocks (exp. vs
rec.) (5)
Cyclical shocks w/o
non-linearities
(6)
Net foreign assets (L) 0.003 (0.005)
-0.019** (0.008)
- -0.019** (0.008)
-0.031*** (0.008)
-0.023*** (0.007)
Net foreign assets creditor countries (L)
- 0.062*** (0.014) - 0.062***
(0.014) 0.078***
(0.015) 0.067***
(0.013)
Net foreign assets highly indebted countries (NFA/GDP < -80%) (L)
- 0.012** (0.005)
0.012** (0.005)
0.012** (0.005)
0.010** (0.005)
-
Net foreign assets. CA accumulation (L)
- - -0.017* (0.010) - -
-
Net foreign assets. Valuation effects (L)
- - -0.023** (0.009) - -
-
Net foreign assets creditor countries. CA accumulation (L)
- - 0.065*** (0.014) - -
-
Net foreign assets creditor countries. Valuation effects (L)
- - 0.049*** (0.017) - -
-
Net foreign assets * output gap (L)
- - - 0.108 (0.100)
0.596*** (0.157)
0.597*** (0.158)
Net foreign assets * negative output gap (L)
- - - - -0.791*** (0.210)
-0.835*** (0.210)
Net foreign assets * output gap creditors (L)
- - - - -1.39** (0.593)
-1.38** (0.593)
Net foreign assets * negative output gap creditors (L)
- - - - 1.60* (0.886)
1.65* (0.886)
Real effective trade weighted exch rate (L)
0.007 (0.008)
0.008 (0.007)
0.008 (0.007)
0.008 (0.008)
0.003 (0.007)
0.003 (0.007)
Nom. eff. FX financial (DL)
-0.010* (0.006)
-0.010* (0.006)
-0.010* (0.006)
-0.010* (0.005)
-0.010* (0.006)
-0.010* (0.006)
Obs. 1164 1164 1164 1164 1164 1164 R2 0.6591 0.6758 0.6796 0.6769 0.6852 0.6865
Between brackets: standard deviation; L: lagged variable; D: first differences; *, **, *** p-value below 10%, 5% and 1%, respectively.
Net external assets derive both from the accumulation of past current account balances and from valuation effects on financial assets. It could be argued that, as capital gains are very volatile, the marginal propensity to spend out of them might be lower than out of NFA accumulated through past CA surpluses. Perhaps this could explain why stabilizing wealth effects do not seem to be dominant in the case of creditor countries. Thus, in the third column of the Table we substitute the NFA regressor with NFA due to past CA accumulation and those due to valuation effects.
WP707 Global imbalances from a stock perspective. The asymmetry between creditors and debtors 23
21 Differences between the CA and the valuation component of NFA are not statistically significant, neither for debtor nor for creditor countries. Moreover, asymmetries between creditors and debtors survive when we only look at the CA component of NFA. This seems to indicate that a lower marginal propensity to spend out of capital gains does not explain differences in the impact of stock imbalances on the CA across debtor and creditor economies.
In columns (4) and (5) we interact lagged NFA with the output gap, to check whether cyclical income disturbances affect countries’ CA depending on their stock of NFA. The interaction term is not significant in column (4), but, when, in column (5), we estimate the extended specification [14] considering separately positive and negative output gaps and allowing the coefficient to differ across debtor and creditor economies, we find that the higher the stock of debtors’ net external liabilities, the more their CA deficit increases in response to positive cyclical income shocks, with a destabilizing effect on the accumulation of external debt. The stock of NFA, on the other hand, has not significant impact on debtors’ CA dynamics in response to negative cyclical shocks. Coefficients are estimated very imprecisely for creditor countries, yet it seems that creditors’ stock of NFA does not affect their CA response to cyclical shocks (the sum of coefficients for creditors is not statistically different from zero). These findings suggest that after positive cyclical shocks debtor countries prefer to keep unchanged the composition of their portfolio, implying a relatively higher increase in their deficit. Another possibility is that debtor economies, who might face tighter financial conditions, see these restrictions being relaxed following a positive shock and are able to increase relatively more domestic spending.
The extended specification in column (5) embeds all the theoretical effects that the stock of NFA should have on CA dynamics. It shows that, even when we consider the effect of cyclical shocks, the destabilizing impact of NFA on debtors’ CA dynamics in response to these disturbances is of a second order of importance with respect to the stabilizing effect they exert at closed output gaps. Indeed, the coefficients estimated in (5) imply that stock imbalances have, overall, a stabilizing impact on the CA of debtor countries (both highly indebted and not), and a destabilizing effect on the external wealth accumulation of creditor economies. Namely, for net foreign assets on average around –30% of GDP for debtors (–100% for highly indebted countries) and around 28% of GDP for creditors, as in our sample, and given the average size of positive output gaps, debtor countries will reduce their current account deficit by 0.6–0.9% of GDP per year (depending on whether they are highly indebted or not), while creditors would increase their surplus by 1.3%. These effects contrast with the results of the IMF, which, disregarding asymmetries in the coefficient of NFA across groups of countries, estimate a coefficient of 0.015 for both creditors and debtors. This implies a much lower destabilizing impact of stock imbalances for creditors (additional surplus of 0.4% GDP per year) and a destabilizing effect for debtors (additional deficit of 0.45–1.5%). As shown in column (6), the overall asymmetric impact of NFA on the CA of creditors and debtors is robust to the exclusion of non-linearities in the group of debtors.
In order to find the source of these asymmetries, in the next sub-sections we analyse the two main sub-balances of the current account – the investment income
21 To obtain these two variables we impose that, in the first year of the sample (1979 for most countries), capital gains are zero.
24 WP707 Global imbalances from a stock perspective. The asymmetry between creditors and debtors
and trade balance. The results obtained for the residual sub-balance, which includes public and private capital transfers, among others, are presented in Appendix 5.
4.1 Through the investment income balance
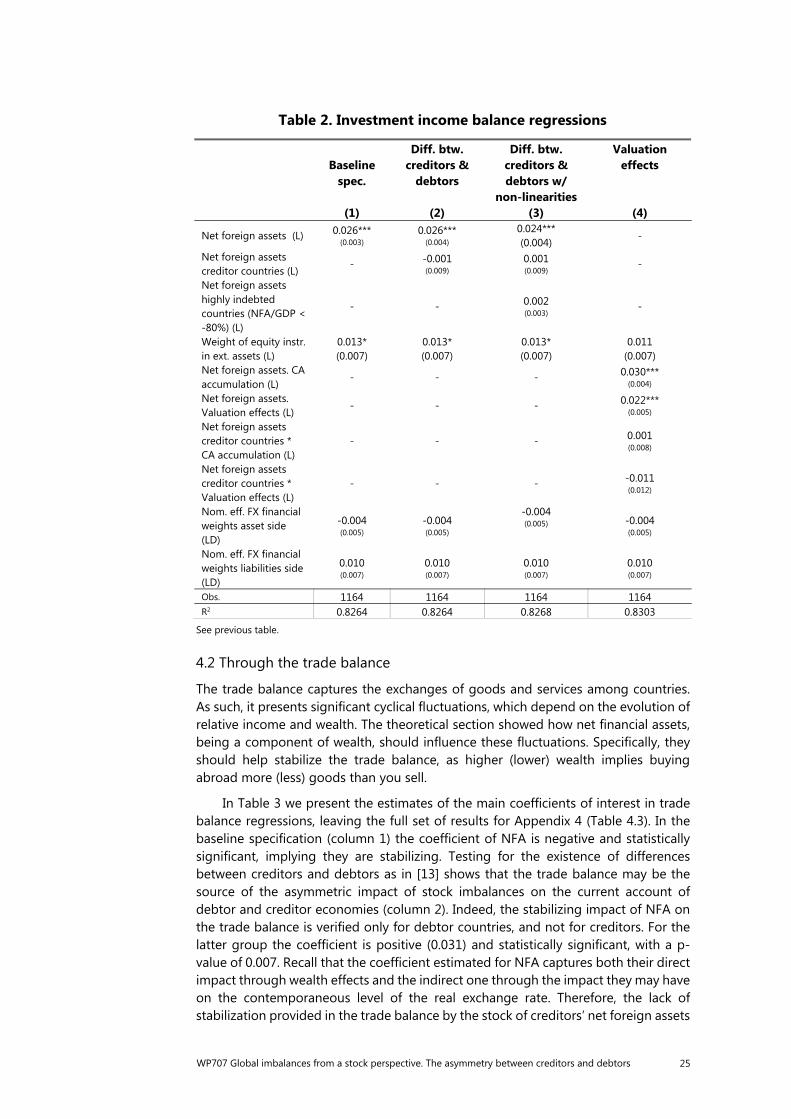
As we saw in section 2, the investment income balance is the most persistent component of the current account. This is not surprising since, according to the theoretical section, it has a very close connection with net financial assets through profitability. Since profitability in large sample averages and aggregate portfolios (as used herein) is expected to be positive, the investment income balance should be positively related to net foreign assets.22
The baseline regression in the first column provides the expected results. The coefficient of NFA is positive, statistically significant and its value seems consistent with the observed implicit returns. From the point of view of the asymmetries between creditor and debtor countries, the origin of the asymmetric impact of NFA on CA dynamics does not appear to be in this sub-balance (columns 2 and 3), which does not seem to present significant differences according to the origin of the accumulation of net financial assets (column 4).
22 It is useful to remember that changes in the financial exchange rates only enter lagged one period in this specification. For this reason, the coefficient of net foreign assets estimated here captures both the direct impact of this variable on the IIB (a positive NFA should imply more revenues from abroad than payments to foreigners) and their indirect impact through financial exchange rate changes, for a given (see eq.[12]).
WP707 Global imbalances from a stock perspective. The asymmetry between creditors and debtors 25
Table 2. Investment income balance regressions
Baseline
spec.
(1)
Diff. btw. creditors &
debtors
(2)
Diff. btw. creditors & debtors w/
non-linearities (3)
Valuation effects
(4)
Net foreign assets (L) 0.026*** (0.003)
0.026*** (0.004)
0.024*** (0.004)
-
Net foreign assets creditor countries (L)
- -0.001 (0.009)
0.001 (0.009)
-
Net foreign assets highly indebted countries (NFA/GDP < -80%) (L)
- - 0.002 (0.003)
-
Weight of equity instr. in ext. assets (L)
0.013* (0.007)
0.013* (0.007)
0.013* (0.007)
0.011 (0.007)
Net foreign assets. CA accumulation (L)
- - - 0.030*** (0.004)
Net foreign assets. Valuation effects (L)
- - - 0.022*** (0.005)
Net foreign assets creditor countries * CA accumulation (L)
- - - 0.001 (0.008)
Net foreign assets creditor countries * Valuation effects (L)
- - - -0.011 (0.012)
Nom. eff. FX financial weights asset side (LD)
-0.004 (0.005)
-0.004 (0.005)
-0.004 (0.005) -0.004
(0.005)
Nom. eff. FX financial weights liabilities side (LD)
0.010 (0.007)
0.010 (0.007)
0.010 (0.007)
0.010 (0.007)
Obs. 1164 1164 1164 1164 R2 0.8264 0.8264 0.8268 0.8303
See previous table.
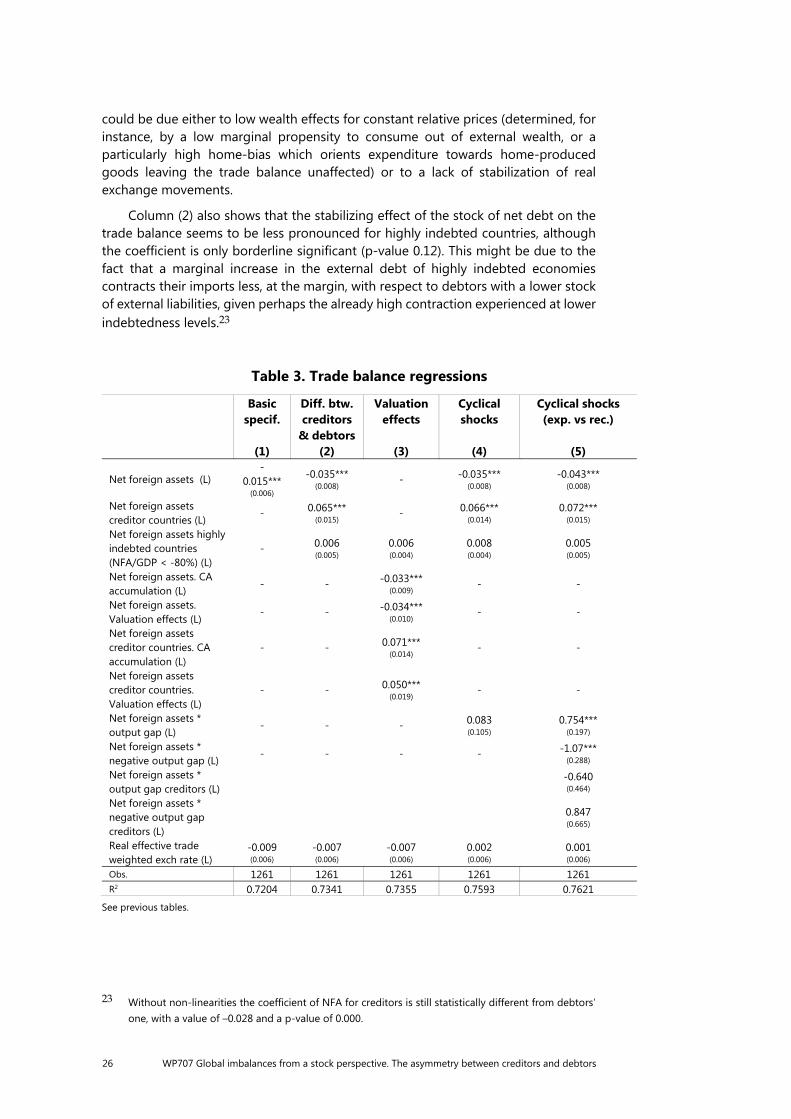
4.2 Through the trade balance
The trade balance captures the exchanges of goods and services among countries. As such, it presents significant cyclical fluctuations, which depend on the evolution of relative income and wealth. The theoretical section showed how net financial assets, being a component of wealth, should influence these fluctuations. Specifically, they should help stabilize the trade balance, as higher (lower) wealth implies buying abroad more (less) goods than you sell.
In Table 3 we present the estimates of the main coefficients of interest in trade balance regressions, leaving the full set of results for Appendix 4 (Table 4.3). In the baseline specification (column 1) the coefficient of NFA is negative and statistically significant, implying they are stabilizing. Testing for the existence of differences between creditors and debtors as in [13] shows that the trade balance may be the source of the asymmetric impact of stock imbalances on the current account of debtor and creditor economies (column 2). Indeed, the stabilizing impact of NFA on the trade balance is verified only for debtor countries, and not for creditors. For the latter group the coefficient is positive (0.031) and statistically significant, with a p-value of 0.007. Recall that the coefficient estimated for NFA captures both their direct impact through wealth effects and the indirect one through the impact they may have on the contemporaneous level of the real exchange rate. Therefore, the lack of stabilization provided in the trade balance by the stock of creditors’ net foreign assets
26 WP707 Global imbalances from a stock perspective. The asymmetry between creditors and debtors
could be due either to low wealth effects for constant relative prices (determined, for instance, by a low marginal propensity to consume out of external wealth, or a particularly high home-bias which orients expenditure towards home-produced goods leaving the trade balance unaffected) or to a lack of stabilization of real exchange movements.
Column (2) also shows that the stabilizing effect of the stock of net debt on the trade balance seems to be less pronounced for highly indebted countries, although the coefficient is only borderline significant (p-value 0.12). This might be due to the fact that a marginal increase in the external debt of highly indebted economies contracts their imports less, at the margin, with respect to debtors with a lower stock of external liabilities, given perhaps the already high contraction experienced at lower indebtedness levels.23
Table 3. Trade balance regressions
Basic specif.
(1)
Diff. btw. creditors
& debtors (2)
Valuation effects
(3)
Cyclical shocks
(4)
Cyclical shocks (exp. vs rec.)
(5)
Net foreign assets (L) -
0.015*** (0.006)
-0.035*** (0.008) - -0.035***
(0.008) -0.043***
(0.008)
Net foreign assets creditor countries (L)
- 0.065*** (0.015) - 0.066***
(0.014) 0.072***
(0.015) Net foreign assets highly indebted countries (NFA/GDP < -80%) (L)
- 0.006 (0.005)
0.006 (0.004)
0.008 (0.004)
0.005 (0.005)
Net foreign assets. CA accumulation (L)
- - -0.033*** (0.009) - -
Net foreign assets. Valuation effects (L)
- - -0.034*** (0.010) - -
Net foreign assets creditor countries. CA accumulation (L)
- - 0.071*** (0.014) - -
Net foreign assets creditor countries. Valuation effects (L)
- - 0.050*** (0.019) - -
Net foreign assets * output gap (L)
- - - 0.083 (0.105)
0.754*** (0.197)
Net foreign assets * negative output gap (L)
- - - - -1.07*** (0.288)
Net foreign assets * output gap creditors (L)
-0.640 (0.464)
Net foreign assets * negative output gap creditors (L)
0.847 (0.665)
Real effective trade weighted exch rate (L)
-0.009 (0.006)
-0.007 (0.006)
-0.007 (0.006)
0.002 (0.006)
0.001 (0.006)
Obs. 1261 1261 1261 1261 1261 R2 0.7204 0.7341 0.7355 0.7593 0.7621
See previous tables.
23 Without non-linearities the coefficient of NFA for creditors is still statistically different from debtors’ one, with a value of –0.028 and a p-value of 0.000.
WP707 Global imbalances from a stock perspective. The asymmetry between creditors and debtors 27
One possible explanation for the destabilizing impact of NFA in creditor countries is that they prefer not consuming out of valuation changes due to their high volatility. The results in column 3 do not seem to support this hypothesis. Although creditor countries have a somewhat smaller marginal propensity to spend out of their capital gains on net foreign wealth, the difference is not significant. Also, asymmetries between creditors and debtors persist when we only compare the coefficients of NFA due to past CA accumulation.
Finally, the last column of the table shows that favourable cyclical income shocks tend to boost trade deficits in debtor countries. Differences in creditors’ responses to cyclical shocks seem to be confirmed in the trade balance regression, although the coefficients are estimated very imprecisely (as in CA regressions) and differences are borderline not significant.
Summarising the findings of this section, we find that stock imbalances lead to destabilizing dynamics only for creditor countries, that is, a creditor position tends to lead to further wealth accumulation through the CA. This is basically the consequence of what happens with the trade balance, which does not limit wealth accumulation in creditor economies. Debtor countries, on the contrary, tend to consume and import less due precisely to their stock of external debt. This asymmetry could be reflecting either characteristics that do not make the trade balance react much to increases in external wealth or a lack of stabilization of relative prices in response to changes in creditors’ NFA. We try to explore these issues further in section 5.
28 WP707 Global imbalances from a stock perspective. The asymmetry between creditors and debtors
5. The heterogeneity between advanced and emerging countries
As we saw in section 2, the behaviour of the external flows and stocks of advanced and emerging economies has been very different in our sample period. Thus, in order to check the possible dependency of the results on countries’ development level, we repeat the estimations dividing the sample among developed and emerging economies. It should be noted that this reduces significantly the sample size, especially in the case of emerging market creditors (essentially China), so that the conclusions should be taken with due caution.
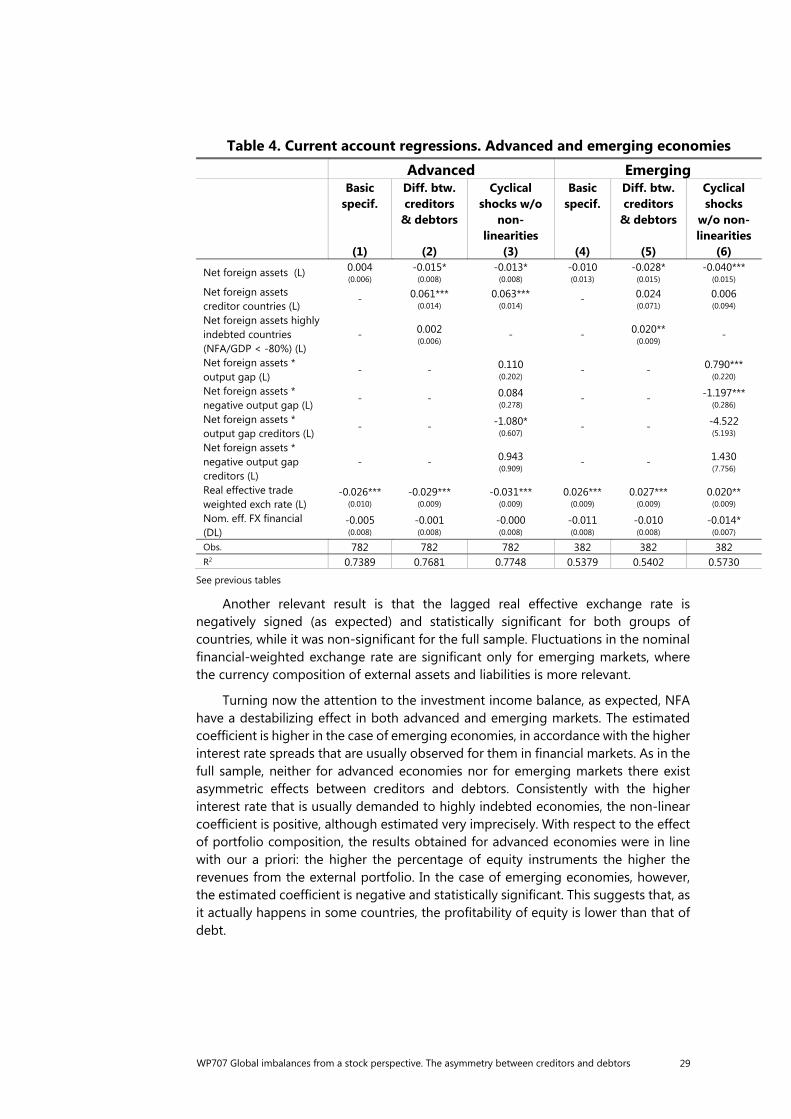
Table 4 presents a summary of the results.24 Current account asymmetries are only statistically significant for the group of advanced economies, with NFA having a stabilizing effect on debtors and a destabilizing impact on creditors. Besides, for this group of countries neither non-linear effects nor transitory income shocks seem to play a relevant role. On the contrary, in the case of emerging market economies, the interaction coefficient of lagged NFA and the creditor dummy is not statistically significant, so that there seem to be no significant asymmetry in the CA dynamics depending of creditors and debtors. In fact, the non-interacted coefficient of NFA is negative, implying a stabilizing impact of stock imbalances on wealth accumulation. However, there exists certain support for non-linear effects that go in the opposite direction, and, more importantly from a quantitative point of view, for destabilizing transitory income shocks. This result is coherent with the idea that emerging economies are more credit constrained than advanced countries.
24 Full regressions, with and without fixed effects, are reported in Appendix 6.
WP707 Global imbalances from a stock perspective. The asymmetry between creditors and debtors 29
Table 4. Current account regressions. Advanced and emerging economies Advanced Emerging Basic
specif.
(1)
Diff. btw. creditors
& debtors
(2)
Cyclical shocks w/o
non-linearities
(3)
Basic specif.
(4)
Diff. btw. creditors
& debtors
(5)
Cyclical shocks
w/o non-linearities
(6)
Net foreign assets (L) 0.004 (0.006)
-0.015* (0.008)
-0.013* (0.008)
-0.010 (0.013)
-0.028* (0.015)
-0.040*** (0.015)
Net foreign assets creditor countries (L)
- 0.061*** (0.014)
0.063*** (0.014) - 0.024
(0.071) 0.006 (0.094)
Net foreign assets highly indebted countries (NFA/GDP < -80%) (L)
- 0.002 (0.006)
- - 0.020**
(0.009) -
Net foreign assets * output gap (L)
- - 0.110 (0.202) - - 0.790***
(0.220)
Net foreign assets * negative output gap (L)
- - 0.084 (0.278) - - -1.197***
(0.286)
Net foreign assets * output gap creditors (L)
- - -1.080* (0.607) - -
-4.522 (5.193)
Net foreign assets * negative output gap creditors (L)
- - 0.943 (0.909) - -
1.430 (7.756)
Real effective trade weighted exch rate (L)
-0.026*** (0.010)
-0.029*** (0.009)
-0.031*** (0.009)
0.026*** (0.009)
0.027*** (0.009)
0.020** (0.009)
Nom. eff. FX financial (DL)
-0.005 (0.008)
-0.001 (0.008)
-0.000 (0.008)
-0.011 (0.008)
-0.010 (0.008)
-0.014* (0.007)
Obs. 782 782 782 382 382 382 R2 0.7389 0.7681 0.7748 0.5379 0.5402 0.5730
See previous tables
Another relevant result is that the lagged real effective exchange rate is negatively signed (as expected) and statistically significant for both groups of countries, while it was non-significant for the full sample. Fluctuations in the nominal financial-weighted exchange rate are significant only for emerging markets, where the currency composition of external assets and liabilities is more relevant.
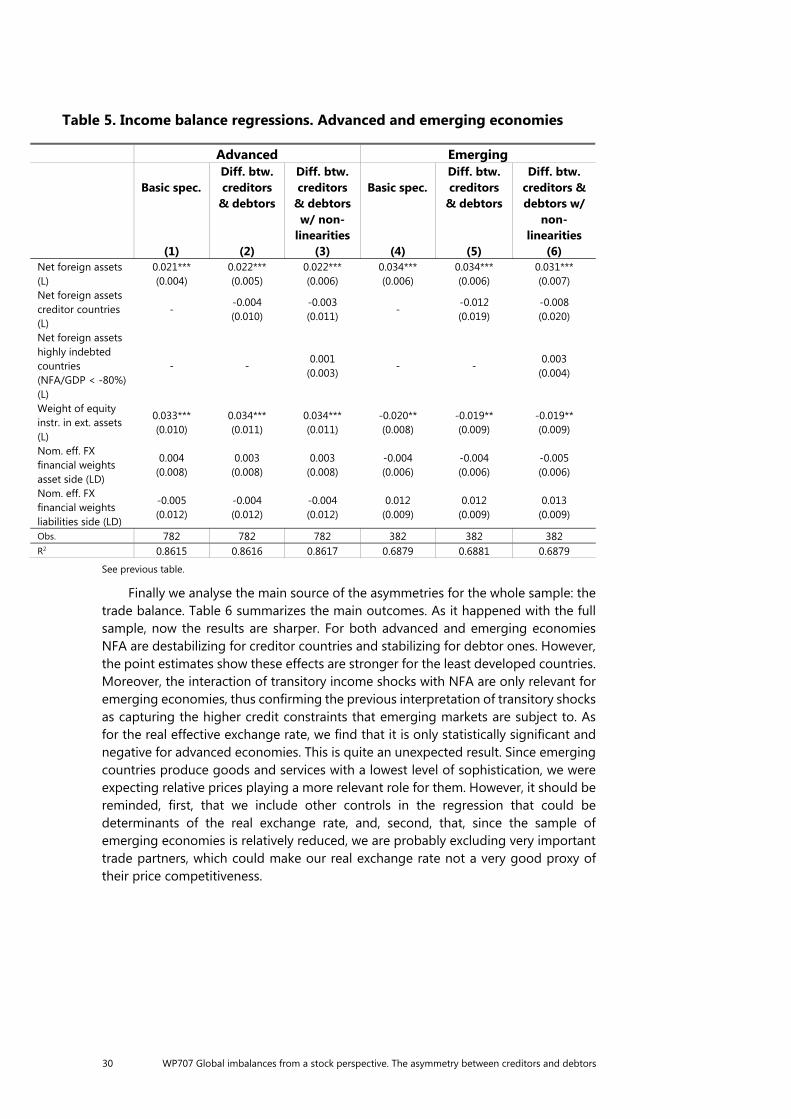
Turning now the attention to the investment income balance, as expected, NFA have a destabilizing effect in both advanced and emerging markets. The estimated coefficient is higher in the case of emerging economies, in accordance with the higher interest rate spreads that are usually observed for them in financial markets. As in the full sample, neither for advanced economies nor for emerging markets there exist asymmetric effects between creditors and debtors. Consistently with the higher interest rate that is usually demanded to highly indebted economies, the non-linear coefficient is positive, although estimated very imprecisely. With respect to the effect of portfolio composition, the results obtained for advanced economies were in line with our a priori: the higher the percentage of equity instruments the higher the revenues from the external portfolio. In the case of emerging economies, however, the estimated coefficient is negative and statistically significant. This suggests that, as it actually happens in some countries, the profitability of equity is lower than that of debt.
30 WP707 Global imbalances from a stock perspective. The asymmetry between creditors and debtors
Table 5. Income balance regressions. Advanced and emerging economies
Advanced Emerging
Basic spec.
(1)
Diff. btw. creditors
& debtors
(2)
Diff. btw. creditors
& debtors w/ non-
linearities (3)
Basic spec.
(4)
Diff. btw. creditors
& debtors
(5)
Diff. btw. creditors & debtors w/
non-linearities
(6) Net foreign assets (L)
0.021*** (0.004)
0.022*** (0.005)
0.022*** (0.006)
0.034*** (0.006)
0.034*** (0.006)
0.031*** (0.007)
Net foreign assets creditor countries (L)
- -0.004 (0.010)
-0.003 (0.011)
- -0.012 (0.019)
-0.008 (0.020)
Net foreign assets highly indebted countries (NFA/GDP < -80%) (L)
- - 0.001
(0.003) - -
0.003 (0.004)
Weight of equity instr. in ext. assets (L)
0.033*** (0.010)
0.034*** (0.011)
0.034*** (0.011)
-0.020** (0.008)
-0.019** (0.009)
-0.019** (0.009)
Nom. eff. FX financial weights asset side (LD)
0.004 (0.008)
0.003 (0.008)
0.003 (0.008)
-0.004 (0.006)
-0.004 (0.006)
-0.005 (0.006)
Nom. eff. FX financial weights liabilities side (LD)
-0.005 (0.012)
-0.004 (0.012)
-0.004 (0.012)
0.012 (0.009)
0.012 (0.009)
0.013 (0.009)
Obs. 782 782 782 382 382 382 R2 0.8615 0.8616 0.8617 0.6879 0.6881 0.6879
See previous table.
Finally we analyse the main source of the asymmetries for the whole sample: the trade balance. Table 6 summarizes the main outcomes. As it happened with the full sample, now the results are sharper. For both advanced and emerging economies NFA are destabilizing for creditor countries and stabilizing for debtor ones. However, the point estimates show these effects are stronger for the least developed countries. Moreover, the interaction of transitory income shocks with NFA are only relevant for emerging economies, thus confirming the previous interpretation of transitory shocks as capturing the higher credit constraints that emerging markets are subject to. As for the real effective exchange rate, we find that it is only statistically significant and negative for advanced economies. This is quite an unexpected result. Since emerging countries produce goods and services with a lowest level of sophistication, we were expecting relative prices playing a more relevant role for them. However, it should be reminded, first, that we include other controls in the regression that could be determinants of the real exchange rate, and, second, that, since the sample of emerging economies is relatively reduced, we are probably excluding very important trade partners, which could make our real exchange rate not a very good proxy of their price competitiveness.
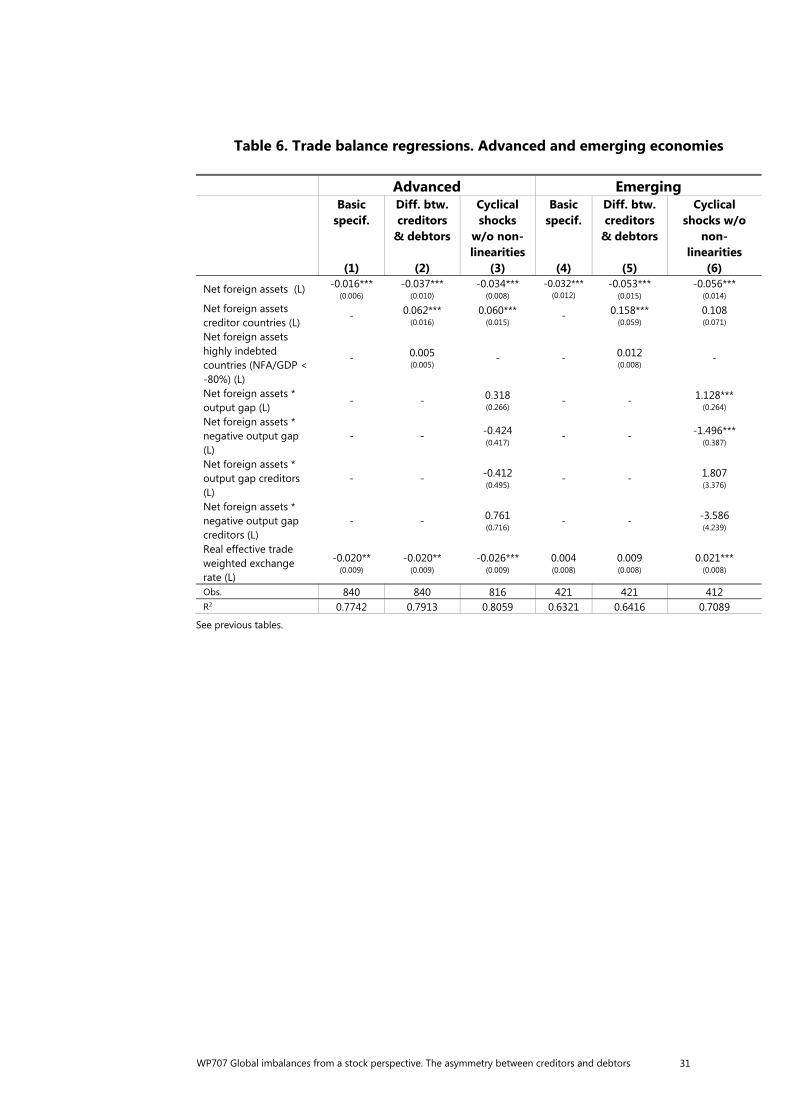
WP707 Global imbalances from a stock perspective. The asymmetry between creditors and debtors 31
Table 6. Trade balance regressions. Advanced and emerging economies
Advanced Emerging Basic
specif.
(1)
Diff. btw. creditors
& debtors
(2)
Cyclical shocks
w/o non-linearities
(3)
Basic specif.
(4)
Diff. btw. creditors
& debtors
(5)
Cyclical shocks w/o
non-linearities
(6)
Net foreign assets (L) -0.016*** (0.006)
-0.037*** (0.010)
-0.034*** (0.008)
-0.032*** (0.012)
-0.053*** (0.015)
-0.056*** (0.014)
Net foreign assets creditor countries (L)
- 0.062*** (0.016)
0.060*** (0.015) - 0.158***
(0.059) 0.108 (0.071)
Net foreign assets highly indebted countries (NFA/GDP < -80%) (L)
- 0.005 (0.005)
- - 0.012 (0.008)
-
Net foreign assets * output gap (L)
- - 0.318 (0.266) - - 1.128***
(0.264) Net foreign assets * negative output gap (L)
- - -0.424 (0.417) - - -1.496***
(0.387)
Net foreign assets * output gap creditors (L)
- - -0.412 (0.495) - - 1.807
(3.376)
Net foreign assets * negative output gap creditors (L)
- - 0.761 (0.716) - - -3.586
(4.239)
Real effective trade weighted exchange rate (L)
-0.020** (0.009)
-0.020** (0.009)
-0.026*** (0.009)
0.004 (0.008)
0.009 (0.008)
0.021*** (0.008)
Obs. 840 840 816 421 421 412 R2 0.7742 0.7913 0.8059 0.6321 0.6416 0.7089
See previous tables.
32 WP707 Global imbalances from a stock perspective. The asymmetry between creditors and debtors
6. Are real exchange rates determined by net foreign assets?
As emphasized in section 4, the coefficient of net foreign assets estimated in trade balance regressions represents both their direct impact through wealth effects and the indirect impact that the stock of NFA has on external trade through the real exchange rate. Is the low coefficient estimated for creditor countries due to a weak wealth effect and a scarce marginal propensity to consume out of external wealth or to the fact that a higher level of net foreign assets does not correspond to a more appreciated exchange rate for these countries? In order to address this question we focus in this section on the latter, indirect effect, trying to establish its empirical relevance and whether it is milder for creditor countries. Another possibility is that the indirect impact of stock imbalances on the trade balance via real exchange rate levels could have changed over time for several economies in our sample. In particular, the creation of the European Monetary Union and the ensuing exchange rate unification under the euro for member countries is a structural change that may have affected that relation. So, even if stock imbalances had a stabilizing impact on the trade balance through the real exchange rate, this effect may have been mitigated for member countries. For one thing, in the presence of rigidities in relative price adjustments, the real exchange rate of the members of a common currency area might depend on the net foreign asset position of the area as a whole rather than on the external position of each member. We test this hypothesis in this section by establishing whether a country’s past stock of net foreign assets influences its real exchange rate level, and whether this relationship changed for euro countries after the establishment of the common currency.
Our tests rely on panel regressions of the level of the REER on a set of fundamental determinants, including the ratio of NFA to GDP. 25 In the spirit of the REER regressions in IMF (2013) and IMF (2016), our basic specification controls for a series of potential determinants of the REER level, such as a country’s level of development, its trade openness, demographic factors and expected growth. We also test whether the impact of the stock of NFA on the exchange rate is the same for debtor and creditor countries. Namely, we run the following regressions:
where is the (log of the) REER level. Notice that using levels instead of indices allows running panel estimations both with and without fixed effects.26 is the impact of the NFA stock on the REER for debtor economies and ( + ) the same for creditor countries; (others) denotes the set of other exchange rate determinants, detailed in Appendix 7.
25 The levels of the real effective exchange rate are recovered from PPP estimates in a base year.
26 On this point see IMF (2013). Being able to run panel regressions without fixed effects is particularly important when estimating the relationship between the stock of NFA and the REER. Indeed, economic theory predicts a positive link between these two variables based on long-run (Steady State) relationships. Fixed effects might capture that link and mechanically lead to estimate a non-significant coefficient. For this reason the benchmark estimates for REER regressions (those reported in the main text) are run without fixed effects. Still, we discuss the robustness of our results to fixed effect estimation, which is reported in Appendix 7.
= + ∙ −1 + ( ℎ ) + = + 1 ∙ −1 + 2 ∙ −1 ∙ ( ) + ( ℎ ) + ,
WP707 Global imbalances from a stock perspective. The asymmetry between creditors and debtors 33
We test whether the relationship between NFA and REER changed significantly for the countries that joined the Euro Area in 1999 by running:
where ( ) is a dummy variable that takes the value of 1 after the creation of the Euro Zone, in 1999, and ( 99 )is a static dummy that characterizes the countries that joined the EMU in 1999 plus Greece. 27
The specification above lets us study whether the NFA coefficient changed after 1999 also for economies outside the Euro Area. However, that specification does not allow investigating the impact of the Euro on the countries that joined the single currency after 1999. For this reason we also run a slightly different regression interacting NFA and NFA for creditors with a dummy ( ) that takes the value of 1 if the country has already joined the Euro in the year under consideration, and 0 otherwise:
The country sample is the same as in Section 4. The time sample is 1990–2015, due to data availability. Table 7.1 in Appendix 7 reports the full set of results. Table 7 below focuses on the results obtained for our main coefficients of interest, those related to countries’ NFA position.
The baseline specification in column (1) shows that, controlling for all the determinants of REER levels, on average countries with a more positive NFA position tend to display a more appreciated exchange rate. Contrary to our conjecture, when we distinguish between debtor and creditor countries in column (2), we find that the relationship above holds only for the latter group, that is, a higher debtor position does not imply a more depreciated exchange rate. 28
27 The coefficients and ( + ) capture the impact of NFA on the REER for, respectively, debtor and
creditor countries before the establishment of the Euro Zone; ( + ) and ( + + + ) the same impact after 1999 for, respectively, debtor and creditor economies outside the EMU; ( + + ) represents the impact after 1999 for debtor countries that joined the Euro Zone; summing all the yields instead the same effect after 1999 for creditor countries that joined the Euro Zone since its creation.
28 The coefficient of the lagged foreign assets position for creditor countries is estimated to be 0.349, with a p-value of 0.000.
= + 1 −1 + 2 −1( ) + 3 −1( ) + 4 −1( )( ) + 5 −1( )( 99 ) + 6 −1( )( 99 )( ) + ( ℎ ) + ,
= + 1 −1 + 2 −1( ) + 3 −1( ) + 4 −1( )( ) + ( ℎ ) + .
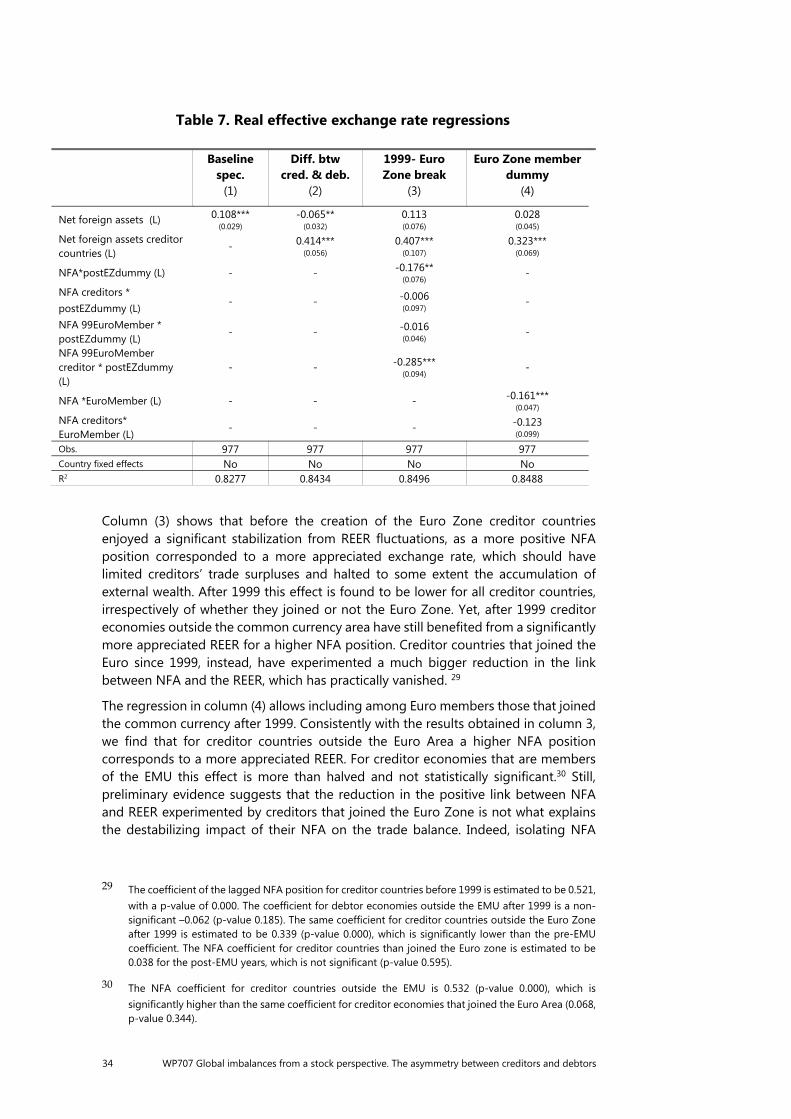
34 WP707 Global imbalances from a stock perspective. The asymmetry between creditors and debtors
Table 7. Real effective exchange rate regressions
Baseline spec.
(1)
Diff. btw cred. & deb.
(2)
1999- Euro Zone break
(3)
Euro Zone member dummy
(4)
Net foreign assets (L) 0.108*** (0.029)
-0.065** (0.032)
0.113 (0.076)
0.028 (0.045)
Net foreign assets creditor countries (L)
- 0.414*** (0.056)
0.407*** (0.107)
0.323*** (0.069)
NFA*postEZdummy (L) - - -0.176** (0.076)
-
NFA creditors * postEZdummy (L)
- - -0.006 (0.097)
-
NFA 99EuroMember * postEZdummy (L)
- - -0.016 (0.046)
-
NFA 99EuroMember creditor * postEZdummy (L)
- - -0.285*** (0.094)
-
NFA *EuroMember (L) - - - -0.161*** (0.047)
NFA creditors* EuroMember (L)
- - - -0.123 (0.099)
Obs. 977 977 977 977 Country fixed effects No No No No R2 0.8277 0.8434 0.8496 0.8488
Column (3) shows that before the creation of the Euro Zone creditor countries enjoyed a significant stabilization from REER fluctuations, as a more positive NFA position corresponded to a more appreciated exchange rate, which should have limited creditors’ trade surpluses and halted to some extent the accumulation of external wealth. After 1999 this effect is found to be lower for all creditor countries, irrespectively of whether they joined or not the Euro Zone. Yet, after 1999 creditor economies outside the common currency area have still benefited from a significantly more appreciated REER for a higher NFA position. Creditor countries that joined the Euro since 1999, instead, have experimented a much bigger reduction in the link between NFA and the REER, which has practically vanished. 29 The regression in column (4) allows including among Euro members those that joined the common currency after 1999. Consistently with the results obtained in column 3, we find that for creditor countries outside the Euro Area a higher NFA position corresponds to a more appreciated REER. For creditor economies that are members of the EMU this effect is more than halved and not statistically significant.30 Still, preliminary evidence suggests that the reduction in the positive link between NFA and REER experimented by creditors that joined the Euro Zone is not what explains the destabilizing impact of their NFA on the trade balance. Indeed, isolating NFA
29 The coefficient of the lagged NFA position for creditor countries before 1999 is estimated to be 0.521, with a p-value of 0.000. The coefficient for debtor economies outside the EMU after 1999 is a non-significant –0.062 (p-value 0.185). The same coefficient for creditor countries outside the Euro Zone after 1999 is estimated to be 0.339 (p-value 0.000), which is significantly lower than the pre-EMU coefficient. The NFA coefficient for creditor countries than joined the Euro zone is estimated to be 0.038 for the post-EMU years, which is not significant (p-value 0.595).
30 The NFA coefficient for creditor countries outside the EMU is 0.532 (p-value 0.000), which is significantly higher than the same coefficient for creditor economies that joined the Euro Area (0.068, p-value 0.344).
WP707 Global imbalances from a stock perspective. The asymmetry between creditors and debtors 35
effects in TB regression for Euro Area countries and the rest, we find that for debtor countries that are members of the Euro Zone the stabilizing impact of NFA is higher and for Euro Area creditor countries their destabilizing impact is actually lower. Also, the magnitude of these effects is very small, so that only with very high NFA levels they would imply a relevant difference for trade balance dynamics.
Table 7.2 in the Appendix shows that some of the results derived without fixed effects are not robust to their inclusion. Namely, with fixed effect estimation the real exchange rate does not seem to appreciate following an increase in net foreign assets. This might be due to the fact that the significant positive relationship between exchange rates and net external wealth holds only in the very long-run, as predicted by the theory. Fixed effects, capturing long-run relationships, might end up capturing that link. According to this interpretation, then, exchange rate movements would be stabilizing only in the very long run, as theory would suggest, and not in medium to short-run fluctuations. Anyways, results obtained with fixed effects show that, if anything, real exchange rate tend to exert a higher stabilizing impact on creditor economies. In this sense, they confirm the finding that the lack of stabilization through relative price fluctuations is unlikely to be the cause of the asymmetry between the wealth accumulation of creditor and debtor economies.
Overall, these results seem to suggest that the reason for the asymmetric impact of stock imbalances on the wealth accumulation of creditor and debtor countries lies more in a weak marginal propensity to consume of the formers than in a different response of relative prices in the two groups of countries.
36 WP707 Global imbalances from a stock perspective. The asymmetry between creditors and debtors
7. Conclusions
Global imbalances played an important role in the run-up to the global financial crisis, irrespectively of whether they represented a symptom of the global turmoil the global financial crisis or were rather among its causes. Traditionally, external imbalances are measured as divergences in countries’ current account positions (“flow imbalances”). Still, global imbalances can also be characterized as the systematic increase in countries’ net claims and liabilities, as described in their net foreign asset positions (“stock imbalances”). While after the crisis flow imbalances have significantly diminished, stock imbalances have continued to rise. The aim of this paper is to study some of the implications that stock imbalances may have for external stability.
Global imbalances played an important role in the run-up to the global financial crisis, irrespectively of whether they represented a symptom of the global turmoil the global financial crisis or were rather among its causes. Traditionally, external imbalances are measured as divergences in countries’ current account positions (“flow imbalances”). Still, global imbalances can also be characterized as the systematic increase in countries’ net claims and liabilities, as described in their net foreign asset positions (“stock imbalances”). While after the crisis flow imbalances have significantly diminished, stock imbalances have continued to rise. The aim of this paper is to study some of the implications that stock imbalances may have for external stability.
Overall, the destabilizing impact of stock imbalances on the wealth accumulation of creditor economies seems to be due either to a low marginal propensity to consume and import of these countries out of net external wealth or to other characteristics that limit the worsening in their trade balance in response to an increased expenditure.
The implications of this result can be very relevant for trade and growth dynamics at the global level. In the short run debtor countries remain the most vulnerable to market sentiment and financial tensions, which call for a proper correction in their disequilibria, through the generation of future surpluses or, at least, the shrinking of the deficits. But creditor countries do not seem to react symmetrically to this correction by increasing their demand and imports (which ultimately constitute debtor economies’ exports). Therefore, the adjustment will end up reducing debtors’ imports and, ultimately, their aggregate demand. This outcome, while effective in limiting the risks stemming from excessively negative current account and debtor positions, would likely imply a slowdown in both global trade and GDP growth. The reasons underlying the reluctance of creditors to adjust by expanding imports and demand go beyond the scope of this paper, but clearly deserve further research as they may hamper global growth in the medium run.
WP707 Global imbalances from a stock perspective. The asymmetry between creditors and debtors 37
Appendix 1. The dataset 31
The dataset consists of 39 countries including both developed and emerging economies. Most of them are OECD members (Australia, Austria, Belgium, Canada, Chile, Czech Republic, Denmark, Estonia, Finland, France, Germany, Hungary, Ireland, Israel, Italy, Japan, Korea, Latvia, Mexico, Netherlands, New Zealand, Norway, Poland, Portugal, Slovakia, Slovenia and Spain, Sweden, Switzerland, Turkey, UK and US), but not the rest (China, Cyprus, Croatia, India, Lithuania and Romania).
As it is explained below, the variables used in this empirical paper were taken from very different sources. In some cases it was necessary to link different bases for the same time series. This was made using the common year as the fixed point, introducing adjustments when it was necessary to fulfil accounting identities. In other cases, it was necessary to interpolate some missing values from very close proxies.
Balance of payments and international investment position: There were obtained from the IMF BOPs statistics. In most of the cases it was necessary to link the different bases.
GDP and expected growth: The main source is the IMF WEO database, both in real and nominal terms. In some cases, GDP deflators were interpolated from consumer price inflation. Domestic output gaps were calculated using the one-side HP filter and trade-partners output gaps correspond to export-weighted output gaps with variable weights.
PPPs and bilateral exchange rates: They were also taken from the IMF WEO database. Effective exchange rates are weighted with the export share and, again, weights are variable.
Population: This information was obtained from the UN database, jointly with the long-term projections and its structure. This information allows us to calculate both the ageing speed and the dependency ratio as in the EBA IMF exercise.
Financial centre, own currency share in world reserves and reserves: These variables were taken from the IMF EBA database. They were enlarged to 1980 using information from the corresponding IMF annual reports.
Private sector credit: For most of the countries this variable came from the BIS database on credit. For the remaining ones from the World Bank database.
M2 and private sector deposits: They were taken from the World Bank database. In some cases it was necessary to use domestic sources to fulfil data gaps.
Gini Index: It comes from the Standardised World Income Inequality Database and the OECD.
Financial reforms index: it is taken from Abiad et al (2008).
VIX, US short term interest rate and corporate credit spreads: They come from the FRED database. The short term interest rate corresponds to the three-months and the spreads to that calculated by Moody’s.
Gross fixed capital formation deflator: It has been obtained from the OECD database and domestic sources.
31 The full data set is available upon request.
38 WP707 Global imbalances from a stock perspective. The asymmetry between creditors and debtors
Employment: It is taken from the IMF WEO database combined in some cases both with the ILO database and domestic sources.
Openness degree: It is defined as exports plus imports form the balance of payments statistics divided on GDP.
Commodities terms of trade: It was taken from the IMF EBA database and extended using a similar definition but considering less categories of commodities.
Structural public balance: Headline public balance was obtained from the IMF WEO data base and domestic sources. Following IMF EBA calculations, the structural component corresponds to the residual of a country by country regression of this variable on the output gap.
Institutional and political environment: It was taken from the WB database on governance indicators.
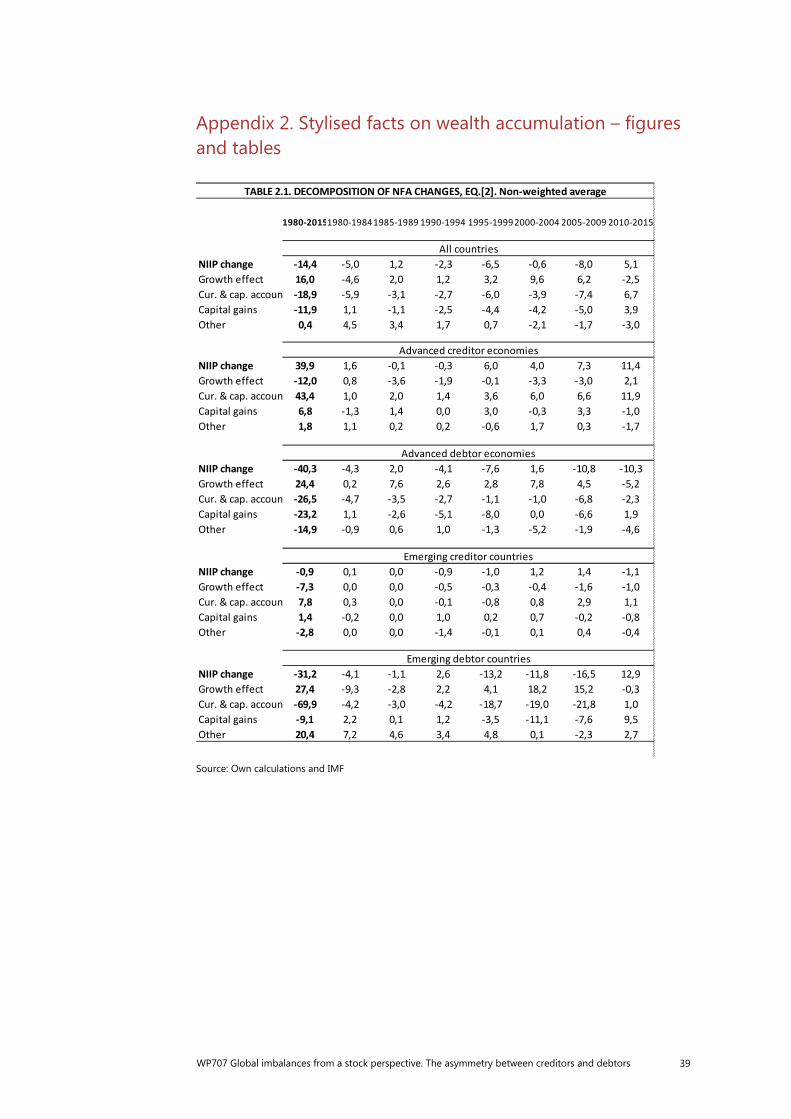
WP707 Global imbalances from a stock perspective. The asymmetry between creditors and debtors 39
Appendix 2. Stylised facts on wealth accumulation – figures and tables
Source: Own calculations and IMF
1980-20151980-19841985-1989 1990-1994 1995-19992000-2004 2005-2009 2010-2015
NIIP change -14,4 -5,0 1,2 -2,3 -6,5 -0,6 -8,0 5,1Growth effect 16,0 -4,6 2,0 1,2 3,2 9,6 6,2 -2,5Cur. & cap. accoun -18,9 -5,9 -3,1 -2,7 -6,0 -3,9 -7,4 6,7Capital gains -11,9 1,1 -1,1 -2,5 -4,4 -4,2 -5,0 3,9Other 0,4 4,5 3,4 1,7 0,7 -2,1 -1,7 -3,0
NIIP change 39,9 1,6 -0,1 -0,3 6,0 4,0 7,3 11,4Growth effect -12,0 0,8 -3,6 -1,9 -0,1 -3,3 -3,0 2,1Cur. & cap. accoun 43,4 1,0 2,0 1,4 3,6 6,0 6,6 11,9Capital gains 6,8 -1,3 1,4 0,0 3,0 -0,3 3,3 -1,0Other 1,8 1,1 0,2 0,2 -0,6 1,7 0,3 -1,7
NIIP change -40,3 -4,3 2,0 -4,1 -7,6 1,6 -10,8 -10,3Growth effect 24,4 0,2 7,6 2,6 2,8 7,8 4,5 -5,2Cur. & cap. accoun -26,5 -4,7 -3,5 -2,7 -1,1 -1,0 -6,8 -2,3Capital gains -23,2 1,1 -2,6 -5,1 -8,0 0,0 -6,6 1,9Other -14,9 -0,9 0,6 1,0 -1,3 -5,2 -1,9 -4,6
NIIP change -0,9 0,1 0,0 -0,9 -1,0 1,2 1,4 -1,1Growth effect -7,3 0,0 0,0 -0,5 -0,3 -0,4 -1,6 -1,0Cur. & cap. accoun 7,8 0,3 0,0 -0,1 -0,8 0,8 2,9 1,1Capital gains 1,4 -0,2 0,0 1,0 0,2 0,7 -0,2 -0,8Other -2,8 0,0 0,0 -1,4 -0,1 0,1 0,4 -0,4
NIIP change -31,2 -4,1 -1,1 2,6 -13,2 -11,8 -16,5 12,9Growth effect 27,4 -9,3 -2,8 2,2 4,1 18,2 15,2 -0,3Cur. & cap. accoun -69,9 -4,2 -3,0 -4,2 -18,7 -19,0 -21,8 1,0Capital gains -9,1 2,2 0,1 1,2 -3,5 -11,1 -7,6 9,5Other 20,4 7,2 4,6 3,4 4,8 0,1 -2,3 2,7
Emerging debtor countries
TABLE 2.1. DECOMPOSITION OF NFA CHANGES, EQ.[2]. Non-weighted average
All countries
Advanced creditor economies
Advanced debtor economies
Emerging creditor countries
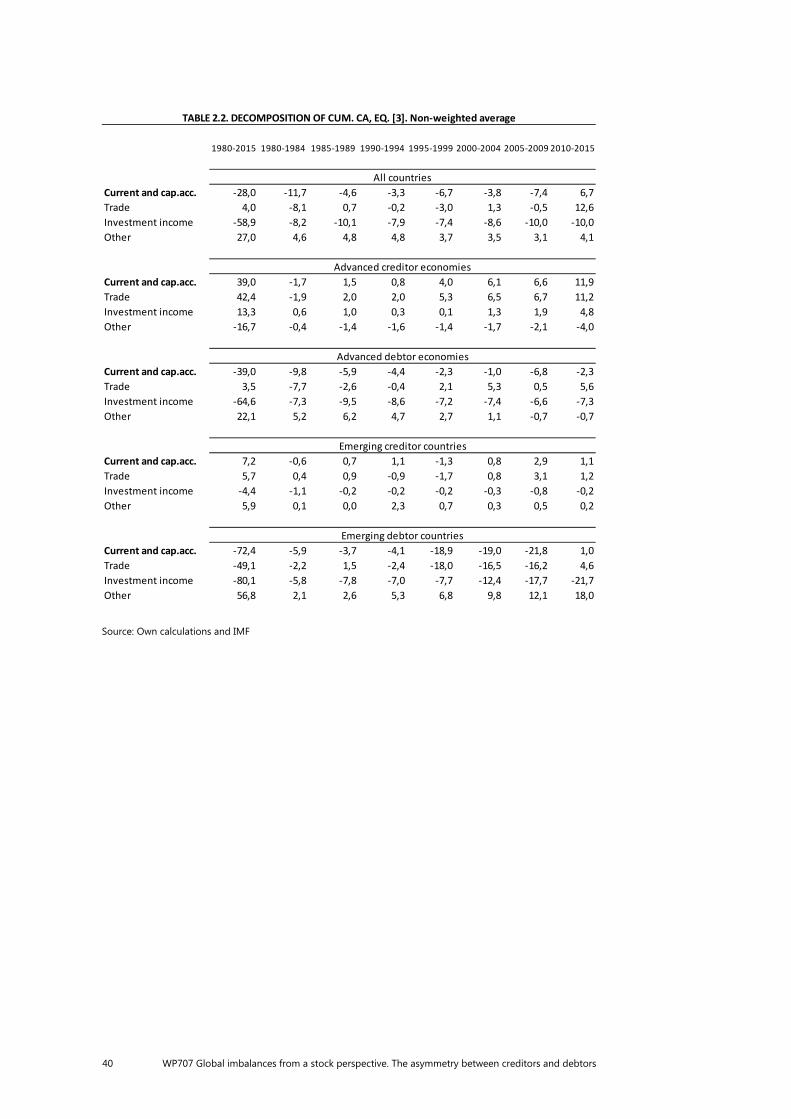
40 WP707 Global imbalances from a stock perspective. The asymmetry between creditors and debtors
Source: Own calculations and IMF
1980-2015 1980-1984 1985-1989 1990-1994 1995-1999 2000-2004 2005-2009 2010-2015
Current and cap.acc. -28,0 -11,7 -4,6 -3,3 -6,7 -3,8 -7,4 6,7Trade 4,0 -8,1 0,7 -0,2 -3,0 1,3 -0,5 12,6Investment income -58,9 -8,2 -10,1 -7,9 -7,4 -8,6 -10,0 -10,0Other 27,0 4,6 4,8 4,8 3,7 3,5 3,1 4,1
Current and cap.acc. 39,0 -1,7 1,5 0,8 4,0 6,1 6,6 11,9Trade 42,4 -1,9 2,0 2,0 5,3 6,5 6,7 11,2Investment income 13,3 0,6 1,0 0,3 0,1 1,3 1,9 4,8Other -16,7 -0,4 -1,4 -1,6 -1,4 -1,7 -2,1 -4,0
Current and cap.acc. -39,0 -9,8 -5,9 -4,4 -2,3 -1,0 -6,8 -2,3Trade 3,5 -7,7 -2,6 -0,4 2,1 5,3 0,5 5,6Investment income -64,6 -7,3 -9,5 -8,6 -7,2 -7,4 -6,6 -7,3Other 22,1 5,2 6,2 4,7 2,7 1,1 -0,7 -0,7
Current and cap.acc. 7,2 -0,6 0,7 1,1 -1,3 0,8 2,9 1,1Trade 5,7 0,4 0,9 -0,9 -1,7 0,8 3,1 1,2Investment income -4,4 -1,1 -0,2 -0,2 -0,2 -0,3 -0,8 -0,2Other 5,9 0,1 0,0 2,3 0,7 0,3 0,5 0,2
Current and cap.acc. -72,4 -5,9 -3,7 -4,1 -18,9 -19,0 -21,8 1,0Trade -49,1 -2,2 1,5 -2,4 -18,0 -16,5 -16,2 4,6Investment income -80,1 -5,8 -7,8 -7,0 -7,7 -12,4 -17,7 -21,7Other 56,8 2,1 2,6 5,3 6,8 9,8 12,1 18,0
Emerging creditor countries
Emerging debtor countries
TABLE 2.2. DECOMPOSITION OF CUM. CA, EQ. [3]. Non-weighted average
All countries
Advanced creditor economies
Advanced debtor economies
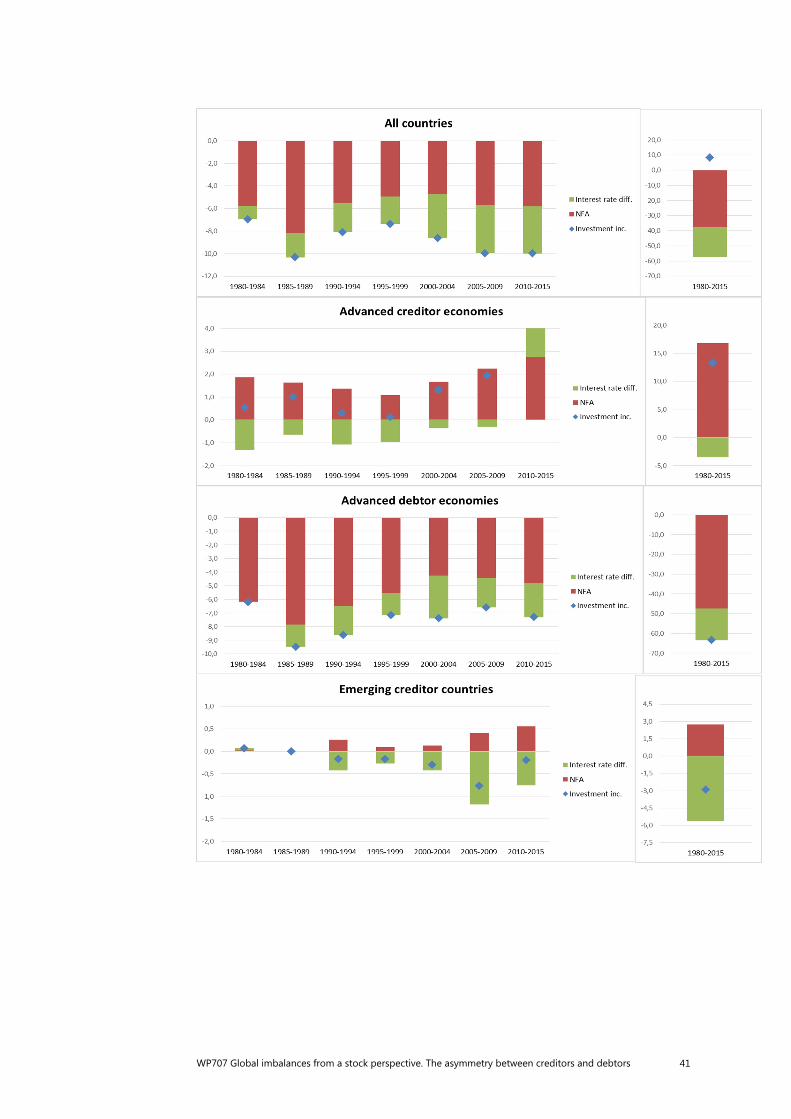
WP707 Global imbalances from a stock perspective. The asymmetry between creditors and debtors 41
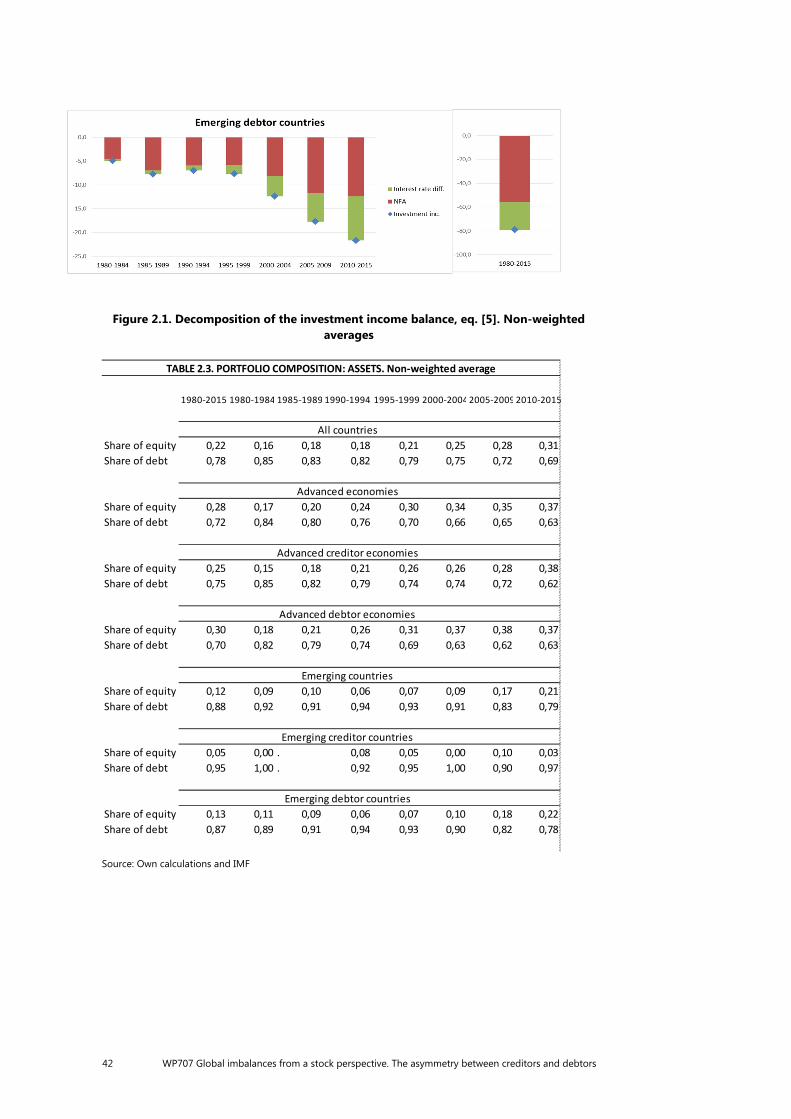
42 WP707 Global imbalances from a stock perspective. The asymmetry between creditors and debtors
Figure 2.1. Decomposition of the investment income balance, eq. [5]. Non-weighted averages
Source: Own calculations and IMF
1980-2015 1980-1984 1985-1989 1990-1994 1995-1999 2000-20042005-20092010-2015
All countriesShare of equity 0,22 0,16 0,18 0,18 0,21 0,25 0,28 0,31Share of debt 0,78 0,85 0,83 0,82 0,79 0,75 0,72 0,69
Advanced economiesShare of equity 0,28 0,17 0,20 0,24 0,30 0,34 0,35 0,37Share of debt 0,72 0,84 0,80 0,76 0,70 0,66 0,65 0,63
Advanced creditor economiesShare of equity 0,25 0,15 0,18 0,21 0,26 0,26 0,28 0,38Share of debt 0,75 0,85 0,82 0,79 0,74 0,74 0,72 0,62
Advanced debtor economiesShare of equity 0,30 0,18 0,21 0,26 0,31 0,37 0,38 0,37Share of debt 0,70 0,82 0,79 0,74 0,69 0,63 0,62 0,63
Emerging countriesShare of equity 0,12 0,09 0,10 0,06 0,07 0,09 0,17 0,21Share of debt 0,88 0,92 0,91 0,94 0,93 0,91 0,83 0,79
Emerging creditor countriesShare of equity 0,05 0,00 . 0,08 0,05 0,00 0,10 0,03Share of debt 0,95 1,00 . 0,92 0,95 1,00 0,90 0,97
Emerging debtor countriesShare of equity 0,13 0,11 0,09 0,06 0,07 0,10 0,18 0,22Share of debt 0,87 0,89 0,91 0,94 0,93 0,90 0,82 0,78
TABLE 2.3. PORTFOLIO COMPOSITION: ASSETS. Non-weighted average
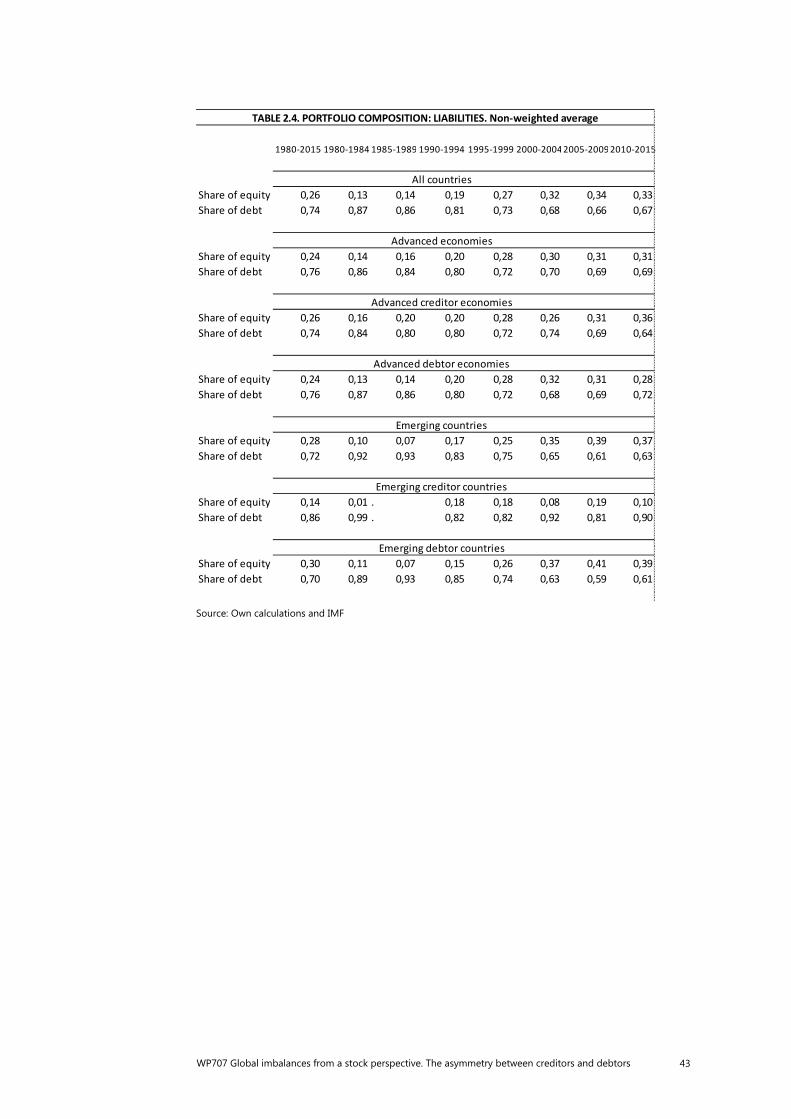
WP707 Global imbalances from a stock perspective. The asymmetry between creditors and debtors 43
Source: Own calculations and IMF
1980-2015 1980-1984 1985-1989 1990-1994 1995-1999 2000-20042005-20092010-2015
All countriesShare of equity 0,26 0,13 0,14 0,19 0,27 0,32 0,34 0,33Share of debt 0,74 0,87 0,86 0,81 0,73 0,68 0,66 0,67
Advanced economiesShare of equity 0,24 0,14 0,16 0,20 0,28 0,30 0,31 0,31Share of debt 0,76 0,86 0,84 0,80 0,72 0,70 0,69 0,69
Advanced creditor economiesShare of equity 0,26 0,16 0,20 0,20 0,28 0,26 0,31 0,36Share of debt 0,74 0,84 0,80 0,80 0,72 0,74 0,69 0,64
Advanced debtor economiesShare of equity 0,24 0,13 0,14 0,20 0,28 0,32 0,31 0,28Share of debt 0,76 0,87 0,86 0,80 0,72 0,68 0,69 0,72
Emerging countriesShare of equity 0,28 0,10 0,07 0,17 0,25 0,35 0,39 0,37Share of debt 0,72 0,92 0,93 0,83 0,75 0,65 0,61 0,63
Emerging creditor countriesShare of equity 0,14 0,01 . 0,18 0,18 0,08 0,19 0,10Share of debt 0,86 0,99 . 0,82 0,82 0,92 0,81 0,90
Emerging debtor countriesShare of equity 0,30 0,11 0,07 0,15 0,26 0,37 0,41 0,39Share of debt 0,70 0,89 0,93 0,85 0,74 0,63 0,59 0,61
TABLE 2.4. PORTFOLIO COMPOSITION: LIABILITIES. Non-weighted average
44 WP707 Global imbalances from a stock perspective. The asymmetry between creditors and debtors
Appendix 3. Auxiliary regressions
Some of the regressors included as controls could be endogenous. Therefore, we estimate the equations in the main text by instrumental variables. In order to implement the traditional two-step procedure, we need to run auxiliary regressions to derive the fitted value of the corresponding variables. These regressions for the structural public balance, reserve accumulation, credit-to-GDP ratio, labor productivity and total factor productivity appear below.
The structural component of the fiscal balance depends positively on that at world level, it seems to be quite persistent and it is higher in countries with a fixed FX regime, higher ageing speed, population growth, when higher is expected growth and in situations of global financial stress. On the contrary, it is lower when the oil balance is in surplus and the economy is in expansion. These two last outcomes probably reflect the difficulties in properly correcting observed balances from temporary business cycle fluctuations.
In the case of reserve accumulation, following the EBA results, we have run the regressions country by country, although using the same explanatory variables. As an average, reserve accumulation is higher when other countries do the same, when the FX regime is fixed, when there are financial turbulences at the global level and when countries have positive terms of trade shocks. It is lower when higher is the financial liberalization degree, when higher are the interest rates, and when the structural public balance is showing a surplus.
Finally, the explanatory factors of labor and total factor productivity are basically the same. They are positively correlated with the level of human capital and the output gap, and negatively with the relative price of investment in equipment goods.
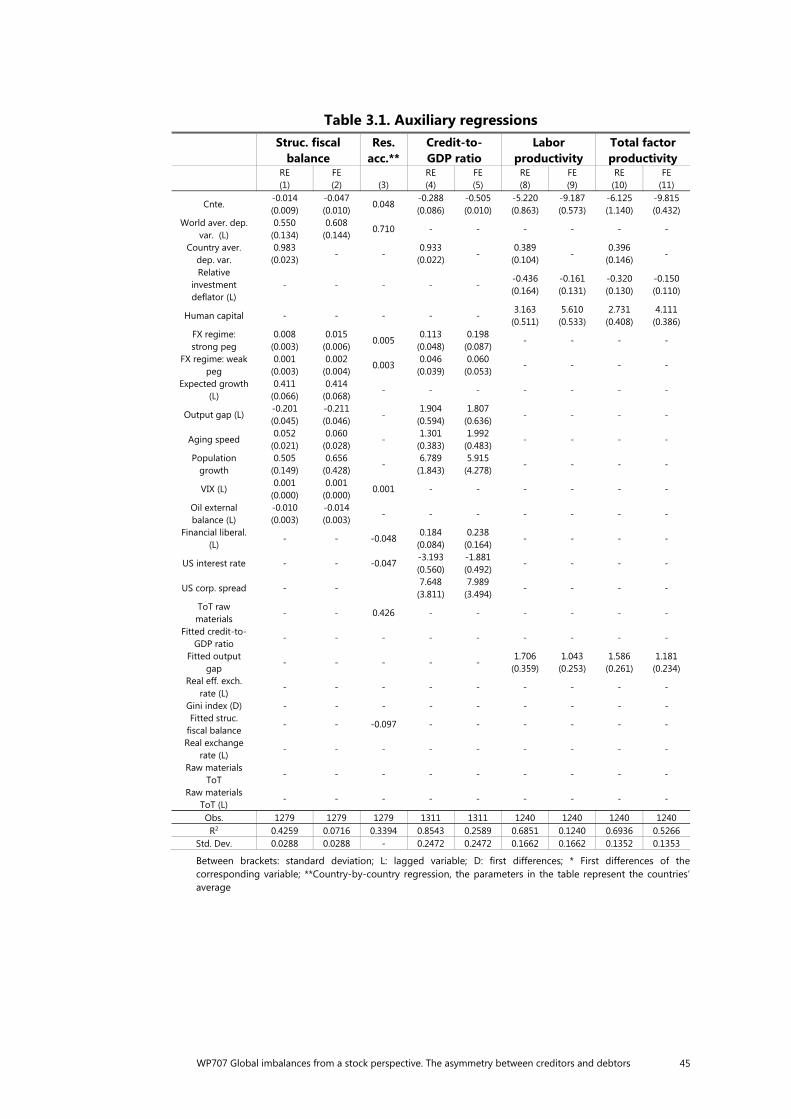
WP707 Global imbalances from a stock perspective. The asymmetry between creditors and debtors 45
Table 3.1. Auxiliary regressions
Struc. fiscal balance
Res. acc.**
Credit-to-GDP ratio
Labor productivity
Total factor productivity
RE (1)
FE (2)
(3)
RE (4)
FE (5)
RE (8)
FE (9)
RE (10)
FE (11)
Cnte. -0.014 (0.009)
-0.047 (0.010)
0.048 -0.288 (0.086)
-0.505 (0.010)
-5.220 (0.863)
-9.187 (0.573)
-6.125 (1.140)
-9.815 (0.432)
World aver. dep. var. (L)
0.550 (0.134)
0.608 (0.144)
0.710 - - - - - -
Country aver. dep. var.
0.983 (0.023)
- - 0.933
(0.022) -
0.389 (0.104)
- 0.396
(0.146) -
Relative investment deflator (L)
- - - - - -0.436 (0.164)
-0.161 (0.131)
-0.320 (0.130)
-0.150 (0.110)
Human capital - - - - - 3.163
(0.511) 5.610
(0.533) 2.731
(0.408) 4.111
(0.386) FX regime: strong peg
0.008 (0.003)
0.015 (0.006)
0.005 0.113
(0.048) 0.198
(0.087) - - - -
FX regime: weak peg
0.001 (0.003)
0.002 (0.004)
0.003 0.046
(0.039) 0.060
(0.053) - - - -
Expected growth (L)
0.411 (0.066)
0.414 (0.068)
- - - - - - -
Output gap (L) -0.201 (0.045)
-0.211 (0.046)
- 1.904
(0.594) 1.807
(0.636) - - - -
Aging speed 0.052
(0.021) 0.060
(0.028) -
1.301 (0.383)
1.992 (0.483)
- - - -
Population growth
0.505 (0.149)
0.656 (0.428)
- 6.789
(1.843) 5.915
(4.278) - - - -
VIX (L) 0.001
(0.000) 0.001
(0.000) 0.001 - - - - - -
Oil external balance (L)
-0.010 (0.003)
-0.014 (0.003)
- - - - - - -
Financial liberal. (L)
- - -0.048 0.184
(0.084) 0.238
(0.164) - - - -
US interest rate - - -0.047 -3.193 (0.560)
-1.881 (0.492)
- - - -
US corp. spread - - 7.648
(3.811) 7.989
(3.494) - - - -
ToT raw materials
- - 0.426 - - - - - -
Fitted credit-to-GDP ratio
- - - - - - - - -
Fitted output gap
- - - - - 1.706
(0.359) 1.043
(0.253) 1.586
(0.261) 1.181
(0.234) Real eff. exch.
rate (L) - - - - - - - - -
Gini index (D) - - - - - - - - - Fitted struc.
fiscal balance - - -0.097 - - - - - -
Real exchange rate (L)
- - - - - - - - -
Raw materials ToT
- - - - - - - - -
Raw materials ToT (L)
- - - - - - - - -
Obs. 1279 1279 1279 1311 1311 1240 1240 1240 1240 R2 0.4259 0.0716 0.3394 0.8543 0.2589 0.6851 0.1240 0.6936 0.5266
Std. Dev. 0.0288 0.0288 - 0.2472 0.2472 0.1662 0.1662 0.1352 0.1353
Between brackets: standard deviation; L: lagged variable; D: first differences; * First differences of the corresponding variable; **Country-by-country regression, the parameters in the table represent the countries’ average
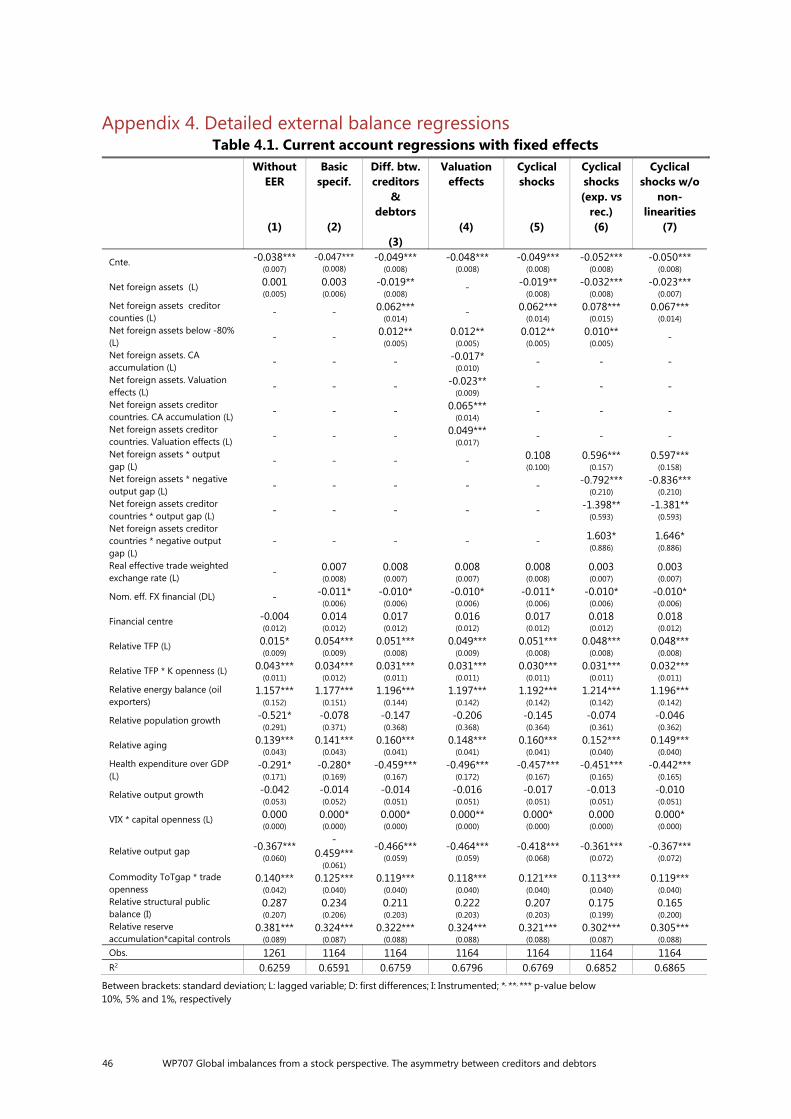
46 WP707 Global imbalances from a stock perspective. The asymmetry between creditors and debtors
Appendix 4. Detailed external balance regressions Table 4.1. Current account regressions with fixed effects
Without EER
(1)
Basic specif.
(2)
Diff. btw. creditors
& debtors
(3)
Valuation effects
(4)
Cyclical shocks
(5)
Cyclical shocks (exp. vs
rec.) (6)
Cyclical shocks w/o
non-linearities
(7)
Cnte. -0.038*** (0.007)
-0.047*** (0.008)
-0.049*** (0.008)
-0.048*** (0.008)
-0.049*** (0.008)
-0.052*** (0.008)
-0.050*** (0.008)
Net foreign assets (L) 0.001 (0.005)
0.003 (0.006)
-0.019** (0.008)
- -0.019** (0.008)
-0.032*** (0.008)
-0.023*** (0.007)
Net foreign assets creditor counties (L) - - 0.062***
(0.014)- 0.062***
(0.014)0.078***
(0.015) 0.067***
(0.014)Net foreign assets below -80% (L) - - 0.012**
(0.005)0.012**
(0.005)0.012**
(0.005)0.010**
(0.005) -
Net foreign assets. CA accumulation (L) - - - -0.017*
(0.010)- - -
Net foreign assets. Valuation effects (L) - - - -0.023**
(0.009)- - -
Net foreign assets creditor countries. CA accumulation (L) - - - 0.065***
(0.014)- - -
Net foreign assets creditor countries. Valuation effects (L) - - - 0.049***
(0.017)- - -
Net foreign assets * output gap (L) - - - - 0.108
(0.100)0.596***
(0.157) 0.597***
(0.158)Net foreign assets * negative output gap (L) - - - - - -0.792***
(0.210) -0.836***
(0.210)Net foreign assets creditor countries * output gap (L) - - - - - -1.398**
(0.593) -1.381**
(0.593)Net foreign assets creditor countries * negative output gap (L)
- - - - - 1.603* (0.886)
1.646* (0.886)
Real effective trade weighted exchange rate (L) - 0.007
(0.008)0.008 (0.007)
0.008 (0.007)
0.008 (0.008)
0.003 (0.007)
0.003 (0.007)
Nom. eff. FX financial (DL) - -0.011* (0.006)
-0.010* (0.006)
-0.010* (0.006)
-0.011* (0.006)
-0.010* (0.006)
-0.010* (0.006)
Financial centre -0.004 (0.012)
0.014 (0.012)
0.017 (0.012)
0.016 (0.012)
0.017 (0.012)
0.018 (0.012)
0.018 (0.012)
Relative TFP (L) 0.015* (0.009)
0.054*** (0.009)
0.051*** (0.008)
0.049*** (0.009)
0.051*** (0.008)
0.048*** (0.008)
0.048*** (0.008)
Relative TFP * K openness (L) 0.043*** (0.011)
0.034*** (0.012)
0.031*** (0.011)
0.031*** (0.011)
0.030*** (0.011)
0.031*** (0.011)
0.032*** (0.011)
Relative energy balance (oil exporters)
1.157*** (0.152)
1.177*** (0.151)
1.196*** (0.144)
1.197*** (0.142)
1.192*** (0.142)
1.214*** (0.142)
1.196*** (0.142)
Relative population growth -0.521* (0.291)
-0.078 (0.371)
-0.147 (0.368)
-0.206 (0.368)
-0.145 (0.364)
-0.074 (0.361)
-0.046 (0.362)
Relative aging 0.139*** (0.043)
0.141*** (0.043)
0.160*** (0.041)
0.148*** (0.041)
0.160*** (0.041)
0.152*** (0.040)
0.149*** (0.040)
Health expenditure over GDP (L)
-0.291* (0.171)
-0.280* (0.169)
-0.459*** (0.167)
-0.496*** (0.172)
-0.457*** (0.167)
-0.451*** (0.165)
-0.442*** (0.165)
Relative output growth -0.042 (0.053)
-0.014 (0.052)
-0.014 (0.051)
-0.016 (0.051)
-0.017 (0.051)
-0.013 (0.051)
-0.010 (0.051)
VIX * capital openness (L) 0.000 (0.000)
0.000* (0.000)
0.000* (0.000)
0.000** (0.000)
0.000* (0.000)
0.000 (0.000)
0.000* (0.000)
Relative output gap -0.367*** (0.060)
-0.459***
(0.061)
-0.466*** (0.059)
-0.464*** (0.059)
-0.418*** (0.068)
-0.361*** (0.072)
-0.367*** (0.072)
Commodity ToTgap * trade openness
0.140*** (0.042)
0.125*** (0.040)
0.119*** (0.040)
0.118*** (0.040)
0.121*** (0.040)
0.113*** (0.040)
0.119*** (0.040)
Relative structural public balance (I)
0.287 (0.207)
0.234 (0.206)
0.211 (0.203)
0.222 (0.203)
0.207 (0.203)
0.175 (0.199)
0.165 (0.200)
Relative reserve accumulation*capital controls
0.381*** (0.089)
0.324*** (0.087)
0.322*** (0.088)
0.324*** (0.088)
0.321*** (0.088)
0.302*** (0.087)
0.305*** (0.088)
Obs. 1261 1164 1164 1164 1164 1164 1164 R2 0.6259 0.6591 0.6759 0.6796 0.6769 0.6852 0.6865
Between brackets: standard deviation; L: lagged variable; D: first differences; I: Instrumented; *, **, *** p-value below 10%, 5% and 1%, respectively
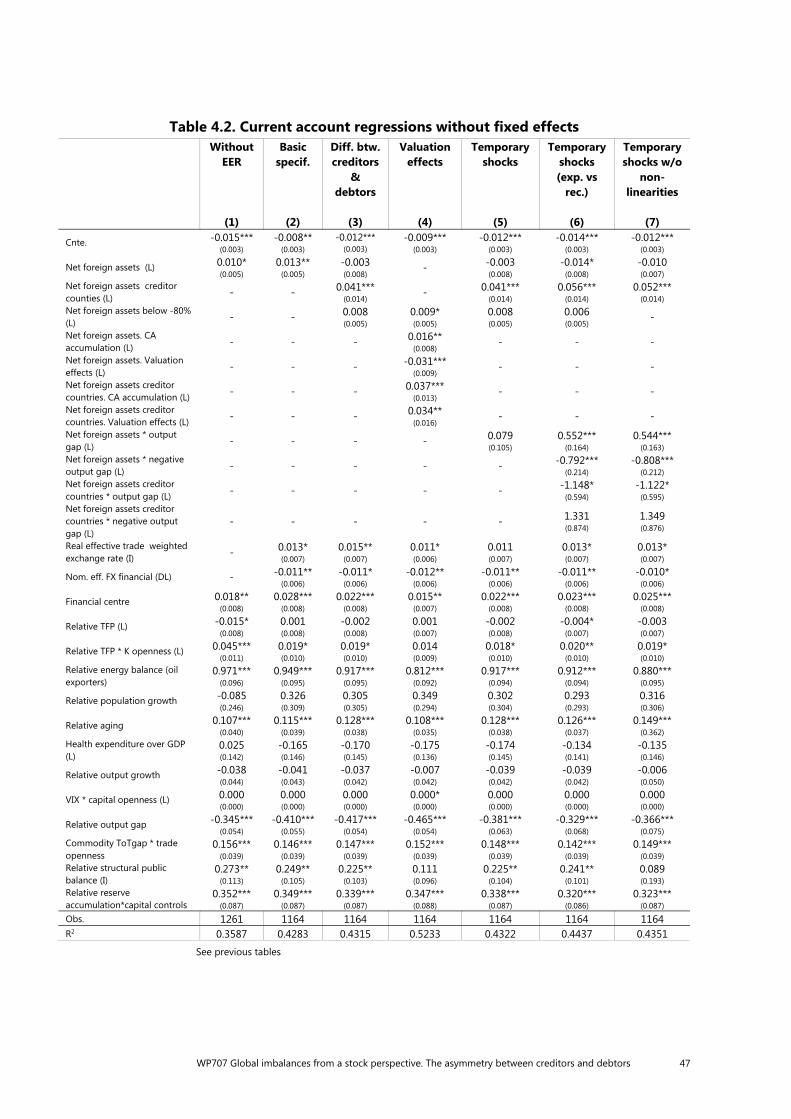
WP707 Global imbalances from a stock perspective. The asymmetry between creditors and debtors 47
See previous tables
Table 4.2. Current account regressions without fixed effects Without
EER
(1)
Basic specif.
(2)
Diff. btw. creditors
& debtors
(3)
Valuation effects
(4)
Temporary shocks
(5)
Temporary shocks (exp. vs
rec.)
(6)
Temporary shocks w/o
non-linearities
(7)
Cnte. -0.015*** (0.003)
-0.008** (0.003)
-0.012*** (0.003)
-0.009*** (0.003)
-0.012*** (0.003)
-0.014*** (0.003)
-0.012*** (0.003)
Net foreign assets (L) 0.010* (0.005)
0.013** (0.005)
-0.003 (0.008)
- -0.003 (0.008)
-0.014* (0.008)
-0.010 (0.007)
Net foreign assets creditor counties (L) - - 0.041***
(0.014)- 0.041***
(0.014)0.056***
(0.014) 0.052***
(0.014)Net foreign assets below -80% (L) - - 0.008
(0.005)0.009* (0.005)
0.008 (0.005)
0.006 (0.005) -
Net foreign assets. CA accumulation (L) - - - 0.016**
(0.008)- - -
Net foreign assets. Valuation effects (L) - - - -0.031***
(0.009)- - -
Net foreign assets creditor countries. CA accumulation (L) - - - 0.037***
(0.013)- - -
Net foreign assets creditor countries. Valuation effects (L) - - - 0.034**
(0.016)- - -
Net foreign assets * output gap (L) - - - - 0.079
(0.105)0.552***
(0.164) 0.544***
(0.163)Net foreign assets * negative output gap (L) - - - - - -0.792***
(0.214) -0.808***
(0.212)Net foreign assets creditor countries * output gap (L) - - - - - -1.148*
(0.594) -1.122*
(0.595)Net foreign assets creditor countries * negative output gap (L)
- - - - - 1.331 (0.874)
1.349 (0.876)
Real effective trade weighted exchange rate (I) - 0.013*
(0.007) 0.015**
(0.007)0.011* (0.006)
0.011 (0.007)
0.013* (0.007)
0.013* (0.007)
Nom. eff. FX financial (DL) - -0.011** (0.006)
-0.011* (0.006)
-0.012** (0.006)
-0.011** (0.006)
-0.011** (0.006)
-0.010* (0.006)
Financial centre 0.018** (0.008)
0.028*** (0.008)
0.022*** (0.008)
0.015** (0.007)
0.022*** (0.008)
0.023*** (0.008)
0.025*** (0.008)
Relative TFP (L) -0.015* (0.008)
0.001 (0.008)
-0.002 (0.008)
0.001 (0.007)
-0.002 (0.008)
-0.004* (0.007)
-0.003 (0.007)
Relative TFP * K openness (L) 0.045*** (0.011)
0.019* (0.010)
0.019* (0.010)
0.014 (0.009)
0.018* (0.010)
0.020** (0.010)
0.019* (0.010)
Relative energy balance (oil exporters)
0.971*** (0.096)
0.949*** (0.095)
0.917*** (0.095)
0.812*** (0.092)
0.917*** (0.094)
0.912*** (0.094)
0.880*** (0.095)
Relative population growth -0.085 (0.246)
0.326 (0.309)
0.305 (0.305)
0.349 (0.294)
0.302 (0.304)
0.293 (0.293)
0.316 (0.306)
Relative aging 0.107*** (0.040)
0.115*** (0.039)
0.128*** (0.038)
0.108*** (0.035)
0.128*** (0.038)
0.126*** (0.037)
0.149*** (0.362)
Health expenditure over GDP (L)
0.025 (0.142)
-0.165 (0.146)
-0.170 (0.145)
-0.175 (0.136)
-0.174 (0.145)
-0.134 (0.141)
-0.135 (0.146)
Relative output growth -0.038 (0.044)
-0.041 (0.043)
-0.037 (0.042)
-0.007 (0.042)
-0.039 (0.042)
-0.039 (0.042)
-0.006 (0.050)
VIX * capital openness (L) 0.000 (0.000)
0.000 (0.000)
0.000 (0.000)
0.000* (0.000)
0.000 (0.000)
0.000 (0.000)
0.000 (0.000)
Relative output gap -0.345*** (0.054)
-0.410*** (0.055)
-0.417*** (0.054)
-0.465*** (0.054)
-0.381*** (0.063)
-0.329*** (0.068)
-0.366*** (0.075)
Commodity ToTgap * trade openness
0.156*** (0.039)
0.146*** (0.039)
0.147*** (0.039)
0.152*** (0.039)
0.148*** (0.039)
0.142*** (0.039)
0.149*** (0.039)
Relative structural public balance (I)
0.273** (0.113)
0.249** (0.105)
0.225** (0.103)
0.111 (0.096)
0.225** (0.104)
0.241** (0.101)
0.089 (0.193)
Relative reserve accumulation*capital controls
0.352*** (0.087)
0.349*** (0.087)
0.339*** (0.087)
0.347*** (0.088)
0.338*** (0.087)
0.320*** (0.086)
0.323*** (0.087)
Obs. 1261 1164 1164 1164 1164 1164 1164 R2 0.3587 0.4283 0.4315 0.5233 0.4322 0.4437 0.4351
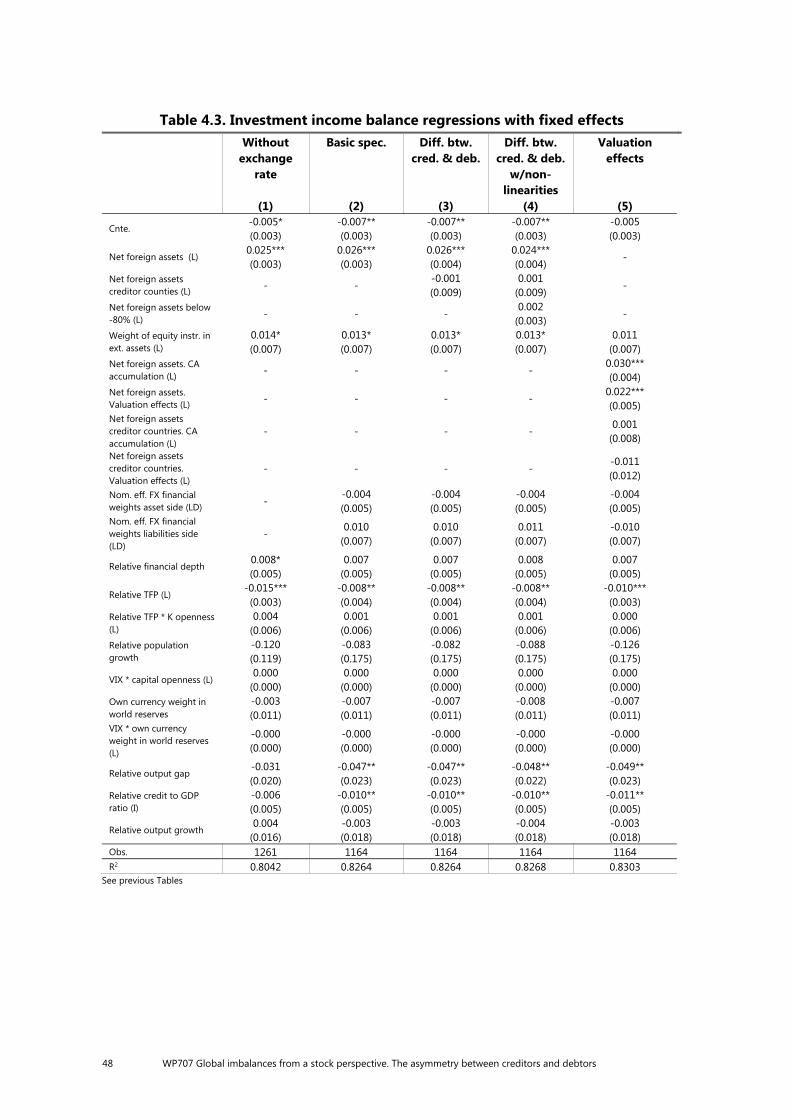
48 WP707 Global imbalances from a stock perspective. The asymmetry between creditors and debtors
Table 4.3. Investment income balance regressions with fixed effects Without
exchange rate
(1)
Basic spec.
(2)
Diff. btw. cred. & deb.
(3)
Diff. btw. cred. & deb.
w/non-linearities
(4)
Valuation effects
(5)
Cnte. -0.005* (0.003)
-0.007** (0.003)
-0.007** (0.003)
-0.007** (0.003)
-0.005 (0.003)
Net foreign assets (L) 0.025*** (0.003)
0.026*** (0.003)
0.026*** (0.004)
0.024*** (0.004)
-
Net foreign assets creditor counties (L) - -
-0.001 (0.009)
0.001 (0.009)
-
Net foreign assets below -80% (L) - - -
0.002 (0.003)
-
Weight of equity instr. in ext. assets (L)
0.014* (0.007)
0.013* (0.007)
0.013* (0.007)
0.013* (0.007)
0.011 (0.007)
Net foreign assets. CA accumulation (L) - - - -
0.030*** (0.004)
Net foreign assets. Valuation effects (L) - - - -
0.022*** (0.005)
Net foreign assets creditor countries. CA accumulation (L)
- - - - 0.001
(0.008) Net foreign assets creditor countries. Valuation effects (L)
- - - - -0.011 (0.012)
Nom. eff. FX financial weights asset side (LD) -
-0.004 (0.005)
-0.004 (0.005)
-0.004 (0.005)
-0.004 (0.005)
Nom. eff. FX financial weights liabilities side (LD)
- 0.010
(0.007) 0.010
(0.007) 0.011
(0.007) -0.010 (0.007)
Relative financial depth 0.008* (0.005)
0.007 (0.005)
0.007 (0.005)
0.008 (0.005)
0.007 (0.005)
Relative TFP (L) -0.015*** (0.003)
-0.008** (0.004)
-0.008** (0.004)
-0.008** (0.004)
-0.010*** (0.003)
Relative TFP * K openness (L)
0.004 (0.006)
0.001 (0.006)
0.001 (0.006)
0.001 (0.006)
0.000 (0.006)
Relative population growth
-0.120 (0.119)
-0.083 (0.175)
-0.082 (0.175)
-0.088 (0.175)
-0.126 (0.175)
VIX * capital openness (L) 0.000
(0.000) 0.000
(0.000) 0.000
(0.000) 0.000
(0.000) 0.000
(0.000) Own currency weight in world reserves
-0.003 (0.011)
-0.007 (0.011)
-0.007 (0.011)
-0.008 (0.011)
-0.007 (0.011)
VIX * own currency weight in world reserves (L)
-0.000 (0.000)
-0.000 (0.000)
-0.000 (0.000)
-0.000 (0.000)
-0.000 (0.000)
Relative output gap -0.031 (0.020)
-0.047** (0.023)
-0.047** (0.023)
-0.048** (0.022)
-0.049** (0.023)
Relative credit to GDP ratio (I)
-0.006 (0.005)
-0.010** (0.005)
-0.010** (0.005)
-0.010** (0.005)
-0.011** (0.005)
Relative output growth 0.004
(0.016) -0.003 (0.018)
-0.003 (0.018)
-0.004 (0.018)
-0.003 (0.018)
Obs. 1261 1164 1164 1164 1164 R2 0.8042 0.8264 0.8264 0.8268 0.8303
See previous Tables
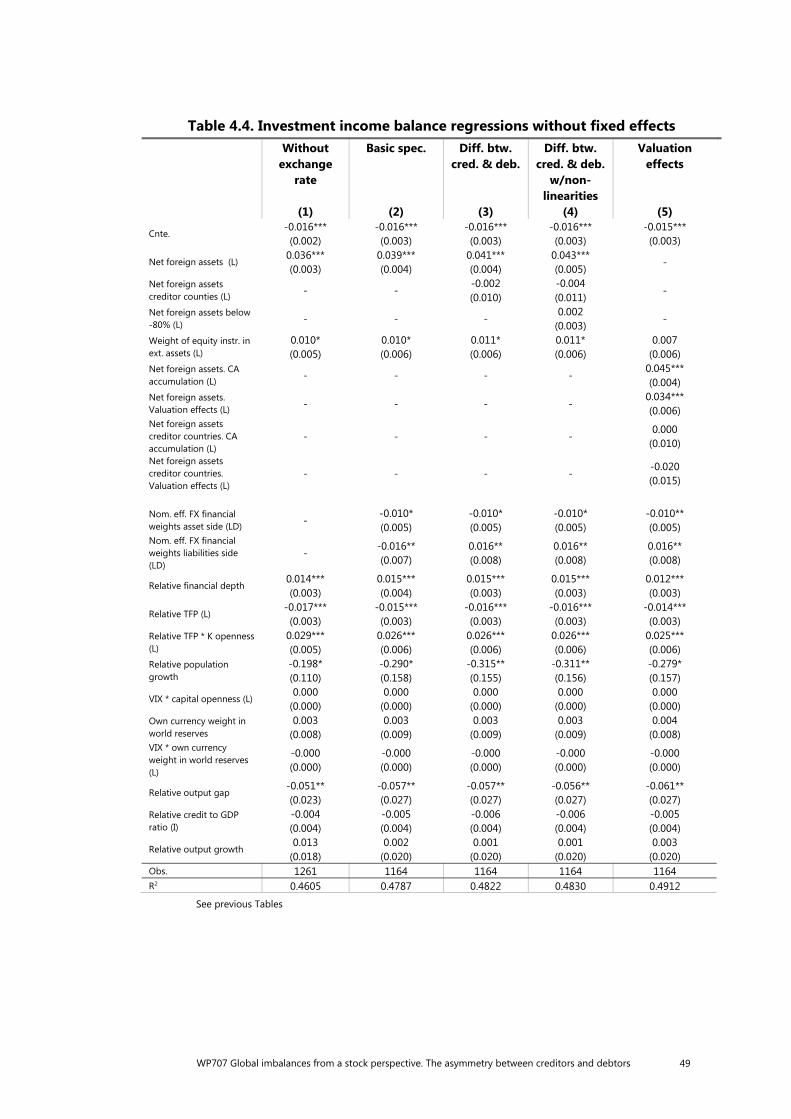
WP707 Global imbalances from a stock perspective. The asymmetry between creditors and debtors 49
See previous Tables
Table 4.4. Investment income balance regressions without fixed effects Without
exchange rate
(1)
Basic spec.
(2)
Diff. btw. cred. & deb.
(3)
Diff. btw. cred. & deb.
w/non-linearities
(4)
Valuation effects
(5)
Cnte. -0.016*** (0.002)
-0.016*** (0.003)
-0.016*** (0.003)
-0.016*** (0.003)
-0.015*** (0.003)
Net foreign assets (L) 0.036*** (0.003)
0.039*** (0.004)
0.041*** (0.004)
0.043*** (0.005)
-
Net foreign assets creditor counties (L) - -
-0.002 (0.010)
-0.004 (0.011)
-
Net foreign assets below -80% (L) - - -
0.002 (0.003)
-
Weight of equity instr. in ext. assets (L)
0.010* (0.005)
0.010* (0.006)
0.011* (0.006)
0.011* (0.006)
0.007 (0.006)
Net foreign assets. CA accumulation (L) - - - -
0.045*** (0.004)
Net foreign assets. Valuation effects (L) - - - -
0.034*** (0.006)
Net foreign assets creditor countries. CA accumulation (L)
- - - - 0.000
(0.010) Net foreign assets creditor countries. Valuation effects (L)
- - - - -0.020 (0.015)
Nom. eff. FX financial weights asset side (LD) -
-0.010* (0.005)
-0.010* (0.005)
-0.010* (0.005)
-0.010** (0.005)
Nom. eff. FX financial weights liabilities side (LD)
- -0.016** (0.007)
0.016** (0.008)
0.016** (0.008)
0.016** (0.008)
Relative financial depth 0.014*** (0.003)
0.015*** (0.004)
0.015*** (0.003)
0.015*** (0.003)
0.012*** (0.003)
Relative TFP (L) -0.017*** (0.003)
-0.015*** (0.003)
-0.016*** (0.003)
-0.016*** (0.003)
-0.014*** (0.003)
Relative TFP * K openness (L)
0.029*** (0.005)
0.026*** (0.006)
0.026*** (0.006)
0.026*** (0.006)
0.025*** (0.006)
Relative population growth
-0.198* (0.110)
-0.290* (0.158)
-0.315** (0.155)
-0.311** (0.156)
-0.279* (0.157)
VIX * capital openness (L) 0.000
(0.000) 0.000
(0.000) 0.000
(0.000) 0.000
(0.000) 0.000
(0.000) Own currency weight in world reserves
0.003 (0.008)
0.003 (0.009)
0.003 (0.009)
0.003 (0.009)
0.004 (0.008)
VIX * own currency weight in world reserves (L)
-0.000 (0.000)
-0.000 (0.000)
-0.000 (0.000)
-0.000 (0.000)
-0.000 (0.000)
Relative output gap -0.051** (0.023)
-0.057** (0.027)
-0.057** (0.027)
-0.056** (0.027)
-0.061** (0.027)
Relative credit to GDP ratio (I)
-0.004 (0.004)
-0.005 (0.004)
-0.006 (0.004)
-0.006 (0.004)
-0.005 (0.004)
Relative output growth 0.013
(0.018) 0.002
(0.020) 0.001
(0.020) 0.001
(0.020) 0.003
(0.020) Obs. 1261 1164 1164 1164 1164 R2 0.4605 0.4787 0.4822 0.4830 0.4912
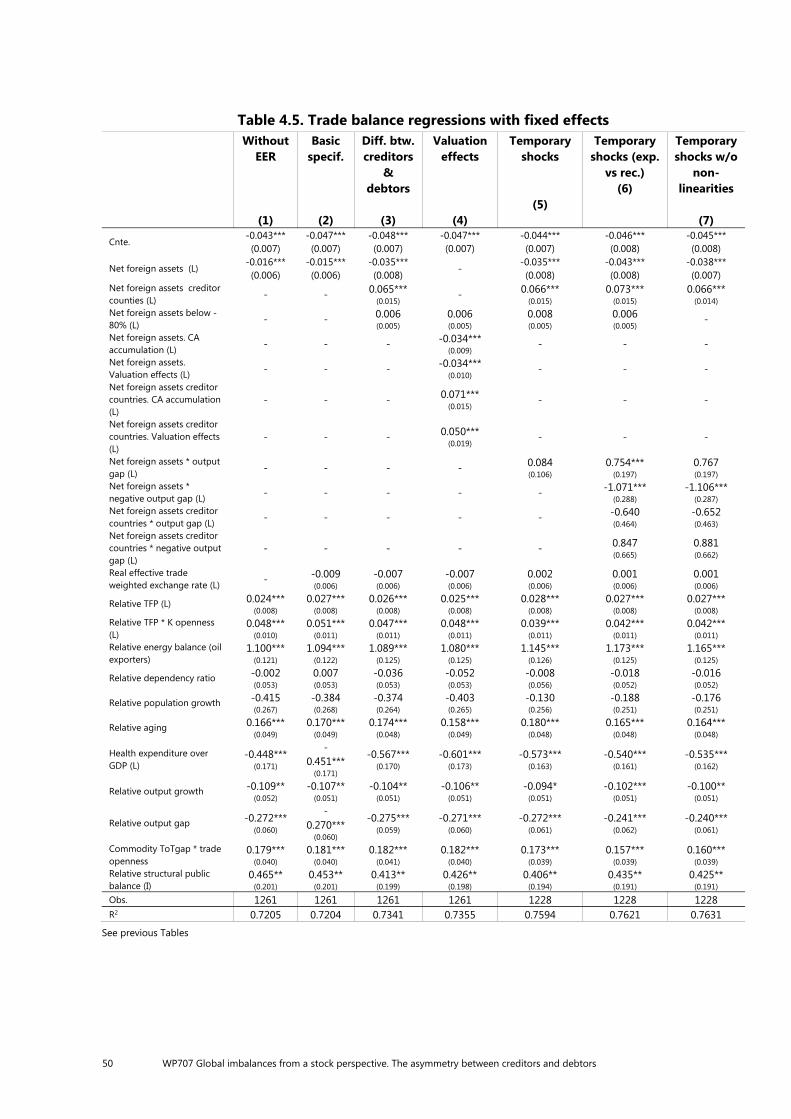
50 WP707 Global imbalances from a stock perspective. The asymmetry between creditors and debtors
Table 4.5. Trade balance regressions with fixed effects Without
EER
(1)
Basic specif.
(2)
Diff. btw. creditors
& debtors
(3)
Valuation effects
(4)
Temporary shocks
(5)
Temporary shocks (exp.
vs rec.) (6)
Temporary shocks w/o
non-linearities
(7)
Cnte. -0.043*** (0.007)
-0.047*** (0.007)
-0.048*** (0.007)
-0.047*** (0.007)
-0.044*** (0.007)
-0.046*** (0.008)
-0.045*** (0.008)
Net foreign assets (L) -0.016*** (0.006)
-0.015*** (0.006)
-0.035*** (0.008)
- -0.035*** (0.008)
-0.043*** (0.008)
-0.038*** (0.007)
Net foreign assets creditor counties (L) - - 0.065***
(0.015)- 0.066***
(0.015)0.073***
(0.015) 0.066***
(0.014)Net foreign assets below -80% (L) - - 0.006
(0.005)0.006 (0.005)
0.008 (0.005)
0.006 (0.005) -
Net foreign assets. CA accumulation (L) - - - -0.034***
(0.009)- - -
Net foreign assets. Valuation effects (L) - - - -0.034***
(0.010)- - -
Net foreign assets creditor countries. CA accumulation (L)
- - - 0.071*** (0.015) - - -
Net foreign assets creditor countries. Valuation effects (L)
- - - 0.050*** (0.019) - - -
Net foreign assets * output gap (L) - - - - 0.084
(0.106)0.754***
(0.197) 0.767 (0.197)
Net foreign assets * negative output gap (L) - - - - - -1.071***
(0.288) -1.106***
(0.287)Net foreign assets creditor countries * output gap (L) - - - - - -0.640
(0.464) -0.652 (0.463)
Net foreign assets creditor countries * negative output gap (L)
- - - - - 0.847 (0.665)
0.881 (0.662)
Real effective trade weighted exchange rate (L) - -0.009
(0.006)-0.007 (0.006)
-0.007 (0.006)
0.002 (0.006)
0.001 (0.006)
0.001 (0.006)
Relative TFP (L) 0.024*** (0.008)
0.027*** (0.008)
0.026*** (0.008)
0.025*** (0.008)
0.028*** (0.008)
0.027*** (0.008)
0.027*** (0.008)
Relative TFP * K openness (L)
0.048*** (0.010)
0.051*** (0.011)
0.047*** (0.011)
0.048*** (0.011)
0.039*** (0.011)
0.042*** (0.011)
0.042*** (0.011)
Relative energy balance (oil exporters)
1.100*** (0.121)
1.094*** (0.122)
1.089*** (0.125)
1.080*** (0.125)
1.145*** (0.126)
1.173*** (0.125)
1.165*** (0.125)
Relative dependency ratio -0.002 (0.053)
0.007 (0.053)
-0.036 (0.053)
-0.052 (0.053)
-0.008 (0.056)
-0.018 (0.052)
-0.016 (0.052)
Relative population growth -0.415 (0.267)
-0.384 (0.268)
-0.374 (0.264)
-0.403 (0.265)
-0.130 (0.256)
-0.188 (0.251)
-0.176 (0.251)
Relative aging 0.166*** (0.049)
0.170*** (0.049)
0.174*** (0.048)
0.158*** (0.049)
0.180*** (0.048)
0.165*** (0.048)
0.164*** (0.048)
Health expenditure over GDP (L)
-0.448*** (0.171)
-0.451***
(0.171)
-0.567*** (0.170)
-0.601*** (0.173)
-0.573*** (0.163)
-0.540*** (0.161)
-0.535*** (0.162)
Relative output growth -0.109** (0.052)
-0.107** (0.051)
-0.104** (0.051)
-0.106** (0.051)
-0.094* (0.051)
-0.102*** (0.051)
-0.100** (0.051)
Relative output gap -0.272*** (0.060)
-0.270***
(0.060)
-0.275*** (0.059)
-0.271*** (0.060)
-0.272*** (0.061)
-0.241*** (0.062)
-0.240*** (0.061)
Commodity ToTgap * trade openness
0.179*** (0.040)
0.181*** (0.040)
0.182*** (0.041)
0.182*** (0.040)
0.173*** (0.039)
0.157*** (0.039)
0.160*** (0.039)
Relative structural public balance (I)
0.465** (0.201)
0.453** (0.201)
0.413** (0.199)
0.426** (0.198)
0.406** (0.194)
0.435** (0.191)
0.425** (0.191)
Obs. 1261 1261 1261 1261 1228 1228 1228 R2 0.7205 0.7204 0.7341 0.7355 0.7594 0.7621 0.7631
See previous Tables
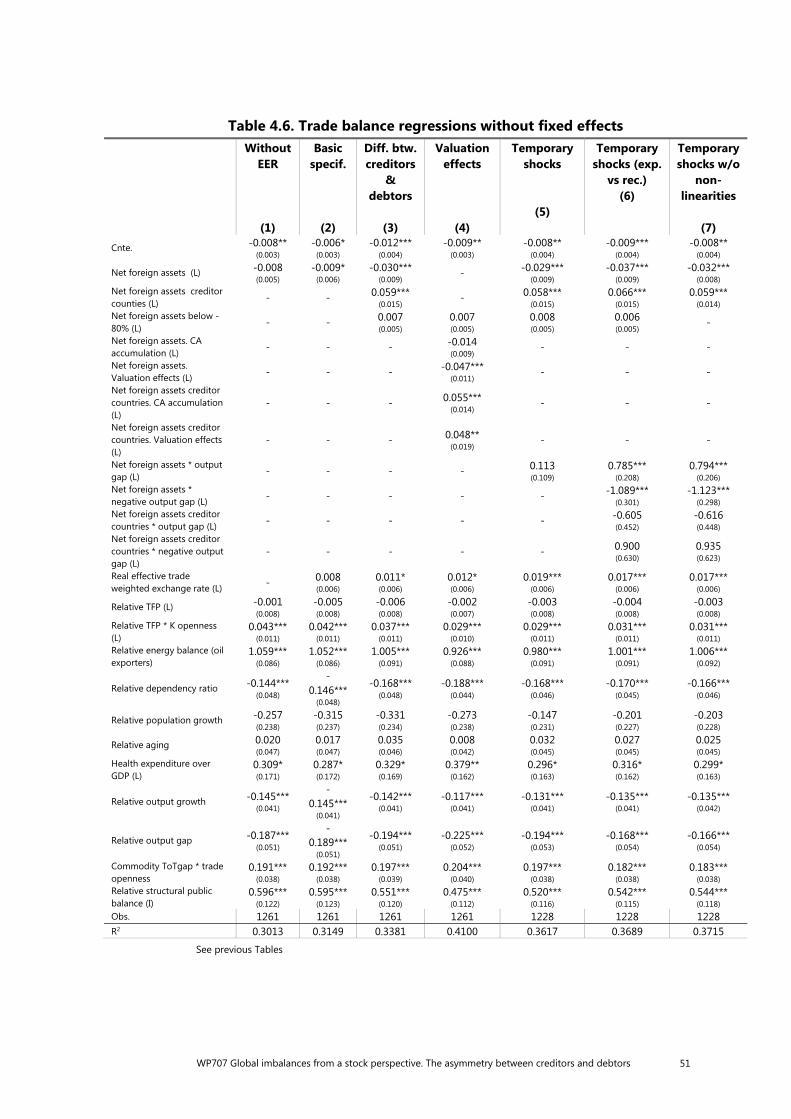
WP707 Global imbalances from a stock perspective. The asymmetry between creditors and debtors 51
See previous Tables
Table 4.6. Trade balance regressions without fixed effects Without
EER
(1)
Basic specif.
(2)
Diff. btw. creditors
& debtors
(3)
Valuation effects
(4)
Temporary shocks
(5)
Temporary shocks (exp.
vs rec.) (6)
Temporary shocks w/o
non-linearities
(7)
Cnte. -0.008** (0.003)
-0.006* (0.003)
-0.012*** (0.004)
-0.009** (0.003)
-0.008** (0.004)
-0.009*** (0.004)
-0.008** (0.004)
Net foreign assets (L) -0.008 (0.005)
-0.009* (0.006)
-0.030*** (0.009)
- -0.029*** (0.009)
-0.037*** (0.009)
-0.032*** (0.008)
Net foreign assets creditor counties (L) - - 0.059***
(0.015)- 0.058***
(0.015)0.066***
(0.015) 0.059***
(0.014)Net foreign assets below -80% (L) - - 0.007
(0.005)0.007 (0.005)
0.008 (0.005)
0.006 (0.005) -
Net foreign assets. CA accumulation (L) - - - -0.014
(0.009)- - -
Net foreign assets. Valuation effects (L) - - - -0.047***
(0.011)- - -
Net foreign assets creditor countries. CA accumulation (L)
- - - 0.055*** (0.014) - - -
Net foreign assets creditor countries. Valuation effects (L)
- - - 0.048** (0.019) - - -
Net foreign assets * output gap (L) - - - - 0.113
(0.109)0.785***
(0.208) 0.794***
(0.206)Net foreign assets * negative output gap (L) - - - - - -1.089***
(0.301) -1.123***
(0.298)Net foreign assets creditor countries * output gap (L) - - - - - -0.605
(0.452) -0.616 (0.448)
Net foreign assets creditor countries * negative output gap (L)
- - - - - 0.900 (0.630)
0.935 (0.623)
Real effective trade weighted exchange rate (L) - 0.008
(0.006)0.011* (0.006)
0.012* (0.006)
0.019*** (0.006)
0.017*** (0.006)
0.017*** (0.006)
Relative TFP (L) -0.001 (0.008)
-0.005 (0.008)
-0.006 (0.008)
-0.002 (0.007)
-0.003 (0.008)
-0.004 (0.008)
-0.003 (0.008)
Relative TFP * K openness (L)
0.043*** (0.011)
0.042*** (0.011)
0.037*** (0.011)
0.029*** (0.010)
0.029*** (0.011)
0.031*** (0.011)
0.031*** (0.011)
Relative energy balance (oil exporters)
1.059*** (0.086)
1.052*** (0.086)
1.005*** (0.091)
0.926*** (0.088)
0.980*** (0.091)
1.001*** (0.091)
1.006*** (0.092)
Relative dependency ratio -0.144*** (0.048)
-0.146***
(0.048)
-0.168*** (0.048)
-0.188*** (0.044)
-0.168*** (0.046)
-0.170*** (0.045)
-0.166*** (0.046)
Relative population growth -0.257 (0.238)
-0.315 (0.237)
-0.331 (0.234)
-0.273 (0.238)
-0.147 (0.231)
-0.201 (0.227)
-0.203 (0.228)
Relative aging 0.020 (0.047)
0.017 (0.047)
0.035 (0.046)
0.008 (0.042)
0.032 (0.045)
0.027 (0.045)
0.025 (0.045)
Health expenditure over GDP (L)
0.309* (0.171)
0.287* (0.172)
0.329* (0.169)
0.379** (0.162)
0.296* (0.163)
0.316* (0.162)
0.299* (0.163)
Relative output growth -0.145*** (0.041)
-0.145***
(0.041)
-0.142*** (0.041)
-0.117*** (0.041)
-0.131*** (0.041)
-0.135*** (0.041)
-0.135*** (0.042)
Relative output gap -0.187*** (0.051)
-0.189***
(0.051)
-0.194*** (0.051)
-0.225*** (0.052)
-0.194*** (0.053)
-0.168*** (0.054)
-0.166*** (0.054)
Commodity ToTgap * trade openness
0.191*** (0.038)
0.192*** (0.038)
0.197*** (0.039)
0.204*** (0.040)
0.197*** (0.038)
0.182*** (0.038)
0.183*** (0.038)
Relative structural public balance (I)
0.596*** (0.122)
0.595*** (0.123)
0.551*** (0.120)
0.475*** (0.112)
0.520*** (0.116)
0.542*** (0.115)
0.544*** (0.118)
Obs. 1261 1261 1261 1261 1228 1228 1228 R2 0.3013 0.3149 0.3381 0.4100 0.3617 0.3689 0.3715
52 WP707 Global imbalances from a stock perspective. The asymmetry between creditors and debtors
Appendix 5. Residual balance regressions
The residual balance of the current account includes items determined by both the private and the public sector or which depend on various agreements between countries. For example, this sub-balance includes migrants’ remittances, which usually flow from richer countries (net immigration) to poorer countries (net emigration). In this sense, his behavior might resemble that of the trade balance, becoming negative in the expansion phase of the cycle and positive in the recession. But it also includes the effect of multilateral mechanisms such as those that exist in the European Union, by which member countries emit transfers depending on VAT collection and receive them according, especially, to their level of per capita income. In general, this type of items should also flow from richer to poorer countries and fluctuate counter-cyclically. Since both countries with higher and lower per capita income may be creditors and debtors, it seems that the sign of net external assets in this regression is not defined a priori.
As shown in the first column of Table 5.1, the coefficient of net foreign assets is negative and significant, implying a stabilizing impact of stock imbalances on wealth accumulation through this sub-balance. The real effective exchange rate has also a positive effect, which may result from decisions of migrants. However, no asymmetry between creditors and debtors is observed (column 2 and 3). Capital gains derived from net external assets not appear to have a significant effect (column 4). Results are confirmed in regressions without fixed effects (Table 5.2). In this case, however, net foreign assets are estimated to exert an even higher stabilizing impact on creditor residual balance than on debtors’, although the coefficient interacted with the creditor dummy is only marginally significant. In any case both sets of estimations –with and without fixed effects – lead us to conclude that the asymmetries between the impact of stock imbalances on wealth accumulation of debtor and creditor countries does not originate in the residual balance.
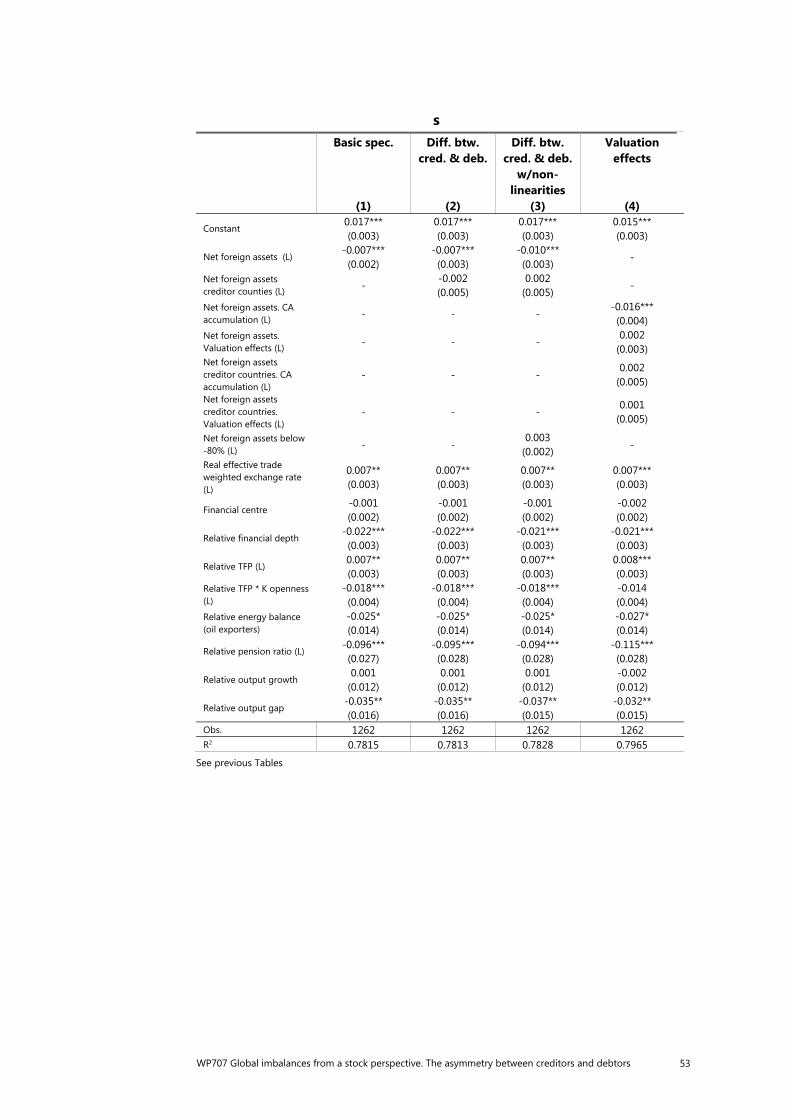
WP707 Global imbalances from a stock perspective. The asymmetry between creditors and debtors 53
s Basic spec.
(1)
Diff. btw. cred. & deb.
(2)
Diff. btw. cred. & deb.
w/non-linearities
(3)
Valuation effects
(4)
Constant 0.017*** (0.003)
0.017*** (0.003)
0.017*** (0.003)
0.015*** (0.003)
Net foreign assets (L) -0.007*** (0.002)
-0.007*** (0.003)
-0.010*** (0.003)
-
Net foreign assets creditor counties (L) -
-0.002 (0.005)
0.002 (0.005)
-
Net foreign assets. CA accumulation (L) - - -
-0.016*** (0.004)
Net foreign assets. Valuation effects (L) - - -
0.002 (0.003)
Net foreign assets creditor countries. CA accumulation (L)
- - - 0.002
(0.005) Net foreign assets creditor countries. Valuation effects (L)
- - - 0.001
(0.005)
Net foreign assets below -80% (L) - -
0.003 (0.002)
-
Real effective trade weighted exchange rate (L)
0.007** (0.003)
0.007** (0.003)
0.007** (0.003)
0.007*** (0.003)
Financial centre -0.001 (0.002)
-0.001 (0.002)
-0.001 (0.002)
-0.002 (0.002)
Relative financial depth -0.022*** (0.003)
-0.022*** (0.003)
-0.021*** (0.003)
-0.021*** (0.003)
Relative TFP (L) 0.007** (0.003)
0.007** (0.003)
0.007** (0.003)
0.008*** (0.003)
Relative TFP * K openness (L)
-0.018*** (0.004)
-0.018*** (0.004)
-0.018*** (0.004)
-0.014 (0.004)
Relative energy balance (oil exporters)
-0.025* (0.014)
-0.025* (0.014)
-0.025* (0.014)
-0.027* (0.014)
Relative pension ratio (L) -0.096*** (0.027)
-0.095*** (0.028)
-0.094*** (0.028)
-0.115*** (0.028)
Relative output growth 0.001
(0.012) 0.001
(0.012) 0.001
(0.012) -0.002 (0.012)
Relative output gap -0.035** (0.016)
-0.035** (0.016)
-0.037** (0.015)
-0.032** (0.015)
Obs. 1262 1262 1262 1262 R2 0.7815 0.7813 0.7828 0.7965
See previous Tables
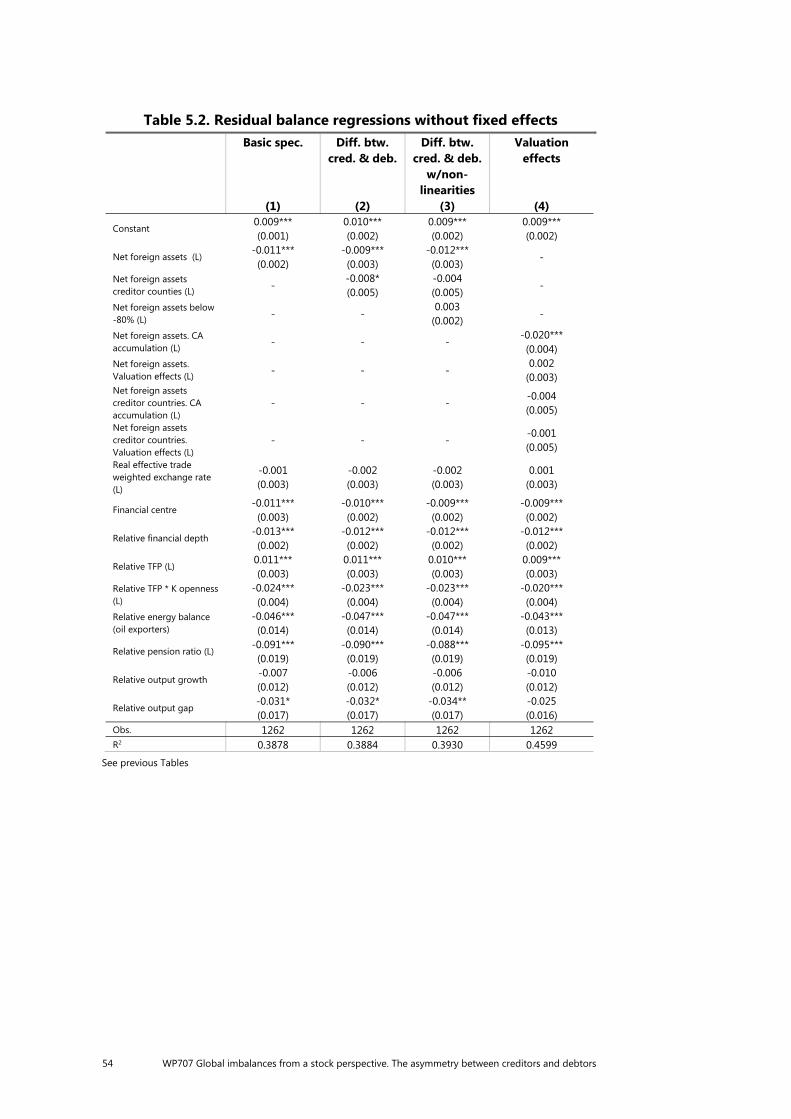
54 WP707 Global imbalances from a stock perspective. The asymmetry between creditors and debtors
Table 5.2. Residual balance regressions without fixed effects Basic spec.
(1)
Diff. btw. cred. & deb.
(2)
Diff. btw. cred. & deb.
w/non-linearities
(3)
Valuation effects
(4)
Constant 0.009*** (0.001)
0.010*** (0.002)
0.009*** (0.002)
0.009*** (0.002)
Net foreign assets (L) -0.011*** (0.002)
-0.009*** (0.003)
-0.012*** (0.003)
-
Net foreign assets creditor counties (L) -
-0.008* (0.005)
-0.004 (0.005)
-
Net foreign assets below -80% (L) - -
0.003 (0.002)
-
Net foreign assets. CA accumulation (L) - - -
-0.020*** (0.004)
Net foreign assets. Valuation effects (L) - - -
0.002 (0.003)
Net foreign assets creditor countries. CA accumulation (L)
- - - -0.004 (0.005)
Net foreign assets creditor countries. Valuation effects (L)
- - - -0.001 (0.005)
Real effective trade weighted exchange rate (L)
-0.001 (0.003)
-0.002 (0.003)
-0.002 (0.003)
0.001 (0.003)
Financial centre -0.011*** (0.003)
-0.010*** (0.002)
-0.009*** (0.002)
-0.009*** (0.002)
Relative financial depth -0.013*** (0.002)
-0.012*** (0.002)
-0.012*** (0.002)
-0.012*** (0.002)
Relative TFP (L) 0.011*** (0.003)
0.011*** (0.003)
0.010*** (0.003)
0.009*** (0.003)
Relative TFP * K openness (L)
-0.024*** (0.004)
-0.023*** (0.004)
-0.023*** (0.004)
-0.020*** (0.004)
Relative energy balance (oil exporters)
-0.046*** (0.014)
-0.047*** (0.014)
-0.047*** (0.014)
-0.043*** (0.013)
Relative pension ratio (L) -0.091*** (0.019)
-0.090*** (0.019)
-0.088*** (0.019)
-0.095*** (0.019)
Relative output growth -0.007 (0.012)
-0.006 (0.012)
-0.006 (0.012)
-0.010 (0.012)
Relative output gap -0.031* (0.017)
-0.032* (0.017)
-0.034** (0.017)
-0.025 (0.016)
Obs. 1262 1262 1262 1262 R2 0.3878 0.3884 0.3930 0.4599
See previous Tables
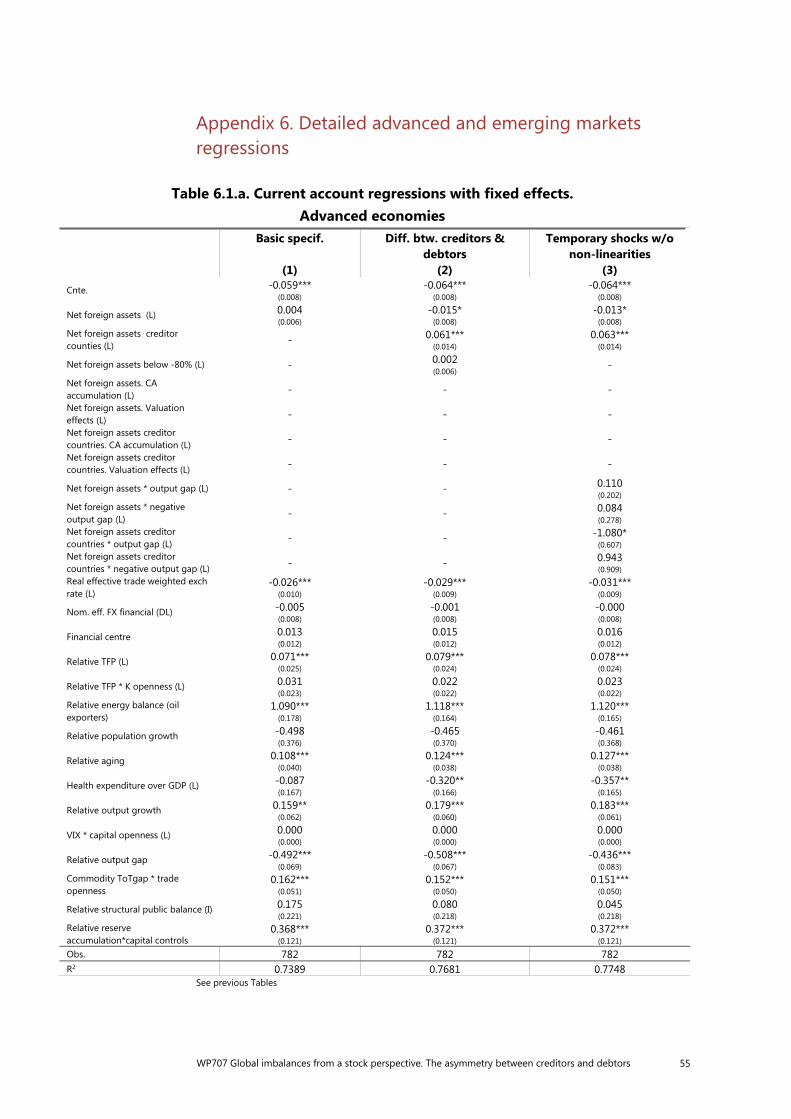
WP707 Global imbalances from a stock perspective. The asymmetry between creditors and debtors 55
Appendix 6. Detailed advanced and emerging markets regressions
Table 6.1.a. Current account regressions with fixed effects. Advanced economies
Basic specif.
(1)
Diff. btw. creditors & debtors
(2)
Temporary shocks w/o non-linearities
(3) Cnte. -0.059***
(0.008) -0.064***
(0.008)-0.064***
(0.008)
Net foreign assets (L) 0.004 (0.006)
-0.015* (0.008)
-0.013* (0.008)
Net foreign assets creditor counties (L) - 0.061***
(0.014)0.063***
(0.014)
Net foreign assets below -80% (L) - 0.002 (0.006)
-
Net foreign assets. CA accumulation (L) - - -
Net foreign assets. Valuation effects (L) - - -
Net foreign assets creditor countries. CA accumulation (L) - - -
Net foreign assets creditor countries. Valuation effects (L) - - -
Net foreign assets * output gap (L) - - 0.110 (0.202)
Net foreign assets * negative output gap (L) - - 0.084
(0.278) Net foreign assets creditor countries * output gap (L) - - -1.080*
(0.607) Net foreign assets creditor countries * negative output gap (L) - - 0.943
(0.909) Real effective trade weighted exch rate (L)
-0.026*** (0.010)
-0.029*** (0.009)
-0.031*** (0.009)
Nom. eff. FX financial (DL) -0.005 (0.008)
-0.001 (0.008)
-0.000 (0.008)
Financial centre 0.013 (0.012)
0.015 (0.012)
0.016 (0.012)
Relative TFP (L) 0.071*** (0.025)
0.079*** (0.024)
0.078*** (0.024)
Relative TFP * K openness (L) 0.031 (0.023)
0.022 (0.022)
0.023 (0.022)
Relative energy balance (oil exporters)
1.090*** (0.178)
1.118*** (0.164)
1.120*** (0.165)
Relative population growth -0.498 (0.376)
-0.465 (0.370)
-0.461 (0.368)
Relative aging 0.108*** (0.040)
0.124*** (0.038)
0.127*** (0.038)
Health expenditure over GDP (L) -0.087 (0.167)
-0.320** (0.166)
-0.357** (0.165)
Relative output growth 0.159** (0.062)
0.179*** (0.060)
0.183*** (0.061)
VIX * capital openness (L) 0.000 (0.000)
0.000 (0.000)
0.000 (0.000)
Relative output gap -0.492*** (0.069)
-0.508*** (0.067)
-0.436*** (0.083)
Commodity ToTgap * trade openness
0.162*** (0.051)
0.152*** (0.050)
0.151*** (0.050)
Relative structural public balance (I) 0.175 (0.221)
0.080 (0.218)
0.045 (0.218)
Relative reserve accumulation*capital controls
0.368*** (0.121)
0.372*** (0.121)
0.372*** (0.121)
Obs. 782 782 782 R2 0.7389 0.7681 0.7748
See previous Tables
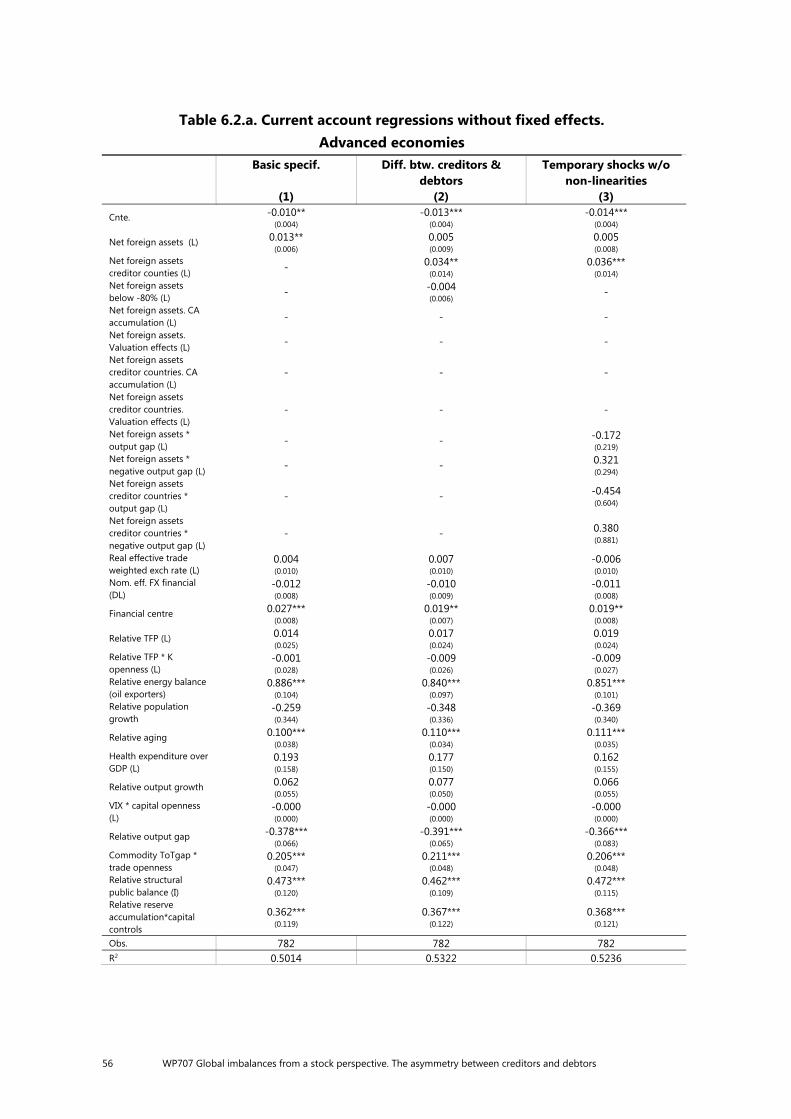
56 WP707 Global imbalances from a stock perspective. The asymmetry between creditors and debtors
Table 6.2.a. Current account regressions without fixed effects. Advanced economies
Basic specif.
(1)
Diff. btw. creditors & debtors
(2)
Temporary shocks w/o non-linearities
(3)
Cnte. -0.010** (0.004)
-0.013*** (0.004)
-0.014*** (0.004)
Net foreign assets (L) 0.013** (0.006)
0.005 (0.009)
0.005 (0.008)
Net foreign assets creditor counties (L) - 0.034**
(0.014)0.036***
(0.014) Net foreign assets below -80% (L) - -0.004
(0.006)-
Net foreign assets. CA accumulation (L) - - -
Net foreign assets. Valuation effects (L) - - -
Net foreign assets creditor countries. CA accumulation (L)
- - -
Net foreign assets creditor countries. Valuation effects (L)
- - -
Net foreign assets * output gap (L) - - -0.172
(0.219) Net foreign assets * negative output gap (L) - - 0.321
(0.294) Net foreign assets creditor countries * output gap (L)
- - -0.454 (0.604)
Net foreign assets creditor countries * negative output gap (L)
- - 0.380 (0.881)
Real effective trade weighted exch rate (L)
0.004 (0.010)
0.007 (0.010)
-0.006 (0.010)
Nom. eff. FX financial (DL)
-0.012 (0.008)
-0.010 (0.009)
-0.011 (0.008)
Financial centre 0.027*** (0.008)
0.019** (0.007)
0.019** (0.008)
Relative TFP (L) 0.014 (0.025)
0.017 (0.024)
0.019 (0.024)
Relative TFP * K openness (L)
-0.001 (0.028)
-0.009 (0.026)
-0.009 (0.027)
Relative energy balance (oil exporters)
0.886*** (0.104)
0.840*** (0.097)
0.851*** (0.101)
Relative population growth
-0.259 (0.344)
-0.348 (0.336)
-0.369 (0.340)
Relative aging 0.100*** (0.038)
0.110*** (0.034)
0.111*** (0.035)
Health expenditure over GDP (L)
0.193 (0.158)
0.177 (0.150)
0.162 (0.155)
Relative output growth 0.062 (0.055)
0.077 (0.050)
0.066 (0.055)
VIX * capital openness (L)
-0.000 (0.000)
-0.000 (0.000)
-0.000 (0.000)
Relative output gap -0.378*** (0.066)
-0.391*** (0.065)
-0.366*** (0.083)
Commodity ToTgap * trade openness
0.205*** (0.047)
0.211*** (0.048)
0.206*** (0.048)
Relative structural public balance (I)
0.473*** (0.120)
0.462*** (0.109)
0.472*** (0.115)
Relative reserve accumulation*capital controls
0.362*** (0.119)
0.367*** (0.122)
0.368*** (0.121)
Obs. 782 782 782 R2 0.5014 0.5322 0.5236
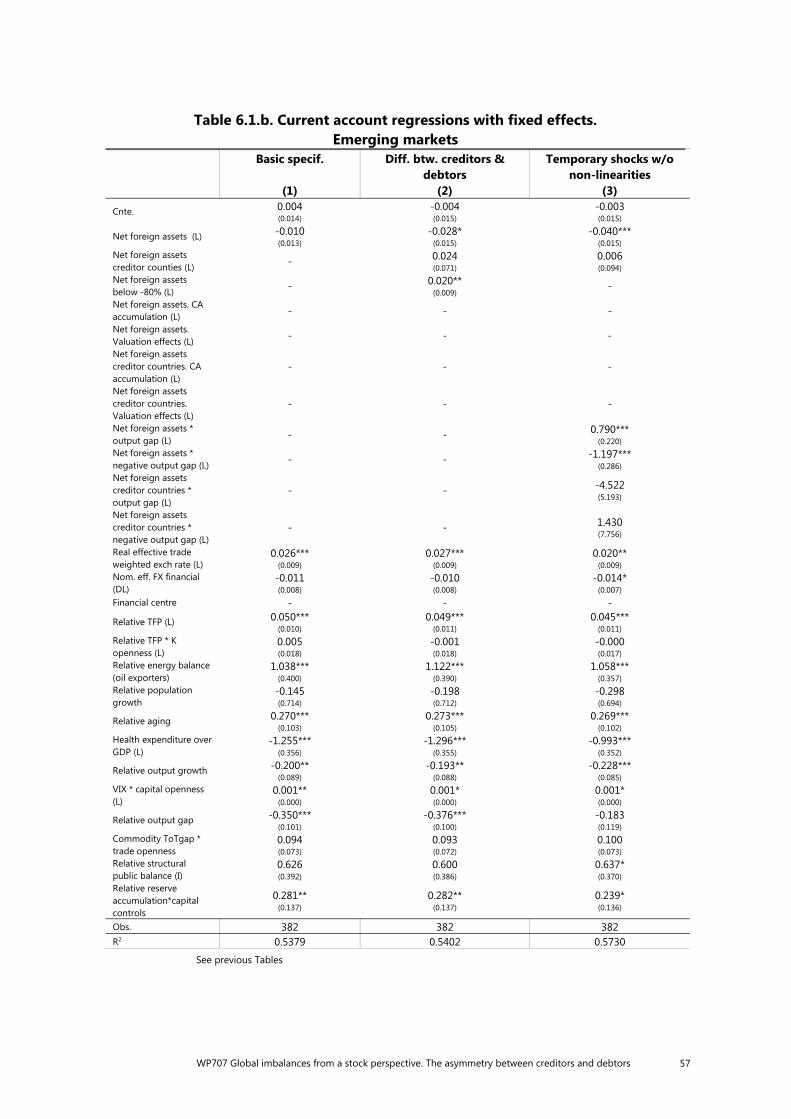
WP707 Global imbalances from a stock perspective. The asymmetry between creditors and debtors 57
Table 6.1.b. Current account regressions with fixed effects. Emerging markets
Basic specif.
(1)
Diff. btw. creditors & debtors
(2)
Temporary shocks w/o non-linearities
(3)
Cnte. 0.004 (0.014)
-0.004 (0.015)
-0.003 (0.015)
Net foreign assets (L) -0.010 (0.013)
-0.028* (0.015)
-0.040*** (0.015)
Net foreign assets creditor counties (L) - 0.024
(0.071)0.006 (0.094)
Net foreign assets below -80% (L) - 0.020**
(0.009)-
Net foreign assets. CA accumulation (L) - - -
Net foreign assets. Valuation effects (L) - - -
Net foreign assets creditor countries. CA accumulation (L)
- - -
Net foreign assets creditor countries. Valuation effects (L)
- - -
Net foreign assets * output gap (L) - - 0.790***
(0.220) Net foreign assets * negative output gap (L) - - -1.197***
(0.286) Net foreign assets creditor countries * output gap (L)
- - -4.522 (5.193)
Net foreign assets creditor countries * negative output gap (L)
- - 1.430 (7.756)
Real effective trade weighted exch rate (L)
0.026*** (0.009)
0.027*** (0.009)
0.020** (0.009)
Nom. eff. FX financial (DL)
-0.011 (0.008)
-0.010 (0.008)
-0.014* (0.007)
Financial centre - - -
Relative TFP (L) 0.050*** (0.010)
0.049*** (0.011)
0.045*** (0.011)
Relative TFP * K openness (L)
0.005 (0.018)
-0.001 (0.018)
-0.000 (0.017)
Relative energy balance (oil exporters)
1.038*** (0.400)
1.122*** (0.390)
1.058*** (0.357)
Relative population growth
-0.145 (0.714)
-0.198 (0.712)
-0.298 (0.694)
Relative aging 0.270*** (0.103)
0.273*** (0.105)
0.269*** (0.102)
Health expenditure over GDP (L)
-1.255*** (0.356)
-1.296*** (0.355)
-0.993*** (0.352)
Relative output growth -0.200** (0.089)
-0.193** (0.088)
-0.228*** (0.085)
VIX * capital openness (L)
0.001** (0.000)
0.001* (0.000)
0.001* (0.000)
Relative output gap -0.350*** (0.101)
-0.376*** (0.100)
-0.183 (0.119)
Commodity ToTgap * trade openness
0.094 (0.073)
0.093 (0.072)
0.100 (0.073)
Relative structural public balance (I)
0.626 (0.392)
0.600 (0.386)
0.637* (0.370)
Relative reserve accumulation*capital controls
0.281** (0.137)
0.282** (0.137)
0.239* (0.136)
Obs. 382 382 382 R2 0.5379 0.5402 0.5730
See previous Tables
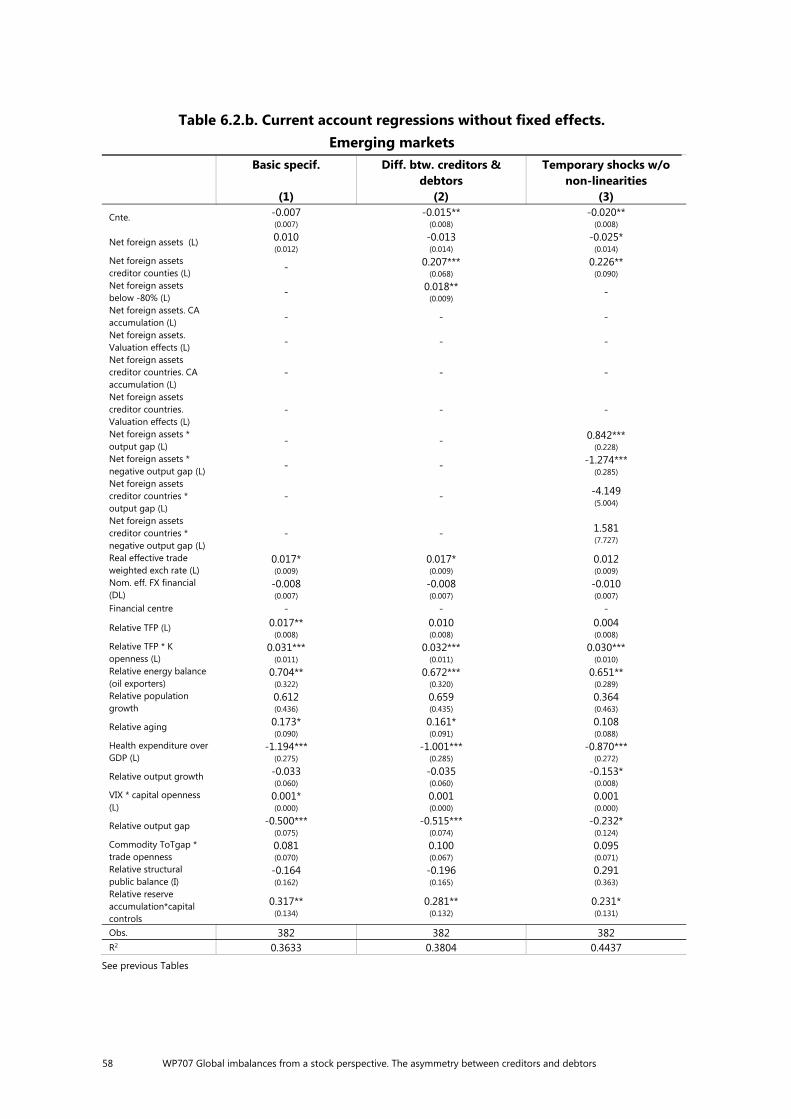
58 WP707 Global imbalances from a stock perspective. The asymmetry between creditors and debtors
Table 6.2.b. Current account regressions without fixed effects. Emerging markets
Basic specif.
(1)
Diff. btw. creditors & debtors
(2)
Temporary shocks w/o non-linearities
(3)
Cnte. -0.007 (0.007)
-0.015** (0.008)
-0.020** (0.008)
Net foreign assets (L) 0.010 (0.012)
-0.013 (0.014)
-0.025* (0.014)
Net foreign assets creditor counties (L) - 0.207***
(0.068)0.226**
(0.090) Net foreign assets below -80% (L) - 0.018**
(0.009)-
Net foreign assets. CA accumulation (L) - - -
Net foreign assets. Valuation effects (L) - - -
Net foreign assets creditor countries. CA accumulation (L)
- - -
Net foreign assets creditor countries. Valuation effects (L)
- - -
Net foreign assets * output gap (L) - - 0.842***
(0.228) Net foreign assets * negative output gap (L) - - -1.274***
(0.285) Net foreign assets creditor countries * output gap (L)
- - -4.149 (5.004)
Net foreign assets creditor countries * negative output gap (L)
- - 1.581 (7.727)
Real effective trade weighted exch rate (L)
0.017* (0.009)
0.017* (0.009)
0.012 (0.009)
Nom. eff. FX financial (DL)
-0.008 (0.007)
-0.008 (0.007)
-0.010 (0.007)
Financial centre - - -
Relative TFP (L) 0.017** (0.008)
0.010 (0.008)
0.004 (0.008)
Relative TFP * K openness (L)
0.031*** (0.011)
0.032*** (0.011)
0.030*** (0.010)
Relative energy balance (oil exporters)
0.704** (0.322)
0.672*** (0.320)
0.651** (0.289)
Relative population growth
0.612 (0.436)
0.659 (0.435)
0.364 (0.463)
Relative aging 0.173* (0.090)
0.161* (0.091)
0.108 (0.088)
Health expenditure over GDP (L)
-1.194*** (0.275)
-1.001*** (0.285)
-0.870*** (0.272)
Relative output growth -0.033 (0.060)
-0.035 (0.060)
-0.153* (0.008)
VIX * capital openness (L)
0.001* (0.000)
0.001 (0.000)
0.001 (0.000)
Relative output gap -0.500*** (0.075)
-0.515*** (0.074)
-0.232* (0.124)
Commodity ToTgap * trade openness
0.081 (0.070)
0.100 (0.067)
0.095 (0.071)
Relative structural public balance (I)
-0.164 (0.162)
-0.196 (0.165)
0.291 (0.363)
Relative reserve accumulation*capital controls
0.317** (0.134)
0.281** (0.132)
0.231* (0.131)
Obs. 382 382 382 R2 0.3633 0.3804 0.4437
See previous Tables
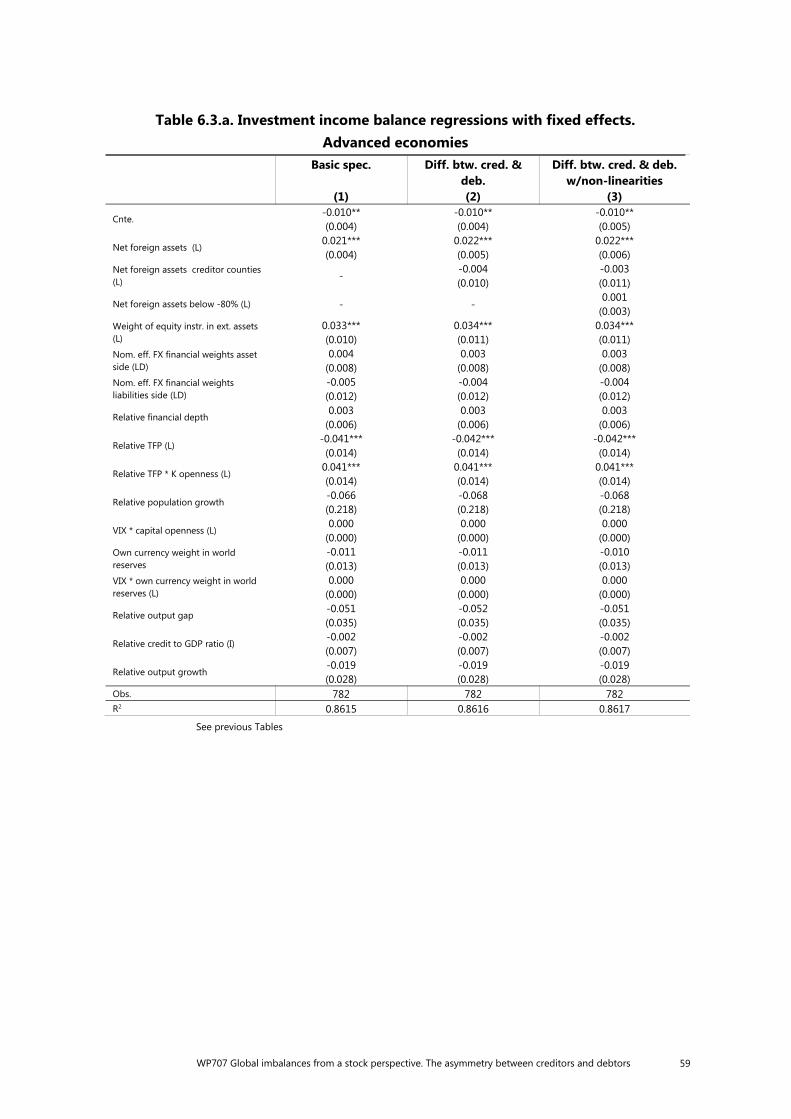
WP707 Global imbalances from a stock perspective. The asymmetry between creditors and debtors 59
Table 6.3.a. Investment income balance regressions with fixed effects. Advanced economies
Basic spec.
(1)
Diff. btw. cred. & deb. (2)
Diff. btw. cred. & deb. w/non-linearities
(3)
Cnte. -0.010** (0.004)
-0.010** (0.004)
-0.010** (0.005)
Net foreign assets (L) 0.021*** (0.004)
0.022*** (0.005)
0.022*** (0.006)
Net foreign assets creditor counties (L) -
-0.004 (0.010)
-0.003 (0.011)
Net foreign assets below -80% (L) - - 0.001
(0.003) Weight of equity instr. in ext. assets (L)
0.033*** (0.010)
0.034*** (0.011)
0.034*** (0.011)
Nom. eff. FX financial weights asset side (LD)
0.004 (0.008)
0.003 (0.008)
0.003 (0.008)
Nom. eff. FX financial weights liabilities side (LD)
-0.005 (0.012)
-0.004 (0.012)
-0.004 (0.012)
Relative financial depth 0.003
(0.006) 0.003
(0.006) 0.003
(0.006)
Relative TFP (L) -0.041*** (0.014)
-0.042*** (0.014)
-0.042*** (0.014)
Relative TFP * K openness (L) 0.041*** (0.014)
0.041*** (0.014)
0.041*** (0.014)
Relative population growth -0.066 (0.218)
-0.068 (0.218)
-0.068 (0.218)
VIX * capital openness (L) 0.000
(0.000) 0.000
(0.000) 0.000
(0.000) Own currency weight in world reserves
-0.011 (0.013)
-0.011 (0.013)
-0.010 (0.013)
VIX * own currency weight in world reserves (L)
0.000 (0.000)
0.000 (0.000)
0.000 (0.000)
Relative output gap -0.051 (0.035)
-0.052 (0.035)
-0.051 (0.035)
Relative credit to GDP ratio (I) -0.002 (0.007)
-0.002 (0.007)
-0.002 (0.007)
Relative output growth -0.019 (0.028)
-0.019 (0.028)
-0.019 (0.028)
Obs. 782 782 782 R2 0.8615 0.8616 0.8617
See previous Tables
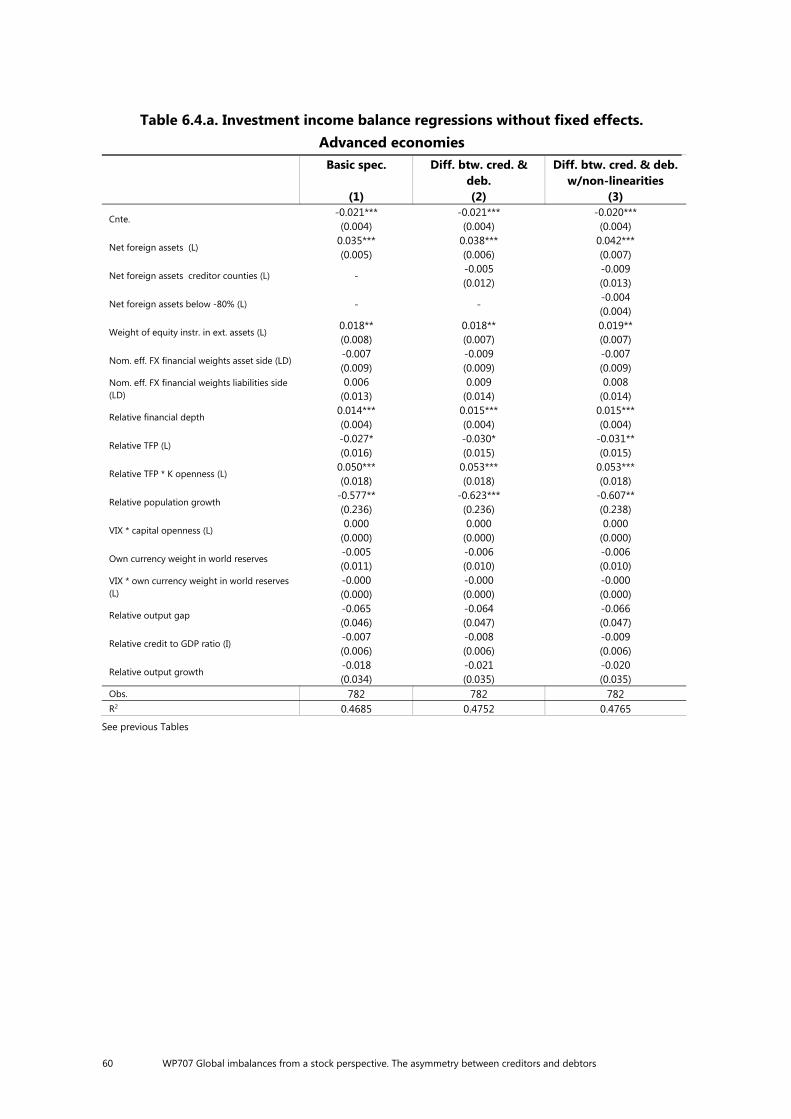
60 WP707 Global imbalances from a stock perspective. The asymmetry between creditors and debtors
Table 6.4.a. Investment income balance regressions without fixed effects. Advanced economies
Basic spec.
(1)
Diff. btw. cred. & deb. (2)
Diff. btw. cred. & deb. w/non-linearities
(3)
Cnte. -0.021*** (0.004)
-0.021*** (0.004)
-0.020*** (0.004)
Net foreign assets (L) 0.035*** (0.005)
0.038*** (0.006)
0.042*** (0.007)
Net foreign assets creditor counties (L) - -0.005 (0.012)
-0.009 (0.013)
Net foreign assets below -80% (L) - - -0.004 (0.004)
Weight of equity instr. in ext. assets (L) 0.018** (0.008)
0.018** (0.007)
0.019** (0.007)
Nom. eff. FX financial weights asset side (LD) -0.007 (0.009)
-0.009 (0.009)
-0.007 (0.009)
Nom. eff. FX financial weights liabilities side (LD)
0.006 (0.013)
0.009 (0.014)
0.008 (0.014)
Relative financial depth 0.014*** (0.004)
0.015*** (0.004)
0.015*** (0.004)
Relative TFP (L) -0.027* (0.016)
-0.030* (0.015)
-0.031** (0.015)
Relative TFP * K openness (L) 0.050*** (0.018)
0.053*** (0.018)
0.053*** (0.018)
Relative population growth -0.577** (0.236)
-0.623*** (0.236)
-0.607** (0.238)
VIX * capital openness (L) 0.000
(0.000) 0.000
(0.000) 0.000
(0.000)
Own currency weight in world reserves -0.005 (0.011)
-0.006 (0.010)
-0.006 (0.010)
VIX * own currency weight in world reserves (L)
-0.000 (0.000)
-0.000 (0.000)
-0.000 (0.000)
Relative output gap -0.065 (0.046)
-0.064 (0.047)
-0.066 (0.047)
Relative credit to GDP ratio (I) -0.007 (0.006)
-0.008 (0.006)
-0.009 (0.006)
Relative output growth -0.018 (0.034)
-0.021 (0.035)
-0.020 (0.035)
Obs. 782 782 782 R2 0.4685 0.4752 0.4765
See previous Tables
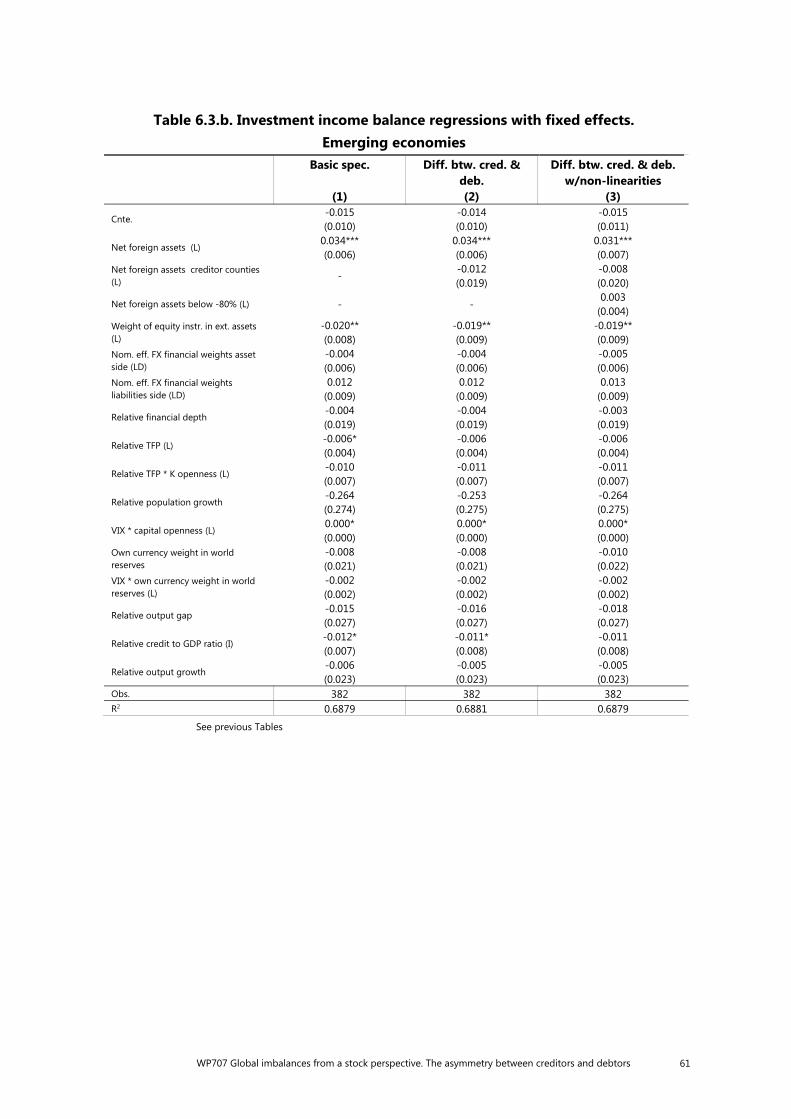
WP707 Global imbalances from a stock perspective. The asymmetry between creditors and debtors 61
Table 6.3.b. Investment income balance regressions with fixed effects. Emerging economies
Basic spec.
(1)
Diff. btw. cred. & deb. (2)
Diff. btw. cred. & deb. w/non-linearities
(3)
Cnte. -0.015 (0.010)
-0.014 (0.010)
-0.015 (0.011)
Net foreign assets (L) 0.034*** (0.006)
0.034*** (0.006)
0.031*** (0.007)
Net foreign assets creditor counties (L) -
-0.012 (0.019)
-0.008 (0.020)
Net foreign assets below -80% (L) - - 0.003
(0.004) Weight of equity instr. in ext. assets (L)
-0.020** (0.008)
-0.019** (0.009)
-0.019** (0.009)
Nom. eff. FX financial weights asset side (LD)
-0.004 (0.006)
-0.004 (0.006)
-0.005 (0.006)
Nom. eff. FX financial weights liabilities side (LD)
0.012 (0.009)
0.012 (0.009)
0.013 (0.009)
Relative financial depth -0.004 (0.019)
-0.004 (0.019)
-0.003 (0.019)
Relative TFP (L) -0.006* (0.004)
-0.006 (0.004)
-0.006 (0.004)
Relative TFP * K openness (L) -0.010 (0.007)
-0.011 (0.007)
-0.011 (0.007)
Relative population growth -0.264 (0.274)
-0.253 (0.275)
-0.264 (0.275)
VIX * capital openness (L) 0.000* (0.000)
0.000* (0.000)
0.000* (0.000)
Own currency weight in world reserves
-0.008 (0.021)
-0.008 (0.021)
-0.010 (0.022)
VIX * own currency weight in world reserves (L)
-0.002 (0.002)
-0.002 (0.002)
-0.002 (0.002)
Relative output gap -0.015 (0.027)
-0.016 (0.027)
-0.018 (0.027)
Relative credit to GDP ratio (I) -0.012* (0.007)
-0.011* (0.008)
-0.011 (0.008)
Relative output growth -0.006 (0.023)
-0.005 (0.023)
-0.005 (0.023)
Obs. 382 382 382 R2 0.6879 0.6881 0.6879
See previous Tables
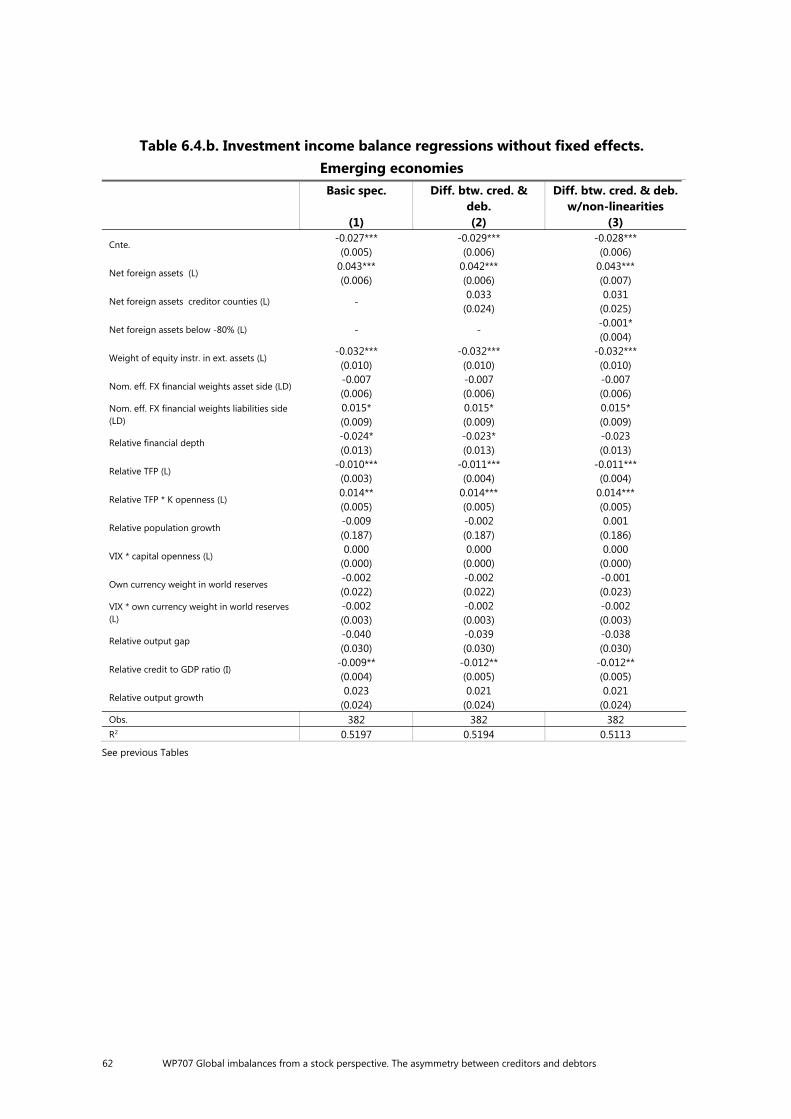
62 WP707 Global imbalances from a stock perspective. The asymmetry between creditors and debtors
Table 6.4.b. Investment income balance regressions without fixed effects. Emerging economies
Basic spec.
(1)
Diff. btw. cred. & deb. (2)
Diff. btw. cred. & deb. w/non-linearities
(3)
Cnte. -0.027*** (0.005)
-0.029*** (0.006)
-0.028*** (0.006)
Net foreign assets (L) 0.043*** (0.006)
0.042*** (0.006)
0.043*** (0.007)
Net foreign assets creditor counties (L) - 0.033
(0.024) 0.031
(0.025)
Net foreign assets below -80% (L) - - -0.001* (0.004)
Weight of equity instr. in ext. assets (L) -0.032*** (0.010)
-0.032*** (0.010)
-0.032*** (0.010)
Nom. eff. FX financial weights asset side (LD) -0.007 (0.006)
-0.007 (0.006)
-0.007 (0.006)
Nom. eff. FX financial weights liabilities side (LD)
0.015* (0.009)
0.015* (0.009)
0.015* (0.009)
Relative financial depth -0.024* (0.013)
-0.023* (0.013)
-0.023 (0.013)
Relative TFP (L) -0.010*** (0.003)
-0.011*** (0.004)
-0.011*** (0.004)
Relative TFP * K openness (L) 0.014** (0.005)
0.014*** (0.005)
0.014*** (0.005)
Relative population growth -0.009 (0.187)
-0.002 (0.187)
0.001 (0.186)
VIX * capital openness (L) 0.000
(0.000) 0.000
(0.000) 0.000
(0.000)
Own currency weight in world reserves -0.002 (0.022)
-0.002 (0.022)
-0.001 (0.023)
VIX * own currency weight in world reserves (L)
-0.002 (0.003)
-0.002 (0.003)
-0.002 (0.003)
Relative output gap -0.040 (0.030)
-0.039 (0.030)
-0.038 (0.030)
Relative credit to GDP ratio (I) -0.009** (0.004)
-0.012** (0.005)
-0.012** (0.005)
Relative output growth 0.023
(0.024) 0.021
(0.024) 0.021
(0.024) Obs. 382 382 382 R2 0.5197 0.5194 0.5113
See previous Tables
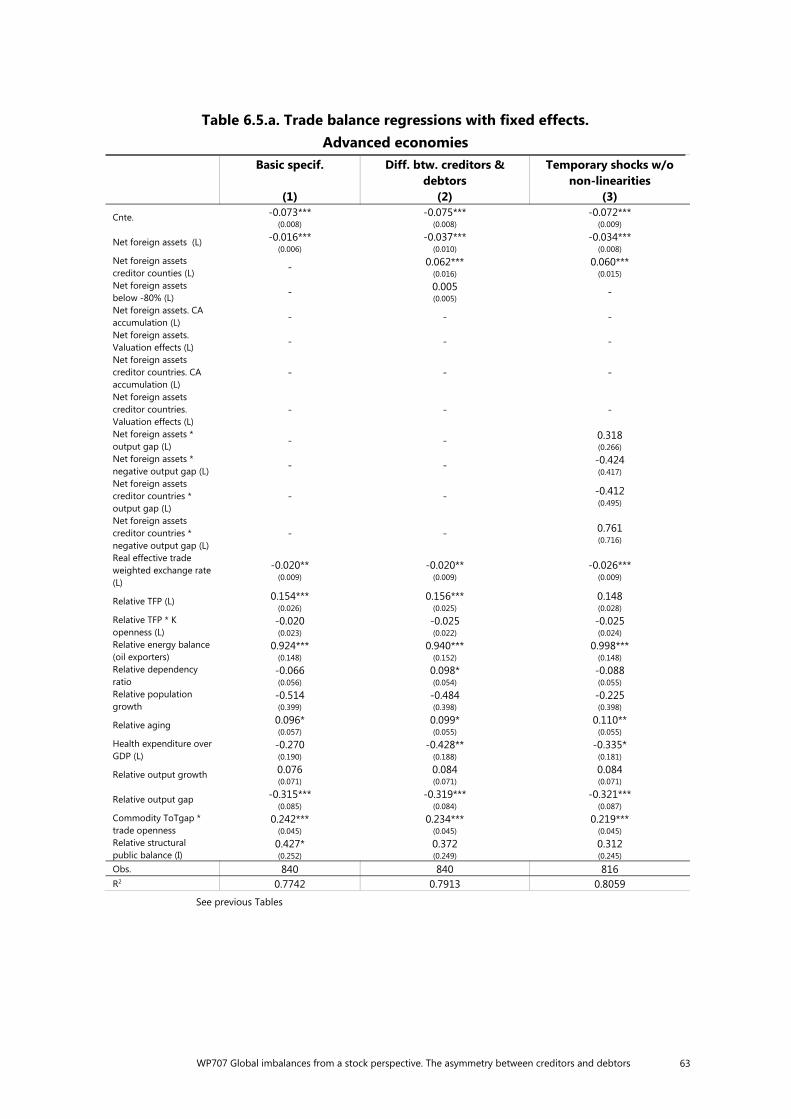
WP707 Global imbalances from a stock perspective. The asymmetry between creditors and debtors 63
Table 6.5.a. Trade balance regressions with fixed effects. Advanced economies
Basic specif.
(1)
Diff. btw. creditors & debtors
(2)
Temporary shocks w/o non-linearities
(3)
Cnte. -0.073*** (0.008)
-0.075*** (0.008)
-0.072*** (0.009)
Net foreign assets (L) -0.016*** (0.006)
-0.037*** (0.010)
-0.034*** (0.008)
Net foreign assets creditor counties (L) - 0.062***
(0.016)0.060***
(0.015) Net foreign assets below -80% (L) - 0.005
(0.005)-
Net foreign assets. CA accumulation (L) - - -
Net foreign assets. Valuation effects (L) - - -
Net foreign assets creditor countries. CA accumulation (L)
- - -
Net foreign assets creditor countries. Valuation effects (L)
- - -
Net foreign assets * output gap (L) - - 0.318
(0.266) Net foreign assets * negative output gap (L) - - -0.424
(0.417) Net foreign assets creditor countries * output gap (L)
- - -0.412 (0.495)
Net foreign assets creditor countries * negative output gap (L)
- - 0.761 (0.716)
Real effective trade weighted exchange rate (L)
-0.020** (0.009)
-0.020** (0.009)
-0.026*** (0.009)
Relative TFP (L) 0.154*** (0.026)
0.156*** (0.025)
0.148 (0.028)
Relative TFP * K openness (L)
-0.020 (0.023)
-0.025 (0.022)
-0.025 (0.024)
Relative energy balance (oil exporters)
0.924*** (0.148)
0.940*** (0.152)
0.998*** (0.148)
Relative dependency ratio
-0.066 (0.056)
0.098* (0.054)
-0.088 (0.055)
Relative population growth
-0.514 (0.399)
-0.484 (0.398)
-0.225 (0.398)
Relative aging 0.096* (0.057)
0.099* (0.055)
0.110** (0.055)
Health expenditure over GDP (L)
-0.270 (0.190)
-0.428** (0.188)
-0.335* (0.181)
Relative output growth 0.076 (0.071)
0.084 (0.071)
0.084 (0.071)
Relative output gap -0.315*** (0.085)
-0.319*** (0.084)
-0.321*** (0.087)
Commodity ToTgap * trade openness
0.242*** (0.045)
0.234*** (0.045)
0.219*** (0.045)
Relative structural public balance (I)
0.427* (0.252)
0.372 (0.249)
0.312 (0.245)
Obs. 840 840 816 R2 0.7742 0.7913 0.8059
See previous Tables
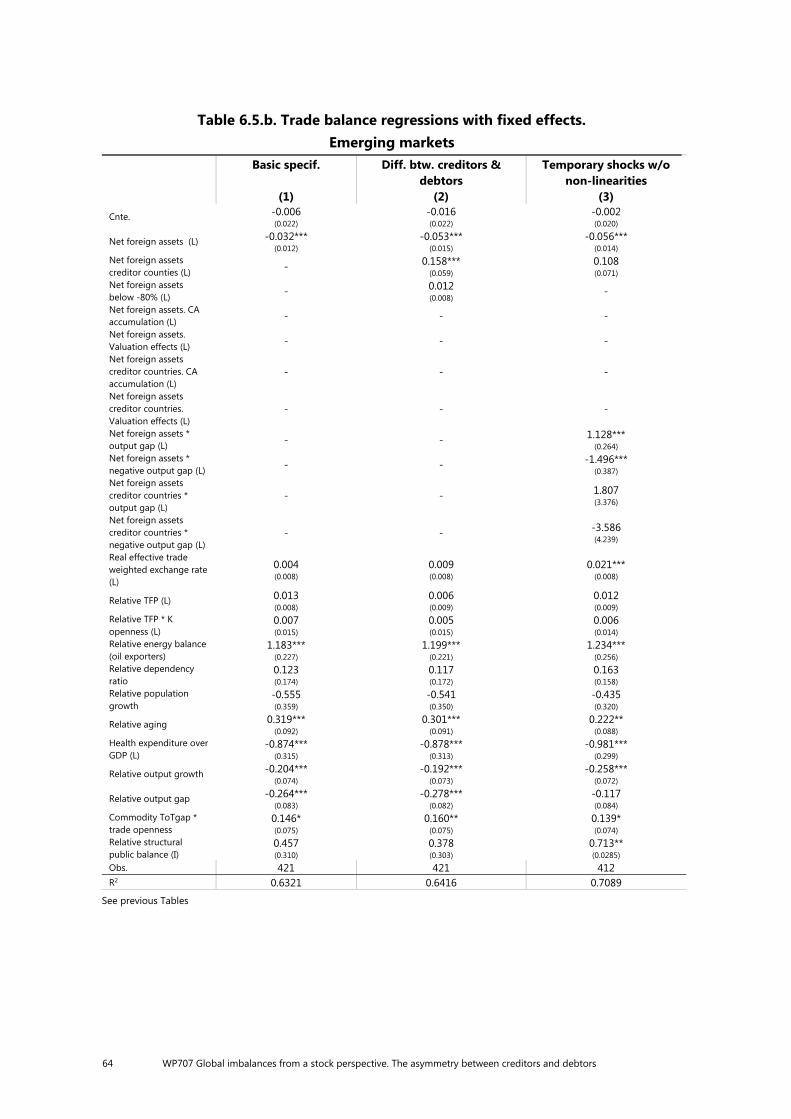
64 WP707 Global imbalances from a stock perspective. The asymmetry between creditors and debtors
Table 6.5.b. Trade balance regressions with fixed effects. Emerging markets
Basic specif.
(1)
Diff. btw. creditors & debtors
(2)
Temporary shocks w/o non-linearities
(3) Cnte. -0.006
(0.022) -0.016 (0.022)
-0.002 (0.020)
Net foreign assets (L) -0.032*** (0.012)
-0.053*** (0.015)
-0.056*** (0.014)
Net foreign assets creditor counties (L) - 0.158***
(0.059)0.108 (0.071)
Net foreign assets below -80% (L) - 0.012
(0.008)-
Net foreign assets. CA accumulation (L) - - -
Net foreign assets. Valuation effects (L) - - -
Net foreign assets creditor countries. CA accumulation (L)
- - -
Net foreign assets creditor countries. Valuation effects (L)
- - -
Net foreign assets * output gap (L) - - 1.128***
(0.264) Net foreign assets * negative output gap (L) - - -1.496***
(0.387) Net foreign assets creditor countries * output gap (L)
- - 1.807 (3.376)
Net foreign assets creditor countries * negative output gap (L)
- - -3.586 (4.239)
Real effective trade weighted exchange rate (L)
0.004 (0.008)
0.009 (0.008)
0.021*** (0.008)
Relative TFP (L) 0.013 (0.008)
0.006 (0.009)
0.012 (0.009)
Relative TFP * K openness (L)
0.007 (0.015)
0.005 (0.015)
0.006 (0.014)
Relative energy balance (oil exporters)
1.183*** (0.227)
1.199*** (0.221)
1.234*** (0.256)
Relative dependency ratio
0.123 (0.174)
0.117 (0.172)
0.163 (0.158)
Relative population growth
-0.555 (0.359)
-0.541 (0.350)
-0.435 (0.320)
Relative aging 0.319*** (0.092)
0.301*** (0.091)
0.222** (0.088)
Health expenditure over GDP (L)
-0.874*** (0.315)
-0.878*** (0.313)
-0.981*** (0.299)
Relative output growth -0.204*** (0.074)
-0.192*** (0.073)
-0.258*** (0.072)
Relative output gap -0.264*** (0.083)
-0.278*** (0.082)
-0.117 (0.084)
Commodity ToTgap * trade openness
0.146* (0.075)
0.160** (0.075)
0.139* (0.074)
Relative structural public balance (I)
0.457 (0.310)
0.378 (0.303)
0.713** (0.0285)
Obs. 421 421 412 R2 0.6321 0.6416 0.7089
See previous Tables
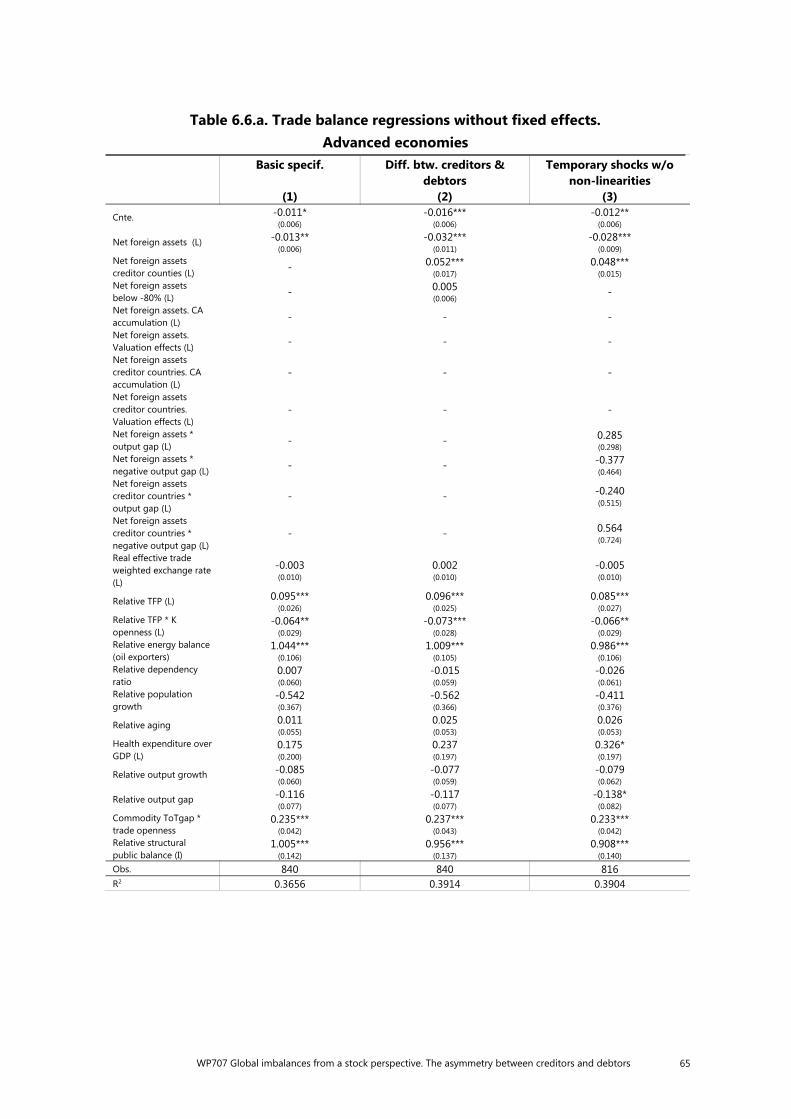
WP707 Global imbalances from a stock perspective. The asymmetry between creditors and debtors 65
Table 6.6.a. Trade balance regressions without fixed effects. Advanced economies
Basic specif.
(1)
Diff. btw. creditors & debtors
(2)
Temporary shocks w/o non-linearities
(3)
Cnte. -0.011* (0.006)
-0.016*** (0.006)
-0.012** (0.006)
Net foreign assets (L) -0.013** (0.006)
-0.032*** (0.011)
-0.028*** (0.009)
Net foreign assets creditor counties (L) - 0.052***
(0.017)0.048***
(0.015) Net foreign assets below -80% (L) - 0.005
(0.006)-
Net foreign assets. CA accumulation (L) - - -
Net foreign assets. Valuation effects (L) - - -
Net foreign assets creditor countries. CA accumulation (L)
- - -
Net foreign assets creditor countries. Valuation effects (L)
- - -
Net foreign assets * output gap (L) - - 0.285
(0.298) Net foreign assets * negative output gap (L) - - -0.377
(0.464) Net foreign assets creditor countries * output gap (L)
- - -0.240 (0.515)
Net foreign assets creditor countries * negative output gap (L)
- - 0.564 (0.724)
Real effective trade weighted exchange rate (L)
-0.003 (0.010)
0.002 (0.010)
-0.005 (0.010)
Relative TFP (L) 0.095*** (0.026)
0.096*** (0.025)
0.085*** (0.027)
Relative TFP * K openness (L)
-0.064** (0.029)
-0.073*** (0.028)
-0.066** (0.029)
Relative energy balance (oil exporters)
1.044*** (0.106)
1.009*** (0.105)
0.986*** (0.106)
Relative dependency ratio
0.007 (0.060)
-0.015 (0.059)
-0.026 (0.061)
Relative population growth
-0.542 (0.367)
-0.562 (0.366)
-0.411 (0.376)
Relative aging 0.011 (0.055)
0.025 (0.053)
0.026 (0.053)
Health expenditure over GDP (L)
0.175 (0.200)
0.237 (0.197)
0.326* (0.197)
Relative output growth -0.085 (0.060)
-0.077 (0.059)
-0.079 (0.062)
Relative output gap -0.116 (0.077)
-0.117 (0.077)
-0.138* (0.082)
Commodity ToTgap * trade openness
0.235*** (0.042)
0.237*** (0.043)
0.233*** (0.042)
Relative structural public balance (I)
1.005*** (0.142)
0.956*** (0.137)
0.908*** (0.140)
Obs. 840 840 816 R2 0.3656 0.3914 0.3904
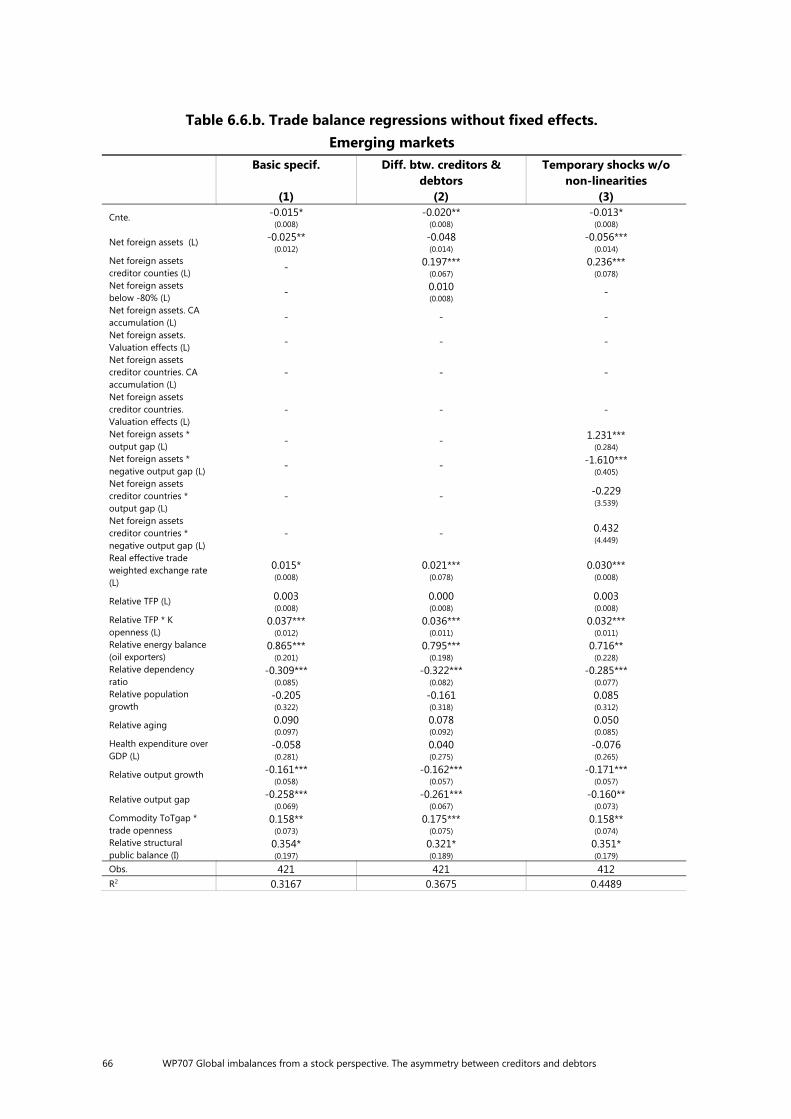
66 WP707 Global imbalances from a stock perspective. The asymmetry between creditors and debtors
Table 6.6.b. Trade balance regressions without fixed effects. Emerging markets
Basic specif.
(1)
Diff. btw. creditors & debtors
(2)
Temporary shocks w/o non-linearities
(3)
Cnte. -0.015* (0.008)
-0.020** (0.008)
-0.013* (0.008)
Net foreign assets (L) -0.025** (0.012)
-0.048 (0.014)
-0.056*** (0.014)
Net foreign assets creditor counties (L) - 0.197***
(0.067)0.236***
(0.078) Net foreign assets below -80% (L) - 0.010
(0.008)-
Net foreign assets. CA accumulation (L) - - -
Net foreign assets. Valuation effects (L) - - -
Net foreign assets creditor countries. CA accumulation (L)
- - -
Net foreign assets creditor countries. Valuation effects (L)
- - -
Net foreign assets * output gap (L) - - 1.231***
(0.284) Net foreign assets * negative output gap (L) - - -1.610***
(0.405) Net foreign assets creditor countries * output gap (L)
- - -0.229 (3.539)
Net foreign assets creditor countries * negative output gap (L)
- - 0.432 (4.449)
Real effective trade weighted exchange rate (L)
0.015* (0.008)
0.021*** (0.078)
0.030*** (0.008)
Relative TFP (L) 0.003 (0.008)
0.000 (0.008)
0.003 (0.008)
Relative TFP * K openness (L)
0.037*** (0.012)
0.036*** (0.011)
0.032*** (0.011)
Relative energy balance (oil exporters)
0.865*** (0.201)
0.795*** (0.198)
0.716** (0.228)
Relative dependency ratio
-0.309*** (0.085)
-0.322*** (0.082)
-0.285*** (0.077)
Relative population growth
-0.205 (0.322)
-0.161 (0.318)
0.085 (0.312)
Relative aging 0.090 (0.097)
0.078 (0.092)
0.050 (0.085)
Health expenditure over GDP (L)
-0.058 (0.281)
0.040 (0.275)
-0.076 (0.265)
Relative output growth -0.161*** (0.058)
-0.162*** (0.057)
-0.171*** (0.057)
Relative output gap -0.258*** (0.069)
-0.261*** (0.067)
-0.160** (0.073)
Commodity ToTgap * trade openness
0.158** (0.073)
0.175*** (0.075)
0.158** (0.074)
Relative structural public balance (I)
0.354* (0.197)
0.321* (0.189)
0.351* (0.179)
Obs. 421 421 412 R2 0.3167 0.3675 0.4489
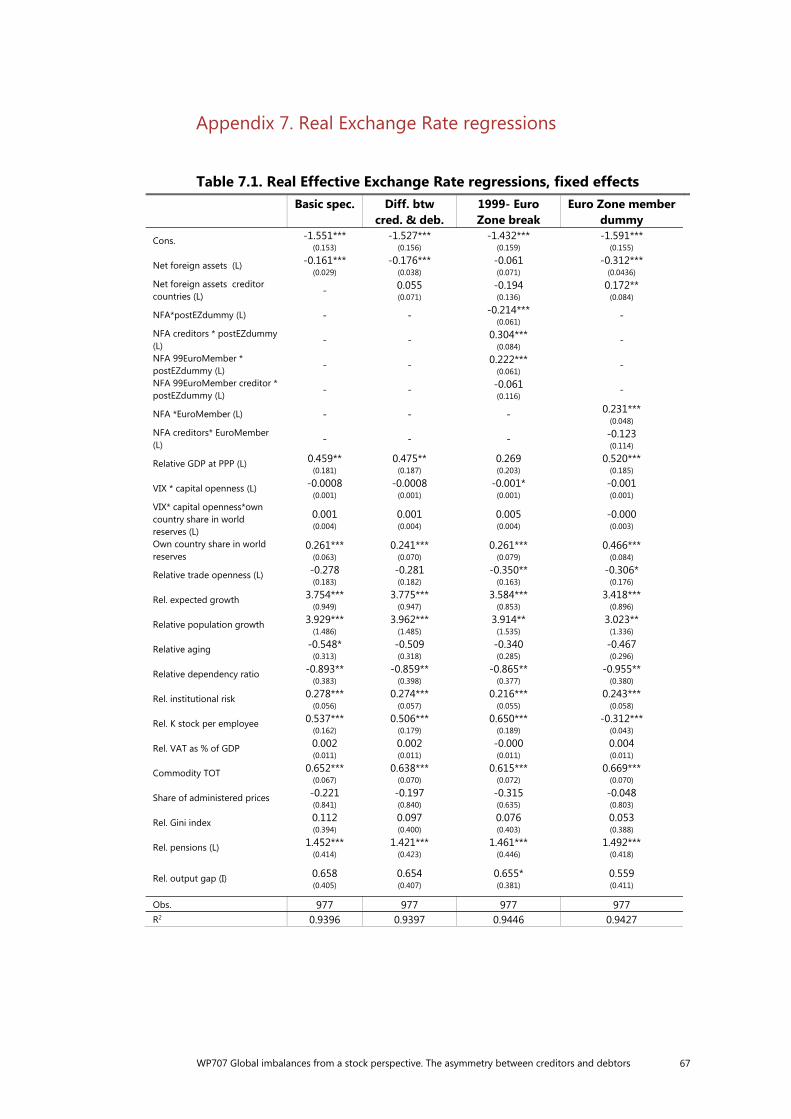
WP707 Global imbalances from a stock perspective. The asymmetry between creditors and debtors 67
Appendix 7. Real Exchange Rate regressions
Table 7.1. Real Effective Exchange Rate regressions, fixed effects Basic spec. Diff. btw
cred. & deb. 1999- Euro Zone break
Euro Zone member dummy
Cons. -1.551*** (0.153)
-1.527*** (0.156)
-1.432*** (0.159)
-1.591*** (0.155)
Net foreign assets (L) -0.161*** (0.029)
-0.176*** (0.038)
-0.061 (0.071)
-0.312*** (0.0436)
Net foreign assets creditor countries (L) - 0.055
(0.071) -0.194 (0.136)
0.172** (0.084)
NFA*postEZdummy (L) - - -0.214*** (0.061)
-
NFA creditors * postEZdummy (L) - - 0.304***
(0.084) -
NFA 99EuroMember * postEZdummy (L) - - 0.222***
(0.061) -
NFA 99EuroMember creditor * postEZdummy (L) - - -0.061
(0.116) -
NFA *EuroMember (L) - - - 0.231*** (0.048)
NFA creditors* EuroMember (L) - - - -0.123
(0.114)
Relative GDP at PPP (L) 0.459** (0.181)
0.475** (0.187)
0.269 (0.203)
0.520*** (0.185)
VIX * capital openness (L) -0.0008 (0.001)
-0.0008 (0.001)
-0.001* (0.001)
-0.001 (0.001)
VIX* capital openness*own country share in world reserves (L)
0.001 (0.004)
0.001 (0.004)
0.005 (0.004)
-0.000 (0.003)
Own country share in world reserves
0.261*** (0.063)
0.241*** (0.070)
0.261*** (0.079)
0.466*** (0.084)
Relative trade openness (L) -0.278 (0.183)
-0.281 (0.182)
-0.350** (0.163)
-0.306* (0.176)
Rel. expected growth 3.754*** (0.949)
3.775*** (0.947)
3.584*** (0.853)
3.418*** (0.896)
Relative population growth 3.929*** (1.486)
3.962*** (1.485)
3.914** (1.535)
3.023** (1.336)
Relative aging -0.548* (0.313)
-0.509 (0.318)
-0.340 (0.285)
-0.467 (0.296)
Relative dependency ratio -0.893** (0.383)
-0.859** (0.398)
-0.865** (0.377)
-0.955** (0.380)
Rel. institutional risk 0.278*** (0.056)
0.274*** (0.057)
0.216*** (0.055)
0.243*** (0.058)
Rel. K stock per employee 0.537*** (0.162)
0.506*** (0.179)
0.650*** (0.189)
-0.312*** (0.043)
Rel. VAT as % of GDP 0.002 (0.011)
0.002 (0.011)
-0.000 (0.011)
0.004 (0.011)
Commodity TOT 0.652*** (0.067)
0.638*** (0.070)
0.615*** (0.072)
0.669*** (0.070)
Share of administered prices -0.221 (0.841)
-0.197 (0.840)
-0.315 (0.635)
-0.048 (0.803)
Rel. Gini index 0.112 (0.394)
0.097 (0.400)
0.076 (0.403)
0.053 (0.388)
Rel. pensions (L) 1.452*** (0.414)
1.421*** (0.423)
1.461*** (0.446)
1.492*** (0.418)
Rel. output gap (I)
0.658 (0.405)
0.654 (0.407)
0.655* (0.381)
0.559 (0.411)
Obs. 977 977 977 977 R2 0.9396 0.9397 0.9446 0.9427
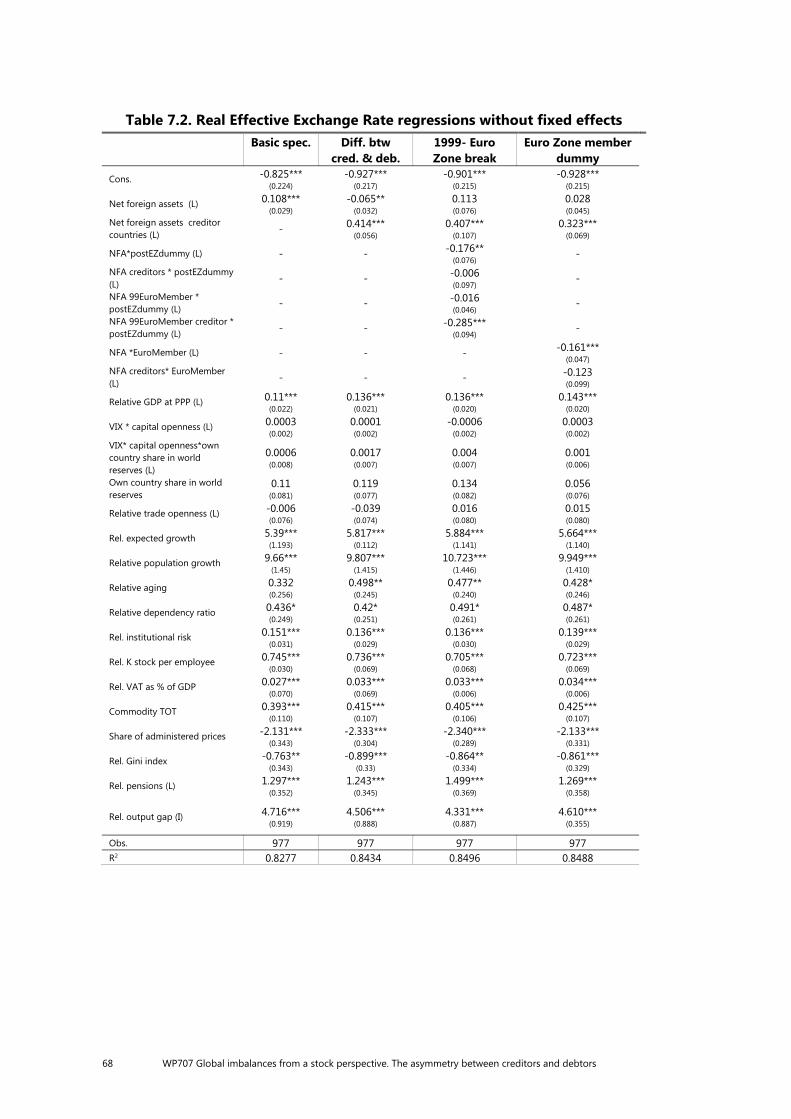
68 WP707 Global imbalances from a stock perspective. The asymmetry between creditors and debtors
Table 7.2. Real Effective Exchange Rate regressions without fixed effects Basic spec. Diff. btw
cred. & deb. 1999- Euro Zone break
Euro Zone member dummy
Cons. -0.825*** (0.224)
-0.927*** (0.217)
-0.901*** (0.215)
-0.928*** (0.215)
Net foreign assets (L) 0.108*** (0.029)
-0.065** (0.032)
0.113 (0.076)
0.028 (0.045)
Net foreign assets creditor countries (L) - 0.414***
(0.056) 0.407***
(0.107)0.323***
(0.069)
NFA*postEZdummy (L) - - -0.176** (0.076)
-
NFA creditors * postEZdummy (L) - - -0.006
(0.097) -
NFA 99EuroMember * postEZdummy (L) - - -0.016
(0.046) -
NFA 99EuroMember creditor * postEZdummy (L) - - -0.285***
(0.094) -
NFA *EuroMember (L) - - - -0.161*** (0.047)
NFA creditors* EuroMember (L) - - - -0.123
(0.099)
Relative GDP at PPP (L) 0.11*** (0.022)
0.136*** (0.021)
0.136*** (0.020)
0.143*** (0.020)
VIX * capital openness (L) 0.0003 (0.002)
0.0001 (0.002)
-0.0006 (0.002)
0.0003 (0.002)
VIX* capital openness*own country share in world reserves (L)
0.0006 (0.008)
0.0017 (0.007)
0.004 (0.007)
0.001 (0.006)
Own country share in world reserves
0.11 (0.081)
0.119 (0.077)
0.134 (0.082)
0.056 (0.076)
Relative trade openness (L) -0.006 (0.076)
-0.039 (0.074)
0.016 (0.080)
0.015 (0.080)
Rel. expected growth 5.39*** (1.193)
5.817*** (0.112)
5.884*** (1.141)
5.664*** (1.140)
Relative population growth 9.66*** (1.45)
9.807*** (1.415)
10.723*** (1.446)
9.949*** (1.410)
Relative aging 0.332 (0.256)
0.498** (0.245)
0.477** (0.240)
0.428* (0.246)
Relative dependency ratio 0.436* (0.249)
0.42* (0.251)
0.491* (0.261)
0.487* (0.261)
Rel. institutional risk 0.151*** (0.031)
0.136*** (0.029)
0.136*** (0.030)
0.139*** (0.029)
Rel. K stock per employee 0.745*** (0.030)
0.736*** (0.069)
0.705*** (0.068)
0.723*** (0.069)
Rel. VAT as % of GDP 0.027*** (0.070)
0.033*** (0.069)
0.033*** (0.006)
0.034*** (0.006)
Commodity TOT 0.393*** (0.110)
0.415*** (0.107)
0.405*** (0.106)
0.425*** (0.107)
Share of administered prices -2.131*** (0.343)
-2.333*** (0.304)
-2.340*** (0.289)
-2.133*** (0.331)
Rel. Gini index -0.763** (0.343)
-0.899*** (0.33)
-0.864** (0.334)
-0.861*** (0.329)
Rel. pensions (L) 1.297*** (0.352)
1.243*** (0.345)
1.499*** (0.369)
1.269*** (0.358)
Rel. output gap (I)
4.716*** (0.919)
4.506*** (0.888)
4.331*** (0.887)
4.610*** (0.355)
Obs. 977 977 977 977 R2 0.8277 0.8434 0.8496 0.8488
WP707 Global imbalances from a stock perspective. The asymmetry between creditors and debtors 69
References
Abiad, A, E Detragiache and T Tressel (2008): “A New Database of Financial Reforms”, Working Paper 266, International Monetary Fund.
Benetrix, A, P Lane and J Shambaugh (2015): “International currency exposures, valuation effects, and the global financial crisis”, Journal of International Economics.
Blanchard, O and GM Milesi-Ferretti (2009): “Global imbalances: in midstream?” IMF Staff Position Note.
Bussiere, M, G Chortareas and R Driver (2003): “Current accounts, net foreign assets and the implications of cyclical factors”, Eastern Economic Journal.
Catao, L and GM Milesi-Ferretti (2014): “External liabilities and crises”, Journal of International Economics.
Curcuru, S, C Thomas and F Warnock (2013): “On returns differentials”, Board of Governors of the Federal Reserve System International Finance Discussion Paper.
Dornbusch, R and S Fischer (1980): “Exchange rates and the current account”, American Economic Review.
Forbes, K, I Hjortsoe, and T Nenova (2016): “Current account deficits during heightened risk: menacing or mitigating?” NBER working paper 22741.
Gourinchas, P O and H Rey (2007): “From world banker to world venture capitalist: US external adjustment and the exorbitant privilege”, in R Clarida ed, “G7 current account imbalances: sustainability and adjustment”, NBER.
Habib, M (2010): “Excess Returns on net foreign assets. The exorbitant privilege form a global perspective,” Working Papers Series, no 1158, European Central Bank.
IMF (2013): “External Balance Assessment (EBA) Methodology: Technical Background,” IMF Working Paper.
––– (2014a): “World Economic Outlook, October 2014”, Chapter 4.
––– (2014b): “2014 External Sector Report”, IMF Policy Paper.
––– (2016): “2016 External Sector Report”, IMF Policy Paper.
Kraay, A and J Ventura (2000): “Current accounts in debtor and creditor countries”, Quarterly Journal of Economics.
Lane, P and GM Milesi-Ferretti (2004): “The transfer problem revisited: net foreign assets and real exchange rates”, Review of Economics and Statistics.
Lane, P and J Shambaugh (2010): “Financial exchange rates and international currency exposures”, American Economic Review.
70 WP707 Global imbalances from a stock perspective. The asymmetry between creditors and debtors
Previous volumes in this series
No Title Author
706 March 2018
Monetary policy in the grip of a pincer movement
Claudio Borio, Piti Disyatat, Mikael Juselius and Phurichai Rungcharoenkitkul
705 February 2018
An explanation of negative swap spreads: demand for duration from underfunded pension plans
Sven Klingler and Suresh Sundaresan
704 February 2018
Are credit rating agencies discredited? Measuring market price effects from agency sovereign debt announcements
Mahir Binici, Michael Hutchison and Evan Weicheng Miao
703 February 2018
The negative interest rate policy and the yield curve
Jing Cynthia Wu and Fan Dora Xia
702 February 2018
Cross-stock market spillovers through variance risk premiums and equity flows
Masazumi Hattori , Ilhyock Shim and Yoshihiko Sugihara
701 February 2018
Mapping shadow banking in China: structure and dynamics
Torsten Ehlers, Steven Kong and Feng Zhu
700 February 2018
The perils of approximating fixed-horizon inflation forecasts with fixed-event forecasts
James Yetman
699 February 2018
Deflation expectations Ryan Banerjee and Aaron Mehrotra
698 February 2018
Money and trust: lessons from the 1620s for money in the digital age
Isabel Schnabel and Hyun Song Shin
697 February 2018
Are banks opaque? Evidence from insider trading
Fabrizio Spargoli and Christian Upper
696 January 2018
Monetary policy spillovers, global commodity prices and cooperation
Andrew Filardo, Marco Lombardi, Carlos Montoro and Massimo Ferrari
695 January 2018
The dollar exchange rate as a global risk factor: evidence from investment
Stefan Avdjiev, Valentina Bruno, Catherine Koch and Hyun Song Shin
694 January 2018
Exchange Rates and the Working Capital Channel of Trade Fluctuations
Valentina Bruno, Se-Jik Kim and Hyun Song Shin
All volumes are available on our website www.bis.org.