Embed Size (px)
Citation preview
BIS Working Papers No 275
Inflation expectations, uncertainty and monetary policy by Christopher A Sims
Monetary and Economic Department
March 2009
JEL classification: E31, E52 Keywords: Inflation Expectations, Expectations formation, Rational Inattention, Asset Prices, Monetary Policy

BIS Working Papers are written by members of the Monetary and Economic Department of the Bank for International Settlements, and from time to time by other economists, and are published by the Bank. The papers are on subjects of topical interest and are technical in character. The views expressed in them are those of their authors and not necessarily the views of the BIS.
Copies of publications are available from:
Bank for International Settlements Press & Communications CH-4002 Basel, Switzerland E-mail: [email protected]
Fax: +41 61 280 9100 and +41 61 280 8100
This publication is available on the BIS website (www.bis.org).
© Bank for International Settlements 2009. All rights reserved. Brief excerpts may be reproduced or translated provided the source is stated.
ISSN 1020-0959 (print)
ISBN 1682-7678 (online)

Foreword
On 26–27 June 2008, the BIS held its Seventh Annual Conference on “Whither monetary policy? Monetary policy challenges in the decade ahead” in Luzern, Switzerland. The event brought together senior representatives of central banks and academic institutions to exchange views on this topic. BIS Paper 45 contains the opening address of William R White (BIS), the contributions of the policy panel on “Beyond price stability – the challenges ahead” and speeches by Edmund Phelps (Columbia University) and Martin Wolf (Financial Times). The participants in the policy panel discussion chaired by Malcolm D Knight (BIS) were Martin Feldstein (Harvard University), Stanley Fischer (Bank of Israel), Mark Carney (Bank of Canada) and Jean-Pierre Landau (Banque de France). The papers presented at the conference and the discussants’ comments are released as BIS Working Papers 273 to 277.
iii

Conference programme
Thursday 26 June
10:00 Registration and refreshments
11:00 Opening remarks:
William White (Bank for International Settlements)
Chair: Guillermo Ortiz, Bank of Mexico
11:15 Session 1: In search of monetary stability: the evolution of policy regimes
Paper title: In search of monetary stability: the evolution of monetary policy Some reflections. Experience – Lessons – Open issues
Author: Otmar Issing (Centre for Financial Studies)
Discussants: José de Gregorio (Central Bank of Chile) Allan Meltzer (Carnegie Mellon University)
12:45 Lunch
Chair: Durmus Yilmaz (Central Bank of the Republic of Turkey)
14:15 Session 2: Monetary policy communication Paper title: Talking about monetary policy: The virtues (and vices?) of
central bank communication
Author: Alan Blinder (Princeton University)
Discussants: Benjamin Friedman (Harvard University) Y V Reddy (Reserve Bank of India)
15:45 Coffee break
Chair: Tito Mboweni, South African Reserve Bank
16:15 Session 3: Expectations formation: beyond rational expectations Paper title: Inflation expectations, uncertainty and monetary policy
Author: Christopher Sims (Princeton University)
Discussants: Athanasios Orphanides (Central Bank of Cyprus) Lars Svensson (Sveriges Riksbank)
18:00 End of day one
19:00 Reception followed by formal dinner
Keynote address by Edmund Phelps (Columbia University)
v

Friday 27 June
Chair: Donald Kohn (Board of Governors of the Federal Reserve System)
09:00 Session 4: Changes in monetary policy transmission Paper title: Has the monetary transmission process in the euro area
changed? Evidence based on VAR estimates
Author: Axel Weber (Deutsche Bundesbank)
Discussants: Marvin Goodfriend (Carnegie Mellon University) Arminio Fraga Neto (Gávea Investimentos)
10:30 Coffee break
Chair: Hamad Saud Al-Sayari (Saudi Arabian Monetary Agency)
11:00 Session 5: Price stability and the external dimension Paper title: China’s financial conundrum and global imbalances
Authors: Ronald McKinnon (Stanford University) and Gunther Schnabl (Leipzig University)
Discussants: Ricardo Caballero (Massachusetts Institute of Technology) Michael Mussa (The Peterson Institute for International Economics)
12:30 Lunch
Luncheon remarks by Martin Wolf (Financial Times)
Chair: Lucas Papademos (European Central Bank)
14:00 Session 6: Credit frictions and monetary policy analysis Paper title: Credit frictions and optimal monetary policy
Author: Michael Woodford (Columbia University)
Discussants: Olivier Blanchard (Massachusetts Institute of Technology) Charles Goodhart (London School of Economics)
15:30 Coffee break
16:00 Panel discussion: Beyond price stability: the challenges ahead Chair: Malcolm Knight (Bank for International Settlements)
Panellists: Martin Feldstein (Harvard University) Stanley Fischer (Bank of Israel) Mark Carney (Bank of Canada) Jean-Pierre Landau (Banque de France)
17:30 Close of conference
vi
Contents
Foreword.................................................................................................................................. iii
Conference programme............................................................................................................v
Inflation expectations, uncertainty and monetary policy (by Christopher A Sims)
1. Introduction......................................................................................................................1
2. Rational inattention..........................................................................................................3
3. Can monetary policy fuel speculation?............................................................................4
4. A view of the history of the phillips curve ......................................................................13
5. The new keynesian phillips curve: is it a phillips curve? Is it useful? ............................17
6. Inflation-determination without a phillips curve..............................................................21
7. Implications for monetary policy ....................................................................................24
References .............................................................................................................................27
Remarks by Athanasios Orphanides ..................................................................................31
Remarks by Lars E O Svensson..........................................................................................37
vii

INFLATION EXPECTATIONS, UNCERTAINTY, AND MONETARY POLICY
CHRISTOPHER A. SIMS
I. INTRODUCTION
Monetary economics as practiced by central bank modelers has made a great deal
of progress in recent years. In a 2002 paper I interviewed research economists at
four central banks and surveyed the models in use at those banks. I criticized the
models for having lost all touch with statistical inference and with its connection
to decision theory. I also criticized them for not following the rational expectations
literature by jointly specifying and estimating the equations in their systems. And
I pointed out that none of the models had a consistent treatment of asset markets.
Since then many central banks, taking advantage of the new computational methods
for Bayesian inference that economists are learning to use, have made substantial
progress toward meeting the first two of these criticisms. They have still for the
most part done little about the third. And academic economists are beginning to
question some of the standard assumptions in the rational expectations framework
that underlies these models.
Recent events in financial markets, and the difficulties that they raise for central
banks, make it painfully clear that even the frontier Bayesian DSGE models like that
Date: June 24, 2008.1
INFLATION EXPECTATIONS, UNCERTAINTY, AND MONETARY POLICY 2
in use at the Swedish Riksbank do not model asset markets in any depth. But the
problem goes beyond that: these models, and most academic macro models as well,
assume a standard rational expectations framework: there is only one probability
measure in play, the “true” probability measure from which nature draws realiza-
tions. Agents in the model form expectations using this true distribution, condi-
tioning on information sets that consist of all information in the model dated t and
earlier. It is well documented that people do not actually behave this way, and in the
literature on behavioral finance there is some suggestion that deviations from this
standardized assumption of rational behavior given a common probability distribu-
tion may be important.
The recent events in financial markets — the dotcom boom, the US house price
boom, perhaps the continuing commodity price boom — look to some observers
like bubbles that must have fed off some sort of irrational behavior. Many observers
think that monetary policy might have somehow fueled these bubble-like episodes
in asset markets. These are important questions for monetary policy, and it is dis-
turbing that the monetary policy models in use cannot even be used to pose these
questions.
In this paper I focus on two particular, and related, deviations from the assump-
tion that all agents have the same probability distribution and that they optimally
process all information available up to some date t. I consider the implications of
INFLATION EXPECTATIONS, UNCERTAINTY, AND MONETARY POLICY 3
agents’ being able to process information only at a limited rate, and the implications
of agents’ assuming differing probability distriubions.
II. RATIONAL INATTENTION
Rational inattention theory explains why people do not use all of the information
that lies in front of them “for free”. It invokes Shannon’s notion of a “channel” with
finite “capacity” to process information, and assumes that people are such finite-
capacity channels. This implies that there are limits on how quickly and precisely
their behavior can react to information about a stochastically evolving economic en-
vironment. The attractive feature of Shannon’s theory for engineers is that it al-
lows discussion of information flows and the capacity of information channels in a
way that is quantitatively precise, yet abstracts from the physical characteristics of
the channel and of the information. These days we are all familiar with the notion
that our internet connections can be characterized by the “bits per second” figure
that measures their Shannon capacity, and that this is a good measure of speed of
transmission whether we are transmitting photos of grandchildren, spreadsheets of
historical GDP data, or MP3 files downloading from E-Music. The bits per second
figure means the same thing for copper wire connections, fiber-optic connections,
and cable connections.
This same independence of the hardware make the theory attractive for modeling
economic behavior, at least from the point of view of economists. It frees us from
INFLATION EXPECTATIONS, UNCERTAINTY, AND MONETARY POLICY 4
needing to know the details of the mental and physical limitations that prevent peo-
ple from reacting at every moment to every bit of information impinging on them —
we only need to know that the limitations exist, and to make the economist’s usual
assumption that information processing capacity, like other resources, is used op-
timally. I have explored these ideas in several papers (1998; 2003; 2006) The 2003
paper shows that the theory implies modifications in the permanent income model
that bring it more closely in line with observed behavior. The 2006 paper considers
a two-period savings model and shows that the theory can generate discretely dis-
tributed behavior, even in the face of continuously distributed information. By now
a number of other economists have taken up these ideas, including Mackowiak and
Wiederholt (2005) and Matejka (2008), who show that some of the observed puzzling
facts about microeconomic price behavior can be explained in the rational inatten-
tion framework.
In addition to its ability to predict sluggish, noisy, and discontinuous reactions
of rational agents to information, rational inattention theory suggests that they will
have persistent differences of opinion, due to the fact that they are all economizing,
in different ways, on their use of information.
III. CAN MONETARY POLICY FUEL SPECULATION?
Savage’s axioms for decision-making under uncertainty imply that a rational eco-
nomic agent making decisions under uncertainty will act as if he is maximizing ex-
pected utility under some probability distribution over the uncertain states of the

INFLATION EXPECTATIONS, UNCERTAINTY, AND MONETARY POLICY 5
world. But nothing in these axioms implies that every rational agent must have the
same probability distribuiton over uncertain states. There is relatively little economic
theory that considers the case where opinions, in the sense of probability distribu-
tions over states, differ. One reason for this neglect is that if people start with differ-
ing opinions, but view the same stream of evidence and process it optimally, their
opinions will tend to converge. Differing opinions are thus seen as rare, one-time
situations, not characteristic of a dynamic, stochastic, steady state. But the rational
inattention theory we have discussed above provides a rationale for something we
all know to be true: in the stochastic steady state we actually live in, the real world,
there are lots of differences of opinion.
Rationally inattentive people in a stochastically evolving environment who have
the same flow of data available to them at no cost will have persistently differing
opinions for two reasons. One is that, even if they have the same objective functions
and constraints, they can have unrelated signal-processing error. The error in their
implicit signals means that their actions and opinions contain a random component
at every date, and thus that their beliefs will differ. The theory does not imply that
this must be true; it implies only that there will be processing error. It could be
identical across individuals, or it could be completely independent across individ-
uals. It seems likely that neither extreme is usually correct, that people filter and
simplify their information streams in part through common mechanisms — reading
news sources, imitating what others are doing — but also in part idiosyncratically.
INFLATION EXPECTATIONS, UNCERTAINTY, AND MONETARY POLICY 6
The idiosyncratic part will lead to persistent differences in probability distributions
across agents. Perhaps more important is that not all data is equally useful to every-
one. People contemplating taking out a fixed rate mortgage will likely follow news
about interest rates closely around the time of the transaction, while people living in
houses with paid-up mortgages and living off social security payments might easily
totally ignore news about interest rates, even though the information would be of
some value to them — it might simply not be valuable enough to displace attention
paid to other aspects of life.
Rational inattention is not the only reason for differences of opinion, though. In
periods where genuinely new phenomena are arising, or when policy seems to be on
a new and upredictable path, the argument that a long history of repeated observa-
tion leads to agreement loses its force. For example in the period 1975-2000, the wide
swings in US fiscal policy (discussed below) could easily have led to differing views
about the implications of those swings for future inflation. And in the late 90’s in the
US, when unemployment and interest rates stayed persistently low, there were dif-
ferences of view even among specialist economists about the long term implications
for the inflation rate.
It is sometimes suggested that low interest rates in the US fueled the dot-com
boom in the stock market, the house price boom, the recent commodity price boom,
or all three. It seems impossible to support this suggestion in a standard equilibrium
INFLATION EXPECTATIONS, UNCERTAINTY, AND MONETARY POLICY 7
model with rational agents, except by assuming some form of irrationality or fric-
tion in the market. In a standard model, the monetary authority controls only the
evolution of the price level. If the model has no money illusion and flexible prices,
the monetary authority has little or no influence over real activity. Its actions control
the nominal interest rate and the path of the price level, not any real asset price.
There are some theoretical models that study markets in which agents with dif-
fering opinions interact. Scheinkman and Xiong (2003a) provides a useful survey.
The idea that differences of opinion can raise asset prices, at least if short sales are
not possible, goes back at least to Miller (1977). Harrison and Kreps (1978) showed
that this result holds in a dynamic model in which agents have no risk aversion and
in which short sales are not possible. Wahhaj (1999) showed that when short sales
are possible and agents are risk-averse, the classic result no longer holds in general.
Recently Brunnermeier and Julliard (2008) have studied irrational beliefs based on
money illusion (i.e. a difference between “true” beliefs and those held by borrow-
ers) and Scheinkman and Xiong (2003b) have studied a model in which difference
of belief emerge from the documented psychological tendency for people to exag-
gerate the precision of their own beliefs. Of these papers, only that of Brunnermeier
and Julliard considers monetary policy explicitly, and they find an effect of monetary
policy by postulating simple money illusion.
Here we develop a model in which no agent has money illusion, markets are
frictionless, short sales are allowed, real investment produces returns according to
INFLATION EXPECTATIONS, UNCERTAINTY, AND MONETARY POLICY 8
a non-stochastic production function known by all, and nonetheless differences of
opinion about the course of inflation generate overinvestment in the real asset. The
mechanism is fairly easy to understand once it is laid out. Suppose one group of
agents believes that inflation is likely to be high and the return on nominal bonds
therefore low. Another group believes that inflation is likely to be lower. Both face
the same real return on investment, which depends on the aggregate level of invest-
ment. The return on real investment in equilibrium must match what each agent
sees as the expected discounted return on the risky bonds. Since they agree on the
return on real investment, it must be that the agent who expects low inflation wants
to hold a lot of bonds, perhaps even lending to (i.e. buying nominal bonds issued
by) the other agent. He may also want to sell the stock short. He will need a port-
folio of this sort so that he perceives the high expected return on bonds as being
offset by the fact that they are highly correlated with his total portfolio return, justi-
fying a risk premium on them. The other agent, on the other hand, perceives selling
bonds and borrowing from the first agent as a source of cheap capital to invest in
the real asset. Because of the cheap source of capital, the second agent will, if he is
not very risk averse, invest more in the real asset than he would if all agents shared
his beliefs, and indeed so much more that the economy’s total investment is higher
than it would be if all agents shared the same beliefs. This all occurs only because
of the heterogeneity of opinions. If all agents in this model have the same beliefs
INFLATION EXPECTATIONS, UNCERTAINTY, AND MONETARY POLICY 9
about monetary policy, whatever the beliefs may be, the amount of real investment
is invariant to their beliefs.
Because the model is meant only to make a point, not to be quantitatively realistic,
it is extremely simple. Agents live two periods. They each begin life with an endow-
ment of nominal bonds B0, and in the first period of life they each have a endowment
Y of goods. They can consume in the first period, and the amount of their consump-
tion is C1. They can finance their first period consumption and their investment S in
the real asset from their real endowment or by selling some of their bonds. They can
also purchase more bonds.
There are two types of agents i = a, b. There are two possible states of the world in
the second period, states j = f , m. In the f state, the tax backing for bonds is low, and
hence prices are high. In the m state taxes are high and prices are therefore lower.
The problem of the agent of type i can therefore be written as
maxCi1,Bi,Si,Ci2 f ,Ci2m
U(C1) + β(piU(Ci2 f ) + (1 − pi)U(Ci2m) subject to (1)
Ci1 + Si +Bi − B0
P1= Y (2)
Ci2j = ρSi + RBi/P2j − τj + δ , j = f , m (3)
(4)
Here ρ is the rental price of capital in the second period, τj is the lump-sum tax rate
in the second period in state j, and δ is the profit dividend. We think of both types of
agents as being endowed with half the ownership rights in the technology, so they
INFLATION EXPECTATIONS, UNCERTAINTY, AND MONETARY POLICY 10
get dividends from the pure profits of the representative firm that are unaffected
by the amount of capital they set aside in the first period to rent out in the second.
Because this mode has to be solved numerically, we assume specific, convenient
functional forms for U and the production function: U(C) = C1−σ/(1 − σ) (with
log C as a limiting case as σ → 1) and g(S) = S1−α. Profit maximizing representative
firms will then require
ρ = (Sa + Sb)−α (5)
The government fixes R, the gross nominal interest rate, as well as τi, i = f , m. Its
second period budget constraints are
RB0
P2j= τj j = f , m . (6)
The government does no taxing, spending, or debt sales in the initial period, so
market clearing requires 2B0 = Ba + Bb.
The first-order conditions for the agents lead to
∂S : C−σi1 = ρ · (piC−σ
i f + (1 − pi)C−σim ) (7)
∂B :1
Cσi1P1
= Rβ
(piRP2 f
+(1 − pi)R
P2m
)(8)
These equations, though I think not soluble analytically, are numerically tractable.
To make this section’s main point, I display two solutions, differing only in that in
one pa = pb = .5, so beliefs are the same across the two types of agent, while in the
other pa = .3, pb = .7, so the type a agent believes it is more likely that the tax backing
INFLATION EXPECTATIONS, UNCERTAINTY, AND MONETARY POLICY 11
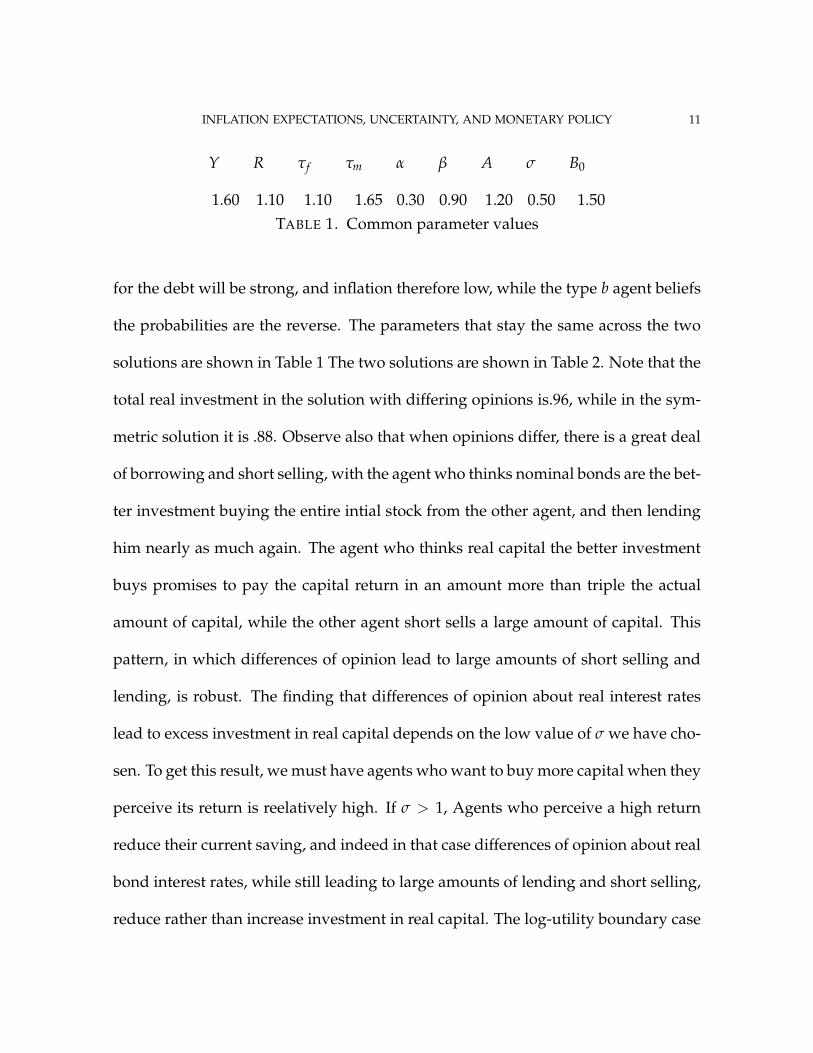
Y R τf τm α β A σ B0
1.60 1.10 1.10 1.65 0.30 0.90 1.20 0.50 1.50TABLE 1. Common parameter values
for the debt will be strong, and inflation therefore low, while the type b agent beliefs
the probabilities are the reverse. The parameters that stay the same across the two
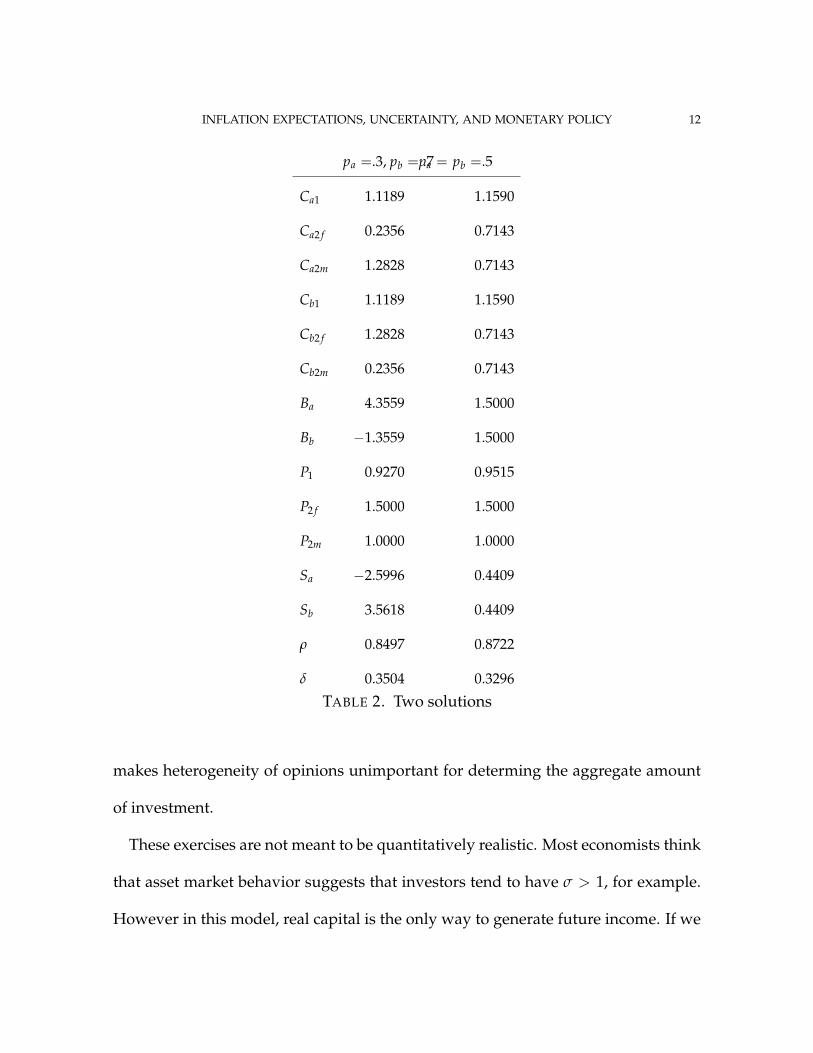
solutions are shown in Table 1 The two solutions are shown in Table 2. Note that the
total real investment in the solution with differing opinions is.96, while in the sym-
metric solution it is .88. Observe also that when opinions differ, there is a great deal
of borrowing and short selling, with the agent who thinks nominal bonds are the bet-
ter investment buying the entire intial stock from the other agent, and then lending
him nearly as much again. The agent who thinks real capital the better investment
buys promises to pay the capital return in an amount more than triple the actual
amount of capital, while the other agent short sells a large amount of capital. This
pattern, in which differences of opinion lead to large amounts of short selling and
lending, is robust. The finding that differences of opinion about real interest rates
lead to excess investment in real capital depends on the low value of σ we have cho-
sen. To get this result, we must have agents who want to buy more capital when they
perceive its return is reelatively high. If σ > 1, Agents who perceive a high return
reduce their current saving, and indeed in that case differences of opinion about real
bond interest rates, while still leading to large amounts of lending and short selling,
reduce rather than increase investment in real capital. The log-utility boundary case
INFLATION EXPECTATIONS, UNCERTAINTY, AND MONETARY POLICY 12
pa =.3, pb = .7pa = pb =.5
Ca1 1.1189 1.1590
Ca2 f 0.2356 0.7143
Ca2m 1.2828 0.7143
Cb1 1.1189 1.1590
Cb2 f 1.2828 0.7143
Cb2m 0.2356 0.7143
Ba 4.3559 1.5000
Bb −1.3559 1.5000
P1 0.9270 0.9515
P2 f 1.5000 1.5000
P2m 1.0000 1.0000
Sa −2.5996 0.4409
Sb 3.5618 0.4409
ρ 0.8497 0.8722
δ 0.3504 0.3296
TABLE 2. Two solutions
makes heterogeneity of opinions unimportant for determing the aggregate amount
of investment.
These exercises are not meant to be quantitatively realistic. Most economists think
that asset market behavior suggests that investors tend to have σ > 1, for example.
However in this model, real capital is the only way to generate future income. If we
INFLATION EXPECTATIONS, UNCERTAINTY, AND MONETARY POLICY 13
had a more realistic model, with many types of investment good, large proportional
changes in investment in any one good could be financed with smaller changes in
bond holdings. This might make the low risk aversion in this example a better ap-
proximation. Also, the case where differences of opinion about bond returns lead
to decreases in real investment might correspond to a situation that is perceived as
speculative excess. Though the total amount of real investment is reduced, this hap-
pens, under high risk aversion, because all the investment is being done by the agent
who sees bond returns as low; that agent’s investment is much higher than it would
be in the symmetric equilibrium. In fact the total investment is only lower because
this type of agent, being risk averse, holds back due to the risky leveraged position
his portfolio puts him in.
The point here is that the notion that some aspect of monetary policy might be
related to distorted speculative excess in asset markets does not rest on invoking
imprecise notions of asset market imperfection or irrationality of agents. Agents
with differing views of probabilities will use asset markets to bet against each other,
and in the process can push real allocations in directions that would not have arisen
if either agent’s belief were common across all agents in the economy.
IV. A VIEW OF THE HISTORY OF THE PHILLIPS CURVE
The original observation by Phillips simply noted an empirical regularity: unem-
ployment and inflation tended to be inversely related. This observation came at
a time when Keynesian macroeconomic theory had a very simple and incomplete
INFLATION EXPECTATIONS, UNCERTAINTY, AND MONETARY POLICY 14
model of inflation. Keynesian theory treated wages as, if not fixed, then on an ex-
ogenously given time path. It was a theory of how nominal aggregate spending
determined the level of output and employment, so long as supply-side limits on
output and employment were not encountered. It was recognized that when ag-
gregate demand exceeded supply-side limits, the result would be inflation, but the
standard Keynesian theory had a discontinuity at the point where output hit “capac-
ity”, and it had no quantitative predictions about the determination of the level of
inflation once capacity limits were hit.
As macroeconomists began to think about quantitative modeling of the aggregate
economy, the Phillips curve offered a way to make Keynesian inflation theory contin-
uous and quantitative. The level of unemployment could be used to measure how
far the economy was from capacity, and thereby to make quantitative predictions
about how inflation would be affected by the level of aggregate demand. Policy,
whether monetary or fiscal, was conceived as affecting inflation via a causal chain,
from aggregate demand, to the level of output and employment (and thereby un-
employment), to the rate of inflation. Through the 1960’s and 1970’s probably most
economists thought about inflation-determination this way, and many still do. I am
not arguing here that many economists think such a two-equation recursive model
of the economy is the full story of inflation determination, but simple one and two
equation models are part of the mental furniture of most macroeconomists, and this
particular simple model remains influential.
INFLATION EXPECTATIONS, UNCERTAINTY, AND MONETARY POLICY 15
Primiceri (2006) models inflation-determination in the 1960’s and 70’s and 80’s as
reflecting policy-makers’ use of a model like this and learning over time about the
value of its coefficients. One may be skeptical of his results because of his assump-
tion that the model about which the policy-makers are learning is correct, with only
the coefficient values uncertain. Nonetheless, the fact that Primiceri’s interpretation
of history works as well as it does may explain why this way of thinking still has a
hold on policy-makers’ thinking.
This is interesting, because we know that Lucas and Rapping in a series of papers
in the late 60’s and early 70’s (1973; 1969b; 1969a) developed a model with some
plausibility in which Phillips’s empirical regularity could be misleading if used, as
the Keynesian models were doing, to analyze the effects of policy. This new simple
model arrived on the scene just as the US entered a period in the 1970’s of simulta-
neous high unemployment and high inflation, making the data in unemployment-
inflation plots jump off the historical Phillips curve. The simple rational expectations
version of this theory, in which the causal direction is reversed, with inflation sur-
prises causing changes in unemployment, did not fit the data any better than the
deteriorating standard Phillips curve, but it provided a qualitative story about why
a Phillips curve might first appear in the data, then disappear in the presence of
Keynesian policy-making.
While a few of the early advocates of rational expectations modeling (Sargent ref-
erence) held out the hope that it would generate “cross-equation restrictions” that
INFLATION EXPECTATIONS, UNCERTAINTY, AND MONETARY POLICY 16
would lead to improved quantitative policy models, the new theory was more com-
monly interpreted as implying the entire enterprise of large-scale policy modeling
was quixotic. Simultaneous equation econometrics began to disappear from eco-
nomics PhD training in the US, while every new PhD could explain how the “Lucas
critique” implied that Keynesian macro models would lead to policy errors. With the
simple “Lucas supply curve” (the rational expectations, reversed-direction, Phillips
curve) replacing the Phillips curve, there was furthermore no need for big policy
models. The best monetary policy could do was to avoid creating surprises. Milton
Friedman’s proposal of a fixed growth rate for the money atock (which he supported
with a different set of arguments) fit well with the rational expectations policy anal-
ysis.
Meanwhile, those actually making monetary policy faced a continuing need to
make decisions responsibly in the light of data emerging week by week. The Thatcher
government’s experiment in the UK with a simple monetary growth rate policy rule
showed that the historical statistical relationships among various measures of the
money stock, and between the money stock and inflation and output, could dete-
riorate when exploited for policy purposes in the same way, and for the same rea-
sons, that the empirical Phillips curve had decayed. With academic economic re-
search turned almost entirely away from large scale policy modeling, central bank
INFLATION EXPECTATIONS, UNCERTAINTY, AND MONETARY POLICY 17
economists developed their own solutions. They emerged with models that pre-
served many of the characteristics of the first generation of Keynesian models: equation-
by-equation specification; emphasis on flow equilibrium; and Phillips curves as the
locus for non-neutrality of monetary policy. Expectations now entered the models
more pervasively, and the models, to sidestep the Lucas critique, made it at least
formally possible to treat expectations as rational. The discipline of simultaneous
equations econometric inference was entirely abandoned. 1
For policy modeling, the simple Lucas supply curve was inadequate. Besides not
fitting the data, its microeconomic underpinnings were either informal or, in formal
models, highly abstract and unrealistic — for example models of “island economies”
in which people had to infer the value of the economy-wide interest rate or money
stock from the price level on their own island. The policy models began by simply
adding an inflation expectations term to the right-hand-side of the original Phillips
curve, but there was no satisfactory theory of how such a relationahip arose out
of individual economic behavior. Into this gap sprang the New Keynesian Phillips
Curve.
V. THE NEW KEYNESIAN PHILLIPS CURVE: IS IT A PHILLIPS CURVE? IS IT USEFUL?
The New Keynesian (NK) Phillips curve is not an empirical relation between un-
employment and inflation. It nonetheless can play the same role as the Phillips curve
in a policy model: it links a continuously varying, observable measure of “distance
1I discussed the state of central bank modeling in a 2002 Brookings paper.
INFLATION EXPECTATIONS, UNCERTAINTY, AND MONETARY POLICY 18
from capacity” to predictions about the rate of inflation. Furthermore, it provides a
microeconomic story about how this relation emerges, a story in which people have
rational expectations and have no money illusion. There are a number of reasons,
though, to see the NK Phillips curve as a Pyrrhic victory.
The theory of the NK Phillips curve is well known and documented elsewhere,
e.g. in Woodford (2003), so I will just summarize it here. A continuum of monop-
olistically competitive firms have control over their own prices, because of product
differentiation, but have an incentive to keep their prices in line with those of other
firms, because there are competitive pressures. They face some friction in price-
setting, however. There are a number of postulated forms of friction. One is that
prices are set in contracts of fixed length, an idea first explored by John Taylor. An-
other, more convenient form is that prices are fixed for random periods, with the
duration of the random period determined exogenously. (This latter is “Calvo pric-
ing”.) There are further variations on the form of the friction, some of which we will
discuss below. Because of the friction, when the aggregate price level moves, not
all firms respond to the change at once, and this creates non-neutrality for monetary
policy.
This theory sidesteps the Lucas critique, because it contains expectations explicitly
and assumes that expectations are rational. But the Lucas critique is only one special
case of a generic problem we face in econometric modeling: we make simplifications
and approximations that we realize are contingent, so that some kinds of changes in
INFLATION EXPECTATIONS, UNCERTAINTY, AND MONETARY POLICY 19
policy, or in the nature of exogenous disturbances, will force us to change the model.
The NK Phillips curve is clearly unstable under some kinds of policy change — in-
deed under exactly the same kinds of policy change that the Lucas critique claimed
could undermine old Keynesian models. Though the agents in the NK model have
rational expectations and no money illusion, the theory has simply moved the non-
neutrality from agent behavior itself into the constraints the agent faces, the frictions.
The contract lengths of Taylor and Calvo theory are clearly not constants of nature;
surely they will change systematically with the level, variability and forecastability
of inflation.
But there is a perhaps more important problem with the NK theory: it props up
the simple Phillips curve way of thinking about the link from monetary policy to
inflation. Though it suggests a different way of measuring real tightness — the “out-
put gap” in place of unemployment — it still provides an equation in which real
tightness appears as the crucial determinant of inflation. Of course in principle once
inflation expectations are admitted to a Phillips curve equation, new style or old,
it becomes possible for disturbances anywhere in the model to impact inflation di-
rectly, without any intermediating move in the measure of real tightness. If such
influences are small, or slow-moving, it may nonetheless be helpful to think of in-
flation as determined, via a Phillips curve, by real tightness. But it is also possible
that the opposite is true — the impact of policy and other disturbances on inflation
is mainly direct, through the expectation term in the Phillips curve, so that retaining
INFLATION EXPECTATIONS, UNCERTAINTY, AND MONETARY POLICY 20
the Phillips curve as the central focus of informal thinking about inflation determi-
nation is misleading. Orphanides (2001) has explained how the US inflation in the
70’s could have emerged from policy-makers’ difficulties in real-time measurement
of the output gap. But these difficulties played such a central role in good part be-
cause of Phillips curve thinking — the notion that some measure based on real data,
with no statistical input from inflation itself or inflation expectations, was the central
determinant of inflationary or disinflationary pressure.
The NK theory gives a central role not to unemployment, but to the output gap.
Recently the empirical literature (Sbordone, 2003), e.g., has recognized that the out-
put gap is actually important in the theory because it measures marginal cost, and
has moved toward more direct measures of this, in particular to looking at the labor
share of output.
It is reasonable then, to ask whether we have any evidence on this issue: to what
extent is some version of a Phillips curve central to the determination of inflation?
In an earlier, related paper 2008a I showed that structural VAR estimates of fairly
strong effects of monetary policy on real activity, prices, and wages do not appear
to be mediated by the marginal cost variable most commonly used in the recent NK
Phillips curve literature, the share of labor in total costs. This does not suggest that
the NK Phillips curve is refuted, or that it should not appear in the DSGE models
where it is widely used. Indeed, it may play an important role in explaining why
INFLATION EXPECTATIONS, UNCERTAINTY, AND MONETARY POLICY 21
consumption good prices respond considerably more slowly to a monetary contrac-
tion or expansioin than do wages or commodity prices. But thinking of monetary
policy as acting on inflation by first changing some measure of real tightness, like
labor share, then affecting prices, seems to be missing the central part of the story.
VI. INFLATION-DETERMINATION WITHOUT A PHILLIPS CURVE
If we cannot rely on a single Phillips-curve like equation to organize our thinking
about inflation, what is the replacement? There are two main directions to pursue,
I think. One, already mentioned above, is to explore theories about deviations from
the simple rational expectations paradigm. This may help us understand not only
price stickiness and non-neutrality, but also sluggishness and inertia in economic
behavior more generally. The other, which can be fruitfully pursued even within the
rational expectations framework, is to be more explicit and systematic in taking a
full dynamic general equilibrium approach to macro modeling, and in particular to
model more carefully the interaction of monetary policy with asset markets and the
interaction of asset markets with “the real economy”.
Current and expected future fiscal and monetary policy have immediate and strong
impacts on asset markets. In a fully articulated dynamic equilibrium model with
rational agents, these impacts involve invoking transversality conditions. I have a
colleague who interrupts every discussion of this kind of model with “Is this going
to involve transversality conditions?”. His view is that few if any economists really
understand transversality conditions (which is also my view) and that it is therefore
INFLATION EXPECTATIONS, UNCERTAINTY, AND MONETARY POLICY 22
unreasonable to entertain models that invoke transversality conditions to explain the
behavior of actual human beings.
But transversality conditions apply even to less-than-hyperrational agents. They
are really just a name for wealth effects. If monetary policy raises the rate of return
on government bonds, and if agents project that this rise in the relative return of
government paper will be persistent, government paper becomes more attractive,
people will tend to trade other assets for government paper, and there will therfore
be downward pressure on the rate at which government paper trades for other goods
— i.e. the price level. But there are conditions under which a rise in interest rates
on government bonds, generated by the central bank, will not lead bond-holders
to believe in persistently higher returns on government bonds. Higher real returns
are possible, in general equilibrium, only if increased primary surpluses emerge in
response to the higher interest rates. In an economy in which political economy or
bureaucratic inefficiency makes increased primary surpluses impossible, the higher
interest rates will only generate an increased rate of issue of government paper, with
no increased rate of return — indeed with capital losses for holders of long nominal
debt. It may take some time for bondholders to appreciate the nature of these fiscal
dynamics, so that the inflationary effects of increased interest rates do not take hold
immediately. But this only makes the real value of the outstanding debt at current
prices increase more rapidly, so that when the realization that the increased debt has
no real backing sinks in, the eventual effects on demand are even larger. This kind of
INFLATION EXPECTATIONS, UNCERTAINTY, AND MONETARY POLICY 23
situation is widely acknowledged to have existed in some countries and some time
periods, especially where interest expense has become a large fraction of the total
government debt and nominal interest rates are high.
Most macroeconomists, though, think of this type of scenario as applying perhaps
to Brazil in some periods, but not to the US, ever. My view is that we should reeval-
uate this possibility. Our recent history of a stock market boom, a housing price
boom, then a commodity price boom and a decline in the value of the dollar, may
be best understood as reflecting the evolution of thinking by bondholders about cur-
rent and future US monetary and fiscal policy. In the 1970’s when the US had its
great burst of inflation, fiscal policy was by some measures much more unstable
than monetary policy. On average over time any country that can issue debt must
be running primary surpluses — the conventional surplus plus interest payments.
The US ran primary surpluses in all but four of the years from 1972 through 1974, for
example, but ran primary deficits every year from 1975 through 1994, except for two
years of small primary surpluses. Then from 1995 through 2002 it ran large primary
surpluses, to the point where it seemed the US government debt might essentially
vanish. And now we are again in a period of primary deficits. What ended the long
period of primary deficits? What were bondholders thinking about future fiscal pol-
icy in this period? How did interest rate policy, which during the early 80’s was
INFLATION EXPECTATIONS, UNCERTAINTY, AND MONETARY POLICY 24
causing large changes in the size of the interest expense component of the budget,
interact with the political economy of fiscal policy?2
These issues are of course only one component of a full general equilibrium ap-
proach to assessing the effects of monetary and fiscal policy on inflation. Nonethe-
less, it seems to me that there may by high returns to focussing more of our attention
on this component, even at the expense of less attention to the microeconomics of
price and wage dynamics.
VII. IMPLICATIONS FOR MONETARY POLICY
So what are the implications of these new strands of research for the Phillips curve,
monetary policy, and macroeconomics more genrally. I do not have space to consider
all the implications here, but some interrelated implications are worth drawing out.
Rational inattention implies that people will behave as if they are observing mar-
ket signals with error, and that agents with a bigger stake will invest more of their
capacity in precise observation of a given signal. It therefore provides one ratio-
nale for why economic agents might have different probability distributions over
the state of the economy, and for why they might persist despite the accumulation of
“freely observable” evidence. Rational inattention and differences of opinion both
may be related to why it is so hard, and yet so important, to model the interaction
2In a 2008b paper I elaborate these points and present a model in which fiscal policy might have
prevented the Fed from controlling inflation in the 1970’s, even though it was capable of creating
recessions and corresponding temporary pauses in inflation.
INFLATION EXPECTATIONS, UNCERTAINTY, AND MONETARY POLICY 25
of asset markets with monetary policy and with the economy. Hard as it may be to
model how a set of rational agents with a single probability distribution would have
modeled the future of fiscal policy in the 70’s and 80’s, it is harder still to imagine
that every agent, whether he held bonds or not, whether she was 75 years old or 23,
whether she was thinking of taking out a mortgage to buy a first home or had lived
in the same house for 40 years and paid off her mortgage, had the same views about
the future of fiscal policy and, therefore, the values of nominally denominated as-
sets. Differences of views, learning, and rational inattention might explain why the
interaction of monetary policy and fiscal policy with asset markets seems sometimes
to work itself out on a long time scale. Not everyone will make the same assessment,
at the same time, of the implications of transversality conditions. It may be that this
can lead to wide swings in asset markets, and to delayed and unpredictable effects
of monetary policy shifts.
Recognition that diverse opinions about the course of the price level can be im-
portant, and that agents display rational inattention, has some immediate implica-
tions, it seems to me, about central bank communications with the public. On the
one hand, rational inattention theory suggests that when monetary policy has been
going well, one of its benefits is that people will pay little attention to it — and there-
fore may misperceive or ignore policy changes. This is a benefit because attention
is a scarce resource. I think it likely that one of the main costs of high and vari-
able inflation is that it forces people to spend a considerable fraction of their limited
INFLATION EXPECTATIONS, UNCERTAINTY, AND MONETARY POLICY 26
information-processing capacity on tracking the price level and the exchange rate.
Thus it is not a problem that the public pays little attention to monetary policy, most
of the time. But there may be periods when policy has to change, and misperception
of the change by the public could be costly. Rational inattention theory suggests that
people will, no matter how information is presented to them, find ways to process
it optimally. They will, therefore, try to be sure that they pay attention to monetary
policy when it is important, perhaps relying on the services of information filters like
newspapers (or, these days, internet news sites). But they will not be able to do this
unless the information is there. It is a mistake, therefore, to take the evidence that
in quiet times people ignore or misperceive monetary policy pronouncements as a
reason to limit the flow of information about monetary policy.
This conclusion is amplified when we recognize that diversity of views about fu-
ture monetary and fiscal policy can be a source of distortions of the behavior of
real asset markets. If agents are forced to infer monetary policy from the time se-
ries of policy rate changes and from terse and cryptic summaries of the rationale for
the rate changes, they will introduce their own signal processing errors and thereby
make diversity of views more likely. The ideal communication strategy might then
be multi-tiered. Very detailed and analytical descriptions of policies and the changes
in it like those produced in the inflation reports of inflation-targeting central banks
might be accompanied by more easily tracked simplified characterizations of policy.
The point of the simplified presentations is not to hide detail from the public, but
INFLATION EXPECTATIONS, UNCERTAINTY, AND MONETARY POLICY 27
to shape the simplified view that the public is bound to form, even if given the de-
tailed information flow. It is worthwhile to try to move the public toward a common
simplified view of monetary and fiscal commitments, rather than having them form
views idiosyncratically and then bet with each other in asset markets.
REFERENCES
Brunnermeier, Markus and Christian Julliard, “Money Illusion and Housing Fren-
zies,” Review of Financial Studies, 2008, 21 (1), 135–180.
Harrison, Michael and David Kreps, “Speculative investor behavior in a stock mar-
ket with heterogeneous expectations,” Quarterly Journal of Economics, 1978, 92, 323–
336.
Lucas, Robert E. Jr., “Some International Evidence on Output-Inflation Tradeoffs,”
American Economic Review, jun 1973, 63 (3), 326–334.
and Leonard Rapping, “Price Expectations and the Phillips Curve,” Ameri-
can Economic Review, 1969.
and , “Real Wages, Employment, and Inflation,” Journal of Political
Economy, 1969.
Mackowiak, Bartosz and Mirko Wiederholt, “Optimal Sticky Prices under Rational
Inattention,” Technical Report, Humboldt University Berlin February 2005.
Matejka, Filip, “Rationally Inattentive Seller: Sales and Discrete Pricing,” Technical
Report, PACM, Princeton University May 2008.
INFLATION EXPECTATIONS, UNCERTAINTY, AND MONETARY POLICY 28
Miller, Edward, “Risk, uncertainty and divergence of opinion,” Journal of Finance,
1977, 32, 1151–1168.
Orphanides, Athanasios, “Monetary Policy Rules, Macroeconomic Stability, and In-
flation: A View from the Trenches,” Technical Report, Board of Governors of the
Federal Reserve System May 2001.
Primiceri, Giorgio, “Why Inflation Rose and Fell: Policymakers’ Beliefs and US Post-
war Stabilization Policy,” Quarterly Journal of Economics, August 2006, 121, 867–901.
Sbordone, Argia, “U.S. Wage and Price Dynamics: A Limited-Information Ap-
proach,” International Journal of Central Banking, September 2003, 2 (3).
Scheinkman, Jose and Wei Xiong, “Heterogeneous Beliefs, Speculation and Trading
in Financial Markets,” Paris-Princeton Lectures in Mathematical Finance, Springer
2003.
and , “Overconfidence and Speculative Bubbles,” Journal of Political
Economy, 2003, 111, 1183–1219.
Sims, Christopher, “Inflation Expectations, Uncertainty, the Phillips Curve, and
Monetary Policy,” Technical Report, Princeton University June 2008. Presented
at the June, 2008 Boston Federal Reserve Bankmonetary policy conference.
Sims, Christopher A., “Stickiness,” Carnegie-rochester Conference Series On Public Pol-
icy, 1998, 49 (1), 317–356.
, “The Role of Models and Probabilities in the Monetary Policy Process,”
Brookings Papers on Economic Activity, 2002, 2002 (2), 1–62.
INFLATION EXPECTATIONS, UNCERTAINTY, AND MONETARY POLICY 29
, “Implications of Rational Inattention,” Journal of Monetary Economics, April
2003, 50 (3), 665–690.
, “Rational Inattention: Beyond the Linear-Quadratic Case,” American Eco-
nomic Review, May 2006, 96 (2), 158–163. Proceedings issue.
, “Stepping on a Rake: The Role of Fiscal Policy in the Inflation of the 1970’s,”
Technical Report, Princeton University 2008.
Wahhaj, Zaki, “Trading in Financial Markets with Differences of Beliefs,” Under-
graduate honors essay, Yale College 1999.
Woodford, Michael, Interest and Prices: Foundations of a Theory of Monetary Policy,
Princeton University Press, 2003.

Remarks on “Inflation expectations, uncertainty, and monetary policy”
Athanasios Orphanides1
This is a rich paper to discuss with numerous exciting ideas. It touches upon areas ranging from questioning the traditional application of rational expectations in macro modelling, the role of disagreement in expectations for asset price determination and implications of the new thinking on modelling expectations for monetary policy. The paper also presents a view of the history of the Phillips curve and discusses the determination of inflation without a Phillips curve. The Phillips curve was at the centre of a related paper (Sims (2008)), which Chris presented a couple weeks ago at the Federal Reserve Bank of Boston’s 53rd economic conference. Given that I had the chance to talk about that paper at that conference, I will focus on some of the other ideas today.
Chris starts his paper by recalling that in earlier work he had criticised central bank macro modellers for not following the rational expectations literature to the letter, for example, in jointly specifying and estimating the system of equations in their models (Sims (2002)). I would like to express my relief that the modellers did not take on board Chris’ suggestions to put all of the cross equation restrictions in place at that time. In light of the central argument in this paper, this would have been a terrible idea. Indeed, the main theme of the present paper is to explain why traditional application of rational expectations can be problematic and why it is high time that modellers incorporated more realistic models of expectations in their analysis.
The rational expectations assumption has proven extremely powerful over the past few decades and there are some good reasons for its broad theoretical appeal. But there are also numerous limitations that should be kept in mind. Chris highlights as a problem the fact that only one probability distribution is in play in any model – what Tom Sargent recently described as the “communism” of rational expectations.2 The rational expectations assumption imposes strict discipline on a model, requiring all agents in the model, the economists and policymakers outside the model, as well as nature, to share a unique set of beliefs. But it is incomplete as it does not explain how people come to hold these common beliefs. It is also inconsistent with the presence of numerous models, each one imposing a different and yet unique set of beliefs. Importantly, as Chris emphasises, it fails to address the presence and the role of heterogeneity of beliefs in the real world we observe around us.
These limitations matter for policy analysis. Oversimplifying the expectations formation process in analytical models can lead to a misreading of the workings of the economy and to false policy recommendations. At present, by and large, traditional modelling imposes rational expectations in a world with fixed and perfectly known structures, including known and stable policy preferences. Under such assumptions, the monetary policy problem seems trivial – and misleadingly so. In particular, anchoring inflation expectations, which is widely acknowledged as a central element of a successful policy strategy – especially in the environment of adverse supply shocks we presently face – becomes a simple matter of policy adopting and adhering to a stable policy rule. Furthermore, in a world of perfect
1 Governor, Central Bank of Cyprus 2 See Evans and Honkapohja (2005).
31
knowledge there is essentially no role for central bank communication, a gap that Alan Blinder also pointed out in his contribution earlier today (Blinder (2008)).
In recognition of the serious limitations of the traditional application of rational expectations, recent work has explored various avenues for improvement. Alternative models of expectations have been developed using the concepts of inattention or learning as refinements of the rational expectations assumption. Chris focuses on the virtues of the rational inattention alternative but I find both approaches promising in different ways. A common element in these approaches is the acknowledgement of the presence of imperfections in the formation of expectations relative to simplistic rational expectations models. Both approaches stress the limited cognitive capacity of humans and by doing so better capture the inherent limitations in gathering and processing information.
The rational inattention models are successful in staying closer to the microfoundations of decision making but are rather hard to work with. Learning models provide a simpler approach for deviating from traditional rational expectations by asking private agents to act as econometricians, respecifying and reestimating forecasting models with limited data to form expectations. The implications, in many respects, are broadly similar, but much more work is needed to figure out whether the simple mechanisms embedded in learning models approximate well the microfoundations of the inattention models.
The paper develops an interesting example of an economy where differences of opinion about the course of inflation could have real economic effects. The example is helpful for explaining one potential reason why policymakers are interested in monitoring expectations and, also, for establishing that disagreement in expectations may be a determinant of financial asset returns. Motivated by the theoretical example, I thought it would be informative to provide two illustrations of the potential empirical relevance of the story by looking at survey measures of expectations.
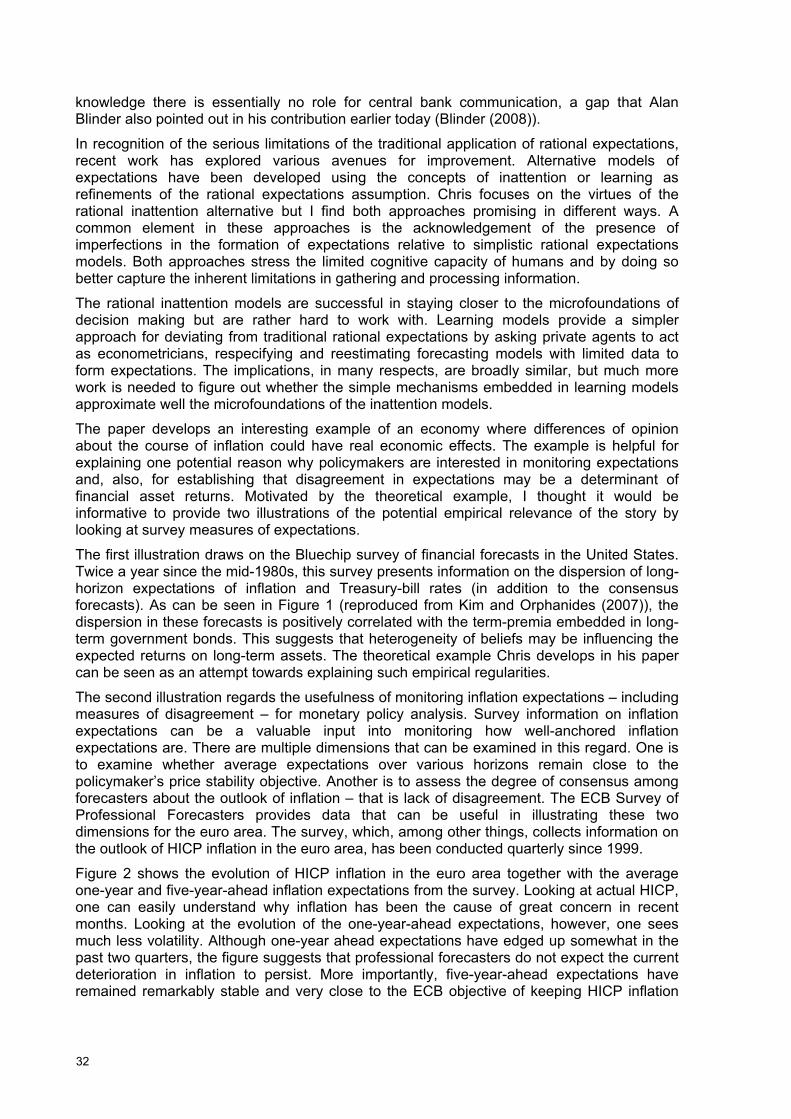
The first illustration draws on the Bluechip survey of financial forecasts in the United States. Twice a year since the mid-1980s, this survey presents information on the dispersion of long-horizon expectations of inflation and Treasury-bill rates (in addition to the consensus forecasts). As can be seen in Figure 1 (reproduced from Kim and Orphanides (2007)), the dispersion in these forecasts is positively correlated with the term-premia embedded in long-term government bonds. This suggests that heterogeneity of beliefs may be influencing the expected returns on long-term assets. The theoretical example Chris develops in his paper can be seen as an attempt towards explaining such empirical regularities.
The second illustration regards the usefulness of monitoring inflation expectations – including measures of disagreement – for monetary policy analysis. Survey information on inflation expectations can be a valuable input into monitoring how well-anchored inflation expectations are. There are multiple dimensions that can be examined in this regard. One is to examine whether average expectations over various horizons remain close to the policymaker’s price stability objective. Another is to assess the degree of consensus among forecasters about the outlook of inflation – that is lack of disagreement. The ECB Survey of Professional Forecasters provides data that can be useful in illustrating these two dimensions for the euro area. The survey, which, among other things, collects information on the outlook of HICP inflation in the euro area, has been conducted quarterly since 1999.
Figure 2 shows the evolution of HICP inflation in the euro area together with the average one-year and five-year-ahead inflation expectations from the survey. Looking at actual HICP, one can easily understand why inflation has been the cause of great concern in recent months. Looking at the evolution of the one-year-ahead expectations, however, one sees much less volatility. Although one-year ahead expectations have edged up somewhat in the past two quarters, the figure suggests that professional forecasters do not expect the current deterioration in inflation to persist. More importantly, five-year-ahead expectations have remained remarkably stable and very close to the ECB objective of keeping HICP inflation
32
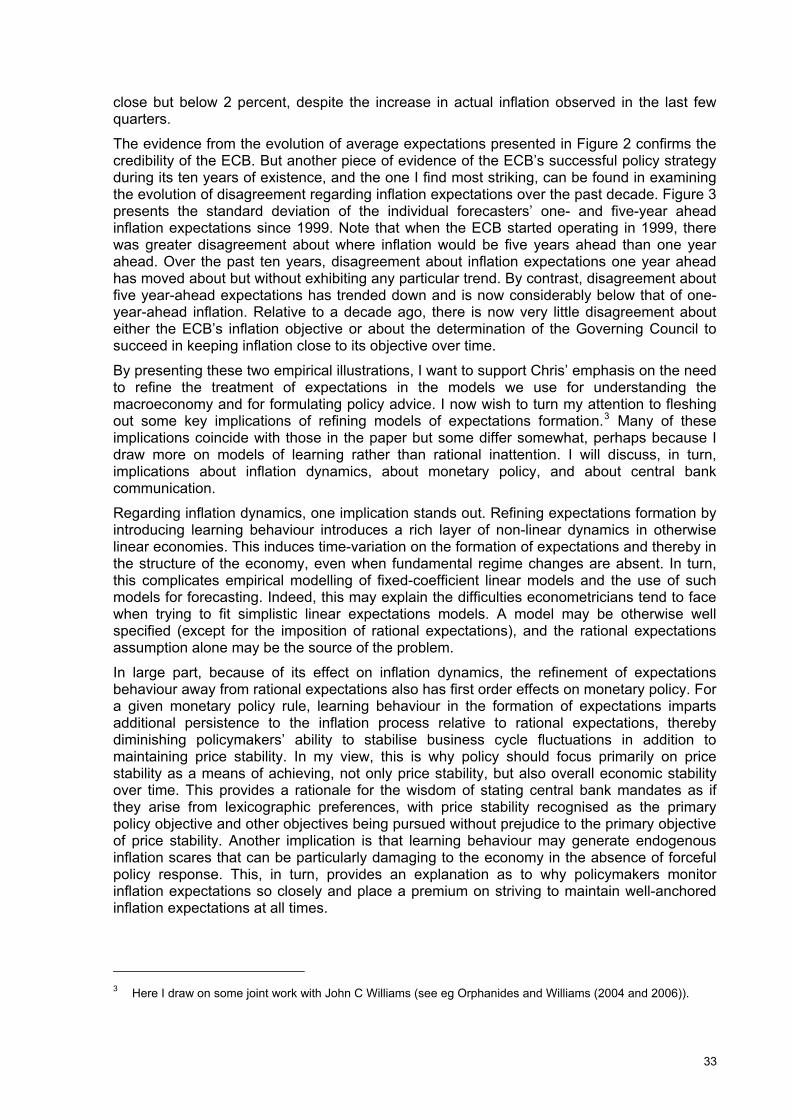
close but below 2 percent, despite the increase in actual inflation observed in the last few quarters.
The evidence from the evolution of average expectations presented in Figure 2 confirms the credibility of the ECB. But another piece of evidence of the ECB’s successful policy strategy during its ten years of existence, and the one I find most striking, can be found in examining the evolution of disagreement regarding inflation expectations over the past decade. Figure 3 presents the standard deviation of the individual forecasters’ one- and five-year ahead inflation expectations since 1999. Note that when the ECB started operating in 1999, there was greater disagreement about where inflation would be five years ahead than one year ahead. Over the past ten years, disagreement about inflation expectations one year ahead has moved about but without exhibiting any particular trend. By contrast, disagreement about five year-ahead expectations has trended down and is now considerably below that of one-year-ahead inflation. Relative to a decade ago, there is now very little disagreement about either the ECB’s inflation objective or about the determination of the Governing Council to succeed in keeping inflation close to its objective over time.
By presenting these two empirical illustrations, I want to support Chris’ emphasis on the need to refine the treatment of expectations in the models we use for understanding the macroeconomy and for formulating policy advice. I now wish to turn my attention to fleshing out some key implications of refining models of expectations formation.3 Many of these implications coincide with those in the paper but some differ somewhat, perhaps because I draw more on models of learning rather than rational inattention. I will discuss, in turn, implications about inflation dynamics, about monetary policy, and about central bank communication.
Regarding inflation dynamics, one implication stands out. Refining expectations formation by introducing learning behaviour introduces a rich layer of non-linear dynamics in otherwise linear economies. This induces time-variation on the formation of expectations and thereby in the structure of the economy, even when fundamental regime changes are absent. In turn, this complicates empirical modelling of fixed-coefficient linear models and the use of such models for forecasting. Indeed, this may explain the difficulties econometricians tend to face when trying to fit simplistic linear expectations models. A model may be otherwise well specified (except for the imposition of rational expectations), and the rational expectations assumption alone may be the source of the problem.
In large part, because of its effect on inflation dynamics, the refinement of expectations behaviour away from rational expectations also has first order effects on monetary policy. For a given monetary policy rule, learning behaviour in the formation of expectations imparts additional persistence to the inflation process relative to rational expectations, thereby diminishing policymakers’ ability to stabilise business cycle fluctuations in addition to maintaining price stability. In my view, this is why policy should focus primarily on price stability as a means of achieving, not only price stability, but also overall economic stability over time. This provides a rationale for the wisdom of stating central bank mandates as if they arise from lexicographic preferences, with price stability recognised as the primary policy objective and other objectives being pursued without prejudice to the primary objective of price stability. Another implication is that learning behaviour may generate endogenous inflation scares that can be particularly damaging to the economy in the absence of forceful policy response. This, in turn, provides an explanation as to why policymakers monitor inflation expectations so closely and place a premium on striving to maintain well-anchored inflation expectations at all times.
3 Here I draw on some joint work with John C Williams (see eg Orphanides and Williams (2004 and 2006)).
33
As already mentioned, acknowledgment of imperfections in expectations formation introduces a role for central bank communication that is absent in traditional rational expectations models. The precise implications are not as clear-cut as the implications for policy, however. To the extent that central bank communication can facilitate the formation of more accurate inflation expectations, it can prove valuable for improving overall policy outcomes. Under this light, clarity regarding the central bank’s price stability objective can be particularly helpful. Nevertheless, care is needed to respect the cognitive limits of economic agents. Thus, as Alan Blinder reported earlier today, “saying more is not always better for a central bank.”4 In this case, the quality of information may be a determining factor as to whether its communication is warranted. At the same time, the presentation of information may also matter, since easier to use information is likely to be more useful than information that is harder to digest.
To conclude, I reiterate that this is a rich paper with numerous exciting ideas. Not all of these ideas are completely fleshed out, but this would have been an impossible task in one paper. By walking us through some of the implications of moving from traditional application of rational expectations to newer refinements for modelling inflation expectations, this paper reminds both policy modellers and policymakers that our understanding of the determinants of inflation expectations is far from perfect. By showing us glimpses of the prospect of further progress in our understanding, it also wets our appetite for what comes next.
References
Blinder, A (2008) “Talking about monetary policy: the virtues (and vices?) of central bank communication”, presented at the Seventh BIS Annual Conference, 26-27 June, Lucerne, Switzerland.
Dale, S, A Orphanides and P Osterholm (2008) “Imperfect central bank communication: information versus distraction”, Central Bank of Cyprus, Working Paper 2008-1.
Evans, G and S Honkapohja (2005) “An interview with Thomas J Sargent”, Macroeconomic Dynamics, vol 9, issue 4, (September), pp 561–83.
Goodfriend, M (2003) “Inflation targeting in the United States?”, Carnegie Mellon University – David A Tepper School of Business, NBER Working Paper no W9981.
Kim, D and A Orphanides (2007) “The bond market premium: what is it and how can we measure it?”, BIS Quarterly Review (June), pp 28–40.
Orphanides, A and JC Williams (2004) "Imperfect knowledge, inflation expectations, and monetary policy", in: B Bernanke and M Woodford (eds), The Inflation Targeting Debate, Chicago: University of Chicago Press.
——— (2006) "Monetary policy with imperfect knowledge", Journal of the European Economic Association, vol 4, issue 2–3, pp 366–75.
Sims, C (2002) “The role of models and probabilities in the monetary policy process,” Brookings Papers on Economic Activity, vol 33, issue 2, pp 1–62.
——— (2008) “Inflation expectations, uncertainty, the Phillips Curve and monetary policy”, presented at the Boston Fed’s 53rd Conference, 9-11 June, Massachusetts, USA.
4 In recent work with Par Osterholm and Spencer Dale (Dale et al (2008)), we reach a similar conclusion:
providing more information is not always necessarily better.
34
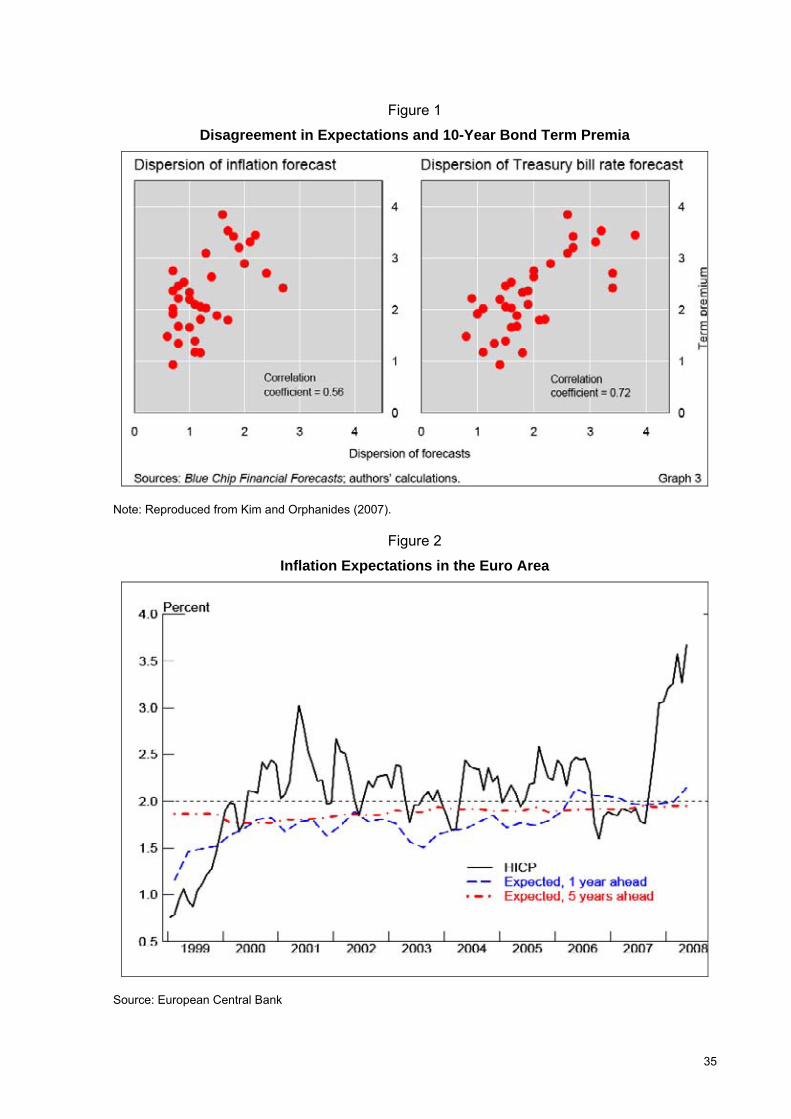
Figure 1
Disagreement in Expectations and 10-Year Bond Term Premia
Note: Reproduced from Kim and Orphanides (2007).
Figure 2
Inflation Expectations in the Euro Area
Source: European Central Bank
35
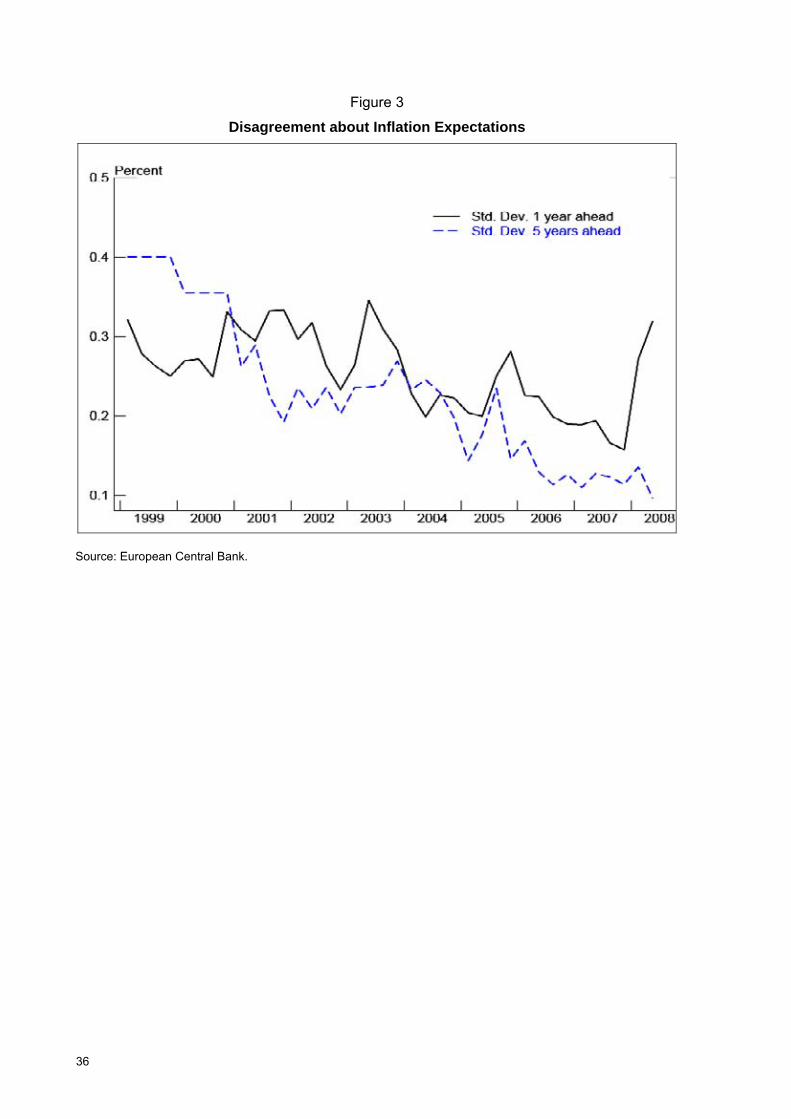
Figure 3
Disagreement about Inflation Expectations
Source: European Central Bank.
36
Remarks on: “Inflation expectations, uncertainty and monetary policy”
Lars E O Svensson1
As usual, Chris Sims (2008a) has given us an interesting and thoughtful paper. Since the title of this session is “Expectations formation: beyond rational expectations,” I will use most of the discussion to discuss some practical policy considerations about expectations formation beyond rational expectations that I have been confronted with at the Riksbank. I will make a couple of specific comments on Chris’s paper at the end of my discussion. I will first summarise the flexible inflation targeting that the Riksbank conducts and emphasise how expectations matter in monetary policy. Then I will give three examples of practical issues relating to expectations formation. The first is the Riksbank’s record so far of managing private-sector interest-rate expectations. The second is the consequence for the Riksbank’s repo-rate path of its recent downgrading of the CPIX core measure of inflation in favour of the CPI. The third is to what extent the recent increase in inflation expectations is a serious problem or not. Finally, I return to Chris’s paper and question his scepticism concerning the Phillips curve and his possible alternative to it.
Flexible inflation targeting2
As other inflation-targeting central banks, the Riksbank conducts so-called flexible inflation targeting.3 This means that the Riksbank conducts monetary policy so as to stabilise inflation around the inflation target, but it also attaches some weight to stabilising the real economy, more precisely its resource utilisation. Strict inflation targeting, corresponding to King’s 1997 “inflation nutter”, would mean that the Riksbank only aims at stabilising inflation around the inflation target without any concern for the stability of the real economy.4 Maximum stability of inflation around the inflation target would require very aggressive contractionary or expansionary policy depending on whether inflation seems to fall above or below the inflation target and would cause a lot of instability in the real economy. No inflation-targeting central bank that I know of, and certainly not the Riksbank, behaves in this way. Real-world inflation targeting is always flexible inflation targeting, not strict. The relative weight placed on the stability of the real economy may vary between different countries and central banks, but it is never zero.
1 Deputy Governor, Sveriges Riksbank. I am grateful for comments by Ylva Hedén, Mathias Trabandt, and
Anders Vredin and assistance from Gustav Karlsson and David Kjellberg. Any remaining errors are my own. The views, analysis, and conclusions in this paper are solely my responsibility and do not necessarily agree with those of other members of the Riksbank’s executive board or staff.
2 Svensson (2008) provides more discussion of the Riksbank’s flexible inflation targeting and the role of transparency in it.
3 The terms “strict” and “flexible” inflation targeting were to my knowledge first introduced in a paper of mine presented at a conference at the Bank of Portugal in 1996, later published as Svensson (1999).
4 The term “inflation nutter” for a central bank that is only concerned about stabilizing inflation was introduced in a paper by Mervyn King at a conference at Gerzensee, Switzerland, in 1995, later published as King (1997).
37
Because of the lags between monetary-policy actions and the effect on inflation and the real economy, effective flexible inflation targeting has to rely on forecasts of inflation and the real economy. Flexible inflation targeting can be described as “forecast targeting:” The central bank chooses an instrument-rate path so that the forecast of inflation and resource utilisation “looks good.” That the forecast “looks good” means that inflation is on target and resource utilisation normal or, when inflation and/or resource utilisation deviate from the target and/or normal, respectively, inflation goes to target and resource utilisation goes to normal at an appropriate pace.5 From a more technical perspective, that the forecast “looks good” means that it is optimal in the sense of minimising a standard intertemporal quadratic loss function.6
After each policy decision, the Riksbank publishes and motivates its interest-rate path and its forecast of inflation and the real economy, presented as mean forecasts with uncertainty intervals. Such publication is an example of the exceptionally high degree of transparency (in a historical perspective) that characterises inflation targeting.
This transparency serves several functions. It makes possible more effective external scrutiny and evaluation of monetary policy. This strengthens the Riksbank’s incentive to achieve its stated objectives and to provide good analysis and decisions.7 Transparency also ensures more effective democratic accountability and increases the legitimacy of the Riksbank (Blinder, Goodhart, Hildebrand, Wyplosz, and Lipton 2001). Finally, transparency allows for more effective implementation of monetary policy by allowing more effective “management of expectations”.
Expectations matter
It is now well understood that monetary policy in general and inflation targeting in particular is what is called “management of expectations” (Woodford 2004, 2005). Monetary policy affects inflation and the real economy mainly through its effects on private-sector expectations about future interest rates, inflation and the real economy. Expectations of future instrument rates (the expected instrument-rate path) matter and affect the yield curve and longer nominal interest rates. Expectations of future inflation affect actual inflation and longer real interest rates. Expectations of future developments of the real economy and longer real interest rates affect current decisions and plans for the real economy.
Given that expectations matter so much, what does theory say about expectations formation? Before the rational-expectations revolution, private-sector expectations were often assumed to be adaptive. For instance, expectations of future inflation would be a distributed lag of past inflation. The rational- expectations revolution brought rational expectations, that is, model-consistent expectations. Importantly, rational expectations do not imply that all agents must have the same expectations. Rational expectations are conditional on the information available, and if there is asymmetric information so that different agents have
5 The idea that inflation targeting implies that the inflation forecast can be seen as an intermediate target was
introduced in King (1994). The term “inflation-forecast targeting” was introduced in Svensson (1997), and the term “forecast targeting” in Svensson (2005). See Svensson and Woodford (2005) and especially Woodford (2007a, b) for more discussion and analysis of forecast targeting.
6 In a situation with forward-looking private-sector expectations, the minimization of the loss function should be under so-called commitment in a timeless perspective. This means that the central bank behaves with a certain consistency over time and does not try to manipulate private-sector expectations for short-run benefits. See Svensson and Woodford (2005) for details and Bergo (2007) for an example of a real-world application for Norges Bank.
7 In Faust and Svensson (2001), increased transparency induces the central bank to pursue a policy closer to the socially optimal one.
38
different information, their expectations need not be identical. Recently there has been a lot of work on expectations formation in situations of incomplete information and learning, where agents learn by Bayesian updating or recursive or constant-gain least squares, for instance. Chris Sims has introduced the concept of rational inattention, where information and expectations are constrained by costly information processing. Greg Mankiw and Riccardo Reis have examined the consequences of sticky information, situations where observation of the state of the economy is infrequent. Behavioural economics has contributed behavioural theories of expectations formation. There is a lot of ongoing theoretical work on expectations formation that should be very relevant for monetary policy.
Expectations formation in practice: Example 1 The Riksbank’s management of interest-rate expectations8
The Riksbank has, since February 2007, been one of the few central banks that publish an instrument-rate path. Publishing and motivating an instrument-rate path should be the most effective way of affecting the private-sector’s interest-rate expectations. What is then the Riksbank’s record in managing such expectations? How have market expectations of future interest rates been affected by the repo-rate paths the Riksbank has published (the repo rate is the Riksbank’s instrument rate). Figures 1-7 illustrate this by comparing the announced repo-rate path with the implied market forward interest rates at the end of the day before the announcement (“Before”) and at the end of the day of the announcement (“After”). The implied forward-rate curves have been adjusted by the Riksbank staff for possible risk premia, to be the staff’s best estimate of market expectations of future repo rates. Depending on the maturity, the forward-rate curve is derived from the rates for STINA (Tomorrow-Next Stibor interest-rate swaps) contracts, FRAs (Forward Rate Agreements), or interest-rate swaps.9
Figure 1 is from the first announcement of a repo-rate path, on February 15, 2007 (before my term as Deputy Governor which started on May 21, 2007). The black step-shaped solid curve shows the actual repo rate. The black dotted curve shows the announced repo rate. The yellow (gray for a black-and-white printer) solid curve shows the implied forward rates the day before the announcement, and the red (black for a black-and-white printer) solid curve shows the implied forward rates after the announcement. Comparing the yellow/gray and the black dotted curve, we see that the market expected a higher repo-rate path than the Riksbank announced. Comparing the yellow/gray and the red/black curve, we see that market expectations shifted down slightly, but not all the way to the announced repo-rate path. The market seemed not to believe that the Riksbank would actually follow its own path, and there were many comments expressing surprise and criticism of how low the path was.
There were policy announcements on March 30 and May 4, 2007, when the repo-rate was held unchanged. On these occasions no full Monetary Policy Report and no repo-rate path and no forecast of inflation and the real economy were published.10 Figure 2 is from the next
8 Svensson (2008) provides more discussion of the Riksbank’s record in managing interest-rate expectations. 9 Market expectations as revealed by the adjusted forward-rate curve should not be interpreted as homogenous
expectations but as an average of heterogeneous expectations. 10 The Riksbank held seven policy meetings during 2007. At three of these meetings (January, June, and
October) the Monetary Policy Report was published. At the intervening meetings before December 2007, no repo-rate path or forecast of inflation and the real economy were published. From December 2007 the Riksbank has published a repo-rate path and a forecast of inflation and the real economy at each policy meeting. From February 2008 there will be six policy meetings per year.
39
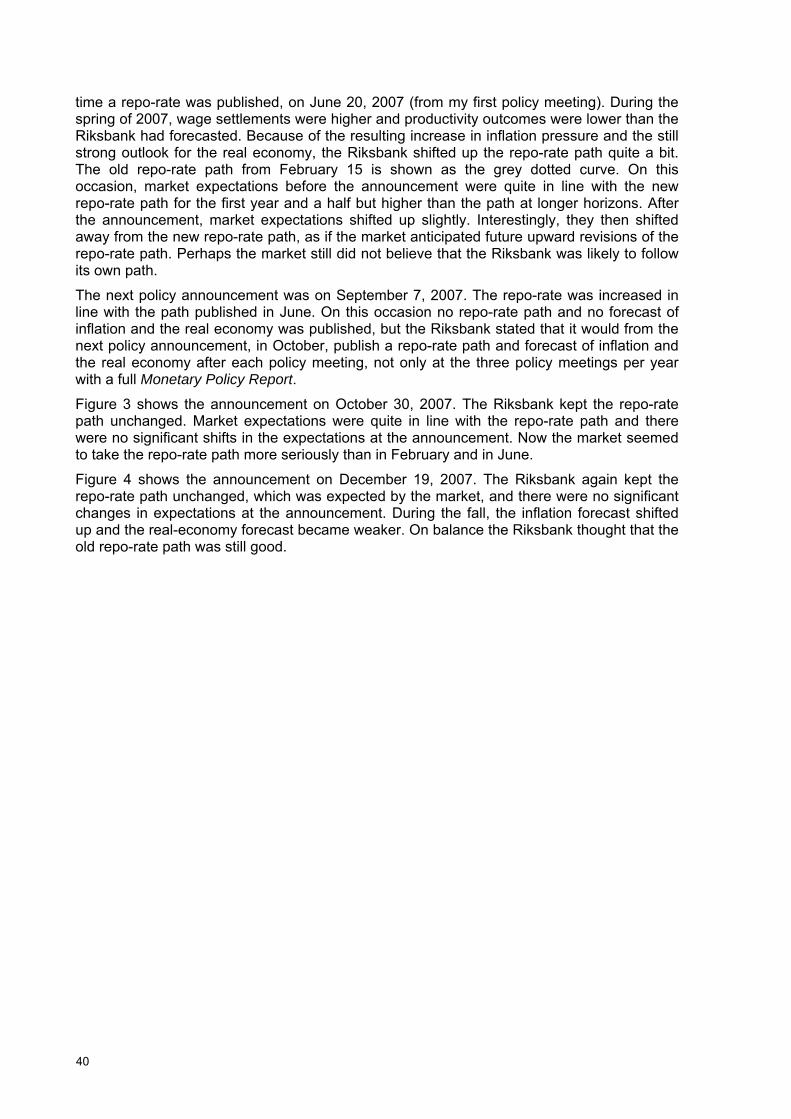
time a repo-rate was published, on June 20, 2007 (from my first policy meeting). During the spring of 2007, wage settlements were higher and productivity outcomes were lower than the Riksbank had forecasted. Because of the resulting increase in inflation pressure and the still strong outlook for the real economy, the Riksbank shifted up the repo-rate path quite a bit. The old repo-rate path from February 15 is shown as the grey dotted curve. On this occasion, market expectations before the announcement were quite in line with the new repo-rate path for the first year and a half but higher than the path at longer horizons. After the announcement, market expectations shifted up slightly. Interestingly, they then shifted away from the new repo-rate path, as if the market anticipated future upward revisions of the repo-rate path. Perhaps the market still did not believe that the Riksbank was likely to follow its own path.
The next policy announcement was on September 7, 2007. The repo-rate was increased in line with the path published in June. On this occasion no repo-rate path and no forecast of inflation and the real economy was published, but the Riksbank stated that it would from the next policy announcement, in October, publish a repo-rate path and forecast of inflation and the real economy after each policy meeting, not only at the three policy meetings per year with a full Monetary Policy Report.
Figure 3 shows the announcement on October 30, 2007. The Riksbank kept the repo-rate path unchanged. Market expectations were quite in line with the repo-rate path and there were no significant shifts in the expectations at the announcement. Now the market seemed to take the repo-rate path more seriously than in February and in June.
Figure 4 shows the announcement on December 19, 2007. The Riksbank again kept the repo-rate path unchanged, which was expected by the market, and there were no significant changes in expectations at the announcement. During the fall, the inflation forecast shifted up and the real-economy forecast became weaker. On balance the Riksbank thought that the old repo-rate path was still good.
40
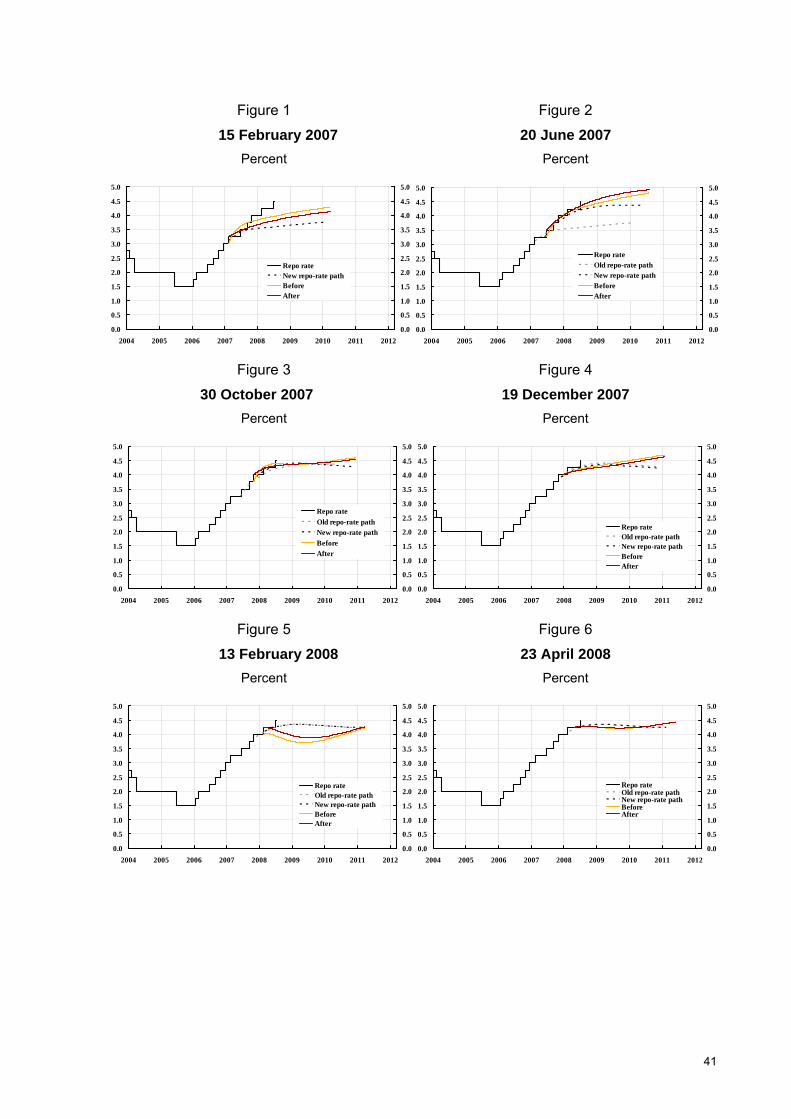
Figure 1 Figure 2
15 February 2007 20 June 2007 Percent Percent
0.0
0.5
1.0
1.5
2.0
2.5
3.0
3.5
4.0
4.5
5.0
2004 2005 2006 2007 2008 2009 2010 2011 20120.0
0.5
1.0
1.5
2.0
2.5
3.0
3.5
4.0
4.5
5.0
Repo rateNew repo-rate pathBeforeAfter
0.0
0.5
1.0
1.5
2.0
2.5
3.0
3.5
4.0
4.5
5.0
2004 2005 2006 2007 2008 2009 2010 2011 20120.0
0.5
1.0
1.5
2.0
2.5
3.0
3.5
4.0
4.5
5.0
Repo rateOld repo-rate pathNew repo-rate pathBeforeAfter
Figure 3 Figure 4
30 October 2007 19 December 2007 Percent Percent
0.0
0.5
1.0
1.5
2.0
2.5
3.0
3.5
4.0
4.5
5.0
2004 2005 2006 2007 2008 2009 2010 2011 20120.0
0.5
1.0
1.5
2.0
2.5
3.0
3.5
4.0
4.5
5.0
Repo rateOld repo-rate pathNew repo-rate pathBeforeAfter
0.0
0.5
1.0
1.5
2.0
2.5
3.0
3.5
4.0
4.5
5.0
2004 2005 2006 2007 2008 2009 2010 2011 20120.0
0.5
1.0
1.5
2.0
2.5
3.0
3.5
4.0
4.5
5.0
Repo rateOld repo-rate pathNew repo-rate pathBeforeAfter
Figure 5 Figure 6
13 February 2008 23 April 2008 Percent Percent
0.0
0.5
1.0
1.5
2.0
2.5
3.0
3.5
4.0
4.5
5.0
2004 2005 2006 2007 2008 2009 2010 2011 20120.0
0.5
1.0
1.5
2.0
2.5
3.0
3.5
4.0
4.5
5.0
Repo rateOld repo-rate pathNew repo-rate pathBeforeAfter
0.0
0.5
1.0
1.5
2.0
2.5
3.0
3.5
4.0
4.5
5.0
2004 2005 2006 2007 2008 2009 2010 2011 20120.0
0.5
1.0
1.5
2.0
2.5
3.0
3.5
4.0
4.5
5.0
Repo rateOld repo-rate pathNew repo-rate pathBeforeAfter
41
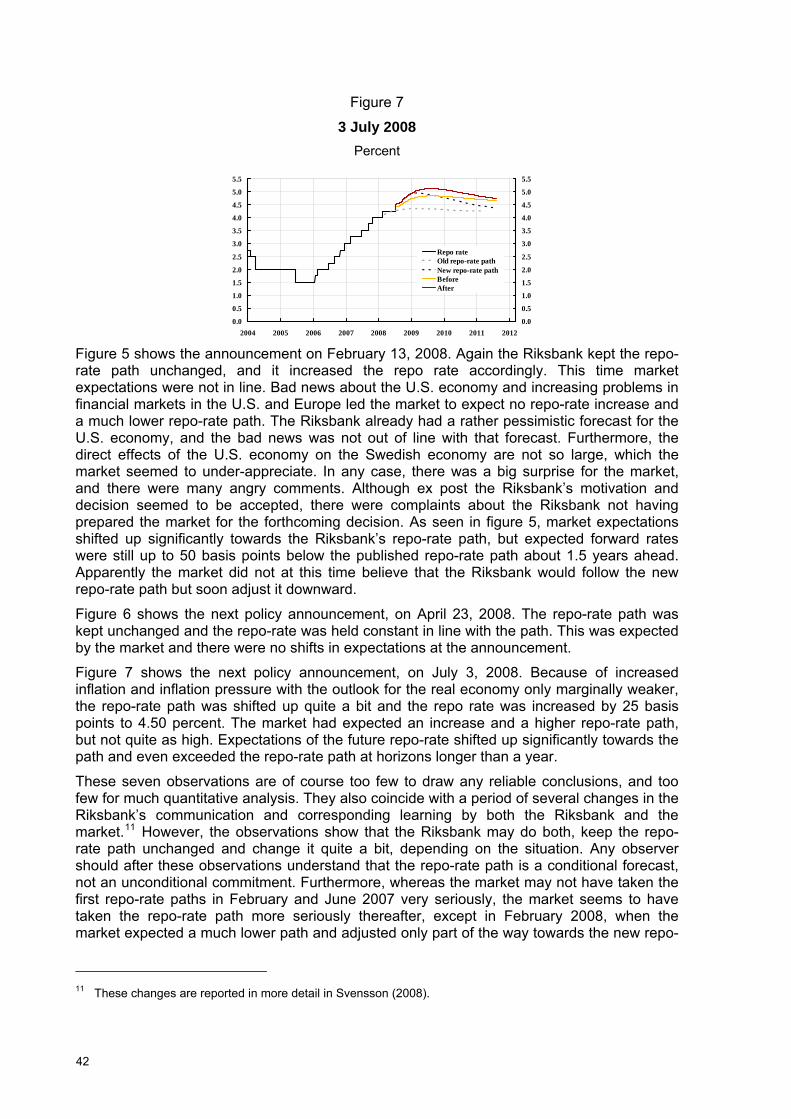
Figure 7
3 July 2008 Percent
0.0
0.5
1.0
1.5
2.0
2.5
3.0
3.5
4.0
4.5
5.0
5.5
2004 2005 2006 2007 2008 2009 2010 2011 20120.0
0.5
1.0
1.5
2.0
2.5
3.0
3.5
4.0
4.5
5.0
5.5
Repo rateOld repo-rate pathNew repo-rate pathBeforeAfter
Figure 5 shows the announcement on February 13, 2008. Again the Riksbank kept the repo-rate path unchanged, and it increased the repo rate accordingly. This time market expectations were not in line. Bad news about the U.S. economy and increasing problems in financial markets in the U.S. and Europe led the market to expect no repo-rate increase and a much lower repo-rate path. The Riksbank already had a rather pessimistic forecast for the U.S. economy, and the bad news was not out of line with that forecast. Furthermore, the direct effects of the U.S. economy on the Swedish economy are not so large, which the market seemed to under-appreciate. In any case, there was a big surprise for the market, and there were many angry comments. Although ex post the Riksbank’s motivation and decision seemed to be accepted, there were complaints about the Riksbank not having prepared the market for the forthcoming decision. As seen in figure 5, market expectations shifted up significantly towards the Riksbank’s repo-rate path, but expected forward rates were still up to 50 basis points below the published repo-rate path about 1.5 years ahead. Apparently the market did not at this time believe that the Riksbank would follow the new repo-rate path but soon adjust it downward.
Figure 6 shows the next policy announcement, on April 23, 2008. The repo-rate path was kept unchanged and the repo-rate was held constant in line with the path. This was expected by the market and there were no shifts in expectations at the announcement.
Figure 7 shows the next policy announcement, on July 3, 2008. Because of increased inflation and inflation pressure with the outlook for the real economy only marginally weaker, the repo-rate path was shifted up quite a bit and the repo rate was increased by 25 basis points to 4.50 percent. The market had expected an increase and a higher repo-rate path, but not quite as high. Expectations of the future repo-rate shifted up significantly towards the path and even exceeded the repo-rate path at horizons longer than a year.
These seven observations are of course too few to draw any reliable conclusions, and too few for much quantitative analysis. They also coincide with a period of several changes in the Riksbank’s communication and corresponding learning by both the Riksbank and the market.11 However, the observations show that the Riksbank may do both, keep the repo-rate path unchanged and change it quite a bit, depending on the situation. Any observer should after these observations understand that the repo-rate path is a conditional forecast, not an unconditional commitment. Furthermore, whereas the market may not have taken the first repo-rate paths in February and June 2007 very seriously, the market seems to have taken the repo-rate path more seriously thereafter, except in February 2008, when the market expected a much lower path and adjusted only part of the way towards the new repo-
11 These changes are reported in more detail in Svensson (2008).
42
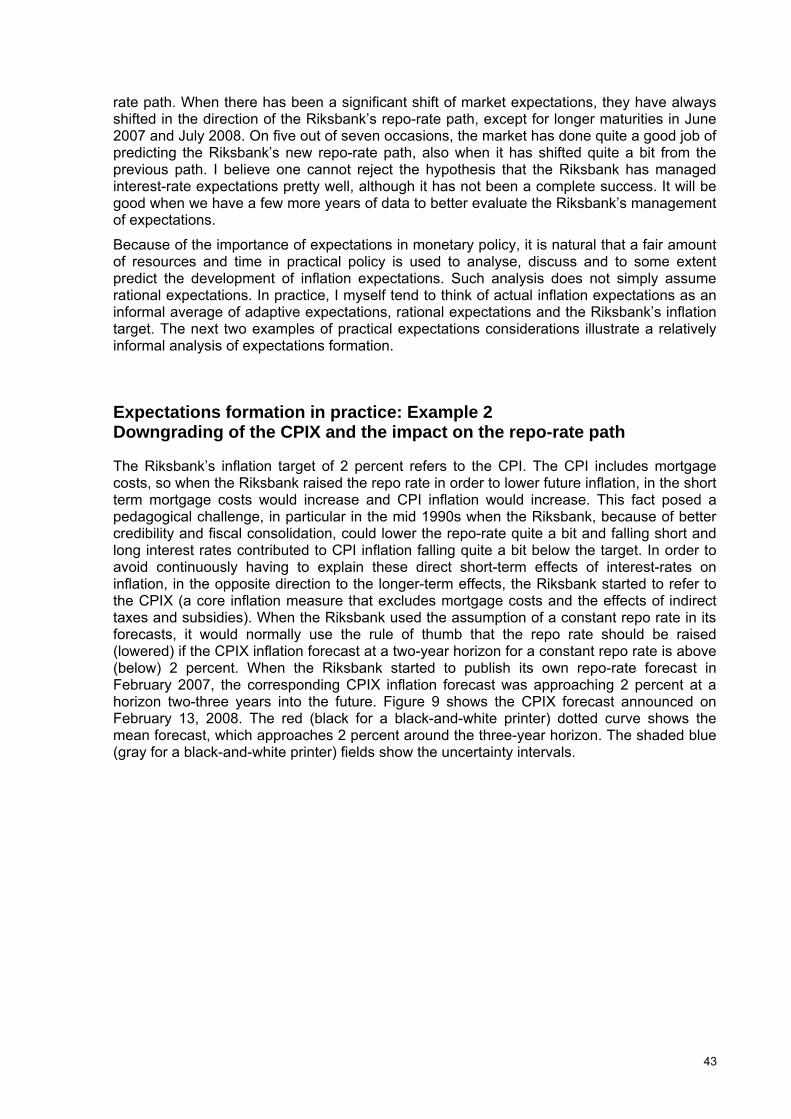
rate path. When there has been a significant shift of market expectations, they have always shifted in the direction of the Riksbank’s repo-rate path, except for longer maturities in June 2007 and July 2008. On five out of seven occasions, the market has done quite a good job of predicting the Riksbank’s new repo-rate path, also when it has shifted quite a bit from the previous path. I believe one cannot reject the hypothesis that the Riksbank has managed interest-rate expectations pretty well, although it has not been a complete success. It will be good when we have a few more years of data to better evaluate the Riksbank’s management of expectations.
Because of the importance of expectations in monetary policy, it is natural that a fair amount of resources and time in practical policy is used to analyse, discuss and to some extent predict the development of inflation expectations. Such analysis does not simply assume rational expectations. In practice, I myself tend to think of actual inflation expectations as an informal average of adaptive expectations, rational expectations and the Riksbank’s inflation target. The next two examples of practical expectations considerations illustrate a relatively informal analysis of expectations formation.
Expectations formation in practice: Example 2 Downgrading of the CPIX and the impact on the repo-rate path
The Riksbank’s inflation target of 2 percent refers to the CPI. The CPI includes mortgage costs, so when the Riksbank raised the repo rate in order to lower future inflation, in the short term mortgage costs would increase and CPI inflation would increase. This fact posed a pedagogical challenge, in particular in the mid 1990s when the Riksbank, because of better credibility and fiscal consolidation, could lower the repo-rate quite a bit and falling short and long interest rates contributed to CPI inflation falling quite a bit below the target. In order to avoid continuously having to explain these direct short-term effects of interest-rates on inflation, in the opposite direction to the longer-term effects, the Riksbank started to refer to the CPIX (a core inflation measure that excludes mortgage costs and the effects of indirect taxes and subsidies). When the Riksbank used the assumption of a constant repo rate in its forecasts, it would normally use the rule of thumb that the repo rate should be raised (lowered) if the CPIX inflation forecast at a two-year horizon for a constant repo rate is above (below) 2 percent. When the Riksbank started to publish its own repo-rate forecast in February 2007, the corresponding CPIX inflation forecast was approaching 2 percent at a horizon two-three years into the future. Figure 9 shows the CPIX forecast announced on February 13, 2008. The red (black for a black-and-white printer) dotted curve shows the mean forecast, which approaches 2 percent around the three-year horizon. The shaded blue (gray for a black-and-white printer) fields show the uncertainty intervals.
43
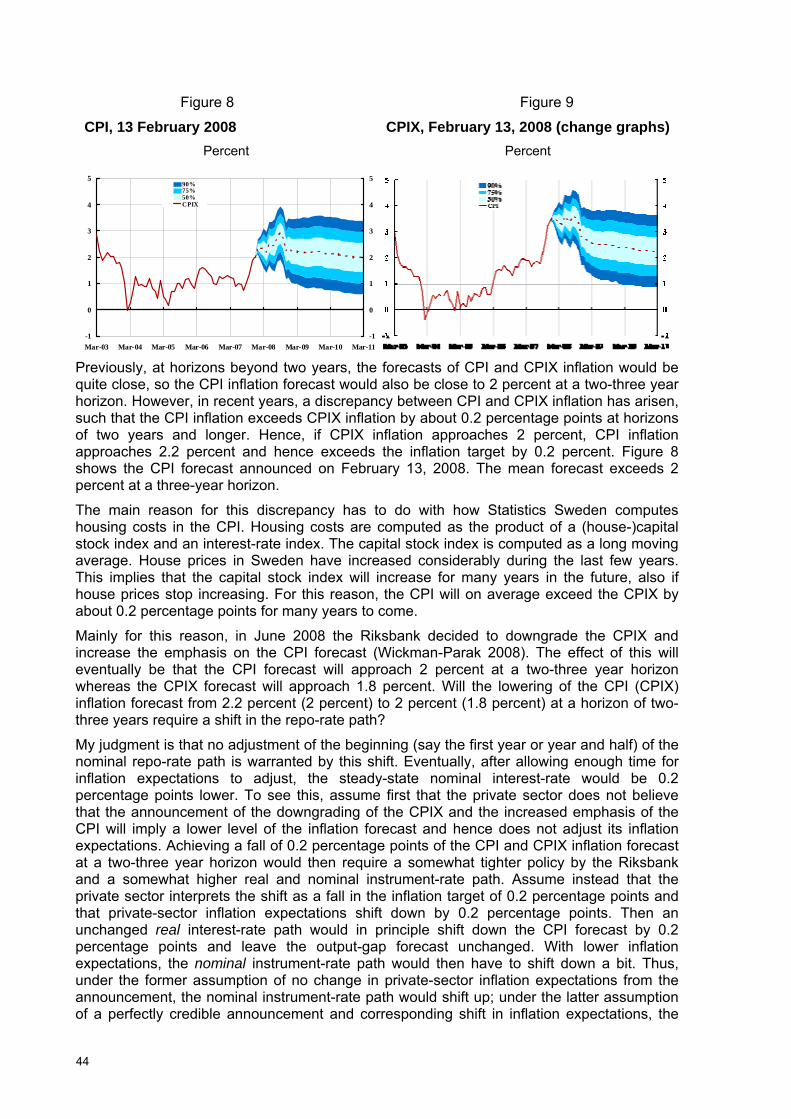
Figure 8 Figure 9
CPI, 13 February 2008 CPIX, February 13, 2008 (change graphs) Percent Percent
-1
0
1
2
3
4
5
Mar-03 Mar-04 Mar-05 Mar-06 Mar-07 Mar-08 Mar-09 Mar-10 Mar-11-1
0
1
2
3
4
590%75%50%CPIX
Previously, at horizons beyond two years, the forecasts of CPI and CPIX inflation would be quite close, so the CPI inflation forecast would also be close to 2 percent at a two-three year horizon. However, in recent years, a discrepancy between CPI and CPIX inflation has arisen, such that the CPI inflation exceeds CPIX inflation by about 0.2 percentage points at horizons of two years and longer. Hence, if CPIX inflation approaches 2 percent, CPI inflation approaches 2.2 percent and hence exceeds the inflation target by 0.2 percent. Figure 8 shows the CPI forecast announced on February 13, 2008. The mean forecast exceeds 2 percent at a three-year horizon.
The main reason for this discrepancy has to do with how Statistics Sweden computes housing costs in the CPI. Housing costs are computed as the product of a (house-)capital stock index and an interest-rate index. The capital stock index is computed as a long moving average. House prices in Sweden have increased considerably during the last few years. This implies that the capital stock index will increase for many years in the future, also if house prices stop increasing. For this reason, the CPI will on average exceed the CPIX by about 0.2 percentage points for many years to come.
Mainly for this reason, in June 2008 the Riksbank decided to downgrade the CPIX and increase the emphasis on the CPI forecast (Wickman-Parak 2008). The effect of this will eventually be that the CPI forecast will approach 2 percent at a two-three year horizon whereas the CPIX forecast will approach 1.8 percent. Will the lowering of the CPI (CPIX) inflation forecast from 2.2 percent (2 percent) to 2 percent (1.8 percent) at a horizon of two-three years require a shift in the repo-rate path?
My judgment is that no adjustment of the beginning (say the first year or year and half) of the nominal repo-rate path is warranted by this shift. Eventually, after allowing enough time for inflation expectations to adjust, the steady-state nominal interest-rate would be 0.2 percentage points lower. To see this, assume first that the private sector does not believe that the announcement of the downgrading of the CPIX and the increased emphasis of the CPI will imply a lower level of the inflation forecast and hence does not adjust its inflation expectations. Achieving a fall of 0.2 percentage points of the CPI and CPIX inflation forecast at a two-three year horizon would then require a somewhat tighter policy by the Riksbank and a somewhat higher real and nominal instrument-rate path. Assume instead that the private sector interprets the shift as a fall in the inflation target of 0.2 percentage points and that private-sector inflation expectations shift down by 0.2 percentage points. Then an unchanged real interest-rate path would in principle shift down the CPI forecast by 0.2 percentage points and leave the output-gap forecast unchanged. With lower inflation expectations, the nominal instrument-rate path would then have to shift down a bit. Thus, under the former assumption of no change in private-sector inflation expectations from the announcement, the nominal instrument-rate path would shift up; under the latter assumption of a perfectly credible announcement and corresponding shift in inflation expectations, the
44
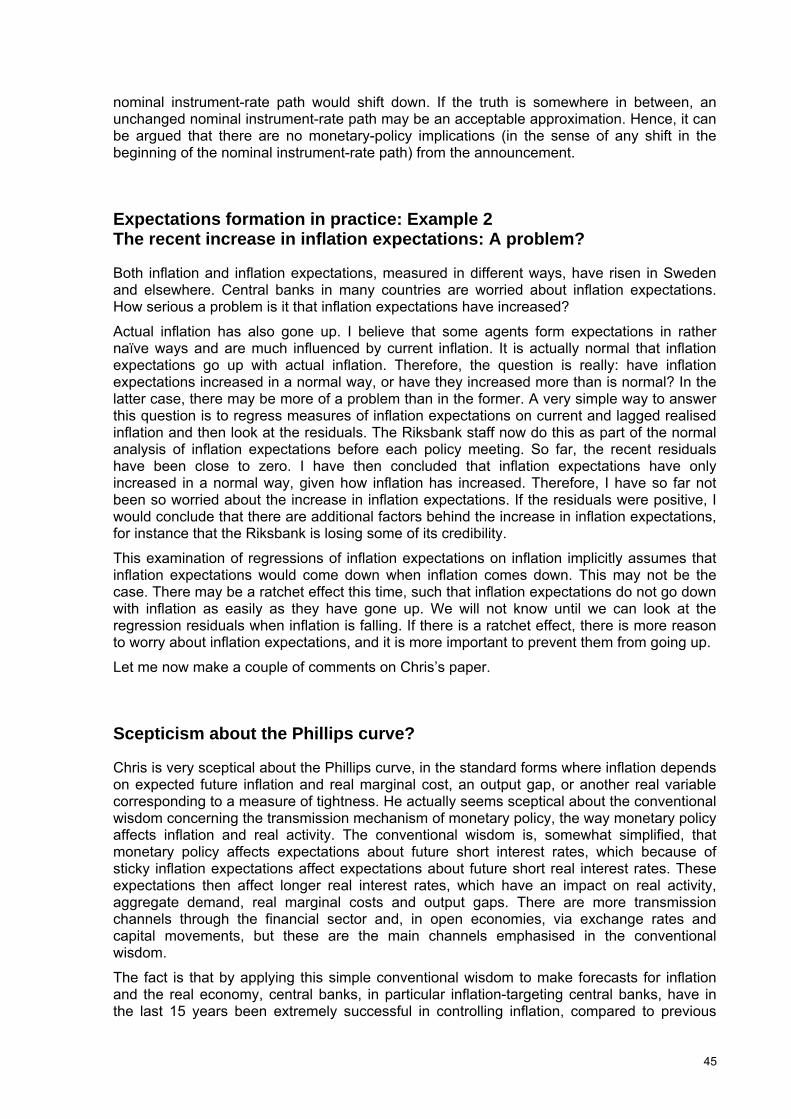
nominal instrument-rate path would shift down. If the truth is somewhere in between, an unchanged nominal instrument-rate path may be an acceptable approximation. Hence, it can be argued that there are no monetary-policy implications (in the sense of any shift in the beginning of the nominal instrument-rate path) from the announcement.
Expectations formation in practice: Example 2 The recent increase in inflation expectations: A problem?
Both inflation and inflation expectations, measured in different ways, have risen in Sweden and elsewhere. Central banks in many countries are worried about inflation expectations. How serious a problem is it that inflation expectations have increased?
Actual inflation has also gone up. I believe that some agents form expectations in rather naïve ways and are much influenced by current inflation. It is actually normal that inflation expectations go up with actual inflation. Therefore, the question is really: have inflation expectations increased in a normal way, or have they increased more than is normal? In the latter case, there may be more of a problem than in the former. A very simple way to answer this question is to regress measures of inflation expectations on current and lagged realised inflation and then look at the residuals. The Riksbank staff now do this as part of the normal analysis of inflation expectations before each policy meeting. So far, the recent residuals have been close to zero. I have then concluded that inflation expectations have only increased in a normal way, given how inflation has increased. Therefore, I have so far not been so worried about the increase in inflation expectations. If the residuals were positive, I would conclude that there are additional factors behind the increase in inflation expectations, for instance that the Riksbank is losing some of its credibility.
This examination of regressions of inflation expectations on inflation implicitly assumes that inflation expectations would come down when inflation comes down. This may not be the case. There may be a ratchet effect this time, such that inflation expectations do not go down with inflation as easily as they have gone up. We will not know until we can look at the regression residuals when inflation is falling. If there is a ratchet effect, there is more reason to worry about inflation expectations, and it is more important to prevent them from going up.
Let me now make a couple of comments on Chris’s paper.
Scepticism about the Phillips curve?
Chris is very sceptical about the Phillips curve, in the standard forms where inflation depends on expected future inflation and real marginal cost, an output gap, or another real variable corresponding to a measure of tightness. He actually seems sceptical about the conventional wisdom concerning the transmission mechanism of monetary policy, the way monetary policy affects inflation and real activity. The conventional wisdom is, somewhat simplified, that monetary policy affects expectations about future short interest rates, which because of sticky inflation expectations affect expectations about future short real interest rates. These expectations then affect longer real interest rates, which have an impact on real activity, aggregate demand, real marginal costs and output gaps. There are more transmission channels through the financial sector and, in open economies, via exchange rates and capital movements, but these are the main channels emphasised in the conventional wisdom.
The fact is that by applying this simple conventional wisdom to make forecasts for inflation and the real economy, central banks, in particular inflation-targeting central banks, have in the last 15 years been extremely successful in controlling inflation, compared to previous
45
periods. Actually, by applying flexible inflation targeting, these central banks have succeeded in stabilising both inflation and the real economy to an unprecedented extent. The best proof of the pudding is in the eating, I believe. I find it very difficult to believe that these central banks would have been so successful if there was a major flaw in their view of inflation determination. Therefore, unless there is more substantial evidence of conventional Phillips curves (including the more sophisticated Phillips curves used in central-bank DSGE models) not working, I continue to believe that there is something right in them. This does not mean that I think it is wrong to continue to look for such evidence.
Alternatives to the Phillips curve?
Chris is not very explicit in his paper about what alternative to the Phillips curve and the conventional wisdom he proposes. In a previous paper with criticism of the Phillips curve (Sims 2008b), he presents a variant of the Fiscal Theory of the Price Level (FTPL) where the present real value of future debt repayment is more or less exogenous and the price level adjusts so as to satisfy the public-sector budget constraint and makes the real value of nominal public debt equal to the present real value of future debt repayments.
I am not at all convinced by this example. I am sceptical about the applicability of the FTPL to advanced countries with fiscal policy under control and independent central banks with a price-stability mandate. Certainly I am sceptical about the applicability of the FTPL to Sweden. I am convinced that the Swedish Government will adjust its expenditures and revenues so as to always repay the national debt in full in kronor. Generally, Swedish fiscal policy is a model for the rest of the world, with a sustainable surplus and excellent control over expenditure and taxes. Furthermore, I am convinced that the real value of these kronor repayments will be determined by the Riksbank through its price-stability mandate. I will certainly do my best to resist any (very unlikely) pressure on the Riksbank to contribute to financing any fiscal deficit. Certainly the law is on the Riksbank’s side. The Swedish Constitution and the Riksbank Act are consistent with the Maastricht Treaty. The Constitution states that “[n]o public authority may determine how the Riksbank shall decide in matters of monetary policy” (The Instrument of Government, chapter 9). The Riksbank Act states that “[m]embers of the Executive Board may neither seek nor take instructions when fulfilling their monetary policy duties” (chapter 3) and “[t]he Riksbank shall not extend credit to or purchase debt instruments directly from the state, another public body or an institution of the European Union” (chapter 8).
References
Bergo, Jarle (2007), “Interest Rate Projections in Theory and Practice,” speech on January 26, 2007, (www.norges-bank.no).
Blinder, Alan S, Charles Goodhart, Philipp Hildebrand, Charles Wyplosz, and David Lipton (2001), How do central banks talk? Geneva Report on the World Economy 3, CEPR.
Faust, Jon, and Lars EO Svensson (2001), “Transparency and Credibility: Monetary Policy with Unobservable Goals,” International Economic Review 42, 369-397. King, Mervyn (1994), “Monetary Policy in the UK,” Fiscal Studies 15(3), 109-128.
King, Mervyn (1997), “Changes in UK monetary policy: Rules and discretion in practice,” Journal of Monetary Economics 39, 81-97.
46
Sims, Chris A (2008a), “Inflation Expectations, Uncertainty, and Monetary Policy,” presented at the 7th BIS Annual Conference, “Whither monetary policy? Monetary policy challenges in the decade ahead,” Lucerne, Switzerland, June 26-27.
Sims, Chris A (2008b), “Inflation Expectations, Uncertainty, the Phillips Curve, and Monetary Policy,” presented at the conference Understanding Inflation and the Implications for Monetary Policy: A Phillips Curve Retrospective , Federal Reserve Bank of Boston, June 9-11, 2008.
Svensson, Lars EO (1997), “Inflation Forecast Targeting: Implementing and Monitoring Inflation Targets," European Economic Review 41, 1111-1146.
Svensson, Lars EO (1999), “Inflation Targeting: Some Extensions.” Scandinavian Journal of Economics 101, 337-361.
Svensson, Lars EO (2005), “Monetary Policy with Judgment: Forecast Targeting,” International Journal of Central Banking 1(1), 1-54.
Svensson, Lars EO (2008), “Transparency under Flexible Inflation Targeting: Experiences and Challenges,” Prepared for the Riksbank’s conference Refining Monetary Policy: Transparency and Real Stability, Stockholm, September 5-6, 2008.
Svensson, Lars EO, and Michael Woodford (2005), “Implementing Optimal Policy through Inflation-Forecast Targeting,” in Bernanke, Ben S and Woodford, Michael, eds., The Inflation-Targeting Debate, University of Chicago Press, 19-83.
Wickman-Parak, Barbro (2008), “The Riksbank's Inflation Target,” speech on June 9, 2008, (www.riksbank.se).
Woodford, Michael (2004), “Inflation Targeting and Optimal Monetary Policy,” Federal Reserve Bank of St. Louis Economic Review 86(4), 15-41.
Woodford, Michael (2005), “Central-Bank Communication and Policy Effectiveness,” in The Greenspan Era: Lessons for the Future: A Symposium Sponsored by the Federal Reserve Bank of Kansas City, Federal Reserve Bank of Kansas City, 399-474.
Woodford, Michael (2007a), “The Case for Forecast Targeting as a Monetary Policy Strategy,” Journal of Economic Perspectives, Fall 2007.
Woodford, Michael (2007b), “Forecast Targeting as a Monetary Policy Strategy: Policy Rules in Practice,” paper presented at the conference John Taylor’s Contributions to Monetary Theory and Policy, Federal Reserve Bank of Dallas.
47