Embed Size (px)
Citation preview
ResearchCMAJ
CMAJ • FEBRUARY 23, 2010 • 182(3)© 2010 Canadian Medical Association or its licensors
235
Birth outcomes are worse in Aboriginal than in non-Aboriginal populations in many developed countries,including the United States, Australia and Canada.1−18
Inuit are the smallest Aboriginal group in Canada, with apopulation of about 45 000.19 Some regional and community
studies have shown that Inuit experience the highest rates ofinfant mortality in Canada.16−18 However, data are lacking atthe national level on birth outcomes among Inuit owing tothe absence of Aboriginal identifiers on birth registrationforms in most provinces.
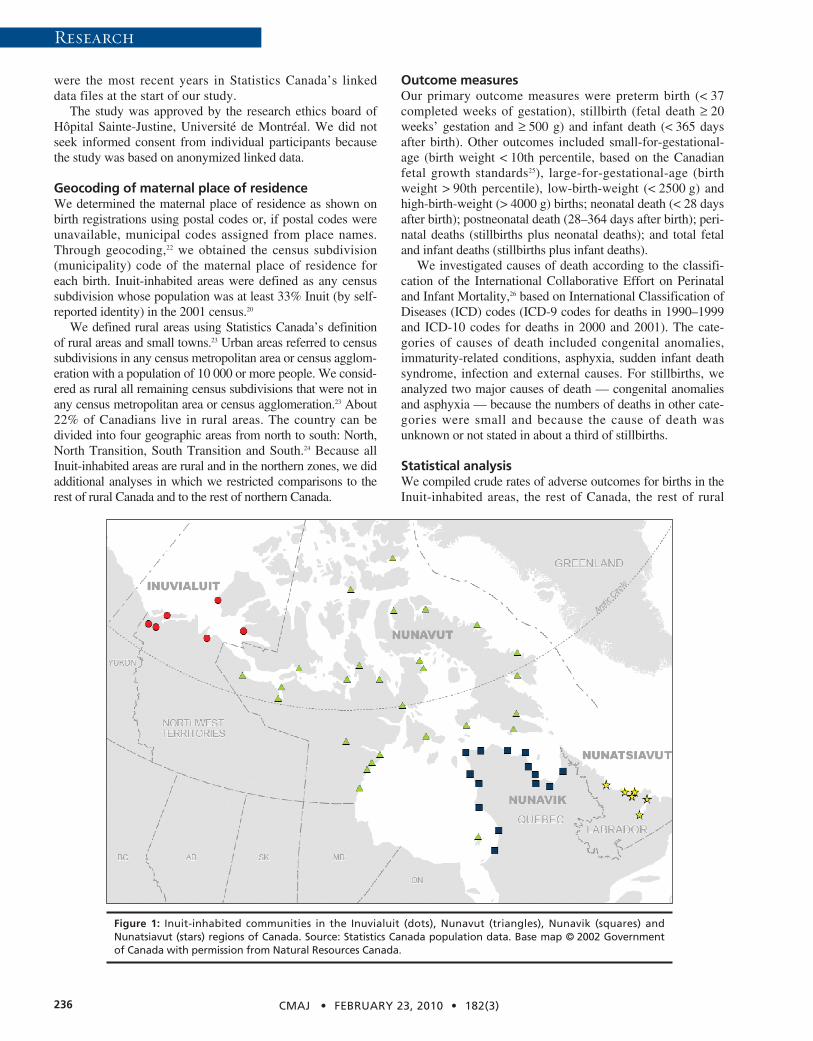
In Canada, over 80% of all Inuit reside in one of four vast,sparsely populated regions: the Inuvialuit region of the North-west Territories, Nunavut, Nunavik (northern Quebec) andNunatsiavut (northern coast of Labrador) (Figure 1). Takentogether, 80% of the population in those four regions isInuit,20 and 90% of the births are to Inuit women according to2006 census data. This creates an opportunity to examinebirth outcomes according to maternal place of residence inany of the four Inuit-inhabited areas of Canada. We con-ducted this study to describe birth outcomes in those areascompared with outcomes in the rest of country and in otherrural and northern areas of Canada.
Methods
Study populationWe conducted a retrospective cohort study using linkeddata on live births, infant deaths and stillbirths provided byStatistics Canada for all births in Canada from 1990 to2000 (n = 4 107 131). We excluded 39 000 births (0.9%)with missing data on birth weight or gestational age, orwith extremely low reported birth weight (< 500 g) or ges-tational age (< 20 weeks) because of their borderline via-bility. Of these excluded births, 281 (2.0%) were in theInuit-inhabited areas and 38 719 (0.9%) were in otherareas (p < 0.001). Not unexpectedly, infant mortality washigh (138 per 1000) among those excluded births. Thevalidity of the linked vital data has been well docu-mented.21 We chose the period 1990–2000 because those
DO
I:10
.150
3/cm
aj.0
8204
2
Birth outcomes in the Inuit-inhabited areas of Canada
Zhong-Cheng Luo MD PhD, Sacha Senécal PhD, Fabienne Simonet MS, Éric Guimond PhD,Christopher Penney MA, Russell Wilkins MUrb
@@ See related research article by Egeland and colleagues, page 243, and related commentary by Cunningham, page 228
From the Department of Obstetrics and Gynecology (Luo, Simonet), Hôpi-tal Sainte-Justine and Université de Montréal, Montréal, Que.; StrategicResearch and Analysis, Indian and Northern Affairs Canada (Senécal, Gui-mond, Penney), Gatineau, Que.; the Department of Sociology (Senécal,Guimond), University of Western Ontario, London, Ont.; the Health Analy-sis Division, Statistics Canada (Wilkins), Ottawa, Ont.; and the Departmentof Epidemiology and Community Medicine (Wilkins), University of Ottawa,Ottawa, Ont.
CMAJ 2010. DOI:10.1503/cmaj.082042
Background: Information on health disparities betweenAboriginal and non-Aboriginal populations is essential fordeveloping public health programs aimed at reducing suchdisparities. The lack of data on disparities in birth out-comes between Inuit and non-Inuit populations in Canadaprompted us to compare birth outcomes in Inuit-inhabitedareas with those in the rest of the country and in otherrural and northern areas of Canada.
Methods: We conducted a cohort study of all births inCanada during 1990–2000 using linked vital data. We iden-tified 13 642 births to residents of Inuit-inhabited areasand 4 054 489 births to residents of all other areas. Theprimary outcome measures were preterm birth, stillbirthand infant death.
Results: Compared with the rest of Canada, Inuit- inhabitedareas had substantially higher rates of preterm birth (riskratio [RR] 1.45, 95% confidence interval [CI] 1.38–1.52), still-birth (RR 1.68, 95% CI 1.38–2.04) and infant death (RR 3.61,95% CI 3.17–4.12). The risk ratios and absolute differencesin risk for these outcomes changed little over time. Excessmortality was observed for all major causes of infant death,including congenital anomalies (RR 1.64), immaturity-related conditions (RR 2.96), asphyxia (RR 2.43), suddeninfant death syndrome (RR 7.15), infection (RR 8.32) andexternal causes (RR 7.30). Maternal characteristics accountedfor only a small part of the risk disparities. Substantial riskratios for preterm birth, stillbirth and infant death re mainedwhen the comparisons were restricted to other rural ornorthern areas of Canada.
Interpretation: The Inuit-inhabited areas had much higherrates of preterm birth, stillbirth and infant death com-pared with the rest of Canada and with other rural andnorthern areas. There is an urgent need for more effectiveinterventions to improve maternal and infant health inInuit-inhabited areas.
Abstract
Previously published at www.cmaj.ca
Research
were the most recent years in Statistics Canada’s linkeddata files at the start of our study.
The study was approved by the research ethics board ofHôpital Sainte-Justine, Université de Montréal. We did notseek informed consent from individual participants becausethe study was based on anonymized linked data.
Geocoding of maternal place of residenceWe determined the maternal place of residence as shown onbirth registrations using postal codes or, if postal codes wereunavailable, municipal codes assigned from place names.Through geocoding,22 we obtained the census subdivision(municipality) code of the maternal place of residence foreach birth. Inuit-inhabited areas were defined as any censussubdivision whose population was at least 33% Inuit (by self-reported identity) in the 2001 census.20
We defined rural areas using Statistics Canada’s definitionof rural areas and small towns.23 Urban areas referred to censussubdivisions in any census metropolitan area or census agglom-eration with a population of 10 000 or more people. We consid-ered as rural all remaining census subdivisions that were not inany census metropolitan area or census agglomeration.23 About22% of Canadians live in rural areas. The country can bedivided into four geographic areas from north to south: North,North Transition, South Transition and South.24 Because allInuit-inhabited areas are rural and in the northern zones, we didadditional analyses in which we restricted comparisons to therest of rural Canada and to the rest of northern Canada.
Outcome measuresOur primary outcome measures were preterm birth (< 37completed weeks of gestation), stillbirth (fetal death ≥ 20weeks’ gestation and ≥ 500 g) and infant death (< 365 daysafter birth). Other outcomes included small-for-gestational-age (birth weight < 10th percentile, based on the Can adianfetal growth standards25), large-for-gestational-age (birthweight > 90th percentile), low-birth-weight (< 2500 g) andhigh-birth-weight (> 4000 g) births; neonatal death (< 28 daysafter birth); postneonatal death (28–364 days after birth); peri-natal deaths (stillbirths plus neonatal deaths); and total fetaland infant deaths (stillbirths plus infant deaths).
We investigated causes of death according to the classifi-cation of the International Collaborative Effort on Perinataland Infant Mortality,26 based on International Classification ofDiseases (ICD) codes (ICD-9 codes for deaths in 1990–1999and ICD-10 codes for deaths in 2000 and 2001). The cate-gories of causes of death included congenital anomalies,immaturity-related conditions, asphyxia, sudden infant deathsyndrome, infection and external causes. For stillbirths, weanalyzed two major causes of death — congenital anomaliesand asphyxia — because the numbers of deaths in other cate-gories were small and because the cause of death wasunknown or not stated in about a third of stillbirths.
Statistical analysisWe compiled crude rates of adverse outcomes for births in theInuit-inhabited areas, the rest of Canada, the rest of rural
CMAJ • FEBRUARY 23, 2010 • 182(3)236
Figure 1: Inuit-inhabited communities in the Inuvialuit (dots), Nunavut (triangles), Nunavik (squares) andNunatsia vut (stars) regions of Canada. Source: Statistics Canada population data. Base map © 2002 Governmentof Canada with permission from Natural Resources Canada.
Research
Canada and the rest of northern Canada. For preterm, small-for-gestational-age, large-for-gestational-age, low-birth-weightand high-birth-weight births, we calculated rates per 100 totalbirths (live births plus stillbirths). For fetal and infant deathscombined, perinatal deaths and stillbirths, we calculated ratesper 1000 total births. For infant deaths and neonatal deaths,rates were per 1000 live births. We calculated the rate of post-neonatal deaths per 1000 neonatal survivors.
We determined absolute risk differences and risk ratioswith 95% confidence intervals to illustrate the magnitude ofthe disparities. We used the χ2 test to examine the statisticalsignificance of differences across the four Inuit-inhabitedareas, and the Cochran-Armitage test to examine the statisti-cal significance of trends over time. We used logistic regres-sion analysis to obtain adjusted odds ratios for assessingwhether the elevated risks could be explained by differencesin maternal age (< 20, 20–29, 30–34, ≥ 35 years), parity(primiparous or not), marital status (legally married or not),infant sex and plurality (singleton or multiple birth).
Results
Of the 4 068 131 births included in our study, 13 642 were toresidents of the Inuit-inhabited areas and 4 054 489 were toresidents of all other areas.
Maternal characteristics differed substantially betweenInuit-inhabited areas and the rest of Canada. Inuit-inhabitedareas had a higher proportion of mothers who were less than20 years of age (22% v. 6%, p < 0.001), who were not legallymarried (71% v. 29%, p < 0.001) and who were multiparous(70% v. 57%, p < 0.001). The proportion of male infants wassimilar (about 51% in each area, p = 0.47).
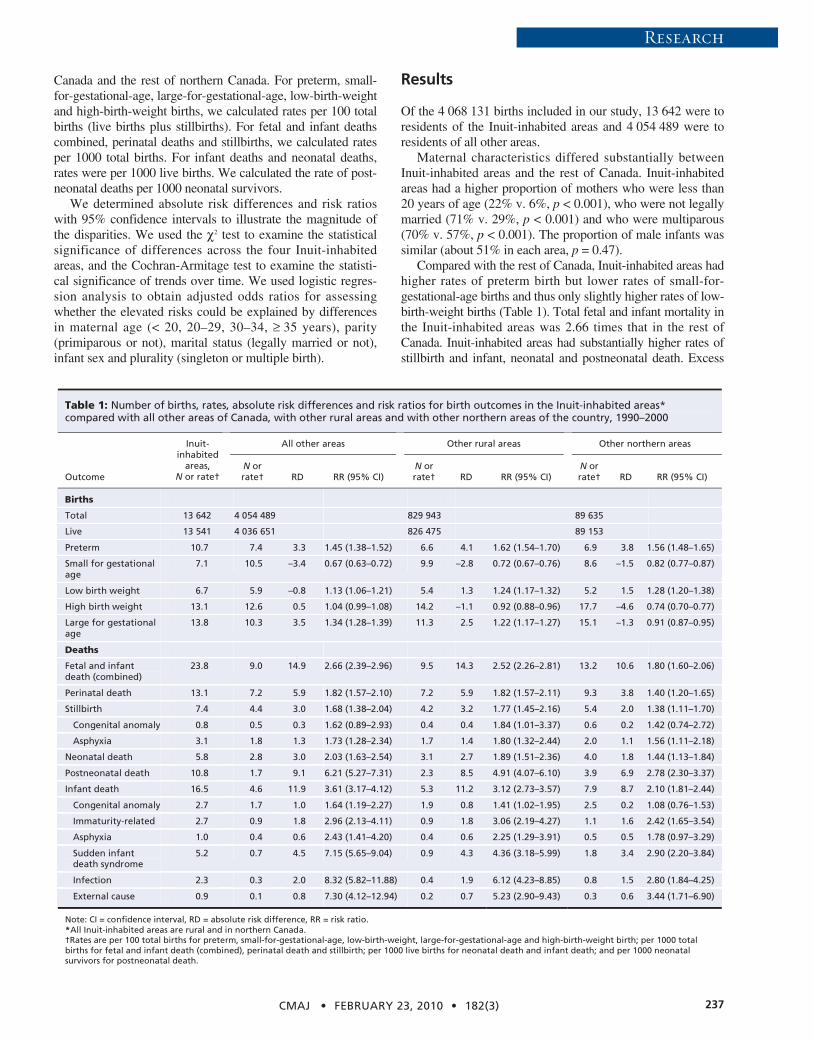
Compared with the rest of Canada, Inuit-inhabited areas hadhigher rates of preterm birth but lower rates of small-for-gestational-age births and thus only slightly higher rates of low-birth-weight births (Table 1). Total fetal and infant mortality inthe Inuit-inhabited areas was 2.66 times that in the rest ofCanada. Inuit-inhabited areas had substantially higher rates ofstillbirth and infant, neonatal and postneonatal death. Excess
CMAJ • FEBRUARY 23, 2010 • 182(3) 237
Table 1: Number of births, rates, absolute risk differences and risk ratios for birth outcomes in the Inuit-inhabited areas* compared with all other areas of Canada, with other rural areas and with other northern areas of the country, 1990–2000
All other areas Other rural areas Other northern areas
Outcome
Inuit- inhabited
areas, N or rate†
N or rate† RD RR (95% CI)
N or rate† RD RR (95% CI)
N or rate† RD RR (95% CI)
Births
Total 13 642 4 054 489 829 943 89 635
Live 13 541 4 036 651 826 475 89 153
Preterm 10.7 7.4 3.3 1.45 (1.38–1.52) 6.6 4.1 1.62 (1.54–1.70) 6.9 3.8 1.56 (1.48–1.65)
Small for gestational age
7.1 10.5 –3.4 0.67 (0.63–0.72) 9.9 –2.8 0.72 (0.67–0.76) 8.6 –1.5 0.82 (0.77–0.87)
Low birth weight 6.7 5.9 –0.8 1.13 (1.06–1.21) 5.4 1.3 1.24 (1.17–1.32) 5.2 1.5 1.28 (1.20–1.38)
High birth weight 13.1 12.6 0.5 1.04 (0.99–1.08) 14.2 –1.1 0.92 (0.88–0.96) 17.7 –4.6 0.74 (0.70–0.77)
Large for gestational age
13.8 10.3 3.5 1.34 (1.28–1.39) 11.3 2.5 1.22 (1.17–1.27) 15.1 –1.3 0.91 (0.87–0.95)
Deaths
Fetal and infant death (combined)
23.8 9.0 14.9 2.66 (2.39–2.96) 9.5 14.3 2.52 (2.26–2.81) 13.2 10.6 1.80 (1.60–2.06)
Perinatal death 13.1 7.2 5.9 1.82 (1.57–2.10) 7.2 5.9 1.82 (1.57–2.11) 9.3 3.8 1.40 (1.20–1.65)
Stillbirth 7.4 4.4 3.0 1.68 (1.38–2.04) 4.2 3.2 1.77 (1.45–2.16) 5.4 2.0 1.38 (1.11–1.70)
Congenital anomaly 0.8 0.5 0.3 1.62 (0.89–2.93) 0.4 0.4 1.84 (1.01–3.37) 0.6 0.2 1.42 (0.74–2.72)
Asphyxia 3.1 1.8 1.3 1.73 (1.28–2.34) 1.7 1.4 1.80 (1.32–2.44) 2.0 1.1 1.56 (1.11–2.18)
Neonatal death 5.8 2.8 3.0 2.03 (1.63–2.54) 3.1 2.7 1.89 (1.51–2.36) 4.0 1.8 1.44 (1.13–1.84)
Postneonatal death 10.8 1.7 9.1 6.21 (5.27–7.31) 2.3 8.5 4.91 (4.07–6.10) 3.9 6.9 2.78 (2.30–3.37)
Infant death 16.5 4.6 11.9 3.61 (3.17–4.12) 5.3 11.2 3.12 (2.73–3.57) 7.9 8.7 2.10 (1.81–2.44)
Congenital anomaly 2.7 1.7 1.0 1.64 (1.19–2.27) 1.9 0.8 1.41 (1.02–1.95) 2.5 0.2 1.08 (0.76–1.53)
Immaturity-related 2.7 0.9 1.8 2.96 (2.13–4.11) 0.9 1.8 3.06 (2.19–4.27) 1.1 1.6 2.42 (1.65–3.54)
Asphyxia 1.0 0.4 0.6 2.43 (1.41–4.20) 0.4 0.6 2.25 (1.29–3.91) 0.5 0.5 1.78 (0.97–3.29)
Sudden infant death syndrome
5.2 0.7 4.5 7.15 (5.65–9.04) 0.9 4.3 4.36 (3.18–5.99) 1.8 3.4 2.90 (2.20–3.84)
Infection 2.3 0.3 2.0 8.32 (5.82–11.88) 0.4 1.9 6.12 (4.23–8.85) 0.8 1.5 2.80 (1.84–4.25)
External cause 0.9 0.1 0.8 7.30 (4.12–12.94) 0.2 0.7 5.23 (2.90–9.43) 0.3 0.6 3.44 (1.71–6.90)
Note: CI = confidence interval, RD = absolute risk difference, RR = risk ratio. *All Inuit-inhabited areas are rural and in northern Canada. †Rates are per 100 total births for preterm, small-for-gestational-age, low-birth-weight, large-for-gestational-age and high-birth-weight birth; per 1000 total births for fetal and infant death (combined), perinatal death and stillbirth; per 1000 live births for neonatal death and infant death; and per 1000 neonatal survivors for postneonatal death.
Research
mortality was observed for all major causes of infant death,including congenital anomalies (risk ratio [RR] 1.64), immatu-rity-related conditions (RR 2.96), asphyxia (RR 2.43), suddeninfant death syndrome (RR 7.15), infection (RR 8.32) andexternal causes (RR 7.30). The major causes of excess stillbirthwere asphyxia (RR 1.73) and congenital anomalies (RR 1.62).
The risk ratios for stillbirth and perinatal, infant and totalfetal and infant death changed little when the comparison wasrestricted to other rural areas of Canada (Table 1). These risksdecreased when the comparison was restricted to other north-ern areas of Canada, but they were still substantial (Table 1).The rate differences for total fetal and infant death per 1000total births were 14.9 for the comparison of Inuit-inhabitedareas and the rest of Canada, 14.3 for the comparison withother rural areas and 10.6 for the comparison with othernorthern areas.
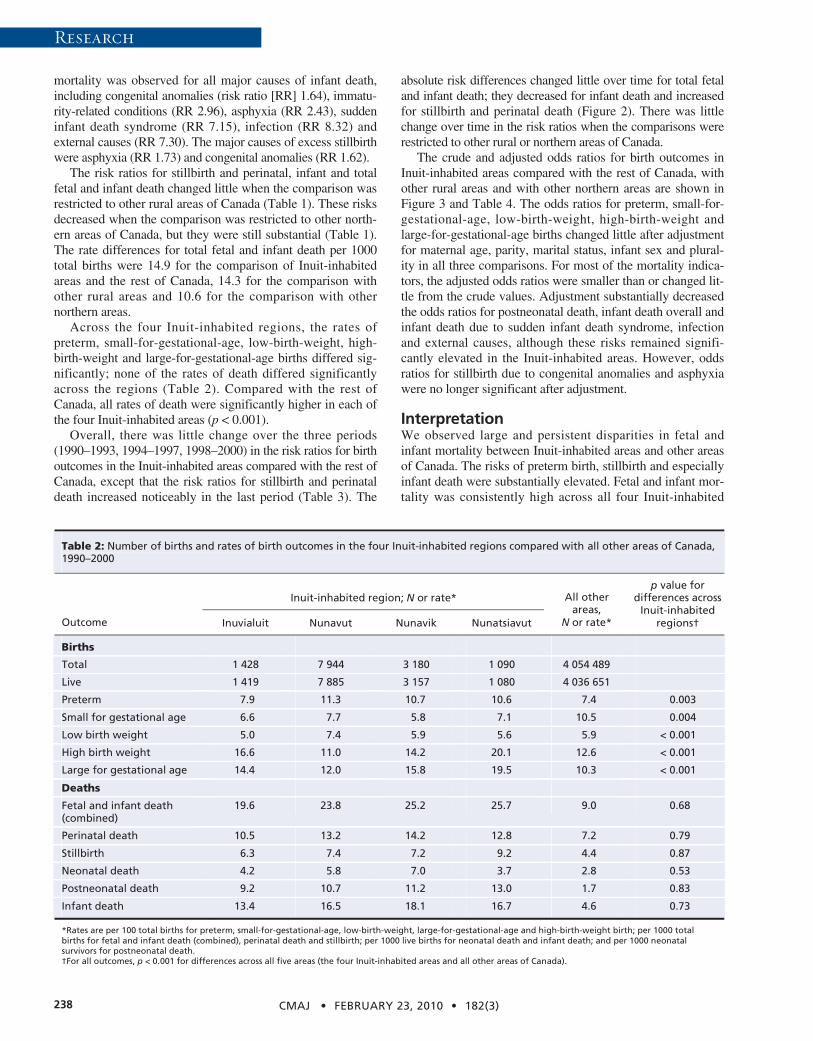
Across the four Inuit-inhabited regions, the rates ofpreterm, small-for-gestational-age, low-birth-weight, high-birth-weight and large-for-gestational-age births differed sig-nificantly; none of the rates of death differed significantlyacross the regions (Table 2). Compared with the rest ofCanada, all rates of death were significantly higher in each ofthe four Inuit-inhabited areas (p < 0.001).
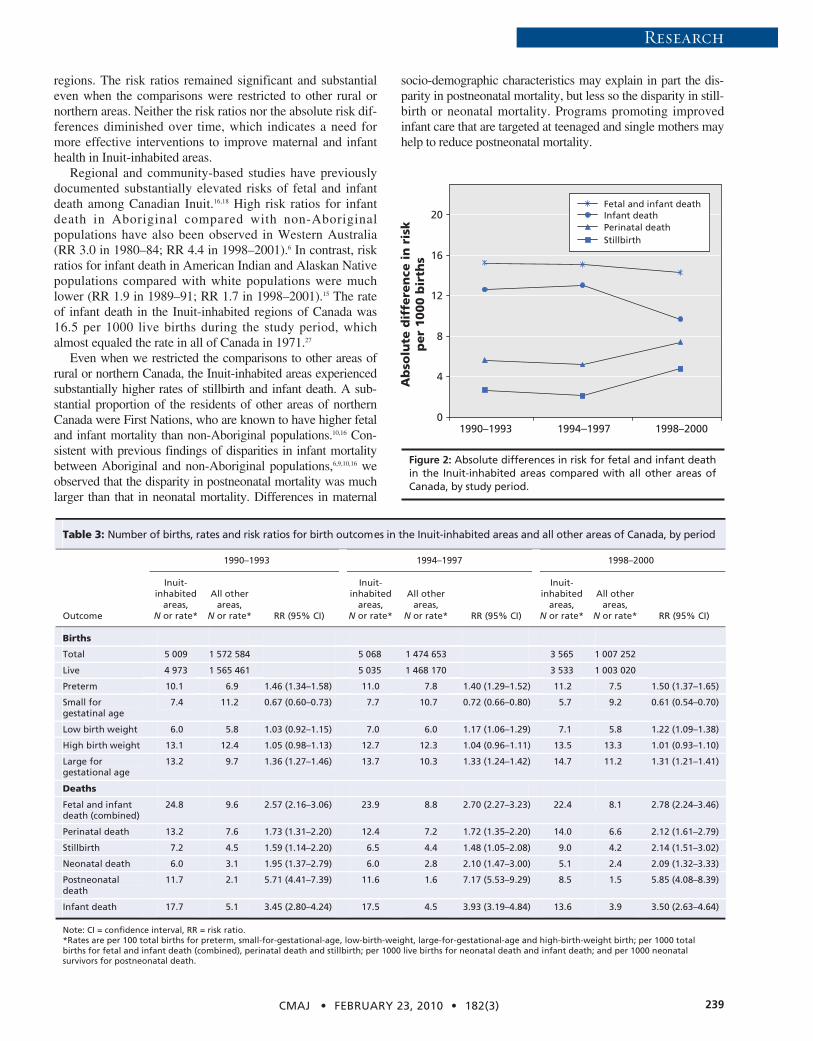
Overall, there was little change over the three periods(1990–1993, 1994–1997, 1998–2000) in the risk ratios for birthoutcomes in the Inuit-inhabited areas compared with the rest ofCanada, except that the risk ratios for stillbirth and perinataldeath increased noticeably in the last period (Table 3). The
absolute risk differences changed little over time for total fetaland infant death; they decreased for infant death and increasedfor stillbirth and perinatal death (Figure 2). There was littlechange over time in the risk ratios when the comparisons wererestricted to other rural or northern areas of Canada.
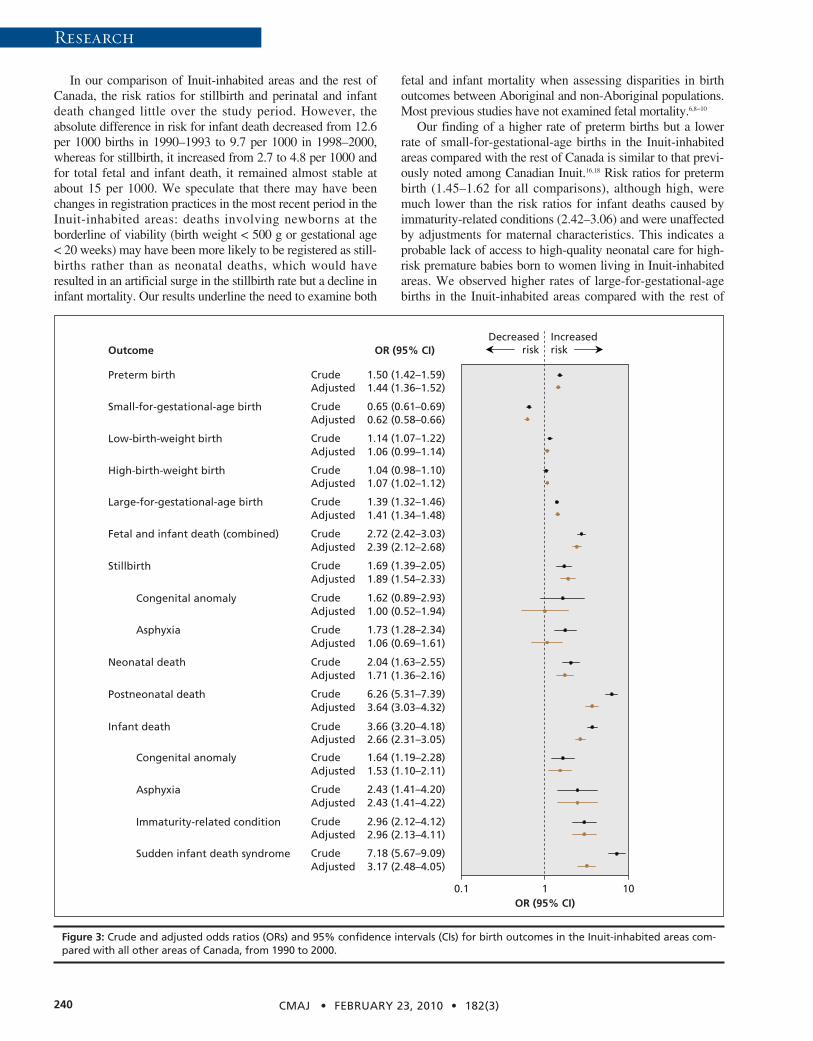
The crude and adjusted odds ratios for birth outcomes inInuit-inhabited areas compared with the rest of Canada, withother rural areas and with other northern areas are shown inFigure 3 and Table 4. The odds ratios for preterm, small-for-gestational-age, low-birth-weight, high-birth-weight andlarge-for-gestational-age births changed little after adjustmentfor maternal age, parity, marital status, infant sex and plural-ity in all three comparisons. For most of the mortality indica-tors, the adjusted odds ratios were smaller than or changed lit-tle from the crude values. Adjustment substantially decreasedthe odds ratios for postneonatal death, infant death overall andinfant death due to sudden infant death syndrome, infectionand external causes, although these risks remained signifi-cantly elevated in the Inuit-inhabited areas. However, oddsratios for stillbirth due to congenital anomalies and asphyxiawere no longer significant after adjustment.
InterpretationWe observed large and persistent disparities in fetal andinfant mortality between Inuit-inhabited areas and other areasof Canada. The risks of preterm birth, stillbirth and especiallyinfant death were substantially elevated. Fetal and infant mor-tality was consistently high across all four Inuit-inhabited
CMAJ • FEBRUARY 23, 2010 • 182(3)238
Table 2: Number of births and rates of birth outcomes in the four Inuit-inhabited regions compared with all other areas of Canada, 1990–2000
Inuit-inhabited region; N or rate*
Outcome Inuvialuit Nunavut Nunavik Nunatsiavut
All other areas,
N or rate*
p value for differences across
Inuit-inhabited regions†
Births
Total 1 428 7 944 3 180 1 090 4 054 489
Live 1 419 7 885 3 157 1 080 4 036 651
Preterm 7.9 11.3 10.7 10.6 7.4 0.003
Small for gestational age 6.6 7.7 5.8 7.1 10.5 0.004
Low birth weight 5.0 7.4 5.9 5.6 5.9 < 0.001
High birth weight 16.6 11.0 14.2 20.1 12.6 < 0.001
Large for gestational age 14.4 12.0 15.8 19.5 10.3 < 0.001
Deaths
Fetal and infant death (combined)
19.6 23.8 25.2 25.7 9.0 0.68
Perinatal death 10.5 13.2 14.2 12.8 7.2 0.79
Stillbirth 6.3 7.4 7.2 9.2 4.4 0.87
Neonatal death 4.2 5.8 7.0 3.7 2.8 0.53
Postneonatal death 9.2 10.7 11.2 13.0 1.7 0.83
Infant death 13.4 16.5 18.1 16.7 4.6 0.73
*Rates are per 100 total births for preterm, small-for-gestational-age, low-birth-weight, large-for-gestational-age and high-birth-weight birth; per 1000 total births for fetal and infant death (combined), perinatal death and stillbirth; per 1000 live births for neonatal death and infant death; and per 1000 neonatal survivors for postneonatal death. †For all outcomes, p < 0.001 for differences across all five areas (the four Inuit-inhabited areas and all other areas of Canada).
Research
regions. The risk ratios remained significant and substantialeven when the comparisons were restricted to other rural ornorthern areas. Neither the risk ratios nor the absolute risk dif-ferences diminished over time, which indicates a need formore effective interventions to improve maternal and infanthealth in Inuit-inhabited areas.
Regional and community-based studies have previouslydocumented substantially elevated risks of fetal and infantdeath among Canadian Inuit.16,18 High risk ratios for infantdeath in Aboriginal compared with non- Aboriginalpopulations have also been observed in Western Australia(RR 3.0 in 1980–84; RR 4.4 in 1998–2001).6 In contrast, riskratios for infant death in American Indian and Alaskan Nativepopulations compared with white populations were muchlower (RR 1.9 in 1989–91; RR 1.7 in 1998–2001).15 The rateof infant death in the Inuit-inhabited regions of Canada was16.5 per 1000 live births during the study period, whichalmost equaled the rate in all of Canada in 1971.27
Even when we restricted the comparisons to other areas ofrural or northern Canada, the Inuit-inhabited areas experiencedsubstantially higher rates of stillbirth and infant death. A sub-stantial proportion of the residents of other areas of northernCanada were First Nations, who are known to have higher fetaland infant mortality than non-Aboriginal populations.10,16 Con-sistent with previous findings of disparities in infant mortalitybetween Aboriginal and non-Aboriginal populations,6,9,10,16 weobserved that the disparity in postneonatal mortality was muchlarger than that in neonatal mortality. Differences in maternal
socio-demographic characteristics may explain in part the dis-parity in postneonatal mortality, but less so the disparity in still-birth or neonatal mortality. Programs promoting improvedinfant care that are targeted at teenaged and single mothers mayhelp to reduce postneonatal mortality.
CMAJ • FEBRUARY 23, 2010 • 182(3) 239
Table 3: Number of births, rates and risk ratios for birth outcomes in the Inuit-inhabited areas and all other areas of Canada, by period
1990–1993 1994–1997 1998–2000
Outcome
Inuit-inhabited
areas, N or rate*
All other areas,
N or rate* RR (95% CI)
Inuit- inhabited
areas, N or rate*
All other areas,
N or rate* RR (95% CI)
Inuit- inhabited
areas, N or rate*
All other areas,
N or rate* RR (95% CI)
Births
Total 5 009 1 572 584 5 068 1 474 653 3 565 1 007 252
Live 4 973 1 565 461 5 035 1 468 170 3 533 1 003 020
Preterm 10.1 6.9 1.46 (1.34–1.58) 11.0 7.8 1.40 (1.29–1.52) 11.2 7.5 1.50 (1.37–1.65)
Small for gestatinal age
7.4 11.2 0.67 (0.60–0.73) 7.7 10.7 0.72 (0.66–0.80) 5.7 9.2 0.61 (0.54–0.70)
Low birth weight 6.0 5.8 1.03 (0.92–1.15) 7.0 6.0 1.17 (1.06–1.29) 7.1 5.8 1.22 (1.09–1.38)
High birth weight 13.1 12.4 1.05 (0.98–1.13) 12.7 12.3 1.04 (0.96–1.11) 13.5 13.3 1.01 (0.93–1.10)
Large for gestational age
13.2 9.7 1.36 (1.27–1.46) 13.7 10.3 1.33 (1.24–1.42) 14.7 11.2 1.31 (1.21–1.41)
Deaths
Fetal and infant death (combined)
24.8 9.6 2.57 (2.16–3.06) 23.9 8.8 2.70 (2.27–3.23) 22.4 8.1 2.78 (2.24–3.46)
Perinatal death 13.2 7.6 1.73 (1.31–2.20) 12.4 7.2 1.72 (1.35–2.20) 14.0 6.6 2.12 (1.61–2.79)
Stillbirth 7.2 4.5 1.59 (1.14–2.20) 6.5 4.4 1.48 (1.05–2.08) 9.0 4.2 2.14 (1.51–3.02)
Neonatal death 6.0 3.1 1.95 (1.37–2.79) 6.0 2.8 2.10 (1.47–3.00) 5.1 2.4 2.09 (1.32–3.33)
Postneonatal death
11.7 2.1 5.71 (4.41–7.39) 11.6 1.6 7.17 (5.53–9.29) 8.5 1.5 5.85 (4.08–8.39)
Infant death 17.7 5.1 3.45 (2.80–4.24) 17.5 4.5 3.93 (3.19–4.84) 13.6 3.9 3.50 (2.63–4.64)
Note: CI = confidence interval, RR = risk ratio. *Rates are per 100 total births for preterm, small-for-gestational-age, low-birth-weight, large-for-gestational-age and high-birth-weight birth; per 1000 total births for fetal and infant death (combined), perinatal death and stillbirth; per 1000 live births for neonatal death and infant death; and per 1000 neonatal survivors for postneonatal death.
0
4
8
12
16
20
1990–1993 1994–1997 1998–2000
Ab
solu
te d
iffe
ren
ce i
n r
isk
per
1000 b
irth
s
Fetal and infant death
Stillbirth Perinatal death Infant death
Figure 2: Absolute differences in risk for fetal and infant deathin the Inuit-inhabited areas compared with all other areas ofCanada, by study period.
Research
In our comparison of Inuit-inhabited areas and the rest ofCanada, the risk ratios for stillbirth and perinatal and infantdeath changed little over the study period. However, theabsolute difference in risk for infant death decreased from 12.6per 1000 births in 1990–1993 to 9.7 per 1000 in 1998–2000,whereas for stillbirth, it increased from 2.7 to 4.8 per 1000 andfor total fetal and infant death, it remained almost stable atabout 15 per 1000. We speculate that there may have beenchanges in registration practices in the most recent period in theInuit- inhabited areas: deaths involving newborns at theborderline of viability (birth weight < 500 g or gestational age< 20 weeks) may have been more likely to be registered as still-births rather than as neonatal deaths, which would haveresulted in an artificial surge in the stillbirth rate but a decline ininfant mortality. Our results underline the need to examine both
fetal and infant mortality when assessing disparities in birthoutcomes between Aboriginal and non-Aboriginal populations.Most previous studies have not examined fetal mortality.6,8−10
Our finding of a higher rate of preterm births but a lowerrate of small-for-gestational-age births in the Inuit-inhabitedareas compared with the rest of Canada is similar to that previ-ously noted among Canadian Inuit.16,18 Risk ratios for pretermbirth (1.45–1.62 for all comparisons), although high, weremuch lower than the risk ratios for infant deaths caused byimmaturity-related conditions (2.42–3.06) and were unaffectedby adjustments for maternal characteristics. This indicates aprobable lack of access to high-quality neonatal care for high-risk premature babies born to women living in Inuit-inhabitedareas. We observed higher rates of large-for-gestational-agebirths in the Inuit-inhabited areas compared with the rest of
CMAJ • FEBRUARY 23, 2010 • 182(3)240
Outcome
Preterm birth
Small-for-gestational-age birth
Low-birth-weight birth
High-birth-weight birth
Large-for-gestational-age birth
Stillbirth
Neonatal death
Postneonatal death
Congenital anomaly
Asphyxia
Immaturity-related condition
Sudden infant death syndrome
Fetal and infant death (combined)
Crude
AdjustedCrude
AdjustedCrude
AdjustedCrude
AdjustedCrude
AdjustedCrude
Adjusted
1.44 (1.36–1.52)1.50 (1.42–1.59)
0.62 (0.58–0.66)0.65 (0.61–0.69)
1.06 (0.99–1.14)1.14 (1.07–1.22)
1.07 (1.02–1.12)1.04 (0.98–1.10)
1.41 (1.34–1.48)1.39 (1.32–1.46)
2.39 (2.12–2.68)2.72 (2.42–3.03)
1.89 (1.54–2.33)1.69 (1.39–2.05)
Infant deathAdjustedCrude
2.66 (2.31–3.05)3.66 (3.20–4.18)
1.71 (1.36–2.16)Crude 2.04 (1.63–2.55)
Crude 6.26 (5.31–7.39)
Congenital anomaly Adjusted 1.00 (0.52–1.94)Crude 1.62 (0.89–2.93)
Adjusted 1.53 (1.10–2.11)Crude 1.64 (1.19–2.28)
AsphyxiaAdjusted 1.06 (0.69–1.61)Crude 1.73 (1.28–2.34)
Adjusted 2.43 (1.41–4.22)Crude 2.43 (1.41–4.20)
Adjusted 2.96 (2.13–4.11)Crude 2.96 (2.12–4.12)
Adjusted 3.17 (2.48–4.05)Crude 7.18 (5.67–9.09)
Crude
Adjusted
3.64 (3.03–4.32)Adjusted
Adjusted
OR (95% CI)
0.1 1 10
Increased risk
Decreased risk
OR (95% CI)
Figure 3: Crude and adjusted odds ratios (ORs) and 95% confidence intervals (CIs) for birth outcomes in the Inuit-inhabited areas com-pared with all other areas of Canada, from 1990 to 2000.
Research
Canada and with other rural areas, but not when we restrictedthe comparison to other northern areas. The lack of a differ-ence in the last comparison could be explained by the highproportion of First Nations in the rest of northern Canada andthe fact that First Nations babies tend to be large at birth.16,28
LimitationsOur results for the Inuit-inhabited areas cannot be taken asresults for Inuit women, because about 10% of the births in theInuit-inhabited areas were to non-Inuit women, according todata from the 2006 census. Nevertheless, we observed suchlarge disparities in fetal and infant mortality that our conclu-sions would not have changed even if we had been able toidentify Inuit births at the individual level. We had no data onother maternal and medical risk factors that might have medi-ated or confounded the observed associations. More studiesare needed to understand the possible impacts of those factors.
Conclusions and future directionsOur findings highlight the dire situations of maternal andinfant health in Inuit-inhabited areas compared with the restof Canada and other rural and northern areas of the country.They underline the need for effective interventions to
improve those situations. A substantial part of the excess fetaland infant mortality in the Inuit-inhabited areas may be pre-ventable, such as deaths from sudden infant death syndrome,infection and external causes or injuries. Maternal smoking,an important risk factor for preterm birth, sudden infant deathsyndrome and postnatal infection,29−31 is much more prevalentamong Inuit women than among other women in Canada.32
Programs to promote smoking cessation, awareness of thedangers of environmental tobacco smoke, and breastfeedingamong Inuit mothers are strongly recommended. More effec-tive “back to sleep” campaigns (educating mothers to placetheir babies on their backs for sleeping to avoid crib deathsoften associated with sleeping in the prone position) may helpto reduce the incidence of sudden infant death syndrome.33−35
Investment in improved socio-economic and living conditionsmay also help to reduce infant mortality, especially post -neonatal mortality,36,37 because such improvements wouldprobably decrease exposure to various risks in the environ-ment where the child is raised.
The elevated risk of infant death from congenital anomaliesin the Inuit-inhabited regions is of particular concern. Inuit areheavy consumers of marine mammals and fish, which results inexposure to environmental contaminants concentrated through
CMAJ • FEBRUARY 23, 2010 • 182(3) 241
Table 4: Odds ratios for birth outcomes in the Inuit-inhabited areas compared with all other areas of Canada and other rural and northern areas of the country, 1990–2000
All other areas Other rural areas Other northern areas
Outcome Crude
OR (95% CI) Adjusted*
OR (95% CI) Crude
OR (95% CI) Adjusted*
OR (95% CI) Crude
OR (95% CI) Adjusted*
OR (95% CI)
Births
Preterm 1.50 (1.42–1.59) 1.44 (1.36–1.52) 1.69 (1.60–1.79) 1.58 (1.50–1.68) 1.63 (1.54–1.73) 1.56 (1.47–1.66)
Small for gestational age 0.65 (0.61–0.69) 0.62 (0.58–0.67) 0.69 (0.65–0.74) 0.67 (0.62–0.71) 0.81 (0.75–0.86) 0.81 (0.75–0.87)
Low birth weight 1.14 (1.07–1.22) 1.06 (0.99–1.14) 1.26 (1.18–1.35) 1.16 (1.08–1.25) 1.31 (1.21–1.40) 1.25 (1.16–1.35)
High birth weight 1.04 (0.99–1.10) 1.07 (1.02–1.13) 0.91 (0.86–0.96) 0.94 (0.89–0.99) 0.70 (0.66–0.73) 0.69 (0.65–0.73)
Large for gestational age 1.39 (1.32–1.46) 1.41 (1.34–1.48) 1.25 (1.19–1.32) 1.26 (1.20–1.32) 0.90 (0.85–0.94) 0.88 (0.83–0.93)
Deaths
Fetal and infant death (combined)
2.70 (2.42–3.02) 2.39 (2.12–2.68) 2.56 (2.28–2.86) 2.13 (1.90–2.40) 1.82 (1.61–2.02) 1.59 (1.40–1.81)
Perinatal death 1.83 (1.58–2.12) 1.81 (1.55–2.12) 1.83 (1.57–2.12) 1.64 (1.40–1.93) 1.41 (1.20–1.66) 1.27 (1.07–1.51)
Stillbirth 1.69 (1.39–2.05) 1.89 (1.54–2.33) 1.78 (1.46–2.17) 1.68 (1.35–2.07) 1.38 (1.11–1.71) 1.23 (0.97–1.55)
Congenital anomaly 1.62 (0.89–2.93) 1.00 (0.52–1.94) 1.85 (1.01–3.37) 1.19 (0.91–2.35) 1.42 (0.74–2.72) 1.00 (0.48–2.10)
Asphyxia 1.73 (1.28–2.34) 1.06 (0.69–1.61) 1.80 (1.32–2.44) 1.05 (0.68–1.61) 1.56 (1.11–2.18) 1.17 (0.73–1.88)
Neonatal death 2.04 (1.63–2.55) 1.71 (1.36–2.16) 1.89 (1.51–2.37) 1.60 (1.26–2.03) 1.45 (1.13–1.85) 1.32 (1.02–1.71)
Postneonatal death 6.26 (5.31–7.39) 3.64 (3.06–4.32) 4.85 (4.10–4.75) 3.19 (2.67–3.81) 2.80 (2.31–3.40) 2.25 (1.84–2.76)
Infant death 3.66 (3.20–4.18) 2.66 (2.31–3.05) 3.16 (2.76–3.61) 2.40 (2.08–2.77) 2.12 (1.82–2.45) 1.82 (1.55–2.13)
Congenital anomaly 1.64 (1.19–2.28) 1.53 (1.10–2.11) 1.41 (1.02–1.96) 1.26 (0.91–1.77) 1.08 (0.76–1.53) 1.02 (0.72–1.46)
Immaturity-related condition
2.96 (2.13–4.12) 2.96 (2.13–4.11) 3.06 (2.19–4.28) 3.06 (2.19–4.27) 2.42 (1.65–3.55) 2.42 (1.65–3.54)
Asphyxia 2.43 (1.41–4.20) 2.43 (1.41–4.22) 2.25 (1.29–3.91) 2.33 (1.33–4.09) 1.78 (0.97–3.29) 1.95 (1.03–3.67)
Sudden infant death syndrome
7.18 (5.67–9.09) 3.17 (2.48–4.05) 5.60 (4.39–7.15) 3.14 (2.43–4.06) 2.91 (2.20–3.85) 2.23 (1.66–2.99)
Infection 8.33 (5.88–11.91) 5.68 (3.93–8.22) 6.14 (4.24–8.88) 4.21 (2.86–6.20) 2.80 (1.84–4.26) 2.37 (1.53–3.68)
External cause 7.31 (4.12–12.96) 5.30 (4.12–8.94) 5.24 (2.90–9.44) 4.23 (1.90–8.34) 3.44 (1.71–6.90) 2.43 (1.61–5.90)
Note: CI = confidence interval, OR = odds ratio. *Adjusted for maternal age (< 20, 20–29, 30–34, ≥ 35 years), parity (primiparous or not), marital status (legally married or not), infant sex and plurality (singleton or multiple birth).
Research
the food chain.38 Further studies are warranted to assesswhether such exposures may be causal. Also, the high preva-lence of alcohol abuse among Inuit women39 may increase ratesof birth defects related to alcohol toxicity.40 Programs to reducealcohol and other substance abuse among Inuit women ofchild-bearing age may help to prevent such adverse outcomes.The fact that the risk of infant death from congenital anomalieswas comparably high in both the Inuit-inhabited areas and therest of northern Canada suggests that common environmentalrisks exist in the North. All adjusted odds ratios were close to1.0 for stillbirths due to congenital anomalies and asphyxia,which indicates that the differences in maternal characteristicscould largely explain those risk differences. However, itremains unclear why women of such a distinct demographicprofile (more young and unmarried women in the Inuit-inhab-ited areas than in the other areas studied) have such high risksof stillbirth from congenital anomalies and asphyxia.
This article has been peer reviewed.
Competing interests: None declared.
Contributors: Zhong-Cheng Luo, Sacha Senécal and Russell Wilkins con-ceived the study and obtained the research funding. All of the authors con-tributed to refining the analytic framework and interpreting the results.Zhong-Cheng Luo and Russell Wilkins conducted the analyses. Zhong-Cheng Luo was responsible for the literature review and for writing the man-uscript. All of the authors contributed to revising the article critically forimportant intellectual content and approved the final version of the manu-script submitted for publication.
Acknowledgement: The authors are grateful to Statistics Canada for provid-ing access to the data.
Funding: This work was supported by a research grant from the StrategicResearch and Analysis Directorate of Indian and Northern Affairs Canada.Zhong-Cheng Luo was supported by a Junior Scholar Award from the Fondsde la recherche en santé du Québec and a New Investigator Award from theCanadian Institutes of Health Research (CIHR). Fabienne Simonet was sup-ported by a PhD studentship from the CIHR Strategic Training Initiative inResearch in Reproductive Health Science and a research grant (no. 73551)from the CIHR Institute of Aboriginal Peoples’ Health.
REFERENCES1. Alessandri LM, Chambers HM, Blair EM, et al. Perinatal and postneonatal mortal-
ity among indigenous and non-indigenous infants born in Western Australia,1980–1998. Med J Aust 2001;175:185-9.
2. Alexander GR, Wingate MS, Boulet S. Pregnancy outcomes of American Indians:contrasts among regions and with other ethnic groups. Matern Child Health J2008;12(Suppl 1):5-11.
3. Decrease in infant mortality and sudden infant death syndrome among NorthwestAmerican Indians and Alaskan Natives — Pacific Northwest, 1985–1996. MMWRMorb Mortal Wkly Rep 1999;48:181-4.
4. Baldwin LM, Grossman DC, Casey S, et al. Perinatal and infant health among ruraland urban American Indians/Alaska Natives. Am J Public Health 2002; 92: 1491-7.
5. Bjerregaard P, Misfeldt J. Infant mortality in Greenland: secular trend and regionalvariation. Arctic Med Res 1992;51:126-35.
6. Freemantle CJ, Read AW, de Klerk NH, et al. Patterns, trends, and increasing dis-parities in mortality for Aboriginal and non-Aboriginal infants born in WesternAustralia, 1980–2001: population database study. Lancet 2006;367:1758-66.
7. Freemantle CJ, Read AW, de Klerk NH, et al. Sudden infant death syndrome andunascertainable deaths: trends and disparities among Aboriginal and non-Aborigi-nal infants born in Western Australia from 1980 to 2001 inclusive. J PaediatrChild Health 2006;42:445-51.
8. Grossman DC, Krieger JW, Sugarman JR, et al. Health status of urban AmericanIndians and Alaska Natives. A population-based study. JAMA 1994;271:845-50.
9. Grossman DC, Baldwin LM, Casey S, et al. Disparities in infant health amongAmerican Indians and Alaska Natives in US metropolitan areas. Pediatrics 2002;109:627-33.
10. Luo ZC, Kierans WJ, Wilkins R, et al. Infant mortality among First Nations versusnon-First Nations in British Columbia: temporal trends in rural versus urban areas,1981–2000. Int J Epidemiol 2004;33:1252-9.
11. MacMillan HL, MacMillan AB, Offord DR, et al. Aboriginal health. CMAJ 1996;155:1569-78.
12. Martens PJ, Derksen S. A matter of life and death for Manitoba’s children: an overviewof birth rates and mortality rates. Can J Public Health 2002;93(Suppl 2):S21-6.
13. Muggah E, Way D, Muirhead M, et al. Preterm delivery among Inuit women in theBaffin Region of the Canadian Arctic. Int J Circumpolar Health 2004;63(Suppl2):242-7.
14. Nakamura RM, King R, Kimball EH, et al. Excess infant mortality in an AmericanIndian population, 1940 to 1990. JAMA 1991;266:2244-8.
15. Tomashek KM, Qin C, Hsia J, et al. Infant mortality trends and differencesbetween American Indian/Alaska Native infants and white infants in the UnitedStates, 1989–1991 and 1998–2000. Am J Public Health 2006;96:2222-7.
16. Luo ZC, Wilkins R, Platt RW, et al. Risks of adverse pregnancy outcomes amongInuit and North American Indian women in Quebec, 1985–97. Paediatr PerinatEpidemiol 2004;18:40-50.
17. Macaulay A, Orr P, Macdonald S, et al. Mortality in the Kivalliq Region ofNunavut, 1987–1996. Int J Circumpolar Health 2004;63(Suppl 2):80-5.
18. Pageau M, Ferland M, Déry S. Our Children — health status of children aged 0–5years in Nunavik. Kuujjuaq (Nunavik): Nunavik Regional Board of Health andSocial Services; 2003.
19. Aboriginal peoples of Canada: a demographic profile [2001 census: analysisseries]. Ottawa (ON): Statistics Canada; 2003. Cat. no. 96F0030XIE2001007.Available: www12.statcan.ca /english /census01 /products /analytic /companion /abor/pdf /96F0030XIE2001007.pdf (accessed 2009 Sept. 29).
20. Wilkins R, Uppal S, Finès P, et al. Life expectancy in the Inuit-inhabited areas ofCanada, 1989 to 2003. Health Rep 2008;19:7-19.
21. Fair M, Cyr M, Allen AC, et al. An assessment of the validity of a computer sys-tem for probabilistic record linkage of birth and infant death records in Canada.The Fetal and Infant Health Study Group. Chronic Dis Can 2000;21:8-13.
22. Wilkins R. PCCF+ version 4J user’s guide. Automated geographic coding basedon the Statistics Canada postal code conversion files, including postal codes toSeptember 2006. Ottawa (ON): Statistics Canada; 2007. Cat. no. 82F0086-XDB.
23. du Plessis V, Beshiri R, Bollman RD, et al. Definitions of rural. Rural and SmallTown Canada Analysis Bulletin 2001;3:1-16. Cat. no. 21-006-XIE.
24. McNiven C, Puderer H. Delineation of Canada’s North: an examination of theNorth–South relationship in Canada [geography working paper series no. 2000-3].Ottawa (ON): Statistics Canada; 2000. Cat. no. 92F0138MPE.
25. Kramer MS, Platt RW, Wen SW, et al.; Fetal/Infant Health Study Group of theCanadian Perinatal Surveillance System. A new and improved population-basedCanadian reference for birth weight for gestational age. Pediatrics 2001;108:E35.
26. Cole S, Hartford RB, Bergsjo P, et al. International collaborative effort (ICE) onbirth weight, plurality, perinatal, and infant mortality. III: A method of groupingunderlying causes of infant death to aid international comparisons. Acta ObstetGynecol Scand 1989;68:113-7.
27. Wadhera S, Strachan J. Selected infant mortality and related statistics, Canada,1921–1990. Ottawa (ON): Statistics Canada; 1993. Cat. no. 82-549.
28. Rodrigues S, Robinson EJ, Kramer MS, et al. High rates of infant macrosomia: a com-parison of a Canadian native and a non-native population. J Nutr 2000; 130: 806-12.
29. Shea AK, Steiner M. Cigarette smoking during pregnancy. Nicotine Tob Res 2008;10: 267-78.
30. Fleming P, Blair PS. Sudden infant death syndrome and parental smoking. EarlyHum Dev 2007;83:721-5.
31. Jeppesen DL, Nielsen SD, Ersboll AK, et al. Maternal smoking during pregnancyincreases the risk of postnatal infections in preterm neonates. Neonatology 2008;94: 75-8.
32. Reading J, Allard Y. The tobacco report. In: First Nations and Inuit RegionalHealth Survey. Ottawa (ON): First Nations and Inuit Regional Health SteeringCommittee; 1999. p. 87-135.
33. Ponsonby AL, Dwyer T, Cochrane J. Population trends in sudden infant death syn-drome. Semin Perinatol 2002;26:296-305.
34. Henderson-Smart DJ, Ponsonby AL, Murphy E. Reducing the risk of sudden infantdeath syndrome: a review of the scientific literature. J Paediatr Child Health1998;34:213-9.
35. Dwyer T, Ponsonby AL. Sudden infant death syndrome: after the “back to sleep”campaign. BMJ 1996;313:180-1.
36. Singh GK, Kogan MD. Persistent socioeconomic disparities in infant, neonatal,and postneonatal mortality rates in the United States, 1969–2001. Pediatrics 2007;119:e928-39.
37. Arntzen A, Nybo Andersen AM. Social determinants for infant mortality in theNordic countries, 1980–2001. Scand J Public Health 2004;32:381-9.
38. Muckle G, Ayotte P, Dewailly E, et al. Determinants of polychlorinated biphenylsand methylmercury exposure in Inuit women of childbearing age. Environ HealthPerspect 2001;109:957-63.
39. Healey GK, Meadows LM. Inuit women’s health in Nunavut, Canada: a review ofthe literature. Int J Circumpolar Health 2007;66:199-214.
40. Calhoun F, Warren K. Fetal alcohol syndrome: historical perspectives. NeurosciBiobehav Rev 2007;31:168-71.
Correspondence to: Dr. Zhong-Cheng Luo, Department ofObstetrics and Gynecology, Sainte-Justine Hospital, 3175 Côte-Sainte-Catherine, Montréal QC H3T 1C5; [email protected]
CMAJ • FEBRUARY 23, 2010 • 182(3)242