Embed Size (px)
Citation preview

Table 17. Social Characteristics of the Foreign-Born Population by Year of Immigration and Country of
Birth: 1970
United States
ALL COUNTRIES'
Age
Mala, •II Gfll --------------------------Under 5 years---------------------------------5 to 9 years ----------------------------------10 to 14 years --------------------------------15 to 19 years --------------------------------20 to 24 years ------ ---- __ --------------------25 to 29 years --------------------------------30 to 34 years -------------------------------35 to 39 years -------------------------------40 to 44 years -------------------------------
---
45 to 49 years -------------------------------50 to 54 yeors -------------------------------55 to 59 years-------------------------------60 to 64 years -------------------------------65 to 69 years -------------------------------70 to 74 years -------------------------------75 to 79 years-------------------------------80 to 84 years -------------------------------85 years and over ----------------------------Median oge ----------------------------------
Femole, all ages __________ ------ ------ _ Under 5 yeors--------------------------------5 to 9 years ---------------------------------10 to 14 years -------------------------------15 to 19 years-------------------------------20 to 24 years-------------------------------25 lo 29 years -------------------------------30 to 34 yeors -------------------------------35 to 39 years-------------------------------40 to 44 years -------------------------------
45 to 49 years -------------------------------50 to 54 years -------------------------------55 to 59 years-------------------------------60 to 64 yeors -------------------------------65 to 69 years -------------------------------70 to 74 years -------------------------------75 to 79 years-------------------------------80 to 84 years-------------------------------85 years and over---------------------------Median age----------------------------------
Citizenship
Toto I ________________ -- -- -- ---- -- -- --Na tu rolized _________________________________ _ Alien _______________________________________ _
Marital Status
Malt, 14 years old and over_ ____________ _ Single ______________________________________ _ Married ________________________ ------ ______ _ Widowed ____________________ ---------- ------Divorced ______________ -- ____ -- -- -- -- ____ -- --
Female, 14 years aid and over------------Single __________________ -------- ____________ _ Married ____ ------ __________________ ------ __ _ Widowed __ -- -- ____ ---- -- __ ------ -- ---- ------Divorced __________________ ------ ------ ------
Fertility
Women, 35 to 44 Years old --------------Ever married ______ ------ ____________________ _
----------
----------
----------
---
----------
---Number of children ever born------------------
Per 1,000 women-------------------------- --Per 1,000 ever married women _______________ _ -
Women, 45 years old and aver ___________ _ -Ever married __________ -- ___________________ _
Number of children ever born-----------------Per 1,000 women---------------------------
----
Per 1,000 ever married women _______________ _ --
'Includes nor reported. no! shown separately
440
IAge and year of immigration were not edited for consistency, see Appendix o. Dato based on 5-percent sample, see text. For minimum base for derived figures ( t edion etc ) and meaning of symbols see text! percen, m
1965 1960 1955 1950 1945 1935 1925 10 to to to to to to Before Not
Total 1970 1964 1959 1954 1949 1944 1934 1925 reported
4 472 293 803 957 515 171 441 635 367 039 239 250 147 815 364 758 1 399 143 193 525 60 696 47 001 1 119 508 184 161 34 142 290 11 257
134 145 82 861 32 572 1 043 369 235 20 71 310 16 664 169 652 69 261 53 074 28 839 1 068 273 173 212 854 15 898 197 670 67 339 46 647 45 648 21 492 592 191 418 898 14 445 247 131 92 569 42 660 35 188 37 337 19 179 574 373 1 009 18 242 271 062 114 332 61 040 32 359 26 256 17 692 3 223 817 l 393 13 950 295 071 100 170 76 861 54 768 27 342 16 362 7 827 634 l 262 9 845
68 460 61 477 63 209 37 214 18 811 9 660 3 861 l 529 8 555 272 776 49 901 42 758 58 889 49 905 30 701 14 122 15 353 2 525 9 I 17 273 271
294 418 35 132 32 910 43 267 50 931 39 129 23 174 33 941 26 939 9 195 236 858 23 576 21 204 25 107 33 773 27 286 18 400 30 265 47 847 9 400 298 923 19 801 17 272 22 071 31 119 25 256 20 790 52 423 100 511 9 680 369 635 13 639 11 543 16 245 21 470 18 402 18 768 93 233 166 583 9 752 401 957 9 185 7 230 7 617 14 307 12 513 13 735 73 543 253 469 10 358 355 851 4 990 3 001 3 867 7 752 7 028 9 198 34 487 276 970 8 558 293 329 3 336 1 937 l 726 4 127 3 314 4 327 14 750 252 358 7 454 192 043 l 542 I 018 810 1 375 1 464 2 236 6 142 171 563 5 893 107 605 862 848 474 l 018 852 1 363 4 093 92 833 5 262
50.4 26.9 31.3 36.8 43.2 47.0 54.1 62.4 71.7 33.2
5 267 430 917 198 620 857 534 869 423 797 346 520 175 634 401 392 1 615 562 231 601 62 543 46 846 I 095 367 418 201 26 143 284 13 163
129 432 78 305 32 807 1 281 329 241 29 188 256 15 996 166 615 67 179 52 299 28 550 l 408 180 217 427 706 15 649 203 201 76 624 44 356 44 743 21 142 708 206 235 l 524 13 663 299 194 134 688 49 411 37 923 40 895 18 929 473 584 l 577 14 714 342 165 146 838 95 191 37 976 26 831 17 049 3 148 626 l 532 12 974 362 450 102 497 103 350 89 924 29 411 15 870 7 945 748 l 494 11 211 335 460 69 880 68 260 89 248 59 765 22 427 9 663 3 811 2 209 10 197 363 753 51 567 51 113 68 782 73 141 73 027 14 117 17 633 3 117 11 256
356 578 38 224 36 644 47 433 55 792 77 652 23 449 35 763 29 425 12 196 265 607 26 914 23 792 25 990 32 608 37 537 23 666 30 115 53 281 11 704 334 114 25 787 21 130 22 759 26 476 28 153 26 958 58 312 111 232 13 307 405 000 18 494 16 047 15 452 20 884 19 586 21 933 93 394 184 433 14 777 468 189 14 496 10 688 10 719 15 755 15 267 17 432 76 039 292 731 15 062 440 895 7 973 6 360 6 784 9 833 9 451 12 913 46 705 325 980 14 896 343 413 5 654 4 309 3 424 4 905 5 322 7 226 21 368 279 602 11 603 236 725 3 134 2 358 2 024 2 328 3 062 3 698 10 036 200 704 9 381 152 096 2 098 1 647 1 490 1 876 l 858 2 535 5 265 125 4 75 9 852
50.2 26.9 31.7 36.5 42.2 46.6 55.9 62.8 71.9 43.7
9 739 723 1 721 155 1 136 028 976 504 790 836 585 770 323 449 766 150 3 014 705 425 126 6 198 173 210 672 357 128 561 760 573 233 483 484 290 928 694 494 2 735 025 291 449 3 541 550 l 510 483 778. 900 414 744 217 603 102 286 32 521 71 656 279 680 133 677
4 144 987 618 114 438 523 420 664 365 867 238 728 147 640 364 411 1 398 093 152 947 712 204 220 636 119 119 102 940 71 683 29 589 10 814 24 886 82 794 49 743
3 046 152 383 871 308 316 305 658 278 723 197 613 126 284 305 938 l 054 620 85 129 296 610 6 191 3 771 3 728 6 415 5 674 6 541 23 251 228 623 12 416 90 021 7 416 7 317 8 338 9 046 5 852 4 001 10 336 32 056 5 659
4 946 389 738 263 544 704 514 462 422 126 345 978 175 481 400 878 1 614 748 189 749 616 121 189 903 103 846 91 134 56 629 21 839 10 489 24 093 80 582 37 606
2 996 213 487 570 390 558 375 078 315 270 274 243 121 041 253 594 678 436 100 423 1 174 866 42 953 31 098 29 231 34 222 34 157 36 221 109 940 812 396 44 648
159 189 17 837 19 202 19 019 16 005 15 739 7 730 13 251 43 334 7 072
699 213 121 447 119 373 158 030 132 906 95 454 23 780 21 444 5 326 21 453 658 103 108 920 110 414 151 374 128 623 93 013 22 549 20 110 3 899 19 201 1 757 040 274 353 263 669 382 352 362 462 279 700 66 694 59 400 11 494 56 916
2 513 2 259 2 209 2 419 2 727 2 930 2 805 2 770 2 158 2 653 2 670 2 519 2 388 2 526 2 818 3 007 2 958 2 954 2 948 2 964
3 002 617 142 774 122 975 136 075 170 457 197 888 139 810 376 997 1 602 863 112 771 2 836 446 129 895 113 199 127 902 160 200 189 560 131 946 354 972 I 526 067 102 705 7 791 289 392 977 296 973 315 808 350 932 432 053 279 086 824 553 4 628 312 270 595 2 595 2 752 2 415 2 321 2 059 2 183 I 996 2 187 2 888 2 399 2 747 3 025 2 623 2 469 2 191 2 279 2 115 2 323 3 033 2 635
NATIONAL ORIGIN AND LANGUAGE
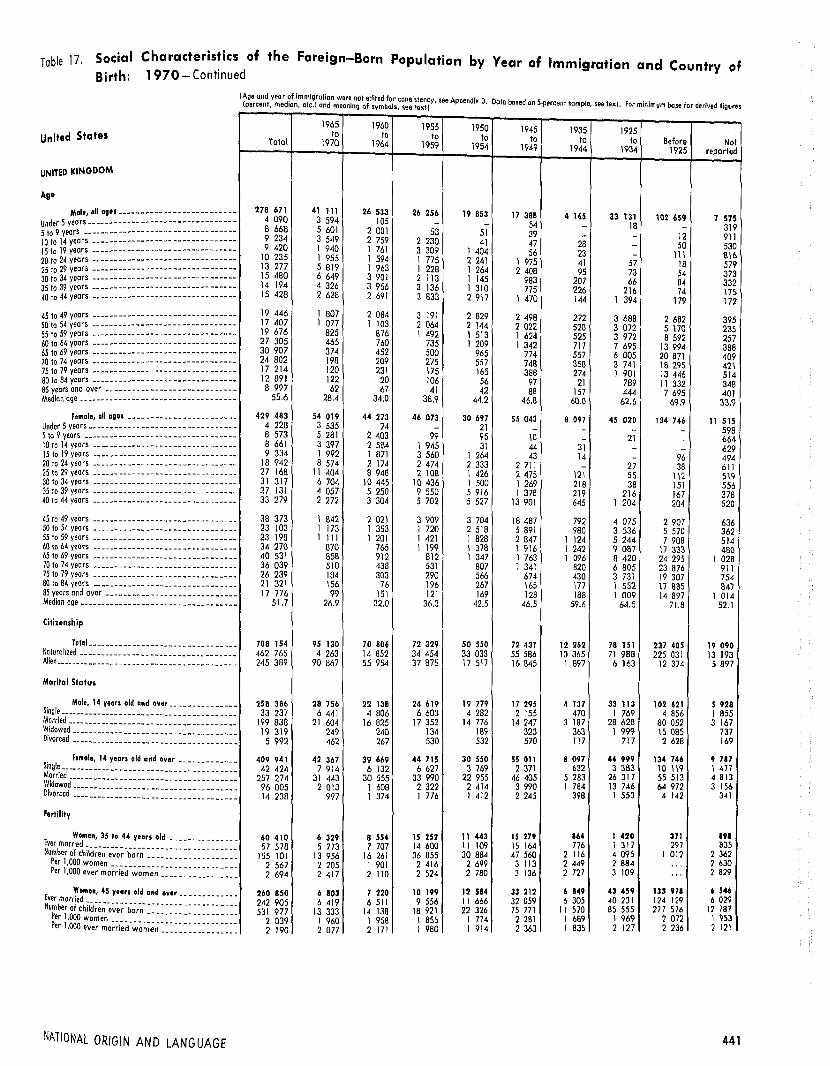
Table 17. Social Characteristics of the Foreign-Born Population by Year of Immigration and Country of Birth: 1970- Continued
United States
UNITED KINGDOM
Age
Male, all ag•'-------------------------Under 5 years---- -- -- -- -- -- -- -- -- -- -- -- -- -- -- -5 to 9 years----------------------------------10 ta 14 years--------------------------------15 to 19 years ------ -- -- -- -- -- -- -- ---- -- -- -- --20 to 24 years--------------------------------25 to 29 years ------------------ --------------30 to 34 years--------------------------------35 ta 39 years--------------------------------40 ta 44 years--------------------------------
45 to 49 years--------------------------------50 to 54 years--------------------------------55 to 59 years --------------------------------60 to 64 years -- ---- -- -- -- -- -- -- -- -- -- -- -- -- --65 to 69 years--------------------------------70 to 74 years --------------------------------75 to 79 years -- ---- -- -- -- -- -- -- -- -- -- -- -- -- --80 to 84 years -- ---- -- -- -- -- -- -- -- -- -- -- -- -- --85 years and aver-----------------------------Median age ------ -- ---- -- -- -- -- -- -- -- __ -- ____ _
Female, all ages-----------------------Under 5 years -- -- -- -- -- -- -- -- -- -- -- -- -- -- -- -- -5 to 9 years ------ -- -- .. -- -- -- ______ -- -- _____ _ lOto 14years --------------------------------15 to 19 years--------------------------------20 to 24 years --------------------------------25 to 29 years--------------------------------30 to 34 years --------------------------------35 to 39 years --------------------------------40to 44 years--------------------------------
45 to 49 years -- -- -- -- -- -- -- -- _______________ _ 50 to 54 years ------ ---- _____________________ _ 55 to 59 years __________________ -- ___________ _ 60 to 64 years -------- _______________________ _
65 to 69 years--------------------------------7010 74yeors --------------------------------75 to 79 years ------ _________________________ _ 80 to 84 years _______________________________ _
85yeorsond over---------------------------- -Median oge _________________________________ _ -Citizenship
Total __________________ .. ___________ _ -Naturalized ____________ -- __ -- __________ -- -- -- -
Alien _______________________________________ _ -
Marital Status
Male, 14 years old and over _____________ _ Single---------- _____________________________ _ -Married _____________________________________ _
~~~~~:1 :: :: :: :: :::: :: :: :: :: :: :: :: :: :: :: :: ::
Fertility
Women, 35 to 44 years old _____ _ Ever morned ________________________________ _ Number of children ever born _
Per l,OOOwomen ________ :_::::::::::::::::: Per 1,000 ever married women _______________ _
Women, 45 years old and over __ _ Ever married __ _ Number of child;,;~~~;-b;r·n- -- -- -- -- -- -- -- -- -- -
Perl,OOOwomen -------------------Per 1,000 ever mo;;i~d-.;,~-;,;-~;::::::::::::::::
NATIONAL ORIGIN AND LANGUAGE
-------
-
---
. -
I Age and year of immigration were not edited for consistency see Appe di o D t b d (percent, median, etc.) and meaning af symbols, s~e text! ' n x · a a ase on S·percent sample, see text. Far minimum bQse for derived figures
1965 1960 1955 1950 1945 1935 1925 to to to to to to to Before Total 1970 Not 1964 1959 1954 1949 1944 1934 1925 reported
278 671 41 111 26 533 26 256 19 853 17 388 4 165 33 131 102 659 4 090 3 594 105 7 575 - - 54 - 18 319 8 668 5 601 2 001 -53 51 39 - 12 911 9 234 3 549 2 759 2 230 -9 420 1 940
41 47 28 - 50 530 1 761 3 309 1 404 56 23 - 111 816 10 235 1 955 1 594 1 775 2 241 l 975 41 57 18 579 13 277 5 819 1 963 1 228 1 264 2 408 95 73 54 373 15 480 6 649 3 901 2 113 1 145 983 207 66 84 332 14 194 4 326 3 956 3 136 1 310 775 226 216 74 175 15 428 2 628 2 691 3 833 2 917 1 470 144 1 394 179 172 19 446 1 807 2 084 3 191 2 829 2 498 272 3 688 2 682 395 17 407 1 077 1 103 2 064 2 144 2 022 520 3 072 5 170 235 19 676 825 876 l 492 \ 513 1 624 525 3 972 8 592 257 27 305 465 760 735 1 209 1 342 717 7 695 13 994 388 30 907 374 452 500 965 774 557 6 005 20 871 409 24 802 198 209 275 557 748 358 3 741 18 295 421 17 214 120 231 175 165 388 274 1 901 13 446 514 12 891 122 20 106 56 97 21 789 11 332 348 8 997 62 67 41 42 88 157 444 7 695 401 55.6 28.4 34.0 38.9 44.2 46,6 60.0 62.6 69.9 33.9
429 483 54 019 44 273 46 073 30 697 55 043 8 097 45 020 134 746 11 515 4 228 3 535 74 - 21 - - - - 598 8 573 5 281 2 403 99 95 10 - 21 - 664 8 661 3 397 2 584 1 945 31 44 31 - - 629 9 334 1 992 1 871 3 560 1 264 43 14 - 96 494 18 942 8 574 2 174 2 474 2 333 2 711 - 27 38 611 27 168 11 404 8 948 2 108 1 426 2 475 121 55 1\2 519 31 317 6 704 10 445 10 436 1 500 1 269 218 38 151 556 27 131 4 057 5 250 9 550 5 916 1 378 219 216 167 378 33 279 2 272 3 304 5 702 5 527 13 901 645 1 204 204 520
38 373 I 842 2 021 3 909 3 704 18 487 792 4 075 2 907 636 23 103 1 173 1 353 1 720 2 518 5 891 980 3 536 5 570 362 23 198 I 111 I 201 1 421 l 828 2 847 l 124 5 244 7 908 514 34 270 870 765 l 199 1 378 l 916 l 242 9 087 17 333 480 40 531 858 912 812 1 347 1 763 l 096 8 420 24 295 I 028 36 039 510 438 531 807 l 341 820 6 805 23 876 911 26 239 184 303 290 566 674 430 3 731 19 307 754 21 321 156 76 196 267 165 177 1 552 17 685 847 17 776 99 151 121 169 128 188 I 009 14 897 1 014
51.7 26.9 32.0 36.3 42.5 46.5 59.6 64.5 71.8 52. l
708 154 95 130 70 806 72 329 so 550 72 431 12 262 78 151 237 405 19 090 462 765 4 263 14 852 34 454 33 033 55 586 10 365 71 988 225 031 13 193 245 389 90 867 55 954 37 875 17 517 16 845 1 897 6 163 12 374 5 897
258 386 28 756 22 138 24 619 19 779 17 295 4 137 33 113 102 621 s 928 33 237 6 441 4 806 6 603 4 282 2 155 470 1 769 4 856 I 855
199 838 21 604 16 825 17 352 14 776 14 247 3 187 28 628 80 052 3 167 19 319 249 240 134 189 323 363 1 999 15 085 737 5 992 462 267 530 532 570 117 717 2 628 169
409 941 42 367 39 669 44 715 30 550 SS 011 8 097 44 999 134 746 9 787 42 424 7 914 6 132 6 627 3 769 2 371 632 3 383 10 119 1 477
257 274 31 443 30 555 33 990 22 955 46 405 5 283 26 317 55 513 4 813 96 005 2 013 1 608 2 322 2 414 3 990 1 784 13 746 64 972 3 156 14 238 997 1 374 I 776 1 412 2 245 398 I 553 4 142 341
60 410 6 329 8 554 15 252 11 443 15 279 864 1 420 37t ... 57 578 5 773 7 707 14 600 11 109 IS 164 776 1 317 297 835
155 101 13 956 16 261 36 855 30 884 47 560 2 116 4 095 l 012 2 362 2 567 2 205 I 901 2 416 2 699 3 113 2 449 2 884 ... 2 630
2 110 2 524 2 780 3 136 2 727 3 109 2 829 2 694 2 417 ...
260 850 6 803 7 220 10 199 12 584 33 212 6 849 43 459 133 971 6 546
6 419 6 511 9 556 11 666 32 059 6 305 40 231 124 129 6 029 242 905 531 977 13 333 14 138 18 921 22 326 75 771 11 570 85 555 277 576 12 787
2 039 1 960 I 958 I 855 1 774 2 281 I 689 I 969 2 072 l 953 2 077 2 171 l 980 1 914 2 363 I 835 2 127 2 236 2 121 2 190
441

Table 17. Social Characteristics of the Foreign-Born Population by Year of Immigration and Country of
Birth: 1970- Continued
United States
IRELAND
Age
Male, all ages _________________________ _
Under 5 years---------------------------------5 to 9 years ----------------------------------10 to 14 years --------------------------------15 to 19 years--------------------------------20 to 24 years --------------------------------25 to 29 years -------------------------------30 to 34 years --------------------------------35 to 39 years -------------------------------40 to 44 years -------------------------------
-
--
45 to 49 years -------------------------------50 to 54 years -------------------------------55 lo 59 years -------------------------------60 to 64 years -------------------------------65 to 69 years __ ---- __ ---------- ------ -------70 to 74 years -------------------------------75 to 79 years -------------------------------80 to 84 years -------------------------------85 years and over ---------------------------Median age----------------------------------
Female, all ages ----------------------Under 5 years __ ------------------------------5 to 9 yeors ---------------------------------10 to 14 years -------------------------------15 to 19 years -------------------------------20 to 24 years -------------------------------25 to 29 years -------------------------------30 to 34 years -------------------------------35 to 39 years -------------------------------40 to 44 years -------------------------------
45 to 49 years -------------------------------50 to 54 years -------------------------------55 to 59 years -------------------------------60 to 64 yeors -------------------------------65 to 69 years -------------------------------70 to 74 yeors -------------------------------75 to 79 years -------------------------------80 to 84 years -------------------------------85 yeors and over----------------------------Median oge ____________ ------ __ ------ ------ __
Citlxenship
Total ____________________ ---- _______ _ Naturalized _________________________________ _ Alien ______________________________ ---- _____ _
Marital Status
Male, 14 years old and over _____________ _ Single ____ -- -- ______ -- ______ -- -- -- __ -- -- ---- -Married ____________ -- -- -- -- -- -- -- -- -- -- -- -- -Widowed ---- ______________ ------ ------ _____ _ Divorced __________ -- -- -- -- - - -- -- -- -- -- -- -- --
Female, 14 years aid and over------------Single ______________________________________ _
Married -- __ ---- ---- ---- ------ -- ---- ---------Widowed ____ ---- __________ ------------ ------Divorced ________________________ ---- ---- -- __
Fertility
----------
--------------------
---
-----
-----
---
Women, 35 to 44 years old-------------Ever married-------------------------------Number of children ever born-----------------
Per 1,000 women-------------------------PH 1,000 ever morried women---------------
Women, 45 years old and over----------Ever married-------------------------------Number of children ever born-----------------
Per 1,000 women--------------------------Per 1,000 ever married women. _____________ _
442
----------------
IAge and year of immigrotfon were not edited for consistency, see Appendix 0. Data based on 5-percent sample, see text. For minimum base for derived figures ( t d' tc) and meaning of symbols see text I percen , me 1cn, e .
1965 1960 1955 1950 1945 1935 1925 to to to to to to to Before Not
Toto I 1970 1964 1959 1954 1949 1944 1934 1925 reported
90 834 4 277 7 176 10 941 6 080 6 995 l 748 24 342 26 190 2 485 229 134 - 18 - - - 23 34 20 668 235 356 41 - - - - - 36 906 157 282 405 - - - 17 - 45
1 346 69 103 600 451 17 29 40 - 37 1 791 570 327 230 218 199 29 84 - 134 4 225 l 103 l 931 782 151 128 - - 43 87 5 851 695 l 971 2 342 379 106 42 70 80 166 6 114 460 l 367 2 729 l 015 307 72 47 16 101
179 629 1 641 l 306 l 653 106 421 64 108 6 107
6 621 138 338 893 l 373 2 206 250 893 348 182 167 166 516 603 1 315 254 744 729 182 4 676 105 125 324 229 614 301 2 174 449 101 4 422 109 52 295 154 281 397 8 872 l 864 336 12 360 156 52 86 105 66 132 6 879 4 541 313 12 330
39 40 63 96 3 117 5 529 155 9 039 - -6 921 - 19 17 40 17 21 745 5 823 239 4 563 - - - 16 23 - 116 4 270 138 2 665 - 19 22 - - 19 100 2 400 105
61.0 29.4 32.3 36.9 43.2 47.5 56.5 64,3 74.5 60.6
147 239 6 879 9 604 13 323 9 875 9 109 4 104 36 174 53 280 4 891 262 187 - - - - - - - 75 447 201 226 - - - - - 20 -658 153 212 139 23 - 19 26 60 26
l 660 229 166 721 328 21 - 44 109 42 4 085 l 994 879 478 440 66 25 67 19 ll7 6 855 l 704 2 770 l 336 249 146 88 75 105 382 9 095 829 2 263 4 255 l 258 137 129 62 38 124 9 191 542 l 127 2 643 3 081 l 223 81 171 107 216 7 827 209 558 l 463 l 841 2 768 42 625 87 234
7 380 252 605 707 l 088 2 361 602 l 170 402 193 6 300 198 266 365 481 1 306 l 114 l 625 737 208
10 964 126 142 501 424 493 685 7 069 l 272 252 20 153 165 139 321 217 225 606 13 697 4 299 484 17 850 61 145 144 282 159 354 7 136 8 980 589 14 669 29 48 151 132 92 115 2 892 10 678 532 12 027 - - 63 31 40 165 762 10 671 295 10 048 - 14 19 - 54 39 443 8 972 507 7 768 - 44 17 - 18 40 310 6 724 615
62.2 27.0 31.2 34.7 39.3 45.4 54.8 62.6 74.9 65.8
238 073 11 156 17 380 24 264 15 955 16 104 5 852 60 516 79 470 7 376 194 772 930 7 287 15 886 12 997 14 197 5 479 56 739 75 288 5 969 43 301 10 226 10 093 8 378 2 958 1 907 373 3 777 4 182 1 407
89 282 3 772 7 181 10 640 6 080 6 995 l 748 24 302 26 156 2 408 15 091 l 726 l 805 2 356 1 420 l 238 459 2 681 2 731 675 64 064 l 992 5 232 8 123 4 488 5 555 1 123 19 541 16 797 1 213 9 261 54 48 121 126 147 125 1 861 6 327 452
866 - 96 40 46 55 41 219 301 68
146 105 6 357 9 207 13 265 9 852 9 109 4 104 36 174 53 221 4 816 25 512 3 090 2 519 2 901 2 246 1 152 894 4 420 7 112 l 178 75 863 3 004 6 374 9 851 7 051 7 265 2 370 21 456 16 540 l 952 42 643 183 169 407 442 473 691 9 773 28 877 l 628
2 087 80 145 106 113 219 149 525 692 58
17 018 751 l 685 4 106 4 922 3 991 123 796 194 450 14 497 508 l 251 3 642 4 289 3 538 123 685 151 310 45 916 905 2 495 10 149 15 972 12 638 518 2 178 177 884
2 698 1 205 l 481 2 472 3 245 3 167 ... 2 736 ... I 964 3 167 l 781 1 994 2 787 3 724 3 572 ... 3 180 ... ...
107 159 831 l 403 2 288 2 655 4 748 3 720 35 104 52 735 3 675 91 797 598 945 1 750 2 003 4 136 2 826 30 877 45 753 2 909
259 277 l 570 2 349 4 732 4 553 11 800 6 654 82 549 138 625 6 445 2 420 1 889 l 674 2 068 1 715 2 485 1 789 2 352 2 629 1 754 2 824 2 625 2 486 2 704 2 273 2 853 2 355 2 673 3 030 2 216
NATIONAL ORIGIN AND LANGUAGE
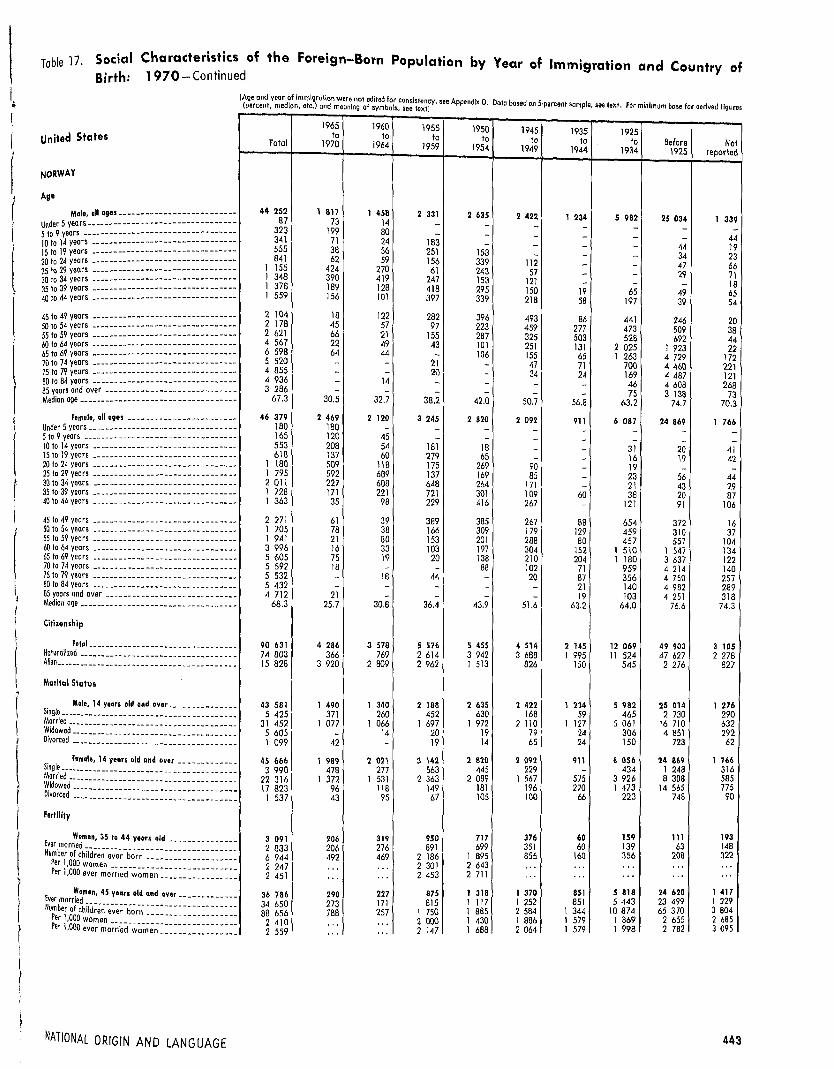
Table 17. Social Characteristics of the Foreign-Born Population by Year of Immigration and Countr of Birth: 1 970- Continued Y
'~ I United States
f NORWAY
, Age
1
\ I
I I
Male, all ages •• ------------------------Under 5 years---------------------------------5 to 9 years ----------------------------------10 to 14 years --------------------------------15 to 19 years --------------------------------20 to 24 years -- -- -- -- -- -- -- -- - - -- -- -- -- -- -- --25 to 29 years ------ -- -- -- -- -- -- -- -- -- -- -- -- --30 to 34 years --------------------------------35 lo 39 years--------------------------------40 to 44 years --------------------------------
45 to 49 years -- ---- -- -- -- -- -- -- ---- -- -- -- -- --50 to 54 years--------------------------------55 to 59 years--------------------------------60 to 64 years --------------------------------65 to 69 years--------------------------------70 to 74 years -- -- -- -- -- -- -- -- -- -- - - -- -- -- -- --75 to 79 years--------------------------------80 ta 84 years--------------------------------85 years and over----------------------------Median age-----------------------------------
Female, all ages-----------------------Under 5 years------ -- -- -- -- -- -- -- -- -- -- -- -- -- -5 ta 9 years ----------------------------------10 la 14 years --------------------------------15to 19years --------------------------------20 to 24 years --------------------------------25 to 29 years--------------------------------30 ta 34 years --------------------------------3S la 39 years--------------------------------40 to 44 years ____________ -- ---- _____________ _
4S lo 49 years ________ -- -- -- __ -- -- -- -- __ - - -- --SO to 54 years ________ -- -- -- ________ -- __ ··- ___ _
SS ta 59 years --------------------------------60 lo 64 years --------------------------------65 to 69 years --------------------------------70 lo 74years --------------------------------7Sto 79 years--------------------------------80 to 84 years --------------------------------85 yeors and aver---------------------------- . Median age-----------------------------------
Citiienship
Total ______ -- ____ -- -- -- -- -- -- -- -- - - --Maturo\ized __ ------ _________________________ _ Alien _______________________________________ _
Marital Status
Male, 14 years aid and over _____________ _ Single------ ________________________________ _ Married ______________________________ -- -- -- -Widowed---- _______________________________ _ Divorced ___________________________________ _
s· I female, 14 years old and over------------
~rJ~~~d====:::::::::: :::::::::: :: : ::::: :: : :: ivorced ___________________________________ _
Fertility
Women, 35 to 44 years old-------------Ever married Number of chlld;;~-e~~;-b~r-n- -- -- -- - - ---- -- -- -- -
Per 1,000 women ________ :: :: :: :: :: :: :: :: :: : Per 1,000 ever married women _______________ _
Women, 45 years old and over Ever married ------------Number of child;;~-e~~;-b~r-n- -- -- -- - - -- -- -- - - - - -
Per 1,000women -------------------Per 1,000 ever ma;;i~d-_:..~~;;::::::::::::::::
NATIONAL ORIGIN AND LANGUAGE
---
----------
---------
!Age and year of Immigration were not edited for consistency e A di o o b d (percent, median, efc.,) and meaning of symbols, see text! 'se pp!l'n x · ata ase on S·percent sample, see text. For minimum base for derived figures
1965 1960 1955 1950 1945 1935 1925 to to to to to to to Before Not Total 1970 1964 1959 1954 1949 1944 1934 1925 reporled
44 252 1 817 1 458 2 331 2 635 2 422 l 234 5 982 25 034 87 73 14 l 339 - - - -323 199 80 - - -341 - - - - - - 44 71 24 183 - - - - 44 19 555 38 56 251 153 - - - 34 23 841 62 59 156 339 112 - - 47 66 l 155 424 270 61 243 57 - 29 71 1 348 390 419 -247 153 121 - 18 1 378 189 128 - -418 295 150 19 65 49 65 1 559 156 101 397 339 218 58 197 39 54
2 104 18 122 282 396 493 86 441 246 20 2 178 45 57 97 223 459 277 473 509 38 2 621 66 21 155 287 325 503 528 692 44 4 567 22 49 43 101 251 131 2 025 1 923 22 6 598 64 44 - 106 155 65 1 263 4 729 172 5 520 - - 21 - 47 71 700 4 460 221 4 855 - - 20 - 34 24 169 4 487 121 4 936 - 14 - - - - 46 4 608 268 3 286 - - - - - - 75 3 138 73 67.3 30.5 32.7 38.2 42.0 50.7 56.B 63.2 74.7 70.3
46 379 2 469 2 120 3 245 2 820 2 092 911 6 087 24 869 l 766 180 180 - - - - - - - -165 120 45 - - - - - - -553 208 54 181 18 - - 31 20 41 618 137 60 279 65 - - 16 19 42 l 180 509 118 175 269 90 - 19 - -1 795 592 689 137 169 85 - 23 56 44 2 011 227 608 648 264 171 - 21 43 29 1 728 171 221 721 301 109 60 38 20 87 l 363 35 98 229 416 267 - 121 91 106
2 271 61 39 389 385 267 SS 654 372 16 1 705 78 38 166 309 179 129 459 310 37 I 941 21 80 153 201 288 80 457 557 104 3 996 16 33 103 197 304 152 1 510 1 547 134 5 605 75 19 20 138 210 204 1 180 3 637 122 5 592 18 - - 88 102 71 959 4 214 140 5 532 - 16 44 - 20 87 356 4 750 257 5 432 - - - - - 21 140 4 982 289 4 712 21 - - - - 19 103 4 251 318
68.3 25.7 30.8 36.4 43.9 51.6 63.2 64.0 76.6 74.3
90 631 4 286 3 578 5 576 5 455 4 514 2 145 12 069 49 903 3 105 74 803 366 769 2 614 3 942 3 688 1 995 11 524 47 627 2 278 15 828 3 920 2 809 2 962 1 513 826 150 545 2 276 827
43 581 1 490 l 340 2 188 2 635 2 422 l 234 5 982 25 014 1 276 5 425 371 260 452 630 168 59 465 2 730 290
31 452 1 077 1 066 1 697 1 972 2 110 1 127 5 061 16 710 632 5 605 - 14 20 19 79 24 306 4 851 292 1 099 42 - 19 14 65 24 150 723 62
45 666 1 989 2 021 3 142 2 820 2 092 911 6 056 24 869 1 766 3 990 478 277 563 445 229 - 434 1 248 316
22 316 1 372 1 531 2 363 2 089 1 567 575 3 926 8 308 585 17 823 96 118 149 181 196 270 1 473 14 565 775
1 537 43 95 67 105 100 66 223 748 90
3 091 206 319 950 717 376 60 159 111 193 206 276 891 699 351 60 139 63 148 2 833
469 2 186 1 895 856 160 356 208 322 6 944 492 2 247 ... ... 2 301 2 643 ... ... .. . ... ... 2 451 ... ... 2 453 2 711 ... ... ... ... ...
36 786 290 227 875 1 318 1 370 851 5 818 24 620 1 417 5 443 23 499 I 229 34 650 273 171 815 1 117 I 252 851
88 656 788 257 1 750 1 885 2 584 1 344 10 874 65 370 3 804 I 886 l 579 l 869 2 655 2 685 2 410 2 000 1 430 ... ...
1 688 2 064 I 579 1 998 2 782 3 095 2 559 ... ... 2 147
443

Table 17. Social Characteristics of the Foreign-Born Population by Year of Immigration and Country of
Birth: 1970-Continued
United States
SWEDEN
Age
Mal•, oll agu _________________________ _
Under 5 years---------------------------------5 to 9 years ----------------------------------10 to 14 years --------------------------------15 to 19 years --------------------------------20 to 24 years --------------------------------25 to 29 years --------------------------------30 to 34 years --------------------------------35 to 39 years --------------------------------40 to 44 years -------------------------------
45 to 49 years -------------------------------50 to 54 years -------------------------------55 to 59 years -------------------------------60 to 64 years -------------------------------65 to 69 years -------------------------------70 to 74 years -------------------------------75 to 79 years -------------------------------80 to 84 years -------------------------------85 years and over ----------------------------Median age----------------------------------
female, all agH ----------------------Under 5 yeors_·------------------------------5 to 9 years ---------------------------------10 to 14 years -------------------------------15 to 19 years -------------------------------20 to 24 years -------------------------------25 to 29 years -------------------------------30 to 34 years -------------------------------35 to 39 years -------------------------------40 to 44 years -------------------------------
45 to 49 years -------------------------------5010 54 years -------------------------------55 to 59 years -------------------------------60 to 64 years -------------------------------65 to 69 years -------------------------------70 to 74 years -------------------------------75 to 79 years -------------------------------80 to 84 years -------------------------------85 years and over ---------------------------Medion age----------------------------------
Citixenship
Tatol -- ______________________ ------ __
Naturalized __ ------ __ -------- ----------------Alien-- -- -- ---- -------------- ------ ---- ------
Marital Status
Male, 14 years old and over _____________ _
Single -- ---- -- -- -- -- -- -- -- -- - --- -- -- ---- -- ---Married ---- ------ ______ ---- ------ -----------Widowed ____ ------ ____ ------ __ ---------- ___ _ Divorced __ -------- __________ ------ __ --------
Female, 14 years old and over ___________ _ Sing le -- __ -- ________________________________ _
Married __________ ---- __ ---------------------Widowed ____ ---------------- ------------ ___ _ Divorced ___________________________________ _
Fertility
-
----------
--------------------
---
----------
---
Women, 35 ta 44 years old -------------Ever married-------------------------------Number of children ever born------------------
Perl ,000 women --------------------------Per 1,000 ever married women----------------
---
Women, 45 years old and aver ___________ _ fver married ________________ -------------- __ _ --t-lumber of children ever born -----------------
Per 1,000 women----------------------------
Per 1,000 ever married women ______ -------- __ ---
444
!Ag-e and year of immigration were not edited for consistency, see Appendix 0, Data based on 5·percent sample, see text. For minimum base for derived figures ( t median etc) and meaning of symbols, see text I percen,
1965 1960 1955 1950 1945 1935 1925 10 to to to to to to Before Not
Total 1970 1964 1959 1954 1949 1944 1934 1925 reported
55 583 1 666 BOS 1 174 1 352 1 531 695 10 502 36 583 1 275 204 173 - - - - - - - 31 440 338 33 - 19 - - - - 50 121 43 40 21 - - - - 17 -299 60 77 37 104 - - - - 21 557 65 22 118 138 108 - - 85 21 569 194 80 18 51 59 - 39 23 105 897 411 176 96 78 112 - - 24 -799 164 143 148 119 128 - 63 16 18 902 54 83 220 172 150 45 130 16 32
l 934 40 38 147 211 278 100 434 677 9 1 746 21 - 147 151 249 61 428 620 69
23 73 110 172 196 116 940 979 34 2 643 7 530 16 21 43 43 75 128 4 291 2 849 64
JO 348 25 19 23 59 98 104 2 867 7 042 111 7 824 28 19 56 47 881 6 622 171 - -8 063 - - 18 - - 43 286 7 593 123 6 523 - - - - 22 36 85 6 227 153 4 184 39 - - 16 - 15 58 3 793 263
69.4 29.0 34.3 43.4 44.9 48.8 61.0 63.7 74.5 72.1
59 487 3 813 2 310 2 251 2 160 1 535 774 1 184 37 798 l 662 203 171 - - - - - - - 32 452 369 83 - - - - - - -410 176 64 84 26 - - - 19 41 642 161 49 142 180 24 - - 44 42
1 500 725 82 185 283 105 - 22 61 37 2 223 1 110 720 152 107 55 - - 56 23 l 981 497 850 405 135 42 19 - - 33 1 546 192 180 468 422 122 39 - 83 40 1 519 221 120 354 215 290 97 114 89 19
2 049 86 54 138 252 251 41 512 642 73 1 722 40 24 68 266 181 147 414 561 21 2 351 22 28 123 107 137 - 914 877 143 5 326 43 18 44 144 137 213 1 960 2 704 63 7 394 - 20 42 23 81 123 1 872 5 087 146 6 887 - - - - - 43 966 5 632 246 7 252 - - 27 - 91 15 190 6 697 232 8 304 - 18 - - 19 17 118 7 854 278 7 726 - - 19 - - 20 102 7 392 193
70.3 26.4 30.9 36.7 39.1 47.6 61.0 64.1 77.3 72.4
115 070 5 479 3 115 3 425 3 512 3 066 l 469 17 686 74 381 2 937 98 190 401 361 1 376 2 341 2 675 1 426 16 723 70 558 2 329 16 880 5 078 2 754 2 049 1 171 391 43 963 3 823 608
54 835 1 112 732 1 153 1 333 1 531 695 10 502 36 583 1 194 5 239 259 290 251 212 293 56 775 2 832 271
39 791 782 422 850 981 1 104 511 8 839 25 772 530 8 460 45 20 28 38 26 91 651 7 177 384 1 345 26 - 24 102 108 37 237 802 9
58 495 3 115 2 184 2 201 2 134 l 535 774 7 184 37 779 1 589 5 298 1 228 411 416 470 101 48 434 1 944 246
26 146 1 787 1 690 1 645 1 541 1 084 488 4 414 12 959 538 25 028 56 28 37 81 175 142 2 049 21 722 738 2 023 44 55 103 42 175 96 287 1 154 67
3 065 413 300 822 637 412 136 114 172 59 2 768 353 261 806 615 412 136 75 90 20 5 917 519 493 1 536 1 544 1 072 448 139 166 -I 931 1 257 "' l 869 2 424 2 602 ... ... '" -2 138 ... ". 1 906 2 511 2 602 ... "' . .. -
49 011 191 162 461 792 897 619 7 048 37 446 1 395 46 228 150 119 350 698 814 571 6 675 35 602 I 249 98 463 294 120 578 1 011 1 324 785 11 211 80 220 2 920 2 009
"' ... 1 254 1 277 1 476 1 268 1 591 2 142 2 093 2 130 ... ... . .. 1 448 1 627 1 375 1 680 2 253 2 338
NATIONAL ORIGIN AND LANGUAGE
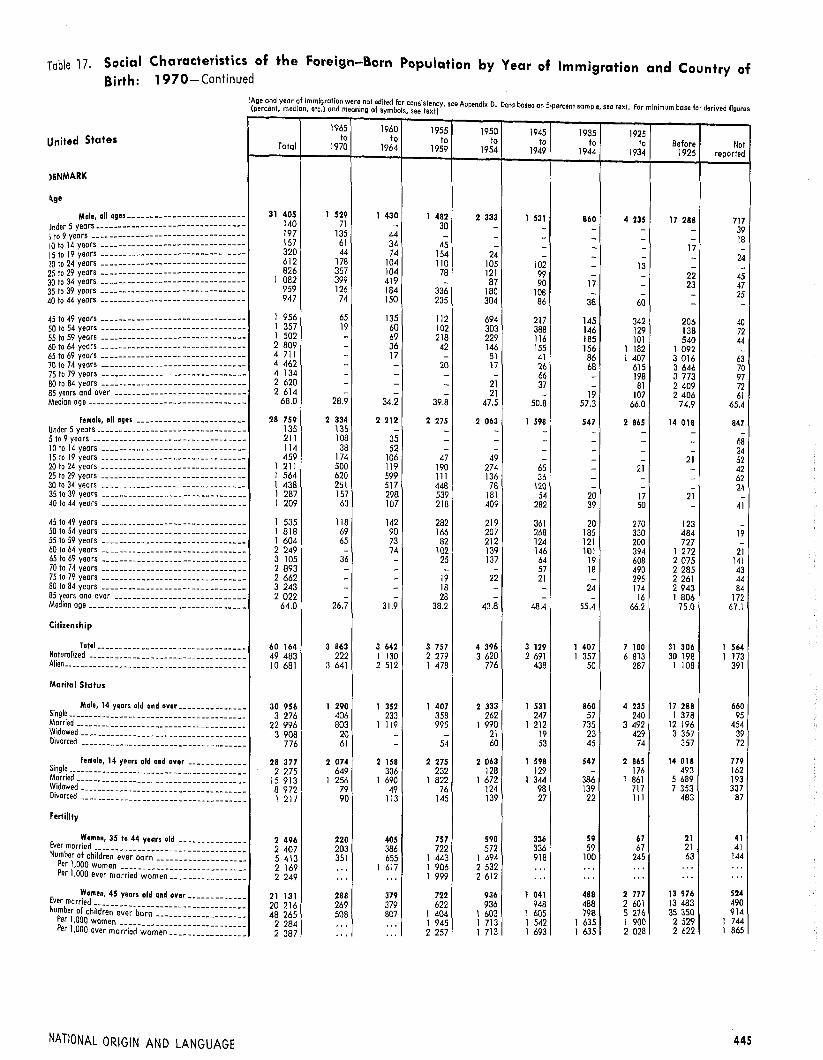
Table 17. Social Characteristics of the Foreign-Born Population by Year of Immigration and Country of Birth: 1970-Continued
United States
)ENMARK
~ge
Male, all ages -- -- -- -- ---- -- ---- ---- -- --Jnder 5 years -- -- -- -- -- -- -- -- -- -- -- - - -- -- -- -- -i to 9 years----------------------------------10 to 14 years --------------------------------15 to 19 years--------------------------------10 to 24 yeors --------------------------------25 to 29 yeors --------------------------------30 to 34 yeors --------------------------------35 to 39 years--------------------------------40 to 44 years --------------------------------
45 to 49 years --------------------------------50 to 54 years--------------------------------55 to 59 years --------------------------------60 to 64 years --------------------------------65 to 69 years--------------------------------70 to 74 years __ ---- -- ____ -- -- -- ---- ____ ---- __ 75to 79 years--------------------------------80 to 84 years -- __ -- _________________________ _
85 years and over ----------------------------Median age-----------------------------------
Female, all ages------------------------Under 5 years ____________________ ---- ________ _
5 to 9 years----------------------------------10 to 14 years--------------------------------15 to 19 years--------------------------------20 to 24 years--------------------------------25 to 29 years ____ -- ---- __ -- ____ ---- _________ _ 30 to 34 years--------------------------------35 to 39 years __ ---- _________________________ _
40 to 44 years--------------------------------
45 to 49 years __ ---- ________ -- -- -- -- _________ _ 50 to 54 years--------------------------------55 to 59 years--------------------------------60 to 64 years ------------------ --------------65 to 69 yeors --------------------------------70 to 74 years--------------------------------75 to 79 years--------------------------------80 to 84 years--------------------------------85 years and over ----------------------------Median age-----------------------------------
Citizenship
Total ________________________________ _ Noturolized _________________________________ _ Alien _______________________________________ _
Marital Status
Mole, 14 years old and over _____________ _ Single---------- ____________________________ _ Married ________________________ ---- ______ -- _ Widowed ________________________ -- ______ -- --Divorced ________________________ ---- _______ _
Fertility
E Women, 35 to 44 years old--------------ver married ________________________________ _
Number of children ever born Per 1,000 women ______ --== == == = = == == :: == :: : Per 1,000 ever married women _______________ _
Women, 45 years old and over ___________ _ Ever married N b --------------------------------
upm e1r0o0f children ever born------------------=
er , 0 women Per 1,000 ever ma;~i;d-~~-;,;-;~=====:::::::::::
NATIONAL ORIGIN AND LANGUAGE
--
-----
-----
----------
1965 to
Total 1970
31 405 1 529 140 71 197 135 157 61 320 44 612 178 826 357
1 082 399 959 126 947 74
l 956 65 l 357 19 l 502 -2 809 -4 711 -4 462 -4 134 -2 620 -2 614 -
68.0 28.9
28 759 2 334 135 135 211 108 114 38 459 174
l 211 500 1 564 620 l 438 251 l 287 157 1 209 63
l 535 118 1 818 69 1 604 65 2 249 -3 105 36 2 893 -2 662 -3 243 -2 022 -
64.0 26.7
60 164 3 863 49 483 222 10 681 3 641
30 956 l 290 3 276 406
22 996 803 3 908 20
776 61
28 377 2 074 2 275 649
15 913 1 256 8 972 79 1 217 \lO
2 496 220 2 407 203 5 413 351 2 169 ... 2 249 ,,,
21 131 288 20 216 269 48 265 508
2 284 ... 2 387 ...
1960 1955 1950 to to to
1964 1959 1954
1 430 1 482 2 333 - 30 -
44 - -34 45 -74 154 24
104 110 105 104 78 121 419 - 87 184 336 180 150 235 304
135 112 694 60 102 303 69 218 229 36 42 146 17 - 81 - 20 \7 - - -- - 21 - - 21
34.2 39.8 47.5
2 212 2 275 2 063 - - -
35 - -52 - -
106 47 49 119 190 274 599 111 136 517 448 78 298 539 181 107 218 409
142 282 219 90 166 207 73 82 212 74 102 139 - 25 137 - - -- 19 22 - 18 -- 28 -
31.9 38.2 43.8
3 642 3 757 4 396 1 130 2 279 3 620 2 512 l 478 776
l 352 l 407 2 333 233 358 262
1 119 995 l 990 - - 21 - 54 60
2 158 2 275 2 063 306 232 128
1 690 1 822 l 672 49 76 124
113 145 139
405 757 590 386 722 572 655 1 443 1 494
l 617 1 906 2 532 ... 1 999 2 612
379 722 936 379 622 936 807 1 404 l 603 . .. 1 945 1 713 ... 2 257 1 713
1945 1935 1925 to to to Before Not
1949 1944 1934 1925 reported
1 531 860 4 235 17 288 717 - - - - 39 - - - - 18 - - - 17 -- - - - 24 102 - 13 - -99 - - 22 45 90 17 - 23 47
108 - - - 25 86 38 60 - -
217 145 342 206 40 388 146 129 138 72 116 185 101 540 44 155 156 1 182 l 092 -
41 86 l 407 3 016 63 26 68 615 3 646 70 66 - 198 3 773 97 37 - 81 2 409 72 - 19 107 2 406 61
50.8 57.3 66.0 74.9 65.4
1 598 547 2 865 14 018 847 - - - - -- - - - 68 - - - - 24 - - - 21 62
65 - 21 - 42 36 - - - 62
120 - - - 24 54 20 17 21 -
282 39 50 - 41
361 20 270 123 -268 185 330 484 19 124 121 200 727 -146 101 394 1 272 21 64 19 608 2 075 141 57 18 490 2 285 43 21 - 295 2 261 44 - 24 174 2 943 84 - - 16 l 806 172
48.4 55.4 66.2 75.0 67.1
3 129 1 407 7 100 31 306 l 564 2 691 1 357 6 813 30 198 l 173
438 50 287 1 108 391
1 531 860 4 235 17 288 660 247 57 240 1 378 95
l 212 735 3 492 12 196 454 19 23 429 3 357 39 53 45 74 357 72
1 598 547 2 865 14 018 779 129 - 176 493 162
1 344 386 1 861 5 689 193 98 139 717 7 353 337 27 22 111 483 87
336 59 67 21 41 336 59 67 21 41 918 100 245 63 144 ... ... ... ... ... ... ... ... ... ...
1 041 488 2 777 13 976 524 948 488 2 601 13 483 490
1 605 798 5 276 35 350 914 1 542 l 635 I 900 2 529 1 744 1 693 l 635 2 028 2 622 l 865
445

Table 17. Social Characteristics of the Foreign-Born Population by Year of Immigration and Country of
Birth: 1970-Continued
United States
NETHERLANDS
Age
Male, all ages _________________________ _
Under 5 yeors---------------------------------5 to 9 years ----------------------------------10 to 14 years--------------------------------15 to 19 years --------------------------------20 to 24 years --------------------------------25 to 29 years -------------- ------------ ---- --30 to 34 years --------------------------------35 to 39 years--------------------------------40 to 44 years --------------------------------45 to 49 years -------------------------------50 to 54 years-------------------------------55 to 59 years -------------------------------60 to 64 years -------------------------------65 to 69 years-------------------------------70 to 74 years -------------------------------75 to 79 years -------------------------------80 to 84 years __ ------------ ------------ ---- -85 years end over ---------------------------Median a9e -- --------------------------------
Female, all ages ----------------------Under 5 years--------------------------------5 to 9 years ---------------------------------10 to 14 years -------------------------------15 to 19 years-------------------------------20 to 24 years-------------------------------25 to 29 years -------------------------------30 to 34 years-------------------------------35 to 39 years -------------------------------40 to 44 years -------------------------------
4510 49 years-------------------------------50 to 54 years -------------------------------55 to 59 years -------------------------------60 to 64 years -------------------------------65 to 69 years -------------------------------70 to 74 years -------------------------------75 to 79 years -------------------------------80 to 84 years -------------------------------85 years and over---------------------------Median age----------------------------------
Citizenship
Total __ -- -- ____ -- ________ ---- _______ _ Naturalized _________________________________ _ Alien -- _____________________________________ _
Marital Status
Male, 14 years old and aver _____________ _ Single ______________________________________ _
Married -------- ______ ------ ____ ------ ______ _ Widowed ______ ------ __________ -------- _____ _ Divorced ___________________________________ _
female, 14 years old and over ___________ _ Single ____________________________ ------ ____ _ Married ________________________ -------- ____ _ Widowed __________ ---------- ------ _________ _ Divorced ___________________________________ _
Fertility
--------------------
----------
---
-----
-----
--
Women, 35 to 44 years old -------------Ever married--------------------------------Number of children ever born------------------
Per 1,000 women----------------------------
Per 1,000 ever married women _______________ _
Women, 45 years old and over ___________ _
Ever married--------------------------------Number of children ever born------------------
Per l,000 women---------------------------Per 1,000 ever married women _______________ _
446
-------
!Age and year of immigration were not edited for consistency, see Appendix D. Data based on 5-percent sample, see text. For minimum base for derived figures (percent median etc} and meaning of symbols, see textl
1965 1960 1955 1950 1945 1935 1925 to to to to to to to Before Not
Total 1970 1964 1959 1954 1949 1944 1934 1925 reported
57 494 4 567 6 646 11 693 6 609 4 257 1 714 3 226 17 524 1 258 358 274 24 24 - - - - - 36 817 474 307 21 - - - - - 15
2 644 384 l 204 904 25 - - - - 127 3 133 215 688 l 572 411 21 18 - - 208 3 078 374 208 l 034 922 407 - 27 - 106 2 948 848 480 654 511 389 23 - - 43 3 934 605 l 053 l 062 448 550 107 - 21 88 3 897 510 777 l 493 692 346 79 - -4 371 373 655 l 568 959 415 -144 183 - 74
4 268 242 488 l 401 846 634 112 302 224 19 3 873 119 415 690 589 580 322 401 757 -3 996 36 167 641 495 459 343 438 l 317 100 4 464 78 60 401 357 194 221 673 2 438 42 4 609 23 47 62 217 168 168 689 3 160 75 3 940 12 38 99 58 37 100 215 3 291 90 3 248 - - 67 40 41 56 139 2 869 36 2 305 - 35 - 39 16 - 82 2 078 55 l 611 - - - - - 21 77 l 369 144
49.2 28.3 32.0 36.9 41.5 45.0 55.B 61.9 71.3 40.4
54 440 5 512 6 936 10 901 5 978 4 314 1 495 2 310 15 704 1 290 308 220 - - - - - - 39 49 807 425 282 14 15 34 - - - 37
2 230 459 l 081 625 24 - - - - 41 2 644 245 656 l 275 340 - - - - 128 3 419 945 333 l 251 544 227 - - - 119 4 185 1 086 l 012 823 552 605 - - 24 83 3 910 710 l 142 l 093 439 426 - - 21 79 3 748 510 750 l 601 555 170 78 - 15 69 4 349 389 590 l 254 l 017 753 145 164 - 37
3 885 128 477 1 297 687 529 172 283 295 17 3 248 110 211 694 621 638 139 310 506 19 3 206 43 181 526 558 322 261 208 l 057 50 4 071 84 105 233 303 346 195 415 2 297 93 3 713 66 42 102 124 128 164 355 2 667 65 3 635 73 20 75 157 72 72 231 2 913 22 2 773 19 - 38 19 42 163 214 2 124 154 2 238 - 23 - 23 22 63 71 l 886 150 2 071 - 31 - - - 43 59 l 860 78
47.l 27.l 30.5 36.2 42.6 44.6 59.l 62.3 71.6 45.9
111 934 10 079 13 582 22 594 12 587 8 571 3 209 5 536 33 228 2 548 77 752 559 3 191 13 911 10 533 7 791 3 080 5 288 31 713 l 686 34 182 9 520 10 391 8 683 2 054 780 129 248 l 515 862
54 567 3 510 5 391 11 221 6 609 4 257 1 714 3 226 17 524 1 115 8 777 l 002 l 497 3 128 l 207 493 130 218 622 480 41 847 2 451 3 728 7 901 5 254 3 576 l 524 2 794 14 156 463
2 948 - 39 44 42 41 18 214 2 425 125 995 57 127 148 106 147 42 - 321 47
51 582 4 425 5 819 10 468 5 939 4 280 1 495 2 310 15 665 1 181 6 138 743 l 180 2 110 872 231 58 60 664 220
34 716 3 365 4 391 7 882 4 488 3 583 l 072 l 699 7 585 651 9 566 162 103 318 454 379 310 481 7 070 289 I 162 155 145 158 125 87 55 70 346 21
8 097 899 1 340 2 855 1 572 923 223 164 15 106 7 705 814 l 226 2 799 l 469 904 223 164 - 106 21 486 1 965 2 897 8 381 4 446 2 585 541 470 - 201 2 654 2 186 2 162 2 936 2 828 2 801 ... - ... 2 789 2 414 2 363 2 994 ". 3 027 2 860 ". ... - '"
28 840 523 1 090 2 965 2 492 2 099 1 272 2 146 15 605 648 27 796 498 l 002 2 890 2 434 2 060 1 214 2 086 14 980 632 84 472 1 372 2 817 9 713 7 338 5 612 2 639 4 427 48 868 l 686 2 929 2 623 2 584 3 276 2 945 2 674 2 075 2 063 3 132 2 602 3 039 2 755 2 811 3 361 3 015 2 724 2 174 2 122 3 262 2 668
NATIONAL ORIGIN AND LANGUAGE
f
' '
r l (
r ('
' r , f I
f
' ( (
~
~
r
f ( (
r ,. r
f r r
r
i r
Table 17. Social Characteristics of the Foreign-Born Population by Year of Immigration and Country of Birth: 1970-Continued
United States
FRANCE
Age
Mala, all ag•'-------------------------Under 5 years---------------------------------5 to 9 years ----------------------------------10to14 years--------------------------------15 to 19 years--------------------------------20 to 24 years--------------------------------25 to 29 years --------------------------------30 to 34 years -- ------ -- -- -- ---- -- -- -------- --35 to 39 years --------------------------------40 to 44 years --------------------------------
45 to 49 years --------------------------------50 to 54 years--------------------------------55 to 59 years--------------------------------60 to 64 years --------------------------------65 to 69 years--------------------------------70 to 74 years--------------------------------75 to 79 years--------------------------------80 to 84 years--------------------------------85 years and over ----------------------------Median age-----------------------------------
Female, all ages-----------------------Under 5 years---------------------------------5 to 9 years ---- ---- -- -- -- -- -- -- ---- -- -- -- -- --10 to 14 years--------------------------------15 to 19 years--------------------------------20 to 24 years ____ -- -- -- -- ______ ---- _________ _
25 to 29 years--------------------------------30to34 years--------------------------------35 to 39 years ____ -- __ -- ________ ---- _________ _
40 to 44 years--------------------------------
45 to 49 years--------------------------------50 to 54 years--------------------------------55 to 59 years--------------------------------60 to 64 years--------------------------------65 to 69 years _______________________________ _
70 to 74 years--------------------------------75 to 79 years--------------------------------80 to 84 years--------------------------------85 years and over ----------------------------Median oge ---------------------------------- -
Citizenship
Total _______________________________ _ ---
Naturolized _________________________________ _ Alien _______________________________________ _
Marital Status
-
Fertility
Women, 35 lo 44 years old ---------------Ever married ________ _ Number of children ever -b~r-;,- -- -- -- -- -- -- - - -- -- - -
Per 1,000 women ________ :::::::::::::::::::: Per 1,000 ever married women __________ ------_
E Women, 45 yeors old and over ____________ _
ver married __ Number of child;e~-e~~;--~ -- -- -- -- -- -- -- -- -- -- --
Per 1,000 women b rn --------------------
Per 1,000 ever m0;;;~ci-~0-;;;n-:::::::::::::::::
NATIONAL ORIGIN AND LANGUAGE
!Age and year of immigration were not edited for conslstenc A d' D D b d (percent. median, etc.) and meaning of symbols, see text I y, see ppen ix • ata ose on S·percent sample, see text. For minimum base for derived figures.
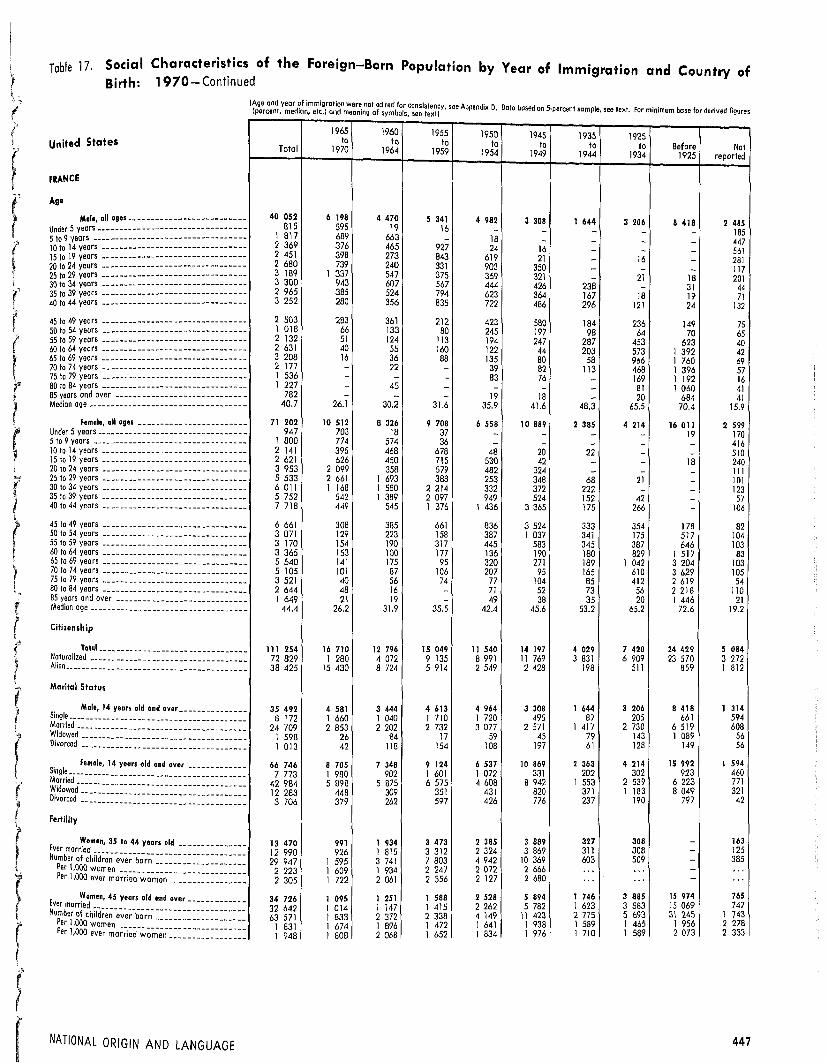
1965 1960 1955 1950 1945 1935 1925 ta ta to to to to to Before Not Total 1970 1964 1959 1954 1949 1944 1934 1925 reported
40 052 6 198 4 470 5 341 4 982 3 308 l 644 3 206 8 418 2 485 815 595 19 16 - - - - - 185 1 817 689 663 - 18 - - - - 447 2 369 376 465 927 24 16 - - - 561 2 451 398 273 843 619 21 - 16 - 281 2 680 739 240 331 903 350 - - - 117 3 189 l 337 547 375 369 321 - 21 18 201 3 300 943 607 567 444 426 238 - 31 44 2 965 385 524 794 623 364 167 18 19 71 3 252 280 356 835 722 486 296 121 24 132
2 503 283 361 212 423 580 184 236 149 75 l 018 66 133 80 245 197 98 64 70 65 2 132 51 124 113 194 247 287 453 623 40 2 631 40 55 160 122 44 203 573 1 392 42 3 208 16 36 88 135 80 58 966 1 760 69 2 177 - 22 - 39 82 113 468 l 396 57 l 536 - - - 83 76 - 169 1 192 16 1 227 - 45 - - - - 81 1 060 41
782 - - - 19 18 - 20 684 41 40.7 26.l 30.2 31.6 35.9 41.6 48.3 65.5 70.4 15.9
71 202 10 512 e 326 9 708 6 558 10 889 2 385 4 214 16 011 2 599 947 703 18 37 - - - - 19 170
I 800 774 574 36 - - - - - 416 2 141 395 468 678 48 20 22 - - 510 2 621 626 450 715 530 42 - - 18 240 3 953 2 099 358 579 482 324 - - - 111 5 533 2 661 l 693 388 253 348 68 21 - 101 6 011 1 168 1 580 2 214 332 372 222 - - 123 5 752 542 l 389 2 097 949 524 152 42 - 57 7 718 449 545 1 376 l 436 3 365 175 266 - 106
6 661 308 385 661 836 3 524 333 354 178 82 3 071 129 223 158 387 l 037 341 175 517 104 3 170 154 190 317 445 583 345 387 646 103 3 365 153 100 177 136 190 180 829 l 517 83 5 540 141 175 95 320 271 189 l 042 3 204 103 5 105 101 87 106 207 95 165 610 3 629 105 3 521 40 56 74 77 104 85 412 2 619 54 2 644 48 16 - 71 52 73 56 2 218 110 1 649 21 19 - 49 38 35 20 1 446 21
44.4 26.2 31.9 35.5 42.4 45.6 53.2 65.2 72.6 19.2
111 254 16 710 12 796 15 049 11 540 14 197 4 029 7 420 24 429 5 084 72 829 l 280 4 072 9 135 8 991 11 769 3 831 6 909 23 570 3 272 38 425 15 430 8 724 5 914 2 549 2 428 198 511 859 1 812
35 492 4 581 3 444 4 613 4 964 3 308 1 644 3 206 8 418 l 314 8 172 l 660 1 040 1 710 l 720 495 87 205 661 594
24 709 2 853 2 202 2 732 3 077 2 571 l 417 2 730 6 519 608 l 598 26 84 17 59 45 79 143 l 089 56 1 013 42 118 154 108 197 61 128 149 56
66 746 8 705 7 348 9 124 6 537 10 869 2 363 4 214 15 992 1 594 7 773 l 980 902 l 601 1 072 331 202 302 923 460
42 984 5 898 5 875 6 575 4 608 8 942 l 553 2 539 6 223 771 12 283 448 309 351 431 820 371 l 183 8 049 321 3 706 379 262 597 426 776 237 190 797 42
13 470 991 1 934 3 473 2 385 3 889 327 308 - 163
12 990 926 1 815 3 312 2 324 3 869 311 308 - 125 29 947 l 595 3 741 7 803 4 942 10 369 603 509 - 385 2 223 1 609 1 934 2 247 2 072 2 666 ... " . - ... 2 305 1 722 2 061 2 356 2 127 2 680 ... ... - . "
34 726 1 095 1 251 l 588 2 528 5 894 1 746 a ass 15 974 765
32 642 l 014 l 147 1 415 2 262 5 782 1 623 3 583 15 069 747
63 571 1 833 2 372 2 338 4 149 11 423 2 775 5 693 3\ 245 1 743
1 831 l 674 l 896 1 472 l 641 l 938 1 589 1 465 1 956 2 278
1 948 1 808 2 068 l 652 1 834 l 976 l 710 1 589 2 073 2 333
447

Table 17. Social Characteristics of the Foreign-Born Population by Year of Immigration and Country of Birth: 1970-Continued
United States
GERMANY
Age
Mala, all ag11 _________________________ _
Under 5 years---------------------------------5 to 9 years ----------------------------------10 to 14 years --------------------------------15 to 19 years--------------------------------20 to 24 years--------------------------------25 to 29 years-------------------------------30 to 34 years --------------------------------35 to 39 years -------------------------------40 to 44 years -------------------------------
-
--
45 to 49 years -------------------------------50 to 54 years-------------------------------55 to 59 years -------------------------------60 to 64 years-------------------------------65 to 69 years-------------------------------70 to 74 years-------------------------------75 to 79 years -------------------------------80 to 84 years -------------------------------85 years and over __ ------ --------------------Median age -- ---- ____ ---- --------------------
Female, all ages ----------------------Under 5 years--------------------------------5 to 9 years ---------------------------------10 to 14 years -------------------------------15 to 19 years -------------------------------20 to 24 years-------------------------------25 to 29 years -------------------------------30 to 34 years -------------------------------35 to 39 years -------------------------------40 to 44 years -------------------------------
45 to 49 years -------------------------------50 to 54 years -------------------------------55 to 59 years -------------------------------60 to 64 years -------------------------------65 to 69 years -------------------------------70 to 74 years -------------------------------75 to 79 years -------------------------------80 to 84 years -------------------------------85 years and over ----------------------------Median age -- ________ ---- --------------------
Citizenship
Total __ ------------------------------Naturalized ______ ---- ------ ------------------Alien __ ---- -- ______ -- ---- -- ------------------
Marital Status
Male, 14 years aid and over--------------
------------------------------
---
-Single ______ ---- __ ---------------------------Married ________________ ----------------------Widowed ______ -------------- -- ---- ------ -- __ Divorced ______ -------- ______ ------------ ___ _
---
Female, 14 years old and over------------Single ______________________________________ _
Married ------ ---- ------ __ ---------------- __ _
--
Widowed ------ ------ -------- ------------ ----Divorced ________ ------------ ______ ------ ----
---
Fertility
---
Women, 35 to 44 years old -------------Ever married--------------------------------Number of children ever born------------------
Per l.000 women __ ------ __ ------------------Per 1,000 ever married women ________ ------ __ -Women, 45 years old and over __________ _
Ever married------------------------------------Number of children ever born------------------
Per 1,000 women--------------------------Per 1,000 ever married women----------------
---
448
!Ave and year of immigration were not edited for consistency, see Appendix D. Data based on S·percent sample, see text. For minimum base for derived figures (percent median etc) and meaning of symbols, see t-extJ
1965 1960 1955 1950 1945 1935 1925 to to to to to to to Before Not Total 1970 1964 1959 1954 1949 1944 1934 1925 reported
357 826 23 460 30 012 47 267 49 705 20 658 26 023 67 533 78 815 14 353 5 371 3 436 137 57 35 - - - 25 1 681
12 431 5 087 4 177 154 19 65 - - - 2 929 15 379 1 442 4 938 5 810 246 - - 21 125 2 797 16 185 1 107 1 811 6 886 4 768 82 20 89 64 1 358 29 751 1 169 1 817 4 857 13 507 6 705 155 45 41 I 455 17 059 3 257 3 449 3 276 4 900 1 442 71 57 62 545 3 676 4 901 6 132 2 831 715 905 131 35 223 19 549 18 398 1 783 3 545 5 657 4 204 916 1 613 294 78 308 20 465 830 2 048 5 379 5 661 I 521 2 898 1 902 54 172
22 250 536 l 114 3 511 4 021 2 378 3 701 4 825 1 975 189 12 741 331 664 1 499 2 612 1 018 2 079 3 064 1 379 95 19 928 280 636 1 487 2 383 1 567 3 971 5 888 3 520 196 39 808 185 341 1 440 2 351 l 607 2 947 20 790 9 554 593 42 307 166 216 599 I 159 1 092 3 239 18 656 16 749 431 26 002 87 23 271 673 726 2 235 7 222 14 283 482 17 549 47 59 97 222 520 l 009 2 715 12 637 243 12 924 41 34 100 78 163 707 1 202 10 367 232 9 729 - 102 55 35 141 473 632 7 867 424 50.8 22.8 28.1 32.1 32.4 41.3 57.0 64.2 72.0 14.6
516 283 45 716 58 363 83 280 78 967 38 229 31 618 68 022 94 688 17 400 6 056 3 575 135 81 41 - - 20 21 2 183
10 776 3 608 4 038 138 79 12 - 26 22 2 853 14 293 1 730 4 016 5 788 233 24 21 42 22 2 417 15 908 1 720 l 557 6 486 4 771 78 23 55 57 l 161 39 739 9 034 2 704 5 243 14 712 6 476 61 79 86 I 344 37 978 12 337 14 159 4 614 4 712 1 111 84 129 104 728 45 872 6 266 14 809 18 434 3 863 890 1 007 124 59 420 36 796 2 563 5 798 14 769 9 819 1 753 l 425 241 86 342 47 801 1 437 4 IDB 11 457 15 235 9 794 2 709 2 397 115 549
40 043 953 2 709 6 599 10 558 7 260 4 067 5 046 2 315 536 21 175 568 1 192 2 673 4 730 2 877 3 384 3 419 I 932 400 25 336 627 997 2 587 3 370 2 249 4 248 7 168 3 643 447 40 045 389 972 1 720 2 776 1 958 4 517 17 880 9 281 552 43 139 248 484 1 496 I 908 l 335 3 695 16 014 17 202 757 33 245 295 354 587 I 212 l 044 2 780 9 419 16 738 816 24 328 187 228 272 541 660 1 806 4 067 16 014 553 17 750 86 65 142 124 365 1 186 I 366 13 939 477 16 003 93 38 194 283 343 605 530 13 052 865 45.4 26.3 30.9 35.3 40.4 44.5 58.6 64.3 73.7 20.3
874 109 69 176 88 375 130 547 128 672 58 887 57 641 135 SSS 173 503 31 753 677 168 11 726 36 557 88 392 105 603 55 298 56 935 131 501 168 485 22 671 196 941 57 450 51 818 42 155 23 069 3 589 706 4 054 5 018 9 082
327 932 13 799 21 335 42 932 49 436 20 593 26 023 67 533 78 722 7 559 59 642 4 362 6 127 13 615 16 629 5 726 1 428 3 693 4 492 3 570 239 796 9 136 14 407 28 162 31 254 14 012 23 171 58 209 58 258 3 187 21 991 148 191 310 343 432 1 049 4 262 14 635 621 6 503 153 610 845 1 210 423 375 1 369 1 337 181
487 981 37 121 50 581 78 898 78 665 38 193 31 618 67 953 94 645 10 307 52 251 4 193 4 673 12 023 12 480 4 177 2 192 3 680 5 982 2 851 324 909 30 470 42 095 59 943 58 311 28 091 20 795 44 690 36 006 4 508 93 081 1 558 1 774 3 238 4 814 3 698 7 569 17 744 50 100 2 586 17 740 900 2 039 3 694 3 060 2 227 1 062 1 839 2 557 362
84 597 4 000 9 906 26 226 25 054 11 547 4 134 2 638 201 891 82 059 3 751 9 355 25 461 24 725 11 323 3 955 2 524 168 797 179 876 7 154 16 605 53 604 55 983 28 534 9 161 6 551 562 I 722 2 126 1 789 1 676 2 044 2 234 2 471 2 216 2 483 ... 1 933 2 192 1 907 1 775 2 105 2 264 2 520 2 316 2 595 ... 2 161
261 064 3 446 7 039 16 270 25 502 18 091 26 288 64 909 94 116 5 403 245 736 3 103 6 574 15 259 24 508 17 174 24 445 61 462 88 275 4 936 477 546 5 654 12 845 26 901 43 197 30 045 35 784 101 470 211 296 10 354 1 829 1 641 l 825 1 653 1 694 1 661 1 361 1 563 2 245 l 916 1 943 l 822 1 954 1 763 1 763 1 749 1 464 1 651 2 394 2 098
NATIONAL ORIGIN AND LANGUAGE
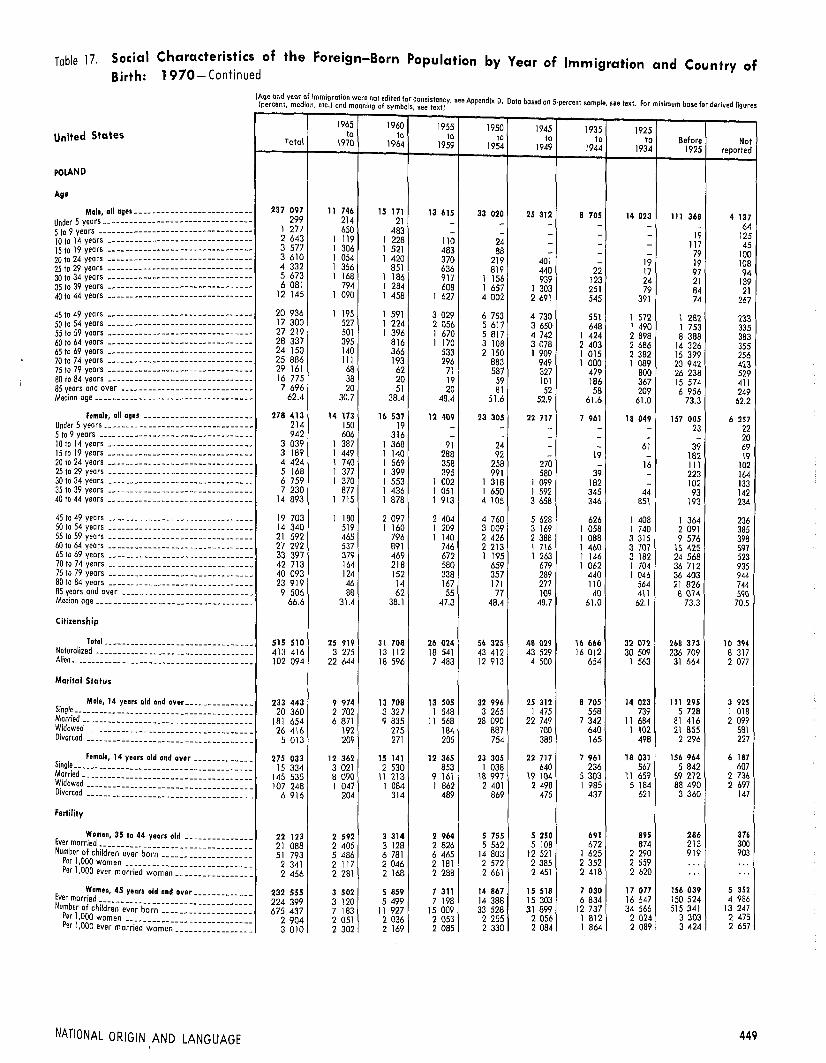
Table 17, Social Characteristics of the Foreign-Born Population by Year of lmmigrQtion and Country of Birth: 1970- Continued
United States
POLAND
Age
Mala, all ages -- -- -- -- -- -- ---- ---- -- -- -Under 5 years -- -- ---- -- ---- -- -- -------- ---- ---5 to 9 years----------------------------------10 to 14 years --------------------------------15to19 years--------------------------------20to 24 years--------------------------------25 to 29 years --------------------------------30 to 34 years --------------------------------35 to 39 years -- -- -- -- -- -- -- -- -- -- -- -- -- -- -- --40 to 44 years --------------------------------
45 to 49 years --------------------------------50to 54 years--------------------------------55to 59 years--------------------------------60 to 64 years -- -- -- -- -- -- -- -- -- -- -- -- -- -- -- --65 to 69 years--------------------------------7010 74 years--------------------------------75to 79 years--------------------------------80 to 84 years -- ---- -- -- -- -- ---- -- -- ---- -- -- --85 yeors and over-----------------------------Median age-----------------------------------
Female, all ages------------------------Under 5 years __ -- ---- ____ -- ____________ •• ___ _ -5 to 9 years ··-- ----·- ---- -- ---- -----· -- -- __ •• !Oto 14 years-------------------------------· 15to 19 years--------------------------------20 to 24 years --------------------------------25 to 29 years--------------------------------30 to 34 years __ -- ____ -- -· -· -- -- -- __ -- -- •. ___ _ 35 to 39 years--------------------------------40 to 44 years __ -- __ -- -- ______________ -- •. ___ _
45 to 49 years-------------------------------50 to 54 years ------·------------------------55 to 59 years -------------------------------60 to 64 years -------------------------------65 to 69 years -------------------------------70 to 74 years -------------------------------75 to 79 years -------------------------------80 to 84 years -------------------------------85 years and over---------------------------Median age----------------------------------
Citizenship
Total _______________________________ _ Naturalized _________________________________ _
Alien •..• ____________ -- ________ -- -- __ -- -- -- --
Marital Status
Mola, 14 years aid and over _____________ _ Single ______________________________________ _ Married ____________________________________ _ Widowed __ ------ ___________________________ _ Divorced ______________________________ -- -- --
Fertility
E Women, 35 lo 44 years old --------------ver married ________________________________ _
----------
---
-----
-----
--Nupmber of children ever born-------------------
er 1,000 women----------------------------
Per 1,000 ever married women _______________ _
Women, 45 years old and over ___________ _ Ever married N b f ---------------------------------
upm e1r
0o children ever born------------------
er , 00 women Per 1,000 ever mo~~i~d-.:;,~-;;;~::::::::::::::::
NATIONAL ORIGIN AND LANGUAGE
--
-----
1965 to
Total 1970
237 097 11 746 299 214
l 277 650 2 643 I 119 3 577 l 306 3 610 I 054 4 332 I 356 5 673 l 168 6 081 794
12 145 l 090
20 936 l 195 17 300 527 27 219 501 28 337 395 24 150 140 25 886 111 29 161 68 16 775 38 7 696 20
62.4 30.7
278 413 14 173 214 150 942 606
3 039 l 387 3 189 I 449 4 424 l 740 5 168 l 377 6 759 l 370 7 230 877
14 893 l 715
19 703 l 180 14 340 519 21 592 465 27 292 537 33 397 379 42 713 164 40 093 124 23 919 46 9 506 aa
66.6 31.4
515 510 25 919 413 416 3 275 102 094 22 644
233 443 9 974 20 360 2 702
181 654 6 871 26 416 192
5 013 209
275 033 12 362 15 334 3 021
145 535 8 090 107 248 l 047
6 916 204
22 123 2 592 21 088 2 405 51 793 5 486
2 341 2 117 2 456 2 281
232 555 3 502 224 399 3 120 675 437 7 183
2 904 2 051 3 010 2 302
1960 1955 1950 to to to
1964 1959 1954
15 171 13 615 33 020 21 - -
483 - -l 228 110 24 l 521 483 88 l 420 370 219
851 636 819 l 186 917 l 156 l 284 608 l 657 l 458 l 627 4 002
l 591 3 029 6 753 l 224 2 056 5 617 l 396 l 670 5 817
816 l 170 3 108 366 533 2 150 193 296 883 62 71 587 20 19 59 51 20 81
38.4 48.4 51.6
16 537 12 409 23 305 19 - -
316 - -l 368 91 24 I 140 288 92 l 569 358 258 l 399 395 991 I 553 l 002 l 318 l 436 1 051 l 650 l 878 l 913 4 105
2 097 2 404 4 760 I 160 l 209 3 009
796 I 140 2 426 891 746 2 213 469 672 l 195 218 580 659 152 338 357 14 167 171 62 55 77
38. l 47.3 48.4
31 708 26 024 56 325 13 112 18 541 43 412 18 596 7 483 12 913
13 708 13 505 32 996 3 327 l 548 3 265 9 835 11 568 28 090
275 184 887 271 205 754
lS 141 12 365 23 305 2 530 853 l 038
11 213 9 161 18 997 l 084 I 862 2 401
314 489 869
3 314 2 964 5 755 3 128 2 826 5 562 6 781 6 465 14 803 2 046 2 181 2 572 2 168 2 288 2 661
5 859 7 311 14 867 5 499 7 198 14 388
11 927 15 009 33 528 2 036 2 053 2 255 2 169 2 085 2 330
1945 1935 1925 to to to Before Not
1949 1944 1934 1925 reported
25 312 8 105 14 023 111 368 4 137 - - - 64 -- - - 19 125 - - - 117 45 - - - 79 100 401 - 19 19 108 440 22 17 97 94 939 123 24 21 139
l 303 251 79 84 21 2 691 545 391 74 267
4 730 551 l 572 l 282 233 3 650 648 l 490 l 753 335 4 742 l 424 2 898 8 388 383 3 078 2 403 2 686 14 326 355 l 909 I 015 2 382 15 399 256
949 l 000 l 089 20 942 423 327 479 800 26 238 529 101 186 367 15 574 411 52 58 209 6 956 249
52.9 61.6 61.0 73.3 62.2
22 717 7 961 18 049 157 005 6 257 - - - 23 22 - - - - 20 - - 61 39 69 - 19 - 182 19
270 - 16 111 102 580 39 - 223 164
l 099 182 - 102 133 l 592 345 44 93 142 3 658 346 851 193 234
5 628 626 l 408 I 364 236 3 169 l 058 l 740 2 091 385 2 388 l 088 3 315 9 576 398 I 716 l 460 3 707 15 425 597 l 263 l 146 3 182 24 568 523
679 l 062 1 704 36 712 935 289 440 l 046 36 403 944 277 110 564 21 826 744 109 40 411 8 074 5%
48.7 61.0 62.1 73.3 70.5
48 029 16 666 32 072 268 373 10 394 43 529 16 012 30 509 236 709 8 317
4 500 654 1 563 31 664 2 077
25 312 8 705 14 023 111 295 3 925 l 475 558 739 5 728 l 018
22 749 7 342 11 684 81 416 2 099 700 640 l 102 21 855 58\ 388 165 498 2 296 227
22 717 7 961 18 031 156 964 6 187 640 236 567 5 842 607
19 104 5 303 11 659 59 272 2 736 2 498 I 985 5 184 88 490 2 697
475 437 621 3 360 147
5 250 691 895 286 376 5 108 672 874 213 300
12 521 1 625 2 290 919 903 2 385 2 352 2 559 ... ... 2 451 2 418 2 620 ... " '
15 518 7 030 17 077 156 039 5 352 15 303 6 834 16 547 150 524 4 986 31 899 12 737 34 566 515 341 13 247
2 056 l 812 2 024 3 303 2 475 2 084 l 864 2 089 3 424 2 657
449

Table 17. Social Characteristics of the Foreign-Born Population by Year of Immigration and Country of
Birth: 1970-Continued
United States
CZECHOSLOVAKIA
Age
Male, all ages__---------------------- __ Under 5 years-------------------- -- ---- -------5 to 9 years ----------------------------------10 to 14 yeors --------------------------------15 to 19 years --------------------------------20 to 24 years--------------------------------25 to 29 years --------------------------------30 lo 34 years --------------------------------35 to 39 years --------------------------------40 to 44 years --------------------------------
45 to 49 years --------------------------------50 to 54 years -------------------------------55 to 59 years -------------------------------60 to 64 years -------------------------------65 to 69 years -------------------------------70 to 74 years -------------------------------75 ta 79 yeors -------------------------------80 to 84 years -------------------------------85 years and Gver ----------------------------
--------
Median age ____ ------ __ -- __ ---- --------------
female, oll ogu ----------------------Under 5 years--------------------------------5 to 9 years ---------------------------------10 to 14 years -------------------------------15 to 19 years -------------------------------20 to 24 years-------------------------------25 to 29 years -------------------------------30 to 34 years -------------------------------35 to 39 years -------------------------------40 to 44 years -------------------------------
45 to 49 years-------------------------------50 ta 54 years -------------------------------55 to 59 years -------------------------------60 to 64 years-------------------------------65 to 69 years -------------------------------70 to 74 years -------------------------------75 to 79 years -------------------------------80 to 84 years -------------------------------85 years and over----------------------------Median age ______________ ------ ------------ __
Citilenship
Totol ____________________ ---- _______ _ Noturo Ii zed _________________________________ _ Alien __________________ -- ____ ---- ------ ---- __
Marital Status
Male, 14 years old and over ________ ---- __
-----------
----------
---
-Single ____________________________ -----------Married ____________________________________ _ -
-Widowed ________________ ------ ______ ---- ___ _ Divorced ___________________________________ _ -
-
Female, 14 years old ond over------------Single ______________________________________ _
Married ____ -- ________ ------ ______ -----------
--
Widowed ______ ---- ________ ------------ ------Divorced ___________________________________ _
Fertility
Women, 35 ta 44 yean old -------------Ever married---------------------------------Number of children ever born __________________ _
---
---Per 1,000 women-------------------------
Per l,000 ever married women------------------
Women, 45 yeors old and over ___ ~--------Ever married---·----------------------------Number of children ever born------------------
Per l,000 women---------------------------Per 1,000 ever married women _______________ _
450
------
IAge ond year of immigration were not edited for con6\stem:.y, see Appendix D. Doto bosed on 5-percent sample, see text. For minimum base for derl~l!d {igurei ( ercent median etc) and meoning of symbols, see text! p
1965 1960 1955 1950 1945 1935 1925 to to to to to to to Before Not Total 1970 1964 1959 1954 1949 1944 1934 1925 re~~!l~d
69 846 5 714 2 592 4 211 5 184 5 650 4 052 5 324 35 421 1 6U 314 250 - - - 23 - - - 41 415 318 39 - - - - - - 58 317 212 40 17 - - - - - 48 356 169 70 - - - - - 20 97 1 977 848 224 281 224 333 - - 44 23 l 714 832 175 184 277 120 21 - 44 61 l 813 845 206 288 176 193 68 - - 37 2 564 726 231 485 389 373 160 64 77 59 4 237 609 239 883 990 929 248 160 42 137
6 257 534 522 765 945 l 135 792 l 049 400 115 3 487 161 194 256 540 690 323 574 662 87 5 672 82 246 413 670 742 639 630 2 193 57 7 479 59 199 343 394 615 797 489 4 381 202 8 087 15 83 166 354 261 510 960 5 609 129 8 878 46 34 97 117 103 213 945 7 130 193 7 451 18 13 33 64 133 175 249 6 647 119 5 894 - 18 - 23 - 34 164 5 520 135 2 934 - 59 - 21 - 72 40 2 652 90 63.9 31.4 45.7 44.8 47.8 48.8 58.2 61.9 73.0 60.6 89 549 5 852 2 858 4 809 5 198 6 243 5 463 7 361 49 672 2 093 308 308 - - - - - - - -325 290 - 15 - - - - - 20 158 98 18 12 - - - - - 30 489 265 48 59 19 - - - 60 38 l 916 1 070 112 309 209 128 18 - 16 54 2 548 l 149 517 243 344 169 - - 43 83 2 162 796 404 382 105 190 198 - 44 43 2 416 461 204 659 441 340 170 18 61 62 5 604 484 437 1 090 1 400 I 467 381 259 43 43
7 363 417 502 947 918 l 743 l 030 1 316 431 59 3 606 176 120 423 383 610 704 552 602 36 5 581 82 167 223 216 422 854 798 2 708 111 7 801 94 137 93 396 286 660 l 434 4 342 359 12 726 35 140 109 317 394 702 l 527 9 226 276 13 261 61 17 126 246 280 385 836 l I 117 193 11 217 21 35 99 130 77 180 239 10 127 309 7 623 - - - 38 81 94 283 6 963 164 4 445 45 - 20 36 56 87 99 3 889 213 66.8 28.9 41.4 43.3 45.4 47.4 56.3 62.6 73,3 67.0
159 395 11 576 5 450 9 020 10 382 11 893 9 515 12 685 85 093 3 781 135 510 1 172 2 876 7 306 9 080 l l 329 9 219 12 080 79 723 2 725 23 885 10 404 2 574 1 714 l 302 564 296 605 5 370 I 056
68 846 4 967 2 513 4 194 5 184 s 627 4 052 5 324 35 421 1 564 6 525 l 339 436 608 636 444 257 300 2 006 499 52 773 3 483 1 998 3 392 4 102 4 869 3 409 4 595 26 053 B/2 8 043 27 40 93 215 169 242 313 6 775 169 l 505 118 39 101 231 145 144 l 16 587 24 88 788 5 156 2 840 4 782 s 198 6 243 5 463 7 361 49 672 2 073 3 892 975 181 317 175 270 l 18 204 1 342 310 47 692 3 809 2 166 3 972 4 346 4 919 4 130 4 471 18 917 962 34 895 160 329 394 506 872 1 070 2 480 28 346 738 2 309 212 164 99 171 182 145 206 l 067 63
8 020 945 641 l 749 l 841 l 807 551 277 104 10S 7 665 905 641 1 683 1 800 l 720 551 197 85 83 17 244 l 401 1 278 3 405 4 100 4 957 l 136 455 339 173 2 l 50 I 483 1 994 1 947 2 227 2 743 2 062 ... ... ... 2 250 l 548 l 994 2 023 2 278 2 882 2 062 ... ... ... 73 623 931 l 118 2 040 2 680 3 949 4 696 7 084 49 405 l 720 71 696 767 l 118 l 980 2 662 3 933 4 596 6 960 48 102 1 578 217 246 l 315 I 824 3 533 5 613 7 107 9 294 16 559 166 918 5 083 2 951 l 412 l 631 l 732 2 094 l 800 l 979 2 338 3 379 2 955 3 030 1 714 1 631 1 784 2 109 l 807 2 022 2 379 3 470 3 221
NATIONAL ORIGIN AND LANGUAGE

Table 17. Social Characteristics of the Foreign-Born Population by Year of Immigration and Country of Birth: 1970- Continued
United States
AUSTRIA
Age
Male, all aues-------------------------Under 5 years -- -- ---- -- -- -- -- -- -- ------ ---- -- -5 to 9 years ----------------------------------10 to 14 years --------------------------------15 to 19 years --------------------------------20 to 24 years -- -- -- -- -- -- -- -- -- -- -- -- -- -- -- --25 to 29 years--------------------------------30to 34 years--------------------------------3510 39 years --------------------------------40 to 44 years --------------------------------
45 to 49 years --------------------------------50 to 54 years--------------------------------55 to 59 years --------------------------------60 to 64 years -- -- -- -- -- -- -- -- -- -- ______ -- ___ _ 65 to 69 years --------------------------------70 to 74 years --------------------------------75 to 79 years --------------------------------80 to 84 years--------------------------------85 years and over-----------------------------Median age-----------------------------------
female, all ages------------------------Under 5 years __________________ -- ____________ _
5 to 9 years ----------------------------------10 to 14 years --------------------------------15to19 years--------------------------------20 to 24 years ______ -- -- -- -- -- -- -- ___________ _ 25 to 29 years--------------------------------3010 34 years--------------------------------35 ta 39 years --------------------------------40 to 44 years ________________ -- -- -- _________ _
45 to 49 years--------------------------------50 to 54 years ------------------------------ __ 55 to 59 years--------------------------------60to 64 years--------------------------------65 to 69 years--------------------------------7010 74 years--------------------------------75 to 79 years--------------------------------80 to 84 years--------------------------------85 years ond over ____________________________ _ Median oge ______________________ ------ ______ _
Citizenship
Total-------- ________________________ _ Naturalized __________________________________ _ Alien ________________________________________ _
Marital Status
Mole, 14 years old and over ____________ _ Single ____________________________________ -=-= Married _____________________________________ _
~~:o,~:~ == :::: :: :: :: :: :: :: :: :: :: == :: :: :: :: :: :
Sin le Female, 14 years old and over ____________ _
~~~~~~j=;~;~;~; ~; ~;~; ~; ~ ;~; ~; ~; ~; ~ ;~; ~; ~; ~; ~; Fertility
E Wamen, 35 to 44 years old---------------ver married
Number of child;;;""e~~;-b-;;-r~- -- -- -- -- -- ---- -- -- --Per 1,000 women --------------------
Per 1,000 ever mo;;;~~(;;,~-;;;;:::============== Women, 45 years old and over ____________ _
Ever married _________________________________ _ Number af children ever born
Per 1,000 women --------------------Per 1,000 ever ma;;i~d-;;,~-;;;;:::::============
NATIONAL ORIGIN AND LANGUAGE
\Age ond Y•or of imm\grotlon were not edited for consist A d' o o b (percent, median, etc.) ond meaning of symbols, see te~~fY· see ppen IX • ate osed on 5-percent sample, see text. for minimum base for de-rived figures
1965 1960 1955 1950 1945 1935 1925 to to to to to to lo Before Not Total 1970 1964 1959 1954 1949 1944 1934 1925 reported
93 387 2 862 2 940 5 740 4 841 2 938 9 993 4 273 57 529 2 271 239 152 16 - - - - - 71 443 284 74 -- - - - - - 85 1 002 216 197 531 19 - - - - 39 1 889 35 216 I 094 359 - - - 47 138 4 148 306 248 1 108 1 511 715 23 - 20 217 1 906 750 420 249 284 142 20 - 41 1 689 434 -320 256 130 63 359 - 24 103 1 920 229 377 361 100 109 580 79 21 64 2 412 57 372 676 135 216 840 35 19 62
3 823 45 278 499 583 204 l 396 404 358 56 2 531 92 95 138 255 223 891 172 585 80 5 994 163 103 263 346 413 I 311 577 2 699 119 9 925 - 81 342 392 295 l 733 l 042 5 893 147
13 658 58 62 60 334 260 l 256 915 10 492 221 14 716 - 42 87 208 152 920 529 12 558 220 13 336 21 23 76 34 91 424 326 12 161 180 9 413 20 16 - 60 55 202 133 8 653 274 4 343 - - - 91 - 38 61 3 958 195
68.2 27.9 34.7 27.8 40.6 50.4 58.4 64.2 73.4 63.5
125 562 3 133 3 649 6 928 7 444 6 957 10 108 5 354 79 234 2 755 93 74 - - - - - - - 19
289 90 147 - - 18 19 - - 15 603 55 100 376 - - 21 19 - 32
2 142 128 137 1 106 637 - - - 24 110 4 544 725 204 911 1 666 740 - 19 167 112 2 779 859 570 435 460 191 47 - 132 85 2 339 392 573 425 215 116 322 - 192 104 2 787 134 556 995 401 163 389 18 25 106 5 264 140 404 867 I 112 l 791 742 106 43 59
4 886 169 259 351 860 l 223 l 110 422 389 103 3 558 82 125 416 404 553 897 227 840 14 6 427 56 195 235 387 517 1 434 724 2 784 95
11 6 I 2 39 83 230 491 424 l 478 995 7 674 198 19 263 90 121 338 313 532 l 485 1 221 14 896 267 21 983 61 84 143 327 324 1 182 876 18 545 441 18 352 39 22 40 79 119 567 345 16 852 289 12 535 - 44 44 76 170 240 277 11 312 372 6 106 - 25 16 16 76 175 105 5 359 334
69.0 27.9 35.8 36.1 41.5 46.9 60.2 65.6 73.4 70.7
218 949 5 995 6 5119 12 668 12 285 9 895 20 \0\ q 617 136 H.3 s 0% 190 290 508 2 613 0 339 10 020 8 962 19 846 9 062 127 162 3 778 28 659 5 487 3 976 4 329 2 265 933 255 565 9 601 1 248
92 072 2 272 2 719 5 450 4 822 2 938 9 993 4 273 57 529 2 076 10 663 701 660 2 356 l 652 686 583 135 3 312 578 66 780 1 458 1 949 2 881 2 809 2 108 8 889 3 603 41 893 l 190 12 611 42 41 61 221 106 277 445 11 152 266 2 018 71 69 152 140 38 244 90 l 172 42
124 679 2 914 3 402 6 635 7 444 6 939 10 068 5 354 79 234 2 689 8 217 472 317 1 589 1 362 511 486 294 2 851 335
59 772 2 219 2 564 4 296 5 059 5 106 6 956 3 311 29 114 1 147 53 010 164 266 447 790 858 2 297 I 643 45 418 1 127 3 680 59 255 303 233 464 329 106 1 851 80
8 051 274 960 1 862 1 513 1 954 1 131 124 68 165 7 749 256 900 1 797 1 513 l 909 1 088 124 45 117
18 228 487 l 344 4 184 3 779 5 098 2 468 422 95 351 2 264 ... 1 400 2 247 2 498 2 609 2 182 ... ... ... 2 352 ... l 493 2 328 2 498 2 671 2 268 ... ... ...
104 722 536 958 1 813 2 953 3 938 8 568 s 192 78 651 2 113
100 832 536 917 l 794 2 828 3 690 8 173 4 898 76 012 l 984
268 993 985 1 129 2 806 4 845 5 882 11 522 10 028 225 687 6 109 2 569 1 838 1 \78 1 548 \ 641 1 494 1 345 1 931 2 869 2 89\
2 668 l 838 1 231 l 564 1 713 1 594 1 410 2 047 2 969 3 079
451

Tobie 17. Social Characteristics of the Foreign-Born Population by Year of Immigration and Country of Birth: 1970-Con1inued
United States
HUNGARY
Age
Male, all ages _________________________ _
Under 5 yeors---------------------------------5 to 9 years ----------------------------------10 to 14 years --------------------------------15 to 19 years --------------------------------20 to 24 years --------------------------------25 to 29 years ______ ---- -------------------- __ 30 to 34 years --------------------------------35 to 39 years -------------------------------40 to 44 years -------------------------------
--45 to 49 years -------------------------------50 to 54 years-------------------------------55 to 59 years -------------------------------60 to 64 years -------------------------------65 to 69 years -------------------------------70 to 74 yeors -------------------------------75 to 79 years -------------------------------80 to 84 years -------------------------------
--------
85 years and over ----------------------------Median age ______________ -------------------- --
--Female, all ages ----------------------Under 5 years--------------------------------5 to 9 years ---------------------------------10 to 14 years -------------------------------15 to 19 years -------------------------------20 to 24 years-------------------------------25 to 29 years __ -----------------------------30 to 34 years -------------------------------35 to 39 years -------------------------------40 to 44 years -------------------------------
-------------
45 to 49 years -------------------------------50 to 54 years -------------------------------55 ta 59 years -------------------------------60 to 64 years -------------------------------65 to 69 years -------------------------------70 to 74 years -------------------------------75 to 79 years -------------------------------80 to 84 years -------------------------------85 years and over---------------------------Median age----------------------------------
-----
Citizenship
Total ____________ ·- _________________ _ Naturalized ____ • _ ----. ______________________ _
Alien ________ ---------------- ____ ------------
---
Marital Status
Male, 14 years old and aver _____________ _ Single _________ • __ -- ____________ ---- ________ •
Married •• -- ____ ------ __ ---- ---- ------ ---- __ _ Widnwed ______ ------ ------ ------ ------ _____ _ Divorced __ -- ____ -- ______________ ---- _. __ -- __
-----
Female, 14 years old and over------------Single ______________________________________ _
Married ________________ ---- ------------ ---- _ Widowed ______ ------ ____________ ------------Divorced ________________________________ -- __
-----
Fertility
-Women, 35 lo 44 yeon old -------------Ever married·-------------------------------Number of children ever born-----------------
Per l,000 women---------------------------
---
Per 1,000 ever married women ____ --------------Wom .. , 45 years old ond •••r -----------
Ever married-----------------------------------
Number of children ever born------------------Per 1,000 women---------------------------Per 1,000 ever married women _______________ _
452
----
IA e and year of irnmigrctlon were not edited for tonsis1ency, see Appendix O. Dato based on 5·percent s.omple, see text. Far minimum base for d~r\\led tigur {p~rcent median etc) ond meaning of symbols, see text I es
1965 1960 1955 1950 1945 1935 1925 to to to to to to to Before Nol Total 1970 1964 1959 1954 1949 1944 1934 1925 reported
82 468 4 226 3 668 23 450 7 758 3 886 2 691 3 783 31 926 1 080 90 32 - - - - 14 - - 44 101 82 19 - - - - - - -594 148 46 375 - - - - 25 -I 775 195 283 l 221 20 - 16 - - 40 2 655 321 230 1 658 270 105 - - - 71 3 708 589 211 1 750 860 135 - 37 69 57 6 990 688 575 4 736 581 167 121 21 20 81 5 498 840 362 3 386 331 339 150 - 22 68 5 351 383 388 3 194 668 361 118 141 37 61
5 198 164 331 2 074 l 047 660 200 316 365 41 3 706 255 314 I 003 663 422 211 280 516 42 7 539 244 278 1 821 1 095 495 531 799 2 219 57 8 032 178 309 1 240 788 537 581 633 3 703 63 9 474 18 201 585 737 247 348 l 022 6 193 123 7 409 31 58 216 457 246 204 228 5 945 24 6 47\ 23 43 67 185 20 124 177 5 721 l ll 5 097 35 20 102 56 131 59 94 4 558 42 2 780 - - 22 - 21 14 35 2 533 155 58.7 35.3 41.4 37.9 50.8 52, l 59.9 62.3 72.3 58. l
98 234 4 662 4 331 17 258 6 920 4 850 3 199 4 553 50 719 1 742 88 16 - - - - - - - 72 79 46 - - - - - - 33 -487 118 62 268 - - - - 19 20 l 839 263 245 l 197 22 23 - - - 89 2 536 604 331 l 231 201 64 - - 66 39 3 727 800 552 l 226 750 322 22 - - 55 3 599 469 197 2 202 422 236 22 - 23 28 4 251 477 283 2 468 641 184 77 - 82 39 4 876 294 428 2 380 645 808 164 26 62 6.9
5 418 375 385 1 975 905 915 276 169 364 54 3 962 349 329 l 052 690 440 350 210 525 17 7 8\0 257 481 1 341 685 633 579 942 2 832 6.G 9 652 161 370 753 700 280 381 908 5 942 157 12 491 140 252 455 598 319 566 852 9 017 292 13 823 131 219 360 258 252 272 584 11 539 208 11 603 94 162 246 179 180 268 385 9 815 274 7 458 20 35 39 68 109 125 336 6 520 206 4 535 48 - 65 156 85 97 141 3 880 63 65.3 35.2 45.9 40.1 49.3 49.3 61.4 65.l 72.8 67.9
180 702 8 888 7 999 40 708 14 678 8 736 5 890 8 336 82 645 2 822 150 747 l 350 4 611 30 855 12 556 8 168 5 744 7 945 77 416 2 102 29 955 7 538 3 388 9 853 2 122 568 146 391 5 229 720
82 084 3 985 3 627 23 406 7 758 3 886 2 677 3 783 31 926 l 036 9 211 l 008 729 4 151 894 251 150 130 l 618 280 64 024 2 711 2 757 18 340 6 398 3 373 2 297 3 266 24 340 542 6 342 71 38 116 197 131 98 193 5 304 194 2 507 195 103 799 269 131 132 194 664 20 97 814 4 505 4 313 17 118 6 920 4 850 3 199 4 553 so 686 I 670 5 795 563 398 2 227 397 299 93 103 l 389 326 52 188 3 381 3 001 12 904 5 167 3 466 2 082 2 461 19 196 510 36 093 428 668 l 272 1 079 837 902 I 735 28 458 714 3 738 133 246 715 277 248 122 254 1 643 100
9 127 771 711 4 848 l 286 992 241 26 144 108 8 851 750 711 4 781 1 215 933 220 26 122 93 19 318 1 075 1 023 9 682 3 446 2 781 689 78 330 214 2 117 1 394 l 439 1 997 2 680 2 803 '" 2 183 ... ... ''' l 433 1 439 2 025 2 836 2 981 '" ". "' ' " 76 752 1 575 2 233 6 286 4 239 3 213 2 914 4 527 50 434 l 331 74 426 l 493 2 116 6 157 4 075 3 038 2 842 4 424 49 085 l 196 190 952 3 058 3 520 11 706 7 952 6 255 4 539 8 861 142 444 2 617 2 488 l 942 1 576 l 862 l 876 1 947 l 558 l 957 2 824 l 966 2 566 2 048 l 664 l 901 l 951 2 059 l 597 2 003 2 902 2 188
NATIONAL ORIGIN AND LANGUAGE
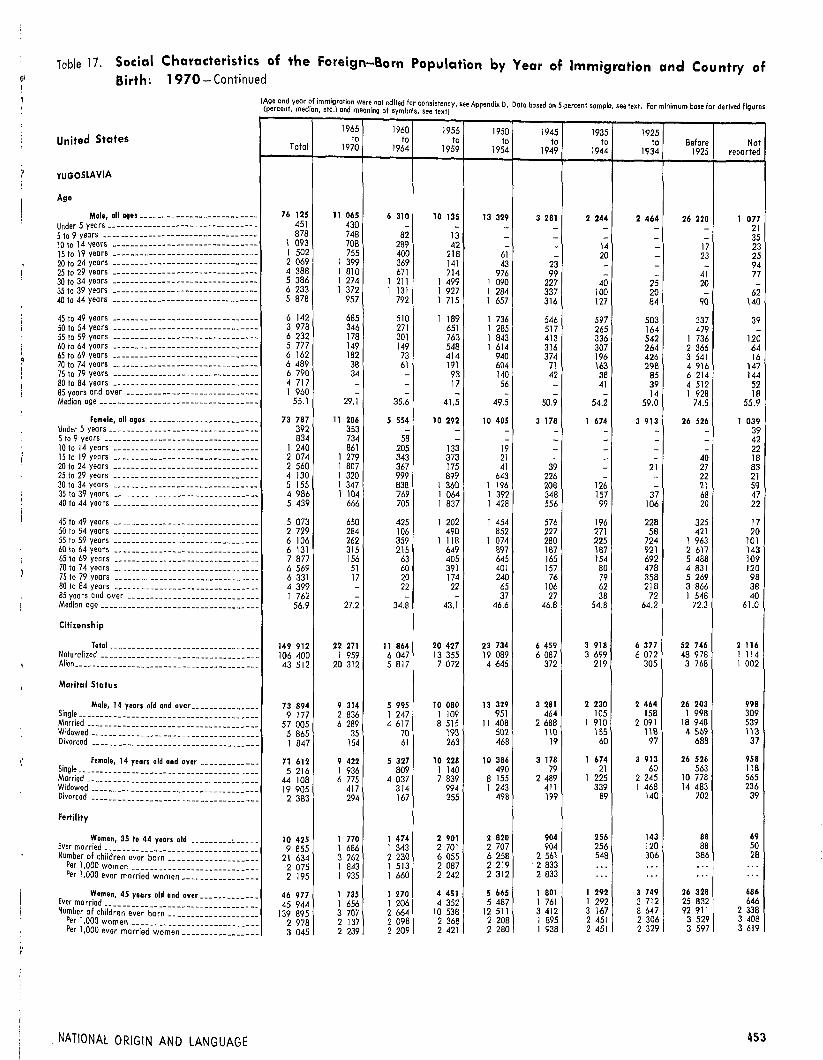
Table 17. Social Characteristics of the Foreign-Born Population by Year of Immigration and Country of Birth: 1970-Continued
United States
YUGOSLAVIA
Age Malo, all ages _________________________ _
Under 5 years---------------------------------5 to 9 years ----------------------------------10 to 14 years ---------------------------- ----15 to 19 yeors --------------------------------20 ta 24 years --------------------------------25 ta 29 years --------------------------------30 to 34 years --------------------------------35 ta 39 years --------------------------------40 ta 44 years --------------------------------
45 to 49 years --------------------------------50 to 54 years --------------------------------55 to 59 years --------------------------------60 to 64 years --------------------------------65 ta 69 years --------------------------------70 ta 74 years --------------------------------75 to 79 years --------------------------------80 to 84 years --------------------------------85 years and over ____________________________ _
Median age-----------------------------------
Female, all ages ------------------------Under 5 years ________________________________ _
5to 9 years----------------------------------10 to 14 years --------------------------------15 ta 19 years--------------------------------20 to 24 years --------------------------------25 ta 29 years --------------------------------30 to 34 years --------------------------------35 to 39 years --------------------------------40 to 44 years --------------------------------
45 to 49 years --------------------------------50 to 54 years --------------------------------55 to 59 years --------------------------------60 to 64 years --------------------------------65 ta 69 years --------------------------------70 ta 74 years--------------------------------75 to 79 years _______________________________ _
80 to 84 years --------------------------------85 years and aver ____________________________ _
Median age-----------------------------------
Citizenship
Total ________________________________ _ Naturalized __________________________________ _ Alien ________________________________________ _
Marital Status
Male, 14 years old and aver ______________ _ Single ________________________________ ---- __ --Married _____________________________________ _ Widowed -- __________________________________ _ Divorced ____________________________ -- ____ -- -
Fertility
Women, 35 to 44 years old ---------'-----Ever married _________________________________ _ Number of children ever born
Per 1,000 women --------------------
Per 1,000 ever ma;~i;d-_;,~;;;;:=:::=:=:=:::=:=:
E Women, 45 years old and over-------------
ver married __ N b --------------------------------u~ el of children ever born--------------------
p:~ l :~~~ :v~~~a;~i;d-_;,~;;;n-:=:::=:=:=:::=:::
. NATIONAL ORIGIN AND LANGUAGE
IA(pge~~enndt yemaerd~10f0imemtclg)ro0t0lodnmweere1 not e1dltedbfolr consistency, see Appendix 0. Doto based on 5~percent sample, see text. For minimum base for derived figures
. • . an ng a sym o s, see text]
1965 1960 1955 1950 1945 1935 1925 to to to to to to to Before Not Total 1970 1964 1959 1954 1949 1944 1934 1925 reported
76 125 11 065 6 310 10 135 13 329 3 281 2 244 2 464 26 220 1 077 451 430 - - - - - - - 21 878 748 82 13 - - - - - 35
1 093 708 289 42 - - 14 - 17 23 1 502 755 400 218 61 - 20 - 23 25 2 069 1 399 369 141 43 23 - - - 94 4 388 1 810 671 714 976 99 - - 41 77 5 386 1 274 1 211 1 499 1 090 227 40 25 20 -6 233 1 372 1 131 1 927 1 284 337 100 20 - 62 5 878 957 792 1 715 1 657 316 127 84 90 140
6 142 685 510 l 189 1 736 546 597 503 337 39 3 978 346 271 651 1 285 517 265 164 479 -6 232 178 301 763 1 843 413 336 542 1 736 120 5 777 149 149 548 1 614 316 307 264 2 366 64 6 162 182 73 414 940 374 196 426 3 541 16 6 489 38 61 191 604 71 \63 298 4 916 147 6 790 34 - 93 140 42 38 85 6 214 144 4 717 - - 17 56 - 41 39 4 512 52 1 960 - - - - - - 14 l 928 18
55.1 29. l 35,6 41.5 49.5 50.9 54.2 59.0 74.5 55.9
73 787 11 206 5 554 10 292 10 405 3 178 l 674 3 913 26 526 l 039 392 353 - - - - - - - 39 834 734 58 - - - - - - 42
l 240 861 205 133 19 - - - - 22 2 074 l 279 343 373 21 - - - 40 18 2 560 1 807 367 175 41 39 - 21 27 83 4 130 1 320 999 899 643 226 - - 22 21 5 155 1 347 838 1 360 1 196 208 126 - 21 59 4 986 1 104 769 l 064 1 392 348 157 37 68 47 5 439 666 705 1 837 1 428 556 99 106 20 22
5 073 650 425 1 202 1 454 576 196 228 325 17 2 729 284 106 490 852 227 271 58 421 20 6 106 262 359 1 118 1 074 280 225 724 1 963 101 6 131 315 2\5 649 897 187 187 921 2 617 143 7 877 156 63 405 645 165 154 692 5 488 109 6 569 51 60 391 401 157 80 478 4 831 120 6 331 17 20 174 240 76 79 358 5 269 98 4 399 - 22 22 65 106 62 218 3 866 38 1 762 - - - 37 27 38 72 1 548 40
56.9 27.2 34.8 43.1 46.6 46.8 54.8 64,2 72.3 61.0
149 912 22 271 11 864 20 427 23 734 6 459 3 918 6 377 52 746 2 116 106 400 I 959 6 047 13 355 19 089 6 087 3 699 6 072 48 978 1 114 43 512 20 312 5 817 7 072 4 645 372 219 305 3 768 1 002
73 894 9 314 5 995 10 080 13 329 3 281 2 230 2 464 26 203 998 9 177 2 836 1 247 1 109 951 464 105 158 1 998 309
57 005 6 289 4 617 8 515 11 408 2 688 1 910 2 091 18 948 539 5 865 35 70 193 502 110 155 118 4 569 \13 1 847 154 61 263 468 19 60 97 688 37
71 612 9 422 5 327 10 228 10 386 3 178 1 674 3 913 26 526 958 5 216 l 936 809 1 140 490 79 21 60 563 118
44 108 6 775 4 037 7 839 8 155 2 489 1 225 2 245 10 778 565 19 905 417 314 994 1 243 411 339 1 468 14 483 236 2 383 294 167 255 498 199 89 140 702 39
10 425 l 770 1 474 2 90-1 2 820 904 256 143 88 69 9 855 1 686 1 343 2 701 2 707 904 256 120 88 50
21 634 3 262 2 230 6 055 6 258 2 561 548 306 386 28 2 075 1 843 1 513 2 087 2 219 2 833 ... ... ... . .. 2 195 1 935 1 660 2 242 2 312 2 833 ... . .. ... ...
46 977 1 735 1 270 4 451 5 665 1 801 1 292 3 749 26 328 686 45 944 1 656 1 206 4 352 5 487 1 761 l 292 3 712 25 832 646
139 895 3 707 2 664 10 538 12 511 3 412 3 167 8 647 92 91 l 2 338 2 978 2 137 2 098 2 368 2 208 1 895 2 451 2 306 3 529 3 408 3 045 2 239 2 209 2 421 2 280 1 938 2 451 2 329 3 597 3 619
453
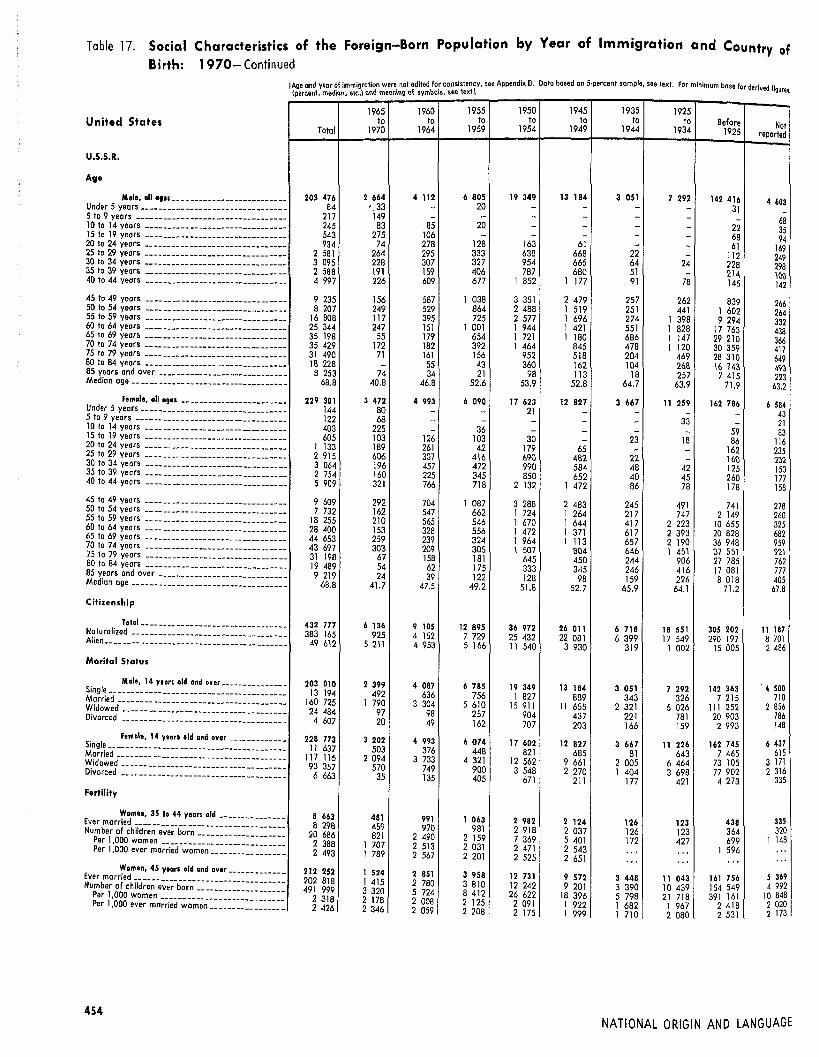
Table 17. Social Characteristics of the Foreign-Born Population by Year of Immigration and Country of Birth: 1970- Continued
United States
U.S.S.R.
Age
Molt, all 0911 ________________________ _ ------
Under 5 years--------------------------------5 to 9 years ---------------------------------10 to 14 yeors -------------------------------15 to 19 years -------------------------------20 to 24 years -------------------------------25 to 29 years -------------------------------30 to 34 years -------------------------------35 to 39 years -------------------------------40 lo 44 yeors -------------------------------
-
45 to 49 years -------------------------------50 to 54 yeors -------------------------------55 to 59 years -------------------------------60 to 64 years -------------------------------65 to 69 years -------------------------------70 to 74 years -------------------------------75 to 79 years -------------------------------80 to 84 years -------------------------------85 years and over ----------------------------Median age----------------------------------
Female, all ages -----------------------Under 5 years __________ ------ ---------- ------5 to 9 years ---------------------------------10 to 14 years -------------------------------15 to 19 years -------------------------------20 to 24 years -------------------------------25 to 29 years -------------------------------30 to 34 years -------------------------------35 to 39 years -------------------------------40 to 44 years -------------------------------
-----------------------
------
45 to 49 years -------------------------------50 ta 54 years -------------------------------55 to 59 years -------------------------------60 to 64 years -------------------------------65 to 69 years -------------------------------70 to 74 years -------------------------------75 to 79 years ------------------------------ --
--80 to 84 years ------------------------------85 years ond over---------------------------Median age----------------------------------
--
CitiZ&nship
Total -- _____________________________ _
Naturalized -- ---- -- __ ---- ---- -- -------- -------
Alien ••.• -- -- -- -- ---------- -- -- ------ --------
--Marital Status
Male, 14 years old ond over ____________ _ Single ______________ ------------------------ ----Married ____ -- ____________ ------------------Widowed ______ ---- ------ ______ ------ ------ _ Divorced __________________________________ _
------
hmolt, 14 years old and over ---- __ ---- _ Single ______ -- ________________ -- -- -- -- -- -- -- --Married ________ ------ __________ -------- ___ _ Widowed ______ ------ ---- -------- ------ ____ _
----Divorced __________________________________ _ --
--Fertility
Women, 35 to 44 years old-------------Ever married ---- __ ---- ______ ------------ ___ _ Number of children ever barn-----------------
Per 1,000 women--------------------------Per 1.000 ever married women ______ ---- ____ _
Women, 45 years old and over __________ _ Ever married __ ---- ------ ---- __ ---------- ___ _ Number of children ever born-----------------
Per 1,000 women--------------------------Per 1,000 ever married women ______________ _
454
----------- -------- -
I Age and year of immigration were not edited for consistency, see Appendix 0. Dato based on S·percent sample, see text. For minimum base for derived fiquru (percenl median elc ) ond meon\ng ot sym\io\s, see l•~I I
1965 1960 1955 1950 1945 1935 1925 to to to to to to to Before Not Total 1970 1964 1959 1954 1949 1944 1934 1925 reported
203 476 2 664 4 112 6 805 19 349 13 184 3 051 7 292 142 416 4 603 '.33 20 - - - - 31 84 - -217 149 - - - - - - - 68
245 83 85 20 - - - - 22 35 543 275 106 - - - - - 68 94 934 74 278 128 163 61 - - 61 169 2 581 264 295 333 638 668 22 - 112 249 3 095 228 307 327 954 665 64 24 228 298 2 588 191 159 406 787 680 51 - 2\4 100 4 997 226 609 677 \ 852 1 177 91 78 145 142
9 235 156 587 1 038 3 351 2 479 257 262 839 266 8 207 249 529 864 2 488 1 519 251 441 1 602 264
16 808 117 395 725 2 577 1 696 274 1 398 9 294 332 25 344 247 151 1 001 1 944 l 421 551 1 828 17 763 438 35 198 55 179 654 1 721 l 180 686 1 147 29 210 366 35 429 172 182 392 1 464 845 478 1 120 30 359 417 31 490 71 161 156 952 518 204 469 28 310 649 18 228 - 55 43 360 162 104 268 16 743 4n
8 253 74 34 21 98 113 18 257 7 415 223 68.8 40.8 46.8 52.6 53.9 52.8 64.7 63.9 71.9 63.2
229 301 3 472 4 993 6 090 17 623 12 827 3 667 11 259 162 786 6 584 144 80 - - 21 - - - - 43 122 68 - - - - - 33 - 21 403 225 - 36 - - - - 59 83 605 103 126 103 30 - 23 18 86 116
1 133 189 261 42 179 65 - - 162 235 2 915 606 307 416 690 482 22 - 160 232 3 064 196 457 472 990 584 48 42 125 150 2 754 160 225 345 850 652 40 45 260 177 5 909 321 766 718 2 132 1 472 86 78 178 158
9 609 292 704 1 087 3 288 2 483 245 491 741 278 7 732 162 547 662 1 724 l 264 217 747 2 149 260 18 255 210 565 546 l 670 1 644 417 2 223 10 655 325 28 400 153 328 556 1 472 1 371 617 2 393 20 828 682 44 653 259 239 324 1 964 1 113 657 2 190 36 948 959 43 697 303 209 305 1 507 804 646 1 451 37 551 921 31 198 67 158 181 645 450 244 906 27 785 762 19 489 54 62 175 333 345 246 416 17 081 777 9 219 24 39 122 128 98 159 226 8 018 405 68.8 41.7 47.5 49.2 51.8 52.7 65.9 64.l 71.2 67.8
432 777 6 136 9 105 12 895 36 972 26 011 6 718 18 551 305 202 11 187 383 165 925 4 152 7 729 25 432 22 081 6 399 17 549 290 197 8 701 49 612 5 211 4 953 5 166 11 540 3 930 319 1 002 15 005 2 486
203 010 2 399 4 087 6 785 19 349 13 184 3 051 7 292 142 363 . 4 500 13 194 492 636 756 l 827 889 343 326 7 215 710 160 725 1 790 3 304 5 610 15 911 11 655 2 321 6 026 111 252 2 856 24 484 97 98 257 904 437 221 781 20 903 786 4 607 20 49 162 707 203 166 159 2 993 148
228 773 3 202 4 993 6 074 17 602 12 827 3 667 11 226 162 745 6 437 11 637 503 376 448 821 685 81 643 7 465 615 117 116 2 094 3 733 4 321 12 562 9 661 2 005 6 464 73 l 05 3 171 93 357 570 749 900 3 548 2 270 1 404 3 698 77 902 2 316 6 663 35 135 405 671 211 177 421 4 273 335
8 663 481 991 1 063 2 982 2 124 126 123 438 335 8 298 459 970 981 2 918 2 037 126 123 364 320 20 686 821 2 490 2 159 7 369 5 401 172 427 699 1 148 2 388 1 707 2 513 2 031 2 471 2 543 ... ... 1 596 ... 2 493 1 789 2 567 2 201 2 525 2 651 ... ... ... ... 212 252 1 524 2 851 3 958 12 731 9 572 3 448 11 043 161 756 5 369 202 818 1 415 2 780 3 810 12 242 9 201 3 390 10 439 154 549 4 992 491 999 3 320 5 724 8 412 26 622 18 396 5 798 21 718 391 161 10 848 2 318 2 178 2 008 2 125 2 091 1 922 1 682 l 967 2 418 2 020 2 426 2 346 2 059 2 208 2 175 1 999 1 710 2 080 2 531 2 173
NATIONAL ORIGIN AND LANGUAGE
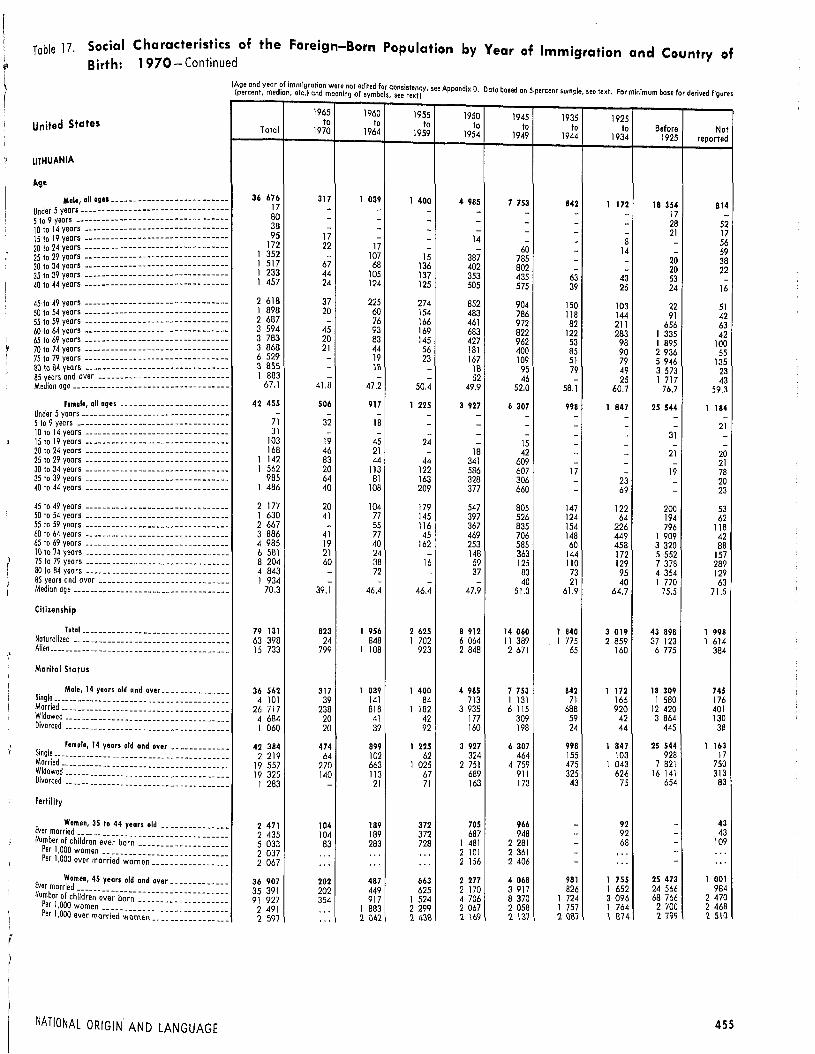
r I
Table 17. Social Characteristics of the Foreign-Born Population by Year of Immigration and Country of Birth: 1970-Continued
United States
LITHUANIA
Age
Male, all agts-------------------------Under 5 years---------------------------------5 to 9 yeors ----------------------------------10 to 14 years --------------------------------15 to 19 years--------------------------------20 to 24 years--------------------------------25 to 29 years --------------------------------30 to 34 years--------------------------------35 to 39 years--------------------------------40 to 44 years--------------------------------
45 to 49 years--------------------------------50 to 54 years--------------------------------55 to 59 years--------------------------------60 to 64 years--------------------------------65 to 69 years--------------------------------70 to 74 years -- -- -- -- -- -- -- -- -- -- -- -- -- -- -- --75 to 79 years -- -- -- -- -- -- -- -- -- -- -- -- -- -- -- --SO ta 84 years --------------------------------85 years and over---------------------------- -Medion age-------------- -- ------ ------ _____ _ -
Female, all ages-----------------------Under 5 years---- -- -- -- -- -- -- -- -- -- ---- -- -- -- -
-5 to 9 years ---------------------------------10to14years --------------------------------15 to 19 years--------------------------------20 to 24 years ------ ______ ------ ____________ _ -25 to 29 years --------------------------------30 to 34 years--------------------------------35 to 39 yeors --------------------------------40 to 44 years------------------------------- -
45 to 49 years-------------------------------50 to 54 years-------------------------------55 to 59 years -------------------------------60 to 64 years-------------------------------65 ta 69 years-------------------------------10 to 14 years ---- __ ---- ____ ---- -- ---- -- -- -- -75 to 79 years-------------------------------80 to 84 years-------------------------------85 years ond over----------------------------Median age _________________________________ _
Citizenship
Total _______________________________ _ Naturalized _________________________________ _ Alien _______________________________________ _
Marital Status
Male, 14 years old and over _____________ _ Single ____________________________ ---- ____ -- _ Married ____ -------- ________________________ _ Widowed ____ ------ _________________________ _ Divorced ___________________________________ _
Fertility
Women, 35 to 44 years old _______ _ Ever married ________________________________ _ Number of children ever born
Per 1,000 women ________ ::::::::::::::::::: Per 1,000 ever married women _______________ _
E Y!odmen, 45 years old and over ___________ _
vcr mame Number of chfld;;~-e~~;-b~r-n- -- -- -- -- - - -- -- -- -- -
Per 1,000 women -------------------
Per 1,000 ever ma;;i~d-.;:,~~~~~=~:~:~:~=~=~=~:
NATIONAL ORIGIN AND LANGUAGE
----------
---
----------
------
---
I Age and year of immigration were not edited for con 'st A d' o b (percent, median, etc,) and meaning of symbols, se!' te~~~y, see ppen ix · Dato ased on 5-percent sample, see text. For minimum base for derived figures
1965 1960 1955 1950 1945 1935 1925 to to to to ta ta to Before Not Total 1970 1964 1959 1954 1949 1944 1934 1925 reported
36 676 317 1 039 l 400 4 985 7 753 842 1 172 18 354 17 814 - - - - - - 17 80 - -- - - - - - 28 52 38 -- - - - - - 21 17 95 17 -- - 14 - - 8 56 172 22 17 -- - 60 - 14 - 59 1 352 - 107 15 387 785 - - 20 38 1 517 67 68 136 402 802 - - 20 22 1 233 44 105 137 353 435 63 43 53 -1 457 24 124 125 505 575 39 25 24 16 2 618 37 225 274 852 904 150 103 22 51 1 898 20 60 154 483 786 118 144 91 42 2 687 - 76 166 461 972 82 211 656 63 3 594 45 93 169 683 822 122 283 l 335 42 3 783 20 83 145 427 962 53 98 1 895 100 3 868 21 44 56 181 400 85 90 2 936 55 6 529 - 19 23 167 109 51 79 5 946 135 3 855 - 1'il - 18 95 79 49 3 573 23 1 883 - - - 52 46 - 25 l 717 43 67.l 41.8 47.2 50.4 49.9 52.0 58. l 60.7 76.7 59.3
42 455 506 917 1 225 3 927 6 307 998 1 847 25 544 1 184 - - - - - - - - - -71 32 18 - - - - - - 21 31 - - - - - - - 31 -103 19 45 24 - 15 - - - -168 46 21 - 18 42 - - 21 20 1 142 83 44 44 341 609 - - - 21 I 562 20 113 122 586 607 17 - 19 78
985 64 81 163 328 306 - 23 - 20 1 486 40 108 209 377 660 - 69 - 23
2 177 20 104 179 547 805 147 122 200 53 l 630 41 77 145 397 526 124 64 194 62 2 667 - 55 116 367 835 154 226 796 118 3 886 41 77 45 469 706 148 449 1 909 42 4 985 19 40 162 253 585 60 458 3 320 88 6 581 21 24 - 148 363 144 172 5 552 157 8 204 60 38 16 59 125 110 129 7 378 289 4 843 - 72 - 37 83 73 95 4 354 129 1 934 - - - - 40 21 40 1 770 63
70.3 39. 1 46.4 46.4 47.9 51.0 61.9 64.7 75.5 71.5
79 131 823 1 956 2 625 8 912 14 060 1 840 3 019 43 898 l 998 63 398 24 848 1 702 6 064 11 389 l 775 2 859 37 123 l 614 15 733 799 1 108 923 2 848 2 671 65 160 6 775 384
36 562 317 1 039 1 400 4 985 7 753 842 l 172 18 309 745 4 101 39 141 84 713 l 131 71 166 l 580 176
26 717 238 818 l 182 3 935 6 115 688 920 12 420 401 4 684 20 41 42 177 309 59 42 3 864 130 I 060 20 39 92 160 198 24 44 445 38
42 384 474 899 1 225 3 927 6 307 998 l 847 25 544 l 163 2 219 64 102 62 324 464 155 103 928 17
19 557 270 663 1 025 2 751 4 759 475 l 043 7 821 750 19 325 140 113 67 689 911 325 626 16 141 313
1 283 - 21 71 163 173 43 75 654 83
2 471 104 189 372 705 966 - 92 - 43 189 372 687 948 - 92 - 43 2 435 104
109 5 033 83 283 728 1 481 2 281 - 68 -2 037 " ' ... 2 101 2 361 - ... - ... . " 2 067 " ' ... 2 156 2 406 - ... - ... ...
36 907 202 487 663 2 277 4 068 981 1 755 25 473 1 001 449 625 2 170 3 917 826 1 652 24 566 984 35 391 202
91 927 354 917 1 524 4 706 8 370 1 724 3 096 68 766 2 470 I 883 2 299 2 067 2 058 1 757 1 764 2 700 2 468 2 491 ,,,
2 \69 2 1'1>7 2 ()\',7 I 874 ?. 799 ?. S\Q 2 597 " ' 2 042 2 438
455

Table 17. Social Characteristics of the Foreign-Born Population by Year of Immigration and Country of Birth: 1970-Continued
United States
GREECE
Age
Male, all ogts-------------------------Under 5 years---------------------------------5 to 9 years----------------------------------10 to 14 years --------------------------------15 to 19 years --------------------------------20 to 24 years --------------------------------25 to 29 years --------------------------------30 to 34 years -------------------------------35 to 39 years -------------------------------40 to 44 years -------------------------------
----45 to 49 years -------------------------------
50 to 54 years -------------------------------55 to 59 years -------------------------------60 to 64 years -------------------------------65 to 69 years -------------------------------70 to 74 years -------------------------------75 to 79 years -------------------------------80 to 84 years -------------------------------85 years and over----------------------------
-
Median age----------------------------------
Female, all agu ----------------------Under 5 years--------------------------------5 to 9 years---------------------------------10 to 14 years -------------------------------15 to 19 years -------------------------------20 to 24 years -------------------------------25 to 29 years -------------------------------30 to 34 years -------------------------------35 lo 39 years -------------------------------40 to 44 years -------------------------------
45 to 49 years -------------------------------50 lo 54 years -------------------------------55 lo 59 years ______ -- __ -- -- __ -- ---- -- -- -- ---60 lo 64 years -------------------------------65 lo 69 years -------------------------------70 to 74 years -------------------------------75 to 79 years -------------------------------80 to 84 years __ -----------------------------85 years and over---------------------------Median age----------------------------------
Citizenship
Total ______ -- -- __ -- ______ ---- __ ---- __ Naturalized __ -- __ ------ __ ------ ------ __ ---- __ Alien _______________________________________ _
Marital Status
--------
--------------------
---
Male, 14 years old and over ____________ _ Single __________ -- __ -- -- -- -- -- - --- -- ---- -- -- ----Married ____________ ---- __ ---------------- __ Widowed ________ ------ __ ---- __ ------ __ ---- _ Divorced __________ -- ________ -- __ ---- ______ _
------
Female, 14 yearo old ond aver-----------Single _____________________________________ _ --Married __________________________ ----------Widowed ________ ---------------- ------ ____ _ Divorced ______________ ---------- ------ ____ _
Fertility
Women, 35 to 44 years old-------------Ever married _______________________________ _
Number of children ever born __ ------ ---------Per 1,000 women--------------------------Per 1,000 ever married women ____ ---- __ -----
Women, 45 years old and over-----------Ever married ____________ ---- ______ ----------Number of children ever born-----------------
Per 1,000 women--------------------------Per 1,000 ever married women ______________ _
456
--------
--------------------
(Age and year of Immigration were not edited for consistency, see Appendix D. Data based on 5-percent sample, see text. For minimum base for derived figures (percent median etc) and meaning of symbols, see textl
1965 1960 1955 1950 1945 1935 1925 lo to to to to to to Before Not Total 1970 1964 1959 1954 1949 1944 1934 1925 reported
96 502 24 873 8 590 12 072 8 014 4 265 3 299 3 771 29 961 1 657 1 087 l 016 16 - - - - - 23 32 1 597 1 088 456 20 - - - - 19 14 3 370 2 284 601 412 - - 16 - - 57 4 251 2 463 611 854 129 28 - - 23 143 4 267 2 295 784 564 388 42 - - 38 156 6 373 3 519 I 073 841 404 339 18 - - 179 9 147 3 473 I 728 2 037 I 049 635 77 - 22 126 9 296 2 641 I 310 2 115 2 361 535 90 78 40 126 7 799 2 037 910 2 534 959 943 146 208 62 -5 255 l 280 290 1 147 960 460 549 213 236 120 4 847 l 037 207 646 687 483 670 546 467 104 5 036 886 242 454 557 241 770 856 l 011 19 4 317 470 182 271 269 295 503 497 l 758 72 5 254 218 122 75 113 112 135 647 3 773 59 8 909 73 42 102 37 76 175 284 7 942 178 9 561 31 16 - 62 58 68 267 8 908 151 4 448 18 - - 22 - 39 50 4 275 44 I 688 44 - - 17 18 43 125 l 364 77 46.0 29.7 32.2 38.1 39.3 42.9 55.5 59.9 74.7 39.8
78 426 21 707 8 074 8 552 6 054 4 820 2 404 6 432 18 296 2 087 953 865 18 - - - - - - 70 1 641 l 315 215 17 27 - - - - 67 2 895 1 739 469 577 - - - - 21 89 3 665 2 411 570 467 92 - - - 24 101 5 210 2 901 824 911 419 43 - - - 112 5 706 2 516 1 495 904 365 260 - - - 166 6 779 2 355 l 417 1 557 723 443 61 40 48 135 6 967 2 036 1 090 1 248 1 423 544 192 82 105 247 6 318 1 845 652 I 132 978 992 141 227 175 176
3 898 l 026 347 526 646 652 238 241 133 89 3 737 939 261 353 491 525 284 268 532 84 5 067 463 144 283 413 423 552 l 266 1 423 100 5 972 506 50 362 159 351 425 2 010 l 939 170 7 342 475 193 83 127 295 178 I 467 4 385 139 5 866 117 151 47 128 161 138 500 4 455 169 3 746 117 80 17 63 18 61 223 3 099 68 l 997 23 64 68 - 98 91 63 l 523 67 667 58 34 - - 15 43 45 434 38 44.3 28.2 31.6 34.5 39.9 46.0 57.6 62.7 70.4 41.6
174 928 46 580 16 664 20 624 14 068 9 085 5 703 10 203 48 257 3 744 114 130 5 940 8 542 17 226 12 600 8 182 5 307 9 516 44 618 2 199 60 798 40 640 8 122 3 398 l 468 903 396 687 3 639 1 545
91 403 20 999 7 682 11 877 8 014 4 265 3 283 3 771 29 919 1 593 17 332 7 276 2 004 2 175 1 048 436 169 248 3 312 664 67 767 13 431 5 463 9 506 6 772 3 636 2 855 3 198 22 106 800 4 718 144 43 Bl 130 55 177 291 3 688 109 1 586 148 172 115 64 138 82 34 813 20 73 898 18 329 7 493 8 223 6 027 4 820 2 404 6 432 18 296 1 874 8 018 4 143 l 114 1 421 482 197 43 63 276 279 47 430 12 771 5 706 6 210 4 878 3 647 I 593 3 553 8 021 l 051 17 257 1 170 558 512 557 831 749 2 689 9 667 524 l 193 245 115 BO 110 145 19 127 332 20
13 285 3 881 1 742 2 380 2 401 1 536 333 309 280 423 12 785 3 739 l 742 2 281 2 381 l 520 311 267 205 339 27 395 7 602 3 569 4 533 5 593 3 552 772 577 310 887 2 062 1 959 2 049 1 905 2 329 2 313 ... ... 2 097 2 143 2 033 2 049 ... l 987 2 349 2 337 ... ... ... ...
38 292 3 724 1 324 l 739 2 027 2 538 2 010 6 083 17 923 924 37 672 3 568 l 301 l 658 I 973 2 475 1 989 6 062 17 722 924 104 420 11 252 3 817 3 906 4 130 5 383 4 776 15 237 53 540 2 379 2 727 3 021 2 883 2 246 2 037 2 121 2 376 2 505 2 987 2 575 2 772 3 154 2 934 2 356 2 093 2 175 2 401 2 514 3 021 2 575
NATIONAL ORIGIN AND LANGUAGE
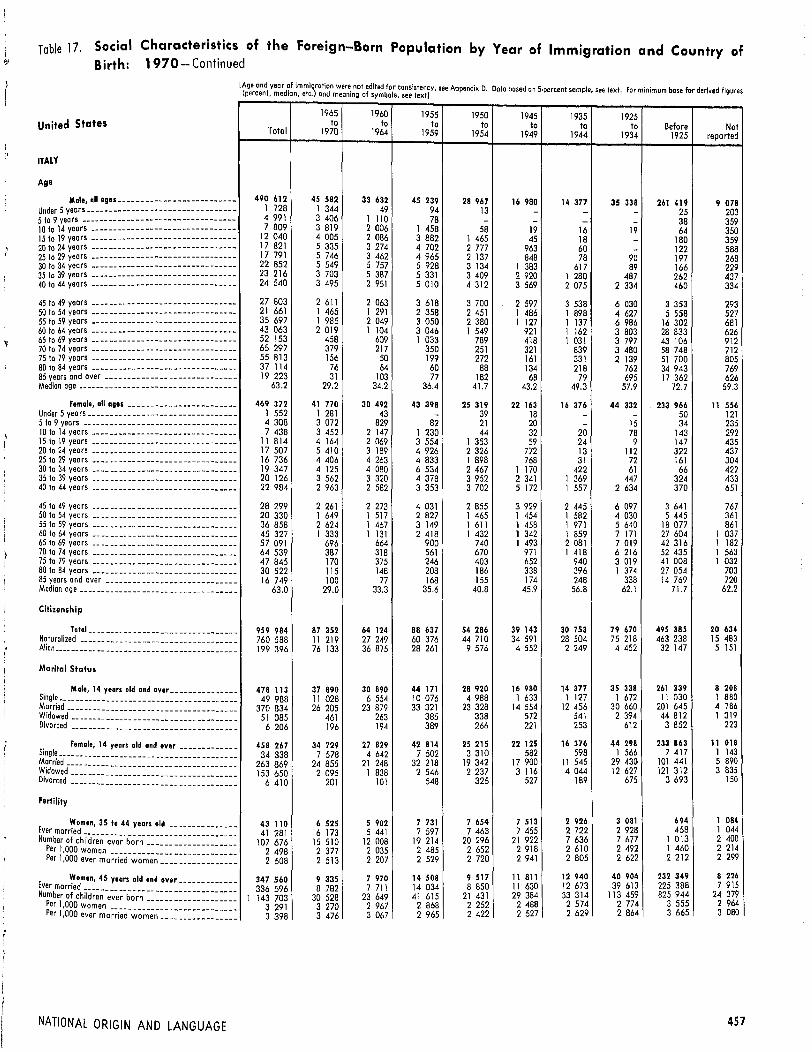
Table 17. Social Characteristics of the Foreign-Born Population by Year of Immigration and Country of Birth: 1970- Continued
United States
ITALY
Age
Male, all ogu-------------------------Under 5 years -- ---- -- -- -- -- -- -- ------ -- ------ -5 to 9 years ----------------------------------10 to 14 years--------------------------------15 ta 19 years--------------------------------20 to 24 years --------------------------------25 to 29 years--------------------------------30 to 34 years--------------------------------35 to 39 years--------------------------------40 to 44 years--------------------------------
45 to 49 years --------------------------------50 to 54 years--------------------------------55 to 59 years--------------------------------60 to 64 years--------------------------------65 to 69 years --------------------------------70 to 74 years --------------------------------75 to 79 years--------------------------------80 to 84 years --------------------------------85 years and over ____________________________ _
Median oge -----------------------------------
Female, all ages------------------------Under 5 years -- -- __________ -- ________________ _
5 to 9 years ----------------------------------10 to 14years --------------------------------15 to 19 years --------------------------------20 ta ~4 years --------------------------------25 to 29 years--------------------------------30 to 34 years --------------------------------35 to 39 years --------------------------------40 to 44 years --------------------------------
45 to 49 years --------------------------------50 to 54 years--------------------------------55 to 59 years _______________________________ _ 60 to 64 years _______________________________ _
65 to 69 years --------------------------------70 to 74 years --------------------------------75 to 79 years _______________________________ _ 80 to 84 years _______________________________ _
85 yeors and over ----------------------------Median age-----------------------------------
Citizenship
Total ________________________________ _ Naturalized __________________________________ _ Alien ________________________________________ _
Marital Status
Mole, 14 years old and over ______________ _ Single _______________________________________ _
~ld~~~i============= = = == = = = = = = = = = = = = = ==== = = = Divorced ____________________________________ _
Fertility
E Women, 45 years aid and over ____________ _
ver married N b f ----------------------------------
upm e1r a children ever born--------------------
er ,000 women----------------------------Per l ,000 ever married women ________________ _
NATIONAL ORIGIN AND LANGUAGE
IA(pgeerc"e"ndtyemoerd?101nlm
0m1
ig)rotlodn were1 not e
1ditedbfo
1r conslstency1 see Appendix D. Data based on S·percent sample, see text. For minimum bos.e for derived figures
, , c. on mean ng o sym o s, see textl
1965 1960 1955 1950 1945 1935 1925 to to to to to to to Before Not Total 1970 1964 1959 1954 1949 1944 1934 1925 reported
490 612 45 582 33 632 45 239 28 967 16 980 14 377 35 338 261 419 9 078 1 728 1 344 49 94 13 - - - 25 203 4 991 3 406 1 110 78 - - - - 38 359 7 809 3 819 2 006 l 458 58 19 16 19 64 350
12 040 4 005 2 086 3 882 l 465 45 18 - 180 359 17 821 5 335 3 274 4 702 2 777 963 60 - 122 588 17 791 5 746 3 462 4 965 2 137 848 78 90 197 268 22 852 5 549 5 757 5 928 3 134 l 383 617 89 166 229 23 216 3 703 5 387 5 331 3 409 2 920 1 280 487 262 437 24 540 3 495 2 951 5 010 4 312 3 569 2 075 2 334 460 334
27 803 2 611 2 063 3 618 3 700 2 597 3 538 6 030 3 353 293 21 661 l 465 1 291 2 358 2 451 l 486 l 898 4 627 5 558 527 35 697 l 985 2 049 3 050 2 380 l 127 l 137 6 986 16 302 681 43 063 2 019 1 104 3 046 l 549 921 l 162 3 803 28 833 626 52 153 458 609 l 033 789 418 1 031 3 797 43 106 912 65 297 379 217 350 251 321 839 3 480 58 748 712 55 813 156 50 199 272 161 331 2 139 51 700 805 37 114 76 64 60 88 134 218 762 34 943 769 19 223 31 103 77 182 68 79 695 17 362 626
63.2 29.2 34.2 36.4 41.7 43.2 49.3 57.9 72.7 59.3
469 372 41 770 30 492 43 398 25 319 22 163 16 376 44 332 233 966 11 556 l 552 l 281 43 - 39 18 - - so 121 4 308 3 072 829 82 21 20 - 15 34 235 7 438 3 452 2 147 1 230 44 32 20 78 143 292
11 814 4 164 2 069 3 554 l 353 59 24 9 147 435 17 507 5 410 3 189 4 926 2 326 772 13 112 322 437 16 736 4 406 4 263 4 833 l 898 768 31 72 161 304 19 347 4 125 4 080 6 534 2 467 l 170 422 61 66 422 20 126 3 562 3 320 4 378 3 952 2 341 l 369 447 324 433 22 984 2 963 2 582 3 353 3 702 5 172 l 557 2 634 370 651
28 299 2 261 2 273 4 031 2 855 3 929 2 445 6 097 3 641 767 20 330 l 649 l 517 2 827 l 465 l 454 l 582 4 030 5 445 361 36 858 2 624 1 467 3 149 l 611 1 458 l 971 5 640 18 077 861 45 327 1 333 l 131 2 418 1 432 l 342 1 859 7 171 27 604 1 037 57 091 696 664 900 740 l 493 2 081 7 019 42 316 l 182 64 539 387 318 561 670 971 l 418 6 216 52 435 l 563 47 845 170 375 246 403 652 940 3 019 41 008 1 032 30 522 115 148 208 186 338 396 l 374 27 054 703 16 749 100 77 168 155 174 248 338 14 769 720
63.0 29.0 33.3 35.6 40.8 45.9 56.8 62.l 71.7 62.2
959 984 87 352 64 124 88 637 54 286 39 143 30 753 79 670 495 385 20 634 760 588 11 219 27 249 60 376 44 710 34 591 28 504 75 218 463 238 15 483 199 396 76 133 36 875 28 261 9 576 4 552 2 249 4 452 32 147 5 151
478 113 37 890 30 890 44 171 28 920 16 980 14 377 35 338 261 339 8 208 49 988 11 028 6 554 10 076 4 988 l 633 l 127 l 672 11 030 l 880
370 834 26 205 23 879 33 321 23 328 14 554 12 456 30 660 201 645 4 786 51 085 461 263 385 338 572 541 2 394 44 812 1 319
6 206 196 194 389 266 221 253 612 3 852 223
458 267 34 729 27 829 42 814 25 215 22 125 16 376 44 298 233 863 11 018
34 338 7 578 4 642 7 502 3 310 582 598 l 566 7 417 l 143
263 869 24 855 21 248 32 218 19 342 17 900 11 545 29 430 101 441 5 890
153 650 2 095 l 838 2 546 2 237 3 116 4 044 12 627 121 312 3 835
6 410 201 101 548 326 527 189 675 3 693 150
43 110 6 525 5 902 7 731 7 654 7 513 2 926 3 081 694 1 084
41 281 6 173 5 441 7 597 7 463 7 455 2 722 2 928 458 l 044
107 676 15 510 12 008 19 214 20 296 21 922 7 636 7 677 l 013 2 400
2 498 2 377 2 035 2 485 2 652 2 918 2 610 2 492 l 460 2 214
2 608 2 513 2 207 2 529 2 720 2 941 2 805 2 622 2 212 2 299
347 560 9 335 7 970 14 508 9 517 11 811 12 940 40 904 232 349 8 226
336 596 8 782 7 711 14 034 8 850 11 630 12 673 39 613 225 388 7 915
l 143 703 30 528 23 649 41 615 21 431 29 384 33 314 113 459 825 944 24 379
3 291 3 270 2 967 2 868 2 252 2 488 2 574 2 774 3 555 2 964
3 398 3 476 3 067 2 965 2 422 2 527 2 629 2 864 3 665 3 080
457

Table 17. Social Characteristics of the Foreign-Born Population by Year of Immigration and Country of
Birth: 1970-Continued
United States
CHINA
Age
Mole, all a911 ______ ------ ------ ------ --Under 5 years---------------------------------5 to 9 years ----------------------------------10 to 14 years--------------------------------15 to 19 yeors --------------------------------20 to 24 years --------------------------------25 ta 29 years--------------------------------30 ta 34 years--------------------------------35 to 39 yeors --------------------------------40 to 44 years --------------------------------
45 to 49 years --------------------------------50 to 54 years --------------------------------55 to 59 years--------------------------------60 to 64 years--------------------------------65 to 69 years --------------------------------70 to 74 years--------------------------------75 ta 79 years --------------------------------80 to 84 years --------------------------------85 years and over ----------------------------Median age-----------------------------------
Female, all ages -----------------------Under 5 yeors---------------------------------5 to 9 years ----------------------------------10 to 14 years--------------------------------15 ta 19 years--------------------------------20 to 24 years--------------------------------25 to 29 years-------------------------------30 to 34 years -------------------------------35 to 39 years-------------------------------40 to 44 years -------------------------------
----
45 ta 49 years ------------------ -------------50 ta 54 years -------------------------------55 to 59 years-------------------------------60 to 64 years-------------------------------65 to 69 years ------------------ -------------70 1<> 74 years-------------------------------75 to 79 years -------------------------------80 to 84 years-------------------------------85 years and over ----------------------------Median age __ ---- ------ ______ ------ ----------
Citizenship
Tatol __________________________ ------Naturalized _________________________________ _ Alien •. __ ------ __ ---- __ ------ __________ ------
Marital Status
Male, 14 years old and over _____________ _ Sing le ______________________________________ _ Married ____ ------ ______ -------- ____________ _ Widowed ________________ ---- ------ ----------Divorced ___________________________________ _
female, 14 years aid and over------------Single ______________________________________ _
Married ____ ---------- __________ -------------Widowed ________________________ ------ _____ _ Divorced ________________________ -------- ___ _
Fertility
----------
---
----------
Women, 35 ta 44 years old--------------Ever married ________________ -------------- __ _ -
Number of children ever born------------------Per 1,000 women ---------------------------Per 1,000 ever married women ____ ------ _____ _
Women, 45 years aid and over-----------Ever married--------------------------------Number of children ever born------------------
Per 1,000 women---------------------------Per 1,000 ever married women _______________ _
458
----
-----
tAge and year of immigration were not edited for consistency, see Appendix D. Data based on S·percent sample, see text. For minimum base far derivl!.d fl~IJtt\ ( t ed' on etc) and meaning of symbols see texll percen, m 1 ,
1965 1960 1955 1950 1945 1935 1925 to to to to to to to Before Not
Total 1970 1964 1959 1954 1949 1944 1934 1925 reported
90 398 27 707 14 271 B 231 7 630 7 485 7 852 7 035 8 382 1 805 570 461 - - 19 - - - - 90
1 364 986 226 16 16 52 - - - 68 1 840 982 660 137 - - - - - 61 4 434 2 182 1 345 666 90 - - 23 - 128 9 227 4 796 1 924 990 615 517 - - 25 360 8 840 5 025 1 785 900 451 385 22 21 20 231
11 055 4 011 3 399 1 173 1 157 968 242 24 - 81 8 915 2 443 1 967 1 328 1 807 1 034 255 22 - 5~ 7 121 1 726 933 908 1 122 914 1 207 80 68 163
8 814 1 506 821 798 1 051 1 106 2 684 651 78 119 6 922 1 382 391 423 643 1 022 1 320 1 224 395 122 6 404 950 419 378 249 417 1 040 2 158 706 87 5 569 524 156 348 177 462 464 1 501 1 843 94 4 409 419 98 118 114 395 321 609 2 313 22 2 256 102 38 - 42 138 122 316 1 478 20 l 547 115 94 24 23 56 95 277 801 62
708 74 - - \8 \9 24 \02 471 -403 23 15 24 36 - 56 27 184 38 39.4 29,4 31.8 35.9 39.1 44.3 49.1 58.4 67.3 29.2
BO 757 29 057 16 036 9 651 6 618 9 933 2 775 l 608 2 950 2 129 408 366 - 23 - - - - - 19
1 391 958 365 - - - - - - 68 1 864 986 474 196 - - - - - 208 3 654 2 333 813 334 69 - - - - 105 9 070 5 225 1 816 809 590 289 20 - - 321 9 2\8 4 898 2 569 728 316 356 60 - 17 274
10 072 3 459 3 250 1 844 517 585 250 - - 167 7 794 1 923 1 640 1 773 1 095 1 099 210 16 20 18 8 069 1 777 l 328 1 008 1 312 2 130 217 97 - 200
6 913 1 787 916 664 824 1 900 283 173 178 188 5 567 1 227 689 727 561 1 573 497 130 68 95 5 263 1 424 705 440 378 1 126 527 423 227 13 3 764 692 495 450 444 616 407 359 171 130 3 604 980 320 380 372 149 188 235 864 116 1 561 300 334 100 19 92 78 51 490 97 1 264 322 226 76 81 - 19 74 432 34
596 186 52 57 17 18 - 19 247 -685 214 44 42 23 - 19 31 236 76 38.0 29.8 33.0 37.5 42.8 46.3 53.5 59.6 69.6 32.1
171 155 56 764 30 307 17 882 14 248 17 418 10 627 8 643 11 332 3 934 76 047 5 409 9 240 11 707 10 189 13 456 8 420 6 965 8 752 1 909 95 108 51 355 21 067 6 175 4 059 3 962 2 207 1 678 2 580 2 025
86 969 25 451 13 557 8 078 7 595 7 433 1 852 7 035 8 382 1 586 23 457 12 086 4 784 2 101 1 363 1 039 284 343 643 814 59 693 12 933 8 559 5 769 6 057 6 060 7 146 5 975 6 521 673 2 956 245 115 156 85 272 332 603 1 069 79 863 187 99 52 90 62 90 114 149 20
77 671 27 029 15 340 9 538 6 618 9 933 2 775 l 608 2 950 1 880 12 753 6 680 2 544 1 441 706 486 196 - 181 519 56 492 18 034 11 671 7 424 5 394 8 703 1 920 1 134 1 136 1 076 7 312 2 074 1 036 505 470 574 457 433 1 571 192 1 114 241 89 168 48 170 202 41 62 93
15 863 3 700 2 968 2 781 2 407 3 229 42.7 113 20 218 15 427 3 600 2 928 2 700 2 304 3 175 388 113 20 199 47 670 10 459 9 491 8 249 6 990 10 065 1 120 478 200 618 3 005 2 827 3 198 2 966 2 904 3 117 2 623 '" "' 3 090 2 905 3 241 ... 3 055 3 034 3 170 ... ... ... ...
29 217 7 132 3 781 2 936 2 719 5 474 2 018 1 495 2 913 749 28 348 6 963 3 674 2 867 2 676 5 296 1 904 1 495 2 749 724 86 315 21 430 9 933 7 788 6 572 15 959 5 787 4 954 11 239 2 653 2 954 3 005 2 627 2 653 2 417 2 915 2 868 3 314 3 858 3 542 3 045 3 078 2 704 2 716 2 456 3 013 3 039 3 314 4 ass 3 664
NATIONAL ORIGIN AND LANGUAGE
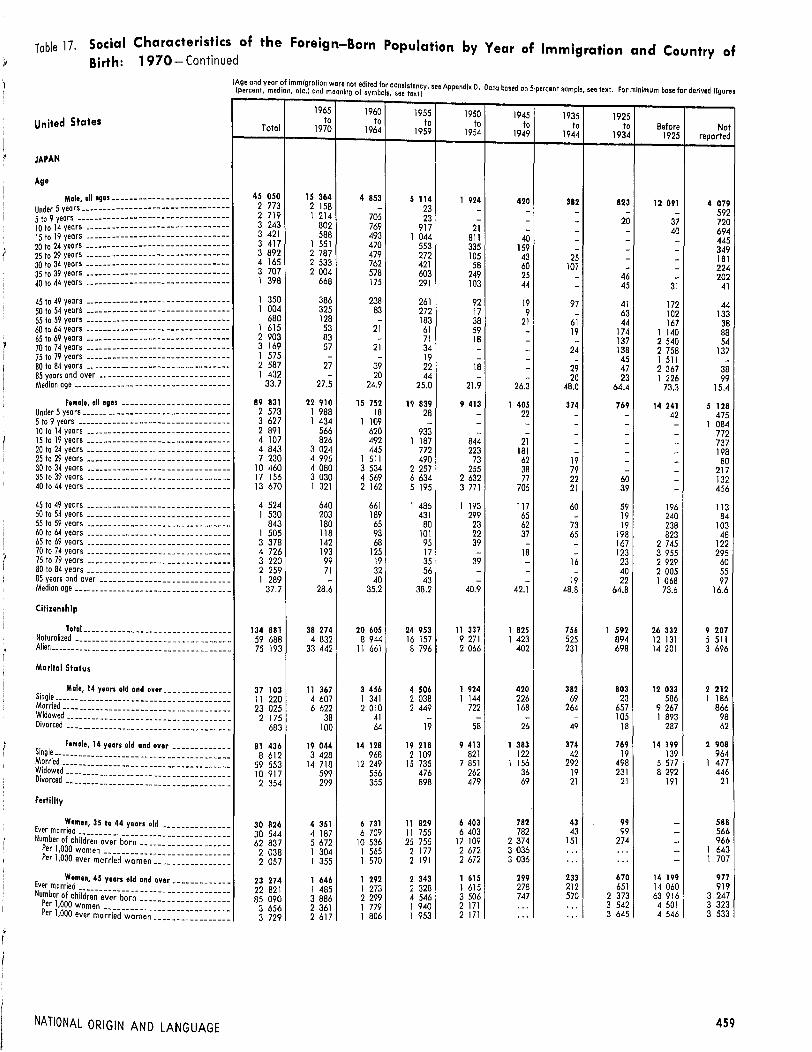
Table 17. Social Characteristics of the Foreign-Born Population by Year of Immigration and Countr of Birth: 1970- Continued Y
United States
JAPAN
Age
Mole, all agts--------------------------Under 5 yeors---------------------------------5 to 9 years ----------------------------------10 to 14 years --------------------------------15 to 19 years --------------------------------20 to 24 years--------------------------------25 to 29 years--------------------------------30 to 34 years ------------ --------------------35 to 39 years--------------------------------40 to 44 years--------------------------------
45 to 49 years--------------------------------50 to 54 years --------------------------------55 to 59 years--------------------------------60 to 64 years--------------------------------65 to 69 years--------------------------------70 to 74 years --------------------------------75 to 79 yeors --------------------------------80 to 84 years--------------------------------85 years ond over-----------------------------Medion age------------------ -- __ ------ -- ____ _
Female, all ages------------------------Under 5 yeors ---- -- -- -- -- -- •• -- __ •• ______ •• __ _ 5 to 9 yeors ------ ________ •• _________________ _
10 to 14 years --------------------------------15 to 19 years--------------------------------20 to 24 years--------------------------------25 to 29 years--------------------------------30 to 34 years --------------------------------35 to 39 years--------------------------------40 to 44 years--------------------------------
45 to 49 years--------------------------------50 to 54 years--------------------------------55to 59 years--------------------------------60 to 64 years--------------------------------65 to 69 years--------------------------------70 to 74 years--------------------------------75 to 79 years--------------------------------80 to 84 years--------------------------------85 yeors ond over---------------------------- -Medion oge ---------------------------------- -Citizenship
Total ________ .... ___________________ _ -Noturolized _________________________________ _ Alien _______________________________________ _ -
-
Marital Status
Male, 14 years old and over _____________ _ Single ______________________________________ _
~!~~~:r:======= :=::: :: =: ==:::::::::::::::: -----
Female, 14 years old and over------------
~~~~~i~~~~~~~~~~ ~~~ ~~~~ ~ ~ ~~~; ~ ~ ~ ~ ~ ~ ~ ~ ~; ~; ~ --
---
Fertility
Wamen, 35 to 44 years old--------------~ver ~arr19d ---------- ____ ------ __ ------ ____ _
upm e1r 0o00
children ever born __________________ _ er , women
Per 1,000 ever ma~;i~d-~~-;;;n·================
Eve Wadman, 45 years old and over ___________ _
r marne Number of chi1ci;;~~~~;-b~r~- -- -- -- -- -- -- -- -- -- -
Per 1,000 wo e -------------------
Per 1,000 eve~ ~0;;i~d-~~-;;;n·================
NATIONAL ORIGIN AND LANGUAGE
----------
(Age and year of Immigration were not edited for consiste A di o D b (percent, mod Ian, etc.) and meaning of symbols, see tex~fY· SH ppen x · ato osed on 5-percent somple, see text. For minimum base for derived figures
1965 1960 1955 1950 1945 1935 1925 to to to to to to to Before Not Total 1970 1964 1959 1954 1949 1944 1934 1925 reported
45 050 15 364 4 853 5 114 1 924 420 382 823 12 091 4 079 2 773 2 158 - 23 - - - 592 2 719 1 214 705 - -23 - - - 20 37 720 3 243 802 769 917 21 - - 40 694 3 421 588 493 1 044 -
811 40 - 445 3 417 l 551 470 - -553 335 159 - 349 3 892 2 787 479 - -272 105 43 25 - 181 4 165 2 533 762 421 -58 60 107 - 224 3 707 2 004 578 -603 249 25 - 46 202 1 398 668 175 -291 103 44 - 45 31 41
1 350 386 238 261 92 19 97 41 172 44 l 004 325 83 272 17 9 - 63 102 133 680 128 - 183 38 21 61 44 167 38 1 615 53 21 61 59 - 19 174 1 140 88 2 903 83 - 71 18 - - 137 2 540 54 3 169 57 21 34 - - 24 138 2 758 137 1 575 - - 19 - - - 45 1 511 -2 567 27 39 22 18 - 29 47 2 367 38 1 432 - 20 44 - - 20 23 1 226 99 33.7 27.5 24.9 25.0 21.9 26.3 48.0 64.4 73,3 15.4
89 831 22 910 15 752 19 839 9 413 1 405 374 769 14 241 5 128 2 573 1 988 18 28 - 22 - - 42 475 3 627 1 434 l 109 - - - - - - 1 084 2 891 566 620 933 - - - - - 772 4 107 826 492 1 187 844 21 - - - 737 4 843 3 024 445 772 223 181 - - - 198 7 230 4 995 1 511 490 73 62 19 - - 80
10 460 4 080 3 534 2 257 255 38 79 - - 217 17 156 3 030 4 569 6 634 2 632 77 22 60 - 132 13 670 1 321 2 162 5 195 3 771 705 21 39 - 456
4 524 640 661 1 485 1 193 117 60 59 196 113 1 530 203 189 431 299 65 - 19 240 84
843 180 65 BO 23 62 73 19 238 103 1 505 118 93 101 22 37 65 198 823 48 3 378 142 68 95 39 - - 167 2 745 122 4 726 193 125 17 - 18 - 123 3 955 295 3 220 99 19 35 39 - 16 23 2 929 60 2 259 71 32 56 - - - 40 2 005 55 1 289 - 40 43 - - 19 22 1 068 97
37.7 28,6 35.2 38.2 40.9 42.1 48,8 64.8 73.6 16.6
134 881 38 274 20 605 24 953 11 337 1 825 756 1 592 26 332 9 207 59 688 4 832 8 944 16 157 9 271 1 423 525 894 12 131 5 511 75 193 33 442 11 661 8 796 2 066 402 231 698 14 201 3 696
37 103 11 367 3 456 4 506 1 924 420 382 803 12 033 2 212 11 220 4 607 l 341 2 038 1 144 226 69 23 586 1 186 23 025 6 622 2 010 2 449 722 168 264 657 9 267 866
2 175 38 41 - - - - 105 1 893 98 683 100 64 19 58 26 49 18 287 62
81 436 19 044 14 128 19 218 9 413 1 383 374 769 14 199 2 908 B 612 3 428 968 2 109 821 122 42 19 139 964
59 553 14 718 12 249 15 735 7 851 1 156 292 498 5 577 l 477 10 917 599 556 476 262 36 19 231 8 292 446 2 354 299 355 898 479 69 21 21 191 21
30 826 4 351 6 731 11 829 6 403 782 43 99 - 588 6 709 11 755 6 403 782 43 99 - 566 30 544 4 187
62 837 5 672 10 536 25 755 17 109 2 374 151 274 - 966 3 036 1 643 2 038 1 304 1 565 2 177 2 672 "' . " -
1 570 2 191 2 672 3 036 - l 707 2 057 1 355 ". . ,. 23 274 1 646 1 292 2 343 1 615 299 233 670 14 199 977
1 485 1 273 2 328 1 615 278 212 651 14 060 919 22 821 63 916 3 247 85 090 3 886 2 299 4 546 3 506 747 570 2 373
3 542 4 501 3 323 3 656 2 361 l 779 I 940 2 171 ... " . 3 645 4 546 3 533 3 729 2 617 1 806 1 953 2 171 '" ".
459

Table 17. Social Birth:
Characteristics of the foreign-Born Population by Year of Immigration and Country of
1970-Continued
United States
CANADA
Age Male, all ages _________________________ _
Under 5 years---------------------------------5 ta 9 years ----------------------------------10 to 14 years --------------------------------15 to 19 years --------------------------------20 to 24 years--------------------------------25 to 29 years ------ ---- ---- -- ------ ---- -- -- --30 to 34 years ____________________ -- -- -- -- -- --
35 to 39 years --------------------------------40 to 44 years --------------------------------
45 to 49 years __ ---- -------- ------ ------ ---- --50 to 54 years --------------------------------55 to 59 years--------------------------------60 to 64 yeors --------------------------------65 to 69 years -- -- -- -- -- __ -- -- -- -- -- -- -- -- -- --70 to 74 years--------------------------------75 to 79 years--------------------------------80 to 84 years --------------------------------85 years and over ----------------------------Median age-----------------------------------
Female, all ages -----------------------Under 5 years---------------------------------5 lo 9 years ----------------------------------10 to 14 years --------------------------------15 to 19 yeors --------------------------------20 to 24 years--------------------------------25 to 29 years --------------------------------30 to 34 years --------------------------------35 to 39 years--------------------------------40 to 44 years --------------------------------
45 to 49 years ---- ----------------------------50 ta 54 years --------------------------------55 to 59 years --------------------------------60 ta 64 years --------------------------------65 to 69 years -- -- ____ -- -------------------- __
---
70 to 74 years --------------------------------75 to 79 years --------------------------------80 to 84 years -------------------------------85 years and over---------------------------Median age----------------------------------
Citizenship
lo ta I _______________________________ _ -Naturalized _________________________________ _ -Alien ______________________ ------ ___________ _ -
Marital Status
Male, 14 years aid and over ______________ _ Single __ -- __ -- __ -- __ -- -- -- -- -- -- __ ---- __ -- -- --Married ________________________ ---------- ___ _ Widowed ____________ ---- __ ------ __ -------- __ _ Divorced ____ ------ ------ __ ------------ ---- __ -
-Female, 14 years aid and over------------Single _______________________________________ _ Mo rried _____________________________________ _
Widowed __________ ------ ---- ____ ------ ------ _ Divorced ____________________________________ _
Fertility
Women, 35 ta 44 y1ars aid --------------Ever married---------------------------------Number of children ever born-------------------
Per 1,000 women---------------------------Per 1,000 ever married women-----------------
Women, 45 years old and aver-------------Ever married _________________________________ _ Number of children ever born ___________________ _
Per 1.000 women----------------------------Per 1,000 ever married women ________________ _
460
IAge and year of immigration were not edited for consistency, see Appendix D. Data based on 5-percent sample, see text. For minimum base for derived figuru ( t median etc) and meaning of symbols see text] percen,
1965 1960 1955 1950 1945 1935 1925 to to to to to to to Before Not
Total 1970 1964 1959 1954 1949 1944 1934 1925 reported
391 665 53 726 45 315 36 541 31 148 23 183 16 479 49 764 116 635 18 874 6 305 5 621 72 28 - - - - 17 567
15 515 8 256 5 708 130 61 18 - 21 28 1 293 18 452 5 688 7 124 4 007 146 45 13 8 88 1 333 19 234 4 304 4 602 5 020 3 652 81 24 49 67 1 435 19 056 5 557 2 626 3 255 3 696 1 748 57 44 144 1 929 21 918 6 329 5 383 2 447 2 890 2 654 901 58 87 1 169 19 635 5 817 4 891 2 882 2 006 1 670 1 769 19 100 481 20 726 3 968 4 552 4 418 2 298 1 938 1 584 1 182 95 691 24 020 2 663 3 805 4 824 3 207 2 720 1 678 3 854 240 1 029
32 982 1 779 2 017 3 602 4 567 3 618 1 867 6 808 7 593 1 131 39 215 1 509 1 931 2 694 3 525 3 389 2 975 6 496 15 228 1 468 36 555 856 1 198 1 872 2 844 2 484 2 187 6 784 16 834 1 496 34 178 318 553 756 1 201 1 492 1 609 11 097 15 984 1 168 31 791 455 490 266 675 847 1 025 7 609 19 013 1 411 22 196 248 207 213 205 312 503 3 158 16 610 740 14 590 156 57 43 57 104 171 1 394 11 961 647 8 790 139 28 25 62 - 61 842 7 258 375 6 507 63 71 59 56 63 55 341 5 288 511
49.7 22.7 27.3 35.6 41.3 46.0 50.6 59.7 65.5 42,6
527 323 58 714 53 759 49 266 46 514 37 101 31 909 66 281 157 842 25 937 6 335 5 381 17 7 20 34 - 42 - 834
13 125 7 328 4 612 190 13 - - 21 21 940 18 885 6 013 6 955 4 243 208 26 - 75 123 1 242 20 302 4 392 4 830 6 144 3 478 60 36 30 210 1 122 25 189 8 885 4 014 3 466 4 932 2 179 160 49 213 1 291 29 446 9 239 8 836 3 238 3 121 2 579 894 81 83 1 375 27 050 4 841 8 249 6 681 2 666 1 884 1 431 145 163 990 30 444 3 646 5 129 8 118 7 150 2 425 1 631 946 156 1 243 35 927 2 619 3 585 5 930 8 607 6 847 2 318 4 746 .386 889
43 716 2 066 2 345 4 038 6 120 7 621 4 560 7 081 7 924 1 961 49 513 1 562 1 721 2 923 4 392 5 826 6 840 7 253 16 702 2 294 50 990 1 170 1 534 1 978 2 995 3 648 6 783 11 368 19 126 2 388 46 690 492 815 716 1 269 1 960 3 110 15 861 20 126 2 341 41 038 384 447 706 788 995 1 895 10 100 24 109 1 614 32 748 269 306 337 381 515 1 210 4 851 23 233 1 646 24 296 227 190 188 181 311 581 2 015 19 358 1 245 17 058 130 75 235 88 108 203 959 14 249 1 011 14 571 70 99 128 105 83 257 658 11 660 1 511
51.3 23.5 28.7 35.4 41.0 46.7 53.6 60.4 67.8 52.4
918 988 112 440 99 074 85 807 77 662 60 284 48 388 116 045 274 477 44 811 582 667 6 919 16 956 35 835 47 686 47 219 42 183 103 926 252 489 29 454 336 321 105 521 82 118 49 972 29 976 13 065 6 205 12 119 21 988 15 357
355 266 35 136 33 798 33 466 30 995 23 120 16 466 49 735 116 548 16 002 53 235 10 638 9 593 9 613 7 692 2 146 1 198 2 092 5 862 4 401
275 590 23 770 23 528 22 806 22 328 20 086 14 276 43 623 95 127 10 046 17 542 267 191 252 180 303 342 2 338 12 610 1 059 8 899 461 486 795 795 585 650 1 682 2 949 496
492 954 41 035 43 222 46 376 46 330 37 067 31 909 66 180 157 754 23 081 59 091 8 865 8 430 10 913 7 581 2 607 1 927 4 408 10 863 3 497
320 740 30 129 32 151 31 934 35 024 29 700 23 796 44 871 79 659 13 476 93 313 1 27.1 1 395 1 837 2 032 2 389 4 648 13 465 60 962 5 314 19 810 770 1 246 1 692 1 693 2 371 1 538 3 436 6 270 794
66 371 6 265 8 714 14 048 15 757 9 272 3 949 5 692 542 2 132 63 095 5 875 8 193 13 422 15 102 8 889 3 821 5 412 367 2 014
180 665 15 783 20 507 34 215 46 244 27 990 12 111 16 246 1 461 6 108 2 722 2 519 2 353 2 436 2 935 3 019 3 067 2 854 2 696 2 865 2 863 2 686 2 503 2 549 3 062 3 149 3 170 3 002 ... 3 033
320 620 6 370 7 532 11 249 16 319 21 067 25 439 60 146 156 487 16 011 298 765 5 941 7 048 10 296 15 069 19 984 23 799 56 139 145 987 14 502 731 363 14 139 15 707 21 497 33 593 45 111 54 378 132 779 377 429 36 730
2 281 2 220 2 085 1 911 2 059 2 141 2 138 2 208 2 412 2 294 2 448 2 380 2 229 2 088 2 229 2 257 2 285 2 365 2 585 2 533
NATIONAL ORIGIN AND LANGUAGE

Table 17. Social Characteristics of the Foreign-Born Population by Year of Immigration and Country of Birth: 1970-Continued
United States
MEXICO
Age Male, all ages_ ________________________ _
Under 5 years-------- -- -- -- -- -- -- ------ -- -- -- -5 to 9 years ----------------------------------10 to 14 years--------------------------------15 lo 19 years --------------------------------20 to 24 years--------------------------------25 to 29 years --------------------------------30 to 34 years--------------------------------35 to 39 years --------------------------------40 to 44 years--------------------------------
45 to 49 years --------------------------------50 to 54 years--------------------------------55 to 59 years --------------------------------60 to 64 years __ -- -- -- -- -- -- -- __ -- ___________ _
65 to 69 years --------------------------------70 to 74 years--------------------------------75 to 79 years--------------------------------80 to 84 years --------------------------------85 years and over ----------------------------Median oge -----------------------------------
Female, all ages------------------------Under 5 years---------- -- ---- ____ ------ -------5 to 9 years ----------------------------------10 to 14 years --------------------------------15 to 19 years--------------------------------20 to 24 years --------------------------------25 to 29 years __ -- -- -- -- -- -- -- -- -- -- -- -- -- -- --30 to 34 years __ -- -- -- ____ -- ____ -- -- ______ -- __
35 to 39 years --------------------------------40 to 44 years ____ -- -- ________ -- -- -- -- -- -- ___ _
45 to 49 years _______________________________ _ 50 to 54 years _______________________________ _ 55 to 59 years _______________________________ _
60 to 64 years--------------------------------65 to 69 years ____ -- _________________________ _ 70 to 74 years _______________________________ _
75to 79 years--------------------------------80 to 84 years--------------------------------85 years ond over ----------------------------Median age-----------------------------------
Citizenship
Toto! ________________________________ _ Naturalized ____________________________ -- -- __ _ Alien ________________________________________ _
Marital Statu•
Male, 14 years old and over ______________ _ Single _______________________________________ _ Married _____________________________________ _ Widowed ____________________________________ _ Divorced ____________________________________ _
Female, 14 years old and aver ____________ _
~!~~t~i=;~~~~~;~~ ~;~ ;~;~ ;~ ;~ ;~ ;~; ~; ~; ~; ~;~ ;~; Fertility
E Women, 35 lo 44 years old---------------Nver bmarried ______________________ ------ _____ _
upm er of children ever born-------------------er l ,000 women
Per 1,000 ever mo~~i~d -._-;,~;n;0-:::::::::::::::=: Women, 45 years old and over ____________ _
Ever married _ N b - --------------------------------
upm e1r of children ever born--------------------
er ,000 women __ _ Per 1,000 ever married-._-;,~;;;~=================
NATIONAL ORIGIN AND LANGUAGE
lAge and yeardof immigration were not edited for consistency, see Appendix D. Data based on 5-percent sample, see te><t. For minimum base for derived figures (percent, me Ian, etc.) and meaning of symbols, see text!
1965 1960 1955 1950 1945 1935 1925 to to to to to to to Before Not Total 1970 1964 1959 1954 1949 1944 1934 1925 reported
383 896 90 298 68 183 57 533 34 388 18 734 10 639 18 989 69 518 15 614 6 998 5 974 257 65 40 - - - - 662
16 986 10 496 4 943 329 92 - - - 40 l 086 25 234 10 273 9 185 4 013 177 92 36 - 51 1 407 30 130 11 437 7 875 6 606 2 812 56 - 18 18 l 308 33 772 15 373 6 897 4 831 3 033 1 584 117 46 102 1 789 34 695 13 320 8 351 4 600 3 391 2 506 963 80 84 1 400 32 257 7 756 9 822 7 166 3 313 l 683 1 188 60 26 1 243 31 207 5 184 7 498 9 477 4 782 1 777 957 423 167 942 27 977 3 135 4 921 7 374 5 887 2 892 l 095 1 557 195 921
26 955 2 876 3 607 5 772 4 464 3 212 l 812 1 953 2 452 807 20 661 1 610 2 043 2 827 2 454 1 733 l 284 1 982 5 985 743 21 374 952 1 269 2 002 l 784 1 381 997 2 211 10 103 675 24 382 703 728 1 242 937 730 797 5 135 13 493 617 21 464 610 380 559 516 525 732 3 342 14 043 757 13 981 284 191 436 452 299 319 1 047 10 491 462 7 661 257 120 52 164 114 225 620 5 823 286 5 039 40 58 144 33 99 117 263 4 055 230 3 123 18 38 38 57 51 - 252 2 390 279
36.9 22.3 28.0 35.6 39.5 42.9 47.7 61. l 65.7 30.6
405 381 96 119 74 932 59 828 35 891 19 506 11 612 17 520 72 406 17 567 7 916 6 272 343 109 112 29 - - 22 l 029
17 193 9 980 5 513 269 - 18 - 20 33 l 360 25 962 10 617 9 467 4 346 213 - - - - 1 319 32 611 13 253 8 064 6 467 3 004 78 54 42 121 l 528 35 874 15 476 7 820 5 394 4 405 l 467 55 24 74 l 159 38 592 12 614 11 446 5 894 3 850 2 143 992 82 60 l 511 37 463 9 190 10 434 10 118 3 694 1 521 l 338 46 155 967 32 946 5 456 6 702 9 296 6 367 2 221 1 213 405 202 l 084 26 657 3 622 4 816 5 942 4 958 3 425 l 468 l 121 261 l 044
23 817 3 251 3 285 3 677 3 124 2 836 1 568 2 200 2 883 993 20 911 l 842 2 027 2 521 l 894 1 607 l 250 1 763 6 948 l 059 25 259 l 927 1 678 l 943 l 338 1 360 l 376 2 944 11 669 1 024 23 786 906 1 327 1 201 1 235 986 895 3 039 13 031 1 166 22 967 835 886 1 036 905 946 646 2 650 14 095 968 14 916 413 562 l 067 320 327 364 l 734 9 684 445 9 072 272 264 209 161 357 232 608 6 572 397 5 811 159 200 229 129 86 62 531 4 188 227 3 628 34 98 110 182 99 99 311 2 408 287
36.l 22.6 27.7 33.7 37.l 43.3 47.2 60.2 65.3 34.5
789 277 186 417 143 115 117 361 70 279 38 240 22 251 36 509 141 924 33 181 306 403 45 556 40 947 37 912 29 290 19 877 13 578 21 300 81 647 16 296 482 874 140 861 102 168 79 449 40 989 18 363 8 673 15 209 60 277 16 885
340 759 65 651 55 612 54 828 34 219 18 695 10 639 18 989 69 427 12 699 74 710 27 471 16 015 13 322 5 620 2 073 651 l 195 4 263 4 100
244 056 36 909 38 426 40 286 27 661 15 721 9 217 15 521 53 090 7 225 14 770 603 433 520 447 364 475 l 523 9 504 901 7 223 668 738 700 491 537 296 750 2 570 473
360 671 71 487 61 851 56 581 35 727 19 459 11 612 17 500 72 351 14 103
67 604 22 112 15 899 12 691 6 484 l 600 702 939 3 620 3 557 230 042 44 678 41 251 38 100 25 078 14 931 8 690 11 025 38 439 7 850
50 141 3 333 3 116 4 011 2 709 2 029 1 599 4 562 26 653 2 129
12 884 1 364 1 585 1 779 1 456 899 621 974 3 639 567
59 603 9 078 11 518 15 238 11 325 5 646 2 681 1 526 463 2 128
55 666 8 196 10 515 14 221 10 987 5 473 2 590 1 444 361 1 879
249 172 36 671 45 912 58 114 50 334 27 251 13 846 6 367 1 876 8 801
4 181 4 040 3 986 3 814 4 445 4 827 5 164 4 172 4 052 4 136
4 476 4 474 4 366 4 086 4 581 4 979 5 346 4 409 ... 4 684
150 167 9 639 10 327 11 993 9 288 8 604 6 492 15 780 71 478 6 566
141 216 8 679 9 561 11 086 8 675 8 150 6 262 14 965 68 094 5 744
674 146 45 883 47 410 51 552 34 358 33 850 27 471 63 254 345 566 24 802
4 489 4 760 4 591 4 299 3 699 3 934 4 232 4 008 4 835 3 777
4 774 5 287 4 959 4 650 3 961 4 153 4 387 4 227 5 075 4 318
461

Table 17. Social Birth:
Characteristics of the foreign-Born Population by Year of Immigration and Country of
1970- Continued
United States
CUBA
Age
Mala, all ages _________________________ _
Under 5 years---------------------------------5 to 9 years ----------------------------------10 to 14 years --------------------------------15 to 19 years ------ -------- -- -- -- -- ---- -- ----20 to 24 years --------------------------------25 to 29 years --------------------------------30 to 34 years --------------------------------35 to 39 years --------------------------------40 to 44 years --------------------------------
45 to 49 years --------------------------------50 to 54 years --------------------------------55 to 59 years --------------------------------60 to 64 years --------------------------------65 to 69 years --------------------------------70 to 74 years --------------------------------75 to 79 years --------------------------------80 to 84 yeors --------------------------------85 years end over ---------------------------Median oge ----------------------------------
--
Female, all ages------------------------Under 5 years _______________________________ _ -5 to 9 years ---------------------------------10 to 14 years-------------------------------15 to 19 years-------------------------------20 to 24 years-------------------------------25 to 29 years-------------------------------30 to 34 years--------------------------------35 to 39 years-------------------------------40 to 44 years ------------------------ -------
-----
--
45 to 49 years-------------------------------50 to 54 years-------------------------------55 to 59 years-------------------------------60 to 64 years ______________________________ _
65 to 69 years-------------------------------70 to 74 years-------------------------------75 to 79 years-------------------------------80 to 84 years-------------------------------85 years and over ---------------------------Median age----------------------------------
Citizenship
Tata I ________________ -- ____ ---- ____ --Naturalized ______________________________ ----Alien ______ ------ __ ------ ___________________ _
Marital Status
----------
---
Male, 14 years aid and aver __ ------------ -Single ______________________________________ _ -Married __ ------ ------ ______ ---- ____ ------ ___ _
Widowed ___________________________________ _ -Divorced ___________________________________ _ -
Female, 14 years old and over------------Single ______________________________________ _ --Married ____ ---- _____________________________ _
Widowed ________ -------- ______________ ------Divorced ___________________________________ _ --Fertility
Women, 35 lo 44 years old --------------Ever married---------------------------------Number of children ever born------------------
Per 1,000 women---------------------------= Per 1,000 ever married women ________________ _
Women, 45 years aid and over ____________ _ Ever married---------------------------------Number of children ever born
Per 1,000 women--------=·=================== Per 1,000 ever married women __________ ------_
462
A e and ear of immigration were not edited for consistency1 see Appendix D. Data based on S·percent sample, see text. For minimum base far derived l ( g t y di etc) and meaning of symbols see text I figures percen , me an,
1965 1960 1955 1950 1945 1935 1925 -to to to to to to to Before
Toto I 1970 1964 1959 1954 1949 1944 1934 1925 Not reported
-
208 670 89 243 80 413 19 018 6 805 3 619 2 255 2 021 1 855 3 441 3 474 3 037 97 46 - 19 - - - 275
15 537 12 236 2 684 77 31 - - - - 509 19 578 10 574 7 866 780 19 - - 18 - 321 18 698 6 793 9 774 l 451 251 - - 72 - 357 12 139 l 810 8 051 1 469 443 40 22 - - 304 12 821 2 584 7 716 l 485 496 158 86 - - 296 18 558 8 435 6 935 2 103 626 187 106 - 28 138 20 795 8 926 7 461 2 562 1 002 433 211 39 - 161 22 349 9 293 7 476 3 047 l 097 772 250 216 19 179
18 719 6 616 7 056 2 291 l 313 625 346 168 67 237 14 286 5 240 5 338 l 564 748 479 463 165 171 118 10 784 4 489 3 572 1 042 318 310 389 364 187 113 8 192 3 214 3 005 398 234 295 152 484 253 157 6 428 2 848 l 941 359 168 128 122 287 396 179 2 759 1 319 609 198 24 65 32 131 359 22 2 095 1 137 467 76 19 50 64 32 215 35 l 057 528 283 50 16 16 - - 144 20
401 164 82 20 - 42 12 45 16 20 35.8 34.5 32.9 39.1 42.4 46.6 51.2 59.6 67.6 24.3
237 320 110 418 84 709 19 686 7 419 4 961 2 429 1 350 1 957 4 391 3 926 3 443 83 - 26 - - 22 - 352
14 565 11 653 2 361 76 18 - 10 17 - 430 19 287 9 958 7 844 879 65 20 - 17 - 504 19 056 8 246 8 157 l 769 580 - - - - 304 15 520 5 838 7 754 l 026 433 157 - - - 312 17 064 8 224 6 777 l 343 344 136 16 - - 224 21 993 10 175 7 636 2 724 560 316 183 - - 399 23 416 10 306 8 140 3 025 858 555 202 87 47 196 23 720 8 868 8 976 2 802 1 506 818 313 204 - 233
19 457 6 909 7 313 2 110 l 184 942 444 160 96 299 14 924 5 560 5 470 1 638 583 640 333 84 311 305 13 678 6 207 4 559 697 550 704 246 236 276 203 11 165 5 100 3 954 581 347 280 310 159 216 218 8 065 4 133 2 205 516 176 207 181 171 353 123 3 932 2 005 1 148 298 54 76 58 75 144 74 3 746 1 864 1 100 164 77 77 46 101 279 38 2 236 1 220 750 - - 19 44 17 81 105 l 570 709 482 38 58 14 43 - 154 72
36.5 33.9 36.1 38.3 42.7 47.5 50.7 56.8 65.5 30.9
445 990 199 661 165 122 38 704 14 224 8 580 4 684 3 371 3 812 7 832 108 301 20 942 40 160 18 078 9 233 7 055 3 895 3 115 3 251 2 572 337 689 178 719 124 962 20 626 4 991 l 525 789 256 561 5 260
174 177 65 429 71 442 18 395 6 755 3 600 2 255 2 021 1 855 2 425 41 048 14 218 20 463 3 708 827 469 232 94 109 928
126 789 48 596 48 953 14 233 5 559 2 880 1 860 l 775 l 479 l 454 2 370 l 308 468 90 105 112 125 46 73 43 3 970 1 307 1 558 364 264 139 38 106 194 -
203 087 86 922 75 989 19 073 7 332 4 941 2 419 1 294 1 957 3 160 42 152 19 096 17 349 3 115 953 388 255 40 238 718
128 368 53 351 47 806 13 438 5 295 3 477 l 510 909 661 l 921 19 889 9 532 6 347 l 082 501 467 360 291 924 385 12 678 4 943 4 487 l 438 583 609 294 54 134 136
47 136 19 174 17 116 5 827 2 364 1 373 515 291 47 429 44 177 17 799 15 861 5 695 2 348 1 308 449 291 17 409 90 977 35 751 33 207 10 812 5 279 3 046 l 158 648 102 974 l 930 l 865 l 940 l 856 2 233 2 218 2 249 " . " . 2 270 2 059 2 009 2 094 1 899 2 248 2 329 2 579 ". . " 2 381
78 773 33 707 26 981 6 042 3 029 2 959 1 705 1 003 1 910 1 437 72 021 30 594 24 824 5 656 2 726 2 728 1 538 963 l 702 1 290
159 393 76 193 52 023 10 982 3 932 4 199 2 297 2 058 4 579 3 130 2 023 2 260 l 928 1 818 l 298 1 419 1 347 2 052 2 397 2 178 2 213 2 490 2 096 l 942 l 442 1 539 1 493 2 137 2 690 2 426
NATIONAL ORIGIN AND LANGUAGE
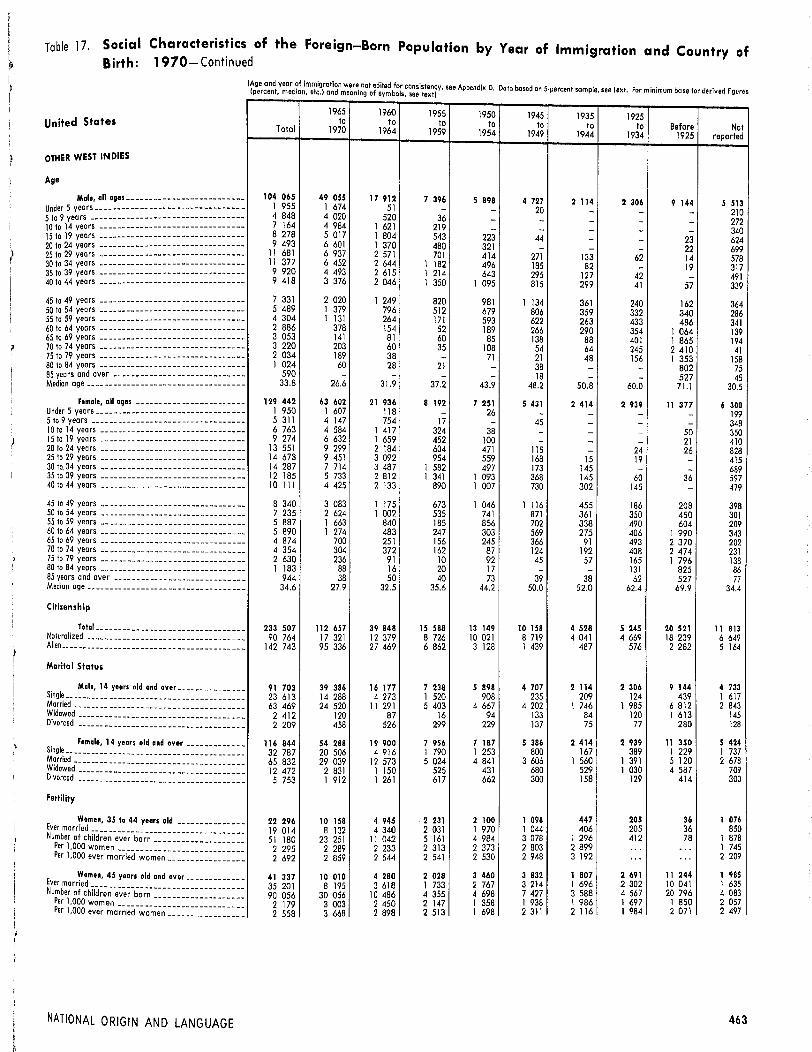
I
I l Table 17. Social Characteristics of the Foreign-Born Population by Year of Immigration and Country of 11 Birth: 1970-Continued
United States
OTHER WEST INDIES
Age
Male, all agas--------------------------Under 5 years -- ---- -- -- -- -- -- -- ------ -- ---- -- -5 to 9 years----------------------------------10 to 14 years --------------------------------15 to 19 years --------------------------------20 to 24 years --------------------------------25 to 29 years --------------------------------30 to 34 years --------------------------------35 to 39 years -- ------------------------------40 to 44 years--------------------------------
45 to 49 years --------------------------------50 to 54 years --------------------------------55 to 59 years --------------------------------60 to 64 years --------------------------------65 to 69 years --------------------------------70 to 74 years--------------------------------75 to 79 years--------------------------------80 to 84 years --------------------------------85 years and over----------------------------Median age-----------------------------------
Female, all ages ------------------------Under 5 years ____ •• ____ -- -- -- ________________ _
5 to 9 years ----------------------------------10 to 14 years--------------------------------15 to 19 years --------------------------------20 to 24 years--------------------------------25 to 29 years __ -- -- -- -- -- -- -- __ -- -- -- -- -- ___ _ 30 to. 34 years __ ------ ------------------------35 to 39 years ______________ -- -- -- -- -- -- -- -- --40 to 44 years--------------------------------
45 to 49 years -------------------------------50 to 54 years -------------------------------55 to 59 years-------------------------------60 to 64 years -------------------------------65 to 69 years-------------------------------70 to 74 years -------------------------------75 to 79 years -------------------------------80to84 years-------------------------------85 years and over ___________________________ _ Median age _________________________________ _
Citiienship
Total _______________________________ _ Naturalized __________________ -- ______ -- -- -- --Alien •• ________________ -- -- ____ -- -- -- -- -- -- --
Marital Status
Male, 14 years old and over _____________ _ Single ______________________________________ _ Married ______________________________ -- __ -- -Widowed ___________________________________ _ Divorced ___________________________________ _
Female, 14 years old and over ___________ _ Single ______________________________________ _
~f J~~~d-======= == = = = = == === = = = = == = === = = = = = = = = Divorced ___________________________________ _
Fertility
Women, 45 years old and over ~ver bmarried ____________________ -============ u~ er of children ever born------------------per 1,000 women---------------------------er l ,000 ever married women __________ ---- __
NATIONAL ORIGIN AND LANGUAGE
----------
---
-----
-----
----------
1965 to
Toto I 1970
104 065 49 055 l 955 1 674 4 848 4 020 7 164 4 984 8 278 5 017 9 493 6 601
11 681 6 937 11 377 6 452 9 920 4 493 9 418 3 376
7 331 2 020 5 489 l 379 4 304 l 131 2 886 378 3 053 141 3 220 203 2 034 189 1 024 60
590 -33.8 26.6
129 442 63 602 l 950 l 607 5 311 4 147 6 763 4 584 9 274 6 632
13 551 9 299 14 673 9 451 14 287 7 714 12 185 5 733 10 111 4 425
8 340 3 083 7 235 2 624 5 887 l 663 5 890 l 274 4 874 700 4 354 304 2 630 236 l 183 88
944 38 34.6 27.9
233 507 112 657 90 764 17 321
142 743 95 336
91 703 39 386 23 613 14 288 63 469 24 520
2 412 120 2 209 458
116 844 54 288 32 787 20 506 65 832 29 039 12 472 2 831 5 753 l 912
22 296 10 158 19 014 8 132 51 180 23 251 2 295 2 289 2 692 2 859
41 337 10 010 35 201 8 195 90 056 30 056
2 179 3 003 2 558 3 668
1960 1955 1950 to to to
1964 1959 1954
17 912 7 396 5 898 51 - -
520 36 -1 621 219 -1 804 543 223 l 370 480 321 2 571 701 414 2 644 1 182 496 2 615 1 214 643 2 046 1 350 l 095
1 249 820 981 796 512 679 264 l7l 593 154 52 189 Bl 60 85 60 35 108 38 - 71 28 21 -- - -
31.9 37.2 43.9
21 936 8 192 7 251 118 - 26 754 17 -
1 417 324 38 1 659 452 100 2 184 604 471 3 092 954 559 3 487 l 582 497 2 812 l 341 l 093 2 133 890 l 007
1 175 673 l 046 1 002 535 741
840 185 856 483 247 303 251 156 245 372 162 87
91 10 92 16 20 17 so 40 73
32.5 35.6 44.2
39 848 15 588 13 149 12 379 8 726 10 021 27 469 6 862 3 128
16 177 7 238 5 898 4 273 l 520 908
11 291 5 403 4 667 87 16 94
526 299 229
19 900 7 956 7 187 4 916 l 790 l 253
12 573 5 024 4 841 l 150 525 431 l 261 617 662
4 945 2 231 2 100 4 340 2 031 l 970
l l 042 5 161 4 984 2 233 2 313 2 373 2 544 2 541 2 530
4 280 2 028 3 460 3 618 l 733 2 767
10 486 4 355 4 698 2 450 2 147 l 358 2 898 2 513 1 698
1945 1935 1925 to to to Before Not
1949 1944 1934 1925 reported
4 727 2 114 2 306 9 144 5 513 20 - - - 210 - - - - 272 - - - - 340 44 - - 23 624 - - - 22 699
271 133 62 14 578 185 82 - 19 317 295 127 42 - 491 815 299 41 57 339
1 134 361 240 162 364 806 359 332 340 286 622 263 433 486 341 266 290 354 1 064 139 138 88 401 l 865 194 54 64 245 2 410 41 21 48 156 l 353 158 38 - - 802 75 18 - - 527 45
48.2 so.a 60.0 71.l 30.5
5 431 2 414 2 939 11 377 6 300 - - - - 199
45 - - - 348 - - - 50 350 - - - 21 410
115 - 24 26 828 168 15 19 - 415 173 145 - - 689 368 145 60 36 597 730 302 145 - 479
l 116 455 186 208 398 871 361 350 450 301 702 338 490 604 209 569 275 406 1 990 343 366 91 493 2 370 202 124 192 408 2 474 231 45 57 165 1 796 138 - - 131 825 86
39 38 62 527 77 50.0 52.0 62.4 69.9 34.4
10 158 4 528 5 245 20 521 11 813 8 719 4 041 4 669 18 239 6 649 l 439 487 576 2 282 5 164
4 707 2 114 2 306 9 144 4 733 235 209 124 439 l 617
4 202 l 746 l 985 6 812 2 843 133 84 120 1 613 145 137 75 77 280 128
5 386 2 414 2 939 11 350 5 424 800 167 389 l 229 l 737
3 606 l 560 l 391 5 120 2 678 680 529 1 030 4 587 709 300 158 129 414 300
1 098 447 205 36 1 076 l 044 406 205 36 850 3 078 l 296 412 78 l 878 2 803 2 899 ... ... 1 745 2 948 3 192 ... ... 2 209
3 832 1 807 2 691 11 244 1 985 3 214 l 696 2 302 10 041 l 635 7 427 3 588 4 567 20 796 4 083 l 938 l 986 l 697 l 850 2 057 2 311 2 116 l 984 2 071 2 497
463
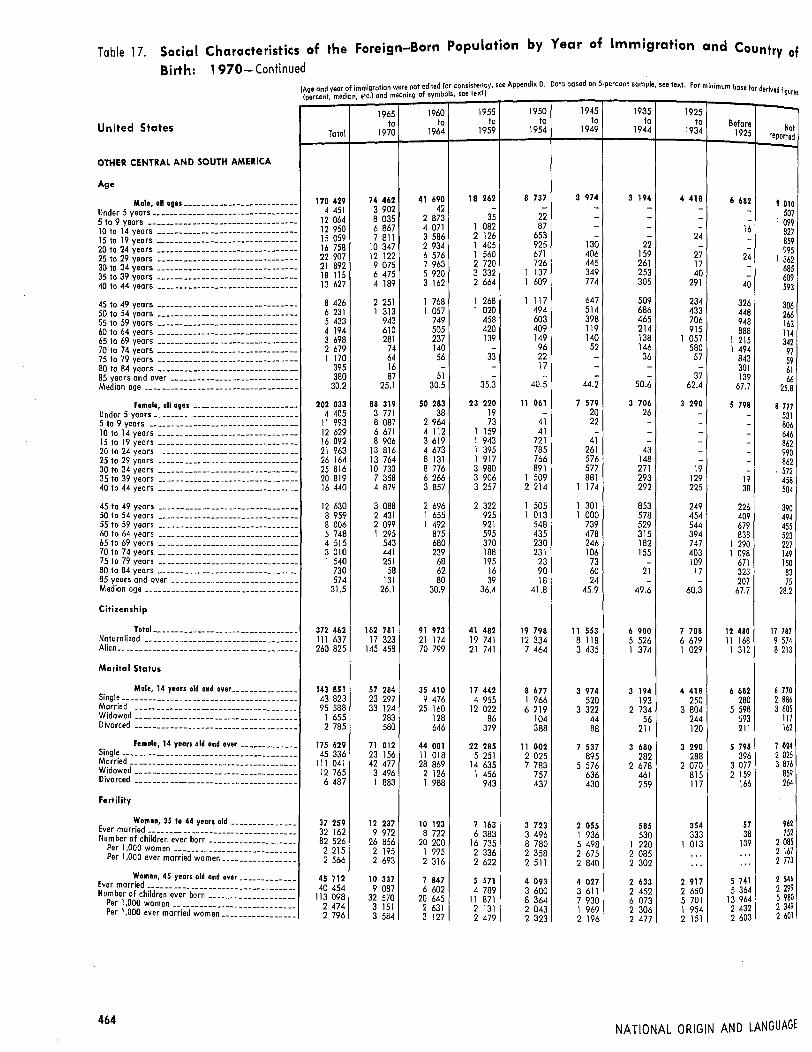
Table 17. Social Characteristics of the Foreign-Born Population by Year of Immigration and Country of
Birth: 1970- Continued
United States
OTHER CENTRAL AND SOUTH AMERICA
Age
Malt, all ages _________________________ _
Under 5 years_ ___ -- -- -- -- -- ---- -- ---- -- -- -- -- -5 to 9 years ----------------------------------10 to 14 years --------------------------------15 to 19 years--------------------------------20 to 24 years --------------------------------25 to 29 years--------------------------------30 to 34 years--------------------------------35 to 39 years --------------------------------40 to 44 years--------------------------------
45 to 49 years--------------------------------50 to 54 years --------------------------------55 to 59 years --------------------------------60 to 64 years--------------------------------65 to 69 years ------ -------- ------ ------ -- -- --70 to 74 years--------------------------------75 to 79 years--------------------------------80 to 84 years --------------------------------85 years and over ----------------------------Median age-----------------------------------
Female, all ages ______ ---- __ -------- __ --Under 5 years ____ ---- ____ ---------------------5 to 9 years ----------------------------------10 to 14 years --------------------------------15 to 19 years --------------------------------20 to 24 years --------------------------------25 to 29 years --------------------------------30 to 34 years --------------------------------35 to 39 years --------------------------------40 to 44 years ____________________________ -- __
45 to 49 years --------------------------------50 to 54 years --------------------------------55 to 59 years --------------------------------60 to 64 years --------------------------------65 to 69 yeors --------------------------------70 to 74 years --------------------------------75 to 79 yeors --------------------------------80 to 84 years --------------------------------85 years and over---------------------------Median age----------------------------------
--
Citizenship
Total ________________________________ _ Naturalized __________________________________ _ Alien ______________________________ ------ ___ _
-
Marital Status
Male, 14 years aid and over_ _____________ _ Single _______________________________________ _ Married _____________________________________ _ Widowed ______________________________ ------ _ Divorced ____________________________________ _
Female, 14 years old and over-------------Single ______ -- ________ -- -- -- __ -- -- -- __ -- -- -- --Married _____________________________________ _
Widowed __ -------- __ ------ ______ ------ ------ _ Divorced ________________________ ------ ______ _
Fertility
Women, 35 ta 44 years aid--------------Ever married---------------------------------Number of children ever born-------------------
Per 1,000 women----------------------------Per l.000 ever married women ________________ _
Women, 45 years old ond aver------------Ever married---------------------------------Number of children ever born-------------------
Per l,000 women----------------------------Per 1,000 ever married women ________________ _
464
!Age and year of immigration were not edited for consistency, see Appendix 0. Dato based on S·percent sample, see text. For minimum base for derived fl ure (percent median etc) and meaning of symbols, see textJ g s
1965 1960 1955 1950 1945 1935 1925 -to to to to to to to Before Not
Total 1970 1964 1959 1954 1949 1944 1934 1925 reported
170 429 74 462 41 690 18 262 8 737 3 974 3 194 4 418 6 682 9 010 4 451 3 902 42 - - - - - - 507
12 064 8 035 2 873 35 22 - - - - 1 099 12 950 6 867 4 071 1 082 87 - - - 16 827 15 059 7 811 3 586 2 126 653 - - 24 - 859 16 758 10 347 2 934 1 405 925 130 22 - - 995 22 907 12 122 6 576 1 560 671 406 159 27 24 l 362 21 892 9 075 7 963 2 720 726 445 261 17 - 685 18 115 6 475 5 920 3 332 l 137 349 253 40 - 609 13 627 4 189 3 162 2 664 l 609 774 305 291 40 593
8 426 2 251 l 768 l 268 l 117 647 509 234 326 306 6 231 l 313 l 057 1 020 494 514 686 433 448 266 5 433 943 749 458 603 398 465 706 948 163 4 194 610 505 420 409 119 214 915 888 114 3 698 281 237 139 149 140 138 l 057 l 215 342 2 679 74 140 - 96 52 146 580 l 494 97 l 170 64 56 33 22 - 36 57 843 59
395 16 - - 17 - - - 301 61 380 87 51 - - - - 37 139 66
30.2 25.1 30.5 35.3 40.5 44.2 50.6 62.4 67.7 25.8
202 033 88 319 50 283 23 220 11 061 7 579 3 706 3 290 5 798 8 777 4 405 3 771 38 19 - 20 26 - - 531
11 993 8 087 2 964 73 41 22 - - - 806 12 629 6 671 4 112 l 159 41 - - - - 646 16 092 8 906 3 619 l 943 721 41 - - - 862 21 963 13 816 4 673 l 395 785 261 43 - - 990 26 164 13 764 8 131 l 917 766 576 148 - - 862 25 816 10 730 8 776 3 980 891 577 271 19 - . 572 20 819 7 358 6 266 3 906 l 509 881 293 129 19 458 16 440 4 879 3 857 3 257 2 214 l 174 292 225 38 504
12 630 3 088 2 696 2 322 l 505 l 301 853 249 226 390 B 959 2 431 l 655 925 l 013 l 000 578 454 409 494 8 006 2 099 l 492 921 548 739 529 544 679 455 5 748 l 295 875 595 435 478 315 394 838 523 4 515 543 680 370 230 246 182 747 l 290 227 3 010 441 239 188 231 106 155 403 l 098 149 l 540 251 68 195 23 73 - 109 671 150
730 58 62 16 90 60 21 17 323 83 574 131 80 39 18 24 - - 207 75
31.5 26. l 30.9 36.4 41.8 45.9 49.6 60.3 67.7 28.2
372 462 162 781 91 973 41 482 19 798 11 553 6 900 7 708 12 480 17 787 111 637 17 323 21 174 19 741 12 334 8 118 5 526 6 679 11 168 9 574 260 825 145 458 70 799 21 741 7 464 3 435 l 374 l 029 l 312 8 213
143 851 57 284 35 410 17 442 8 677 3 974 3 194 4 418 6 682 6 770 43 823 23 297 9 476 4 955 l 966 520 193 250 280 2 886 95 588 33 124 25 160 12 022 6 219 3 322 2 734 3 804 5 598 3 605
1 655 283 128 86 104 44 56 244 593 117 2 785 580 646 379 388 88 211 120 211 162
175 629 71 012 44 001 22 285 11 002 7 537 3 680 3 290 5 798 7 024 45 336 23 156 11 018 5 251 2 025 895 282 288 396 2 025
111 041 42 477 28 869 14 635 7 783 5 576 2 678 2 070 3 077 3 876 12 765 3 496 2 126 l 456 757 636 461 815 2 159 859 6 487 l 883 1 988 943 437 430 259 117 166 264
37 259 12 237 10 123 7 163 3 723 2 055 585 354 57 962 32 162 9 972 8 722 6 383 3 496 I 936 530 333 38 752 82 526 26 856 20 200 16 735 8 780 5 498 l 220 l 013 139 2 085 2 215 2 195 1 995 2 336 2 358 2 675 2 085 ... ... 2 167 2 566 2 693 2 316 2 622 2 511 2 840 2 302 ... ... 2 773
45 712 10 337 7 847 5 571 4 093 4 027 2 633 2 917 5 741 2 546 40 454 9 087 6 602 4 789 3 600 3 611 2 452 2 650 5 364 2 299
113 098 32 570 20 645 11 871 8 364 7 930 6 073 5 701 13 964 5 980 2 474 3 151 2 631 2 131 2 043 I 969 2 306 l 954 2 432 2 349 2 796 3 584 3 127 2 479 2 323 2 196 2 477 2 151 2 603 2 601
NATIONAL ORIGIN AND LANGUAGE
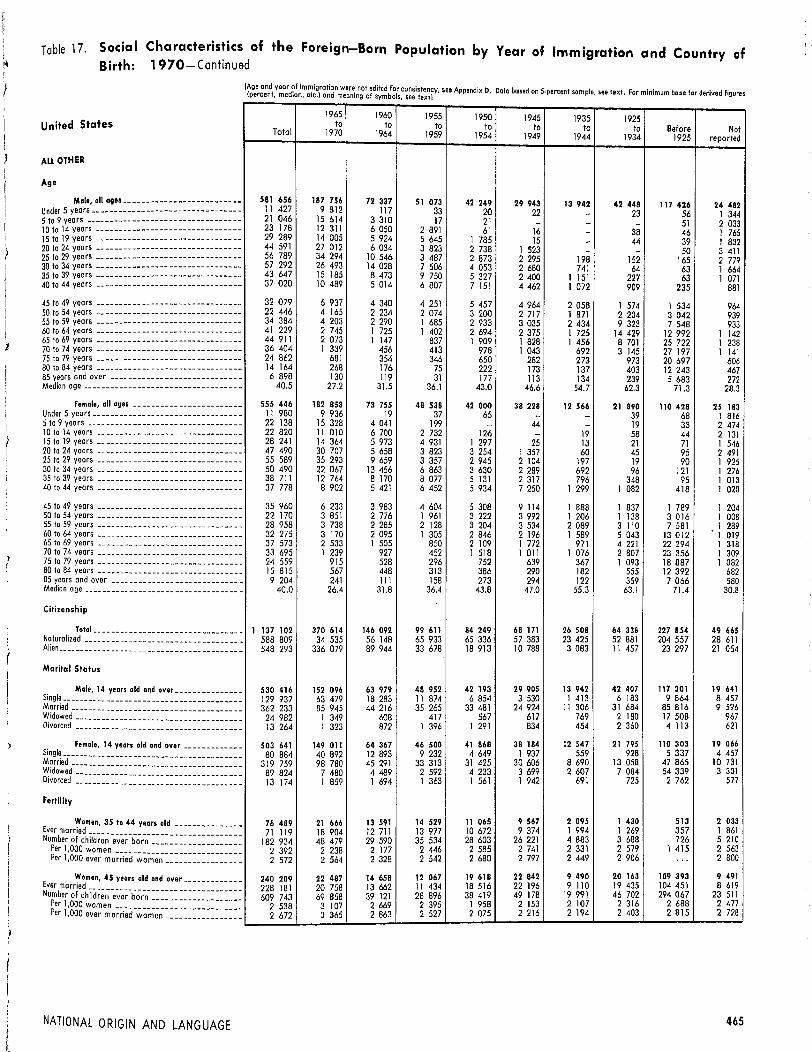
.. Table 17. Social Characteristics of the Foreign-Born Population by Year of Immigration and Country of ~ Birth: 1970-Continued
United States
ALL OTHER
Age Male, all ages _________________________ _
Under 5 years---------------------------------5 to 9 years -------------------- --------------10 to 14 years --------------------------------15 to 19 years--------------------------------20 to 24 years--------------------------------25 to 29 years--------------------------------30 to 34 years--------------------------------35 to 39 years--------------------------------40 to 44 years --------------------------------
45 to 49 years --------------------------------50 to 54 years--------------------------------55 to 59 years --------------------------------60 to 64 years --------------------------------65 to 69 years--------------------------------70 to 74 years --------------------------------75 to 79 years -- __ -- -- ______ -- _______________ _
80 to 84 years --------------------------------85 years and over __ -- -- -- -- -- ________________ _ Median age-----------------------------------
Female, all ages ------------------------Under 5 years ____ ---- ________________________ _
5 to 9 years----------------------------------10 to 14 years--------------------------------15 to 19 years--------------------------------20 to 24 years--------------------------------25 to 29 yeors --------------------------------30 to 34 years--------------------------------35 to 39 years--------------------------------40 to 44 years--------------------------------
45 to 49 years -------------------------------50 lo 54 years ______________________________ _
55 to 59 years-------------------------------60 to 64 years ______________________________ _ 65 to 69 years ______________________________ _
70 to 74 years-------------------------------75 to 79 years __________________ ---- ________ _ 80 to 84 years-------------------------------85 years and over----------------------------Median age----------------------------------
Citizenship
Total _______________________________ _ Naturalized _________________________________ _ Alien _______________________________________ _
Marital Status
Male, 14 years old and over _____________ _ Single ______________________________________ _ Married ____________________________________ _ Widowed ________________________ -- -- -- ---- --Divorced ___________________________________ _
Female, 14 years old and over ___________ _ Single ______________________________________ _ Married ____________________________________ _ Widowed ___________________________________ _ Divorced ___________________________________ _
Fertility
Women, 35 lo 44 years old -------------Ever married
Nu~~e[.~60c~l~~~fn-e~~~~~~r~~ == == == == == == == == == = Per 1,000 ever married women----------------
Women, 45 years old and over ___________ _ Ever married
----------
---
-----
-----
-----
--N b -- -- -- -- -- -- -- -- -- -- -- -- -- -- -- -- -u; er of children ever born __________________ --
per 1,000 women---------------------------er 1,000 ever married women---------------- -
NATIONAL ORIGIN AND LANGUAGE
1
1965 to
Total 1970
581 656 187 756 11 427 9 812 21 046 15 614 23 178 12 311 29 289 14 005 44 591 27 012 56 789 34 294 57 292 26 493 43 647 15 185 37 020 10 489
32 079 6 937 22 446 4 165 34 384 4 203 41 229 2 745 44 911 2 073 36 404 1 339 24 862 681 14 164 268 6 898 130
40.5 27.2
555 446 182 858 11 980 9 936 22 138 15 328 22 820 11 010 28 241 14 364 47 490 30 707 55 589 35 293 50 490 22 067 38 711 12 764 37 778 8 902
35 960 6 233 22 170 3 851 28 958 3 738 32 275 3 170 37 573 2 533 33 695 1 239 24 559 915 15 815 567 9 204 241
40.0 26.4
137 102 370 614 588 809 34 535 548 293 336 079
530 416 152 096 129 937 63 479 362 233 85 945
24 982 1 349 13 264 1 323
503 641 149 011 80 884 40 892
319 759 98 780 89 824 7 480 13 174 1 859
76 489 21 666 71 119 18 904
182 934 48 479 2 392 2 238 2 572 2 564
240 209 22 487 228 181 20 758 609 743 69 858
2 538 3 107 2 672 3 365
1960 1955 1950 to to to
1964 1959 1954
72 337 51 073 42 249 117 33 20
3 310 17 21 6 050 2 891 61 5 924 5 645 1 785 6 034 3 823 2 738
10 546 3 487 2 873 14 028 7 506 4 053 8 473 9 750 5 327 5 014 6 807 7 151
4 340 4 251 5 457 2 234 2 074 3 200 2 290 1 685 2 933 1 725 1 402 2 694 1 147 837 1 909
456 413 978 354 346 650 176 75 222 119 31 177
31.5 36.1 43.0
73 755 48 538 42 000 19 37 65
4 041 199 -6 700 2 732 126 5 973 4 931 1 297 5 658 3 823 3 254 9 659 3 357 2 945
13 456 6 863 3 630 8 170 8 077 5 131 5 421 6 452 5 934
3 983 4 604 5 308 2 776 1 961 3 222 2 285 2 128 3 204 2 095 1 305 2 846 1 505 850 2 109
927 452 1 518 528 296 752 448 313 386 111 158 273
31.8 36.4 43.B
146 092 99 611 84 249 56 148 65 933 65 336 89 944 33 678 18 913
63 979 48 952 42 193 18 283 11 874 6 854 44 216 35 265 33 481
608 417 567 872 1 396 1 291
64 367 46 500 41 868 12 893 9 232 4 649 45 291 33 313 31 425 4 489 2 592 4 233 1 694 1 363 1 561
13 591 14 529 11 065 12 711 13 977 10 672 29 590 35 534 28 603 2 177 2 446 2 585 2 328 2 542 2 680
14 658 12 067 19 618 13 662 11 434 18 516 39 121 28 896 38 419
2 669 2 395 1 958 2 863 2 527 2 075
1945 1935 1925 to to to Before Not
1949 1944 1934 1925 reported
29 943 13 942 42 448 117 426 24 482 22 - 23 56 1 344 - - - 51 2 033
16 - 38 46 1 765 15 - 44 39 1 832
1 523 - - so 3 411 2 295 198 152 165 2 779 2 680 741 64 63 1 664 2 400 1 151 227 63 1 071 4 462 1 072 909 235 881
4 964 2 058 1 574 1 534 964 2 717 1 871 2 204 3 042 939 3 035 2 434 9 323 7 548 933 2 375 1 725 14 429 12 992 1 142 1 828 1 456 8 701 25 722 1 238 1 043 692 3 145 27 197 1 141
282 273 973 20 697 606 173 137 403 12 243 467 113 134 239 5 683 272
46.6 54.7 62.3 71.3 28.3
38 228 12 566 21 890 110 428 25 m - - 39 68 1 816
44 - 19 33 2 474 - 19 58 44 2 131
25 13 21 71 1 546 1 357 60 45 95 2 491 2 104 197 19 90 1 925 2 289 692 96 121 1 276 2 317 796 348 95 1 013 7 250 1 299 1 082 418 1 020
9 114 1 888 1 837 1 789 1 204 3 992 1 206 1 138 3 016 1 008 3 534 2 089 3 110 7 581 1 289 2 196 1 589 5 043 13 012 1 019 1 772 971 4 221 22 294 1 318 1 011 1 076 2 807 23 356 1 309
639 367 1 093 18 887 l 082 290 182 SSS 12 392 682 294 122 359 7 066 S80 47.0 S5.3 63.1 71.4 30.8
68 171 26 508 64 338 227 854 49 665 57 383 23 425 52 881 204 557 28 611 10 788 3 083 11 457 23 297 21 054
29 905 13 942 42 407 117 301 19 641 3 530 1 413 6 183 9 864 8 457
24 924 11 306 31 684 85 816 9 596 617 769 2 180 17 508 967 834 454 2 360 4 113 621
38 184 12 547 21 795 110 303 19 066 1 937 559 928 5 337 4 457
30 606 8 690 13 058 47 865 10 731 3 699 2 607 7 084 54 339 3 301 1 942 691 72S 2 762 577
9 567 2 095 l 430 513 2 033 9 374 1 994 1 269 357 l 861
26 221 4 883 3 688 726 5 210 2 741 2 331 2 579 l 415 2 563 2 797 2 449 2 906 ... 2 800
22 842 9 490 20 163 109 393 9 491 22 196 9 110 19 435 104 451 8 619 49 178 19 991 46 702 294 067 23 511
2 153 2 107 2 316 2 688 2 477 2 216 2 194 2 403 2 815 2 728
465
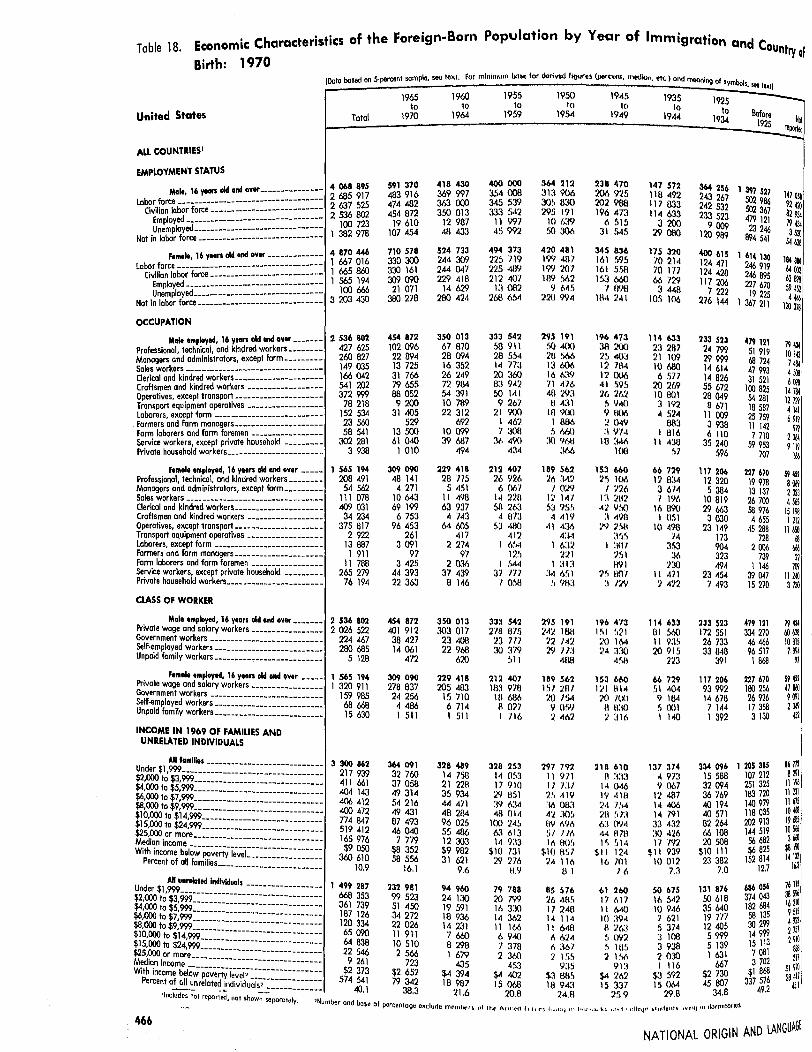
Table 18. · Ch ter'istics of the Foreign-Born Population by Year of Economic arac
Birth: 1970
Immigration and C ountry of
[Oat bosed on 5-percent scmplo, seo toxt. For minimum bo .. for derived hgur•• (1>•«."'11, modkln, ott) 000 meaning of, bol o ym s, S4M l8l<t]
1965 1960 1955 1950 1945 1935 1925 to to to to to to
Total 1970 1964 1959 1954 19-19 1944 1 9~ ~~~ Nol 1--~:.:.:.::....~~~~~~~~~~~~~~~~~~~~~~....:.:.=---...'.:~r~~~
United States
ALL COUNTRIES1
EMPLOYMENT STATUS
Malt, 16 Y9CI"' Gld and ov., ---------------Labor force-------·---------------------------
Civilian labor force---------------------------
ii~~:ti~id::::::::::::::::::::::::::::::: Not in labor force------------------------------
Femala, 16 years old and ••ef -------------Labor force-----------------------------------
Civilian labor force---------------------------
ii~~::i~;;::::::::::::::::::::::::::::::: Not in labor force------------------------------
OCCUPATION
Male employed, 16 years aid and ovef -------Professional, technical, and kindred workers _______ _ Managers and administrators, except farm. _______ _ Soles workers---------------------------------Clerical end kindred wcrkers---------------·----Croftsmen and kindred workers -----------------Operatives, except transport--------------------Transport equipment operatives -----------------Laborers, except form-------------------------· Formers and form mancgerS--------------------Fcrm laborers and form foremen ----------------Service workers, except private household -------- -Private household workers ..•• -------------------
Female 011playad, 16 years aid and over -----Professional, technical, and kindred workers _______ _ Managers and administrators, except form ••••••••• Soles workers---------------------------------Clerical end kindred workers--------------------Croftsmen and kindred workers-----------------Operatives, except transport--------------------Transport equipment operatives ---------------·-Laborers, except farm-------------------------Formers end form manogers--------------------Form laborers and farm foremen ----------------Service workers, except private household ---------Private household workers ______________________ _
CLASS OF WORKER
Mole 111ployed, 16 yean aid and aver------Private wage and salary workers----------------Government workers --------------------------Self-employed workers--------------------------Unpaid family workers •• _______________________ _
Fe11ala employed, 16 yeon old olld over ----Private wage end salary warkers ----------------Government workers --------------------------Self-employed workers--------------------------Unpaid family workers •• _______________________ _
INCOME IN 1969 OF FAMILIES AND UNRELATED INDIVIDUALS
All fa11llles ----------------------------
~s 1~ i :~~~~~~~~~~~~~~~~~~~~~~~~~~~~~=~ $~b~t~ $$9,999 ________________________ -----=-
• 0 .t,999 ____________________________ _ m·~ to $24,999 ____________________________ _
Median i~~o~~:::::::·---------------- ----- •• With income below povert;i;;;i::::::::::::::::::
Percent of all families ________________________ _
4 068 895 2 685 917 2 637 525 2 536 802
100 723 1 382 978
4 870 446 1 667 016 l 665 860 1 565 194
100 666 3 203 430
2 536 802 427 625 260 827 149 035 166 042 541 202 372 999
78 218 152 534 23 560 58 541
302 281 3 938
1 565 194 208 491 54 562
1ll 078 409 031 34 234
375 817 2 922
13 887 1 911
11 788 265 279
76 194
2 536 802 2 026 522
224 467 280 685
5 128
1 565 194 l 320 911
159 985 68 668 15 630
3 300 862 :m 939 411 661 404 143 406 412 400 472 774 847 519 412 165 976 $9 050
360 610 10.9
591 370 483 916 474 482 454 872
19 610 107 454
710 578 330 300 330 161 309 090
21 071 380 278
454 872 102 (116 22 894 13 725 31 766 79 655 88 052 9 200
31 405 529
13 500 61 040 1 010
309 090 48 141 4 271
10 643 69 199
6 753 96 453
261 3 091
97 3 425
44 393 22 363
454 872 401 912 36 427 14 061
472
309 090 278 837 24 256 4 486 l 511
364 091 32 760 37 058 49 314 54 216 49 431 87 493 46 040 7 779
$8 352 58 556
16.l
418 430 369 997 363 CXXl 350 013
12 987 48 433
524 733 244 309 244 047 229 416
14 6'J9 280 424
350 013 67 870 28 W4 16 352 26 249 72 964 54 391 10 789 22 312
m2 10 rm 39 687
494
229 418 28 775
5 451 11 498 63 937 4 74:1
64 605 417
2 274 97
2 036 37 439 0 146
350 013 303 017 23 408 22 960
620
229 418 205 48.1
l!i 710 6 714 1 511
328 489 14 758 21 228 35 934 44 471 48 284 96 025 55 486 12 303 $9 982 31 621
9.6
400 000 354 008 345 539 3:13 542
11 997 45 992
494 373 225 719 225 489 212 407
1:1 082 268 654
333 542 58 911 20 554 1.i 773 20 360 S:l 942 50 14! 9 267
21 9()0 1 462 7 :IOO
36 49() 4:14
212 407 26 9?.lt 6 061
14 no SH 263
4 81:! !i:I •l8Cl
412 l 6~1
l:l!i I 544
37 171 l 0!>8
333 542 276 87!l 23 771 30 :179
511
212 407 18:1 970 \fl 686
!1 027 1 111,
328 253 14 053 17 91() 29 851 39 6.14 48 014
ltXl 245 6.1 613 14 933
$10 731 29 276
8.9
364 212 313 906 305 83() 295 191
10 0.19 50 306
470 441 199 48'/ 199 20/ 109 562
9 M5 no 994
295 191 ~j() 4(X)
20 566 1:1 IJ,)6 16 t>..l'i 71 •176 48 '..19:1 !l 4:11
l!l 9<X:l 1 BS6 !) fHl
:10 'it.fl '.166
189 St.2 26 :142 I O:x>
12 1'1/ ~;1 'i!i~ 4 4 l'i
•ll 4:'14'1 4:!4
1 6:12 :.?:Jl
1 :11:1 :\.I 6~11
!1 911:1
2'15 191 242 rnn
22 J4') 29 ll:I
4811
189 562 1 S7 :.>HJ 20 7!14 9 O!i'i 2442
'1'17 192 11 911 17 J:I/ 2~ 419 :11i 011:1 "'' ;l()~l 119 696 ~)7 116 16 f:l(')~,
$Hl 11~1 24 116
!l.l
238 470 206 925 202 900 196 473
6 515 31 s-15
34S 8.36 161 595 161 5!)£1 1~>3 6fl>
., 098 184 :w
1% 473 :~1 :X:Xl 25 4<'.1:1 12 7S4 12 CX)6 oil 595 26 242 ~ 'Ji!() 9 fl()6 :l 00 :1 IJ/4
HI '.146 10tl
1S3 6bO ?~ 1()6
I 126 l :1 2112 4:.' IJ!i()
:1 4<,18 '.l9 ;~
:m 1 :l07
:?~l fl'.11
:?~ Ii{)/ :.1 1'19
19'6 473 1~1 f1:?l :Xl 16-1 :?4 :l'.l!l
-1~.>ll
1$3 660 1'..'1 lll•I :Xl l(X) u u:io , :116
218 610 ll :.1:1:1
IA 046 19 4111 :?A IY, :tu 51;1 6:t 0'14 44 am l'i fil.t
$11 124 16 !01
., 6
147 572 118 492 117 833 114 633
3 200 29 000
11s :no 70 214 '10 177 (;,{, m :i 448
105 106
114 6-33 2:1 267 21 109 10 600 6 577
20 269 l() 001 3 192 " 524
t!B:I l 816
11 436 57
1>6 72'1 12 0:14
:1 674 ] 196
16 890 l OSI
10 498 14
:is:1 :16
:i:JO 11 471 2 4'.12
114 633 81 !>6() 11 93S 20 91.S
22:1
"" 729 51 4()4 9 1&1 5 (Xll 1 14()
137 374 ... 973 'I 067
12 487 l>I 406 14 791 33 432 :JO 426 17 m
$1 l 93'1 10 012
7,3
364 256 243 267 242 532 233 523
9 009 120 989
400 615 124 471 124 426 117 206
7 222 276 14.t
233 523 24 799 29 999 14 614 14 826 55 672 28 049 a 671
11 009 3 938 6 110
35 240 596
117 206 12 320 5 364
10 619 29 663 3 030
23 M9 173 904 323 494
23 454 7 493
233 $23 in 551 26 733 33 848
391
117 206 93 992 14 678 7 144 I 392
33-4 096 15 588 32 094 36 769 40 194 40 571 82 264 66 108 20 508
$10 111 23 382
7.0 All unrwlated Individuals
Under $1,999 .• __ _ ---------- 1 499 287 232 981 94 960 79 788 85 576 bl 2t.O SO 675 131 876 $2,000 to $3,999.:.::::::::::··---------------- 668 353 99 523 24 130 20 799 26 48~> 17 61"1 16 542 SO 618 $4,000 to $5 999 ------------------ 361 739 51 450 19 591 16 330 17 246 11 MO 10 946 35 640 $6,000 to ]°999 ·------------------------------ 187 126 34 272 18 36 1 621 19 777 $8,000 to ~9·999------------------------------- 120 334 22 026 14 ~31 1i m :i ~ 1~ ~.:i 5 374 12 405 $10 000 to $i4 999---------------------- 65 090 11 911 7 6YJ 6 940 6 624 5 C'fr.l 3 108 5 999
~f: ~~ ~~:w=======:=====:=============== ~ ~ l~ lli ~ ~ ~ ill ~ ;~; j ~ ~ ~ 6~ ~ m Median Income ------------------------------- 9 261 723 435 453 935 '11'.J l 116 667 With income bel~wp~~~rtYle""v-ei;--------------- -- $2 373 $2 652 $4 394 $4 402 $3 811~ $4 26'2 $3 592 $2 730
Percent ofGll unrelated individu~I;;··------------ 574 541 79 342 16 987 15 068 lll 94:\ 15 :1:11 15 064 45 607
l 397 527 502 986 502 367 479 121
23 246 894 541
1 614 130 246 919 246 895 227 670
19 225 l 367 211
479 121 51 919 68 724 47 993 31 521
100 825 54 281 18 587 25 759 11 142 7710
59 953 707
227 670 19 978 13 137 26 700 58 976 4655
45 288 728
2 006 739
1 146 39 047 15 270
479 121 334 270 46 466 96 517 l 868
227 670 180 256 26 926 17 358 3 130
1 205 385 107 212 251 325 183 720 140 979 118 035 202 913 144 519 56 682 $6 825
152 814 12.7
~ 056 374 043 182 684 58 135 30 299 14 999 15 113 7 081 3 702
$1 868 337 576
49.2 'Inc~·;;;,, report-ed, not shown ,:::~~:I~~----~ b 40. l 38.3 21.6 20.8 24.8 './S.9 Z9.8 34.8 , urn er and bose of pcrccr\1091! e11.dl1dc tnf'mhc.•t!> nl thlf' Armf'41 f 1111 ""' i,..,,H(J 11 < hiutw i.-. ,m11 111 llr•J" t.lu1fcmU l1v111y m dontiimrios.
147 051 92 4~ 82 954 79 434 3 5:!)
54 638
1843!0 M002 63 898 59 452 4 446
120 318
79434 10 14l 7~ 4500 6(118
14784 12729 4141 6919
9"/I 2364 9119
IOI
59451 8069 2323 4565
15198 1212
11650 68
w, 22
lrJI 112411 37:ll
79434 60 628 10815 7894
91
59451 478lll 91)11 2 049
452
86112 8291
11196 11231 11675 10 409 19685 10 516 36/.ll
$8 IW 14 in
16,3
7611! 38596 162!0 9515 49'/l 2151 2910
8$l 311
$19~ 28411
45,I
466 NATIONAL ORIGIN AND LANGUAGl
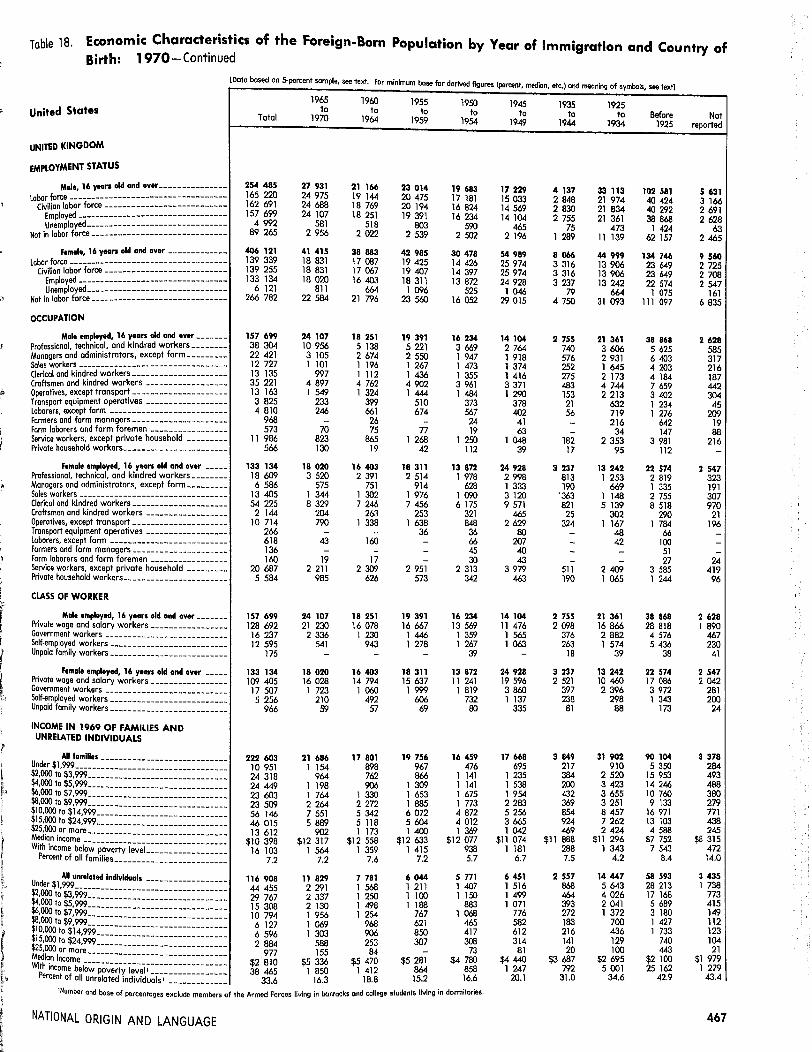
Table 18. Economic Characteristics of the Foreign-Born Population by Year of Immigration and Country of Birth: 1970-Continued
[Data based an 5-percent sample, see text. Far minimum base far derived figure• (peroint median etc ) and meaning of symbols see text]
United States
UNITED KINGDOM
EMPLOYMENT STATUS
Male, 16 years old and over---------------Labor force-----------------------------------
Civilian labor force---------------------------
~~~~~1~;d::::::::::::::::::::::::::::::: Not in labor force------------------------------
Female, 16 years old and over -------------Labor force-----------------------------------
Civilian labor force---------------------------
~~~~~l~y;d:::::::: :: :: ==== :: :: ::: : :::::: = Not in labor force------------------------------
OCCUPATION
Malt employed, 16 years old and over-------Prafessionol, technical, and kindred workers _______ _ Managers ond administrators, except farm ________ _ Sales workers---------------------------------Clerical and kindred workers ____________________ _ Craftsmen ond kindred workers -----------------Operatives, except transport--------------------Transport equipment operatives -----------------Laborers, except form --------------------------Farmers and form managers ____________________ _
Form laborers ond form foremen ----------------Service workers, except private household --------Private household workers-----------------------
Female employed, 16 years aid ond over -----Professional, technical, and kindred workers _______ _ Managers ond administrators, except farm ________ _ Sales workers---------------------------------Clerical and kindred workers_ ___________________ _
Craftsmen ond kindred workers -----------------Operatives, except transport--------------------Transport equipment operatives -----------------laborers, except form --------------------------Farmers and form managers ____________________ _
Farm laborers and form foremen ----------------Service workers, except private household --------Private household workers---------------------- -
CLASS OF WORKER
Male employed, 16 years old and aver-----Private wage and salary workers---------------Government workers -------------------------Self-employed workers-------------------------Unpaid family workers ________________________ _
Female employed, 16 years old and over ___ _ Private wage and salary workers---------------Government workers -------------------------Self-employed workers-------------------------Unpaid family workers ________________________ _
INCOME IN 1969 OF FAMILIES AND UNRELATED INDIVIDUALS
~j ·~ti~\~~~i~i~llll~l=~~~~~~~l~~~-~ m:~ :~ $~!·::---------------------------
~~~~i~~o~~;~=========================::::: 1pt income below poverty level ________________ _
ercent of all families _______________________ _
U d All unrelated Individuals -----------------
ri·~ ~~ ~ 999:::::::::=:::::::=:=:::::::::: $6:000 :~ ~N~------------------------------ria~~o$~i'7.9~:::::==::::::=::::::::::===: $15,()()() to $24,999---------------------------$25,000 or more __ ---------------------------Medion income ----------------------------With income be1;;-p;~;;;y1;;;i~::::::::==::::::
Percent of all unrelated individuals' ------------
-----
-----
------------------------
1965 to
Total 1970
254 485 27 931 165 220 24 975 162 691 24 688 157 699 24 107
4 992 581 89 265 2 956
406 121 41 415 139 339 18 831 139 255 18 831 133 134 18 020
6 121 811 266 782 22 584
157 699 24 107 38 304 10 956 22 421 3 105 12 727 1 101 13 135 997 35 221 4 897 13 163 1 549 3 825 233 4 810 246
968 -573 70
11 986 823 566 130
133 134 18 020 18 609 3 520 6 586 575
13 405 1 344 54 225 8 329
2 144 204 10 714 790
266 -618 43 136 -160 19
20 687 2 211 5 584 985
157 699 24 107 128 692 21 230 16 237 2 336 12 595 541
175 -
133 134 18 020 109 405 16 028
17 507 l 723 5 256 210
966 59
222 603 21 686 10 951 1 154 24 318 964 24 449 1 198 23 603 1 764 23 509 2 264 56 146 7 551 46 015 5 889 13 612 902
$10 398 $12 317 16 103 1 564
7.2 7,2
116 908 11 829 44 455 2 291 29 767 2 337 15 308 2 130 10 794 1 956 6 127 1 069 6 596 1 303 2 884 588
977 155 $2 810 $5 336 38 465 l 850
33.6 16.3
1960 1955 1950 to to to
1964 1959 1954
21 166 23 014 19 683 19 144 20 475 17 181 18 769 20 194 16 824 18 251 19 391 16 234
518 803 590 2 022 2 539 2 502
38 883 42 985 30 478 17 087 19 425 14 426 17 067 19 407 14 397 16 403 18 311 13 872
664 1 096 525 21 796 23 560 16 052
18 251 19 391 16 234 5 138 5 221 3 669 2 674 2 550 1 947 1 196 1 267 1 473 1 112 1 436 1 355 4 762 4 902 3 961 1 324 1 444 1 484
399 510 373 661 674 567 26 - 24 75 77 19
865 1 268 1 250 19 42 112
16 403 18 311 13 872 2 391 2 514 1 978
751 914 628 1 302 1 976 1 090 7 246 7 456 6 175
263 253 321 1 338 1 638 848
- 36 36 160 - 66
- - 45 17 - 30
2 309 2 951 2 313 626 573 342
18 251 19 391 16 234 16 078 16 667 13 569 l 230 1 446 1 359
943 l 278 1 267 - - 39
16 403 18 311 13 872 14 794 15 637 11 241
1 060 1 999 l 819 492 606 732
57 69 80
17 801 19 756 16 459 898 967 476 762 866 1 141 906 1 309 1 141
1 330 1 653 1 675 2 272 1 885 l 773 5 342 6 072 4 872 5 118 5 604 4 012 1 173 1 400 1 369
$12 558 $12 633 $12 077 1 359 l 415 938
7.6 7.2 5.7
7 781 6 044 5 771 1 568 l 211 1 407 l 250 l 100 l 150 1 498 l 188 883 l 254 767 1 068
968 621 465 906 850 417 253 307 308 84 - 73
$4 780 $5 470 $5 281 864 858 1 412
18.8 15.2 16.6
1Number and base of percentages exclude members of the Armed Forces living in barracks and college students living in dormitories.
NATIONAL ORIGIN AND LANGUAGE
1945 1935 1925 to to to Before
1949 1944 1934 1925
17 229 4 137 33 113 102 581 15 033 2 848 21 974 40 424 14 569 2 830 21 834 40 292 14 104 2 755 21 361 38 868
465 75 473 1 424 2 196 1 289 11 139 62 157
54 989 8 066 44 999 134 746 25 974 3 316 13 906 23 649 25 974 3 316 13 906 23 649 24 928 3 237 13 242 22 574
1 046 79 664 1 075 29 015 4 750 31 093 111 097
14 104 2 755 21 361 38 868 2 764 740 3 606 5 625 1 918 576 2 931 6 403 1 374 252 1 645 4 203 1 416 275 2 173 4 184 3 371 483 4 744 7 659 1 290 153 2 213 3 402
378 21 632 1 234 402 56 719 1 276
41 - 216 642 63 - 34 147
1 048 182 2 353 3 981 39 17 95 112
24 928 3 237 13 242 22 574 2 998 813 l 253 2 819 1 333 190 669 1 335 3 120 '363 l 148 2 755 9 571 821 5 139 8 518
465 25 302 290 2 629 324 1 167 1 784
80 - 48 66 207 - 42 100 40 - - 51 43 - - 27
3 979 511 2 409 3 585 463 190 1 065 1 244
14 104 2 755 21 361 38 868 11 476 2 098 16 866 28 818 1 565 376 2 882 4 576 1 063 263 l 574 5 436
- 18 39 38
24 928 3 237 13 242 22 574 19 596 2 521 10 460 17 086 3 860 397 2 396 3 972 l 137 238 298 1 343
335 Bl 88 173
17 668 3 849 31 902 90 104 695 217 910 5 350
1 235 384 2 520 15 953 1 538 200 3 423 14 246 l 954 432 3 655 10 760 2 283 369 3 251 9 133 5 256 854 8 457 16 971 3 665 924 7 262 13 103 1 042 469 2 424 4 588
$11 074 $11 888 $11 296 $7 752 l 181 288 l 343 7 543
6.7 7.5 4,2 8.4
6 451 2 557 14 447 S8 593 1 516 868 5 643 28 213 1 499 464 4 026 17 168 1 071 393 2 041 5 689
776 272 l 372 3 180 582 183 700 1 427 612 216 436 l 733 314 141 129 740
81 20 100 443 $4 440 $3 687 $2 695 $2 100
l 247 792 5 001 25 162 20,1 31.0 34,6 42,9
Not reported
5 631 3 166 2 691 2 628
63 2 465
9 560 2 725 2 708 2 547
161 6 835
2 628 585 317 216 187 442 304
45 209
19 88
216 -
2 547 323 191 307 970
21 196
---
24 419 96
2 628 l 890
467 230
41
2 547 2 042
281 200
24
3 378 284 493 488 380 279 771 438 245
$8 315 472 14.0
3 435 1 738
773 415 149 112 123 104
21 $1 979
1 279 43.4
467

Table 18. Economic Characteristics of the Foreign-Born Population by Year of Immigration and Country of
Birth: 1970-Continued [Doto based on 5-percent sample, see text. For minimum base for derived figures (percent, median, etc.) ond meoning of symbols, see text]
United States
IRELAND
EMPLOYMENT STATUS
Male, 16 yean old and o•er--------------Lobar force ----------------------------------
Civilion labor force--------------------------Employed--------------------------------Unemployed _________ - --------------------
Not in labor force-----------------------------
Fe .. ale, 16 yean old and ••er------------Labor force ----------------------------------
Civilian labor force--------------------------Employed--------------------------------Unemployed _____________ ----------- ---- __
Not in labor force-----------------------------
OCCUPATION
Male •'"ployed, 16 yHrS old and ••er-----Professionol, technical, and kindred workers-------Monagers and administrators, except farm _______ _ Sales workers-------------------------------Clerical and kindred workers-------------------Craftsmen and kindred workers ----------------Operatives, except transport-------------------Transport equipment operatives ----------------Laborers, except farm -------------------------Formers ond farm managers ___________________ _
Farm laborers and farm foremen ---------------Service workers, except privote household -------Private household worker•----------------------
Female •'"ployed, 16 yeon old and a•er ----Professional, technical, ond kindred workers ______ _ Manogers and administrators, except farm-------Sales workers--------------------------------Clericol ond kindred workers ___________________ _
Croftsmen and kindred workers ----------------Operatives, except transport-------------------Transport equipment operatives ----------------Laborers, except farm -------------------------formers and farm manogers ___________________ _
form loborers and farm foremen---------------Service workers, except privote household --------Privote household workers _____________________ _
CLASS OF WORKER
Malo employed, 16 yean old and aver-----Private woge and salory workers ---------------Government workers-------------------------Self-employed workers-------------------------Unpoid family workers ________________________ _
Female employed, 16 yean old and over ___ _
------------
--------------------------
-----
--Private wage and salary workers---------------
Government workers -------------------------Self-employed workers------------------------Unpaid family workers-------------------------
-
INCOME IN 1969 OF FAMILIES AND UNRELATED INDIVIDUALS
All fa .. llies ---------------------------Under $1, 999 ______ ---------------------------$2,000 to $3,999------------------------------
--
---
$4,000 to $5,999-------------------------------$6,000 to $7,999------------------------------~.000 to $9,999------------------------------$10,000 to $14,999----------------------------
-$15,000 to $24,999 ______________________ _
~~~i~~o~~r:============================== With income below poverty level_ ________________ _
Percent of all fcmilies-------------------------
----
All unn1latacl Individuals ------------------
ij~ iliE~jjjj:=ji~~jm:~~~~jjjj::=:: ~
1s'°oo to $14,999 ____________________________ _
~~~i~!o~?~============================= With income below poverty level'----=============
1965 to
Totol 1970
88 888 3 751 56 819 3 404 56 310 3 359 54 690 3 205
l 620 74 32 069 347
145 654 6 338 46 377 4 237 46 377 4 237 44 860 4 220
l 517 17 99 277 2 101
54 690 3 285 6 695 1 147 4 344 124 2 322 86 4 574 334
13 291 818 4 619 253 3 422 46 3 680 91
189 -176 -
11 180 363 198 23
44 860 4 220 7 703 1 088 1 278 124 2 203 197
10 728 l 272 593 61
3 779 213 100 -m 24
- -57 20
12 901 640 5 219 581
54 690 3 285 42 929 2 845
8 396 256 3 320 184
45 -
44 860 4 220 38 202 3 716 5 026 399 1 337 86
295 19
77 098 2 050 3 480 118 7 308 45 7 853 117 9 192 192
10 271 355 22 148 776 13 435 381 3 411 66
$10 100 $11 276 4 795 141
6,2 6.9
51 782 3 763 19 977 1 159 14 115 929 7 767 782 4 800 394 2 864 313 1 627 166
434 20 198 -
$2 725 $3 374 17 902 1 012
1960 1955 1950 to to to
1964 1959 1954
7 119 10 393 6 080 6 895 9 795 5 554 6 795 9 683 5 447 6 700 9 424 5 288
95 259 159 224 598 526
9 150 13 045 9 830 4 780 5 304 4 181 4 780 5 304 4 181 4 718 5 144 4 050
62 160 131 4 370 7 741 5 649
6 700 9 4114 5 288 995 1 253 747 471 877 358 231 442 283 431 947 364
2 105 3 117 l 525 574 679 507 469 539 258 5f1t 450 430
16 14 -- 40 -
899 l 023 816 - 43 -
4 718 5 144 4 050 852 1 060 l 107 153 85 131 79 365 211
l 614 1 638 881 19 - 89
359 485 419 18 37 -- 44 19 - - -
17 - -l 247 1 131 947
360 m 246
6 700 9 424 s 288 5 771 7 676 4 259
552 1 291 633 352 457 396 25 - -
4 718 s 144 4 050 4 257 4 634 3 425
234 354 414 '207 137 169
'20 19 42
s 706 8 479 4 879 175 245 99 112 138 89 426 396 350 521 941 545
1 009 l 542 627 2 141 3 572 2 054 1 275 l 419 803
47 226 312 $11 425 $11 368 $11 776
268 404 221 4.7 4.8 4.5
3 128 3 286 2 950 441 589 997 816 625 673 570 666 523 682 552 326 312 355 230 272 375 158
'20 77 43 15 47 -
$5 008 $5 380 $3 463 394 422 750 Percent of all unreloted individuals• ------------- .a 13.3 26.6
'Number a.nd base of percentages exclude members of the Armed Forces living fn borracks and college students living in dormitories.
34.9 28.1 12
468
1945 1935 1925 to to to Before Nol 1949 1944 1934 1925 reported
6 995 1 748 24 262 26 156 2 384 6 768 l 403 15 035 6 568 l 397 6 703 l 403 15 035 6 568 1 317 6 554 l 382 14 687 6 194 1 176 149 21 348 374 141 227 345 9 227 19 588 987
9 109 4 085 36 129 53 178 4 790 3 998 1 993 13 392 7 015 1 477 3 998 1 993 13 392 7 015 l 477 3 923 l 948 12 813 6 613 1 431 75 45 579 402 46 5 111 2 092 22 737 46 163 3 313
6 554 1 382 14 687 6 194 1 176 521 283 932 634 183 448 44 l 181 784 57 209 86 709 276 -362 93 l 529 408 106
l 839 264 2 558 796 269 725 103 l 168 545 65 434 lll l 108 335 122 675 105 l 072 283 65
22 - 54 83 -33 - 24 79 -
1 286 293 4 292 l 899 309 - - 60 72 -
3 923 1 948 12 813 6 613 1 431 778 361 l 424 822 211 144 - 404 197 40 61 77 720 373 120
1 016 305 2 101 l 499 402 68 21 187 129 19
284 129 1 365 390 135 - - 24 21 -
22 - 163 27 -- - - - -
20 - - - -l 231 688 4 707 l 930 380
299 367 l 718 1 225 124
6 554 1 382 14 687 6 194 1 176 5 057 1 139 10 744 4 558 880 1 009 204 3 050 1 142 259
488 39 873 494 37 - - 20 - -
3 923 1 948 12 813 6 613 1 431 3 351 1 659 10 567 5 347 l 246
479 247 l 791 967 141 41 42 369 262 24 52 - 86 37 20
6 177 1 712 23 147 23 486 l 462 222 99 787 1 511 224 211 170 l 804 4 636 103 513 225 1 979 3 754 93 813 171 3 028 2 856 125 992 172 3 097 2 341 136
2 262 471 5 853 4 575 #I l 010 280 5 134 2 828 305
154 124 l 465 985 32 $10 746 $10 202 $10 750 $7 256 $10 563
347 125 1 037 1 985 267 5.6 7.3 4.5 8.5 18.3
2 368 1 716 11 723 20 866 l 982
698 534 3 701 10 993 865 470 516 3 436 6 219 431 407 325 2 190 2 041 263 340 217 l 278 797 214
322 20 740 470 102
89 85 281 164 37
42 19 76 92 45
- - 21 90 25
$4 087 $3 284 $3 255 $1 921 $2 592
553 490 3 470 9 969 842 44.3 23.8 29.6 47.8 28.6
NATIONAL ORIGIN AND LANGUAGE

Table 18. Economic Characteristics of the Foreign-Born Population by Year of Immigration and Country of Birth: 1970-Continued
lDoto based on S·percent sample, see text. For minimum bose for derived figures (percent median etc) ond meaning of s mb I I t] y o s, see ex
United States
NORWAY
EMPLOYMENT STATUS
Mala, 16 yaars old and over_ _____________ _
Lobor force -- -- -- -- -- -- -- -- -- -- -- -- -- -- -- -- -- -Civilian labor force---------------------------
~~::~l~~;d :::: :: :: :: :: :: :: :: :: :: :: :: :: :: : Not in labor force -- -- -- -- -- -- -- -- -- -- -- -- -- -- --
Female, 16 years old and over -- __________ _
Labor force -- -- -- -- -- -- -- -- -- -- -- -- -- -- -- -- -- -Civilian labor force---------------------------
t~::~l~~;d ==== :: :: :: :: == == :: == == == :: == == = Not in lobar force -- -- -- -- -- -- -- -- -- -- -- -- -- -- --
OCCUPATION
Male employed, 16 years old and aver ______ _ Professional, technical, and kindred workers __ -- -- __ Monogers and administrators, except form ________ _ Soles workers -- ------ -- -- -- -- -- -- -- ---- ---- __ _ Clerical and kindred workers -- -- -- -- -- -- ________ _ Craftsmen and kindred workers ---- -- -- ---- _____ _ Operotiv1;, except transport -- -- -- -- -- -- __ ·- ____ _ Transport equipment operatives -- -· -- -- ---- _____ _ Laborers, except form--------------------------Formers and form managers---- __ -- -- __________ _ Form laborers and farm foremen -- -- -- __________ _ Service workers, except private household ________ _ Privote household workers •• -- -- -- -- -- __________ _
Female employed, 16 years old and over ____ _ Professional, technical, and kindred workers _______ _ Monogers and administrators, except form ________ _ Sales workers ____ ---- ____ -- -- __ -- -- __________ _ Clerical and kindred workers ____________________ _ Croflsmen and kindred workers ______ -- _________ _ Operatives, except transport ____________________ _ Transport equipment operatives _________________ _ Loborers, except farm _________________________ _ Formers and form managers ____________________ _ Form laborers and form foremen ________________ _ Service workers, except private household ---------Privote household workers ______________________ _
CLASS OF WORKER
Male amployed, 16 years old and over _____ _ -Privote wage and salary workers ________________ _ Government workers __________________________ _ Self·employed workers _________________________ _ Unpaid family workers_ ________________________ _
Female employed, 16 years old and over ____ _ Private wage and salary workers-----------·-----Government workers __________________________ _ Self.employed workers _________________________ _ Unpoid family workers_ ________________________ _
INCOME IN 1969 OF FAMILIES ANO UNRELATED INDIVIDUALS
U d All families----------------------------n er$1,999__ _______ _ $2 000 to $3 999 -- -- -- -- -- -- -- -- -- -- -- -$4:000 to 5'999 ·-----------------------------$6.000 to $7,999:::----------------------------$8 000 $ • - -- -- -- -- -- -- -- -- -- -- -- -- -- -$lO
00 to $9,999 ______________________________ _
$15:00~ :~ fJ!:m==-- -- -- -- -- -- -- -- -- -- -- -- -- -$25,000 or more -- -- -- -- -- -- -- -- -- -- -- -- -- -Medion income -- -- -- -- -- -- -- -- -- -- -- -- -- -- -- -
With income bel~-;;-P~~~~ty 1;;~:: :: :: :: == == :: :: :: Percent of all families ________________________ _
All unrelated Individuals Under $1,999 ____ __ -- -- -- -- ·- -- -- -- --$2,000 to $3,999__ _=~=- -- -- -- -- -- -- -- -- -- -- -- -$4,000 to $5 999 ·- -- -- -- -- -- -- -- -- -- -- -- -$6,000 to $7°999 -- -- -- -- -- -- -- -- -- -- -- -- -- -- -- -$8.000 to $9°999------------------------------$10,000 to $014 9------------------------------$15,000 to $24°9~~ ::-- -- -- -- -- -- -- ---- -- -- -- -· -
-$25,000 or mo;e --------------------------Median income -------------------------------With income bel~-;;p~~~~ty 1;;;1 ~- -- -- -- -- -- -- -- --
Percent of oll unrelated individu~ls-; ==== == == == == =
1965 lo
Total 1970
43 379 1 455 19 925 1 126 19 763 1 107 18 430 1 107
1 333 -23 454 329
45 328 1 945 9 490 723 9 475 723 9 068 723
407 -35 838 1 222
18 430 1 107 3 584 621 2 459 161 1 086 43
779 60 5 391 182 1 632 -
461 23 944 -625 -89 -
1 380 17 - -
9 068 723 1 382 181
441 -652 24
2 118 284 187 -927 -
21 -77 -19 -43 -
2 318 234 883 -
18 430 1 107 14 144 888 1 536 156 2 690 63
60 -
9 068 723 7 144 669 1 108 54
778 -38 -
33 787 1 074 2 251 37 5 821 20 5 131 140 3 299 90 3 379 . 15 7 058 418 5 252 315 1 596 39
$8 232 $12 811 3 096 37
9.2 3.4
20 306 766 9 898 281 5 190 131 2 257 154 I 436 83
701 77 602 19 201 21
21 -$2 070 $3 580
8 659 237 43.4 33.7
1960 1955 1950 to to to
1964 1959 1954
1 340 2 045 2 635 1 271 l 874 2 325 1 246 1 854 2 285 1 139 l 835 2 139
107 19 146 69 171 310
2 021 2 988 2 802 874 l 368 991 874 1 353 991 874 l 229 971
- 124 20 1 147 l 620 1 811
1 139 1 835 2 139 277 397 507 109 258 237 77 140 164 75 20 90
372 679 782 42 170 78 - 22 61
79 - 99 - 61 -- - -
108 88 121 - - -
874 1 229 971 129 219 179 56 37 66 79 133 75
197 210 189 33 38 -32 63 152 21 - -19 - -- - -- - -
233 422 288 75 107 22
1 139 l 835 2 139 959 1 547 1 690 63 168 208
117 120 241 - - -
874 l 229 971 747 1 059 769 65 109 83 62 61 119 - - -
1 118 1 849 1 961 48 108 19 16 98 -24 99 81
137 118 272 71 205 232
428 496 673 250 632 528 144 93 156
$13 072 $12 989 $12 797 48 212 19 4.3 11.5 1.0
532 469 783 76 121 177 lll 102 103 61 66 121
118 95 163 45 22 78
100 63 119 - - 22
21 - -$6 450 $4 174 $5 856
76 79 129 15.0 19.4 19.l
1Number and hose of percentages exclude members of the Armed Forces living in barracks and college students living in dormitories.
NATIONAL ORIGIN AND LANGUAGE
1945 1935 1925 to to to Before
1949 1944 1934 1925
2 422 1 234 5 982 24 990 2 171 1 043 3 768 5 897 2 171 1 043 3 768 5 839 1 973 1 023 3 462 5 344
198 20 306 495 251 191 2 214 19 093
2 092 911 6 056 24 830 827 245 l 743 2 460 827 245 l 743 2 460 827 245 l 645 2 321
- - 98 139 1 265 666 4 313 22 370
1 973 1 023 3 462 5 344 450 176 305 765 233 132 437 840 97 42 158 365 18 77 201 218
615 310 1 138 1 212 206 121 531 442 66 19 79 191
122 39 181 352 29 26 129 380 26 22 19 22
111 59 284 557 - - - -
827 245 1 645 2 321 70 47 189 347 40 18 77 98 22 - 125 178
234 21 432 468 38 - 15 63
138 15 215 290 - - - -
18 - - 40 19 - - -- - - 43
225 123 435 358 23 21 157 436
1 973 1 023 3 462 5 344 1 576 753 2 602 3 801
174 108 302 294 203 162 558 1 209 20 - - 40
827 245 1 645 2 321 643 160 1 231 1 698 127 66 280 259 57 19 114 346 - - 20 18
2 093 l 113 5 335 18 632 21 - 232 l 767 95 11 641 4 843
128 217 663 3 674 157 88 482 1 890 209 43 782 1 716 795 320 l 105 2 641 516 337 l 138 l 515 172 97 292 586
$12 745 $13 086 $9 661 $5 365 78 - 319 2 342
3.7 - 6.0 12.6
665 358 2 116 13 936 179 103 799 7 783 88 116 523 3 854 79 59 371 1 307 85 41 214 608
137 19 122 184 97 20 87 87 - - - 113 - - - -
$5 663 ". $2 725 $1 840 179 103 573 6 994
26.9 "' 27.1 50.3
Not reported
1 276 450 450 408 42
826
1 683 259 259 233 26
l 424
408 86 52 -
20 101 42 -
72 --
35 -
233 21 49 16 83 -
22 -----
42
408 328
63 17 -
233 168 65 --
612 19 97
105 65
106 182 21 17
$8 377 41 6.7
681 379 162 39 29 17 10 45 -
$1 827 289
45.7
469

Table 18. Economic Characteristics of the Foreign-Born Population by Year of Immigration and Country of
Birth: 1970-Continued [Doto based on S-percent sample, :see text. For minimum base for derived figures (percent, median, etc.) and meaning of symbols, see text]
United States
SWEDEN
EMPLOYMENT STATUS
Malo, 16 years old and aver ______________ _
Labor force-----------------------------------Civilian lobar force---------------------------
Employed -- ------ ------ ------------ ------ -Unemployed-------------------------------
Not in labor forc•------------------------------
female, 16 years old and over -------------Labor force---------------------------------- -
Civilian labor force---------------------------Employed ------ ------ __ -------------------Unemployed ______________________________ _
Not in labor force _____________________________ _
OCCUPATION
Malo employed, 16 years old and over-------Professional, technical, ond kindred workers _______ _
-Managers and administrators, except farm -- -----Soles workers---------------------------------Clerical ond kindred workers ____ -- -- ------ -- -- -- -Craftsmen ond kindred workers ------------------Operatives, except transport -- ______ ------ ---- -- -Transport equipment operatives -----------------laborers, except form -------------------------Farmers and farm managers------------------ --form laborers ond farm foremen---------------Service workers, except private household ------ __
--
Private household workers ______ -- ------ _______ _ -
Female emplayod, 16 years old and aver ___ _ -Professional, technical, and kindred workers_ ______ _ Managers and administrators, except farm--------Sales workers-------------------------------- -Clerical and kindred workers ____ ------ __ --------_ Craftsmen and kindred workers -------------·----Operatives, except transporl -- -- -- ---- -- __ -- ____ _ Transport equipment operatives ------------------laborers, except farm ____ ----------------------Formers and farm managers_ __________________ _
Farm laborers and farm foremen ---------------Service workers, except private household --------Private household workers _____________________ _
CLASS OF WORKER
Male omplayod, 16 years old and aver-----Private wage and salary workers---------------Government workers--------------------------
----
---Self-employed workers ________________ ---- _____ _
Unpaid family workers-------- ______ ------------
-Female employed, 16 years old and aver ___ _ Private wage and salary workers-----------------Government workers ________ ---------------- __ _ Self-em played workers--------------------------Unpaid family workers ________ ---------- _______ _
INCOME IN 1969 OF FAMILIES ANO UNRELATED INDIVIDUALS
All famillu ----------------------------Under $1,999 ______ -------- ____ ------ ------ ___ _ $2,000 to $3,999 ______________________________ _
$4,000 to $5,999-------------------------------$6,000 to $7,999 __________ -------- ---------- __ _ $8,000 to $9,999 ______________________________ _ $10,000 to $14,999 ____________________________ _
$15,000 to $24,999-----------------------------
~;d~OnO i~~o~~r~::::::::::::::::::::::::======= With income below poverty leveL ________________ _
Percent of all families ____ ---------------------
All unrelated individuals ------------------Under $1,999 _________________________________ _ $2,000 to $3,999 ________________ ---------- ____ _
:::ggg :~ $~,~~~=- ------ -- ------ ------ -- ------
$8,000 to :9'.999_============================== $10,000 to $14,999----------------------------m·~OO to $24,999----------------------------MediaOnO i~~o:~r~=- -- -- -- -- -- -- -- -- -- -- -- - --- -- -
With income belo,,;p~~;rty 1;;;i ~================= Percent of all unrelated individuals' -------------
1965 to
Total 1970
54 800 1 112 21 142 872 21 039 872 19 844 853
1 195 19 33 658 240
58 380 3 097 12 686 1 592 12 686 1 592 12 012 1 533
674 59 45 694 1 505
19 844 853 2 802 554 2 294 173 I 004 23
968 -7 008 64 1 765 -
368 -734 39 505 -197 -
2 152 -47 -
12 012 1 533 1 770 313
577 19 938 87
3 055 488 252 -
1 148 79 19 -
117 -64 -39 -
2 672 449 1 361 98
19 844 853 14 982 670
1 503 104 3 312 79
47 -12 012 1 533 9 565 1 219 1 259 247
917 67 271 -
43 111 765 2 975 -8 961 85 6 339 24 4 897 61 3 972 110 8 470 177 6 028 244 1 469 64
$7 280 $12 895 4 440 37
10.3 4.8
28 583 1 535 13 722 466 7 539 206 2 747 267 2 067 288 1 090 207
893 78 348 -177 23
$2 122 $4 764 12 122 447
42.8 29.l
1960 1955 1950 to to to
1964 1959 1954
732 1 135 1 333 653 915 1 092 653 915 1 092 653 873 1 043 - 42 49
79 220 241
2 163 2 125 2 134 868 890 1 207 868 890 1 207 868 822 1 188
- 68 19 1 295 1 235 927
653 873 1 043 173 308 221
21 168 195 59 61 65 60 24 99
164 193 357 14 44 21 21 - -17 - 21 - - -- - -
124 75 64 - - -
868 822 1 188 269 225 195 46 18 116 46 42 100
139 289 319 - - 42
38 25 100 - - -- - -- - -- - -
281 136 287 49 87 29
653 873 1 043 573 714 905
16 24 37 64 135 101 - - -
868 822 1 188 708 759 848 94 - 144 66 18 157 - 45 39
451 905 1 083 52 48 43 - 58 19
19 35 94 15 76 61 - 103 70
252 275 360 47 293 351 66 17 85
$12 768 $12 409 $13 535 52 48 62
11.5 5.3 5.7
645 575 473 155 118 138 128 53 106 122 63 -73 187 100 98 44 46 45 63 83 24 47 -- - -
$4 658 $6 569 $3 913 107 45 59
1Number and base of percentages exclude members of the Armed Forces livLng in barracks and college students l;ving in dormi;o·ri.es.
17.9 90
470
1945 1935 1925 -to to to Before
1949 1944 1934 1925 Not
reported -
1 531 695 10 502 36 566 1 194 1 365 413 6 563 8 901 1 304 392 6 563 8 901
368 1 241 392 6 109 8 354
347 63 - 454 326
547 21 166 282 3 939 27 665 826 1 535 774 7 184 37 779 1 589 769 403 2 147 4 547 263 769 403 2 147 4 547 263 769 381 2 059 4 129 263 - 22 88 418
766 371 5 037 33 232 -
1 326
l 241 392 6 109 8 354 326 244 36 475 744 47 216 42 510 917 52 104 19 241 4)1 21 32 - 380 373 -376 182 2 773 2 864 35 63 43 726 809 45 24 - 123 185 15 54 - 208 374 21 24 22 118 341 -- - 24 173 -104 48 501 1 146 90 - - 30 17 -
769 381 2 059 4 129 263 189 - 85 450 44 120 - 124 95 39 40 46 269 308 -
144 110 379 1 089 98 25 - 45 106 34 92 21 394 399 -19 - - - -- - 20 75 22 - - 20 44 -- - 39 - -
122 156 452 763 26 18 48 232 800 -
1 241 392 6 109 8 354 326 1 046 287 4 769 5 787 231
26 18 409 774 95 169 87 911 1 766 -- - 20 27 -
769 381 2 059 4 129 263 549 299 1 695 3 356 132 65 - 205 434 70
115 82 118 233 61 40 - 41 106 -
1 194 550 9 076 28 495 592 41 36 515 2 155 85 65 64 945 7 661 64 59 19 942 5 087 lfJ 81 187 1 133 3 222 61
116 22 1 081 2 389 81 479 125 2 330 4 417 55 221 97 1 868 2 755 152 132 - 262 809 34
$12 453 $7 523 $9 856 $5 706 $8 642 41 63 635 3 395 107 3.4 11.5 7.0 11.9 18.1
611 379 3 396 20 260 709 189 157 935 11 137 427
41 69 1 073 5 724 139 64 47 543 1 539 102
167 39 451 741 21 26 45 140 464 20
100 - 209 315 -24 - 25 228 -- 22 20 112 -
$6 172 ... $2 982 $1 869 $1 6/,9 169 133 876 9 948 338
49.1 52.6 27.7 25.8
NATIONAL ORIGIN AND LANGUAGE
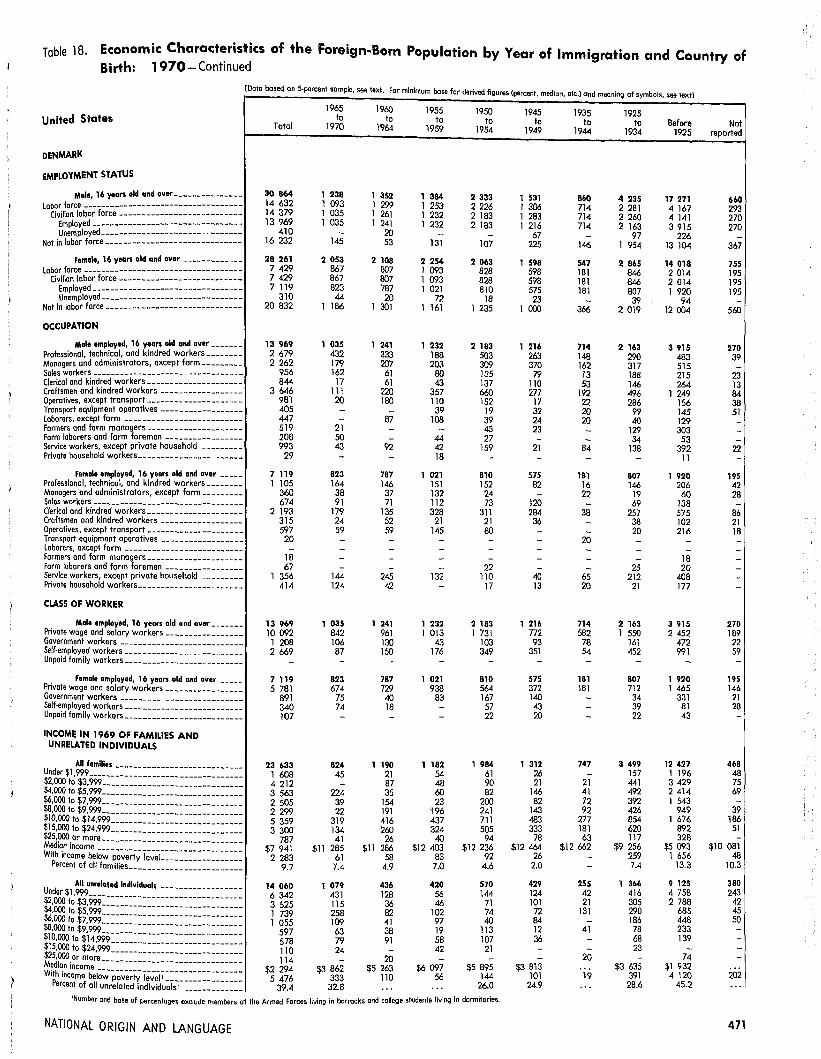
Tobie 18. Economic Characteristics of the Foreign-Born Population by Year of Immigration and Country of Birth: 1970-Continued
[Doto based on 5-percent sample, see text. For minimum base for derived figures (percent median etc ) ond meaning f bol t tl o sym s, see ex
United States
DENMARK
EMPLOYMENT STATUS
Male, 16 years old and aver ______________ _
Labor force----------------------------------Civilian labor force---------------------------
t~~~~l~~ed :::::: :: :: :: :: :: : : : ::::: :: :: :: : Not in labor force------------------------------
Female, 16 years old and over------------Labor force----------------------------------
Civilian labor force---------------------------
~~~~~l~e;C::::::::::::::::::::::::::::: Not in labor force------------------------------
OCCUPATION
Mole employed, 16 years old and over-------Professional, technical, and kindred workers_ ______ _ Managers and administrators, except farm ________ _ Soles workers---------------------------------Clerical and kindred workers ____________________ _
-
-
Craftsmen and kindred workers -----------------Operatives, except transport--------------------Transport equipment operatives ----------------Laborers, except farm -------------------------Formers and form managers--------------------Form laborers and farm foremen----------------Service workers, except private household --------Private household workers----------------------
female employed, 16 years old and over -----Professional, technical, and kindred workers ______ _ Managers and administrators, except farm-------Soles workers--------------------------------Clerical and kindred workers ___________________ _
Craftsmen and kindred workers ----------------Operatives, except transport-------------------Transport equipment operatives ----------------Laborers, except farm -------------------------Farmers and form managers_ __________________ _
Farm laborers and farm foremen ---------------Service workers, except private household --------Private household workers _____________________ _
CLASS OF WORKER
Mole employed, 16 years old and over-----Private wage and salary workers---------------Government workers--------------------------Self-employed workers ____ ---------------------Unpaid family workers_ _______________________ _
female employed, 16 years aid and over ___ _ Private wage and salary workers---------------Government workers -------------------------Self-employed workers------------------------Unpaid family workers-------------------------
INCOME IN 1969 OF FAMILIES AND UNRELATED INDIVIDUALS
i ·11~i~=~rn~~=l~~-~l-:l=l~~~~~~~~l :~~:~ ~~ $~~·:---------------- -----------t~df;;ii~~o;~;e __ :::::::: :: :::::: :::::: ::::::
With income bel~~-P~~~rtvie;;i::::::::::::::::: Percent of all families_ ______________________ _
U d All unrelated Individuals -----------------$~.oOO $'~ 99j 999- -- ---------------------------$4,000 to ~5'.999------------------------------~:~ :~ :~:::===:::::::::::::::::::::::::: $10,00Q lo $14 999-- -----------------------
m:~ ~~ ~2i~============================ Median income -----------------------------
With income bel~;P;~;;fy'j;;;i~:::=:::=:::::::: Percent of all unrelated individuals 1 ------------
------------
----------
------------
------------
1965 to
Total 1970
30 864 l 238 14 632 l 093 14 379 1 035 13 969 1 035
410 -16 232 145
28 261 2 053 7 429 867 7 429 867 7 119 823
310 44 20 832 l 186
13 969 1 035 2 679 432 2 262 179
956 162 844 17
3 646 111 981 20 405 -447 -519 21 208 50 993 43
29 -7 119 823 1 105 164
360 38 674 91
2 193 179 315 24 597 59
20 -- -
18 -67 -
1 356 144 414 124
13 969 1 035 10 092 842
1 208 106 2 669 87
- -
7 119 823 5 781 674
891 75 340 74 107 -
23 633 824 l 608 45 4 212 -3 563 224 2 505 39 2 299 22 5 359 319 3 300 134
787 41 $7 941 $11 285
2 283 61 9.7 7.4
14 060 1 079 6 342 431 3 525 115 l 739 258 1 055 109
597 63 578 79 110 24 114 -
$2 294 $3 862 5 476 333
39.4 32.8
1960 1955 1950 to to to
1964 1959 1954
l 352 l 384 2 333 l 299 l 253 2 226 1 261 1 232 2 183 1 241 1 232 2 183
20 - -53 131 107
2 108 2 254 2 063 807 1 093 828 807 l 093 828 787 1 021 810 20 72 18
l 301 1 161 1 235
l 241 l 232 2 183 333 188 503 207 203 309
61 80 135 61 43 137
220 357 660 180 110 152
- 39 19 87 108 39 - - 43 - 44 27
92 42 159 - 18 -
787 1 021 810 146 151 152 37 132 24 71 112 73
135 328 311 52 21 21 59 145 80 - - -- - -- - -- - 22
245 132 110 42 - 17
l 241 1 232 2 183 961 l 013 l 731 130 43 103 150 176 349 - - -
787 1 021 810 729 938 564 40 83 167 18 - 57 - - 22
1 190 1 182 1 984 21 54 61 87 48 90 35 60 82
154 23 200 191 '196 241 416 437 711 260 324 505 26 40 94
$11 286 $12 403 $12 236 58 83 92 4.9 7.0 4.6
436 420 570 128 56 144 36 46 71 82 102 74 41 97 40 38 19 113 91 58 107 - 42 21
20 - -$5 263 $6 097 $5 895
110 56 144
·-· "' 26.0
'Number and base of percentages exclude members of the Armed Forces living in barracks and college studenis living in dormiiories.
NATIONAL ORIGIN AND LANGUAGE
1945 1935 1925 to to to Before
1949 1944 1934 1925
l 531 860 4 235 17 271 l 306 714 2 281 4 167 1 283 714 2 260 4 141 1 216 714 2 163 3 915
67 - 97 226 225 146 l 954 13 104
1 598 547 2 865 14 018 598 181 846 2 014 598 181 846 2 014 575 181 807 1 920 23 - 39 94
l 000 366 2 019 12 004
1 216 714 2 163 3 915 263 148 290 483 370 162 317 515 79 13 188 215
110 53 146 264 277 192 496 1 249
17 22 286 156 32 20 99 145 24 20 40 129 23 - 129 303 - - 34 53
21 84 138 392 - - - 11
575 181 807 1 920 82 16 146 206 - 22 19 60
120 - 69 138 284 38 257 575 36 - 38 102 - - 20 216 - 20 - -- - - -- - - 18 - - 25 20
40 65 212 408 13 20 21 177
1 216 714 2 163 3 915 772 582 l 550 2 452 93 78 161 472
351 54 452 991 - - - -
575 181 807 1 920 372 181 712 l 465 140 - 34 331 43 - 39 81 20 - 22 43
1 312 747 3 499 12 427 26 - 157 l 196 21 21 441 3 429
146 41 492 2 414 82 72 392 l 543
143 92 426 949 483 277 854 l 676 333 181 620 892
78 63 117 328 $12 464 $12 662 $9 256 $5 093
26 - 259 l 656 2.0 - 7-4 13.3
429 255 1 366 9 125 124 42 416 4 758 101 21 305 2 788 72 131 290 685 84 - 186 448 12 41 78 233 36 - 68 139 - - 23 -- 20 - 74
$3 813 $3 635 $1 932 ... 101 19 391 4 120
24.9 ·-- 28.6 45.2
Not reported
660 293 270 270 -
367
755 195 195 195
-560
270 39 -
23 13 84 38 51 ---
22 -
195 42 28 -
86 21 18 ------
270 189 22 59 -
195 146
21 28 -
468 48 75 69 -
39 186
51 -
$10 081 48
10.3
380 243
42 45 50 ----
·--202
---
471

Table 18. Economic Characteristics of the Foreign-Born Population by Year of Immigration and Country of Birth: 1970-Continued
!Data based on 5-percent sample see text. For minimum base for derived figures (percent, median, etc.) and meaning of symbols SO<! text)
United States
NETHERLANDS
EMPLOYMENT STATUS
Male, 16 years aid and"'"---------------lobar force -----------------------------------
Civnian labor force---------------------------Employed---------------------------------Unemployed-------------------------------
Not in labor force-------------------·-----·----
Femala, 16 years aid and over -------------Lobor force -----------------------------------
Civilian labor force---------------------------Employed---------------------------------Unemployed ______________________________ _
Not in labor force _____________________________ _
OCCUPATION
Male .,.ployed, 16 years old and •- ------ -Professional, technical, and kindred workers _______ _ Managers and administrators, except form ________ _ Soles workers---------------------------------Clerical and kindred workers_ __________________ _
Craftsmen and kindred workers ----------------Operatives, except transport-------------------Transport equipment operotives -------·--------Laborers, except form -------------------------Formers and farm managers ___________________ _
Form laborers and farm foremen ---------------Service workers, except private household --------Private household workers _____________________ _
Female employed, 16 years aid and aver ___ _ Professional, technical, and kindred workers ______ _ Managers and administrators, except form __ -----Soles workers--------------------------------Clerical and kindred workers ___________________ _
Craftsmen and kindred workers ----------------Operatives, except transport-------------------Transport equipment operatives ----------------Laborers, except farm -------------------------Farmers ond farm managers ___________________ _
Farm laborers and farm foremen ---------------Service workers, except privote household -------Private household worker•----------------------
CLASS OF WORKER
Male employed, 16 years aid and aver-----Private wage and salary workers---------------Government workers -------------------------Self-employed workers------------------------Unpaid family workers-------------------------
---------
-------------
--------
Ftmale empleyod, 16 years aid and o¥er ---Private wage and salary workers---------------Government workers -------------------------Self-employed workers------------------------Unpaid family workers-------------------------
-
INCOME IN 1969 OF FAMILIES AND UNRELATED INDIVIDUALS
-
All fa1ailles ---------------------------Under $1,999 ____ -----------------------------
-
$2.000 to $3,999-----------------------------$4,000 to $5,999-----------------------------$6,000 to $7,999-----------------------------$8,000 to $9,999------------------------------$10,000 to $14,999----------------------------
-----
$15,000 to $24,999 ______________ --------------
t2~~i~~o~~r~:=:=:=:::::::::::::::::::::·:= With income below poverty leve'--------------=--Percent of all families_ ______________________ _
All unrelated Individuals -----------------
¥~.~ ~~~999:::::::::::::::::::::::::::::: $4,000 to $5,999 ____________________ _
:::~ ~~ l~:~:::::::::::::::::::::::::::::: $10,000 to $14,999---------------------------$15,000 to $24,999----------------------------
--------------
$25,000 or more------------------------------Medion income -------------------------------
---
1965 to
Total 1970
53 072 3 421 37 725 2 906 37 123 2 847 36 088 2 803
l 035 44 15 347 515
50 671 4 408 16 083 1 621 16 066 l 604 15 174 1 489
892 115 34 588 2 787
36 088 2 803 7 688 1 282 4 617 329 2 124 60 1 792 181 B 078 314 3 191 197 l 187 35 1 434 67 2 175 -
766 40 2 973 298
63 -15 174 1 489
2 962 280 655 93
1 253 106 3 956 410
231 17 1 385 23
16 -163 15
21 -99 -
3 449 511 984 34
36 088 2 803 27 384 2 417
3 211 274 5 408 112
85 -15 174 1 489 12 265 1 240
1 845 187 968 62 96 -
43 807 2 473 2 311 121 5 099 220 4 110 168 4 520 219 5 205 310
11 996 782 8 447 592 2 119 61
$10 274 $11 269 3 620 236
8.3 9.5
14 856 1 503 6 087 596 3 422 191 1 819 192 1 383 158
778 160 892 144 350 62 125 -
$2 602 $3725 4 790 356
1960 1955 1950 to to to
1964 1959 1954
4 939 10 347 6 564 4 497 9 384 6 113 4 458 9 243 5 978 4 392 9 036 5 833
66 207 145 442 963 451
5 404 10 031 5 939 2 168 4 053 2 673 2 168 4 053 2 673 2 000 3 836 2 574
168 217 99 3 236 5 978 3 266
4 392 9 036 5 833 l 167 2 104 1 217
550 980 592 286 466 383 200 459 301
1 087 2 180 l 538 350 l 008 461 203 140 184 148 406 246 94 356 181 43 180 161
220 738 569 44 19 -
2 000 3 836 2 574 547 664 579 80 66 151
165 324 180 502 992 698
- 78 43 125 546 171 16 - -22 61 25 - - -
23 16 19 454 803 493
66 286 215
4 392 9 036 5 833 3 546 7 679 4 350
320 534 575 505 823 886
21 - 22
2 000 3 836 2 574 1 789 3 285 2 055
143 370 308 68 141 192 - 40 19
3 898 8 159 s sos 137 215 185 112 238 166 228 400 457 448 734 556 605 l 291 834
1 545 3 010 1 846 646 1 900 l 237 177 371 224
$11 356 $11 996 $11 502 228 314 277 5.8 3.8 5.0
966 1 316 1 353 159 375 252 183 273 353 236 76 206 130 178 306 103 98 106 80 224 66 75 92 64 - - -
$5 527 $4 476 $5 066 138 201 140
With income below poverty level1 ---------------Percent of all unrelated individuals' ------------
11.7 'Number and base of percentages exclude members of the Armed Forces living In barracks ond college students living in dormitories.
- 34.5 29.7 15.0 18.0
472
1945 1935 1925 to to to Before Not 1949 1944 1934 1925 reported
4 257 1 714 3 226 17 524 1 080 3 883 l 463 2 217 6 622 MO 3 841 l 463 2 217 6 622 454 3 734 1 371 2 121 6 360 438 107 92 96 262 16 374 251 l 009 10 902 440 4 280 1 495 2 310 15 665 1 139 l 731 460 526 2 646 205 1 731 460 526 2 646 205 l 661 460 507 2 467 180
70 - 19 179 25 2 549 l 035 l 784 13 019 934
3 734 1 371 2 121 6 360 438 639 326 280 653 20 523 376 264 879 124 204 121 140 406 58 199 67 134 224 27 653 269 403 l 557 77 339 38 221 577 -
80 25 111 381 28 160 22 99 286 -579 66 216 664 19 199 - 65 56 22 159 61 188 677 63
- - - - -1 661 460 507 2 467 180
425 119 100 187 61 133 - 21 111 -104 44 51 267 12 328 125 101 737 63
74 - 19 - -195 55 24 246 -
- - - - -40 - - - -- - - 21 -- - - 41 -
300 95 81 668 44 62 22 110 189 -
3 734 1 371 2 121 6 360 438 2 393 1 009 l 512 4 148 330
386 169 260 668 25 955 193 327 l 524 83
- - 22 20 -1 661 460 507 2 467 180 1 285 348 395 1 738 130
233 73 82 399 50 143 39 30 293 -
- - - 37 -
3 772 1 585 2 799 15 162 454 104 44 152 1 337 16 159 39 293 3 792 80 324 178 343 1 975 37 413 139 144 1 850 17 517 86 354 l 208 -
l 060 359 719 2 514 161 969 348 627 2 010 118 226 392 167 476 25
$11 741 $14 269 $10 789 $6 492 $12 391 219 83 152 2 075 36 5.8 5.2 5.4 13.7 7.9
903 496 759 6 924 636 245 102 367 3 460 531 168 114 184 l 914 42 158 43 128 757 23 86 39 63 423 -81 65 - 165 -
126 73 17 122 40 20 17 - 20 -19 43 63 --
$4 356 $5 500 $2 119 $2 001 $981 231 102 367 2 988 267
26.2 20.6 48.4 43.2 ...
NATIONAL ORIGIN AND LANGUAGE

Table 18. Economic Characteristics of the Foreign-Born Population by Year of Immigration and Country of Birth: 1970-Continued
[Data based on S.peroent sample, see text. For minimum base for derived iigures (peMnt median etc) and meaning of symbols see text]
United States
FRANCE
EMPlOYMENT STATUS
Mole, 16 years old and over---------------Labor force-----------------------------------
Civilian labor force---------------------------
~~:~l~;<l::::::::::::::::::::::::::::::: Not in lobar force------------------------------
Female, 16 years old and over ------------Labor force----------------------------------
Civilian labor force---------------------------Employed------------------------------ - - -Unemployed ____ ---- - - - - - - - - -- - - - - - - --- - -- -
Not in labor force------------------------------
OCCUPATION
Mole employed, 16 years old and aver-------Professional, technical, and kindred workers_ ______ _ Managers and administrators, except farm ________ _ Sales workers---------------------------------Clerical ond kindred workers ____________________ _
Craftsmen and kindred workers -----------------Operatives, except transport--------------------Transport equipment operatives -----------------Laborers, except form --------------------------Formers and form managers_ ___________________ _
Farm laborers and form foremen ----------------Service workers, except private household ---------Private household workers ______________________ _
Female employed, 16 ye an old and aver ____ _ Professional. technical, and kindred workers _______ _ Managers and administrators, except farm ________ _ Sales workers--------------------------------Clerico! and kindred worker'--------------------Craftsmen and kindred workers -----------------Operatives, except transport--------------------Transport equipment operatives -----------------Laborers, except farm --------------------------Farmers and farm managers_ ___________________ _
Form laborers and farm foremen ----------------Service workers, except private household ---------Private household workers ______________________ _
CLASS OF WORKER
Male employed, 16 years old and over------Private wage and salary workers----------------Government workers--------------------------Self ... mployed workers--------------------------Unpaid family workers_ ________________________ _
. Female employed, 16 years aid and over ____ _ Private wage and salary workers----------------Government workers --------------------------Self-employed workers--------------------------Unpaid family workers _________________________ _
INCOME IN 1969 OF FAMILIES AND UNRELATED INDIVIDUALS
Under l ~~~illes ----------------------------
t;~$:~ i~::=============================== $8:~ :~ $~·: :------------------------------$10,000 ta$ i4 999-----------------------------$1 $ . -----------------------------$2~:~ ~~ ~!:'9----------------------------~~~n income _:::::::::::::::::::::::::::::::
IP income below poverty leve'------------------ercent of all families ________________________ _
All unniloted Individuals ------------------~;,~ ~~~:999-------------------------------
*~~u~;~ ~~~~~~~~~~~~~~~~~~~~~~~~~~~~~~~ $15,000 to ~24::-----------------------------~2;J:'i~~o';;,~e __ :::::::::::::::::::::::::::::
With income bel~;'f;;;;,~rty-j;,;ei~::::::::::::::::: Percent of all unrelated individuals 1 -------------
Total
34 586 24 373 23 847 23 057
790 10 213
65 861 24 458 24 438 22 904
l 534 41 403
23 057 5 589 2 974 1 140 l 314 3 571 l 603
351 879 339 275
4 851 171
22 904 4 259 l 285 l 957 5 820
488 3 418
74 63 -
19 4 309 l 212
23 057 17 932 2 198 2 848
79
22 904 18 389 3 003 l 244
268
28 743 2 094 3 178 2 816 3 525 3 149 7 039 5 126 l 816
$9 752 3 050
10.6
18 951 7 552 4 098 2 648 l 800
936 l 019
720 178
$2 779 6 391
35.6
1965 to
1970
4 470 3 701 3 604 3 479
125 769
8 570 3 847 3 847 3 592
255 4 723
3 479 l 223
378 168 204 408
82 21 16 -
73 883
23
3 592 771 124 'l.96 955
82 283
----
738 343
3 479 2 901
461 94 23
3 592 2 824
607 102 59
2 991 'l.97 321 260 430 169 777 553 184
$10 119 478 16.0
3 070 l 391
619 403 315 129 167 46 -
$2 454 l 108
40.8
1960 1955 1950 to to to
1964 1959 1954
3 257 4 107 4 940 2 931 3 663 3 843 2 859 3 601 3 755 2 759 3 538 3 607
100 63 148 326 444 l 097
7 194 8 779 6 493 3 167 4 370 2 945 3 167 4 370 2 945 2 867 4 207 2 736
300 163 209 4 027 4 409 3 548
2 759 3 538 3 607 543 893 706 233 345 402 84 151 171
163 178 136 477 620 585 162 245 433 41 79 58
222 166 128 - 38 109
21 42 42 788 695 818 25 86 19
2 867 4 207 2 736 368 853 462 64 196 228
196 384 258 655 l 161 671 69 95 41
571 479 428 - - -
20 22 -- - -- - -
719 817 554 205 200 94
2 759 3 538 3 607 2 257 2 84(l 2 949
142 356 279 360 342 379
- - -
2 867 4 207 2 736 2 400 3 328 2 302
365 585 'l.96 102 250 138
- 44 -
2 805 3 460 3 402 234 337 152 201 205 121 179 254 274 439 300 346 442 408 621 635 968 l 142 453 785 579 222 203 167
$9 581 $11 167 $10 819 333 506 224 11.9 14.6 6.6
l 106 l 471 l 659 203 458 486 210 236 288 'l.93 279 246 216 119 324 60 173 95 23 75 177
101 84 43 - 47 -
$5 195 $4 249 $4 375 178 349 295
16.9 26.5 20.7
'Number and base of percentages exclude members of the Armed Forces living in barracks end college students living in dormitories.
NATIONAL ORIGIN AND LANGUAGE
1945 1935 1925 to to to Before
1949 1944 1934 1925
3 292 1 644 3 206 8 418 2 947 l 465 l 965 3 151 2 807 l 465 l 965 3 151 2 741 l 465 l 877 2 951
66 - 88 200 345 179 l 241 5 267
10 851 2 363 4 214 15 992 5 119 916 1 196 2 395 5 119 916 l 196 2 395 4 944 874 l 110 2 160
175 42 86 235 5 732 l 447 3 018 13 597
2 741 1 465 1 877 2 951 638 517 326 570 507 427 191 412 119 65 20 295 155 64 111 217 683 102 140 493 97 39 180 344 38 24 52 19
102 22 77 79 - 35 104 53
16 - 44 37 386 152 632 432
- 18 - -4 944 874 1 110 2 160
875 347 199 317 345 19 184 102 339 85 77 225
1 190 155 235 686 115 42 22 22 945 78 136 431
50 - 24 -- - - 21 - - - -- - - 19
903 136 192 202 182 12 41 135
2 741 l 465 l 877 2 951 2 024 1 084 l 475 1 837
259 140 63 460 440 241 339 616
18 - - 38
4 944 874 1 110 2 160 4 138 656 853 l 557
483 168 77 362 232 50 145 202 91 - 35 39
3 654 1 517 2 774 7 582 BB 41 207 633
278 16 334 l 603 495 84 321 929 445 59 339 l 128 375 176 262 674
l 074 297 667 l 308 748 555 523 850 151 289 121 457
$10 680 $16 541 $9 420 $7 104 196 57 267 846 5.4 3.8 9.6 11.2
1 292 781 l 550 7 359 209 163 549 3 764 224 121 371 l 927 246 81 365 674 214 134 101 336
54 61 21 278 168 137 61 187 157 63 82 126 20 21 - 67
$5 795 $6 425 $2 876 $1 965 189 163 475 3 425
15.3 20.9 30.6 46.5
Not reported
1 252 707 640 640
-545
1 405 503 483 414
69 902
640 173 79 67 86 63 21 19 67 --
65 -
414 67 23 97
112 -
67 ----
48 -
640 565
38 37 -
414 331
60 23 -
558 105 99 20 39 22
171 80 22
$9 455 143
25.6
663 329 102
61 41 65 24 18 23
$2 061 209
41.6
473

Table 18. Economic Characteristics of the foreign-Born Population by Year of Immigration and Country of
Birth: 1970-Continued [Data based on 5-percent sample see text. For minimum base for derived figures (percent, median, etc.) and meaning of symbols see text]
United States
GERMANY
EMPLOYMENT STATUS
Male, 16 years old and aver--------------Labor force----------------------------------
Civilian lobar force--------------------------Employed---------------------------------Unemployed ____ -----___ -------------- -----
Not in labor force----------------------------- -
Female, 16 years old and over------------Labor force---------------------------------
Civilian labor force----------------------------
~~~:~l~;d==============================--Not in labor force----------------------------- -
OCCUPATION
Male employed, 11> years old and over------ -Professional, technical, and kindred workers ______ _ -Managers and administrators, except form _______ _ -Sales workers---------------------------------Clerical and kindred workers_ __________________ _ -Craftsmen and kindred workers----------------Operatives, except transport-------------------Transport equipment operatives----------------Laborers, except form -------------------------
----Formers and farm managers ___________________ _
Form laborers and form foremen ---------------Service workers, except private household --------Private household workers _____________________ _
Female employed, 16 years old and over ----Professional, technical, end kindred workers ______ _ Managers and administrators, except farm _______ _ Sales workers--------------------------------Clerical and kindred workers_ __________________ _ Craftsmen and kindred workers ----------------Operatives, except transport-------------------Transport equipment operatives ----------------Laborers, except farm -------------------------Formers and farm managers_ __________________ _
Form laborers and form foremen ---------------Service workers, except private household --------Private household workers _____________________ _
CLASS OF WORKER
Male employed, 16 years aid and aver-----Private wage and salary workers---------------Government workers -------------------------Self-employed workers------------------------Unpaid family workers-------------------------
Female employed, 16 years old and over ___ _
----
-------------
-----
--
-
Private wage ond salary workers---------------Government workers --------------------------Self-employed workers-------------------------Unpaid family workers ________________________ _
INCOME IN 1969 OF FAMILIES AND UNRELATED INDIVIDUALS
-
All families----------------------------Under $1,999 ___________________________ _
$2,000 to $3,999------------------------------$4,000 to $5.999-------------------------------
~~;~]~~jrnj~_:j_j:~:i~)-::~_~:jrnj With income below poverty level _________________ _
Percent of all families-------------------------
All unntlated individuals ------------------
~~~~Jjjji-ij~~-:~!_:_j-~~!-j-:=:jj $~~·~to $24,999-------------------------=--= 1ecJ· . or more-------------------------------
1an tncome ----------With income below poverty 1;.;el~=================
Percent of all unrelated individuals, -------------
Total
321 348 214 676 208 226 202 129
6 097 106 672
482 276 173 446 173 171 164 433
8 738 308 830
202 129 37 749 27 052 13 854 12 170 57 436 21 566 4 541 6 383 3 602 l 041
16 494 241
164 433 21 718 7 654
15 686 50 270 3 614
23 407 364
1 321 238 359
31 980 7 822
202 129 158 818 16 761 26 270
280
164 433 136 349 17 563 8 597 l 924
265 552 16 587 29 158 29 651 27 931 29 628 65 158 49 474 17 965 $9 988 23 341
8.8
133 108 53 604 32 537 16 918 12 044 6 495 7 564 2 855 1 091
$2 687 44 817
35.5
1965 to
1970
13 241 11 802 11 245 11 088
157 1 439
36 591 13 562 13 499 12 453 1 046
23 029
11 088 3 788 1 285
337 534
2 980 l 014
98 171
-28
853 -
12 453 2 121
473 978
3 823 253
1 613 19 88 -
'29 2 545
511
11 088 9 357 1 233
498 -
12 453 11 239
924 271
19
10 354 l 117
850 938
l 222 885
2 884 2 151
307 $10 286
l 564 15.l
7 369 2 532 1 189 l 121 1 039
606 6(JJ 176 46
$3 943 2 110
30.2
1960 1955 1950 to to ta
1964 1959 1954
20 379 39 237 49 215 18 480 34 324 42 070 18 071 33 267 39 795 17 797 32 527 38 615
274 740 1 180 1 899 4 913 7 145
49 754 75 529 78 510 20 960 32 956 39 348 20 942 32 916 39 222 19 706 31 495 37 588 1 236 1 421 1 634
28 794 42 573 39 162
17 797 32 527 38 615 3 718 5 503 7 771 1 948 3 771 4 294
783 1 411 2 117 562 l 849 2 836
6 551 11 338 10 697 l 847 4 045 5 427
365 505 930 321 1 361 1 744
- 125 290 52 131 198
1 601 2 428 2 289 49 {jJ 22
19 706 31 495 37 588 1 658 3 347 4 661
855 1 193 l 324 1 749 2 963 3 207 6 320 9 355 13 038
398 715 903 3 131 5 460 5 586
116 47 119 251 226 392
- - 45 43 66 43
4 389 6 940 7 161 796 l 183 l 109
17 797 32 527 38 615 15 528 27 341 32 395
816 l 790 2 903 1 414 3 355 3 278
39 41 39
19 706 31 495 37 588 17 906 27 055 30 921
870 3 057 4 504 787 1 035 1 669 143 348 494
17 228 32 834 34 863 l 637 2 065 1 480
878 1 383 1 889 1 126 2 104 2 436 l 240 3.097 3 480 2 071 4 473 5 170 5 711 11 271 11 863 3 964 7 168 6 810
601 l 273 l 735 $11 455 $11 462 $11 255
2 163 2 824 2 372 12.6 8.6 6.8
8 028 10 289 14 700 1 352 2 645 4 777 l 685 2 056 3 337 l 344 1 933 2 5'29 1 447 1 539 l 597
683 1 102 888 1 246 758 1 113
246 214 342 25 42 117
$5 563 $4 474 $3 562 l 247 1 800 2 569
16 3 . 19.5 21.9 lNumber and base of percentages exclude members of the Armed Forces living in barracks and college students living in dormitories.
474
1945 1935 1925 to to to Before
1949 1944 1934 1925 Not
reported
20 571 26 023 67 512 78 645 6 525 16 630 20 766 40 901 25 826 3 877 15 916 20 661 40 797 25 826 2 648 15 347 20 348 39 123 24 711 2 573 569 313 1 674 1 115 75 3 941 5 257 26 611 52 819 2 648 38 173 31 574 67 934 94 599 9 612 19 331 12 789 18 259 13 160 3 081 19 331 12 789 18 259 13 160 3 053 18 531 12 217 17 212 12 283 2 948 800 572 1 047 877 105 18 842 18 785 49 675 81 439 6 531
15 347 20 348 39 123 24 711 2 573 3 927 5 855 4 117 2 609 461 2 763 5 149 4 847 2 699 296 1 599 3 636 2 088 1 661 222 1 426 l 349 1 972 1 449 193 2 422 2 279 13 387 7 245 537 l 173 698 4 601 2 420 341
536 305 938 753 111 391 178 935 1 085 197 105 144 1 350 1 487 101
71 44 238 259 20 934 711 4 590 2 994 94
- - 60 50 -18 531 12 217 17 212 12 283 2 948
3 854 2 738 1 545 1 304 490 910 938 1 050 699 212
1 791 1 710 1 860 1 243 185 6 274 3 884 4 182 2 595 799
395 218 517 158 57 2 276 675 2 696 1 450 520
- 18 - 45 -176 23 38 85 42
18 - 92 83 -32 - 92 37 17
2 439 1 634 3 498 2 865 5<:11 366 379 1 642 1 719 117
15 347 20 348 39 123 24 711 2 573 11 765 13 487 '29 800 17 378 1 767 1 930 2 073 3 175 2 422 419 l 585 4 788 6 126 4 839 387
67 - 22 72 -
18 531 12 217 17 212 12 283 2 948 14 607 8 811 13 538 9 863 2 409 2 794 1 828 1 976 l 274 336 1 005 1 341 1 381 972 136
125 237 317 174 67
16 136 24 675 61 199 65 114 3 149 676 552 2 841 5 887 332
l 061 1 347 7 013 14 216 521 1 522 1 453 8 088 11 506 478 1 940 1 689 7 117 7 689 457 1 855 1 864 7 153 5 900 257 4 064 4 836 13 742 10 311 476 3 379 7 180 11 377 6 943 502 l 639 5 754 3 868 2 662 126
$11 248 $15 831 $9 549 $6 254 $7 143 1 073 879 3 897 8 022 547
6.6 3.6 6.4 12.3 17.4
8 050 10 019 24 617 46 067 3 969 2 502 2 707 9 311 25 696 2 082 l 439 2 131 7 206 12 394 l 100 1 674 l 423 2 905 3 572 417
928 998 2 551 l 774 171
527 670 1 087 912 20 638 1 092 1 025 873 159
265 651 389 552 20 77 347 143 294 -
$4 077 $4 234 $2 687 $1 838 $1 896
2 017 2 487 8 365 23 114 1 108 0.2 44.0 27.0 24.9 34.0
NATIONAL ORIGIN AND LANGUAGE

Table 18. Economic Characteristics of the Foreign-Born Population by Year of Immigration and Country of Birth: 1970-Continued
[Dato based on S.percent sample, see text. For minimum base for derived figures (percent medlon etc) and meaning of symbols see text]
United . States
POLAND
EMPLOYMENT STATUS
Male, 16 years old and over ______________ _
Labor force-----------------------------------Civilian labor force---------------------------
~~~~~l~;ci::::::::::::::::::::::::::::::: Not in labor force _____________________________ _
Female, 16 years aid and over-------------Labor force-----------------------------------
Civilian labor force---------------------------
~~~~~~y;ci::::::::::::::::::::::::::::::: Not In labor force------------------------------
OCCUPATION
Male employe<I, 16 years old and over------Professional, technical, and kindred workers--------Managers and administrators, except farm ________ _ Soles workers---------------------------------Clerical and kindred workers ____________________ _
Craftsmen and kindred workers -----------------Operatives, except transport--------------------Transport equipment operatives -----------------Laborers. except form --------------------------Formers and form managers ____________________ _
Form laborers and form foremen ----------------Service workers, except private household --------Private household workers-----------------------
Female employed, 16 years old and aver -----Professional, technical, ond kindred workers _______ _ Managers and administrators, except farm--------Sales workers---------------------------------Clerical and kindred workers ____________________ _
Craftsmen and kindred workers -----------------Operatives, except transport--------------------Transport equipment operatives -----------------Laborers, except farm --------------------------Farmers and farm managers ____________________ _
Farm laborers and form foremen ----------------Service workers, except private household ---------Private household workers_ _____________________ _
CLASS OF WORKER
Mole employed, 16 years old and over------Private woge and salary workers----------------Government workers--------------------------Self·employed workers-------------------------Unpaid family workers--------------------------
. Female employed, 16 years aid and aver -----Private wage and solory workers----------------Government workers --------------------------Self·employed workers-------------------------Unpaid family workers--------------------------
INCOME IN 1969 OF FAMILIES AND UNRELATED INDIVIDUALS
i':ii5Tu~~~=~jjj==j:j==jj=~=~~m=jj $1 o.ooci~t ;'79-------------------------------$15,000 to ~24·===---------------------------
~~~~i~~o~~~=============================== ~ income below poverty level _________________ _ ercent of all families ________________________ _
All unrelated individuals ------------------Under $1,999 _______ _
$2,000 to $3,999 ____ :_::::::::::::::::::::::::: t:~ :~ $~,999 ______________________________ _
ria~~}9;T=============================== $15.000 to $ 2/99----------------------------$25,000 or ! 0;:'9-----------------------------Medion income -------------------------------
With income bel~~p~~~rtYie;ell::::::::::::::::: Percent of all unrelated individuals 1 ------------
Total
232 283 139 064 138 491 133 006
5 485 93 219
273 671 70 763 70 763 65 581
5 182 202 908
133 006 16 341 16 786 11 922
7 178 31 618 28 729
3 300 4 712
843 505
11 011 61
65 581 5 979 2 401 7 227
12 723 l 936
19 777 41
714 182 162
12 879 l 560
133 006 103 076
8 076 21 522
332
65 581 55 889
4 688 3 868 l 136
205 524 12 458 26 214 20 729 22 845 25 028 50 919 35 019 12 312 $9 639 17 272
8.4
91 910 48 131 21 905
8 721 5 596 3 086 3 006
929 536
$1 925 44 018
48.l
1965 to
1970
9 490 8 188 8 140 7 665
475 l 302
11 771 7 146 7 146 6 800
346 4 625
7 665 l 377
182 289 285
2 052 2 772
92 191
-23
402 -
6 800 819 22
216 635 213
3 035 -
211 -
20 l 514
115
7 665 6 975
494 173
23
6 800 6 401
306 73 20
6 479 296 443 454 852
l 058 2 431
775 170
$10 281 436 6.7
2 558 845 300 601 441
98 251
-22
$4 543 757
30.4
1960 1955 1950 to to to
1964 1959 1954
13 298 13 347 32 996 11 732 12 177 28 882 11 696 12 088 28 690 11 357 11 683 28 081
339 405 609 l 566 l 170 4 114
14 59'1 12 301 23 281 8 823 6 381 10 909 8 823 6 381 10 909 8 295 6 034 10 395
528 347 514 5 776 5 920 12 372
11 357 11 683 28 081 l 164 2 080 2 947
686 664 2 556 503 389 1 124 445 546 1 091
3 121 3 539 7 835 3 462 2 729 7 687
229 204 541 !'IJ7 488 l 444
17 19 105 63 22 121
l 136 981 2 630 24 22 -
8 295 6 034 10 395 543 657 719 221 164 248 278 507 803
l 347 l 134 l 352 251 255 361
3 304 l 874 3 985 - - -
123 14 76 - 39 -- - 63
2 152 l 277 2 591 76 113 197
11 357 11 683 28 081 10 047 10 223 23 690
391 515 l 361 876 945 3 030
43 - -
8 295 6 034 10 395 7 545 5 383 8 942
399 313 700 180 318 509 171 20 244
10 215 12 162 29 199 193 332 940 236 388 935 623 608 l 945 957 1 105 3 551
l 739 l 860 4 367 4 066 4 134 9 969 2 065 3 055 6 155
336 680 1 337 $11 672 $12 163 $11 435
319 513 l 364 3.1 4.2 4.7
2 272 2 216 s 939 433 440 l 517 446 588 l 124 409 395 943 362 375 l 074 289 226 600 264 157 431 69 35 97 - - 153
$5 336 $4 465 $4 737 346 354 l 442 16.2 16.7 24.4
•Number and base of percentages exclude members of the Armed Forces living in barracks and college students living in dormitories.
NATIONAL ORIGIN AND LANGUAGE
1945 1935 1925 to to to Before
1949 1944 1934 1925
25 312 8 705 14 023 111 209 21 828 6 474 9 707 38 277 21 749 6 474 9 691 38 260 20 966 6 200 9 155 36 265
783 274 536 l 995 3 484 2 231 4 316 72 932
22 717 7 942 17 988 156 926 9 523 2 675 5 174 18 889 9 523 2 675 5 174 18 889 8 751 2 490 4 763 16 887
772 185 411 2 002 13 194 5 267 12 814 138 037
20 966 6 200 9 155 36 265 2 626 969 l 041 4 057 3 303 l 450 l 834 5 833 l 855 722 930 5 896
913 411 546 2 651 4 840 l 155 l 880 6 907 4 544 858 l 434 4 900
451 88 268 l 388 729 40 219 l 031 298 15 57 288
31 33 22 170 l 376 459 924 2 929
- - - 15
8 751 2 490 4 763 16 887 l 070 465 351 l 148
296 109 158 l 142 l 126 527 880 2 764 1 651 627 l 236 4 535
372 18 142 309 2 619 361 979 3 384
- - - 41 22 16 104 129 87 - 25 31 21 - 21 37
1 357 283 753 2 789 130 84 114 578
20 966 6 200 9 155 36 265 15 579 4 197 6 136 25 076
768 428 l 020 2 902 4 581 l 554 l 982 8 097
38 21 17 190
8 751 2 490 4 763 16 887 7 156 2 000 4 012 13 462
523 257 412 1 640 770 150 317 l 511 302 83 22 274
23 508 7 908 12 775 101 086 943 266 893 8 458
1 267 461 l 181 21 076 l 407 698 l 256 13 499 2 304 l 162 1 342 11 287 2 940 888 l 368 10 474 7 615 l 807 3 070 17 359 5 447 l 400 2 667 13 015 l 585 l 226 998 5 918
$11 900 $11 325 $10 566 $7 333 l 303 369 l 211 11 556
5.5 4.7 9.5 11.4
3 820 2 689 5 574 64 368 l 155 969 2 454 38 716
634 653 l 600 16 107 719 386 627 4 467 440 154 432 2 202 357 123 265 l 064 404 255 155 1 068
93 127 20 444 18 22 21 300
$4 350 $3 138 $2 327 $1 728 971 858 2 250 35 560
25.9 31.9 40.4 55.2
Not reported
3 903 l 799 l 703 l 634
69 2 1()4
6 146 l 243 l 243 l 166
77 4 903
l 634 80
278 214 90
289 343
39 63 44 20
174 -
l 166 207
41 126 206
15 236
-19 --
163 153
l 634 l 153
197 284
-l 166
988 138 40 -
2 192 137 227 239 285 334 468 440
62 $9 246
201 9.2
2 474 l 602
453 174 116 64 21 44 -
$1 596 l 480
61.2
475

Table 18. Economic Characteristics of the Foreign-Born Population by Year of Immigration and Country of
Birth: 1970-Continued [Doto b<lsed on 5-percent sample see text. For minimum b<lse for derived figures (percent, median, etc.) and meaning of symbols, see text]
United States
CZECHOSLOVAKIA
EMPLOYMENT STATUS
Male, 16 years old and over ______________ _
Labor force -----------------------------------Civilian lobar force---------------------------
Employed---------------------------------Unemployed ______ -------------------------
Not in labor force-------------------------------Female, 16 years aid and aver -----------
labor force----------------------------------Civilian labor force---------------------------
Employed ------------ ----------------- ___ _ Unemployed ______ -------------------------
Not in labor force------------------------------
OCCUPATION
Male employed, 16 years aid and over-------Professional, technical, and kindred workers _______ _ Managers and administrators, except farm _______ _ -Sales workers---------------------------------Clerical and kindred workers ___________________ _ -
--
-
Craftsmen and kindred workers -----------------Operatives, except transport-------------------Transport equipment operatives -----------------Laborers, except farm ------------------------Farmers and form managers--------------------Farm laborers and farm foremen ----------------Service workers, except private household --------Private household workers _____________________ _ -
Female employed, 16 yurs old and over -----Professional, technical, and kindred workers ______ _ -Managers and administrators, except form--------Sales workers-------------------------------- -Clerical and kindred workers ____________________ _
"
-
Craftsmen and kindred workers -----------------Operatives, except transport--------------------Transport equipment operatives ----------------Laborers, except form -------------------------Farmers and farm managers_ __________________ _
Form laborers and form foremen ---------------Service workers, except private household --------Private household workers _____________________ _
CLASS OF WORKER
----
---
Mole employed, 16 years old and over-----Private wage and salary workers----------------Government workers-------------------------Self-employed workers------------------------Unpaid family workers--------------------------
Fomale employ..t, 16 years old and over ----Private wage and salary workers----------------Government workers--------------------------Self-employed workers-------------------------Unpaid family workers--------------------------
INCOME IN 1969 OF FAMILIES AND UNRELATED INDIVIDUALS
All famil!BS ----------------------------Under $1, 999 ____ ---------- ---- ------ ----------$2,000 to $3,999------------------------------$4,000 to $5,999------------------------------$6,000 to $7,999-------------------------------$8,000 to $9,999 ______________________________ _
$10,000 to $14,999 ________ ---------------------$15,000 to $24,999-------------------------- __
~;d:ii~~o~':~::::::::::::::::::::::::::::::: With income below poverty level_ ________________ _
Percent of all families ________________________ _
All unAlated individuals ------------------
~) itimii=i~~~~i=iiiii~~i~i=~~~:i~~~i $10,000 to $14,999----------------------------$~~·~ to $24,999-----------------------------
i~dian i~~C:,~r~=============================== With income below poverty le11el'----------------
Percent of all unrelated individuals' -------------
1965 to
Total 1970
68 780 4 924 37 045 4 590 36 840 4 590 35 589 4 457
1 251 133 31 735 334
88 657 5 103 21 745 2 831 21 721 2 831 20 357 2 508
1 364 323 66 912 2 272
35 5119 4 457 7 006 l 588 3 976 71 2 144 59 1 803 192 8 616 l 088 5 646 890 1 018 56 l 367 248
811 -96 -
3 106 265 - -
20 357 2 508 2 873 761
819 44 l 719 76 4 407 526
547 61 4 395 481
52 -132 46 18 -
104 19 4 381 409
910 85
35 589 4 457 27 698 3 954 3 198 409 4 652 94
41 -20 357 2 508 16 556 2 085 2 063 345 l 446 59
292 19
60 810 3 288 4 889 316 9 155 333 6 745 337 6 738 327 7 358 507
13 600 777 9 379 649 2 946 42
$8 782 $9 306 6 631 543
10.9 16.5
30 022 1 852 16 179 599 6 666 333 2 711 352 2 001 226 l 083 '209
847 57 426 59 109 17
$1 884 $3 967 14 751 581
49.4 32.1
1960 1955 1950 to to to
1964 1959 1954
2 513 4 194 s 184 2 203 3 834 4 408 2 203 3 795 4 321 2 061 3 689 4 191
142 106 130 310 360 776
2 1113 4 782 5 198 l 466 1 938 2 287 l 466 l 914 2 287 1 413 1 835 2 106
53 79 181 l 347 2 844 2 911
2 061 3 689 4 191 5n 671 1 158 167 554 531 115 108 345 97 228 230
555 l 332 945 351 352 539
74 84 118 40 20 104 - - -- - -
85 340 221 - - -
1 413 1 1135 2 106 183 319 456 36 81 104 40 110 55
477 500 278 57 33 45
349 528 600 - - 26 - - -- - -- - 21
191 264 482 80 - 39
2 061 3 689 4 191 l 829 2 995 3 158
45 275 399 187 419 634 - - -
1 413 1 835 2 106 l 314 l 550 1 582
50 166 274 37 102 209 12 17 41
2 170 3 636 4 353 68 87 90
173 139 127 119 140 389 160 338 290 311 592 618 653 l 201 l 510 580 913 l 030 1()6 226 '299
$11 945 $12 173 $12 194 130 154 194 6.0 4.2 4.5
616 754 1 261 172 162 415 104 134 240 199 69 178 95 135 98 24 88 41 22 124 148 - 42 106 - - 35
$4 410 $6 128 $3 785 141 162 359
24.1 21.5 29.5 1 Number and base of percen.toges exclude members of the Armed Forces living In barracks and college students living in dormitories.
476
1945 1935 1925 to to to Before Not 1949 1944 1934 1925 reported
5 627 4 052 5 324 35 421 1 541 4 905 3 106 3 203 10 101 695 4 887 3 106 3 185 10 101 652 4 744 3 026 3 091 9 678 652 143 80 94 423 722 946 2 121 25 320
-846
6 243 5 463 7 361 49 651 2 043 2 499 2 527 2 283 5 428 486 2 499 2 527 2 283 5 428 486 2 410 2 412 2 159 5 028 486 89 115 124 400 3 744 2 936 5 078 44 223 -
l 557
4 744 3 026 3 091 9 678 652 1 132 w; 419 710 142
990 565 300 743 55 432 306 203 534 42 280 182 81 437 76 743 w; 836 2 448 60 753 391 444 1 730 196
80 60 46 500 -109 54 104 667 21
- 18 84 689 20 - - - 96 -225 232 574 1 124 40
- - - - -2 410 2 412 2 159 5 028 486
323 312 141 331 47 114 171 58 211 -379 235 208 485 131 590 450 573 890 123 95 33 79 144 -
512 491 363 975 96 - - - 26 -- 47 - 39 -- - - 18 -- - - 64 -
335 615 655 l 366 64 62 58 82 479 25
4 744 3 026 3 091 9 678 652 3 415 2 338 2 390 7 070 549
433 267 410 877 83 896 421 291 l 690 20
- - - 41 -2 410 2 412 2 159 5 028 486 l 958 l 984 1 697 3 940 446
216 246 268 498 -236 148 127 508 20
- 34 67 82 20
s 187 3 742 s 182 32 274 978 110 121 301 3 582 214 198 99 618 7 330 138 206 282 584 4 646 42 636 357 568 4 026 36 883 423 660 3 242 122
l 309 1 167 1 133 5 671 179 l 074 869 l 130 2 940 194
771 424 188 837 53 $12 141 $12 524 $9 576 $6 279 $8 967
154 183 441 4 596 236 3.0 4.9 8.5 14.2 24.1
1 347 l 533 l 926 20 010 723
419 431 l 018 12 569 394
199 452 597 4 509 98
153 277 176 1 243 64 270 143 74 859 101
164 69 20 426 42 99 45 21 307 24
43 59 20 97 -- 57 - - -
$4 653 $3 037 $1 915 $1 679 $1 877
399 369 958 11 431 351 7 50,1
29.6 49.7 5 .l 24.l
NATIONAL ORIGIN AND LANGUAGE
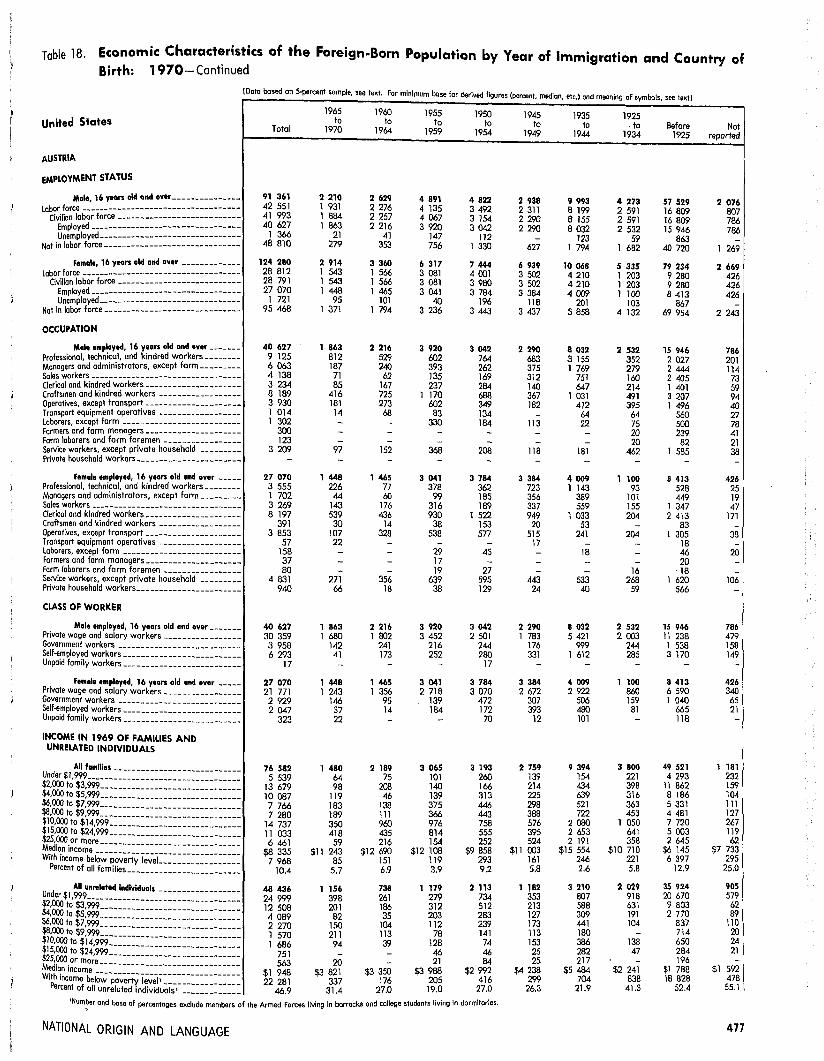
Table 18. Economic Characteristics of the Foreign-Born Population by Year of Immigration and Country of Birth: 1970-Continued
[Doto based on 5-pereent sample, see text. For minimum base for derived figures (percent median etc) and meaning of symbols see text]
United States
AUSTRIA
EMPLOYMENT STATUS
Mala, 16 yecin aid and over ______________ _
Labor farce-----------------------------------Civilian labor force---------------------------
Employed ------------------ ---------------Unemployed __ -------- ---------- --___ --- __ _
Not in lobar force------------------------------
Famale, 16 yean old and over ------------Labor force ----------------------------------
Civilian labor force---------------------------
ii~~:i1~~;<l::::::::::::::::::::::::::::::: Not in labor force------------------------------
OCCUPATION
Male employed, 16 yean old and over------Professional, technical, and kindred workers--------Monagers and administrators, except farm ________ _ Sales workers---------------------------------Clerical and kindred workers_ ___________________ _
Craftsmen and kindred workers -----------------Operatives, except transport--------------------Transport equipment operatives -----------------Laborers, except farm --------------------------Farmers and farm managers ____________________ _ Form laborers and form foremen ----------------Service workers, except private household ---------Private household workers ______________________ _
Female employed, 16 yean old and over -----Professional, technical, and kindred workers _______ _ Managers and administrators, except farm ________ _ Sales workers---------------------------------Clerical and kindred workers ____________________ _ Craftsmen and kindred workers -----------------Operatives, except transport--------------------Transport equipment operatives -----------------Laborers, except form --------------------------Formers and form managers ____________________ _
Form laborers and form foremen----------------Service workers, except private household ---------Private household workers ______________________ _
CLASS OF WORKER
Male employed, 16 ye an old and over ______ _ Private wage and salary workers----------------Government workers--------------------------Self-employed workers------------------------Unpaid family workers-------------------------
----
Female employed, 16 yean old and over ---Private wage and salary workers---------------Government workers -------------- -------------Self-employed workers ____ --------------------- -Unpaid family workers ____ ----------------------INCOME IN 1969 OF FAMILIES AND
UNRELATED INDIVIDUALS
-
~:: $:~ W:~~~~~~~~~~~;~~~~~~~;~~~~~;~~~~~= t::l&l :~ $~·:-------------------------------
---
$ ' ------------------ ------------$10,000 to $14,999----------------------------m·:l&l to $24,999 ___________________________ _
--~~~n i~~o'::i°:~=======::::::::::= ::::::::::::
1~ income below poverty level_ ________________ _ ercent of all families_ ______________________ _ -
U d All unrelated Individuals ------------------
$~.oOO $t~1i m:::::::::::::::::: :::::::::::: t::l&l :~ ~~,999 __ ---------------- -------------
--$8 000 ,999 _____________________________ _
--$10.ocxf ~o$~J9J9999:------------- -- ------------
$1 s,ooo to $24.999 ----------------------------$25,000 or mo~e ----------------------------Median income -------------------------------
--With income bel~wp~·;;;;r1Y1;;~;::::::::::::::::-
Percent of all unrelated individuals• -----------
Total
91 361 42 551 41 993 40 627
1 366 48 810
124 280 28 812 28 791 27 070
1 721 95 468
40 627 9 125 6 063 4 138 3 234 8 189 3 930 1 014 1 302
300 123
3 209 -
27 070 3 555 1 702 3 269 8 197
391 3 853
57 158 37 80
4 831 940
40 627 30 359 3 958 6 293
17
27 070 21 771
2 929 2 047
323
76 582 5 539
13 679 10 087 7 766 7 280
14 737 11 033 6 461
$8 335 7 968
10.4
48 436 24 999 12 508 4 089 2 270 l 570 1 686
751 563
$1 948 22 281
46.9
1965 to
1970
2 210 1 931 l 884 1 863
21 279
2 914 1 543 1 543 1 448
95 1 371
1 863 812 187
71 85
416 181
14 ---
97 -
1 448 226 44
143 539
30 107 22 ---
271 66
1 863 1 680
142 41 -
1 448 1 243
146 37 22
l 480 64 98
119 183 189 35() 418 59
$11 243 85
5.7
1 156 398 201 82
150 211 94 -
20 $3 821
337 31.4
1960 1955 1950 to to to
1964 1959 1954
2 629 4 891 4 822 2 276 4 135 3 492 2 257 4 067 3 154 2 216 3 920 3 042
41 147 112 353 756 1 330
3 360 6 317 7 444 1 566 3 081 4 001 l 566 3 081 3 980 1 465 3 041 3 784
101 40 196 1 794 3 236 3 443
2 216 3 920 3 042 529 602 764 240 393 262
62 135 169 167 237 284 725 1 170 688 273 602 349 68 83 134 - 330 184 - - -- - -
152 368 208 - - -
1 465 3 041 3 784 77 378 362 60 99 185
176 316 189 436 930 1 522
14 38 153 328 538 577
- - -- 29 45 - 17 -- 19 27
356 639 595 18 38 129
2 216 3 920 3 042 1 802 3 452 2 501
241 216 244 173 252 280
- - 17
1 465 3 041 3 784 1 356 2 718 3 070
95 139 472 14 184 172 - - 70
2 189 3 065 3 193 75 101 260
208 140 166 46 139 313
138 375 446 111 366 443 960 976 758 435 814 555 216 154 252
$12 690 $12 108 $9 858 151 119 293 6.9 3.9 9.2
738 1 179 2 113 261 279 734 186 312 512 35 203 283
104 112 239 113 78 141 39 128 74 - 46 46 - 21 84
$3 350 $3 988 $2 992 176 205 416
27.0 19.0 27.0
•Nu~~er ond bose of percentages exclude members of the Armed Forces living in barracks and college students living in dormitories.
NATIONAL ORIGIN AND LANGUAGE
1945 1935 1925 to to to Before
1949 1944 1934 1925
2 938 9 993 4 273 57 529 2 311 8 199 2 591 16 809 2 290 8 1ss 2 591 16 809 2 290 8 032 2 532 15 946
- 123 59 863 627 1 794 l 682 40 720
6 939 10 068 5 335 79 234 3 502 4 210 l 203 9 280 3 502 4 210 1 203 9 280 3 384 4 009 l 100 8 413
118 201 103 867 3 437 5 858 4 132 69 954
2 290 8 032 2 532 15 946 683 3 155 352 2 027 375 1 769 279 2 444 312 751 160 2 405 140 647 214 1 401 367 1 031 491 3 207 182 412 395 1 496 - 64 64 560
113 22 75 500 - - 20 239 - - 20 82
118 181 462 1 585 - - - -
3 384 4 009 1 100 8 413 723 1 143 93 528 356 389 101 449 337 559 155 1 347 949 1 033 204 2 413
20 53 - 83 515 241 204 1 305
17 - - 18 - 18 - 46 - - - 20 - - 16 18
443 533 268 1 620 24 40 59 566
2 290 8 032 2 532 15 946 1 783 5 421 2 003 11 238
176 999 244 1 538 331 1 612 285 3 170
- - - -
3 384 4 009 1 100 8 413 2 672 2 922 860 6 590
307 506 159 1 040 393 480 81 665
12 101 - 118
2 759 9 394 3 800 49 521 139 154 221 4 293 214 434 398 11 862 225 639 316 8 186 298 521 363 5 331 388 722 453 4 481 576 2 080 1 050 7 720 395 2 653 641 5 003 524 2 191 358 2 645
$11 003 $15 554 $10 710 $6 145 161 246 221 6 397 5.8 2.6 5.8 12.9
1 ]82 3 210 2 029 35 924 353 807 918 20 670 213 588 631 9 803 127 309 191 2 770 173 441 104 837 113 180 - 714 153 386 138 650 25 282 47 284 25 217 - 196
$4 238 $5 484 $2 241 $1 788 299 704 838 18 828
26.3 21.9 41.3 52.4
Not reported
2 076 807 786 786 -
1 269
2 669 426 426 426
-2 243
786 201 114
73 59 94 40 27 78 41 21 38 -
426 25 19 47
171 -
38 -
20 --
106 -
786 479 158 149 -
426 340 65 21 -
1 181 232 159 104 111 127 267 119 62
$7 733 295
25.0
905 579
62 89
110 20 24 21 -
$1 592 478 55.l
477
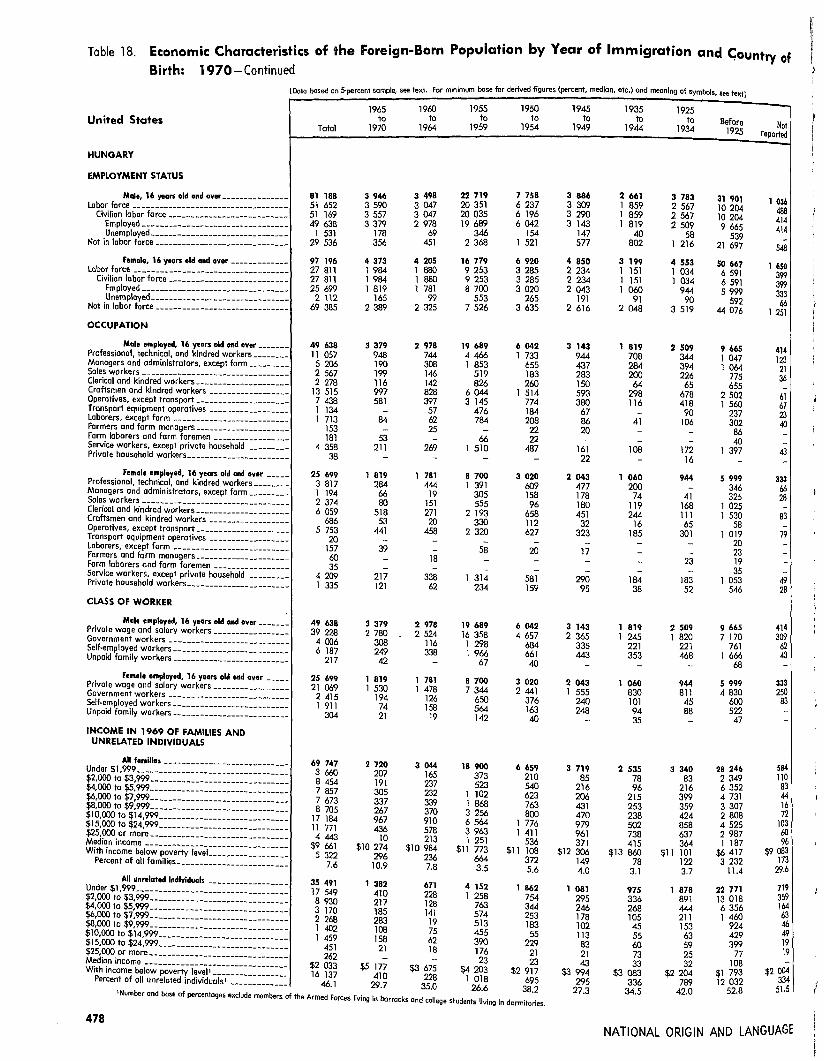
Table 18. Economic Characteristics of the Foreign-Born Population by Year of Immigration and c;ountry of Birth: 1970-Continued
[Doto based on 5-percent sample, see text. For minimum base for derived figures (percent, median, etc.) and meaning of symbols, see text]
United States
HUNGARY
EMPLOYMENT STATUS
Male, 16 years old and over _____________ _ -Labor force -----------------------------------
Civilian labor force-------------------------- -Employed -------------------------- -------Unemployed ------ - ----------------------
Not in labor force-------------------------------
Female, 16 years old and over-------------Lobar force -----------------------------------
Civilian lobar force-------------------------Employed -------------------- ------ -----Unemployed __ --------- - -- __ -- - ----_ - ----
Not in labor force-----------------------------
-
OCCUPATION
Male employed, 16 years old and over------Professional, technical, and kindred workers ______ _ Managers and administrators, except farm _______ _ Soles workers--------------------------------Clerical and kindred workers_ __________________ _
Craftsmen and kindred workers ----------------Operatives, except transport-------------------Transport equipment operatives ----------------Laborers, except form -------------------------Farmers and farm managers ___________________ _
Form laborers and farm foremen ---------------Service workers. except private household --------Private household workers_ ____________________ _
Female employed, 16 years old and over ___ _ Professional, technical, and kindred workers ______ _ Managers and administrators, except farm-------Soles workers-------------------------------Clerical and kindred workers-------------------Craftsmen and kindred workers ----------------Operatives, except transport-------------------Transport equipment operatives ----------------Laborers. except form -------------------------Formers and farm managers ___________________ _
Form laborers and farm foremen ---------------Service workers. except private household -------Private household workers----------------------
CLASS OF WORKER
Male employed, 16 years old and over-----Private wage ond salary workers---------------Government workers -------------------------Self-employed workers------------------------Unpaid family workers-------------------------
Female employed, 16 years aid and over ___ _
---
-------------
-------------
-----
-Private wage end salary workers--------------Government workers ------------------------Self-employed workers-----------------------Unpaid family workers------------------------
--
INCOME IN 1969 OF FAMILIES AND UNRELATED INDIVIDUALS
All families--------------------------Under $1, 999 ____ ---------- __ ----------------$2,000 ta $3,999----------------------------$4.000 to $5,999----------------------------$6,000 to $7,999----------------------------$8,000 to $9,999-----------------------------$10,000 to $14,999 __________________________ _ $15,000 to $24,999 __________________________ _
$25,000 or mare----------------------------Median income------------------------------With income below poverty leveL ______________ _
Percent of all families_ _____________________ _
All unrelated l"dlvlduals ----------------Under $1, 999 ____ ---------- ----- -------------$2,000 to $3,999-----------------------------
t:~ i~ ~N:::::::::::::::::::::::::::::: $8,000 to $9,999-----------------------------$10,000 to $14,999 __________________________ _
$15,000 to $24,999---------------------------
i~~i~~o~':~:::::::::::::::::::::::::::::
------
----------------------------------------------With income below poverty level•--------------
Percent of all unrelated individuals• -------------
1965 to
Total 1970
81 188 3 946 51 652 3 590 51 169 3 557 49 638 3 379
1 531 178 29 536 356
97 196 4 373 27 811 1 984 27 811 1 984 25 699 l 819
2 112 165 69 385 2 389
49 638 3 379 11 057 948
5 206 190 2 567 199 2 278 116
13 515 997 7 438 581 1 134 -1 713 84
153 -181 53
4 358 211 38 -
25 699 1 819 3 817 284 l 194 66 2 374 80 6 059 518
686 53 5 753 441
20 -157 39 60 -35 -
4 209 217 1 335 121
49 638 3 379 39 228 2 780
4 006 308 6 187 249
217 42
25 699 1 819 21 069 1 530
2 415 194 l 911 74
304 21
69 747 2 720 3 660 207 8 454 191 7 857 305 7 673 337 8 705 267
17 184 967 11 771 436 4 443 10
$9 661 $10 274 5 322 '196
7.6 10.9
35 491 1 382 17 549 410 8 930 217 3 170 185 2 268 283 1 402 108 1 459 158
451 21 262 -
$2 033 $5 177 16 137 410
46.1 '19.7
1960 1955 1950 to to to
1964 1959 1954
3 498 22 719 7 758 3 047 20 351 6 237 3 047 20 035 6 196 2 978 19 6B9 6 042
69 346 154 451 2 368 1 521
4 205 16 779 6 920 1 880 9 253 3 285 l 880 9 253 3 285 1 781 0 100 3 020
99 553 265 2 325 7 526 3 635
2 978 19 689 6 042 744 4 466 1 733 308 1 853 655 146 519 183 142 826 260 828 6 044 1 514 397 3 145 774
57 476 184 62 784 208 25 - 22 - 66 22
269 1 510 487 - - -
1 781 8 700 3 020 444 1 391 609
19 305 158 151 555 96 271 2 193 658 20 330 112
458 2 320 627 - - -- 58 20
18 - -- - -
338 1 314 581 62 234 159
2 978 19 689 6 042 2 524 16 358 4 657
116 l 298 684 338 l 966 661
- 67 40
1 781 8 700 3 020 l 478 7 344 2 441
126 650 376 158 564 163 19 142 40
3 044 18 900 6 659 165 373 210 237 523 540 232 1 102 623 339 l 868 763 370 3 256 800 910 6 564 1 776 578 3 963 1 411 213 l 251 536
$10 984 $11 773 $11 108 236 664 372 7.8 3.5 5.6
671 4 152 1 862 228 l 258 754 128 763 344 141 574 253
19 513 183 75 455 55 62 390 2'19 18 176 21 - 23 23
$3 675 $4 203 $2 917 228 l 018 695
35.0 26.6 38.2 1Number and bose of percentages exclude members of the Armed Forces living in barracks and college students living In dormitories.
478
1945 1935 1925 to to to Before Not 1949 1944 1934 1925 reported
3 886 2 661 3 783 31 901 1 036 3 309 1 859 2 567 10 204 488 3 290 1 859 2 567 10 204 414 3 143 1 819 2 509 9 665 414 147 40 58 539 -577 802 1 216 21 697 548 4 850 3 199 4 553 50 667 1 650 2 234 l 151 1 034 6 591 399 2 234 l 151 1 034 6 591 399 2 043 1 060 944 5 999 333 191 91 90 592 66 2 616 2 048 3 519 44 076 1 251
3 143 1 819 2 509 9 665 414 944 708 344 1 047 123 437 284 394 1 064 21 283 200 226 775 36 150 64 65 655 -593 298 678 2 502 61 380 116 418 1 560 67
67 - 90 237 23 86 41 106 302 40 20 - - 86 -- - - 40 -
161 108 172 1 397 43 22 - 16 - -
2 043 1 060 944 5 999 333 477 200 - 346 66 178 74 41 325 28 180 119 168 l 025 -451 244 111 l 530 83 32 16 65 58 -
323 185 301 1 019 79 - - - 20 -
17 - - 23 -- - 23 19 -- - - 35 -
290 184 183 1 053 49 95 38 52 546 28
3 143 1 819 2 509 9 665 414 2 365 1 245 l 820 7 170 309
335 221 221 761 62 443 353 468 1 666 43
- - - 68 -2 043 1 060 944 5 999 333 l 555 830 811 4 830 250
240 101 45 600 83 248 94 88 522 -
- 35 - 47 -
3 719 2 535 3 340 28 246 584 85 78 83 2 349 110
216 96 216 6 352 83 206 215 399 4 731 44 431 253 359 3 307 16 470 238 424 2 808 72 979 502 858 4 525 103 961 738 637 2 987 lfJ 371 415 364 l 187 96
$12 306 $13 860 $11 101 $6 417 $9 083 149 78 122 3 232 173 4.0 3.1 3.7 11.4 29.6
1 081 975 1 878 22 771 719 295 336 891 13 018 359 246 268 444 6 356 164 178 105 211 l 460 63 102 45 153 924 46 113 55 63 429 49 83 YJ 59 399 19 21 73 25 77 19 43 33 32 108 -
$3 994 $3 083 $2 204 $1 793 $2 004 295 336 789 12 032 334
2 52.8 51.5 7.3 34.5 42.0
NATIONAL ORIGIN AND LANGUAGE

Table 18. Economic Characteristics of the Foreign-Born Population by Year of Immigration and Country of Birth: 1970-Continued
[Doto based on S.porcent sample, see text. For minimum base for derived figures (percent median etc) and meoning of symb I see text] 0 s,
United States
YUGOSLAVIA
EMPLOYMENT STATUS
Mole, 16 years old and over ______________ _
Labor force-----------------------------------Civilian lobar force---------------------------
~~~:~l~;<l::::::::::::::::::::::::::::::: Not in labor force------------------------------
Female, 16 years old ond over------------Labor force----------------------------------
Civilian labor force---------------------------
~~~~~l~~;d :::::: :: :: :: : : :: : : : : :: :: :: : : : : : Nat in labor force------------------------------
OCCUPATION
Male employed, 16 years old ond over-------Professional, technical, and kindred workers _______ _ Managers and administrators, except farm ________ _ Sales workers--------------------------------Clerical ond kindred workers--------------------Craftsmen and kindred workers -----------------Operatives, except transport--------------------Transport equipment operatives -----------------laborers, except farm -------------------------Formers and form monogers--------------------Farm laborers ond farm foremen ----------------Service workers, except private household ---------Private household workers ______________________ _
Female employed, 16 yean aid and over -----Professional, technical, and kindred workers _______ _ Managers and administrators, except farm--------Sales workers--------------------------------Clerical and kindred workers--------------------Craftsmen and kindred workers -----------------Operatives, except transport--------------------Transport equipment operatives -----------------laborers, except farm-------------------------Farmers and farm monagers--------------------Form laborers and form foremen ----------------Service workers, except private household -------- -Private household workers ______________________ _
CLASS OF WORKER
--
Male employed, 16 years old and over-----Private wage ond salary workers----------------Government workers ------ ------------------ __ _ Self-employed workers--------------------------Unpaid family workers_ _______________________ _
-
--
--
Female employed, 16 years old ond over ---Private wage ond salary workers---------------Government workers--------------------------Self-employed workers------------------------Unpaid family workers-------------------------
INCOME IN 1969 OF FAMILIES AND UNRELATED INDIVIDUALS
------------
~·~i~··:j:~j-~:=~~i~i~~~=~l:=jl~ji $
15,~ to $14,999 ___________________________ _
$25
•000
to $24,999 ________ ------------ _______ _
M~ian i~~o%~~=:::::::::=::::::::: :: :::::::: With income below poverty level_ _______________ _
Percent of oil families_ ______________________ _
------------
All unrelated Individuals -----------------~~~ $t~99j999------------- -----------------
it~:~=~==~~~~~==~~=~~~=::~:~::::~:~ $15,000 to i24::----------------------------
i~~i~~o~~·--=::::: :: :::::::::: :: :::::::: With income bel~-;P~~~rtY/;;01~::::::::::::::::
Percent of oil unrelated individuals' ------------
Total
73 492 47 035 46 787 45 232
1 555 26 457
71 032 22 414 22 414 21 392
1 022 48 618
45 232 6 034 2 884
945 1 352
13 830 10 128
972 2 710
390 53
5 934 -
21 392 2 048
563 1 130 2 931
815 7 345
-301
87 67
4 917 1 188
45 232 38 577 2 707 3 878
70
21 392 18 596 1 297 1 215
284
60 204 3 245 7 737 6 042 6 628 6 681
17 065 10 653 2 153
$9 931 5 107
8.5
21 430 9 577 4 959 2 661 1 795 1 115
924 329
70 $2 363 8 956
42.2
1965 to
1970
9 065 8 289 B 289 8 054
235 776
9 044 4 585 4 585 4 362
223 4 459
8 054 1 079
188 83
252 2 213 2 294
124 626
--
1 195 -
4 362 600
35 245 416 211
1 709 -
64 -
15 990
77
8 054 7 483
403 141 27
4 362 3 953
259 39
111
5 689 378 565 588 867 740
1 546 912 93
$9 207 758 13.3
1 762 459 348 325 270 199 161
--
$4 510 422 24.3
1960 1955 1950 to to to
1964 1959 1954
5 866 10 056 13 329 5 452 9 010 11 374 5 411 8 991 11 309 5 139 a 12a 11 078
272 263 231 414 1 046 1 955
5 254 10 121 10 386 2 854 4 801 4 113 2 854 4 801 4 113 2 758 4 591 4 034
96 210 79 2 400 5 320 6 273
5 139 8 728 11 078 586 1 483 1 184 262 369 590 132 212 78 149 262 313
1 647 2 748 4 011 1 038 2 197 2 717
112 116 320 483 377 556
- 37 43 - 33 -
730 894 1 266 - - -
2 758 4 591 4 034 225 349 393
- 119 140 87 270 158
556 637 490 92 176 132
1 090 1 773 1 356 - - -
71 42 44 - - 18 - 52 -
521 851 949 116 322 354
5 139 8 728 11 078 4 498 7 608 10 086
187 400 532 432 720 460 22 - -
2 758 4 591 4 034 2 577 4 106 3 495
103 221 271 58 244 225 20 20 43
4 726 8 649 11 570 96 222 282
146 392 486 329 427 669 558 738 1 414 562 993 1 376
1 938 3 117 4 166 906 2 330 2 723 191 430 454
$11 734 $12 490 $11 870 125 434 561 2.6 5.0 4.8
872 1 636 2 569 176 422 758 165 306 406 145 373 482 171 265 433 102 103 236 43 116 233 70 51 21 - - -
$4 913 $4 469 $4 597 695 156 326
19.2 20.2 27.3
1Number and base of percentages exclude members of the Armed Forces living in barracks and college students living in dormitories.
NATIONAL ORIGIN AND LANGUAGE
1945 1935 1925 to to to Before
1949 1944 1934 1925
3 281 2 230 2 464 26 203 2 743 1 716 1 642 6 268 2 681 1 698 1 642 6 246 2 551 1 675 1 560 5 927
130 23 82 319 538 514 822 19 935
3 178 1 674 3 913 26 526 1 188 508 923 3 201 1 188 508 923 3 201 l 156 508 811 2 952
32 - 112 249 1 990 1 166 2 990 23 325
2 551 1 675 1 560 5 927 631 231 174 586 329 223 149 774 100 37 46 236 37 19 87 214
572 310 480 1 707 405 199 267 873
52 28 - 220 103 196 39 289 62 60 39 127 - - - 20
260 372 279 881 - - - -
1 156 508 811 2 952 169 84 31 197
20 21 43 185 45 59 20 225
150 117 95 450 45 - 40 119
355 113 225 646 - - - -
42 - 19 19 - - 24 45 - - - -
291 114 274 871 39 - 40 195
2 551 1 675 1 560 5 927 l 920 1 103 1 109 4 372
259 206 164 490 372 366 266 1 065
- - 21 -
1 156 508 811 2 952 949 395 621 2 280
57 60 74 252 126 37 116 370 24 16 - 50
2 803 1 985 2 389 21 897 149 125 62 1 909 119 110 208 5 628 225 185 330 3 203 220 143 319 2 369 304 336 335 l 980
1 032 593 625 3 877 592 390 468 2 253 162 103 42 678
$11 863 $10 788 $9 645 $6 177 149 184 62 2 812 5.3 9.3 2.6 12.8
984 501 1 190 11 546 424 140 451 6 568 219 104 336 3 032 42 21 169 1 032
132 67 64 338 43 83 80 269 74 18 43 236 25 68 21 52 25 - 26 19
$2 642 $5 310 $2 603 $1 814 409 140 429 6 221 41.6 29.0 36.l 54.0
Not reported
998 541 520 520
-457
936 241 241 220
21 695
520 80 -
21 19
142 138 -
41 22 -
57 -
220 --
21 20 -
78 ----
56 45
520 398 66 56 -
220 220
---
496 22 83 86 -
55 171 79 -
$10 058 22
4.4
370 179 43 72 55 --
21 -...
158 ...
479

Table 18. Economic Characteristics of the Foreign-Born Population by Year of Immigration and Country of
Birth: 1970-Continued [Data based on S.percent somple, see text. For minimum base for derived figures (percent, median, etc.) and meaning of symbols, see text]
United States
U.S.S.R.
EMPLOYMENT STATUS
Male, 16 yean old and ov..----------------Labor force-----------------------------------
Civilian labor force---------------------------Employed -- ------ ---- ---------------------Unemployed ------ __ ----------------------
Not in labor force------------------------------
Female, 16 years old and over ------------Labor force----------------------------------
Civilian labor force--------------------------Em ployed _ ---------_ - ---------------------Unemployed ____ -----___ ---_ ---------------
Not in labor force------------------------------
OCCUPATION
Male employed, 16 years old and ov..- ------Professional, technical, and kindred workers ______ _ Managers and administrators, except form-------Sales workers-------------------------------Clerical and kindred workers-------------------Craftsmen and kindred workers ----------------Operatives, except transport-------------------Transport equipment operatives ----------------Laborers, except form -------------------------Formers and farm managers_ __________________ _
farm laborers ond form foremen ---------------Service workers, except private household -------Private household workers----------------------
Female employed, 16 years old and over ----Professional, technical, and kindred workers_ _____ _ Managers and administrators, except form _______ _ Soles workers--------------------------------Clerical and kindred workers_ __________________ _
Craftsmen and kindred workers ----------------Operatives, except transport-------------------Transport equipment operatives ----------------Laborers, except form -------------------------Farmers and form managers ___________________ _
Form laborers and farm foremen ---------------Service workers, except private household -------Private household workers----------------------
CLASS OF WORKER
Male employed, 16 years old a!ld ov..- -----Private wage and salary workers---------------Government workers --------------------------Self-employed workers ________________________ _ Unpaid family workers ________________________ _
Female employed, 16 years old and over ---Private wage and salary workers---------------Government workers -------------------------Self-employed workers-------------------------Unpaid family workers_ _______________________ _
INCOME IN 1969 OF FAMILIES AND UNRELATED INDIVIDUALS
-------------
-------------
----------
All families---------------------------Under $1,999 ____ -----------------------------
-$2,000 to $3,999-----------------------------$4,000 to $5,999-----------------------------$6,000 to $7,999-----------------------------$8,000 to $9,999------------------------------$10,000 to $14,999---------------------------$15,000 to $24,999----------------------------$25,000 or more-----------------------------Medion income -------------------------------With income below poverty level_ _______________ _
Percent of all families------------------------
All unnlated lndMcluals -----------------Under $1,999 ____ ---------- -------------------
~;~ ~~ fs:~:::::::::::::::::::::::::::::: $6.000 to $7,999------------------------------$8,000 to $9,999------------------------------
------------------$10,000 to $14,999---------------------------
$15,000 to $24,999----------------------------
~;i:ii~~o'::i°:~:::::::::::::::::::::::::::::: -
With income below poverty leve1•---------------Percent of all unrelated individuals• ------------
----
1965 to
Total 1970
20!2 780 2 295 105 913 1 825 105 688 1 B25 100 858 1 792
4 830 33 96 867 470
228 579 3 099 52 104 1 458 52 080 1 458 48 142 1 358
3 938 100 176 475 1 641
100 858 1 792 18 673 442 16 302 22 13 277 -7 160 171
17 739 374 12 677 481 2 861 -3 067 105 1 401 19
389 34 7 247 144
65 -48 142 1 358
6 450 307 2 761 -6 178 92
11 914 233 958 -
10 475 336 114 -489 -
87 -195 -
7 389 314 1 132 76
100 858 1 792 71 625 1 ·484
7 447 179 21 514 103
272 26
48 142 l 358 38 575 989
5 089 291 3 623 41
855 37
172 903 l 615 12 051 95 28 014 202 20 609 151 19 910 197 17 435 231 33 920 479 27 384 239 13 580 21 $8 673 $9 407 16 548 186
9.6 11.5
92 426 661 45 234 227 21 345 233 9 739 98 5 987 42 3 428 -3 687 41 1 856 20 1 150 -
$2 070 $3 247 40 624 210
44.0 31.8
1960 1955 1950 to to to
1964 1959 1954
4 003 6 765 19 349 3 440 5 689 15 227 3 440 5 666 15 128 3 217 5 430 14 549
223 236 579 563 1 076 4 122
4 993 6 037 17 602 2 636 3 393 a 319 2 636 3 393 8 319 2 539 3 187 7 945
97 206 374 2 357 2 644 9 283
3 217 5 430 14 549 634 1 157 3 300 205 269 827 123 142 169 306 326 632 952 1 493 3 149 395 1 126 3 387
58 - 347 109 232 758
- - 268 - - 62
435 685 1 606 - - 44
2 539 3 187 7 945 384 568 1 182 57 41 84 42 64 185
361 494 1 347 56 159 217
794 1 121 2 730 - - -
49 20 124 23 - 21 24 - 70
720 651 1 800 29 69 185
3 217 5 430 14 549 2 865 4 846 11 886
168 292 1 076 184 292 1 526 - - 61
2 539 3 187 7 945 2 142 2 821 6 750
123 273 788 250 73 274
24 20 133
3 306 5 630 16 435 41 161 608
179 340 1 272 327 229 1 307 345 641 1 624 619 914 2 240 848 1 801 5 241 863 1 290 3 372 84 254 771
$10 837 $11 471 $11 113 77 382 911
2.3 6.8 5.5
871 l 732 s 200 330 496 1 935 164 217 944 183 392 585 86 314 877 41 164 385 67 109 '299 - 40 89 - - 86
$3 500 $4 584 $3 318 277 395 1 755
31.8 22.8 33.9 'Number and base cf per'Centoges exclude members of the Armed Fon::es living in barracks and college students living in dormitories.
480
1945 1935 1925 to to to Before Not 1949 1944 1934 1925 reported
13 184 3 051 7 292 142 363 4 478 10 651 2 000 4 521 60 323 2 237 10 589 2 000 4 521 60 301 2 218 10 319 1 904 4 354 57 230 2 063 270 96 167 3 071 155 2 533 1 051 2 771 82 040 2 24]
12 827 3 667 11 226 162 715 6 413 5 857 1 064 3 047 24 885 1 445 5 857 1 064 3 047 24 861 1 445 5 565 1 064 2 890 22 247 1 347 292 - 157 2 614 98 6 970 2 603 8 179 137 830 4 968
10 319 1 904 4 354 57 230 2 063 2 837 483 618 8 967 235
956 480 1 000 12 263 280 420 255 580 11 423 165 457 44 352 4 536 336
1 934 326 815 8 389 307 1 974 152 463 4 385 314
245 81 92 1 841 197 433 41 99 1 220 70
58 20 21 969 46 42 - - 233 18
963 22 314 2 983 95 - - - 21 -
5 565 1 064 2 890 22 247 1 347 1 120 289 352 2 076 172
131 67 174 2 153 54 260 191 482 4 674 188 929 231 667 7 224 428 102 16 94 287 27
1 515 170 721 2 866 222 16 - - 98 -67 - 43 186 -- - - 43 -
19 - - 82 -1 332 100 323 1 951 198
74 - 34 607 58
10 319 l 904 4 354 57 230 2 063 7 986 1 300 2 780 37 056 1 422 1 169 114 519 3 670 260 1 164 490 1 034 16 340 381
- - 21 164 -5 565 1 064 2 890 22 247 1 347 4 625 760 2 210 17 165 1 113
597 115 247 2 490 165 238 168 334 2 176 69 105 21 99 416 -
12 089 2 444 6 935 121 498 2 951 293 94 479 10 007 273 714 221 828 23 960 298 804 243 500 16 647 401
1 131 321 932 14 193 526 1 522 170 747 10 727 265 3 745 426 1 499 19 239 642 2 916 649 1 382 16 316 357
964 320 568 10 409 189 $12 110 $12 031 $9 950 $7 405 $7 897
468 145 622 13 362 395 3.9 5.9 9.0 11.0 13.4
2 725 l 797 3 636 74 053 1 751 807 723 1 818 37 918 980 509 353 882 17 728 315 419 330 432 7 208 92 354 70 178 3 943 123 218 151 98 2 301 70 120 108 83 2 731 129 156 21 101 1 387 42 142 41 44 837 -
$4 314 $3 085 $2 000 $1 962 $1 763 769 667 1 640 33 997 914
2 45.9 52.2 8.8 37.1 45.1
NATIONAL ORIGIN AND LANGUAGE

Table 18. Economic Characteristics of the Foreign-Born Population by Year of Immigration and Country of Birth: 1970- Continued
(Data based an 5-percent sample, see text. For minimum base far derived figures (percent median etc) and meaning of symbols see text]
United States
LITHUANIA
EMPLOYMENT STATUS
Male, 16 years old and over--------------Labor force----------------------------------
Civilian labor force---------------------------
~~~:;,~~;ct::::::::::::::::::::::::::::::: Not in labor force------------------------------
Female, 16 yean old and over ------------Labor force-----------------------------------
Civilian labor force---------------------------
~~~~~l~;ct:::: :: :: :: :: :: :: :: :::: :: : : ::::: Not in labor force------------------------------
OCCUPATION
Male employed, 16 years old and over------Professional, technical, and kindred workers-------Managers and administrators, except farm---------Soles workers---------------------------------Clerical and kindred workers ____________________ _
Craftsmen and kindred workers -----------------Operatives, except transport--------------------Transport equipment operatives -----------------Laborers, except farm --------------------------Formers and form managers ____________________ _
Form laborers and farm foremen ----------------Service workers, except private household --------Privale household workers-----------------------
female employed, 16 yean old and over -----Professionol, technical, and kindred workers _______ _ Managers and administrators, except farm---------Sales workers---------------------------------Clerico! and kindred workers_ __________________ _
Craftsmen and kindred workers ----------------Operatives, except transport-------------------Transport equipment operatives ----------------Laborers. except farm ------------------------Farmers and farm managers-------------------Form laborers and farm foremen ---------------Service workers, except private household -------Private household workers----------------------
CLASS OF WORKER
Male employed, 16 yean old and over-----Private wage and salary workers---------------Government workers -------------------------Self-employed workers------------------------Unpaid family workers-------------------------
Female employed, 16 yean old ond over ---Private wage and salary workers---------------Government workers -------------------------Self-employed workers------------------------Unpaid family workers-------------------------
INCOME IN 1969 OF FAMILIES AND UNRELATED INDIVIDUALS
~ ·~ti~~:~~~~~~~~j~~~~:~~~~~~~~~~~ $10~~o$9i~----------------------------$15,000 to$ 24'999 ----------------------------
~~~;i~~o~~;~============================== 1~ income below poverty level_ _______________ _ ercent of all families------------------------
U d All unrelated Individuals -----------------$~.~ $'~ 9939 __________ -- -------- -- ---------- -
~ ~.~~~~==~~==~=~~:~~:~~~~~~~~~~: $15,000 to ~24°999----------------------------$25,000 or mo;e ---------------------------Median income ------------------------------
With income bel~~P~~~rtYle.;.;il:::::::::::::::: Percent of all unrelated individuals 1 ------------
---------
-----
-----
------------------------
1965 to
Total 1970
36 541 317 19 506 254 19 404 254 18 631 254
773 -17 035 63
42 306 474 10 365 225 10 349 225 9 563 225
786 -31 941 249
18 631 254 4 462 45 1 784 -1 191 -1 077 22 3 717 125 3 366 -
314 -809 -
72 -25 -
l 814 62 - -
9 563 225 1 727 39
475 -664 19
2 183 43 154 -
2 313 61 25 -74 21 - -- -
1 834 42 114 -
18 631 254 14 521 232
1 343 -2 691 22
76 -9 563 225 7 806 206 1 025 -
611 19 121 -
29 805 256 1 903 -4 154 -3 736 60 3 212 44 2 984 38 6 978 90 5 155 24 l 683 -
$9 272 ... 2 751 -
9.2 -
17 529 60 8 689 39 4299 -l 586 -1 328 -
674 21 556 -315 -
82 -$2 027 ...
7 827 39 44.7 ...
1960 1955 1950 to to to
1964 1959 1954
1 039 1 400 4 985 915 1 262 4 193 915 1 242 4 193 878 1 242 4 014 37 - 179
124 138 792
876 1 201 3 927 353 603 2 205 353 603 2 205 353 603 2 055 - - 150 523 598 1 722
878 1 242 4 014 317 194 1 017
72 97 192 56 - 20 19 98 167
150 297 844 122 365 l 012 22 - 100 17 129 161 - - 19 - - 25
103 62 457 - - -
353 603 2 055 60 43 333 - 37 100 - - 21
130 108 441 19 41 40 77 272 491 - - 25 - - 18 - - -- - -
67 102 508 - - 78
878 1 242 4 014 718 1 098 3 396 102 97 277 58 47 319 - - 22
353 603 2 055 331 585 1 790 22 - 137 - 18 68 - - 60
840 1 208 4 115 21 - 143 64 18 136 36 131 217 77 109 552
135 112 394 344 588 1 542 142 231 919 21 19 212
$11 265 $11 990 $11 996 21 - 205
2.5 - 5.0
200 264 1 352 36 33 331 - 54 311
42 81 204 21 53 188 39 21 161 62 22 141 - - 16 - - -... ... $4 279
36 33 320 ... ... 23.7
•Number and base of percentages exclude members of the Armed Forces living In barracks and college students living in dormitories.
NATIONAL ORIGIN AND LANGUAGE
1945 1935 1925 to to to Before
1949 1944 1934 1925
7 753 842 l 172 18 288 6 339 634 814 4 718 6 297 634 814 4 718 6 137 634 770 4 398
160 - 44 320 1 414 208 358 13 570
6 307 998 1 847 25 513 3 170 375 556 2 663 3 154 375 556 2 663 2 974 353 515 2 270
180 22 41 393 3 137 623 1 291 22 850
6 137 634 770 4 398 1 976 165 129 577
345 140 157 724 232 100 62 695 367 - 82 322
1 332 97 84 692 1 146 104 61 492
38 - 66 88 260 - 21 202
- - 22 31 - - - -
441 28 86 575 - - - -
2 974 353 515 2 270 851 139 64 157
61 38 19 205 131 40 105 332 538 110 59 669 38 - - -
876 - 171 365 - - - -
35 - - -- - - -- - - -426 26 97 524
18 - - 18
6 137 634 770 4 398 5 025 440 613 2 738
475 - 89 286 601 194 68 1 356
36 - - 18
2 974 353 515 2 270 2 322 271 450 1 742
468 38 41 235 145 44 24 271 39 - - 22
6 182 748 925 15 039 113 - BO 1 546 255 47 57 3 472 396 54 181 2 558 455 86 41 1 745 767 58 95 l 335
1 941 164 181 2 089 1 938 158 247 1 444
317 181 43 850 $12 846 $13 933 $10 235 $5 948
192 14 116 2 203 3.1 1.9 12.5 14.6
2 011 420 552 12 356 334 245 262 7 222 425 85 137 3 241 213 19 80 921 501 24 39 484 207 24 14 187 182 - - 129 127 - - 172 22 23 20 -
$2 120 $1 783 !$6 158 $1 809 226 243 6 447 320
15.9 53.B 44.0 52.2
Not reported
745 377 337 304
33 368
1 163 215 215 215
-948
304 42 57 26 -
96 64 -
19 ----
215 41 15 16 85 16 -----
42 -
304 261
17 26 -
215 109 84 22 -
492 -
105 103 103
50 39 52 40
$7 217 --
314 187 46 26 18 -
20 -
17 ... 163 ...
481
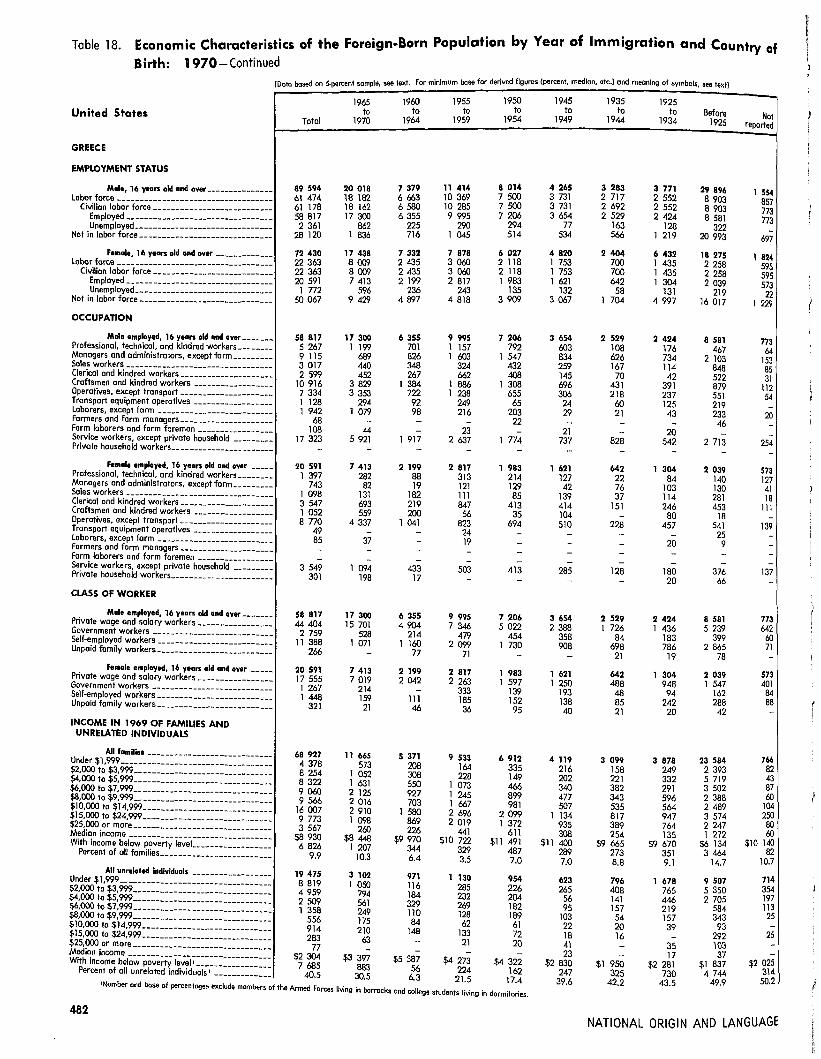
Table 18. Economic Characteristics of the Foreign-Born Population by Year of Immigration and Country of Birth: 1970-Continued
[Dato based on 5-percent sample, see text. For minimum base for derived figures (percent, median, etc.) and meaning of symbols, see text!
United States
GREECE
EMPLOYMENT STATUS
Male, 16 yean old and over--------------Lober force ----------------------------------
Civilian labor force---------------------------Employed---------------------------------unemployed ------ -----------------. ------
Not in labor force------------------------------
Female, 16 yean old and over ------------Labor force----------------------------------
Civilian lobar force-------------------------- -
~~:~;l~~;d:::::::::::::::::::::::::::::: Not in labor force-----------------------------
OCCUPATION
Male employed, 16 yean old and over-----Professional, technical, and kindred workers-------Monagers and administrators, except farm _______ _ Soles workers ---------------C----------------Clericol and kindred workers_ __________________ _
Craftsmen and kindred workers ----------------Operatives. except transport-------------------Transport equipment operatives ----------------Laborers, except farm -------------------------farmers and form managers ___________________ _
Form laborers and form foremen ---------------Service workers, except private household -------Private household workers__--------------------
Female employO<I, 16 yean old and over ___ _ Professional, technical, and kindred workers ______ _ Managers and administrators, except farm _______ _ Soles workers--------------------------------Clerical and kindred workers ___________________ _
Craftsmen and kindred workers ----------------Operatives, except transport-------------------Transport equipment operatives ----------------Laborers, except farm -------------------------Formers and form managers ___________________ _
Form laborers and form foremen ---------------Service workers, except private household --------Private household workers_ ____________________ _
CLASS OF WORKER
Male employed, 16 years old and over-----Private wage and salary workers---------------Government workers -------------------------Self-employed workers------------------------Unpaid family workers-------------------------
Female employed, 16 years old and over ___ _ Private wage and salary workers---------------Government workers --------------------------Self-employed workers ________________________ _ Unpoid family workers ________________________ _
INCOME IN 1969 OF FAMILIES AND UNRELATED INDIVIDUALS
---
-------------
-------------
-----
-----
All families---------------------------Under $1,999 ________________ ---------- ------ _ ---$2,000 to $3,999 __ ---------------- -----------$4,000 to $5, 999-----------------------------$6,000 ta $7, 999 __ ----------------------------
---------
$8,000 to $9,999 _____________________________ _
$10,000 to $14,999----------------------------
~Jj~£o~~~============================ With income below poverty level_ _______________ _ Percent of all families _______________________ _
--------
All unreloted individuals -----------------Under $1,999 ______ ------ ---------------------
~~ml~ iUE~~~~~~~~~~~~~~~~~~~~~~~~~~~~~~ $JO,OOO to $14,999 ___________________________ _ $ 5,000 to $24,999 ___________________________ _
-~~~i~~o';;,':~============================--With income below poverty level 1 --------------==
Percent of all unrelated individuals' ------------
---
Total
89 594 61 474 61 178 58 817
2 361 28 120
72 430 22 363 22 363 20 591
1 772 50 067
58 817 5 267 9 115 3 017 2 599
10 916 7 334 l 128 1 942
68 108
17 323 -
20 591 1 397
743 l 098 3 547 l 052 8 770
49 85 --
3 549 301
58 817 44 404 2 759
11 388 266
20 591 17 555 l 267 1 448
321
68 927 4 378 8 254 8 322 9 060 9 566
16 007 9 773 3 567
$8 930 6 826
9.9
19 475 8 819 4 959 2 509 l 358
556 914 283
77 $2 304
7 685 40.5
1965 to
1970
20 018 18 182 18 162 17 300
862 1 836
17 438 8 009 8 009 7 413
596 9 429
17 300 l 199
689 440 452
3 829 3 353
294 1 079
-44
5 921 -
7 413 282
82 131 693 559
4 337 -
37 --
l 094 198
17 300 15 701
528 1 071
-
7 413 7 019
214 159
21
11 665 573
1 052 1 631 2 125 2 016 2 910 1 098
260 $8 448
1 207 10.3
3 102 1 050
794 561 249 175 210 63 -
$3 397 883
30.5
1960 1955 1950 to to to
1964 1959 1954
7 379 11 414 8 014 6 663 10 369 7 500 6 580 10 285 7 500 6 355 9 995 7 206
225 290 294 716 l 045 514
7 332 7 878 6 027 2 435 3 060 2 118 2 435 3 060 2 118 2 199 2 817 l 983
236 243 135 4 897 4 818 3 909
6 355 9 995 7 206 701 l 157 792 826 l 603 l 547 348 324 432 267 662 408
I 384 l 886 I 308 722 1 238 655 92 249 65 98 216 203 - - 22 - 23 -
1 917 2 637 1 774 - - -
2 199 2 817 1 983 88 313 214 19 121 129
182 111 85 219 847 413 200 56 35
1 041 823 694 - 24 -- 19 -- - -- - -
433 503 413 17 - -
6 355 9 995 7 206 4 904 7 346 5 022
214 479 454 1 160 2 099 1 730
77 71 -2 199 2 817 1 983 2 042 2 263 l 597
- 333 139 111 185 152 46 36 95
5 371 9 533 6 912 208 164 335 308 228 149 550 1 073 466 927 1 245 899 703 1 667 981
l 580 2 696 2 099 869 2 019 1 372 226 441 611
$9 970 $10 722 $11 491 344 329 487 6.4 3.5 7.0
971 l 130 954 116 285 226 184 232 204 329 269 182 110 128 189 84 62 61
148 133 72 - 21 20 - - -
$5 387 $4 273 $4 322 56 224 162
6.3 21.5 17.4 1Nvmber and base of percentages exclude members of the Armed Forces living in barracks and college students living in dormitories.
482
1945 1935 1925 to to to Before Not 1949 1944 1934 1925 reported
4 265 3 283 3 771 29 896 1 554 3 731 2 717 2 552 8 903 857 3 731 2 692 2 552 8 903 773 3 654 2 529 2 424 8 581 773 77 163 128 322 -534 566 l 219 20 993 697
4 820 2 404 6 432 18 275 l 824 1 753 700 l 435 2 258 595 1 753 700 1 435 2 258 595 l 621 642 l 304 2 039 573
132 58 131 219 22 3 067 1 704 4 997 16 017 l 229
3 654 2 529 2 424 8 581 773 603 108 176 467 64 834 626 734 2 103 153 259 167 114 848 85 145 70 42 522 31 696 431 391 879 112 306 218 237 551 54
24 60 125 219 -29 21 43 233 20 - - - 46 -21 - 20 - -
737 828 542 2 713 254 - - - - -1 621 642 1 304 2 039 573
127 22 84 140 127 42 76 103 130 41
139 37 114 281 18 414 151 246 453 lll 104 - 80 18 -510 228 457 541 139
- - - 25 -- - 20 9 -- - - - -- - - - -
285 128 180 376 137 - - 20 66 -
3 654 2 529 2 424 8 581 773 2 388 1 726 l 436 5 239 642
358 84 183 399 60 908 698 786 2 865 71
- 21 19 78 -1 621 642 1 304 2 039 573 l 250 488 948 1 547 401
193 48 94 162 84 138 85 242 288 88 40 21 20 42 -
4 119 3 099 3 878 23 584 766 216 158 249 2 393 82 202 221 332 5 719 43 340 382 291 3 502 87 477 343 596 2 388 60 507 535 564 2 489 104
1 134 817 947 3 574 250 935 389 764 2 247 80 308 254 135 1 272 60
$11 400 $9 665 $9 670 $6 134 $10 140 289 273 351 3 464 82 7.0 8.8 9.1 14.7 10.7
623 796 1 678 9 507 714 265 408 765 5 350 354
56 141 446 2 705 197 95 157 219 584 113
103 54 157 343 25 22 20 39 93 -18 16 - 292 25 41 35 103 --23 17 37 --
$2 830 $1 950 $2 281 $1 837 $2 025 247 325 730 4 744 314
3 9.6 42.2 43.5 4 9.9 50.2
NATIONAL ORIGIN AND LANGUAGE

Tobie 18. Economic Characteristics of the Foreign-Born Population by Year of Immigration and Country of Birth: 1970-Continued
[Data based an 5-percent sample, see text. For minimum base for derived figures (percent median etc) and meaning of sy b t t t] mos, see ex
United States
ITALY
EMPLOYMENT STATUS
Male, 16 years old and over ______________ _
lobar force -------------------- --- -------- ----Civilian labor force---------------------------
~~~~~l~~;ci:::::: :: :: :: :::: :: ::::::: :: : ::: Not in labor force------------------------------
Female, 16 years old and over-------------labor force-----------------------------------
Civilian labor force---------------------------
~~~~~l~;ci::::::::::::::::::::::::::::::: Not in lobar force------------------------------
OCCUPATION
Male employed, 16 years aid and aver-------Professional, technical, and kindred workers _______ _ Managers and administrators, except form ________ _ Sales workers---------------------------------Clerical and kindred workers ____________________ _
Craftsmen and kindred workers -----------------Operatives, except transport--------------------Transport equipment operatives -----------------laborers, except farm --------------------------Formers and farm managers ____________________ _
Form laborers and farm foremen ----------------Service workers, except private household ---------Private household workers ______________________ _
Female employed, 16 years aid and aver ____ _ Professional, technical, and kindred workers--------Managers and administrators, except form ________ _ Sales workers---------------------------------Clerical and kindred workers ____________________ _ Craftsmen and kindred workers -----------------Operatives, except transport--------------------Transport equipment operatives -----------------laborers, except farm --------------------------Formers and form managers ____________________ _
Form laborers and form foremen ----------------Service workers, except private household ---------Private household workers ______________________ _
CLASS OF WORKER
Male employed, 16 years old and over------Private wage and salary workers----------------Government workers --------------------------Self·employed workers-------------------------Unpaid family workers--------------------------
Female employed, 16 years old and over ----Private wage and salary workers----------------Government workers--------------------------Self-employed workers-------------------------Unpaid family workers------------ __ ------------
INCOME IN 1969 OF FAMILIES AND UNRELATED INDIVIDUALS
U d All lamlliH ----------------------------$~.OO:i$t~99j----------------------------------$4 000 $ ,999 ______________________________ _
$6:000 :~ ~N~::::::::::::::::::::::::::::::: fimri~t·1T-------------------------------$1s.ooo to :14'= ::-:·------------------------~~:i~~o~~;~::::=====:::::::::::::::::::::: With income below poverty 1;,;;i::::::::::::::::::
Percent of off families ________________________ _
All unrelated Individuals ~~~ $t~ 99j-------------- __ :::::::::::: ::::::
~:: ;~ !f ~~t============================= fio~o $~.m ______________________________ _ $
15•000
to ., 14,999 ____________________________ _
$2s:ooo ~~ ~2:;999-----------------------------Median income•-------------------------------
With income bel~;P~~~rt;j;_;;i~::::::::::::::::: Percent of all unrelated individuals 1 -------------
Total
474 074 261 838 260 137 249 778
10 359 212 236
454 151 118 811 118 756 108 832
9 924 335 340
249 778 16 389 20 040 10 529 12 227 73 406 43 527
8 276 24 903
I 396 666
38 331 88
108 832 4 350 2 792 5 950
17 385 3 738
56 823 80
1 392 126 138
14 869 l 189
249 778 195 179
19 475 34 600
524
108 832 97 001
6 559 4 259 1 013
403 937 29 235 59 467 50 049 51 916 50 428 92 523 56 064 14 255 $8 448 42 697
10.6
115 028 62 717 27 929 10 833 5 996 3 170 3 003
995 385
$1 860 56 618
49.9
1965 to
1970
36 181 33 092 32 966 31 652
I 314 3 089
33 091 14 681 14 681 13 579
1 102 18 410
31 652 1 465
394 589 931
9 756 7 927
496 5 007
70 64
4 953 -
13 579 264
75 205 709 564
9 911 16
221 -
19 1 451
144
31 652 29 234
1 340 l 060
18
13 579 12 978
409 192 -
23 533 1 281 1 279 3 371 4 307 3 894 6 187 2 853
361 $8 785
2 405 10.2
2 741 997 350 517 343 262 248
-24
$4 115 978
37.1
1960 1955 1950 to to to
1964 1959 1954
30 115 42 944 28 831 27 402 38 610 25 582 27 110 38 077 25 304 26 008 36 547 24 455
1 102 1 530 849 2 713 4 334 3 249
27 072 41 520 25 175 11 610 18 420 11 076 11 594 18 402 11 076 10 559 17 184 10 236
l 035 l 218 840 15 462 23 100 14 099
26 008 36 547 24 455 l 114 2 380 l 530 l 040 l 760 l 418
411 I 044 681 l 190 1 862 I 129 8 919 11 782 7 794 5 525 6 554 4 525
403 845 845 3 330 4 742 2 905
21 45 82 65 55 19
3 971 5 478 3 527 19 - -
10 559 17 184 10 236 172 603 586 65 116 223
287 713 427 1 3BB 3 728 1 982
306 514 286 6 857 8 799 5 098
- - 19 143 307 223
- - 16 - 12 -
l 225 2 353 l 309 116 39 67
26 008 36 547 24 455 22 508 30 014 20 234
l 281 2 282 l 533 2 189 4 186 2 688
30 65 -
10 559 17 184 10 236 9 854 15 920 9 196
269 842 503 328 294 438 108 128 99
23 844 33 663 23 845 519 873 752 792 1 146 848
2 346 2 515 1 776 4 113 4 750 3 305 4 425 6 702 4 354 7 447 11 334 7 842 3 654 5 394 4 162
548 949 806 $9 877 $10 373 $10 566
1 114 I 477 I 261 4.7 4.4 5.3
2 447 3 005 3 109 909 742 1 075 355 694 642 427 580 568 352 423 376 212 255 220 127 217 146 65 94 41 - - 41
$3 726 $4 200 $3 589 652 480 823
31.2 19.3 29.2
1Number and base of percentages exclude members of the Armed Forces living in barrack$ end college students living in dormitories.
NATIONAL ORIGIN AND LANGUAGE
1945 1935 1925 to to to Before
1949 1944 1934 1925
16 961 14 361 35 319 261 273 15 146 11 462 24 405 82 220 15 007 l1 440 24 380 82 181 14 475 11 277 23 688 78 174
532 163 692 4 007 1 815 2 899 JO 914 179 053
22 093 16 356 44 239 233 739 8 417 5 137 13 239 33 628 8 396 5 137 13 239 33 628 7 689 4 784 12 042 30 337
707 353 l 197 3 291 13 676 11 219 31 000 200 I 11
14 475 11 277 23 688 78 174 l 115 969 l 871 5 644 l 551 l 498 3 244 8 635
394 552 I 479 5 235 694 528 1 092 4 583
4 366 3 326 7 115 19 532 2 436 1 415 3 515 JO 965
648 407 846 3 724 1 556 990 1 239 4 960
38 38 90 1 012 32 18 17 396
1 645 1 536 3 180 13 419 - - - 69
7 689 4 784 12 042 30 337 629 248 491 l 180 423 154 397 1 249 388 251 878 2 687
l 119 864 2 298 4 885 331 148 440 I 083
3 519 2 062 5 810 13 684 - - - 45
97 19 21 319 21 - 20 69 - 34 53 20
1 060 922 l 553 4 608 102 82 Bl 508
14 475 11 277 23 688 78 174 11 599 8 306 16 470 54 281
958 870 2 785 B 173 l 901 2 083 4 433 15 344
17 18 - 376
7 689 4 784 12 042 30 337 6 394 4 048 10 512 25 965
736 376 912 2 291 465 315 500 l 660
94 45 118 421
16 046 13 814 35 109 229 260 557 499 l 728 22 606 582 978 2 935 50 144
l 454 1 213 2 705 34 345 2 266 l 685 3 972 26 696 2 350 l 675 4 065 22 355 5 068 3 984 JO 182 39 303 2 983 2 831 7 572 26 069
786 949 l 950 7 742 $10 803 $11 076 $11 056 $6 556
950 951 2 288 31 651 5.9 6.9 6.5 13.8
2 654 2 969 9 257 85 895 1 028 l 508 4 836 50 010
411 547 2 272 22 057 485 238 1 111 6 684 338 287 502 3 214 171 121 259 1 533 201 228 206 1 441
- 22 21 724 20 18 50 232
$3 364 $1 976 $1 925 $1 769 924 l 462 4 287 45 755
36.0 49.2 46.3 53.3
Not reported
8 089 3 919 3 672 3 502
170 4 170
10 866 2 603 2 603 2 422
!Bl 8 263
3 502 301 500 144 218 816 665
62 174
--
622 -
2 422 177 90
114 412
66 l 083
-42 --
388 50
3 502 2 533
253 716
-2 422 2 134
221 67 -
4 823 420 763 324 822 608
l 176 546 164
$8 271 600 12.4
2 951 l 612
601 223 161 137 189 28 -
$1 857 l 257
46.4
483
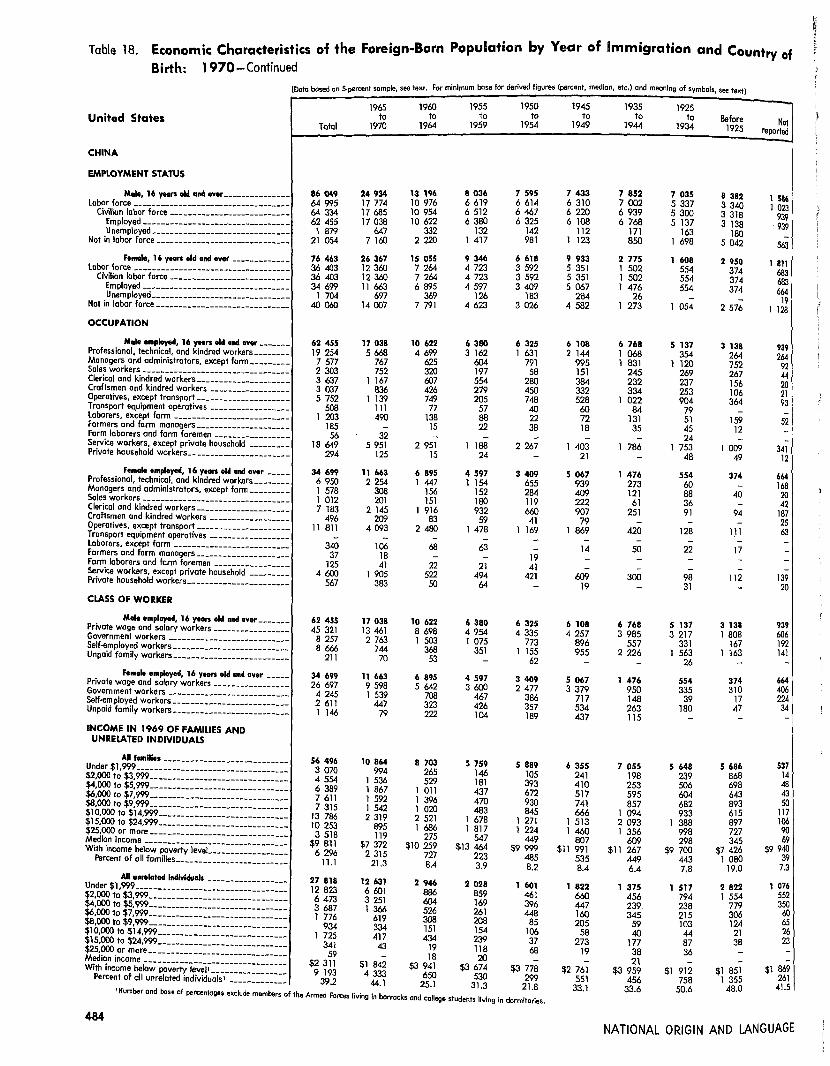
Table 18. Economic Characteristics of the Foreign-Born Population by Year of Immigration and Country of Birth: 1970-Continued
[Dalo based an 5-percent sample, see 1ext. For minimum base for derived figures (percent. median, e1c.) and meaning of symbols, see text]
United States
CHINA
EMPLOYMENT STATUS
Malo, 16 years oltl and over--------------Labor force----------------------------------
Civilian labor force--------------------------Em ployed ---_ ----------------------------Unemployed_------ ___ --------------------
Not in labor force-----------------------------
Ft111ale, 16 yean old and aver ------------labor force ----------------------------------
Civilian labor force--------------------------Employed--------------------------------U nem ployed _______ -----_-----------------
Not in labor force-----------------------------
OCCUPATION
Male ••ployed, 16 yean old and aver------Professional, technical, end kindred workers_ _____ _ Managers end administrators, except form _______ _ Sales workers--------------------------------Clerical and kindred workers_ __________________ _
Craftsmen and kindred workers ----------------Operatives, except transport-------------------Transport equipment operatives ----------------laborers, except form ------------------------formers end farm managers-------------------Form laborers and farm foremen ---------------Service workers. except private household -------Private household workers----------------------
Fe,.ale employed, 16 yean aid and over ----Professional, technical, and kindred workers ______ _ Managers and administrators, except form _______ _ Soles workers--------------------------------Clerical and kindred workers ___________________ _
Craftsmen and kindred workers----------------Operatives, except transport-------------------Transport equipment operatives ----------------Laborers, except form -------------------------Farmers and farm managers ___________________ _
Farm laborers and farm foremen ---------------Service workers, except private household --------Private household workers _____________________ _
CLASS OF WORKER
Male employed, 16 yean old and aver _____ _
------------
-------------
-------------
-Private wage and salary workers---------------Government workers --------------------------
---Self-employed workers ____________ ------------.
Unpaid family workers-------------------------
Female employed, 16 yoan aid an.t over ---Private wage and solory workers ---------------Government workers -------------------------Self-employed workers------------------------Unpaid family workers-------------------------
INCOME IN 1969 OF FAMILIES AND UNRELATED INDIVIDUALS
All famllles --------------------------Under $1,999 -------------------- ------------. $2,000 to $3,999 __ ---·-----------------------$4,000 to $5, 999-----------------------------$6,000 to $7, 999-----------------------------$8.000 to $9,999------------------------------
------
-------$10,000 to $14,999---------------------------
$15,000 to $24,999----------------------------$25,000 or more _____________________________ _ -----
Median income-------------------------------With income below poverty level__ ______________ _
Percent of oil fomilies------------------------
--------
All unrelated lndivld11als -----------------Under $1, 999---------------------------------$2,000 ta $3,999------------------------------
t'.5 !~ iHE:::::::::::::::::::::::::::::: $10,000 to $14,999 ___________________________ _
$15,000 to $24,999----------------------------
~:.i~i~~o~~~:::::::::::::::::::::::::::::· -With income below poverty level'---------------=
Percent of oil unrelated individuals• ------------
---
1965 to
Total 1970
86 049 24 934 64 995 17 774 64 334 17 685 62 455 17 038
1 879 647 21 054 7 160
76 463 26 367 36 4()3 12 360 36 4()3 12 360 34 699 11 663
1 704 697 40 060 14 007
62 455 17 038 19 254 5 668
7 577 767 2 303 752 3 637 l 167 3 037 836 5 752 l 139
508 1ll l 203 490
185 -56 32
18 649 5 951 294 125
34 699 11 663 6 950 2 254 l 578 308 l 012 201 7 183 2 145
496 209 11 811 4 093
- -340 106
37 18 125 41
4 600 l 905 567 383
62 455 17 038 45 321 13 461
8 257 2 763 8 666 744
211 70
34 699 11 663 26 697 9 598
4 245 l 539 2 611 447 l 146 79
56 496 10 864 3 070 994 4 554 l 536 6 389 1 867 7 611 l 592 7 315 l 542
13 786 2 319 10 253 895 3 518 119
$9 811 $7 372 6 '296 2 315
11.1 21.3
27 818 12 631 12 823 6 601 6 473 3 251 3 687 l 366 l 776 619
934 334 l 725 417
341 43 59 -
$2 311 $1 842 9 193 4 333
39.2 44.1
1960 1955 1950 to to to
1964 1959 1954
\3 \96 8 036 7 595 10 976 6 619 6 614 10 954 6 512 6 467 10 622 6 380 6 325
332 132 142 2 220 l 417 981
\5 055 9 346 6 618 7 264 4 723 3 592 7 264 4 723 3 592 6 895 4 597 3 409
369 126 183 7 791 4 623 3 026
10 622 6 380 6 325 4 699 3 162 l 631
625 604 791 320 197 58 (;fJ7 554 280 426 279 450 749 205 748
77 57 40 138 88 22 15 22 38 - - -
2 951 l 188 2 267 15 24 -
6 895 4 597 3 409 1 447 1 154 655
156 152 284 151 180 119
1 916 932 660 83 59 41
2 480 l 478 l 169 - - -
68 63 -- - 19 22 21 41
522 494 421 50 64 -
10 622 6 380 6 325 8 698 4 954 4 335 l 503 1 075 773
368 351 l 155 53 - 62
6 895 4 597 3 409 5 642 3 600 2 477
708 467 386 323 426 357 222 104 189
8 703 5 759 5 889 265 146 105 529 181 393
1 011 437 672 l 396 470 930 1 020 483 845 2 521 l 678 1 271 l 686 l 817 1 224
275 547 449 $10 259 $13 464 $9 999
727 223 485 8.4 3.9 8.2
2 946 2 028 1 601 886 859 461 604 169 396 526 261 448 308 208 85 151 154 106 434 239 37
19 118 68 18 20 -$3 941 $3 674 $3 778
650 530 299 25.l 31.3 21.8
'Humber and base of percentoges exclude members of the Armed Fon:es living in barracks and college students living in dormitories.
484
1945 1935 1925 to to to Before Not 1949 1944 1934 1925 reported
7 433 7 852 7 035 8 382 \ 586 6 310 7 002 5 337 3 340 l 023 6 220 6 939 5 300 3 318 939 6 108 6 768 5 137 3 138 939 112 171 163 180 -l 123 850 l 698 5 042 563 9 933 2 775 1 608 2 950 1 811 5 351 1 502 554 374 683 5 351 1 502 554 374 683 5 067 l 476 554 374 664 284 26 - - 19 4 582 l 273 1 054 2 576 1 128
6 108 6 768 5 137 3 138 939 2 144 l 068 354 264 264
995 1 831 l 120 752 92 151 245 269 267 44 384 232 237 156 20 332 334 253 106 21 528 l 022 904 364 93 60 84 79 - -72 131 51 159 52 18 35 45 12 -- - 24 - -l 403 l 786 l 753 l 009 341 21 - 48 49 12
5 067 1 476 554 374 664 939 273 60 - 168 409 121 88 40 20 222 61 36 - 42 907 251 91 94 187
79 - - - 25 l 869 420 128 11 l 63
- - - - -14 50 22 17 -- - - - -- - - - -
609 300 98 112 139 19 - 31 - 20
6 108 6 768 5 137 3 138 939 4 257 3 985 3 217 l 808 606
896 557 331 167 192 955 2 226 l 563 1 163 141
- - 26 - -5 067 1 476 554 374 664 3 379 950 335 310 406
717 148 39 17 224 534 263 180 47 34 437 115 - - -
6 355 7 055 5 648 5 686 537 241 198 239 868 14 410 253 506 698 48 517 595 604 643 43 741 857 682 893 50 666 1 094 933 615 117
l 513 2 093 1 388 897 106 1 460 l 356 998 727 90
807 609 298 345 69 $11 991 $11 267 $9 700 $7 426 $9 940
535 449 443 l 080 39 8.4 6.4 7.8 19.0 7.3
1 822 1 375 1 517 2 822 1 076 660 456 794 l 554 552 447 239 238 779 350 160 345 215 306 llJ 205 59 103 124 65
58 40 44 21 26 273 177 87 38 23
19 38 36 - -- 21 - - -
$2 761 $3 959 $1 912 $1 851 $1 869 551 456 758 1 355 261
3 48.0 41.5 3.1 33.6 50.6
NATIONAL ORIGIN AND LANGUAGE
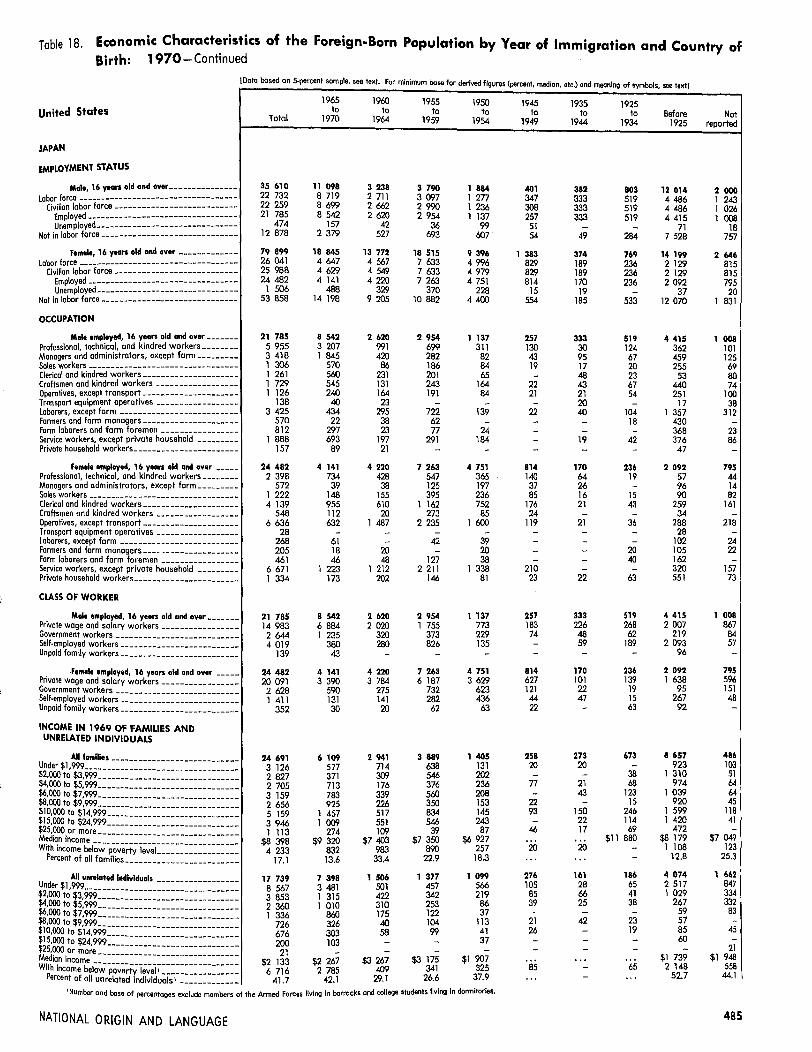
Table 18. Economic Characteristics of the Foreign-Born Population by Year of Immigration and Country of Birth: 1970-Continued
[Doto based on 5-percent sample, see le•t. For minimum base for derived figures (percent median etc) and meaning of symbols see te•tl
United States
JAPAN
EMPLOYMENT STATUS
Male, 16 years old and over--------------Labor force----------------------------------
Civilian labor farce ---------------------------
~~~~~l~~;ci::::::::::::::::::::::::::::::: Not in labor force------------------------------
Female, 16 years aid and over------------Labor farce ----------------------------------
Civilian labor force---------------------------Employed ------------------ ---------------Unemployed-- -------- - - -- __ - _ - --- ________ _
Not in lobar force------------------------------
OCCUPATION
Mole employed, 16 years old and over-------Professional, technical, and kindred workers _______ _ Monogers and administrators, except farm--------Soles workers--------------------------------Clerical and kindred workers--------------------Craftsmen and kindred workers -----------------Operatives, except transport--------------------Transport equipment operatives -----------------Laborers, except farm -------------------------Formers and farm monagerS--------------------Form laborers ond farm foremen ----------------Service workers, except private household __ -------Private household workers ______________________ _
Female employed, 16 years old and over -----Professional, technical, and kindred workers _______ _ Managers and administrators, except form ________ _ Soles workers---------------------------------Clerical and kindred workers ____________________ _
Craftsmen and kindred workers -----------------Operatives, except transport--------------------Transport equipment operatives -----------------Laborers, except farm -------------------------Formers and form managers--------------------Farm laborers and form foremen ----------------Service workers, except private household --------Private household workers-----------------------
CLASS OF WORKER
Male employed, 16 years aid and aver------Private wage and salary workers----------------Government workers --------------------------Self-employed workers-------------------------Unpaid family workers·-------------------------
Female employed, 16 years old and over ----Private wage and salary workers----------------Government workers --------------------------Self-employed workers-------------------------Unpaid family workers--------------------------
INCOME IN 1969 OF FAMILIES AND UNRELATED INDIVIDUALS
~m·~~i~)~~~~~~~~=~~~~~~~~i~~~:~==~=~ $rn.ooo to $14,999 ____________________________ _ $
25.ooo to $24,999 ____________________________ _
Med:i i~~o~~r::- ---- - - -------- - - -- - -- - - - ---- -w· h · ------------------------------'~ mcome below poverty level_ ________________ _ ercent of all families ________________________ _
All unrelated lndlvlduols ------------------~~~ $1, 999 ____ ------------ ------------ -- -- - -$4'ooo to $3,999 ______________________________ _
~:: :~ ~N~::::::::::::::::::::::::::::::: $1o,ooo'~o$ii9rm-----------------------------$15 000 -----------------------------$25'000 to $24,999 ____________________________ _
Median i~~o'::i':0 ------------ ------------------ -
With income bel~~P~~;rt;1;.;e1~::::::::::::::::: Percent of all unrelated individuals• ------------
Total
35 610 22 732 22 259 21 785
474 12 878
79 899 26 041 25 988 24 482
1 506 53 858
21 785 5 955 3 418 1 306 1 261 1 729 1 126
138 3 425
570 812
l 888 157
24 482 2 398
572 1 222 4 139
548 6 636
28 268 205 461
6 671 1 334
21 785 14 983 2 644 4 019
139
24 482 20 091
2 628 1 411
352
24 691 3 126 2 827 2 705 3 159 2 656 5 159 3 946 1 113
$8 398 4 233
17.1
17 739 8 567 3 853 2 360 1 336
726 676 200
21 $2 133
6 716 41.7
1965 to
1970
11 098 8 719 8 699 8 542
157 2 379
18 845 4 647 4 629 4 141
488 14 198
8 542 3 207 1 845
570 560 545 240
40 434
22 297 693
89
4 141 734 39
148 955 112 632
-61 18 46
1 223 173
8 542 6 884 1 235
380 43
4 141 3 390
590 131 30
6 109 577 371 713 783 925
l 457 l r:m
274 $9 320
832 13.6
7 398 3 481 1 315 1 010
860 326 303 103 -
$2 267 2 785
42.l
1960 1955 1950 to to to
1964 1959 1954
3 238 3 790 1 884 2 711 3 097 1 277 2 662 2 990 1 236 2 620 2 954 1 137
42 36 99 527 693 607
13 772 18 515 9 396 4 567 7 633 4 996 4 549 7 633 4 979 4 220 7 263 4 751
329 370 228 9 205 10 882 4 400
2 620 2 954 1 137 991 699 311 420 282 82
86 186 B4 231 201 65 131 243 164 164 191 B4 23 - -
295 722 139 38 62 -23 77 24
197 291 184 21 - -
4 220 7 263 4 751 428 547 365 38 125 197
155 395 236 610 1 162 752 20 273 85
1 487 2 235 1 600 - - -- 42 39
20 - 20 48 127 38
1 212 2 211 1 338 202 146 81
2 620 2 954 l 137 2 020 1 755 773
320 373 229 280 826 135 - - -
4 220 7 263 4 751 3 784 6 187 3 6'E
275 732 623 141 282 436 20 62 63
2 941 3 889 1 405 714 638 131 'm 546 202 176 376 236 339 560 208 226 350 153 517 834 145 551 546 243 109 39 87
$7 403 $7 350 $6 927 983 890 257 33.4 22.9 18.3
1 506 1 377 1 099 501 457 566 422 342 219 310 253 86 175 122 37 40 104 113 58 99 41 - - 37 - - -
$3 267 $3 175 $1 907 409 341 325
29.1 26.6 37.9
'Number and base of percentages exclude members of the Armed Forces living In barracks and college students living in dormitories.
NATIONAL ORIGIN AND LANGUAGE
1945 1935 1925 to to to Before
1949 1944 1934 1925
401 382 803 12 014 347 333 519 4 486 308 333 519 4 486 257 333 519 4 415
51 - - 71 54 49 284 7 528
1 383 374 769 14 199 829 189 236 2 129 829 189 236 2 129 814 170 236 2 092
15 19 - 37 554 185 533 12 070
257 333 519 4 415 130 30 124 362 43 95 67 459 19 17 20 255 - 48 23 53
22 43 67 440 21 21 54 251 - 20 - 17
22 40 104 1 357 - - 18 430 - - - 368 - 19 42 376 - - - 47
814 170 236 2 092 140 64 19 57 37 26 - 96 85 16 15 90
176 21 43 259 24 - - 34
119 21 36 288 - - - 28 - - - 102 - - 20 105 - - 40 162
210 - - 320 23 22 63 551
257 333 519 4 415 183 226 268 2 007 74 48 62 219 - 59 189 2 093 - - - 96
814 170 236 2 092 627 101 139 1 638 121 22 19 95 44 47 15 267 22 - 63 92
258 273 673 8 657 20 20 - 923 - - 38 1 310
77 21 68 974 - 43 123 1 039
22 - 15 920 93 150 246 l 599 - 22 114 1 420
46 17 69 472 ... ... $11 880 $8 179 20 20 - 1 108 ... ... - 12.8
276 161 186 4 074 105 28 65 2 517 85 66 41 1 029 39 25 38 267 - - - 59
21 42 23 57 26 - 19 85 - - - 60 - - - -... ... ... $1 739
85 - 65 2 148
". - ... 52.7
Not reported
2 000 1 243 1 026 1 008
18 757
2 64'1 815 815 795 20
1 831
1 008 101 125 69 80 74
100 38
312 -
23 86 -
795 44 14 82
161 -
218 -
24 22 -
157 73
1 008 867
84 57 -
795 596 151 48 -
486 103
51 64 64 45
118 41 -
$7 049 123
25.3
1 662 847 334 332
83 -
45 -
21 $1 948
558 44.1
485

Table 18. Economic Characteristics of the Foreign-Born Population by Year of Immigration and Country of Birth: 1970-Continued
[Doto based on 5-percent somple, see text. For minimum base for derived figures (percent, median, etc.) and meaning of symbols, see text]
United States
CANADA
EMPLOYMENT STATUS
Mala, 16 years old and over ______________ _
Lobar force-----------------------------------Civilian lobar force---------------------------
Em ployed __ ---------------·- - -------------Unemployed ___ ----_____ ------------ __ ----_
Not in labor force------------------------------
--
Female, 16 yun old Giid o~er ------------Labor force----------------------------------
Civilian labor force---------------------------Employed--------------------------------Unemployed ______ ------------------------
Not in labor force-----------------------------
OCCUPATION
Mola employed, 16 years old and over------Professional, technicol, and kindred workers ______ _ Managers and administrators, except farm-------Sales workers --------------------------------Clerical and kindred workers. __________________ _
Craftsmen and kindred workers----------------Operatives, except transport-------------------T ronsport equipment operatives ----------------Laborers, except farm -------------------------Formers and farm managers ___________________ _
Farm laborers and farm foremen ---------------Service workers, except private household --------Private household workers _____________________ _
Female employed, 16 years old alMI over ----Professional, technical, and kindred workers ______ _ Manogers and administrators, except form _______ _ Soles workers--------------------------------Clerico! and kindred workers ___________________ _
Craftsmen and kindred workers ----------------Operatives, except transport-------------------Transport equipment operatives ----------------Laborers, except form ------------------------Formers and farm managers-------------------Form laborers and form foremen ---------------Service workers, except privote household --------Private household workers _____________________ _
CLASS OF WORKER
Male employed, 16 years old a!MI over-----Private wage and salary workers---------------Government workers -------------------------Self-employed workers------------------------Unpaid family workers·------------------------
---
--------------------------
-----
-Female employed, 16 years old and over ---Private wage and salary workers---------------Government workers -------------------------Self-employed workers-------------------------
----Unpaid fomily workers_ _______________________ _
INCOME IN 1969 OF FAMILIES AND UNRELATED INDIVIDUALS
All families--------------------------Under $1,999 __ ---------------------- --------$2,000 to $3,999-----------------------------$4,000 to $5,999------------------------------$6,000 to $7,999 _____________________________ _
$8,000 lo $9,999------------------------------$10,000 to $14,999 __________ ------------------
---------
$15,000 to $24,999--------------------------$25,000 or more __ ---------------------------= Median income--------------------------------With income below poverty level_ _______________ _ --Percent of all families------------------------
All unnolated Individuals ----------------
¥2.~ ~~W.m::::::::::::::::::::::::::::: $4,000 to $5,999----------------------------$6,000 to $7,999----------------------------$8,000 to $9,999-----------------------------
------------$10,000 to $14,999 __________________________ _
$15,000 to $24,999----------------------------
~~~i~~o~~r~:::::::::::::::::::::::::::::: ---
With income below poverty level•---------------Percent of all unrelated individuals• ------------
----
Total
347 117 254 3<IO 250 272 241 811
8 461 92 777
435 02.'I 184 198 184 014 175 872
8 142 300 831
241 811 41 770 35 933 20 440 15 631 57 460 28 733 9 811 9 835 2 993 1 673
17 314 218
175 872 30 115
9 014 15 372 60 262
3 086 22 069
557 l 196
258 408
27 995 5 540
241 811 191 403 22 462 27 404
542
175 872 142 457 22 620 9 014 I 781
302 438 12 826 26 178 29 413 33 178 36 888 80 830 62 609 20 516
$10 788 20 145
6.7
133 142 49 028 30 393 19 110 14 130 8 156 8 486 2 777 l 062
$2 960 39 682
31.5
1965 1960 1955 1950 ta ta to to
1970 1964 1959 1954
33 197 31 268 30 672 30 758 26 919 28 189 27 157 26 874 26 201 27 682 26 443 25 995 25 142 26 896 25 441 25 012
l 059 786 1 002 983 6 278 3 079 3 515 3 884
39 114 41 046 43 34'1 46 106 15 876 18 337 19 231 22 604 15 876 18 276 19 209 22 583 15 086 17 384 18 346 21 718
790 892 863 865 23 238 22 7r:YY 24 118 23 502
25 142 26 896 25 441 25 012 7 320 4 752 4 897 4 187 3 184 3 724 3 274 3 699 1 762 2 006 2 382 2 166 1 315 1 543 l 566 1 544 5 597 6 858 6 311 6 211 2 733 3 513 3 028 3 261
566 1 111 l 075 933 1 004 1 466 l 106 1 280
84 92 168 100 188 241 129 204
1 352 1 530 l 485 1 409 37 60 20 18
15 086 17 384 18 346 21 718 4'299 2 949 3 183 3 458
456 590 872 1 377 596 847 1 623 1 825
5 185 7 101 7 032 8 970 233 264 495 265
1 535 2 155 1 782 1 910 25 65 65 77 87 126 108 150 16 - 19 -69 19 41 64
2 096 2 784 2 666 3 276 489 484 460 346
25 142 26 896 25 441 25 012 21 462 23 562 21 508 21 133
2 397 1 405 l 404 l 794 1 266 1 897 2 460 2 041
17 32 69 44
15 086 17 384 18 346 21 718 13 026 15 305 15 490 18 262
1 577 1 341 1 856 2 346 395 658 781 884
88 BO 219 226
23 181 24 404 24 794 24 367 964 803 789 656
l 214 870 958 863 l 955 1 588 1 588 l 463 2 767 2 391 2 648 2 364 2 703 3 771 3 411 3 294 7 760 8 322 7 623 7 616 4 641 5 152 6 234 6 135 1 177 1 507 l 543 l 976
$11 281 $11 670 $11 970 $12 326 l 651 1 386 l 374 1 127
7.1 5.7 5.5 4.6
12 343 7 945 7 565 8 613 4 593 1 941 1 878 2 139 2 034 l 145 1 265 1 380 l 498 1 593 1 243 1 407 1 866 l 341 1 104 1 449 1 101 803 790 992
970 948 850 866 195 101 391 279 86 73 44 101 $3 556 $5 164 $5 190 $5 232
2 652 1 431 1 428 1 219 27.5 19.7 4 20. 16.5 1
Number ond base of percentages exclude members of the Armed Forces living In barracks and college students living in dormitories.
486
1945 1935 1925 to to to Before Not 1949 1944 1934 1925 reported
23 120 16 466 49 735 116 489 15 412 21 143 14 266 37 051 62 977 9 764 20 847 14 163 36 919 62 917 9 105 20 397 13 699 35 641 60 767 8 816 450 464 1 278 2 150 289 1 977 2 200 12 684 53 512 5 648
37 041 31 909 66 143 157 627 22 694 18 836 15 070 25 614 40 633 7 997 18 836 15 033 25 571 40 633 7 997 17 868 14 627 24 598 38 687 7 558
968 406 973 1 946 439 18 205 16 839 40 529 116 994 14 697
20 397 13 699 35 641 60 767 8 816 4 141 2 727 5 171 7 355 1 220 3 031 2 234 6 046 9 404 1 337 2 025 1 127 3 244 5 197 531 l 267 913 2 614 4 202 667 4 345 2 938 8 401 14 645 2 154 2 461 l 338 4 003 7 423 973
815 552 1 621 2 745 393 625 589 1 168 2 054 543 447 240 417 1 358 87 182 60 110 453 106
1 058 981 2 846 5 866 787 - - - 65 18
17 868 14 627 24 598 38 687 7 558 3 765 2 977 3 984 4 272 1 228
896 942 882 2 468 531 1 904 1 612 2 243 3 931 791 6 151 4 185 7 690 11 683 2 265
214 113 534 867 101 1 551 1 570 3 938 6 772 856
20 36 56 213 -140 61 207 260 57 45 36 99 43 -BO 20 19 56 40
2 862 2 597 3 999 6 292 1 423 240 478 947 1 830 266
20 397 13 699 35 641 60 767 8 816 16 007 9 871 26 994 44 436 6 430
1 855 1 827 3 601 6 906 1 273 2 366 1 941 5 009 9 328 1 096
169 60 37 97 17
17 868 14 627 24 598 38 687 7 558 13 598 10 973 19 278 30 800 5 725 3 071 2 421 3 646 4 966 1 396
963 980 1 458 2 534 361 236 253 216 387 76
22 379 16 433 48 963 107 284 10 633 743 521 1 533 6 087 730
1 065 980 3 598 15 396 1 234 1 459 l 402 4 443 14 358 1 157 2 259 1 671 5 469 12 187 1 422 3 149 1 885 5 467 11 680 1 528 6 287 4 360 13 123 23 220 2 519 5 300 3 948 11 501 18 171 1 527 2 117 1 666 3 829 6 185 516
$12 000 $12 015 $11 513 $8 961 $9 012 1 382 1 057 2 324 8 554 1 290
6.2 6.4 4.7 8.0 12.1
6 015 6 698 16 960 58 317 8 686 1 215 2 071 4 594 26 517 4 080 1 106 1 266 4 433 15 876 1 888 1 049 1 127 3 175 6 760 1 258
997 954 l 920 3 940 559 605 597 1 063 1 922 283 657 411 1 264 2 065 455 246 168 416 839 142 140 104 95 398 21
$5 304 $4 024 $3 706 $2 255 $2 261 987 l 837 4 024 23 258 2 846
40.7 16.8 27.5 23.8 39.9
NATIONAL ORIGIN AND LANGUAGE

Table 18. Economic Characteristics of the Foreign-Born Population by Year of Immigration and Country of Birth: 1 970 - Continued
(Doto based on 5-percent sample, see text. For minimum base for derived figures (percent median etc ) and meaning of symbols see text]
United States
MEXICO
EMPLOYMENT STATUS
Male, 16 years old and aver ______________ _
Labor force-----------------------------------Civilian labor force---------------------------
~~~J1~~;ci::::::::::::::::::::::::::::::: Not in labor force------------------------------
female, 16 years aid and aver -------------Labor force-----------------------------------
Civilian lobar force---------------------------
~~~~J1~;J::::::::::::::::::::::::::::::: Not in labor force------------------------------
OCCUPATION
Male employed, 16 years aid and aver-------Professional, technical, and kindred workers_ ______ _ Managers and administrators, except farm ________ _ Soles workers--------------------------------Clerical and kindred warkers--------------------Croftsmen and kindred workers -----------------Operatives, except transport--------------------Transport equipment operatives -----------------Laborers, except farm -------------------------Formers and farm managers--------------------Form laborers and form foremen ----------------Service workers, except private household ---------Private ~ousehold workers ______________________ _
Female employed, 16 years old and over -----Professional, technical, and kindred workers_ ______ _ Managers and administrators, except farm--------Soles workers--------------------------------Clerical and kindred workers--------------------Craftsmen and kindred workers-----------------Operatives, except transport--------------------Transport equipment operatives -----------------Laborers, except form--------------------------Formers and farm managers_ ___________________ _
Form laborers and farm foremen ----------------Service workers, except private household ---------Private household workers ______________________ _
CIASS OF WORKER
Male employed, 16 years aid and over------Private wage and salary workers----------------Government workers--------------------------Self-employed workers--------------------------Unpaid family workers_ ________________________ _
Female employed, 16 years old and over ____ _ Private wage and salary workers----------------Government workers--------------------------Self-employed workers--------------------------Unpaid family workers _________________________ _
INCOME IN 1969 OF FAMILIES AND UNRELATED INDIVIDUALS
U d All fomllles ----------------------------n er $1,999 __________ _ $2,000 to $3,999 ________ ::::::::::::::::::::::: t:: :~ $~·:-------------------------------fio~~}~;~~====:::::::::::::::::::::::::
~1~i;~o~~~~============================= Wi~r~:~~~~ ~ttl~:~~::~~~~~==================
All unrelated indlvlduols ------------------~~:i $1,999 ____ ---- ------ -- ---- ---- ----------$4:000 :~ :~·~-------------------------------t:: :~ $~::::::::::::::::::::::::::::::::: $10,000 to$$l4 9-------------------------------
m:: ~~ ~.;;~~============================= Median income ------------------------------
With income bel~;P~~~rtYle.;el;::::::::::::::::: Percent of all unrelated individuals 1 -------------
Total
328 539 252 084 249 198 235 955
13 243 76 455
347 706 106 779 106 713 97 400 9 313
240 927
235 955 7 513 7 136 5 407 7 548
44 250 53 807 10 936 35 454
1 492 35 401 26 713
298
97 400 3 813 l 490 4 343
13 064 2 495
37 869 268
l 897 56
7 014 16 730 8 361
235 955 210 358
12 524 12 653
420
97 400 87 724
6 319 2 539
818
262 528 27 081 45 142 49 867 44 564 34 726 42 056 16 046 3 046
$6 395 68 546
26.l
79 944 38 951 21 171 11 191 5 000 l 848 1 415
191 177
$2 085 34 918
45.0
1965 to
1970
61 454 52 931 52 716 49 402
3 314 8 523
66 645 22 382 22 382 20 610
1 772 44 263
49 402 l 040
510 482
1 262 6 834
15 217 1 315 7 747
98 8 144 6 637
116
20 610 424 144 695
1 377 365
9 343 18
481 -
2 355 2 709 2 699
49 402 47 173
1 399 759
71
20 610 19 697
534 129 250
32 044 4 282 6 670 7 492 5 811 3 511 3 153 1 064
61 $5 354 10 344
32.3
21 922 10 748 5 889 3 533 1 115
309 201 58 69
$2 076 10 126
47. l
1960 1955 1950 to to to
1964 1959 1954
51 844 51 635 33 718 45 112 44 888 29 419 44 485 44 276 28 931 42 038 42 065 27 264
2 447 2 211 1 667 6 732 6 747 4 299
57 666 53 641 35 234 19 926 19 495 12 784 19 898 19 476 12 765 17 924 17 414 11 898 1 974 2 062 867
37 740 34 146 22 450
42 038 42 065 27 264 934 1 105 1 198 727 898 1 178 778 769 621
l 147 l 383 873 6 766 8 845 5 668
10 637 10 619 5 856 1 886 2 108 1 354 5 967 5 804 4 054
86 258 160 8 323 5 279 4 120 4 762 4 936 2 138
25 61 44
17 924 17 414 11 898 242 662 718 152 155 128 498 640 691
2 015 2 900 2 095 437 347 404
8 214 7 550 4 237 44 35 92
461 285 164 36 - -
1 559 l 004 654 3 173 2 724 1 882 1 093 1 052 833
42 038 42 065 27 264 39 803 38 498· 24 123
l 049 1 796 1 077 l 073 1 723 1 989
113 48 75
17 924 17 414 11 898 16 770 16 188 10 523
693 896 919 380 285 387
81 45 69
38 769 43 157 29 693 2 529 3 169 2 569 5 851 5 709 4 317 8 940 8 165 5 177 8 120 0 122 5 582 5 610 6 770 4 529 6 176 8 463 5 494 1 146 2 558 l 485
397 201 540 $6 499 $7 118 $6 992
9 540 10 721 7 976 24.6 24.8 26.9
9 629 7 873 4 573 3 421 2 590 1 875 2 705 2 356 l 250 2 087 l 473 829 1 060 771 320
247 322 119 58 292 155 27 40 25 24 29 -
$3 122 $3 175 $2 478 2 918 2 216 l 514
31.8 29.8 35.7
1Nvmber and base of percentages exclude members of the Armed Forces living In barracks and college students living In dormitories.
NATIONAL ORIGIN AND LANGUAGE
1945 1935 1925 to to to Before
1949 1944 1934 1925
18 606 10 603 18 989 69 427 16 224 8 517 12 886 33 706 15 956 8 460 12 827 33 665 15 242 8 007 12 338 32 130
714 453 489 l 535 2 382 2 086 6 103 35 721
19 435 11 612 17 500 72 351 7 265 3 777 4 588 11 531 7 265 3 777 4 588 11 531 6 732 3 496 4 197 10 598
533 281 391 933 12 170 7 835 12 912 00 820
15 242 8 007 12 338 32 130 613 505 478 1 281 588 303 791 1 891 644 238 439 l 156 896 380 528 857
3 555 l 799 2 602 6 627 2 383 l 452 1 807 4 418
754 509 891 l 823 2 298 954 l 706 5 674
163 83 117 453 2 169 1 176 1 398 3 600 l 179 608 l 581 4 298
- - - 52
6 732 3 496 4 197 10 598 321 259 268 648 88 76 277 337
389 187 228 846 1 444 673 643 1 243
277 90 135 306 1 817 l 159 1 227 3 001
- - - 59 109 21 63 214 - - - 20
431 144 102 391 l 453 719 l 006 2 194
403 168 248 1 339
15 242 8 007 12 338 32 130 13 154 6 577 9 579 25 063 1 107 935 l 344 3 142
901 473 l 391 3 858 - 22 24 67
6 732 3 496 4 197 10 598 6 089 2 764 3 267 8 636
443 609 473 l 132 159 100 396 664 41 23 61 166
17 683 10 267 17 707 65 780 l 148 930 1 783 9 871 2 748 1 393 2 830 14 231 3 554 2 083 2 205 11 057 2 781 1 705 2 557 8 727 2 559 1 211 2 763 7 097 3 335 1 891 3 302 0 813 l 329 980 1 854 4 972
229 74 413 l 012 $7 004 $6 911 $7 576 $5 564 4 380 2 724 3 501 17 280
24.8 26.5 19.8 26.3
2 918 2 072 5 099 21 187 l 279 853 2 729 12 855
652 510 l 288 5 649 456 366 369 1 466 343 146 343 690 116 127 200 185 72 70 133 301 - - - 41 - - 37 -
$2 452 $2 598 $1 886 $1 688 l 135 764 2 537 11 675
40.8 37.3 49.8 55.l
Not reported
12 263 8 401 7 882 7 469
413 3 862
13 622 5 031 5 031 4 531
500 8 591
7 469 359 250 280 222
l 554 1 418
296 1 250
74 l 192
574 -
4 531 271 133 169 614 134
1 321 20 99 -
374 870 526
7 469 6 388
675 406
-
4 531 3 790
620 39 82
7 428 800
1 393 1 194 l 159
676 l 429
658 119
$6 476 2 080
28.0
4 671 2 601
872 612 212 223 133
-18
$1 754 2 033
50.0
487

Table 18. Economic Characteristics of the Foreign-Born Population by Year of Immigration and Country of
Birth: 1970-Continued [Dato based on 5-percent sample, see text. For minimum base for derived figures (percent, median, etc.) and meaning of symbols, see text)
United States
CUBA
EMPLOYMENT STATUS
Male, 16 yt1Gr$ old and•••-------------Labor force---------------------------------
Civilian labor farce--------------------------Employed--------------------------------Unemployed _____________________________ _
Not in labor farce-----------------------------
Fe•ale, 16 yean old Clftd over ------------Labor force ----------------------------------
Civilian labor force--------------------------Employed--------------------------------Unemployed __________________ ------------
Not in labor force-----------------------------
OCCUPATION
Male ••ployed, 16 Yffl1I old and aver------Professional, technical, and kindred workers. _____ _ Managers and administrators, except form _______ _ Soles workers--------------------------------Clerical and kindred workers-------------------Craftsmen and kindred workers ----------------Operatives, except transport-------------------Transport equipment operatives ----------------Laborers, except form -------------------------Farmers and farm managers ___________________ _
Farm laborers and form foremen---------------Service workers, except private household --------Private household workers_ ____________________ _
Fe11ale ••ployed, 16 y_.. old and o- ___ _ Professional, te<:hnicol, ond kindred workers ______ _ Managers and administrators, except farm _______ _ Sales workers--------------------------------Clerical ond kindred workers-------------------Craftsmen and kindred workers ----------------Operatives, except transport-------------------Transport equipment operatives ----------------Laborers, except form -------------------------Farmers and form monogers ___________________ _
Form laborers and form foremen---------------Service workers, except private household __ ------Private household workers_ ____________________ _
CLASS OF WORKER
Male -ployed, 16 yean old and over-----Private wage and salary workers---------------Government workers-------------------------Self-employed workers-------------------------Unpaid family workers_ _______________________ _
F111ale e11ployed, 16 years old ond over ___ _
------------
-------------
-------------
-----
-Private wage and salary workers---------------Government workers -------------------------Self-employed workers-------------------------
----Unpaid family workers ________________________ _
INCOME IN 1969 OF FAMILIES AND UNRELATED INDIVIDUALS
All la•Hles ---------------------------Under $1,999 __ ---------- ------ __ ------------$2,000 to $3,999-----------------------------$4,000 to $5,999·-----------------------------
-
$6,000 to $7,999-----------------------------$8,000 to $9,999------------------------------$10,000 to $14,999---------------------------$15,000 to $24,999---------------------------$25,000 or more-----------------------------Median income -------------------------------With income below poverty level__ ______________ _
Percent of oll families _______________________ _
AH unrelated lndivlduols -----------------Under $1,999 __ ---------------- --------------$2,000 to $3,999-----------------------------$4,000 to $5,999-----------------------------$6,000 to $7,999-----------------------------$8,000 to $9,999------------------------------$10,000 to $14,999---------------------------$15,000 to $24,999----------------------------
~!J~ i~~o~~~::::::::::::::::::::::::::::::
-----------
----------With income below poverty level•---------------
Percent of all unrelated individuals' --------------
1965 to
Total 1970
165 641 61 290 139 902 49 273 139 007 49 226 133 362 46 728
5 645 2 498 25 739 12 017
195 553 83 586 100 896 40 475 100 871 40 475 93 225 36 938
7 646 3 537 94 657 43 lll
133 362 46 728 17 488 3 519 9 987 1 683 7 368 1 245
14 414 4 523 23 848 8 809 26 562 13 760 5 981 2 096 8 047 3 741
172 76 478 323
18 844 6 881 173 72
93 225 36 938 7 797 2 185 l 226 234 4 602 1 465
23 793 6 354 2 508 l 192
40 734 20 728 188 49 857 536
- -260 229
10 054 3 562 l 206 404
133 362 46 728 117 886 43 243
6 755 l 598 8 603 l 868
118 19
93 225 36 938 85 193 35 079 5 721 l 327 l 742 408
569 124
132 608 48 608 9 463 6 142
12 123 6 327 17 601 7 602 20 805 8 436 20 236 7 028 33 301 9 879 15 829 2 798 3 250 396
$8 624 $7 047 17 381 10 828
13.l 22.3
26 862 8 520 9 758 3 943 6 027 l 980 5 199 l 604 2 894 587 l 225 216 l 324 79
335 111 100 -
$3 244 $2 325 8 044 3 574
31.9 43.2
1960 1955 1950 to to to
1964 1959 1954
67 830 17 869 6 707 59 088 16 079 6 070 58 717 15 952 5 903 56 731 15 221 5 769
l 986 731 134 8 742 l 790 637
72 725 18 373 7 268 40 164 10 071 3 824 40 139 10 071 3 824 37 560 9 218 3 512
2 579 853 312 32 561 8 302 3 444
56 731 15 221 5 769 10 225 l 838 696 5 199 l 360 623 4 285 1 155 238 7 281 l 398 417 9 026 2 982 l 268 8 148 2 529 981 2 853 550 192 3 030 643 287
76 20 -112 43 -
6 474 2 683 l 031 22 20 36
37 560 9 218 3 512 4 087 628 209
654 170 44 2 174 455 140
12 782 2 210 856 900 130 164
12 279 4 164 l 308 62 58 -
255 48 -- - -
31 - -3 887 l 257 642
449 98 149
56 731 15 221 5 769 49 710 13 062 4 800
3 169 719 391 3 793 l 440 556
59 - 22
37 560 9 218 3 512 33 819 8 436 2 889
2 842 468 336 659 250 222 240 64 65
52 061 15 468 5 936 2 070 537 205 3 224 844 411 5 843 2 204 691 7 441 2 540 974 8 219 2 661 l 125
14 908 4 436 l 344 8 825 l 814 915 l 531 432 271
$9 813 $9 209 $9 221 3 892 l 159 465
7.5 7.5 7.8
10 587 2 678 1 384 3 403 822 408 2 173 774 298 2 238 428 246 1 316 317 192
624 143 53 713 131 167 80 43 -40 20 20
$3 750 $3 429 $3 937 2 501 597 343
25.9 24.4 26.9 •Number and base of percentages exclude members <>I the Armed Forces living in barracks and college students living in dormitories.
488
1945 1935 1925 to to to Before Not 1949 1944 1934 1925 reported
3 600 2 255 1 984 1 855 2 251 3 214 l 973 l 537 l 100 l 568 3 134 l 973 l 537 l 100 l 465 3 046 l 894 l 491 l 085 l 397 88 79 46 15 68 386 282 447 755 683
4 941 2 419 1 294 1 957 2 990 2 775 l 017 590 547 l 433 2 775 l 017 590 547 l 433 2 694 961 529 509 l 304
81 56 61 38 129 2 166 l 402 704 l 410 l 557
3 046 1 894 1 491 1 085 1 397 474 357 240 66 73 388 182 176 236 140
74 104 139 91 37 234 150 82 133 196 758 336 312 152 205 312 240 145 68 379 91 72 25 60 42
155 59 - 56 76 - - - - -- - - - -
560 394 372 200 249 - - - 23 -
2 694 961 529 509 1 304 281 205 67 57 78
42 - - 22 60 171 64 57 24 52 590 252 243 190 316 40 62 - - 20
l 143 328 119 87 578 19 - - - -- - - - 18 - - - - -- - - - -
370 50 43 97 146 38 - - 32 36
3 046 1 894 l 491 1 085 1 397 2 477 l 537 l 087 758 l 212
243 187 212 134 102 326 170 192 175 83
- - - 18 -2 694 961 529 509 1 304 2 250 802 403 322 1 193
231 159 110 165 83 175 - - - 28 38 - 16 22 -
3 577 2 105 1 807 1 894 1 152 162 64 40 164 79 388 159 140 485 145 367 303 202 283 106 412 323 286 238 155 360 347 147 217 132
l 151 546 522 209 306 589 204 316 192 176 148 159 154 106 53
$10 432 $9 173 $10 848 $6 211 $9 379 373 143 75 260 186 10.4 6.8 4.2 13.7 16.l
1 032 758 323 694 886 231 239 70 289 353 234 133 102 150 183 304 139 42 40 158 82 89 45 134 132 59 45 25 38 22 83 72 20 21 38 19 41 19 22 -20 - - - -
$4 425 $4 073 $2 744 $2 957 ... 314 162 239 70 244
.7 35.2 40.1 15 31.5
NATIONAL ORIGIN AND LANGUAGE

Table 18. Economic Characteristics of the Foreign-Born Population by Year of Immigration and Country of Birth: 1970-Continued
[Data based on 5-percent sample, see text. For minimum base for derived figures (percent median eJcJ ond meaning of symbols 5.., t••tl
United States
OTHER WEST INDIES
EMPLOYMENT STATUS
Male, 16 years old and aver ______________ _
Labor force -----------------------------------Civilian labor force---------------------------
~~~:~1~t;<l::::::::::::::::::::::::::::::: Not in labor force------------------------------
Female, 16 years old and over-------------Labor force-----------------------------------
Civilian labor force---------------------------
~~~:;1~;;c::::::::::::::::::::::::::::: Not in labor force.-----------------------------
OCCUPATION
Molt employed, 16 years old and over-------Professional, technical, and kindred workers _______ _ Managers and administrators, except form---------Soles workers---------------------------------Clerical and kindred worker"--------------------Croftsmen and kindred workers -----------------Operatives, except transport--------------------Transport equipment operatives -----------------Laborers, except form --------------------------Formers ond form managers ____________________ _
Form laborers and farm foremen ----------------Service workers, except private household ---- ----Private household workers-----------------------
Female employed, 16 years old and over ____ _ Professional, technical, and kindred workers--------Managers and administrators, except form _______ _ -Soles workers---------------------------------
--
Clerical and kindred workers ••• -----------------Craftsmen ond kindred workers ----------------Operatives, except transport-------------------Transport equipment operatives -----------------laborers. except form --------------------------Formers and farm managers ____________________ _ Form laborers and form foremen ----------------Service workers, except private household ---------Private household workers_ _____________________ _
CLASS OF WORKER
--
Male employed, 16 years old and over------Private wage and salary workers----------------Government workers --------------------------Self-employed workers------------------------Unpaid family workers-------------------------
----
Female employed, 16 years aid and aver __ • _ Private wage and salary workers----------------Government workers -------------------------Self-employed workers------------------------Unpaid family workers-------------------------
INCOME IN 1969 OF FAMILIES AND UNRELATED INDIVIDUALS
Under $1.~J:~~~~·-:: :::: :: ::::::::::::::::::: ----
-
~,000 to $3,999------------------------------
~:a i~ i!:E::::::::::::::::::::::::::::::-:10.000 to $14,999 ___________________________ _
$2~:~ ~~ ~2~~---------------------------~~~n income .:::::::::::::::::::::::::::::: 1~ mcome below poverty leve1-----------------rcent of all families _______________________ _
~~:o$t~~r~~~~~~~~~~:~-================= $4,000 to ls·:------------------------------~'.~~~~~::=::::::::::::::::::::::::::::: $10,()()() to $14 999----------------------------m:~ ~~ !~~~============================ Median income --------- ... ----------------- .. --
With income bel~;P;~~rt;i;'7ei~:::::::::::::::: Percent of all unrelated individuals 1 -----------
------------------
1965 to
Total 1970
88 731 37 684 70 079 31 042 68 583 30 457 65 942 29 135
2 641 1 322 18 652 6 642
113 258 51 730 67 272 35 076 67 234 35 061 64 232 33 531
3 002 1 530 45 986 16 654
65 '942 29 135 7 824 2 940 3 137 595 2 763 l 038 8 897 4 549
12 317 5 405 12 555 6 662
2 606 911 3 623 1 471
106 17 548 208
11 367 5 254 199 BS
64 232 33 531 6 365 3 222
658 90 1 598 584
15 385 7 934 898 368
14 122 6 668 83 51
431 202 24 24 20 20
12 656 6 770 9 992 7 398
65 942 29 135 55 605 26 606
6 979 l 752 3 319 738
39 39
64 232 33 531 56 202 30 689
6 715 2 545 1 251 254
64 43
72 100 25 869 4 546 1 594 7 741 2 828
11 035 4 770 11 395 4 398 10 174 4 122 16 692 5 445 8 864 2 525 1 653 187
$6 262 $7 653 8 726 3 351
12.1 13.0
39 40'9 20 301 13 936 7 503 10 649 6 314 7 359 3 919 4 360 1 645 l 7'29 558
896 241 94 21
186 100 $3 031 $2 842 11 703 6 582
31.4 34.4
1960 1955 1950 to to to
1964 1959 1954
15 315 1 005 5 898 13 158 6 165 5 243 12 919 6 084 5 243 12 401 5 934 5 009
518 150 234 2 157 840 655
1'9 163 7 737 7 187 11 559 4 623 4 516 11 536 4 623 4 516 11 031 4 294 4 362
505 329 154 7 604 3 114 2 671
12 401 5 '934 5 009 1 369 860 727
828 329 322 533 344 292
1 615 808 619 1 986 1 349 1 099 2 495 738 764
516 289 214 810 233 416
- 20 -69 63 46
2 180 901 510 - - -
11 031 4 294 4 362 1 883 1 060 757
62 37 141 172 131 142
2 626 1 312 955 214 72 41
3 144 614 1 230 15 - -82 22 16 - - -- - -
1 967 930 760 866 116 298
12 401 5 934 5 009 10 882 4 768 3 710
1 051 733 926 468 433 373 - - -
11 031 4 294 4 362 9 886 3 527 3 562
961 565 674 184 202 105 - - 21
13 856 6 085 5 904 684 240 427
1 049 462 387 2 030 714 667 2 518 898 898 2 090 688 BOO 3 724 1 793 l 503 1 438 , 129 879
323 161 343 $8 619 $10 113 $9 433
1 384 527 656 10.0 8.7 11.1
3 596 2 142 1 855 700 331 322 744 336 453
1 042 447 434 573 642 423 322 230 185 160 135 3B 31 21 -24 - -
$4 620 $4 892 $5 838 519 151 281 15.5 7.5 15.3
•Number ond bose of percentages exclude members of the Armed Forces living In barracks and college students living in dormitories.
NATIONAL ORIGIN AND LANGUAGE
1945 1935 1925 to to to Before
1949 1944 1934 1925
4 707 2 114 2 306 9 121 4 057 1 593 1 611 3 890 4 001 I 593 1 591 3 870 3 857 l 536 1 512 3 781
144 57 79 89 650 521 695 5 231
s 386 2 414 2 939 11 327 3 242 I 154 1 226 2 809 3 242 l 154 1 226 2 809 3 172 l 070 l 172 2 668
70 84 54 141 2 144 l 260 1 713 8 518
3 857 1 536 l 512 3 781 634 152 161 739 184 146 234 355 125 41 41 235 386 74 189 351 761 367 254 484 586 250 195 135 261 55 89 113 84 53 70 362 - - - 36
23 - 16 63 813 376 238 864
- 22 25 44
3 172 1 070 l 172 2 668 499 112 220 352 108 21 39 139 66 113 95 121
816 366 282 480 18 38 23 -
670 166 :m 492 17 - - -23 16 - 24 - - - -- - - -
729 212 164 469 226 24 78 571
3 857 1 536 1 512 3 781 2 801 1 075 1 028 2 454
749 402 210 812 307 59 274 515
- - - -3 172 , 070 , 172 2 668 2 378 834 849 1 887
749 182 245 559 45 54 78 222 - - - -
4 978 1 911 2 291 8 128 171 66 168 807 500 259 308 1 537 450 188 334 l 442 710 248 272 1 110 660 173 447 765
1 529 570 377 1 154 796 318 318 1 038 162 89 67 275
$9 994 $10 189 $8 284 $6 633 473 212 314 1 194 9.5 11.l 13.7 14.7
1 268 875 1 227 5 487 363 302 578 2 692 315 83 173 1 751 264 220 160 452 152 169 182 396 96 55 92 110 76 46 42 63 - - - -- - - 23
$3 806 $4469 $2 271 $2 045 318 241 487 2 306 25.l 27.5 39.7 42.0
Nat reported
4 581 3 320 2 825 2 777
48 1 261
5 375 3 067 3 067 2 932
135 2 308
2 777 242 144 114 306 612 730 158 124 33 60
231 23
2 932 260
21 174 614 124 667
-42 --
615 415
2 777 2 281
344 152 -
2 932 2 590
235 107 -
3 078 389 411 440 343 429 597 423
46 $7 761
615 20.0
2 658 l 145
680 421 178
81 93 21 39
$2 452 818 39.7
489
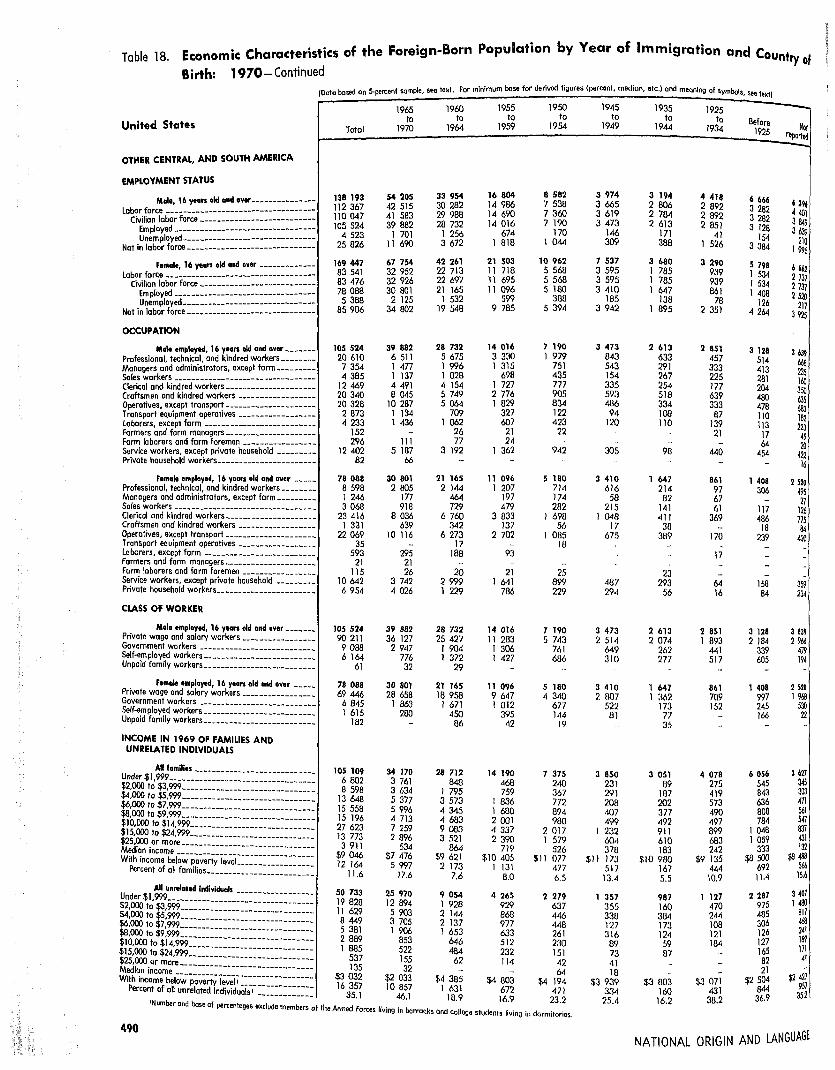
Table 18. Economic Characteristics of the Foreign-Born Population by Year of Immigration and Country of Birth: 1970-Continued
{Date based an 5-percent sample, see te•t. For minimum base far derived figures (per<»nt, median, elc.) and mooning of symbols, see l'"I)
United States
OTHER CENTRAL, AND SOUTH AMERICA
EMPLOYMENT STATUS
Male, 16 yean old and aver---------------Lobor force -------------------------------- ---
Civilian labor force---------------------------Employed---------------------------------Unemployed __ -----------_ -----------------
Not in labor fore•------------------------------
Female, 16 yhn old and over -------------Labor force-----------------------------------
Civilian labor force---------------------------Employed--------------------------------Unemployed-------------------------------Not in labor force _____________________________ _
OCCUPATION
Male employed, 16 years old and over ______ _ Professional. technical, and kindred workers_ ______ _ Managers and administrators, except farm ________ _ Soles workers--------------------------------Clerical and kindred workers--------------------Croftsmen and kindred workers -----------------Operatives, except transport--------------------Transport equipment operatives -----------------Laborers, except form --------------------------Formers and farm managers ____________________ _
Form laborers and farm foremen ----------------Service workers. except private household --------Private household workers-----------------------
Female employed, 16 years old and over -----Professional, technical, and kindred workers _______ _ Managers ond administrators, except farm--------Sales workers--------------------------------Clerical and kindred workers--------------------Craftsmen and kindred workers -----------------Operatives, except transport--------------------Transport equipment operatives -----------------Laborers, except form ------------ --------------Formers and farm managers ____________________ _
Farm laborers and farm foremen ----------------Service workers, except privote household --------Priva1e household workers-----------------------
CLASS OF WORKER
Male employed, 16 years old and over------Priva1e wage ond salary workers ----------------Government workers --------------------------Seif-em ployed workers __ -----------------------Unpaid family workers--------------------------
Female employed, 16 years old and aver ----Private woge and solory workers----------------Government workers ---------------------------Self-employed workers---------------------- ___ _ Unpaid family workers---------------------- ___ _
INCOME IN 1969 OF FAMILIES AND UNRELATED INDIVIDUALS
~"i ';ll~~~~j=~~~~~~i~~:~~~j~~~j=~ $10,000 to $l4,999 __________________ :_:_:::::::
fJ~·g;g to $24, 999-----------------------------Med' .or more-------------------------------
100 mcome ----------With income below poverty i;v~::::::::::::::::::
Percent of all families. _______________________ _
Total
138 193 112 367 110 047 105 524
4 523 25 826
169 447 83 541 83 476 78 088 5 388
85 906
105 524 20 610 7 354 4 385
12 469 20 340 20 328 2 873 4 233
152 7.96
12 402 82
78 088 8 598 l 246 3 068
23 416 1 331
22 069 35 593
21 1 l5
10 642 6 954
105 524 90 211
9 088 6 164
61
78 088 69 446 6 845 1 615
l82
105 109 6 802 8 598
13 648 15 558 15 196 27 623 13 773 3 911
$9 046 12 164
11.6
1965 to
1970
54 205 42 515 41 583 39 882
1 701 11 690
67 754 32 952 32 926 30 801
2 125 34 802
39 882 6 511 1 477 1 137 4 491 8 045
10 287 1 134 1 436
111 5 187
66
30 801 2 805
177 918
8 036 639
10 116
295 21 26
3 742 4 026
39 882 36 127 2 947
776 32
30 801 28 658
1 863 280
34 170 3 761 3 634 5 377 5 996 4 713 7 259 2 896
534 $7 476
5 997 17.6
1960 to
1964
33 954 30 282 29 988 28 732
1 256 3 672
42 261 22 713 22 697 21 165 1 532
19 548
28 732 5 675 1 996 1 028 4 154 5 749 5 064
7Cfi 1 062
26 77
3 192
21 165 2 144
464 729
6 7{1J 342
6 273 17
188
20 2 999 1 229
28 732 25 427 I 904 1 372
29
21 165 18 958 l 671
450 86
28 712 848
l 795 3 573 4 345 4 683 9 083 3 521
864 $9 621 2 173
7.6
1955 to
1959
16 804 14 986 14 690 14 016
674 1 818
21 503 11 718 11 695 11 CYY6
599 9 785
14 016 3 330 l 315
698 1 727 2 776 1 87.9
327 607
21 24
l 362
11 096 1 207
197 479
3 833 137
2 702
93
21 1 641
786
14 016 11 283 1 306 I 427
ll 096 9 647 I 012
395 42
14 190 468 759
I 836 1 680 2 001 4 337 2 390
719 $10 405
1 131 8.0
1950 to
1954
8 582 7 538 7 360 7 190
170 1 044
10 962 5 568 5 568 5 180
388 5 394
7 190 1 979
751 435 777 905 834 122 423
22
942
5 180 714 174 282
1 698 56
1 085 18
25 899 229
7 190 5 743
761 686
5 180 4 340
677 144
19
7 375 240 367 772 894 980
2 017 1 579
526 $11 077
477 6.5
All •nrolated lndlvlduols 50 733 25 970 Under l 999 ----------- 9 054 4 265 2 279 $2000$td $3 999------------------------------- l9 828 12 894 1 928 929 637
$4:000 to $5:999::::::::::::::::::::::::::::::: 1J _t~ 5 ~; ~ ~~ 868 446 ~·:to $7•999------------------------ 5 381 1 906 1 653 ~~ 448 $10,ood~0$;i~::::::::·:------------------- 2 889 853 64¢ 512 ~~ci $15 000 t $24 999 - ------------------- 1 885 522 484 232 151
~~:ii~~o~~;~==========::::::::::::::::::::: i~~ l~~ 62 114 ~ With income below poverty i;~;17::::::::::::::::: 1~ g~~ $2 033 $4 385 $4 803 $4 194
Percent of all unrelated individuals• 35 1 10 857 1 631 67'1. 471
'Number and ------------- ' 46·1 18.9 16.9 23.2 base of percentages exclude members of the Armed forces living in borrac:ks ond college students living in dormitories.,
490
1945 to
1949
3 974 3 665 3 619 3 473
146 309
7 537 3 595 3 595 3 410
185 3 942
3 473 843 543 154 335 593 486 94
120
305
3 410 616
58 215
l 048 17
675
487 7.94
3 473 2 514
649 310
3 410 2 807
522 81
3 850 231 291 208 407 499
I 232 604 378
$11 173 517 13.4
1 357 355 338 127 316 89 73 41 18
$3 939 334 25.4
1935 to
1944
3 194 2 806 2 784 2 613
171 388
3 680 1 785 1 785 1 647
l38 1 895
2 413 633 291 267 254 518 334 108 110
98
647 214 62
141 411 38
389
23 293
56
2 613 2 074
262 277
1 647 1 :162
173 77 35
3 051 09
187 202 377 492 911 610 183
$10 980 167 5.5
987 160 384 173 124 59 87
$3 803 160
16.2
1925 to
1934
4 418 2 892 2 892 2 851
41 1 526
3 290 939 939 861
76 2 351
2 851 457 333 225 177 639 333 87
139 21
440
861 97 67 61
369
170
17
64 l6
2 851 1 893
441 517
861 709 152
4 078 275 419 573 490 497 899 683 242
$9 135 444 10.9
1 127 470 244 108 121 184
$3 071 431 38.2
Before 1925
6 666 3 282 3 282 3 128
154 3 384
5 798 1 534 1 534 1 408
126 4 264
3 128 514 413 281 204 480 478 110 113
17 64
454
1 408 306
117 486
18 239
158 84
3 128 2 l84
339 605
1 408 997 245 166
6 056 545 843 636 808 784
l 048 1 059
333 $8 500
692 11.4
2 287 975 485 306 126 127 165 82 21
$2 504 844 36.9
Not reported
6 396 4 401 3 849 3 639
210 l 995
6 662 2737 2737 2 520
217 3 925
3 639 668 235 I~ 350 635 683 182 223
45 20
422 16
2 520 495 27
126 175 84
420
359 234
3 639 2 966
479 194
2 520 1 968
530 22
3 627 345 303 471 561 547 837 431 132
$8 488 566
15.6
3 407 1480
817 468 241 18'1 171
41
$2 427 957
352
NATIONAL ORIGIN AND LANGUAGE
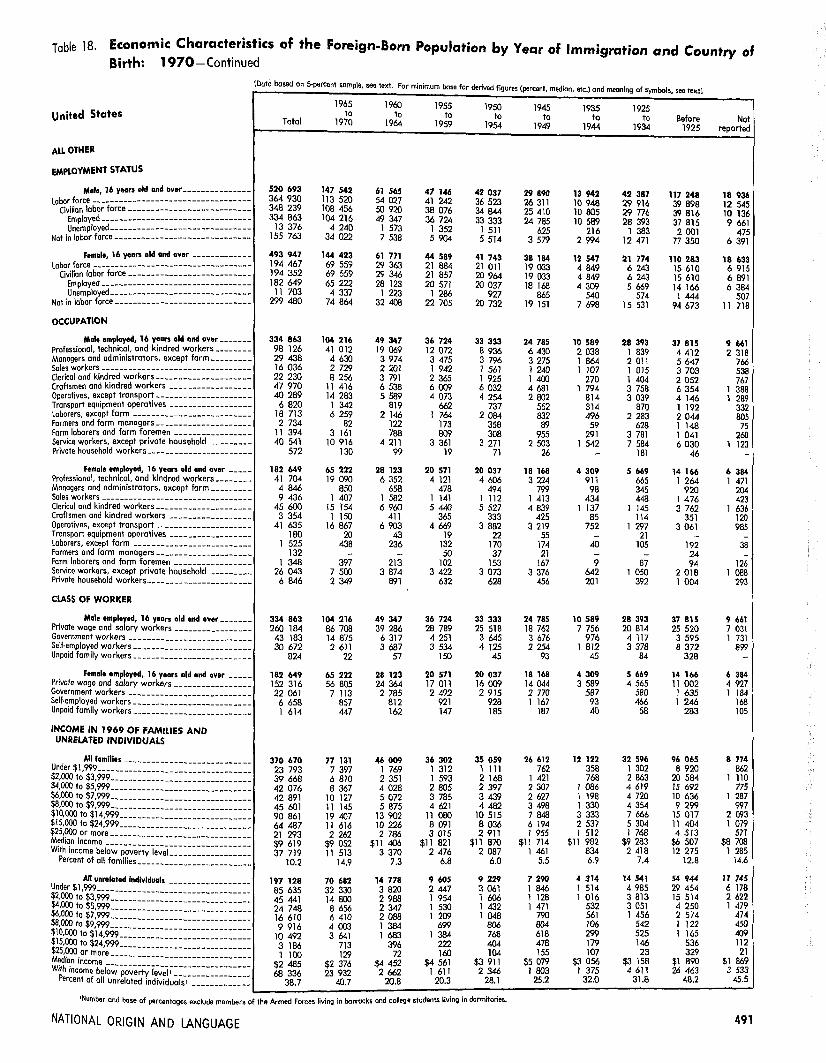
Table 18. Economic Characteristics of the Foreign-Born Population by Year of Immigration and Country of Birth: 1970-Continued
{Data based on 5-percent sample, see text. For minimum bose for derived figures (percent median etc J and meaning of symbols see text]
United States
AU OTHER
EMPLOYMENT STATUS
Ma,., 16 years old and over ______________ _
Labor farce-----------------------------------Civilian labor force---------------------------
~~~~~l~~;ci::::::::::::::::::::::::::::::: Not in labor force------------------------------
Female, 16 years old and over ------------Labor farce-----------------------------------
Civilian labor farce---------------------------
~~~~~l~~;d::::::::::::::::::::::::::::::: Not in lobar farce------------------------------
OCCUPATION
Male employed, 16 years aid Gnd over-------Professional, technical. and kindred workers _______ _ Managers ond administrators, except farm--------Sales workers--------------------------------Clerical ond kindred workerS--------------------Craftsmen and kindred workers -----------------Operatives, except transport--------------------Transport equipment operatives -----------------laborers, except form --------------------------Farmers and farm managers ____________________ _
--
Form laborers and farm foremen ----------------Service workers, except private household -------Private household workers----------------------
Female employed, 16 years old and aver ____ _ Professional, technical, and kindred workers _______ _
---
---
Managers ond administrators, except farm-------Sales workers-------------------------------Clerical and kindred warkers-------------------Craftsmen and kindred workers -----------------Operatives, except transport-------------------Transport equipment operatives ----------------laborers, except form -------------------------Farmers and farm managers_ __________________ _
Form laborers and form foremen ---------------Service workers, except private household -------Private household workers----------------------
CLASS OF WORKER
Male employed, 16 years old and over-----Private wage and salary workers---------------Government workers-------------------------Self-employed workers------------------------Unpaid family workers-------------------------
Female employed, 16 years aid and over ---Private wage and salary workers---------------Government workers-------------------------Self-employed workers-------------------------Unpaid family workers_ _______________________ _
INCOME IN 1969 OF FAMILIES AND UNRELATED INDIVIDUALS
~::~~~~~I~~~~~~~~~~~~~~~~~~~~~~~~~~~~~~ ~:: :~ ~~:~============================== $10,000 ta $14,999 ___________________________ _
m:~ ~~ ~:;~----------------------------Median income ----------------------------
With income bel~~P~~~rt:;l;;;i::::============= Percent of all families _______________________ _
All unrelated individuals -----------------~~~ $t~ 99a'1 m- -- -------------- -------------
----
-----
-----
-----------------~:: :~ :{~============================== $1o.oocJ~o$~1'79 .m-----------------------------
$15,000 to $24•999--------------------------------
i~~:ii~~o:~;e __ ::::::::::::::::::::::::::::
With income bel~~ .. P~~~rt:;iiv""ii~::::::::::::::::_ Percent of all unrelated individuals 1 -------------
1965 ta
Total 1970
520 693 147 542 364 930 113 520 348 239 108 456 334 863 104 216
13 376 4 240 155 763 34 022
493 947 144 423 194 467 69 559 194 352 69 559 182 649 65 222 ll 703 4 337
'299 480 74 864
334 863 104 216 98 126 41 012 29 438 4 630 16 036 2 729 22 230 8 256 47 970 11 416 40 289 14 283
6 820 1 342 18 713 6 259 2 734 82
11 394 3 161 40 541 10 916
572 130
182 649 65 222 41 704 19 090
4 846 850 9 436 l 407
45 600 15 154 3 354 l 150
41 635 16 867 180 20
1 525 438 132 -
l 348 397 26 043 7 500
6 846 2 349
334 863 104 216 260 184 86 708
43 183 14 875 30 672 2 611
824 22
182 649 65 222 152 316 56 805 22 061 7 113
6 658 857 l 614 447
370 670 77 131 23 793 7 397 39 668 6 810 42 076 8 367 42 891 10 127 45 601 11 145 90 861 19 407 64 487 11 616 21 293 2 262 $9 619 $9 052 37 719 11 513
10.2 14.9
197 128 70 682 85 635 32 330 45 441 14 800 24 748 8 656 16 610 6 410 9 916 4 003
10 492 3 641 3 186 713 1 100 129
$2 485 $2 376 68 336 23 932
38.7 40.7
1960 1955 1950 to to to
1964 1959 1954
61 5'15 47 146 42 037 54 027 41 242 36 523 50920 38 076 34 844 49 347 36 724 33 333
1 573 1 352 1 511 7 538 5 904 5 514
61 771 44 589 41 743 29 363 21 884 21 Oil 29 346 21 857 20 964 28 123 20 571 20 037
1 223 1 286 927 32 408 22 705 20 732
49 347 36 724 33 333 19 069 12 072 8 936 3 974 3 475 3 796 2 201 l 942 l 561 3 791 2 365 1 925 6 538 6 r:m 6 032 5 589 4 073 4 254
819 662 737 2 146 1 764 2 084
122 173 358 788 809 308
4 211 3 361 3 271 99 19 71
28 123 20 571 20 037 6 352 4 121 4 606
658 478 494 1 582 l 141 l 112 6 960 5 440 5 527
411 365 333 6 903 4 669 3 882
43 19 22 236 132 170
- 50 37 213 102 153
3 874 3 422 3 073 891 632 628
49 347 36 724 33 333 39 286 28 789 25 518
6 317 4 251 3 645 3 687 3 534 4 125
57 150 45
28 123 20 571 20 037 24 364 17 011 16W 2 785 2 492 2 915
812 921 928 162 147 185
46 009 36 302 35 059 l 769 1 312 1 ll1 2 351 l 593 2 168 4 028 2 805 2 397 5 072 3 785 3 439 5 875 4 621 4 482
13 902 11 080 10 515 10 226 a 091 8 036 2 786 3 015 2 911
$11 406 $11 821 $11 870 3 370 2 476 2 087
7.3 6.8 6.0
14 778 9 605 9 22'/ 3 820 2 447 3 061 2 988 l 954 l 606 2 347 l 530 1 432 2 088 l 209 1 048 1 384 699 806 1 683 l 384 768
396 222 404 72 160 104
$4 452 $4 561 $3 911 2 662 1 611 2 346
20.8 20.3 28.1
1Number and base of percentages exclude members of the Armed Forces living in barrocks and college student.s living in dormitories.
NATIONAL ORIGIN AND LANGUAGE
1945 1935 1925 to to ta Before
1949 1944 1934 1925
29 890 13 942 42 387 117 248 26 311 10 948 29 916 39 898 25 410 10 805 29 776 39 816 24 785 10 589 28 393 37 815
625 216 1 383 2 001 3 579 2 994 12 471 77 350
38 184 12 547 21 774 110 283 19 033 4 849 6 243 15 610 19 033 4 849 6 243 15 610 18 168 4 309 5 669 14 166
865 540 574 l 444 19 151 7 698 15 531 94 673
24 785 10 589 28 393 37 815 6 430 2 038 l 839 4 412 3 275 1 864 2 011 5 647 l 240 l 107 1 015 3 703 l 400 270 1 404 2 052 4 681 1 794 3 758 6 354 2 802 814 3 039 4 146
552 314 870 1 192 832 496 2 283 2 044 89 59 628 l 148
955 291 3 781 l 041 2 503 1 542 7 584 6 030
26 - 181 46
18 168 4 309 5 669 14 166 3 224 911 665 l 264
799 98 345 920 l 413 434 448 l 476 4 839 l 137 l 145 3 762
425 85 114 351 3 219 752 1 297 3 061
55 - 21 -174 40 105 192 21 - - 24
167 9 87 94 3 376 642 1 050 2 018
456 201 392 1 004
24 785 10 589 28 393 37 815 18 762 7 756 20 814 25 520 3 676 976 4 117 3 595 2 254 J 812 3 378 8 372
93 45 84 328
18 168 4 309 5 669 14 166 14 044 3 589 4 565 11 002 2 770 587 580 J 635 l 167 93 466 l 246
187 40 58 283
26 612 12 122 32 596 96 065 762 358 l 302 8 920
l 421 768 2 863 20 584 2 307 1 086 4 619 15 692 2 627 l 198 4 720 lO 636 3 498 l 330 4 354 9 299 7 848 3 333 7 666 15 017 6 194 2 537 5 304 1l 404 1 955 1 512 1 768 4 513
$11 714 $11 982 $9 283 $6 507 l 461 834 2 418 12 275
5.5 6.9 7.4 12.8
7 290 4 314 14 541 54 944 l 846 1 514 4 985 29 454 l 128 l 016 3 813 15 514 l 471 532 3 051 4 250
790 561 1 456 2 574 804 106 542 I 122 618 299 525 1 165 478 179 146 536 155 107 23 329
$5 079 $3 056 $3 158 $1 890 I 803 1 375 4 611 26 463
25.2 32.0 31.8 48.2
Nat reported
18 936 12 545 10 136 9 661
475 6 391
18 633 6 915 6 891 6 384
507 l l 718
9 661 2 318
766 538 767
1 388 1 289
332 805
75 260
l 123 -
6 384 l 471
204 423
1 636 120 985
-38 -
126 1 088
293
9 661 7 031 1 731
899 -
6 384 4 927 l 184
168 105
8 774 862
l 110 775
l 287 997
2 093 1 079
571 $8 708
1 285 14.6
11 745 6 178 2 622 l 479
474 450 409 112 21
$1 869 3 533
45.5
491

Table 19. Mother Tongue of the Population by Nativity and Parentage: 1970
United States
Total ____________________________ _ -English ------------------ -- ------------- --Celtic ---- -- ------------------------------Norwegian ----------------- ---------------Swedish -- --------------------------------Danish -- ---- -- ---------- -- ---------- -----Dutch ---------- ----------- ------------- --Flemish--. --- -- - ----- - - -- ---- -- - --- - --- - -- -French -- -------------- -- ---- ----------- --Breton __ ------------------ -------- ----- ---
Germon ----------------- ------- -------- --Polish ---------- ------------ -- --- ----- -- --Czech ---- ------ ------------ --- --------- --Slovak -- -------------- -------- -- ---------Hungarian ---- -- ------- -- --- ---- ------ -- ---Serbo-Croatian-.------ -- -- ---- -- -- ------ ----Slovenian ------ - ------- -- ------ - ----- --- --Dolmatian __ -- -- ------- --- -- --- - ------ -- --Albanian •• ------ -- -- --- --- -- -- - ------- -- ---
Finnish ---- ---- -------- ---- -- -- ------ - ----Lithuanian __ -- -- ------ __ ---- --- --- ------ ---Other Bolto-Slovonic dialects ---- -- ------------Russian ------ -- ----- ----- -- --------- --- ---Ukrainian ---- ---------- ------ -------- -----Georgian __ -- -- ---- -- -- -- ---- -- ------ ---- -Rumanian __ -- -------- -- __ -- -- -- ------ -- ---Yiddish -- -- -- -- ---- -- -- ------ ------ -- .. ---Gypsy (Romani) ___________________________ _
Greek __ -- __ -- -- --- --- -- ---- ---- --- ----- -ltolion •• -- __ -- -- --- _ -- __ ---- ------- ----- _. Spanish ------------------ ----------------Portuguese ____ .. --- ------- -- __ ---- - • ---- --Bosque -- __ -- -- -- ---- -- ------------ ---- -- -
Armenian __ ------ __ -------------------- __ _ Persian -- _________________ . _. ___ ... ______ _ Other Persian dialects ______________________ _
Hebrew ___________________ • __ --- • _______ •• Arabic (n.e.c.) -- __ ------ --- ___ --- ---- ____ .• Egyptian-------------------------------- __ Iraqi ____ ---- -- ______ - - ----- - -- - ----- -- -- -Near Eastern Arabic diolecls -----------------
North African Arobk dialects----------------Southern Semitic---------------------------Hamitic .• ________________________________ _ Swahili __________________________ ---- .. __ _ Libyan ________ ------ ____________________ _
Niger-Conga (Chari-Nile)---------------------Eastern Sudanic_.---- _____________________ _
Turkish ____ ---- __ ---- ________ -------- ---- _ Other Urofic ____ ------ ---------------------Altaic ____________________ ---- ___________ _
Hindi (Hindustani)-------------------- .. ·--Other Inda-Aryan --------------------------
Dravidian _____ • _____________ . -- __ --- _ -- -- _ Korean -- .. __ •• -----. _. __________________ _
~i!:• '~;~:~:~~ ~~ ~ =~=:= ~ ::: :: :: ~=~:: ~ Ot er Chinese dialects ----------------------
~~~;~;==== :::::::::::: :::: == :::: :: = =: :::
---------. ---
-----
-------
-----
---. . ---01 ( 1amese), Lao ________________ _
~hlay (Indonesian) _________________ :::::::: -
~~i~I~~~~~~~= :::::::::::::: :: :::::::::::: ----
Algonquin ____ -------- ____________ _
~fheaj~;i;;· ;;-~ ---- -- - -- ---- --- -- -- - - -- -- -Ut A t P k n--------------------------0· 2 econ _______ _ Other American Indian·::::::::::::::::::::::
----
All other __ _ Not reported·:=:::::::=:::::::::::::::::::: --
492
ID 1 b d n 15 percent sample see te>t. Far meaning of symbols, see text I a a ase o
Foreign stock -.... ___ Native of foreign or mixed porentoge --Native of ~--·~... .
·native Foreign Mixed Foreign Total parentage Total Toto I porentoge parentage
born ~
203 210 158 169 634 926 33 575 232 23 '155 930 12 902 976 11 052 954 160 717 113 149 312 435 11 404 678 9 706 85.1 3 170 4!1 6 536 442 9 6!9 302
88 162 9 734 78 428 32 969 25 655 7 314 l 697 825 612 862 204 822 408 040 313 675 191 929 121 746 45 459 626 102 113 119 512 983 :lBl 575 283 569 98 006 94 365 194 462 29 089 165 373 !07 155 75 6!4 31 541 131 ~ 350 748 90 713 260 035 !32 20! 86 463 45 738 5€ 1\S
61 889 12 064 49 825 29 02,1 2! 649 7 375 127 834 2 598 408 1 460 130 l 138 278 n1 698 33:l 997 393 701 20 801
32 722 7 252 25 470 15 439 8 963 6 476 410 5&J
10 031 6 093 054 2 488 394 3 604 660 2 40:! 125 1 468 715 934 410 1 201 535 2 437 938 670 335 l 767 603 1 347 691 1 085 041 262 650
452 812 148 9M 303 868 23:) 165 163 104 69 461 419 911
510 366 86 950 423 416 :140 85.S 279 203 61 652 70 703
447 497 52 156 395 341 234098 195 556 38 532 82 561
239 455 24 095 215 360 132 2w. 109 262 23 034 161 253 83 064 82 321 9 040 73 281 S•I HJ:! 47 552 6 551 19 118 9 802 3 038 6 764 ,, 748 3 201 l 547
17 382 1 571 15 811 a :m:i 6 7:l0 l 553 2 016 7528
214 168 58 124 156 044 111 '75'1 91 730 26 024 38 2'ill 292 820 34 744 258 076 162 68ll 143 297 19 591 95 188 19 748 1 231 18 517 fl 30'1 6 646 l 663 10 2Q8 334 615 30 665 30:l 950 154 67:! 131 793 22 800 149 271 249 351 22 662 226 689 l:lo OS4 115 982 IA 072 96 615 757 179 578 \~I 120 37 421 56 590 5 166 51 ·124 1~. :1m 21 809 3 560 26 055 I 593 993 170 174 1 423 819 '1!15 10:1 845 484 140 219 438116 1 588 1 252 :l:l6 l&J 79 101 156
458 699 56 839 401 1160 WH 11~1 l•hl 897 61 218 193 745 4 144 315 605 625 3 530 690 'J !il~ 696 I I)'(,/ ()()1 585 695 l 025 994 7 823 583 4 171 050 3 652 533 l 9!ll1 2'>:1 9!IB 6W 997 665 1 696 240
365 300 62 252 303 048 162 l49 111 9')2 50 827 140 m 8 108 l 852 6 256 4 (\l\/ :I !Xl4 l 053 2 169
100 495 13 758 ll6 73/ 4(1 •1l•t :rn 9:m 9 484 38 323 20 553 965 11) 5H8 :1 (>():! I t.'N l 905 15 986 3 370 590 l 100 1 •J:l/ I 110 327 1 341
101 686 19 691 Bl 'l9S <1!1 m1:1 :M 0:1t1 11 847 36 112 123 744 14 055 109 61)<) !1~ 'XI:? :10 /()<I 14 198 56 787
891 33 IJ51J 1'J 49 30 771/ 2 413 509 I 'i04 I !>II .1:1~ 323 1 1~6
66 064 10 952 55 112 •10 :«)(, :JI fo/2 a 634 lH06
408 217 191 ~1'} 16 36 139 l 354 380 9l·t 216 /H 138 758
948 445 503 'JI/ 135 82 286 3 991 2 040 I 951 Ill'./ :l!M 428 I 139
410 265 145 Ht. 29 57 59 6 537 l 055 ti 482 1 1:-»1 t.!1:\ 568 4261 2 543 336 2 WI 1 :MJ ')!,:l 394 8611
24 123 l 811 22 a12 ~l 666 :i 826 I 840 16 04-0 15 191 765 14 426 :1 016 2 3'11 669 11410
974 306 668 2.'11 Wi 45 417 26 253 1 249 25 ()()4 '1 'lfr/ 1 9,14 1 043 22 017 22 939 731 22 20H :1 J.17 I UI 602 19 M6
8 983 635 8 348 ttl:l 578 235 7535 53 528 2 756 50 712 16 0~4 1 :no 8 696 3'1748
408 504 82 886 325 618 20/ s:w 1:11 :173 70 155 118 090 337 283 29 244 308 039 12:.! 000 HO :117 41 683 186 039
1 697 651 I 046 :11.1 115 139 732 5 819 703 5 116 I •/:p 1 273 664 3179
632 166 466 IS6 106 50 310
352 183 169 !iO 2:1 27 119 I 581 248 l 33:1 II/ 51 126 1156
14 416 1 178 13 238 1 ~i4:.l 4M I 079 11695 6 253 826 5 427 Al/ 311 506 4610 4 042 l \93 2 fM9 ~·M :!B2 162 2305
217 907 8 336 209 571 ~" 0 /J :1s ~111 21 492 152498 20 687 12 006 6 6BI 3 125 2 1:12 1 593 4 956
19 909 18 079 I 030 1 l'Xl 274 916 640 IN 91 860 91 092 768 64H 174 474 580 18 528 17 497 I 031 4~i 1 m 278 31 245 152 93 s~) 2:1 32
4431 137 663 128 039 9 624 '.1 l'l'.l 1 ll66 3 327
880 779 350 l 26 530 653 :1111 4!tl ?:l6 .504 104 979 189 170 96 w 9 317 873 8 873 08! 444 792 311H 645 171 288 171 357 -
NATIONAL ORIGIN AND LANGUAGf
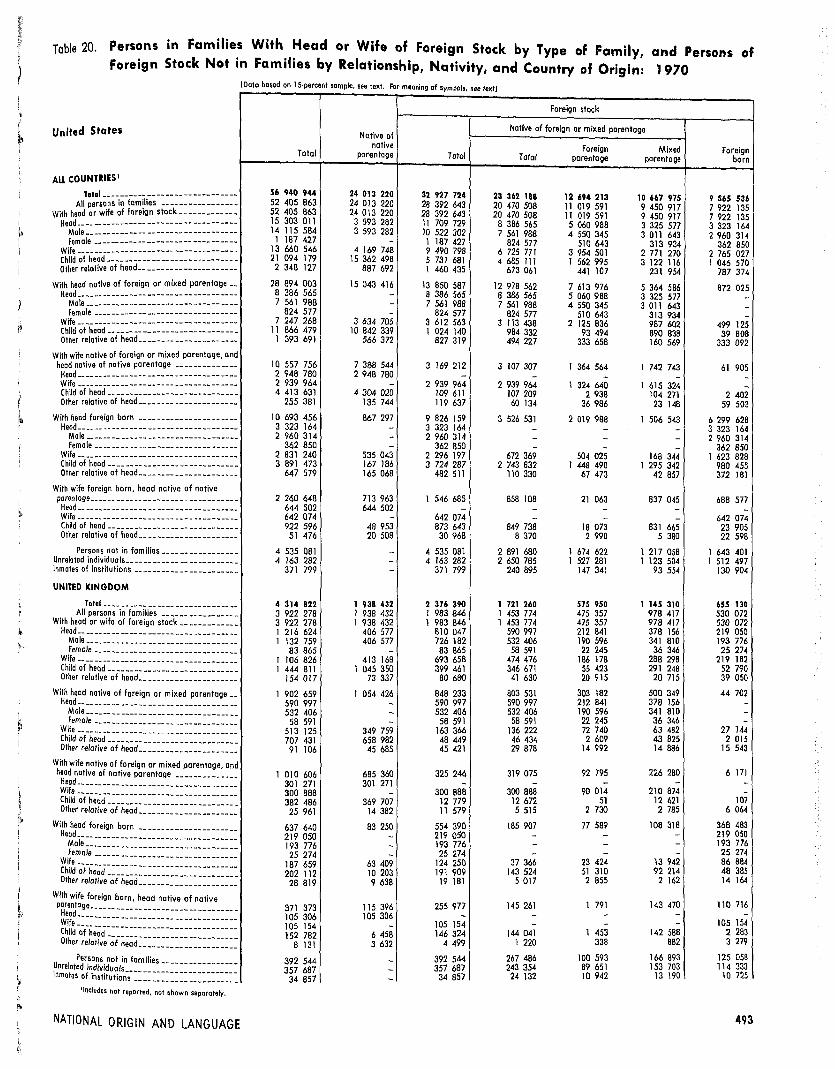
fl
\
l I
l I 1 i ') \
Tobie 20. Persons in Families With Head or Wife of Foreign Stock by Type of Family, Foreign Stock Not in Families by Relationship, Nativity, and Country of Origin:
and Persons of 1970
United States
All COUNTRIES 1
Total -- -- -- -- -- -- -- -- -- -- -- -- -- -- --All persons in families -----------------
With head or wife of foreign stock ____________ _
Heod-- -- -- -- -- -- -- -- -- -- -- -- -- -- -- -- -- -M• - - - - - - - - - - - - - - - - -Female ---- ------ -- ------ -- -- ---- -- ---
W~ --- ------ ---- --- - -Child of head -- -- -- -- -- -- -- -- -- -- -- ______ _ Other relative of head ______ -- __ ------ __ ----
With head native of foreign or mixed parentage __ Head-- -- __ -- -- -- -- -- -- -- -- -- -- -- -- -- -- __
Mole __ -- -- -- ------ ------ -- ------ -- -- --Female -- -- -- ---- -- -- -- -- -- -- -- __ -- ___ _
Wife -- ------ -- ------ -- -- -- -- ---- -- -- -- --Child of heod----------------------------Other relative of head __ -- -- -- ---- ----------
With wife native of foreign or mixed parentage, and head native of native parentage __ -- ---- -- ----Heod-- ---- -- -- -- ---- -- -- -- -- -- -- -- -- ---Wife -- -- -- -- -- -- ---- -- -- -- -- -- ---- -- -- --Child of head ______ -- __________ -- ________ _ Other relative of head ____ -- ______ ---- _____ _
With head foreign barn -- __ -- __ ---- __ ---- ___ _ Head ____ -- -- -- -- -- -- -- -- -- -- -- -- -- -- ----Mole __ -- -- -- ____________________ ---- __
Female _______________________________ _
Wife -- -- -- -- -- -- ---- -- -- -- -- -- ------ ----Child of head -- ------ -- __________________ _ Other relative of head ____________ ------ ___ _
With wife foreign born, head native of native parenlage __ ---- __________________________ _
Head-- -- -- -- -- -- -- -- -- -- -- -- -- -- ---- -- -Wife -- -- -- -- -- -- ---- -- -- -- ---- -- -- -- -- --Child of heod ___________________________ _
-Other relative of head ______ -- _____________ _
Persons not in families ______ ---- __ ---- -Unrelated individuals-- ______ -- -- __ ---- ______ _ Inmates of institutions ______________________ _
UNITED KINGDOM
Total ______ ---- ____________ ---- __ --All persons in families ________________ _
With head or wife of foreign stock ____________ _ Head ______ -- __ -- -- -- -- -- -- -- ------ -- -- --Male _________________________________ _
Female _______________________________ _ Wife __________ ---- __________ ---- __ ---- __ Child of head __________________________ -- -Other relative of head _____________________ _
With heod native of foreign or mixed parentage __ Head ________________ ---- ____ ---- -- -- -- --
Male _________________________________ _
Female -- -- -- ---- -- ______ ---- -- __ -- -- --Wife -- ________ ---- _____________________ _ Child of head ____________ -- _____________ _
-Other relative of head _____________________ _
With wife native of foreign or mixed parentage, an head native of native parentage --------------
~r::::: :: :: :: :::::: == :: :: :: == :: :: ::::::
d
Child of head ___________________________ _ Other relative of head ________________ -------
With head foreign born ________________ ------
He~dal; :: :: :: :: :: :: :: :: :: :: :: :: :: :: :: :: :-
~i~~~iijie=~~~~~;~~~~~~~~~~~~~~~~~~~~~~ -
-With wife foreign born, head native of native
p[~yJ~:~::::::::::::::::::::::::::::::::_ Chi!~ -of-h;~d- -- -- ---- -- -- -- -- -- -- -- ---- -Other relative -~f-h;~.:;:::::::::::::::::::::_
-
-
Unrelat:~'fn~~~i;~~ !n families -- -- -- -- ------ --Inmates of instituti~ -------------------------
ns ----------------------
--
llncludes not reported, not shown separately,
NATIONAL ORIGIN AND LANGUAGE
[Dato based on 15-percent sample, see text. For meaning of symbols oee text]
Foreign stock
Native of Native of foreign or mixed parentage
native Foreign Mixed Total parentage Total Total parentage parentage
56 940 944 24 013 220 32 927 724 23 362 188 12 694 213 10 667 975 52 405 863 24 013 220 28 392 643 20 470 508 11 019 591 9 450 917 52 405 863 24 013 220 28 392 643 20 470 508 11 019 591 9 450 917 15 303 011 3 593 282 11 709 729 8 386 565 5 060 988 3 325 577 14 115 584 3 593 282 10 522 302 7 561 988 4 550 345 3 011 643 1 187 427 - 1 187 427 824 577 510 643 313 934 13 660 546 4 169 748 9 490 798 6 725 771 3 954 501 2 771 270 21 094 179 15 362 498 5 731 681 4 685 l1l 1 562 995 3 122 116 2 348 127 887 692 1 460 435 673 061 441 107 231 954 28 894 003 15 043 416 13 850 587 12 978 562 7 613 976 5 364 586 8 386 565 - 8 386 565 8 386 565 5 060 988 3 325 577
7 561 988 - 7 561 988 7 561 988 4 550 345 3 011 643 824 577 - 824 577 824 577 510 643 313 934
7 247 268 3 634 705 3 612 563 3113438 2 125 836 987 602 11 866 479 10 842 339 1 024 140 984 332 93 494 890 838
1 393 691 566 372 827 319 494 227 333 658 160 569
10 557 756 7 388 544 3 169 212 3 107 307 1 364 564 1 742 743 2 948 780 2 948 780 - - - -2 939 964 - 2 939 964 2 939 964 1 324 640 1 615 324 4 413 631 4 304 020 109 611 107 209 2 938 104 271
255 381 135 744 119 637 60 134 36 986 23 148
10 693 456 867 297 9 826 159 3 526 531 2 019 988 1 506 543 3 323 164 - 3 323 164 - - -2 960 314 - 2 960 314 - - -
362 850 - 362 850 - - -2 831 240 535 043 2 296 197 672 369 504 025 168 344 3 891 473 167 186 3 724 287 2 743 832 l 448 490 1 295 342
647 579 165 068 482 511 110 330 67 473 42 857
2 260 648 713 963 1 546 685 858 108 21 063 837 045 644 502 644 502 - - - -642 074 - 642 074 - - -922 596 48 953 873 643 849 738 18 073 831 665
51 476 20 508 30 968 8 370 2 990 5 380
4 535 081 - 4 535 081 2 891 680 l 674 622 1 217 058 4 163 282 - 4 163 282 2 650 785 l 527 281 1 123 504
371 799 - 371 799 240 895 147 341 93 554
4 314 822 1 938 432 2 376 390 1 721 260 575 950 1 145 310 3 922 278 1 938 432 1 983 846 1 453 774 475 357 978 417 3 922 278 1 938 432 1 983 846 1 453 774 475 357 978 417 1 216 624 406 577 810 047 590 997 212 841 378 156 1 132 759 406 577 726 182 532 406 190 596 341 810
83 865 - 83 865 58 591 22 245 36 346 1 106 826 413 168 693 658 474 476 186 178 288 298 1 444 811 1 045 350 399 461 346 671 55 423 291 248
154 017 73 337 80 680 41 630 20 915 20 715
1 902 659 1 054 426 848 233 803 531 303 182 500 349 590 997 - 590 997 590 997 212 841 378 156 532 406 - 532 406 532 406 190 596 341 810
58 591 - 58 591 58 591 22 245 36 346 513 125 349 759 163 366 136 222 72 740 63 482 707 431 658 982 48 449 46 434 2 609 43 825
91 106 45 685 45 421 29 878 14 992 14 886
1 010 606 685 360 325 246 319 075 92 795 226 280 301 271 301 271 - - - -300 888 - 300 888 300 888 90 014 210 874 382 486 369 707 12 779 12 672 51 12 621
14 382 11 579 5 515 2 730 2 785 25 961
637 640 83 250 554 390 185 907 77 589 108 318 219 050 - 219 050 - - -193 776 - 193 776 - - -25 274 - 25 274 - - -
187 659 63 409 124 250 37 366 23 424 13 942 202 112 10 203 191 909 143 524 51 310 92 214
9 638 19 181 5 017 2 855 2 162 28 819
371 373 115 396 255 977 145 261 1 791 143 470 105 306 105 306 - - - -105 154 - 105 154 - - -152 782 6 458 146 324 144 041 1 453 142 588
3 632 4 499 1 220 338 882 8 131
392 544 - 392 544 267 486 100 593 166 893 357 687 243 354 89 651 153 703 357 687 -
34 857 - 34 857 24 132 10 942 13 190
Foreign born
9 565 536 7 922 135 7 922 135 3 323 164 2 960 314
362 850 2 765 027 1 046 570
787 374
872 025 ---
499 125 39 808
333 092
61 905 --
2 402 59 503
6 299 628 3 323 164 2 960 314
362 850 1 623 828
980 455 372 181
688 577 -
642 074 23 905 22 598
1 643 401 1 512 497
130 904
655 130 530 072 530 072 219 050 193 776 25 274
219 182 52 790 39 050
44 702 ---
27 144 2 015
15 543
6 171 --
107 6 064
368 483 219 050 193 776 25 274 86 884 48 385 14 164
110 716 -
105 154 2 283 3 279
125 058 114 333
10 725
493

Tobie 20. Persons in Families With Head or Wife of Foreign Stock by Type of Family, Foreign Stock Not in Families by Relationship, Nativity, and Country of Origin:
and Persons of 1970- Continued
U" ited States
IRElAND
Tolol ---- ------ --------------------All persons in families -----------------
With head or wife of foreign stock ____________ _ Head ________________ -- ________ ---- __ ----
Male ________________________ ------ ___ _
Female __ ---- ------ ---- ---------------Wh -------- - - --------Child of head ____________________________ _
Other relative of heod---------------------
With head native of foreign or mixed parentage __ Head •• ________ ---- ____________ ---- __ ----
Male ____ -- ______ -- -- ______ -- -- ____ ----Female ---- ------------ ----------------Wh _________________ _
Child of head_ ___________________________ _
Other relative of head----------------------
With wife native of foreign or mixed parentage, and head native of native parentage --------------H~d-----------------Wife •• ---- -------- -- -------------- -- ----Child of head----------------------------Other relative of heod----------------------
With head foreign born ----------------------Head •• ---- -- -- ---- -- -- -------------- ----
Male ______ ------ __ -------------- _____ _ Female •• -- __ ---- -- -- -- ---- ------ -- -- -
Wife -- __ -- -- ------ -- ---- ------ ---- ------Child of head ____________________________ _ Other relative of head _____________________ _
With wife foreign born, head native of native parentage ______ -------- ______ -------------
Head .• ____ -- ------ ------ ---- ------ -- -- --Wife -- __ -- -- -- -- ---- -- -------- ---- -- -- --Child of head ____________________________ _ Other relative of head _____________________ _
Persons not in families-----------------Unrelated individuals. _________________ -------Inmates of institutions-----------------------
NORWAY
Total ____ -------- __ ------------ ___ _ All persons in families -----------------
With head or wife of foreign stock ____________ _ Head ______ ---------- -- ---- ------------ --
Mole ________ -------- ________ -------- __ Female -- ____ ---- -- -- __ -------------- --
Wife -- __ -- ______ ------ ---- ------------ __ Child of head ____________________________ _ Other relative of head _____________________ _
With head native of foreign or mixed parentage __ Head ______ -------------------- _________ _
Male ______________ -------- ____ ------ __ Female •• __ -------- ---- -- -- -- -- ------ --
Wife -- __ •• ____ -------- __ ------ __ ------ __ Child of head ____________________________ _
Other relative of head----------------------
With wife native of foreign or mixed parentage, and head native of native parentage ______ ------ __
Head ____________________ ------------ ___ _ Wife ______ -------------------------- ___ _ Child of head -- __________________________ _ Other relative of head ______ ------------ ___ _
With head foreign born ----------------------Head __________ ---- __ ---------------- ___ _
Mole ____________________ ---------- ___ _ Female ____ -------- __ -------- __ ------ __
Wife -- __ -- ____ ---- ______ ------ -------- __ Child of head ____________________________ _
Other relative of head----------------------
With wife foreign born, head native of native
p~~e:.it~~~::::::::::::::::::::::::::::::::: w•------------------Child of head ____________________________ _ Other relative of head _____________________ _
Persons not in families ________________ _ Unrelated individuals ____________ ------------_ Inmates of institutions ---- ______ ------------ _
494
!Data based on 15-percent sample, see text. For meaning of symbols. see text]
Total
2 686 726 2 403 679 2 403 679
688 847 614 377
74 470 588 300
1 001 493 125 039
1 449 652 423 980 362 853
61 127 340 887 590 173
94 612
620 199 165 722 165 785 273 373
15 319
272 517 81 935 68 592 13 343 64 563
112 217 13 802
61 311 17 210 17 065 25 730
1 306
283 047 251 149
31 898
1 156 675 1 036 072 l 036 072
332 731 311 525
21 206 301 605 362 230
39 506
622 353 201 180 182 825
18 355 174 410 217 808
28 955
292 267 88 326 88 185
109 675 6 081
102 075 37 070 34 219
2 851 32 909 28 049
4 047
19 377 6 155 6 101 6 698
423
120 603 104 870
15 733
Native of native
parentage
1 267 697 1 267 697 l 267 697
182 932 182 932
209 073 828 634
47 058
784 680
197 676 552 335
34 669
444 016 165 722
270 571 7 723
19 639
11 397 4 204 4 038
19 362 17 210
1 524 628
545 467 545 467 545 467 94 481 94 481
116 289 316 984
17 713
326 116
107 056 206 407
12 653
199 687 88 326
108 092 3 269
12 785
9 233 1 928 1 624
6 879 6 155
557 167
Total
1 419 029 1 135 982 1 135 982
505 915 431 445 74 470
379 227 172 859 77 981
664 972 423 980 362 853
61 127 143 211 37 838 59 943
176 183
165 785 2 802 7 596
252 878 81 935 68 592 13 343 53 166
108 013 9 764
41 949
17 065 24 206
678
283 047 251 149
31 898
611 208 490 605 490 605 238 250 217 044
21 206 185 316 45 246 21 793
296 237 201 180 182 825
18 355 67 354 11 401 16 302
92 580
88 185 1 583 2 812
89 290 37 070 34 219 2 851
23 676 26 121
2 423
12 498
6 101 6 141
256
120 603 104 870
15 733
Foreign stock
Native of foreign or mixed parentage
Total
1 160 896 938 706 938 706 423 980 362 853
61 127 300 144 162 271 52 311
629 178 423 980 362 853
61 127 122 188 37 015 45 995
172 280
165 785 2 605 3 890
113 059
12 171 98 686 2 202
24 189
23 965 224
222 190 197 664 24 526
510 975 416 017 416 017 201 180 182 825
18 355 158 626
41 494 14 717
284 600 201 180 182 825
18 355 60 134 11 077 12 209
91 235
88 185 1 555 1 495
34 111
10 307 22 843
961
6 071
6 019 52
94 958 83 555 11 403
Foreign parentage
623 248 499 482 499 482 232 546 197 236 35 310
167 619 67 087 32 230
338 986 232 546 197 236 35 310 75 572 2 523
28 345
85 800
83 305 85
2 410
73 720
8 742 63 573
l 405
976
906 70
123 766 109 326
14 440
251 249 194 953 194 953 100 963
91 089 9 874
74 487 10 265 9 238
141 547 100 963
91 089 9 874
32 334 594
7 656
36 315
35 319
996
16 939
6 834 9 558
547
152
113 39
56 296 48 876
7 420
Mixed parentage
537 648 439 224 439 224 191 434 165 617 25 817
132 525 95 184 20 081
290 192 191 434 165 617 25 817 46 616 34 492 17 650
86 480
82 480 2 520 1 480
39 339
3 429 35 113
797
23 213
23 059 154
98 424 88 338 10 086
259 726 221 064 221 064 100 217 91 736
8 481 84 139 31 229
5 479
143 053 100 217
91 736 8 481
27 800 10 483 4 553
54 920
52 866 l 555
499
17 172
3 473 13 285
414
5 919
5 906 13
38 662 34 679 3 983
Foreign born
258 133 197 276 197 276
81 935 68 592 13 343 79 083 10 588 25 670
35 794
21 023 823
13 948
3 903
197 3 706
139 819 81 935 68 592 13 343 40 995 9 327 7 562
17 760
17 065 241 454
60 857 53 485 7 372
100 233 74 588 74 588 37 070 34 219
2 851 26 690 3 752 7 076
11 637
7 220 324
4 093
l 345
28 1 317
55 179 37 070 34 219
2 851 13 369 3 278 1 462
6 427
6 101 122 204
25 645 21 315 4 330
NATIONAL ORIGIN AND LANGUAGE
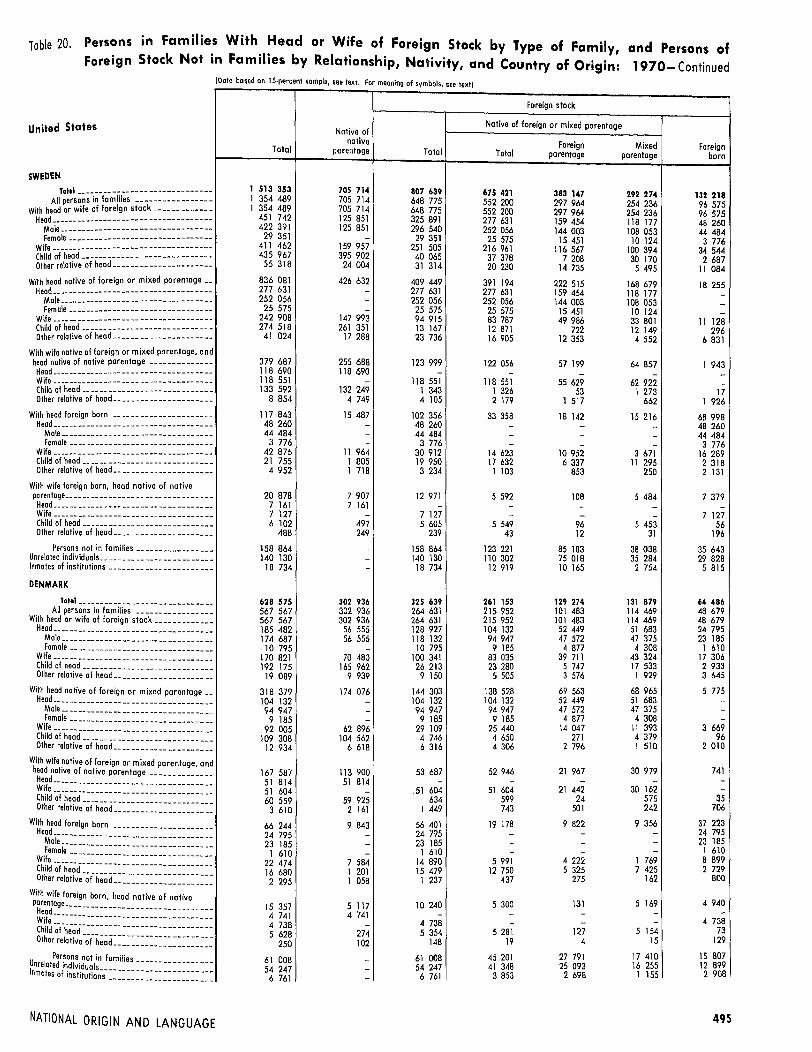
Table 20. Persons in Families With Head or Wife of Foreign Stock by Type of Family, Foreign Stock Not in Families by Relationship, Nativity, and Country of Origin:
!Data based on 15-porcent sample, see text. For meaning of symbols, see text}
Foreign stock
and Persons of 1970-Continued
United States Native of Native of foreign or mixed parentage
SWEDEN
Total __ ---- -- -- -- -- -- ------ -- ---- --All persons in families ----------------
With heod or wife of foreign stock---- -- ---- -- _ Head------ -- ------ -- -- -- -- ------ -- -- -- --
Mole ____ ------ -- -- -- -- -- -- -------- -- --Female -- -- ---- -- -- ---- -- -- -- -- ------ -
Wife -- -- -- -- -- -- -- -- -- -- -- -- -- -- -- -- -- --Child of head ____________________________ _
Other relative al heed __ -- -- -- -- -- -- - - -- -- --
With head native of foreign or mixed parentage --Head __ -- -- -- -- -- -- -- -- -- -- -- -- ------ -- __
Male-- -- -- ------ -- -- -- -- -- ---- -- -- -- -Female -- -- -- -- -- -- -- -- -- -- -- -- -- -- -- -
Wife -- -- -- ------ -- -- -- -- -- -- -- ---- -- -- --Child of head.----------------------------Other relative of head ____ -- -- -- -- ______ -- __
With wife native of foreign or mixed parentage, and head native of native parentage -- -- -- -- -- -- __ Head ____ ---- -- -- -- -- -- -- -- -- -- -- -- -- -- --Wife __ -- ---- ---- -- -- __________ ---- _____ _ Child of head-----------------------------Other relative of head _____________________ _
With head foreign born -- ________ -- _________ _ Head ____ -- -- -- -- -- -- -- -- -- -- -- -- -- -- -- --
Mole------ -- -- -- -- -- -- -- -- -- -- -- -- -- --Female -- ____ -- -- -- __ -- -- -- -- _________ _
Wife------ -- ---- -- -- ---- -- -- -- -- -- -- -- --Child of head ____________________________ _ Other relative of head ______ -- -- -- _________ _
With wife foreign born, head native of native parentage __ -- ______ -- -- ______ -- ______ -- __ _
Heod ___________________________________ _ Wife ___________________________________ _ Child of head ____________________________ _ Other relative of heod _____________________ _
Persons not in families ________________ _ Unrelated individuals ________________________ _ Inmates of institutions -- ____________________ _
DENMARK Total __________________________ -- __
All persons in families -----------------With head or wife of foreign stock ____________ _
Head ___________________________________ _ Mole ____________________ ---- _________ _ Female _______________________________ _
Wife -- _________________________________ _
Child of head-----------------------------Other relative of head _____________________ _
With heod native of foreign or mixed parentage __ Head ___________________________________ _ Mole _________________________________ _ Female -- ____ ---- ________________ -- -- __
~ii\d ~i-he_o_c=================== ======== Other relative of head _____________________ _
With wife .native of foreign or mixed parentage, and head native of native parentage ------ _______ _
ri~~r~~i~i,~=D~~~~;;;;~;~;;;~;~;~;;;~;~; Wi~h ~ad foreign born----------------------
J~~~e=== == ==== == == == == == == == == == == == == Child -;;-f-he-;;-d-- -- ---- -- -- -- -- -- -- -- -- -- -- --
Other relotive-~ft,;~d====================== With wife foreign born, head native of native
p~~~~~~============ ===== = == = = = == = == = == = = Child ~-fh;~d--- -- -- -- -- -- -- -- -- -- -- -- -- --
Other relative -~fh;~d======================
U Persons not in families-----------------nreloted individuals_ ____ _ Inmates of institutions __ --== == == == == ==== == == =
NATIONAL ORIGIN AND LANGUAGE
Total
1 513 353 1 354 489 1 354 489
451 742 422 391
29 351 411 462 435 967
55 318
836 OBI 277 631 252 056 25 575
242 900 274 518
41 024
379 687 118 690 118 551 133 592
8 854
117 843 48 260 44 484
3 776 42 876 21 755
4 952
20 B7B 7 161 7 127 6 102
488
158 864 140 130 18 734
628 575 567 567 567 567 185 482 174 687 10 795
170 821 192 175
19 089
318 379 104 132 94 947
9 185 92 005
109 308 12 934
167 587 51 814 51 604 60 559
3 610
66 244 24 795 23 185
l 610 22 474 16 680 2 295
15 357 4 741 4 738 5 628
250
61 008 54 247 6 761
native parentage Total
705 714 807 639 705 714 648 775 705 714 648 775 125 851 325 891 125 851 296 540
- 29 351 159 957 251 505 395 902 40 065
24 004 31 314
426 632 409 449 - 277 631 - 252 056 - 25 575
147 993 94 915 261 351 13 167
17 208 23 736
255 688 123 999 118 690 -
- 118 551 132 249 l 343
4 749 4 105
15 487 102 356 - 48 260 - 44 484 - 3 776
11 964 30 912 l 805 19 950 l 718 3 234
7 907 12 971 7 161 -
- 7 127 497 5 605 249 239
- 158 864 - 140 130 - 18 734
302 936 325 639 302 936 264 631 302 936 264 631
56 555 128 927 56 555 118 132
- 10 795 70 480 100 341
165 962 26 213 9 939 9 150
174 076 144 303 - 104 132 - 94 947 - 9 185
62 896 29 109 104 562 4 746
6 618 6 316
113 900 53 687 51 Bl4 -
- .51 604 59 925 634 2 161 1 449
9 843 56 401 - 24 795 - 23 185 - l 610
7 584 14 890 1 201 15 479 1 058 1 237
5 117 10 240 4 741 -
- 4 738 274 5 354 102 148
- 61 008 - 54 247 - 6 761
Foreign Mixed Foreign Total parentage parentage born
675 421 383 147 292 274 132 218 552 200 297 964 254 236 96 575 552 200 297 964 254 236 96 575 277 631 159 454 118 177 48 260 252 056 144 003 108 053 44 484
25 575 15 451 10 124 3 776 216 961 116 567 100 394 34 544
37 378 7 20B 30 170 2 687 20 230 14 735 5 495 11 084
391 194 222 515 168 679 18 255 277 631 159 454 11 B 177 -252 056 144 003 108 053 -
25 575 15 451 10 124 -83 707 49 986 33 801 11 128 12 871 722 12 149 296 16 905 12 353 4 552 6 831
122 056 57 199 64 057 1 943 - - - -
118 551 55 629 62 922 -l 326 53 1 273 17 2 179 1 517 662 1 926
33 358 18 142 15 216 68 998 - - - 48 260 - - - 44 484 - - - 3 776
14 623 10 952 3 671 16 289 17 632 6 337 11 295 2 318 1 103 853 250 2 131
5 592 108 5 484 7 379 - - - -- - - 7 127
5 549 96 5 453 56 43 12 31 196
123 221 85 183 38 038 35 643 110 302 75 018 35 284 29 828
12 919 10 165 2 754 5 815
261 153 129 274 131 879 64 486 215 952 101 483 114 469 4B 679 215 952 101 483 114 469 48 679 104 132 52 449 51 683 24 795 94 947 47 572 47 375 23 185
9 185 4 877 4 308 1 610 83 035 39 711 43 324 17 306 23 280 5 747 17 533 2 933 5 505 3 576 1 929 3 645
138 528 69 563 6B 965 5 775 104 132 52 449 51 683 -94 947 47 572 47 375 -9 185 4 877 4 308 -
25 440 14 047 11 393 3 669 4 650 271 4 379 96 4 306 2 796 1 510 2 010
52 946 21 967 30 979 741 - - - -
51 604 21 442 30 162 -599 24 575 35 743 501 242 706
19 17B 9 822 9 356 37 223 - - - 24 795 - - - 23 185 - - - 1 610
5 991 4 222 l 769 8 899 12 750 5 325 7 425 2 729
437 275 162 800
5 300 131 5 169 4 940 - - - -- - - 4 738
5 281 127 5 154 73 19 4 15 129
45 201 27 791 17 410 15 807 41 348 25 093 16 255 12 899 3 853 2 698 l 155 2 908
495

Table 20. Persons in Families With Head or Wife of Foreign Stock by Type of Family, Foreign Stock Not in Families by Relationship, Nativity, and Country of Origin:
and Persons of 1970- Continued
United States
NETHERLANDS
Total __ ------------ -- --------------All persons in families -----------------
With head or wife of foreign stock ____ ------ ---Head------------------------------------
Mole __ ------------ ______ --------------Femole ---------------- ---------------
Wife ---- -- ---- ------ ---- ----------------Child of head-----------------------------Other relative of head _____________________ _
With head native of foreign or mixed parentage_ -Head ____ --------------------------------Mole ____ ---- -- ____ -- -- ____ -------- __ _ -
Female --------·- __ ---- ---------------Wife---- -- ---- ---- -- ---- ----------------Child of heod.----------------------------Other relative of head _____________________ _
With wife native of foreign or mixed parentage, on head native of native parentage -------------
d -
Head ____ ---------------------------- ----Wh _________________ _ -
Child of head.----------------------------Other relative of head ____________________ _ -With head foreign born ----------------------
Head__----------------------------------Mole------------ ____ ------------------Female -- ---- ---- -- -- -- --------------
Wife -- -- ---- ---------- -- ---------- -------
Child of head -- ---- ---- -- ------ -----------Other relative of head ____________________ _ -With wife foreign born, head native of native parentage __________________________ ------
Head ________ -- ---- ---------------- -- ---Wife ________ ------ ____ ------------ ____ _ Child of head ___________________________ _ Other relative of head ____________________ _
Persons not in families---------------Unrelated individuals.----- -- ---- -----------Inmates of institutions----------------------
FRANCE
--------
Total ---------- ------ ---------- __ _ -All persons in families ---------------- --With head or wife of foreign stock ___________ _
Head ____ -- -- -- -- -- -- -- -- -- ------ -- -- -- - -Male ________ -------- __ ------ ________ _ -Female __ ------------------ __________ _ -Wile __ ---------------------------- -- -- --Child of head -- __________ ---- ______ ------ -Other relative of head ____________________ _ -
With head native of foreign or mixed parentage_ Head __ -------- __ -- ---- __ ------------ __ _
Mole ____ ------------ __ -------- ______ _ Female -- ---- ---- ------ -------------- _
Wife ____ -- __ ---------- ---------------- _ Child of head ___________________________ _ Other relative of head ____________________ _
With wife native of foreign or mixed parentage, on head native of native parentage -------------
~~f~ :: :: :: :: :: :::: :: :: :: :: :: :: :: :::: :: : Child of head ___________________________ _ Other relative of head __ ------------------_
With head foreign born -------------------- _ Head ______ -----------------------------
Male--------------------------------Female __ -------------------- __ ------ _
Wife ____ ------------------------------_ Child of head ___________________________ _
-------d -----------Other relative of head ____________________ _ -
With wife foreign born, head native of native
PH~~~~~~:::::::::::::::::::::::::::::::: Wife------ __ --------------------------_ Child of head ___________________________ _ Other relative of head ____________________ _
-----
Persons not in fomili·es ----------------Unrelated individuals ______ ------------------Inmates of institutions ______ ----------------
---
496
(D ta based an 15 percent sample see text. for meaning of symbols, see text) a .
Native of native
Total parentage Toto!
716 334 333 626 382 708 669 179 333 626 335 553 669 179 333 626 335 553 191 610 50 857 140 753 182 206 50 857 131 349
9 404 - 9 404 178 338 65 684 112 654 282 591 208 946 73 645
16 640 8 139 8 501
340 154 197 573 142 581 97 342 - 97 342 90 349 - 90 349
6 993 - 6 993 87 721 54 340 33 381
144 735 137 900 6 835 10 356 5 333 5 023
155 553 112 068 43 485 42 183 42 183 -42 021 - 42 021 68 886 68 435 451
2 463 1 450 1 013
144 202 14 617 129 585 43 411 - 43 411 41 000 - 41 000
2 41 l - 2 411 39 952 11 344 28 608 57 409 2 076 55 333
3 430 1 197 2 233
29 270 9 368 J9 902 8 674 8 674 -8 644 - 8 644
11 561 535 11 026 391 159 232
47 155 - 47 155 42 426 - 42 426 4 729 - 4 729
525 389 210 981 314 408 468 613 210 981 257 632 468 613 210 981 257 632 145 815 50 321 95 494 133 364 so 321 83 043
12 451 - 12 451 129 842 43 045 86 797 174 580 109 670 64 910
18 376 7 945 10 431
207 945 110 548 97 397 65 844 - 65 844 58 292 - 58 292
7 552 - 7 552 55 815 36 679 19 136 75 386 68 897 6 489 10 900 4 972 5 928
107 081 71 384 35 697 32 678 32 678 -32 640 - 32 640 39 228 37 289 1 939
2 535 l 417 l 118
90 340 10 008 80 332 29 650 - 29 650 24 751 - 24 751
4 899 - 4 899 23 857 6 366 17 491 32 774 2 380 30 394
4 059 1 262 2 797
63 247 19 041 44 206 17 643 17 643 -17 530 - 17 530 27 192 l 104 26 088
882 294 588 56 776 - 56 776 52 419 - 52 419 4 357 - 4 357
Foreign stock
Native of foreign or mixed parentage
Foreign Mixed Foreign Total parentage parentage born
271 005 126 458 144 547 111 703 240 278 110 061 130 217 95 275 240 278 110 061 130 217 95 275 97 342 46 945 50 397 43 411 90 349 43 474 46 875 41 000 6 993 3 471 3 522 2 411 78 506 36 921 41 585 34 148 59 631 23 556 36 075 14 014 4 799 2 639 2 160 3 702
136 895 65 532 71 363 5 686 97 342 46 945 50 397 -90 349 43 474 46 875 -6 993 3 471 3 522 -29 313 16 020 13 293 4 068 6 716 510 6 206 119 3 524 2 057 1 467 1 499
43 030 16 610 26 420 455 - - - -42 021 16 307 25 714 -439 22 417 12 570 281 289 443
49 440 27 643 21 797 80 145 - - - 43 411 - - - 41 000 - - - 2 411 7 172 4 594 2 578 21 436
41 655 22 797 18 858 13 678 613 252 361 1 620
JO 9J3 276 JO 637 8 989 - - - -- - - 8 644 10 821 227 10 594 205
92 49 43 140
30 727 16 397 14 330 16 428 27 766 14 639 13 127 14 660
2 961 1 758 1 203 1 768
220 086 79 163 140 923 94 322 183 467 63 186 120 281 74 165 183 467 63 186 120 281 74 165 65 844 26 969 38 875 29 650 58 292 23 720 34 572 24 751 7 552 3 249 4 303 4 899
53 850 23 680 30 170 32 947 58 557 9 708 48 849 6 353 5 216 2 829 2 387 5 215
91 930 38 874 53 056 5 467 65 844 26 969 38 875 -58 292 23 720 34 572 -
7 552 3 249 4 303 -15 976 9 308 6 668 3 160 6 195 456 5 739 294 3 915 2 141 l 774 2 013
35 149 10 944 24 205 548 - - --
32 640 10 708 21 932 -l 939 5 1 934 -
570 231 339 548
30 670 13 099 17 571 49 662 - - - 29 650 - - - 24 751 - - - 4 899
5 234 3 664 ) 570 12 257 24 839 9 047 15 792 5 555
597 388 209 2 200
25 718 269 25 449 18 488 - - --- - - 17 530
25 584 200 25 384 504 134 69 65 454
36 619 15 977 20 642 20 157 33 322 14 407 18 915 19 097 3 297 1 570 l 727 1 060
NATIONAL ORIGIN AND LANGUAGE

Table 20. Persons in Families With Head or Wife of Foreign Stock by Type of Family, Foreign Stock Not in Families by Relationship, Nativity, and Country of Origin:
and Persons of 1970-Continued
[Dalo based an 15·percent sample, S86 text. For meaning of symbols, •eo 1ex11
United States
GERMANY
Total---------- -- ---- -- -------- ----All persons in families ----------------
With head or wife of foreign stock -- ---- ---- -- -Head •• -- -- -- -- ---- -- -- -- -- -- -- -- -- -- -- -
Mole __ -- -- -- -- -- -- -- -- -- -- -- -- -- -- -- -Female -- -- -- -- -- -- -- -- -- -- -- -- -- -- -- -
Wife -- ---- -- -------- -- -- -- -- ---- -- -- -- --Child of head -- -- -- -- -- -- -- -- -- -- -- -- -- -- -Other relative of head----------------------
With head native of foreign or mixed parentage --Head __ -- -- -- -- -- -- -- -- -- -- -- -- -- -- -- -- -
Male-------------- -- -- -- -- ------ -- -- --female ____ -- -- -- -- -- -- -- -- -- -- -- -- -- --
Wife -- ---- -- -- -- -- -- -- -- -- -- -- -- -- - - -- --Child of head----------------------------Other relative of head----------------------
With wife native of foreign or mixed parentage, ond head native of native parentage _____________ _
Head ____ ---- -- ---- -- -- -- -- -- -- ---- -- -- --Wife -- ---- -- -- ------ -- -- -- -- ------ -- -- --Child of head-----------------------------Other relative of head __ -- -- -- ____ -- -- -- -- --
With head foreign barn ----------------------Head ___________________________________ _ Mole __ ---- __________ -- -- _____________ _
female ____ -- ---- -- -- -- -- -- -- -- -- -- -- --Wife------ -- -- ---- -- -- -- -- -- -- -- -- -- -- --Child of head ______________ -------------- -Other relative of head.---------------------
With wife foreign born, heed native of native parentage.--------- -- -- -- -- -- -- -- -- -- -- -- -Head __________________________ -- _______ _
Wife---- -- -- -- ---- -- ---- -- __ -- -- -- -- -- --Child of head---------------------------- -Other relative of head •• __________ -- _______ _
Persons not in families---------------- -Unrelated individuals __________ -- ______ -- -- __ -Inmates of institutions _____________________ _ -
POIAND Tola[ _____________________________ _
All persons In families ----------------With head or wife of foreign stock ________ •• __
Head •• ---- __ ------ ____________ -- __ •• -- -
---Mole __ ---- ________ -- -- ______ -- -- -- -- --Female ---- __________________________ _
Wife ________________ ---- ______________ _
Child of head -- ____ -- __ -- -- -- -- -- -- -- -- __ Other relative of head ____ ---- ____ ---- ____ _
----
With head native of foreign or mixed parentage • Head ______________________ •• __ •• ______ _ --Mole ________ -·-· _____________________ _
wfr:~~~e_ :::::::::: :: :::: :: :: :: :: :: :: :: :-Child of head __________________ •• _______ _ Other relative of head •• __________________ _
---
With wife ~alive of foreign or mixed parentage, an h~od dative of native parentage --------------
~~~~ :::::::: :::: :: :: :: :: :: :: :: :: :: :: :: : d
-Other
0/e1~~rvde -~ii,;-·- -- -- -- -- -- -- -- -- ·- --ad __ •• ________________ _ ---
W~h hJ°d foreign born ____________________ _
r;t~~ ~:~~~~:~ ~~:~~~::~~:~::~~ ~ ~:: Other ~~l~~~v~ -~ii,;~d:::::::::::::::::::::
-------
With wife foreign born, head native al native parentage
~Ii~::::=:::::::::::::::::::::::::::::: Child ofheod -------- ---------------
Other relotive-~ii;;~d:::::::::::::::::::::
-----U 1 Persons not in families---------------nre Died individuals
Inmates of institution·s· :: :: :: :: :: :: :: :: : : :: :: ---
NATIONAL ORIGIN AND LANGUAGE
Total
5 914 499 5 255 575 5 255 575 l 734 234 l 607 476
126 758 I 562 259 1 741 972
217 110
2 803 522 949 612 852 724 96 888
815 541 887 707 150 662
l 228 772 392 299 392 057 413 769
30 647
789 046 272 354 242 484
29 870 235 302 252 038 29 352
434 235 119 969 119 359 188 458
6 449
658 924 596 179 62 745
4 188 216 3 890 325 3 890 325 1 147 604 I 051 117
96 487 I 010 839 1 562 775
169 107
2 559 500 740 237 669 696
70 541 639 046
I 056 377 123 840
654 022 177 391 176 598 284 777
15 256
646 690 220 522 194 576 25 946
185 757 211 052
29 359
30 113 9 454 9 438
10 569 652
297 891 276 912
20 979
Native of native
parentage Total
2 451 523 3 462 976 2 451 523 2 804 052 2 451 523 2 804 052
512 268 1 221 966 512 268 1 095 208 - 126 758 574 239 988 020
l 264 841 477 131 100 175 116 935
1 428 855 1 374 667 - 949 612 - 852 724 - 96 888
517 249 298 292 839 873 47 834
71 733 78 929
817 050 411 722 392 299 -- 392 057 407 149 6 620
17 602 13 045
76 449 712 597 - 272 354 - 242 484 - 29 870
56 990 118 312 10 837 241 201 8 622 20 730
129 169 305 066 119 969 -- 119 359
6 982 181 476 2 218 4 231
- 658 924 - 596 179 - 62 745
1 776 921 2 411 295 l 776 921 2 113 404 I 776 921 2 113 404
186 845 960 759 186 845 864 272
- 96 487 246 218 764 621
1 287 209 275 566 56 649 112 458
1 267 713 1 291 787 - 740 237 - 669 696 - 70 541
230 777 408 269 996 137 60 240
40 799 83 041
465 904 188 118 177 391 -- 176 598 282 040 2 737
6 473 8 783
32 475 614 215 - 220 522 - 194 576 - 25 946
15 441 170 316 7 866 203 186 9 168 20 191
10 829 19 284 9 454 -- 9 438 I 166 9 403
209 443
- 297 891 - 276 912 - 20 979
Foreign stock
Native of foreign or mixed parentage
Foreign Mixed Foreign Total parentage parentage born
2 669 031 , 200 599 l 468 432 793 945 2 153 648 926 606 1 227 042 650 404 2 153 648 926 606 1 227 042 650 404
949 612 454 286 495 326 272 354 852 724 405 156 447 568 242 484 96 880 49 130 47 758 29 870
694 396 333 166 361 230 293 624 435 055 96 964 338 091 42 076 74 585 42 190 32 395 42 350
l 317 100 641 668 675 432 57 567 949 612 454 286 495 326 -852 724 405 156 447 568 -96 888 49 130 47 758 -259 772 149 428 110 344 38 520 46 505 2 984 43 521 l 329 61 211 34 970 26 241 17 718
405 964 159 458 246 506 5 758 - - - -
392 057 155 071 236 986 -6 484 125 6 359 136 7 423 4 262 3 161 5 622
251 678 123 969 127 709 460 919 - - - 272 354 - - - 242 484 - - - 29 870
42 567 28 667 13 900 135 745 204 239 92 644 111 595 36 962
4 872 2 658 2 214 15 858
178 906 l 511 177 395 126 160 - - - -- - - 119 359
177 827 l 211 176 616 3 649 1 079 300 779 3 152
515 383 273 993 241 390 143 541 465 146 243 984 221 162 131 033 50 237 3() 009 20 228 12 508
1 818 040 1 323 436 494 604 593 255 1 626 702 1 173 181 453 521 486 702 I 626 702 1 173 181 453 521 486 702
740 237 577 781 162 456 220 522 669 696 519 776 149 920 194 576
70 541 58 005 12 536 25 946 601 640 445 943 155 697 162 981 229 054 104 351 124 703 46 512
55 771 45 106 10 665 56 687
1 214 257 905 577 308 680 77 530 740 237 577 781 162 456 -669 696 519 776 149 920 -
70 541 58 005 12 536 -370 402 285 374 85 028 37 867
58 303 5 083 53 220 l 937 45 315 37 339 7 976 37 726
183 363 117 200 66 163 4 755 - - - -
176 598 113 931 62 667 -2 597 132 2 465 140 4 168 3 137 l 031 4 615
219 866 149 776 70 090 394 349 - - - 220 522 - - - 194 576 - - - 25 946
54 640 46 638 8 002 ll5 676 159 099 98 619 60 480 44 ()87
1 608 14 064 6 127 4 519
9 216 628 0 588 10 068 - - - -- - - 9 438
9 055 517 8 538 348 161 111 50 282
191 338 150 255 41 083 106 553 179 361 140 455 38 906 97 551
11 977 9 800 2 177 9 002
497

Tobie 20. P . Families With Head or Wife of Foreign Stock by Type of Family, and Pers ersons 1n • . • d . , ons of
Foreign Stock Not in Families by Relationship, Nativity, an Country of Origin: 1970-Continuea
United States
CZECHOSLOVAKIA
Total -- -- ------ -- -- -- -- ------ ---- --All persons in families ----------------
With head or wife of foreign stoc~ -------------Head __ -- -- ---- ---- -- ---- -- -- ---- -- -- -- -
Mole------------------ -- ---- ---------Female ---------------- ---------------
W~ ------------------Child of head-----------------------------Other relative of head _____________________ _
With head native of foreign or mixed parentage --Head __ -- -- -- -- -- -- -- -- -- -- -- ---- -- -- ---
Male -- -- -- -- ------ -- -- -- -- ---- -- -- -- --Female __ -- ____________ -- __ ------ -- ----Wife -- __ ---- -------- -------- ------ ------Child of head·----------------------------Other relative of head __ ------ -- ------ -- ----
d With wife native of foreign or mixed parentage, on head native of native parentage --------------Head ______ -- ------ -- -- -- -- -- ---- -- ---- --w• ------------------Child of head ___________________________ _ -Other relative of head __ ---- ____ -------- -- --
With head foreign barn ----------------------Head __________________________________ _ . Mole -- -- -- -- -- -- -- -- -- -- -- ---- -- -- -- --Fe mole __ -- __________ -- -- ____ -- __ -- -- --
Wife ---- ---- __ -- ------------------------Child of head ___________________________ _ -Other relative of head ____________________ _ -With wife foreign born, head native of native parentage __ -- __ ---- ____ -- __ -- -- -- -- __ -- -- -Head ________________________ ------ ____ _ -Wife -- ------ __ ------ ------ -------- -- ----Child of head ____ -- -- ________ -- -- -- __ -- -- -Other relative of head ____________________ _ -
Persons not in families ____ ------------ -IJnrelated individuals _______________________ _ -Inmates of institutions---------------------- -AUSTRIA
Total ____________________________ _ -
Ail persons in families ---------------- -With head or wife of foreign stock ___________ _ -Heo d __________ ---- ________ ---- ________ _ -
Mole -- -- -- -- ---- -- -- -- -- -- -- -- -- -- -- --Female ______________________________ _ -Wife ________ ---------- ______ ----------_ -
Child of heod---------------------------- -Other relative of head ____________________ _ -
With head native of foreign or mixed parentage _ Head __________________________________ _ --Male -- ---------- ---- ________________ _
female ____ -------- ____ ---- __ -------- _
w~------------------Child of head·---------------------------Other relative of head ____________________ _
-----
With wife .native of foreign or mixed parentage, an head native of native parentage -------------
~eif~ :::::::::::::::: :::: :: :: ::::::::::: Child of heod----------------------------Other relative of head ____________________ _
d -----
With head foreign born-------·-------------
~j~i;,~~irn=:~~~-:j~:):!:):!:~ Other relative of head ____________________ _
-------
With wife foreign born, heod notive of native
p~~~t~~;;;f J~~~~~~~~~~~~==============:= Other relative of head _____ ::::::::::::::::
-. ---
Persons not in families Unrelated individuals.. -- ---- ----------Inmates of institvtions ::::::::::::::::::::::
---
498
!D t bas don 15 porcent sample, see text. For moaning of symbols, see text] 0 0 e
Native of native
Total parentage Total
1 401 096 647 008 754 088 l 298 447 647 008 651 439 l 298 447 647 008 651 439
385 410 84 861 300 549 355 608 84 861 270 747
29 802 - 29 802 342 322 104 918 237 404 516 666 436 686 79 980
54 049 20 543 33 506
817 433 427 538 389 895 239 325 - 239 325 217 538 - 217 530
21 787 - 21 787 207 160 98 020 109 140 331 896 315 003 16 893 39 052 14 515 24 537
280 252 198 021 82 231 77 439 77 439 ... 77 303 - 77 303
118 814 117 486 1 328 6 696 3 096 3 600
175 728 12 819 162 909 61 224 - 61 224 53 209 - 53 209 8 015 - 8 015
50 502 6 898 43 604 56 278 3 282 52 996 7 724 2 639 5 085
25 034 8 630 16 404 7 422 7 422 7 357 - 7 357 9 67B 915 a 763
577 293 284
102 649 - 102 649 96 019 - 96 019 6 630 - 6 630
1 736 322 762 502 973 820 1 589 229 762 502 826 727 I 589 229 762 502 626 727
493 232 104 375 388 857 453 637 104 375 349 262
39 595 - 39 595 438 552 125 782 312 770 587 976 507 708 80 260
69 469 24 637 44 832
1 032 848 505 163 527 685 314 692 - 314 692 283 985 - 283 985
30 707 - 30 707 271 765 115 264 156 501 395 849 373 I 16 22 733 so 542 16 783 33 759
327 107 228 272 98 835 93 223 93 223 93 031 - 93 031
132 244 130 998 1 246 8 609 4 OS! 4 550
192 799 16 755 176 044 14 165 - 74 165 65 277 - 65 277 a 888 - 8 808 62 513 10 518 51 995 46 640 2 815 43 625 ? 481 3 422 6 059
36 475 12 312 24 163 11 152 71 152 -11 243 - I I 243 13 243 719 12 464
837 381 456 147 093 147 093 -136 523 - I 36 523
10 570 - 10 570
Foreign stock -Native of foreign or mixed parentage -
Foreign Mixed Foreign Total parentage parentage born -
589 135 384 836 204 299 518 632 334 504 184 128 )#4 fJI
518 632 334 504 184 128 132 807 239 325 167 687 71 638 132 807 217 538 151 223 66 315 61 224
21 787 16 464 5 323 53 WI
190 510 127 143 63 367 8 015 71 005 26 083 44 922 46 894 17 792 13 591 4 201
8 975 IS 714
368 304 250 655 117 649 21 591 239 325 167 687 71 638 217 538 151 223 66 315 -
21 787 16 464 5 323 -98 022 70 522 27 500 JI 118 16 533 1 291 15 242 360 14 424 11 155 3 269 JO 113
80 166 45 428 34 738 2065 .. -77 303 44 176 33 127 -l 271 36 I 235 -
57 I 592 1 216 376 2008 61 •125 38 211 23 214 101 484 - 61 224 ... - 53 209 - 8 015 15 105 12 445 2 740 28 419 44 574 24 599 19 975 8 422
1 666 l 167 499 3419
8 1:11 210 8 527 ) h61 - -- 7 357
6 (,27 157 8 470 136 110 53 57 174
70 503 50 332 20 171 32 146 66 3:l5 47 084 19 25) 29.!N 4 168 3 248 920 2462
7S8 078 517 052 241 026 215742 663 021 445 431 217 590 163 706 663 021 445 431 217 590 ld3 100 314 692 231 716 82 976 74165 283 ?OS 208 242 75 743 65 277
30 707 23 474 7 233 8888 250 061 174 140 75 921 62709 '/4 3:13 20 551 53 782 5935 2:1 935 19 024 4 911 20897
494 9:l2 352 353 \42 579 32753 314 692 ?.31 716 82 976 -283 985 208 242 75 743 -
30 707 23 474 7 233 -138 220 103 023 35 197 18281 22 1.17 I 499 20 638 596 19 883 16 115 3 768 13876
96 239 57 234 39 005 259! ---·
93 031 55 749 37 282 18 I 220 19 1 209
1 980 l 466 514 2578
59 420 35 723 23 697 116624 74165 -.,
65277 -- 8888
18 810 15 368 3 442 33 185 5175 38 650 18 937 19 713 4099 1 960 I 418 542
12 430 121 12 309 11733 ., - IJ 241 '" - 146
12 318 96 12 222 344
112 25 87
95 057 71 621 23 436 52036 46802
89 721 67 431 22 290 5234 5 336 4 190 1 146
NATIONAL ORIGIN AND LANGUAGI
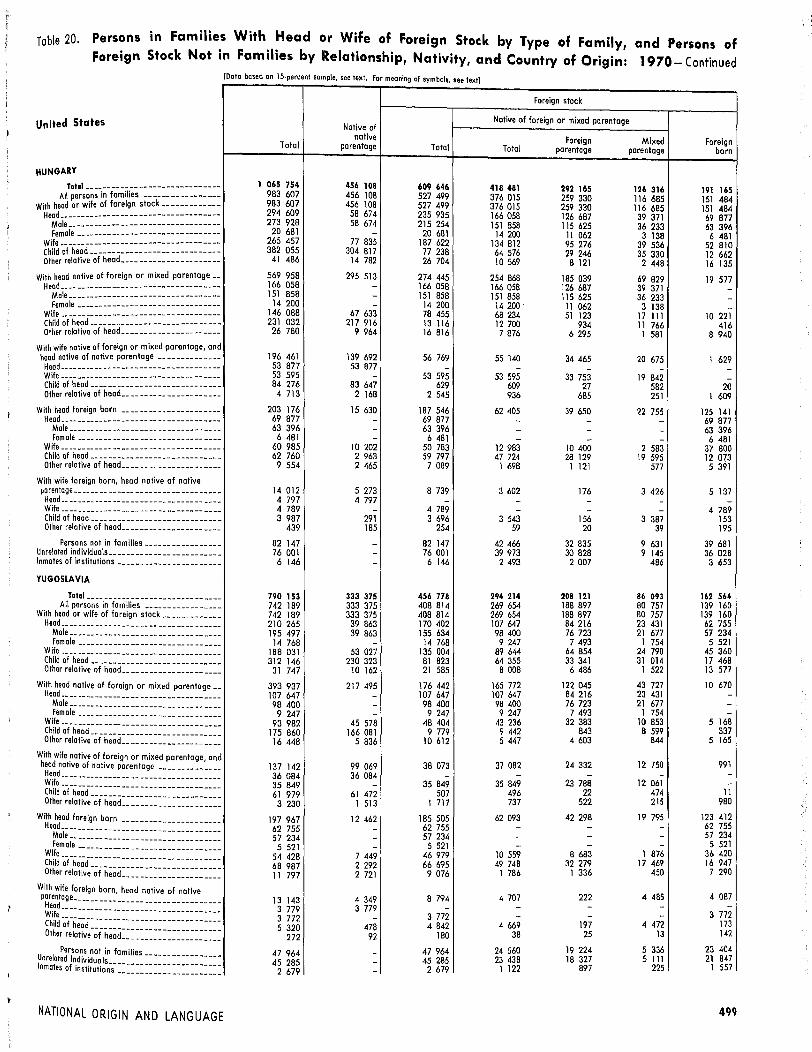
Table 20. Persons in Families With Head or Wife of Foreign Stock by Type of Family, Foreign Stock Not in Families by Relationship, Nativity, and Country of Origin:
[Dato based on 15-percent sample, see text. For meaning of symbols, see text]
Foreign stock
and Persons of 1970- Continued
United States Native of Native of foreign or mixed parentage
HUNGARY
Total __ -- -- -- -- -- -- -- -- -- -- -- -- -- --All persons in families -----------------
With head or wife of foreign stock ____ ---------Head-- -- -- -- -- -- -- -- -- -- -- -- -- -- -- -- -- -
Mole -- -- -- -- -- -- -- -- -- -- -- -- -- -- -- -- -Female -- -- ------------ -- -------------
Wife---- -- -- ---- -- -- -- -- -- ---- ---- -- ----Child of head-----------------------------Other relative of head ____ -- -- -------- ------
With head native of foreign or mixed parentage --Head __ -- -- -- -- -- -- -- -- -- -- -- -- -- -- -- __ -
Mole -- __ -- -- -- -- -- -- -- -- -- -- -- -- -- -- -Female -- -- -- -- -- -- -- -- -- -- -- -- -- -- -- -
Wife -- -- -- -- -- -- -- -- -- -- -- -- -- -- -- -- -- --Child of heed__ -- -- -- -- -- -- -- -- -- -- -- -- -- -Other relative of head ________ -- ___________ _
With wife native of foreign or mixed parentage, and head native of native parentage -- ___________ _ Head-- -- -- -- -- -- -- -- -- -- -- -- ---- -- -- -- -Wife -- -- -- -- -- -- -- -- -- -- -- -- -- -- -- -- -- --Child of head -- -- -- -- -- -- -- -- ______ -- -- __ _ Other relative of head ____ -- -- -- ------ _____ _
With head foreign born ----------------------Head __ -- -- -- -- -- -- -- -- -- -- -- -- ---- -- -- --Mole __________ ---- ________ ------ _____ _
Female ____ ---- ____________ ------ _____ _ Wife -- -- ---- -- ---- -- -- -- -- -- -- ---- -- ----Child of head-----------------------------Other relative of heed _____________________ _
With wife foreign born, head native of native parentage __________ ---- __________________ _
Head ___________________________________ _
Wife ________ -- -- -- -- -- -- -- -- -- -- -- -- ----Child of head ______ ---- __ -- -- ____________ _ Other relative of head _____________________ _
Persons not in families-----------------Unrelated individuals ________________________ _ Inmates of institutions ______________________ _
YUGOSLAVIA
Total __________________ -- -- -- -- ----All persons in families __________ ------ _
With head or wife of foreign stock ____________ _ Head_ __________________________________ _ Mole __________ -- ____________ -- -- -- ----Female _______________________________ _
Wife ___________________________________ _ Child of head ___________________________ _ -Other relative of head _____________________ _
With head native of foreign or mixed parentage __ Head ___________________________________ _ Mole _________________________________ _ Female _______________________________ _
Wife ____ ---- __________________ ---- ____ --Child of head_ ___________________________ _ Other relative of head _____________________ _
With wife .native of foreign ar mixed parentage, and head native of native parentage --------------
~~~ ~=f =~;;i:============================ -Other relative of head _____________________ _
-
Wi~h head foreign born----------------------
~O;h~~;,~~;:):~=j~~~m=j~~rn~~:rn~:)~ t er relative of head _____________________ _
-
-
With wife foreign born, heed native of native
"tl~~i~=~;~~~~j~:)~)~=~~~~~~~j~~=j: ---
Persons not in families---------------Unrelated individuo Is Inmates of institution_s_ == == == == == == == == == == ==
NATIONAL ORIGIN AND LANGUAGE
Total
1 065 754 983 607 983 607 294 609 273 928
20 681 265 457 382 055
41 486
569 958 166 058 151 858
14 200 146 088 231 032
26 780
196 461 53 877 53 595 84 276
4 713
203 176 69 877 63 396 6 481
60 985 62 760 9 554
14 012 4 797 4 789 3 987
439
82 147 76 001 6 146
790 153 742 189 742 189 210 265 195 497
14 768 188 031 312 146
31 747
393 937 107 647 98 400 9 247
93 982 175 860 16 448
137 142 36 084 35 849 61 979 3 230
197 967 62 755 57 234 5 521
54 428 68 987 11 797
13 143 3 779 3 772 5 320
272
47 964 45 285
2 679
native parentage Total
456 108 609 646 456 108 527 499 456 108 527 499 58 674 235 935 58 674 215 254
- 20 681 77 835 187 622
304 817 77 238 14 782 26 704
295 513 274 445 - 166 058 - 151 858 - 14 200
67 633 78 455 217 916 13 116
9 964 16 816
139 692 56 769 53 877 -
- 53 595 83 647 629
2 168 2 545
15 630 187 546 - 69 877 - 63 396 - 6 481
10 202 50 783 2 963 59 797 2 465 7 089
5 273 8 739 4 797 -
- 4 789 291 3 696 185 254
- 82 147 - 76 001 - 6 146
333 375 456 778 333 375 408 814 333 375 408 814 39 863 170 402 39 863 155 634
- 14 768 53 027 135 004
230 323 81 823 10 162 21 585
217 495 176 442 - 107 647 - 98 400 - 9 247
45 578 48 404 166 081 9 779
5 836 10 612
99 069 38 073 36 084 -
- 35 849 61 472 507
1 513 1 717
12 462 185 505 - 62 755 - 57 234 - 5 521
7 449 46 979 2 292 66 695 2 721 9 076
4 349 8 794 3 779 -
- 3 772 478 4 842
92 180
- 47 964 - 45 285 - 2 679
foreign Mixed Foreign Total parentage parentage born
418 481 292 165 126 316 191 165 376 015 259 330 116 685 151 484 376 015 259 330 116 685 151 484 166 058 126 687 39 371 69 877 151 858 115 625 36 233 63 396
14 200 11 062 3 138 6 481 134 812 95 276 39 536 52 810
64 576 29 246 35 330 12 662 10 569 8 121 2 448 16 135
254 868 185 039 69 829 19 577 166 058 126 687 39 371 -151 858 115 625 36 233 -
14 200 11 062 3 138 -68 234 51 123 17 111 10 221 12 700 934 11 766 416 7 876 6 295 1 581 8 940
55 140 34 465 20 675 1 629 - - - -
53 595 33 753 19 842 -609 27 582 20 936 685 251 1 609
62 405 39 650 22 755 125 141 - - - 69 877 - - - 63 396 - - - 6 481
12 983 10 400 2 583 37 800 47 724 28 129 19 595 12 073
1 698 l 121 577 5 391
3 602 176 3 426 5 137 - - - -- - - 4 789
3 543 156 3 387 153 59 20 39 195
42 466 32 835 9 631 39 681 39 973 30 828 9 145 36 028 2 493 2 007 486 3 653
294 214 208 121 86 093 162 564 269 654 188 897 80 757 139 160 269 654 188 897 80 757 139 160 107 647 84 216 23 431 62 755 98 400 76 723 21 677 57 234 9 247 7 493 1 754 5 521
89 644 64 854 24 790 45 360 64 355 33 341 31 014 17 468
8 008 6 486 1 522 13 577
165 772 122 045 43 727 10 670 107 647 84 216 23 431 -98 400 76 723 21 677 -9 247 7 493 1 754 -
43 236 32 383 10 853 5 168 9 442 843 8 599 337 5 447 4 603 844 5 165
37 082 24 332 12 750 991 - - - -
35 849 23 788 12 061 -496 22 474 11 737 522 215 980
62 093 42 298 19 795 123 412 - - - 62 755 - - - 57 234 - - - 5 521
10 559 8 683 1 876 36 420 49 748 32 279 17 469 16 947 1 786 1 336 450 7 290
4 707 222 4 485 4 087 - - - -- - - 3 772
4 669 197 4 472 173 38 25 13 142
24 560 19 224 5 336 23 404 23 438 18 327 5 111 21 847 1 122 897 225 1 557
499
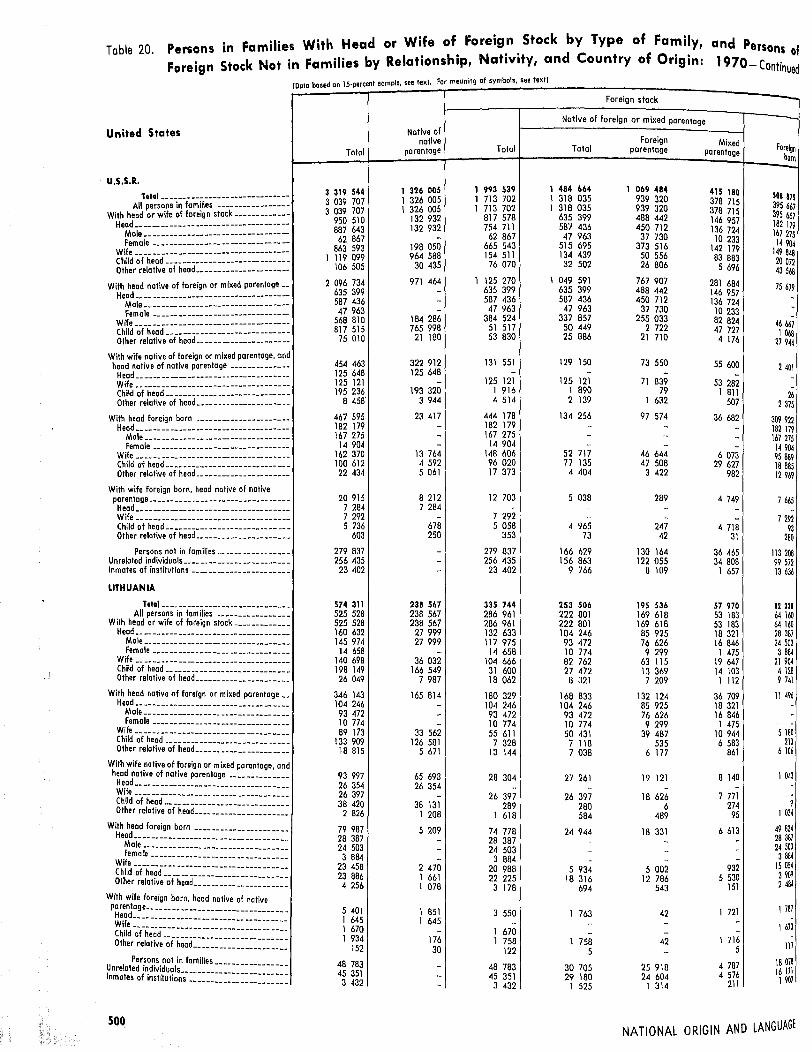
Tobie 20. Persons in families With Head or Wife of foreig.n. Stock by Type of Family, foreign Stock Not in Families by Relationship, Nat1v1ty, and Country of Origin:
and Persons of 1970- Continued
United States
u.s.s.R. Total---------------------------- --
All persons in families ----------------With heod or wife of foreign stock-------------
Head ____________ -------- ------------ -- --M•----------------Female ---- ------------ ------ -------- -
Wh --- ---------------Child of heod-----------------------------Other relative of head •• --------------------
With head notive of foreign or mixed parentage --Head ____ ---- -- ------ -- ---- -- ---- ---- -- --
Mole-------------- -- -------------- -- -Female ------ -------------------------
Wh - - --- -------------Child of head .••• -------------------------Other relative of head _____________________ _
With wife native of foreign or mixed parentage, and head native of notive parentage --------------
Head ____ -- -- -- -- -- -- -- ---- -· -----· ---- --Wife __ ---- -- -- ---- -- ---------------- ----Child of head·----------------------------Other relative of head _____________________ _
With head foreign born ----------------------Heod •• __ -- -- -- __ -- -- -- -- -- -- ------ ---- -
Mole -- -- -- -- -- -- -- -- -- -- -- -- -- -- -- -- -female -- ---- ------ -------------------
Wife -- ---- -- -- --------------------------Child of head ____ -------- __ ---- __ ---- -- __ _ Other relative of head _____________________ _
With wife foreign born, head native of native parentage ________ ------ -- -- ---- -------- ---Head ____ -- __ -- __ -- __ -- -- -- -- ------ ---- --Wife ------ ____ ------ ________ ------------Child of head.. __________________________ _ Other relative of head _____________________ _
Persons not in families-----------------Unrelated individuals •• ______________ ---- ____ _ Inmates of institutions -- __ -------- ------ ____ _
LITHUANIA
Total •• -- -- ---- __ -- __ -- ------ __ ----All persons in families -----------------With head or wife of foreign stock ____________ _
Head ________ -- ------ ________ ---- _______ _ Male __ -- -- -- __ -- __ -- ---- -- -- -- -- -- -- --Female ------ ---------- __ ------ ---- ___ _
w•------------------Child of head_ ___________________________ _ Other relative of head ____________ ----------
With head native of foreign or mixed parentage __ Head ___________________________________ _
Male---------------------- -- ------ ----Female ____ -------- ---- ------ ------ ----
Wife -- -- -- __ ------------ ______ ------ ----Child of heod-----------------------------Other relative of head _____________________ _
With wife native of foreign or mixed parentage, and head notive of native parentage--------------Heod •• ______ ------ _____________________ _
Wife ______ ---- __ ---- ___________________ _
Child of head·----------------------------Other relative of head ______ ------ __ --------
With head foreign born _____________________ _
He~ai; :: :::::: :::::::: :: :::::: :::::: :::: Female _______________________________ _
~i~~ -o·f·h;~d'::::::::::::::::::::::::::::: Other relative of head ___________________ _
With wife foreign born, head native of native
p~~~;~~~jj~~~~~~~~~~~~~~~~~~~~~~~~~~~~~ Other relative of head _____________________ _
Persons not in families Unrelated individuals -----------------Inmates of institutlon·s·:::::::::::::::::::::::
500
[D t based an 15 percent sample, see text. Far meaning of symbols. see text] aa
Native of native
Total parentage Total
3 319 544 1 326 005 1 993 539
3 039 707 1 326 005 1 713 702 3 039 707 1 326 005 l 713 702
950 510 132 932 817 578 887 643 132 932 754 711 62 867 - 62 867
863 593 198 050 665 543 1 119 099 964 588 154 511
106 505 30 435 76 070
2 096 734 971 464 l 125 270 635 399 - 635 399 587 436 - 587 436 47 963 - 47 963
568 810 184 286 384 524 817 515 765 998 51 517 75 010 21 180 53 830
454 463 322 912 131 551 125 648 125 648 -125 121 - 125 121 195 236 193 320 1 916
8 458' 3 944 4 514
467 595 23 417 444 178 182 179 - 182 179 167 275 - 167 275 14 904 - 14 904
162 370 13 764 148 606 100 612 4 592 96 020 22 434 5 061 17 373
20 915 8 212 12 703 7 284 7 284 -7 292 - 7 292 5 736 678 5 058
603 250 353
279 837 - 279 837 256 435 - 256 435 23 402 - 23 402
574 311 238 567 335 744 525 528 238 567 286 961 525 528 238 567 286 961 160 632 27 999 132 633 145 974 27 999 117 975 14 658 - 14 658
140 698 36 032 104 666 198 149 166 549 31 600 26 049 7 987 18 062
346 143 165 814 180 329 104 246 - 104 246 93 472 - 93 472 10 774 - 10 774 89 173 33 562 55 611
133 909 126 581 7 328 18 815 5 671 13 144
93 997 65 693 28 304 26 354 26 354 -26 397 - 26 397 38 420 38 131 289 2 826 1 208 1 618
79 987 5 209 74 778 28 387 - 28 387 24 503 - 24 503 3 884 - 3 884
23 458 2 470 20 988 23 886 1 661 22 225 4 256 1 078 3 178
5 401 1 851 3 550 1 645 1 645 -1 670 - 1 670 1 934 176 1 758
152 30 122 48 783 - 48 783 45 351 - 45 351 3 432 - 3 432
Foreign stock -Native of foreign or mixed parentage -
Foreign Mixed Fore~n Total parentage parentage born -
1 484 664 1 069 484 415 180 508 875 1 318 035 939 320 378 715 l 318 035 939 320 378 715 395 667
635 399 488 442 146 957 395 667 587 436 450 712 136 724 182 179 47 963 37 730 10 233
167 275 515 695 373 516 142 179 14 904 134 439 50 556 83 883
149 848 32 502 26 806 5 696
20 072 43 568
1 049 591 767 907 281 684 75 679 635 399 488 442 146 957 587 436 450 712 136 724 -
47 963 37 730 10 233 -337 857 255 033 82 824 46 667 50 449 2 722 47 727 1 068 25 886 21 710 4 176 27 944
129 150 73 550 55 600 2 401 - - -125 121 71 839 53 282 --1 890 79 1 811 26 2 139 1 632 507 2 375
134 256 97 574 36 682 309 922 ·- -· - 182 179 - - - 167 275 - - 14 904
52 717 46 644 6 073 95 889 77 135 47 508 29 627 18 885 4 404 3 422 982 12 969
5 038 289 4 749 7 665 - - -- - 7 292
4 965 247 4 718 93 73 42 31 280
166 629 130 164 36 465 113 208 156 863 122 055 34 808 99 572
9 766 8 109 1 657 13 636
253 506 195 536 57 970 82 238 222 801 169 618 53 183 64 160 222 801 169 618 53 183 64 160 104 246 85 925 18 321 28 387 93 472 76 626 16 846 24 503 10 774 9 299 1 475 3 884 82 762 63 115 19 647 21 904 27 472 13 369 14 103 4 128 8 321 7 209 1 112 9 741
168 833 132 124 36 709 11 496 104 246 85 925 18 321 -
93 472 76 626 16 846 -10 774 9 299 1 475 -50 431 39 487 10 944 5180 7 118 535 6 583 210 7 038 6 177 861 6 106
27 261 19 121 8 140 1 043 -·- - -
26 397 18 626 7 771 -280 6 274 9 584 489 95 1 034
24 944 18 331 6 613 49 834 -· - 28 387
- - 24 503 - 3 884 -
5 934 5 002 932 15 054 18 316 12 786 5 530 3 909
694 543 151 2 484
1 763 42 1 721 1787 --.. - 1670 -- -
1 758 42 1 716 -117
5 - 5
30 705 25 918 4 787 18 078
29 180 24 604 4 576 16 171
1 525 1 314 211 1907
NATIONAL ORIGIN AND LANGUAGf

Table 20. Persons in Families With Head or Wife of Foreign Stock by Type of Family, Foreign Stock Not in Families by Relationship, Nativity, and Country of Origin:
and Persons of 1970- Continued
United States
GREECE
Totol -- -- -- -- -- -- -- -- -- -- -- -- -- -- --All persons in families ----------------
With head or wife of foreign stock -- ------ -- -- -Head __ -- -- -- -- -- -- -- -- -- -- -- -- -- -- -- -- -
Male---- -- -- -- -- -- -- -- -- -- -- -- -- -- -- -Female ---- -- ------ ---- -- -- -- -- -- -- -- -
Wife -- -- -- -- -- -- -- -- -- -- -- -- -- -- -- -- -- --Child of head-----------------------------Other relative of head _____________________ _
With head native of foreign or mixed parentage --Head ______ -- ---- -- -- ---- -- -- -- -- -- -- -- --
Mole.------------- -- -- -- -- -- -- -- -- -- -Female ---- ------ -- -- -- -- -- -- -- -- -- -- -
Wife -- -- ---- -------- -- -- -- -- -- -- -- -- -- --Child of head -- -- -- -- -- -- -- -- -- -- ____ -- __ _ Other relative of head __ -- __ -- -- -- -- _______ _
With wife native of foreign or mixed parentage, and head native of native parentage --------------
Head_ _______ -- -- ---- -- -- -- -- -- -- -- -- -- --Wife-------- -- -- -- -- -- -- -- -- -- -- -.- -- -- --Child of head -- ____ -- -- -- ______ -- ________ _ Other relative of head __ -- -- -- -- -- -- ____ -- __
With head foreign born----------------------Head __ ---- -- __ -- -- -- -- -- -- -- -- -- -- -- -- -
Male-- -- -- -- -- -- -- -- -- -- -- -- -- -- -- -- --Female ---- ___________________________ _ Wife-------------- _____________________ _ Child of head ____________________________ _
Other relative of heod----------------------
With wife foreign born, head native of native parentage_ _______________________________ _ Heod ___________________________________ _ Wife-------------- ____ -- _______________ _ Child of head ____________________________ _ Other relative of head _____________________ _
Persons not in families ________________ _ Unrelated individuals ________________________ _ Inmates of institutions ______________________ _
ITALY Totol _____________________________ _
All persons in families -----------------With head or wife of foreign stock ____________ _
Head ___________________________________ _ Male _________________________________ _ Female _______________________________ _
Wife ________________________________ -- --Child of heod ____________________________ _ Other relative of head _____________________ _
With head native af foreign ar mixed parentage __ Head ___________________________________ _ Male_ _____ ------ _____________________ _
~iri~~'.~;~d============================== Other relative of head _____________________ _
With wife native of foreign or mixed parentage and h~ad dnative of native parentage __________ ~- __
Weii -- -- -- -- -- -- -- -- -- -- -- -- -- -- -- -- -- --Chil~ ~-fh;~d==- ---- -- -- -- -- -- -- -- -- -- -- --
Other relative afii;~d====================== With heod foreign barn ---------------- ------
~~~~~~~~ho~d=--l_=~=-~~:~~: =-~::i With wife foreign born, head native of native parentage ___ _
~~,;~~~;,~;~~~~::~~:::~:~-~=::=:::::: Persons not in families
Unrelated individuals -----------------Inmates of institution-s· :: == == == ==== == == == == == =
NATIONAL ORIGIN AND LANGUAGE
I Data based on 15-percent sample, see 1ext, For meaning of symbols, see text}
Native of native
Total parentage Total
701 570 258 014 443 556 662 388 258 014 404 374 662 388 258 014 404 374 181 271 27 411 153 860 168 488 27 411 141 077
12 783 - 12 783 161 679 43 413 118 266 285 005 179 302 105 703
34 433 7 888 26 545
318 181 170 688 147 493 82 476 - 82 478 74 952 - 74 952
7 526 - 7 526 71 529 33 673 37 856
149 509 132 735 16 774 14 665 4 280 10 385
95 276 69 092 26 184 24 586 24 586 -24 439 - 24 439 44 117 43 407 710
2 134 1 099 1 035
239 255 15 019 224 236 71 382 - 71 382 66 125 - 66 125
5 257 - 5 257 62 911 9 740 53 171 87 561 2 832 84 729 17 401 2 447 14 954
9 676 3 215 6 461 2 825 2 825 -2 800 - 2 BOO 3 818 328 3 490
233 62 171
39 182 - 39 182 36 708 - 36 708 2 474 - 2 474
7 913 110 3 589 330 4 323 780 7 548 329 3 589 330 3 958 999 7 548 329 3 589 330 3 958 999 2 100 083 359 766 1 740 317 1 946 742 359 766 1 566 976
153 341 - 153 341 1 881 487 510 246 1 371 241 3 220 822 2 596 445 624 377
345 937 122 873 223 064
4 846 302 2 535 182 2 311 120 1 314 909 - 1 314 909 1 201 818 - 1 201 818
113 091 - 113 091 1 155 521 468 713 686 808 2 145 006 1 984 152 160 854
230 866 82 317 148 549
1 310 586 947 320 363 266 338 993 338 993 -337 529 - 337 529 602 340 595 166 7 174
31 724 13 161 18 563
1 318 860 83 314 1 235 546 425 408 - 425 408 385 158 - 385 158
40 250 - 40 250 367 725 41 533 326 192 444 408 15 090 429 318
81 319 26 691 54 628
72 581 23 514 49 067 20 773 20 773 -20 712 - 20 712 29 068 2 037 27 031 2 028 704 1 324
364 781 - 364 781 340 504 - 340 504 24 277 - 24 277
Foreign stock
Native of foreign or mixed parentage
Foreign Mixed Foreign Total parentage parentage born
260 567 156 538 104 029 182 989 243 069 145 993 97 076 161 305 243 069 145 993 97 076 161 305 82 478 57 559 24 919 71 382 74 952 52 276 22 676 66 125
7 526 5 283 2 243 5 257 70 852 47 689 23 163 47 414 83 736 36 382 47 354 21 967
6 003 4 363 1 640 20 542
132 920 84 380 48 540 14 573 82 478 57 559 24 919 -74 952 52 276 22 676 -
7 526 5 283 2 243 -30 712 23 218 7 494 7 144 16 306 866 15 440 468 3 424 2 737 687 6 961
25 502 12 068 13 434 682 - - - -
24 439 11 759 12 680 -678 21 657 32 385 288 97 650
81 189 49 440 31 749 143 047 - - - 71 382 - - - 66 125 - - - 5 257
15 701 12 712 2 989 37 470 63 313 35 402 27 911 21 416
2 175 1 326 849 12 779
3 458 105 3 353 3 003 - - - -- - - 2 800
3 439 93 3 346 51 19 12 7 152
17 498 10 545 6 953 21 684 16 341 9 743 6 598 20 367 1 157 802 355 1 317
3 268 999 2 175 591 1 093 408 1 054 781 3 036 839 2 004 038 1 032 801 922 160 3 036 839 2 004 038 1 032 801 922 160 1 314 909 970 052 344 857 425 408 1 201 818 882 461 319 357 385 158
113 091 87 591 25 500 40 250 1 078 189 757 584 320 605 293 052
539 026 194 332 344 694 85 351 104 715 82 070 22 645 118 349
2 155 217 1 496 567 658 650 155 903 1 314 909 970 052 344 857 -1 201 818 882 461 319 357 -
113 091 87 591 25 500 -606 233 450 254 155 979 80 575 156 488 13 654 142 834 4 366
77 587 62 607 14 980 70 962
353 136 201 439 151 697 10 130 - - - -
337 529 194 457 143 072 -6 927 253 6 674 247 8 680 6 729 1 951 9 883
501 397 304 928 196 469 734 149 - - - 425 408 - - - 385 158 - - - 40 250
134 427 112 873 21 554 191 765 348 924 179 604 169 320 80 394
18 046 12 451 5 595 36 582
27 089 l 104 25 985 21 978 - - - -- - - 20 712
26 687 821 25 866 344 402 283 119 922
232 160 171 553 60 607 132 621 217 843 160 758 57 085 122 661
14 317 10 795 3 522 9 960
501
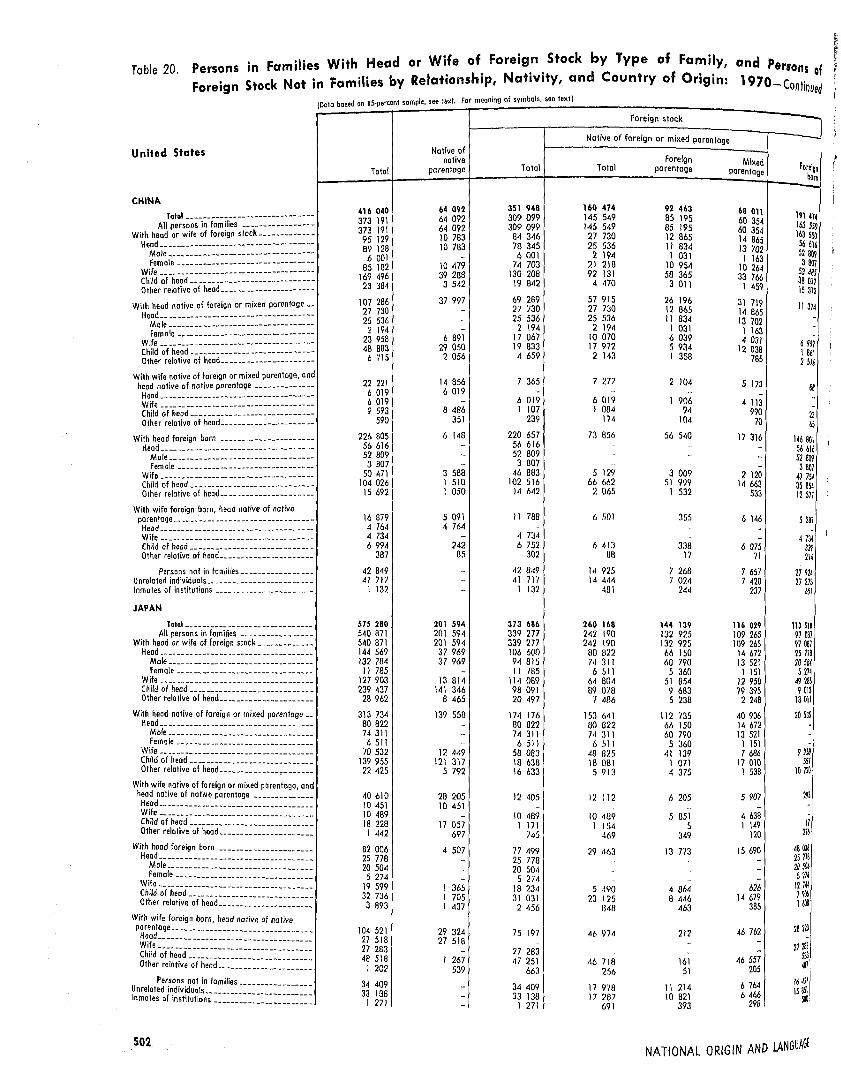
Tobie 20. Persons Foreign
in Families With Head or Wife of Foreign Stock by Type of Family, Stock Not in families by Relationship, Nativity, and Country of Origin:
and Persons of 1970- Continued
United States
CHINi\ htal ________________ --------------
All persons in families ----------------With head or wife of foreign stock---------- -- -
Head -- -- -- -· ---- -- -- -- -- -- -- -- -- -- ---- -Mole __ ---------------------- -- -- -- -- -Female -- -- -- -- -- -- -- -- -- -- -- ---- -- -- -
Wife -- -- ---- ---------- -- ---------- -- ----Child of heod----------------------------Other relative of head._ -- -- ---- -- ---- -- ----
With heed native of foreign or mixed parentage --Head ____ -- -- __ -- -- -- -- -- -- -- -- ---- -- -- --
Ma le -- -- -- -- -- -- -- -- -- -- -- -- ---- -- -- --Female ______ ---- -- -- -- ---- -- ---- -- -- --
Wh - - - - - -- - - - - --- - - - -Child of head----------------------------Other relative of head __ -- -- -- -- -- -- -- -- -- --
Wilh wife native of foreign or mixed parentage, and heed native of native parentage--------------
Head __ -- -- -- -- -- -- -- -- -- -- -- -- -- -- -- -- -Wife -- -- -- -- -- -- -- -- -- -- -- ---- ------ -- --Child of head -- -- -- -- -- -- -- -- -- -- -- -- -- -- -Other relative of head----------------------
With head foreign born ----------------------Head ______ -- ______ -- ______ -- ____ -- -- ___ _ Male ____ -- -- -- -- -- -· -- -- -- -- -- -- -- -- --Fem ale ---- __ ---- -- ---- ------ ------ -- -
Wife __ -- -- -- -- -- -- -- -- -- -- -- ---- -- -- -- --Child of head __ ------ __ -- ---- __ ---- -- -- -- -Other relative of head----------------------
With wife foreign born, head native of native parentage __ -- __ ---- -- -- -- -- -- -- ---- ---- -- -Head __ ---- -- -- ------ -- -- -- ---- ---- -- ---Wife -- ---- -- -- ------ ---- -- -- -- -- -- ---- --Child of heed ____________________________ _ Other relative af head ____________________ --
Persons not in families ______ -- -- -- __ -- -Un related individuals ____ -- -- -- -- -- -- -- -- -- -- -Inmates of institutions-----------------------
JAPAN Total ______________ -- __________ -- __
All persons in fomilies -----------------With head or wife of foreign stock ____________ _
Heed -- -- -- -- -- -- ---- -- -- -- -- -- -- -- -- -- --Male ______ -- ______ -- _________________ _
Female -- -- -- -- __ -- -- __ -- -- -- -- -- -- -- -Wife ---- -- -- -- -- -- -- ------ ------ -- ---- --Child of heod-----------------------------Other relative of head _____________________ _
With head native of foreign or mixed parentage __ \lead ___________________________________ _ Male -- _______________________________ _
Fem a le __ -- -- ____ -- -- -- -- -- -- -- -- -- -- --W h _________________ _ Child of head ____________________________ _
Other relative of head--------------~-------
With wife native of foreign or mixed parentage, end head native of native pa rentoge _____________ _ Head._ -- ____ -- ____ -- -- -- -- -- -- __ -- -- -- --Wife -- ________ -- __ -- -- -- -- -- -- __ -- -- -- --Child of heed ____________________________ _ Other relative of head _____________________ _
With head foreign born -------------------·--Head __________________________ -· _______ _ Male ________________________ ------ ___ _ female ______ ------ ___________________ _
Wife -- -- __ -- ------ -- -- -- __ -- -- ---- -- -- __ Child of head ____________________________ _ Other relative of head _____________________ _
With wife foreign born, head native of native
p}~fi~~~~~~~~;~~~;~;~;~;~;~;~;~;~;~~~;~;~ Other relative of head ________ ------ _______ _
Persons not in families ________________ _ Unrelated individuals __ _ Inmates of institutions-======================
502
ID 1 based on 15·percen1 sample, see text. For meaning of symbols, see text] 00
Native of na1ive
Total parentage Total
416 040 64 092 351 948
373 191 64 092 309 099 373 191 64 092 309 099 95 129 10 783 84 346 89 128 10 783 78 345 6 001 - 6 001
85 182 10 479 74 703 169 496 39 288 130 206 23 384 3 542 19 842
107 286 37 997 69 289 27 730 - 27 730 25 536 - 25 536 2 194 - 2 194
23 958 6 891 17 067 48 883 29 050 19 833 6 715 2 056 4 659
22 221 14 856 7 365 6 019 6 019 -6 019 - 6 019 9 593 a 486 I 107
590 351 239
226 805 6 148 220 657 56 616 - 56 616 52 809 - 52 809 3 807 - 3 807
50 471 3 588 46 883 104 026 1 510 102 516
15 692 l 050 14 642
16 879 5 091 11 788 4 764 4 764 -4 734 - 4 734 6 994 242 6 752
387 85 302
42 649 - 42 849 41 717 - 41 717
I 132 - 1 132
575 280 201 594 373 686 540 871 201 594 339 277 540 871 201 594 339 277 144 569 37 969 106 600 132 784 37 969 94 815
11 785 - 11 785 127 903 13 814 114 089 239 437 141 346 98 091 28 962 8 465 20 497
313 734 139 558 174 176 80 822 - 80 822 74 311 .. 74 311 6 511 - 6 511
70 532 12 449 58 083 139 955 121 317 18 638
22 425 5 792 16 633
40 610 28 205 12 405 10 451 10 451 -10 489 - 10 489 18 228 17 057 1 171 1 442 697 745
82 006 4 507 77 499 25 778 - 25 778 20 504 - 20 504 5 274 - 5 274
19 599 1 365 18 234 32 736 1 705 31 031 3 893 1 437 2 456
104 521 29 324 75 197 27 518 27 518 27 283 - 27 283 48 518 1 267 47 251 1 202 539 663
34 409 - 34 409 33 1B8 - 33 138
I 271 - 1 271
Foreign stock -Native of foreign or mixed parentage -
Foreign Mixed Foreign Total parentage parentage born -
160 474 92 463 68 011 145 549 85 195 60 354 191 474 145 549 85 195 60 354 163 550 27 730 12 865 14 865 163 550 25 536 11 634 13 702 56 616
2 194 l 031 1 163 52 809 21 218 10 954 10 264 3 807 92 131 58 365 33 766 53 48!
4 470 3 011 1 459 38 0)) 15372
57 915 26 196 31 719 Ii 374 27 730 12 865 14 865 25 536 11 634 13 702 -2 194 l 031 1 163 -
10 070 6 039 4 031 -17 972 5 934 12 038
6 997 1861 2 143 I 358 785 2 Sib
7 277 2 104 5 173 88 ... -6 019 1 906 4 113 -l 084 94 990 -
23 174 104 70 65 73 056 56 540 17 316 146 80\ - 56 616 - 52 809 - 3 807 5 129 3 009 2 120 41 754 66 662 51 999 14 663 35854
2 065 1 532 533 12 571
6 ~01 355 6 146 5281 - -- 4 734
6 41:1 338 6 075 339 88 17 71 rn
14 925 7 266 7 657 27 924 14 444 7 024 7 420 27273
•181 244 237 b51
260 168 144 139 116 029 mm 242 190 132 925 109 265 97 081 242 190 132 925 109 265 97 087
80 022 66 150 14 672 25 178 74 311 60 790 13 521 2G 501 6 511 5 360 1 151 5274
64 1104 51 854 12 950 49 281 89 orn 9 683 79 395 9013
7 486 5 238 2 248 13011
153 641 112 735 40 906 20 m IJO 822 66 150 14 672 -74 311 60 790 13 521 6 511 5 360 1 151 -
48 825 41 139 7 686 9 lJ! 18 OBI 1 071 17 010 551 5 913 4 375 1 538 10 72G
12 112 6 205 5 907 293 --
10 489 5 851 4 638 1 154 5 1 149 17
469 349 120 216
29 463 13 773 15 690 48036 - 25118 - 20 JOI - - 5214
5 490 4 864 626 12m 23 125 0 446 14 679 79Gb
ll4B 463 385 16-0i
46 974 212 46 762 28223 . -- 27283 - -46 716 161 46 557 533
4G1 256 51 205
17 9"/8 11 214 6 764 ld4ll
17 287 10 821 6 466 15811 500
691 393 298
NATIONAL ORIGIN AND lANGUAGf

Table 20. Persons in Families With Head or Wife of Foreign Stock by Type of Family, Foreign Stock Not in Families by Relationship, Nativity, and Country of Origin:
and Persons of 1970- Continued
United States
CANADA
Total -- ------ -- -- -- -- ---- -- -- -- -- --All persons in families ----------------
With heod or wife of foreign stock-------------Head __ ---- -- -- -- -- -- -- -- -- -- -- -- -- -- -- -
Mole -- -- -- -- ---- -- -- -- -- ---- -- ---- -- -Female -- -- ------ -- -- -- -- -- -- -- -- -- -- --
t~/id -;;f ·h;~,c=========================== Other relative of heod _____________________ _
With head native of foreign or mixed parentage --Head-------------- -- -- -- -- -- -- -- -- -- -- -
Mole __ -- -- -- -- -- -- -- -- -- -- -- -- -- -- -- -female __ -- -- -- -- -- -- -- -- -- -- -- -- -- -- -
Wife-------------- -- -- -- -- -- -- -- -- -- -- --Child of head -- ---- -- -- -- -- -- ---- -- -- -- -- -Other relative of heod _____________________ _
With wife native of foreign or mixed parentage, and head native of native parentage -- -- -- -- -- -- --Head .• ------ -- -- -- -- -- -- -- -- -- -- -- -- -- -Wife __ ---- -- -- -- -- -- -- -- -- -- -- -- -- -- -- --Child of head_ __________________________ _ -Other relative of head ____________________ _ -
With head foreign born -- -- __ -- -- -- -- _______ _ Head •. ---- -- -- ---- -- -- -- -- -- -- -- -- -- -- -
Mole ______ -- -- -- -- -- -- -- -- -- -- -- -- -- -female -- -- -- ---- -- -- -- -- -- -- -- -- -- -- _
Wife------ -- -- ---- -- -- -- -- -- -- -- -- -- -- -Child of head __ -- -- __ -- __ -- -- __ -- ______ .. Other relative of heod __________ -- -- -- ____ •
With wife foreign born, head native of native parentage •• ____ -- -- -- -- -- -- -- -- -- -- -- -- --Head .. ________________________________ _ Wife---- __ -------- ______________ -- -- -- -Child of head __ -- __________________ -- -- --Other relative of head ____________________ _
Persons not in families ____________ -- __ Unrelated individuals •• _____________________ _ Inmates of institutions _____________________ _
MEXICO Total ____________________________ -
All persons in families _______________ _ With head or wife of foreign stock ___________ _
Head_ _________________________________ _ Mole __________________ -- __ -- ---- -- -- -female ______________________________ •
Wife __ ---- ____________________________ _ Child of head __________________________ --Other relative of head ____________________ _
With head native of foreign or mixed parentage_ Head ________ ------ ____________________ _ Mole •• ______________________________ _ female ______________________________ _
Wife __ ------ __________________________ _ Child of head ___________________________ _ Other relative of heod ____________________ _
With wife .native of foreign or mixed parentage, an head native of native parentage ------------Head -- ---- -- -- -- ---- -- -- -- -- -- -- -- -- -- -Wife __ ---- ____ ---- ____________________ _
~:~:r 0:e~~f:e -~f h;~d========== ======= ::::
Wi~h hJ°d foreign born ---------------------
------
--------
----------------d -----
------~[~i~~if~~~,-~~ll:-l~=--=~:mi_~ -
With wife foreign born, head native of native p~~~~~~~=- -- -- -- -- -- -- -- -- - - -- -- -- -- -- -- -Wife __ ---- __ -- ---- -- -- -- -- -- -- -- -- --
~:~:r 0
:e~~f:e -if=~;~~===================== ----
Persons not in families _______________ _ Unrelated individuals Inmates of institution~-====::::::::::::==::::
---
NATIONAL ORIGIN AND LANGUAGE
\Data based on 15-percent sample, sec text. For meaning of symbols see text)
Native of native
Total parentage Total
5 305 353 2 488 983 2 816 370 4 879 390 2 488 983 2 390 407 4 879 390 2 488 983 2 390 407 1 403 667 453 707 949 960 1 307 829 453 707 854 122
95 838 - 95 838 1 276 526 463 985 812 541 2 033 130 1 489 539 543 591
166 067 81 752 84 315
2 425 115 1 353 060 1 072 055 693 936 - 693 936 626 043 - 626 043
67 893 - 67 893 604 114 383 786 220 328
l 029 247 920 464 108 783 97 818 48 810 49 008
1 291 375 905 235 386 140 349 907 349 907 -348 247 - 348 247 565 969 538 936 27 033
27 252 16 392 10 860
816 263 114 281 701 982 256 024 - 256 024 228 079 - 228 079 27 945 - 27 945
220 700 80 199 140 501 305 596 21 169 284 427 33 943 12 913 21 030
346 637 116 407 230 230 103 800 103 800 -103 465 - 103 465 132 318 8 970 123 348
7 054 3 637 3 417
425 963 - 425 963 388 862 - 388 862 37 101 - 37 101
3 766 110 1 461 848 2 304 262 3607116 1 461 848 2 145 268 3 607 116 1 461 848 2 145 268
778 336 141 125 637 211 691 010 141 125 549 885 87 326 - 87 326
657 909 152 776 505 133 1 960 969 1 074 828 886 141
209 902 93 119 116 783
1 788 949 961 976 826 973 375 515 - 375 515 324 428 - 324 428
51 087 - 51 087 307 531 119 280 188 251
1 009 750 794 316 215 434 96 153 48 380 47 773
500 767 371 312 129 455 108 331 108 331 -107 661 - 107 661 268 777 252 632 16 145
15 998 10 349 5 649
1 179 996 89 900 1 090 096 261 696 - 261 696 225 457 - 225 457 36 239 - 36 239
209 995 33 496 176 499 616 122 24 370 591 752 92 183 32 034 60 149
137 404 38 660 98 744 32 794 32 794 -32 722 - 32 722 66 320 3 510 62 810 5 568 2 356 3 212
158 994 - 158 994 146 806 - 146 806
12 188 - 12 188
Foreign stock
Native of foreign or mixed parentage
Foreign Mixed Foreign Total parentage parentage born
2 076 919 605 416 1 471 503 739 451 1 786 489 512 300 1 274 189 603 918 1 786 489 512 300 1 274 189 603 918
693 936 206 174 487 762 256 024 626 043 184 825 441 218 228 079 67 893 21 349 46 544 27 945
578 448 197 027 381 421 234 093 467 893 88 509 379 384 75 698 46 212 20 590 25 622 38 103
1 006 342 318 677 687 665 65 713 693 936 206 174 487 762 -626 043 184 825 441 218 -67 893 21 349 46 544 -
176 807 88 152 88 655 43 521 102 667 9 591 93 076 6 116 32 932 14 760 18 172 16 076
380 861 82 134 298 727 5 279 - - - -
348 247 79 351 268 896 -26 612 379 26 233 421 6 002 2 404 3 598 4 858
278 365 107 891 170 474 423 617 - - - 256 024 - - - 228 079 - - - 27 945
53 394 29 524 23 870 87 107 218 829 75 337 143 492 65 598
6 142 3 030 3 112 14 888
120 921 3 598 117 323 109 309 - - - -- - - 103 465
119 785 3 202 116 583 3 563 1 136 396 740 2 281
290 430 93 116 197 314 135 533 265 970 83 352 182 618 122 892 24 460 9 764 14 696 12 641
1 548 685 713 154 835 531 755 577 1 474 474 676 112 798 362 670 794 1 474 474 676 112 798 362 670 794
375 515 217 036 158 479 261 696 324 428 186 823 137 605 225 457
51 087 30 213 20 874 36 239 304 351 167 180 137 171 200 782 738 062 266 274 471 788 148 079 56 546 25 622 30 924 60 237
750 991 333 081 417 910 75 982 375 515 217 036 158 479 -324 428 186 823 137 605 -
51 087 30 213 20 874 -139 754 82 447 57 307 48 497 207 396 21 069 186 327 8 038 28 326 12 529 15 797 19 447
127 027 49 992 77 035 2 428 - - - -
107 661 47 979 59 682 -15 730 682 15 048 415 3 636 1 331 2 305 2 013
535 833 288 816 247 017 554 263 - - - 261 696 - - - 225 457 - - - 36 239
56 936 36 754 20 182 119 563 455 504 240 747 214 757 136 248
23 393 11 315 12 078 36 756
60 623 4 223 56 400 38 121 - - - -- - - 32 722
59 432 3 776 55 656 3 378 1 191 447 744 2 021
74 211 37 042 37 169 84 783 65 883 32 965 32 918 80 923 8 328 4 077 4 251 3 860
503
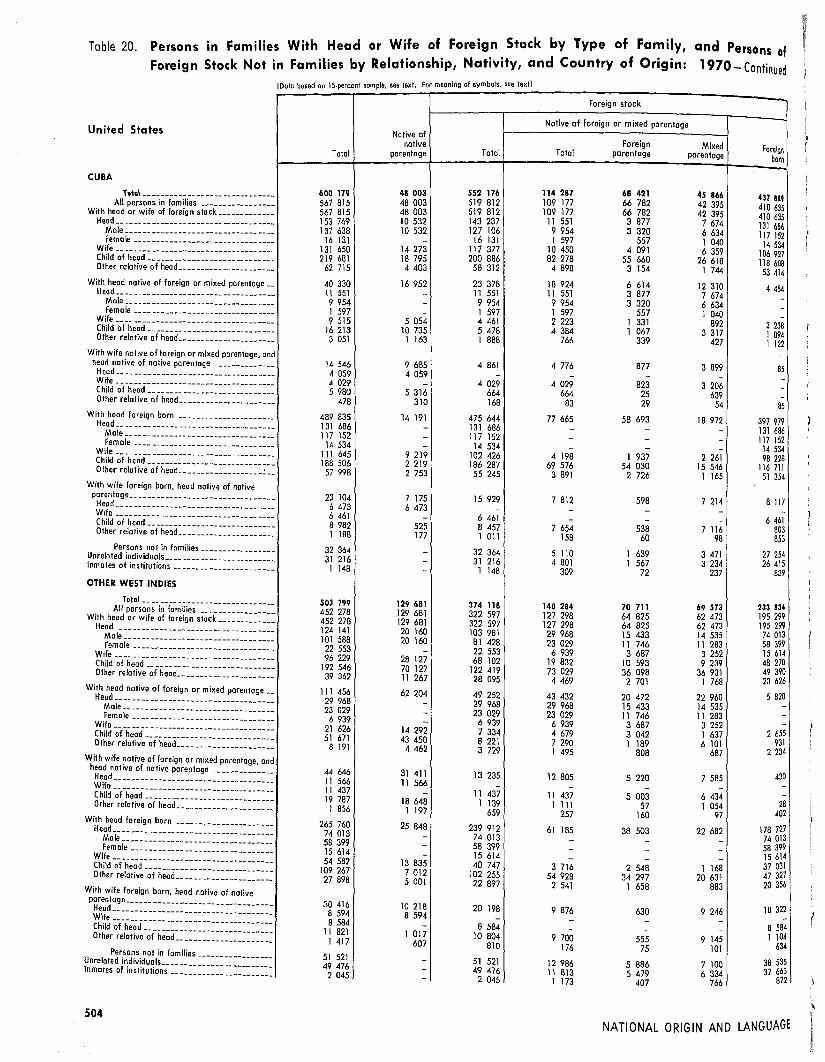
Table 20. Persons in Families With Head or Wife of Foreign Stock by Type of Family, Foreign Stock Not in Families by Relationship, Nativity, and Country of Origin:
and Persons of 1970- Continued
United States
CUBA
lolal ---------- -------- __ ------ ----All persons in families -----------------
With head or wife of foreign stock ____________ _ liead __________ ------ ___________________ _
Mole ______ ------ __ --------------------female ____ ------ __ -------- -------- ___ _
Wife -- -- -- -- -- -- -- -- -- -- -- -- -- -- -- -- -- --Child of head ____________________________ _
Other relative of head----------------------
With head native of foreign or mixed parentage __ Head ________________________________ ----
Mole---- ____ -------------- __ ------ ___ _ Female ______ ------ ------ __ -------- ___ _
Wife __________ ---------- -- __ -- ------ ----Child of head_ _____________ ------------ __ _ Other relative of head ____ ---- ____ ----------
With wife native of foreign or mixed parentage, and head native of native parentage--------------Head ___________________________________ _
Wife -- ____ -- -- ---- -- -- ---- -- -- ---- -- ----Child of head_ ___________________________ _ Other relative of head _____________________ _
With head foreign born ----------------------Head ______ -- __ -- __ -- -- -------- ---- -- ----Mole _________________________________ _
female ________________ ------ _________ _
Wife -- -- __ -- ------ -- -- -- -- ---- ---- -- ----Child of head__------ ______ ---------------Other relative of head ___________________ : __
With wife foreign born, head native of native parentage ________________________________ _
Head ________ -------- ___________________ _ Wife -- ____ -- __ ---- ______ -- ____ ------ ----Child of head._---- ______________ ---------Other relative of head _____________________ _
Persons not in families __ ---------------Unrelated individuals ____________ -------------Inmates of institutions ________ ------ ------ __ _
OTHER WEST INDIES Total _____________________________ _
All persons in families -----------------With head or wife of foreign stack ____________ _
Head ________ -- -- __ -- __ -- -- -- -- -- -- -- ----Male __________________ ------ _________ _ female ____ ------ _____________________ _
Wife -- ________ ---- ____ ---- ______ ---- ----Child of head ____________________________ _ Other relative of head _____________________ _
With head native of foreign or mixed parentage __ Head ____________ ---- ___________________ _
Mole ______________________ ------ _____ _ Female _______________________________ _
Wife __ -- ________ ---- ____ -------- _______ _ Child of head ____ ------ __________________ _ Other relative of head _____________________ _
With wife native of foreign or mixed parentage, and head native of native parentage --------------Head ___________________________________ _
Wife ____ -------- __ -- ________ ------ ---- __ Child of head-----------------------------Other relative of head _____________________ _
With head foreign born ----------------------Head __ -- ____________________ ---- _______ _ Mo le ________________ -------- _________ _ female ______________ ---- _____________ _
Wile ____ ---- __ ---- ______ -- ____ ---- __ -- __ Cliiid of head-----------------------------Other relative of head ________________ ------
With wife foreign born, head native of notive parentage ________________________________ _ Head ___________________________________ _ Wife __________ -- ______________ ---- __ ----Child of head_ ___________________________ _ Other relative of head _____________________ _
Persons not in families-----------------Unrelated individuals. _______________________ _
Inmates of institutions-----------------------
504
!Dato b(lsed on 15 percent sample see text For meaning of symbols, see textl
Total
600 179 567 815 567 815 153 769 137 638
16 131 131 650 219 681
62 715
40 330 11 551 9 954 1 597 9 515
16 213 3 051
14 546 4 059 4 029 5 980
478
489 835 131 686 117 152
14 534 111 645 188 506
57 998
23 104 6 473 6 461 8 982 1 188
32 364 31 216 1 148
503 799 452 278 452 278 124 141 101 588
22 553 96 229
192 546 39 362
111 456 29 968 23 029 6 939
21 626 51 671
8 191
44 646 11 566 11 437 19 787 I 856
265 760 74 013 58 399 15 614 54 582
109 267 27 898
30 416 8 594 8 584
11 821 1 417
51 521 49 476
2 045
Native of native
parentage
48 003 48 003 48 003 10 532 10 532
14 273 18 795 4 403
16 952
5 054 10 735 l 163
9 685 4 059
5 316 310
14 191
9 219 2 219 2 753
7 175 6 473
525 177
129 681 129 681 129 681 20 160 20 160
28 127 70 127 11 267
62 204
14 292 43 450
4 462
31 411 11 566
18 648 l 197
25 848
13 835 7 012 5 001
10 218 8 594
1 017 607
Total
552 176 519 812 519 812 143 237 127 106
16 131 117 377 200 886 58 312
23 378 11 551 9 954 1 597 4 461 5 478 1 888
4 861
4 029 664 168
475 644 131 686 117 152
14 534 102 426 186 287 55 245
15 929
6 461 8 457 1 011
32 364 31 216 1 148
374 118 322 597 322 597 103 981
81 428 22 553 68 102
122 419 28 095
49 252 29 968 23 029
6 939 7 334 8 221 3 729
13 235
11 437 l 139
659
239 912 74 013 58 399 15 614 40 747
102 255 22 897
20 198
8 584 10 804
810
51 521 49 476 2 045
Foreign stock
Native of foreign or mixed parentage
Total
114 287 109 177 109 177
11 551 9 954 l 597
10 450 82 278
4 898
18 924 11 551 9 954 l 597 2 223 4 384
766
4 776
4 029 664
83
77 665
4 198 69 576
3 891
7 812
7 654 158
5 110 4 801
309
140 284 127 298 127 298 29 968 23 029 6 939
19 832 73 029 4 469
43 432 29 968 23 029
6 939 4 679 7 290 1 495
12 805
11 437 l 111
257
61 185
3 716 54 928
2 541
9 876
9 700 176
12 986 11 813 l 173
Foreign parentage
68 421 66 782 66 782 3 877 3 320
557 4 091
55 660 3 154
6 614 3 877 3 320
557 1 331 1 067
339
877
823 25 29
58 693
1 937 54 030
2 726
598
538 60
l 639 l 567
72
70 711 64 825 64 825 15 433 11 746 3 687
10 593 36 098 2 701
20 472 15 433 11 746 3 687 3 042 l 189
808
5 220
5 003 57
160
38 503
2 548 34 297
l 658
630
555 75
5 886 5 479
407
Mixed parentage
45 866 42 395 42 395 7 674 6 634 1 040 6 359
26 618 l 744
12 310 7 674 6 634 l 040
892 3 317
427
3 899
3 206 639
54
18 972
2 261 15 546 l 165
7 214
7 116 98
3 471 3 234
237
69 573 62 473 62 473 14 535 11 283 3 252 9 239
36 931 l 768
22 960 14 535 11 283 3 252 1 637 6 101
687
7 585
6 434 l 054
97
22 682
l 168 20 631
883
9 246
9 145 101
7 100 6 334
766
Foreign born
437 m 410 635 410 635 131 686 117 152
14 534 106 927 118 608 53 414
4 454
2 238 I 094 1 122
85
85
397 979 131 686 117 152
14 534 98 228
116 711 51 354
8 117
6 461 803 853
27 254 26 415
839
233 834 195 299 195 299 74 013 58 399 15 614 48 270 49 390 23 626
5 820
2 655 931
2 234
430
28 402
178 727 74 013 58 399 15 614 37 031 47 327 20 356
10 322
8 584 1 104
634
38 535 37 663
872
NATIONAL ORIGIN AND LANGUAGE ' I I f
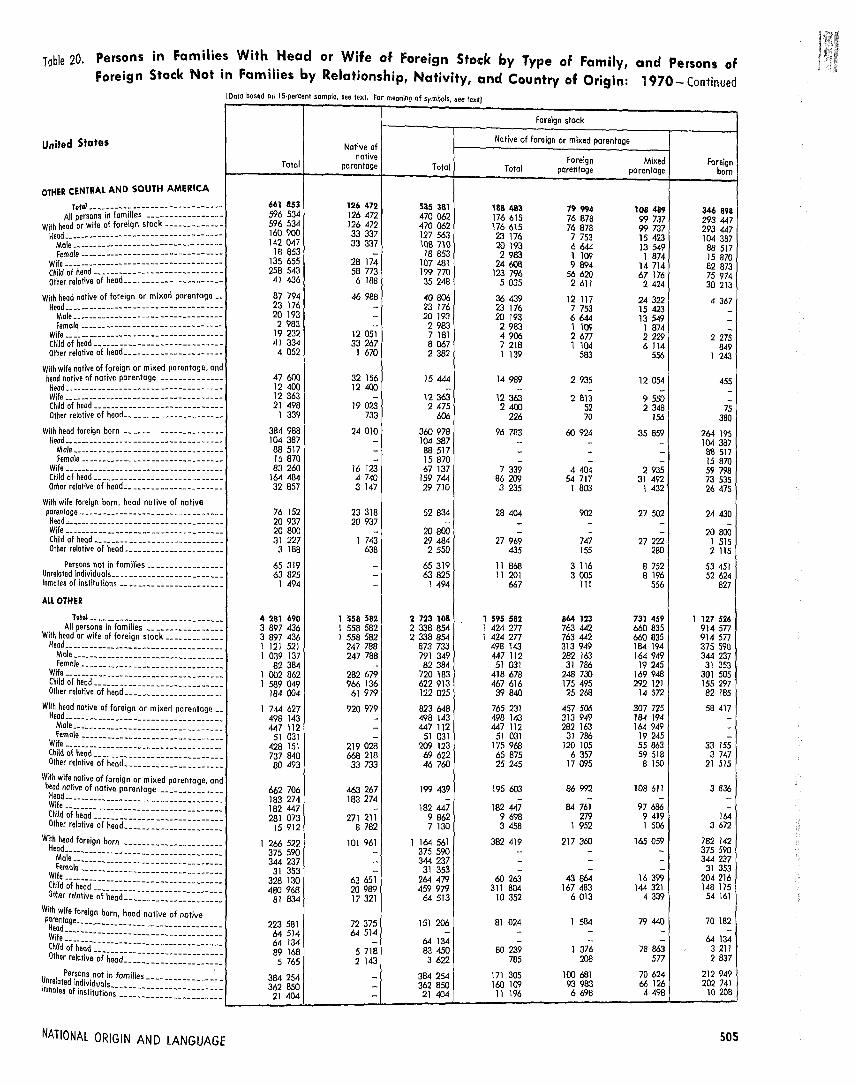
Tobie 20. Persons in Families With Head or Wife of Foreign Stock by Type of family, Foreign Stock Not in Families by Relationship, Nativity, and Country of Origin:
I Dalo based on l 5·percen1 sample, see 1ex1. For meaning af symbols see text)
Foreign stock
and Persons of 1970- Continued
United State5 Native of Native of foreign or mixed parentage
OTHER CENTRAL AND SOUTH AMERICA
Total -- -- -- -- -- -- -- -- -- -- -- -- -- -- --All persons in families ----------------
With head or wife of foreign stock-------------Head __ -- -- -- -- -- -- -- -- -- -- -- -- -- -- -- -- -
Male-------------- -- ---- -- --- - -- -- -- -Female ---- -------- -- ---- -- -- ---- -----
Wife-------------- -- ---- -- -- ---- -- -- -- --Child af head----------------------------Other relative of head----------------------
With head native of foreign or mixed parentage __ Head __ ---------- -- -- -- -- -- -- -- -- -- -- -- __
Male .• ---------- -- -- -- -- -- -- -- -- -- -- -Female -- -- -- ---- -- -- -- -- -- -- -- -- -- -- -
Wife -- ---- -- -- -- -- -- -- -- -- -- -- -- -- -- -- - -Child of head·----------------------------Other relative of head _____________________ _
With wife native of foreign or mixed parentage, and head native of native parentage --------------Head ____ ---- -- ---- -- -- -- -- -- -- -- -- - - -- --Wife-----· -- ------ -- -- -- -- -- -- -- -- -- -- --Child of head ____________________________ _ Other relative of head _____________________ _
With head foreign born----------------------Head ________ ---- -- -- -- -- -- -- -- -- -- - --- --Male---- .• __ •• _______________________ _
female -- -- __ ---- -- __ -- ____ -- _________ _
Wife -- ------ -- -- -- -- -- -- -- -- ---- -- - - -- --Child of head -- __ ---- -- __ -- __ -- -- ____ -- -- -Other relative of head _____________________ _
With wife foreign born, head native of native parentage •••• -- -- -- -- -- -- -- -- -- -- -- -- -- -- -Head"·---- __ ------ ________________ ---- __ Wife ------ ---- ---- -- -- -- -- -- -- -- ---- -- --Child of head·---------------------------Other relative al head •• --------------------
Persons not in families. _______________ _ Unrelated individuals ______________ -- ________ _ Inmates al institutions-----------------------
ALL OTHER
lolol .• ____ ---- __ -- ____________ -- --
All persons in families -----------------With head or wife of foreign stock ____________ _ Head ________________________________ -- --
Mole _________________________________ _ Female ____ ------ _____________________ _
Wife __ ------------ _____________________ _ Child of head •. __________________________ _ Other relative of heod _____________________ _
With heod native of foreign or mixed parentage __ Head __ ------ ___________________________ _
Male ________ ---- ____ ---- _____________ _
~:i~~~~~e~i:::=:=======================~ Other relative of head _____________________ _
With wife _native of foreign or mixed parentage, and h~ad native of native parentage--------------
~~f~:~~~~f.~;J~~~~~~~~;~~~;~;~;; ~; ~;;; ~ ~ Wi~h hdad foreign born ----------------------
t~i~=!~~dm-=~=:i~j~jj~~ j=~j= With wife foreign born, head native of native parentage Head __ ---------- -- -- -- -- ------ -- ------ -Wife __ __ __ _ -- -- .. _ -- -- -- -- -- -- -- -- --
6~~~r 0
:e~~~~e =;;~;;~====== = = == ==== == ==== == U
Persons not in families ________________ _ nrelated individuals
Inmates of institution~-==:::::::::::::::::::::
NATIONAL ORIGIN AND LANGUAGE
Total
661 853 596 534 596 534 160 900 142 047
18 653 135 655 258 543
41 436
B7 794 23 176 20 193 2 983
19 232 41 334 4 052
47 600 12 400 12 363 21 498
1 339
384 988 104 387 88 517 15 870 83 260
164 484 32 857
76 152 20 937 20 800 31 227
3 188
65 319 63 825
1 494
4 281 690 3 897 436 3 897 436 1 121 521 1 039 137
82 384 1 002 862 1 589 049
184 004
1 744 627 498 143 447 112
SI 031 428 151 737 840 80 493
662 706 183 274 182 447 281 073
15 912
1 266 522 375 590 344 237
31 353 328 130 480 968
81 834
223 581 64 514 64 134 89 168 5 765
384 254 362 850
21 404
native parentage Total
126 472 535 381 126 472 470 062 126 472 470 062 33 337 127 563 33 337 lOB 710
- 18 853 28 174 107 481 58 773 199 770 6 188 35 248
46 988 40 806 - 23 176 - 20 193 - 2 983
12 051 7 181 33 267 a 061
l 670 2 382
32 156 15 444 12 400 -
- 12 363 19 023 2 475
733 606
24 010 360 978 - 104 387 - 88 517 - 15 870
16 123 67 137 4 740 159 744 3 147 29 710
23 318 52 834 20 937 -
- 20 800 l 743 29 484
638 2 550
- 65 319 - 63 825 - 1 494
1 558 582 2 723 108 l 558 582 2 338 854 1 558 582 2 338 854
247 788 873 733 247 788 791 349
- 82 384 282 679 720 183 966 136 622 913
61 979 122 025
920 979 823 648 - 498 143 - 447 112 - 51 031
219 028 209 123 668 218 69 622 33 733 46 7{/J
463 267 199 439 183 274 -
- 182 447 271 211 9 862
8 782 7 130
101 961 1 164 561 - 375 590 - 344 237 - 31 353
63 651 264 479 20 989 459 979 17 321 64 513
72 375 151 206 64 514 -
- 64 134 5 718 83 450 2 143 3 622
- 384 254 - 362 850 - 21 404
Foreign Mixed Foreign Total parentage parentage born
188 483 79 994 108 489 346 898 176 615 76 878 99 737 293 447 176 615 76 878 99 737 293 447 23 176 7 753 15 423 104 387 20 19J 6 644 13 549 BB 517 2 983 1 109 1 874 15 870
24 608 9 894 14 714 82 873 123 796 56 620 67 176 75 974
5 035 2 611 2 424 30 213
36439 12 117 24 322 4 367 23 176 7 753 15 423 -20 193 6 644 13 549 -2 983 1 109 l 874 -4 906 2 677 2 229 2 275 7 218 1 104 6 114 849 1 139 583 556 1 243
14 989 2 935 12 054 455 - - - -
12 363 2 813 9 550 -2 400 52 2 348 75
226 70 156 380
96 783 60 924 35 859 264 195 - - - 104 387 - - - 88 517 - - - 15 870
7 339 4 404 2 935 59 798 86 209 54 717 31 492 73 535 3 235 l 803 1 432 26 475
28 404 902 27 502 24 430 - - - -- - - 20 800
27 969 747 27 222 1 515 435 155 280 2 115
11 868 3 116 8 752 53 451 11 201 3 005 8 196 52 624
667 l11 556 827
l 595 582 864 123 731 459 I 127 526 1 424 277 763 442 660 835 914 577 1 424 277 763 442 660 835 914 577
498 143 313 949 184 194 375 590 447 112 282 163 164 949 344 237
51 031 31 786 19 245 31 353 418 678 248 7JO 169 948 301 505 467 616 175 495 292 121 155 297 39 840 25 268 14 572 82 185
765 231 457 506 307 725 58 417 498 143 313 949 184 194 -447 112 282 163 164 949 -
51 031 31 786 19 245 -175 968 120 105 55 863 33 155 65 875 6 357 59 518 3 747 25 245 17 095 8 150 21 515
195 603 86 992 108 611 3 836 - - - -
182 447 84 761 97 686 -9 698 279 9 419 164 3 458 1 952 1 506 3 672
382 419 217 360 165 059 762 142 - - - 375 590 - - - 344 237 - - - 31 353
{/.) 263 43 864 16 399 204 216 311 804 167 483 144 321 148 175
10 352 6 013 4 339 54 161
81 024 l 584 79 440 70 182 - - - -- - - 64 134
80 239 1 376 78 863 3 211 785 208 577 2 837
171 305 100 681 70 624 212 949 160 109 93 983 66 126 202 741
11 196 6 698 4 498 10 208
505
Appendix A.-GENERAL INFORMATION CONCERNING THE DATA
PRESENTATION OF THE DATA .• App·1
Derived figures (percents, medians, etc.l .....•...•.•...•.....• , . App-1
Symbols ...•.....•.•.•.......• App-1
Boundaries .....•.....•........ App·1
DATA COLLECTION PROCEDURES ..........•.... App-1
PROCESSING PROCEDURES .... App-2
PRESENTATION OF THE DATA
Derived figures (percents, medians, etc.).-Percents, medians, and means, as well as certain rates and ratios are shown in Volume 11 reports. For all types of derived figures in this series of reports, the figure is not presented (but indicated by three dots " ... ") if the base is smaller than the minimum number prescribed for the sample on which the figure is based. The minimum bases for 1970 are 100 (persons, families, or households) for the 20-percent sample, 132 for the 15-percent, and 400 for the 5-percent.
The reader should exercise caution in the use and interpretation of data for very small subgroups of the population; these data are especially subject to the effects of sampling variability, misreporting, and processing errors.
Percents that round to less that 0.1 are not shown but indicated as zero (i.e .. "-"). The median, which is a type of average, is the middle value in a distribution; i.e., the median divides the distribution into two equal partsone-half of the cases fall below the median and one-half of the cases exceed the median. When the median falls in the lower terminal category of an open-end distribution, the method of presentation is to show the initial value of the next category followed by a minus sign; thus, for example, if the median falls in the category "Less than
$250," it is shown as "$250-." When the median falls in the upper terminal category of an open-end distribution, the method of presentation is to show the initial value of the terminal category followed by a plus sign; thus, for example, if the median falls· in the category "$10,000 and over," it is shown as "$10,000+ ."The mean is the arithmetic average derived by adding the values in a particular distribution and dividing by the number of units in the distribution.
Symbols.-A dash "-" signifies zero. Three dots " ... " mean not applicable, or that the base for the derived figure is too small for it to be shown. The symbol "NA" means not available.
Boundaries.-The data shown for 1970 relate to boundaries as they existed on January 1, 1970. Information on boundary changes between 1960 and 1970 for certain types of areas is given in the Volume I report for each State.
DATA COLLECTION PROCEDURES
The 1970 census was conducted primarily through self-enumeration. In 1960, self-enumeration was first intro· duced on a nationwide scale as a substitute for the traditional census direct interview.
A census questionnaire was delivered by postal carriers to every household several days before Census Day, April 1, 1970. This questionnaire contained certain explanatory information and was accompanied by an instruction sheet; in areas with comparatively large proportions of Spanish-speaking persons, a Spanish version of the instruction sheet was also enclosed. Facsimiles of the questionnaires and instructions to respondents are included in the Volume I reports.
In the larger metropolitan areas and some adjacent counties, altogether containing about three-fifths of the population of the United States, the householder was requested to fill out and mail back the form on Census Day. Approximately 87 percent of the householders returned their forms by mail. The mailed-back forms were reviewed by the census enumerator (or, in some localities, a census clerk) and if the form was determined to be incomplete or inconsistent, a followup was made. The bulk of these followups were made by telephone, the rest by personal visit. For the households which did not mail back their forms, a followup was also made, in almost all cases by personal visit and in the remainder by telephone.
For the remaining two-fifths of the population, the householder was requested to fill out the form and give it to the enumerator when he called; approximately 80 percent did so. Incomplete and unfilled forms were completed by interview during the enumerator's visit.
Three types of questionnaires were used throughout the country; 80 per· cent of the households answered a form containing a limited number of population and housing questions, and the remainder, split into 15-percent and 5-percent samples, answered forms which contained these questions as well as a number of additional questions. Some of the additional questions were the same on the 15-percent and 5·percent versions; others were different. A random procedure was u$ed to determine which of the three forms any particular household answered.
In the metropolitan and adjacent areas, the designated type was sent to each household. In the remaining
App-1

APPENDIX A-Continued
areas, the questionnaire with a limited number of questions was distributed to all households, and the enumerators asked the additional questions in those households designated for the 15-per· cent and 5-percent samples.
PROCESSING PROCEDURES
The 1970 census questionnaires were specially designed to be processed by FOSDIC (Film Optical Sensing Device for Input to Computer). For most items on the questionnaire, the infor· mation supplied by the respondent or obtained by the enumerator was indi· cated by marking the answers in pre· designated positions that would be "read" by FOSDIC from a microfilm
App-2
copy of the questionnaire onto computer magnetic tape with no inter· vening manual processing. Among the items covered in these reports, how· ever, a number required reviewing written entries to determine the proper code. Consequently, the proc· essing involved a manual coding and editing operation in which clerks determined the appropriate codes and marked the specified positions on the questionnaire; for example, the clerks applied a 2.cJigit numerical code for the State-of-birth entry. These marks as well as those made by the respondent and enumerator were read by FOSDIC onto magnetic tape.
The tape containing the informa· tion from the questionnaires was proc-
essed on the Census Bureau's computers th rough a number of
editing and tabulation steps (see' Appendix D, "Accuracy of the Data"). Figures shown in this series of reports may differ from comparable figures in Volume I because of differences in processing.
One of the end results of the tabulation operation was a computer tape from which the tables in this report were prepared on a cathoderay-tube phototypesetting machine at the Government Printing Office. Another end result was the summary tapes which are available for purchase, as described in Appendix E, "Publication and Computer Summary Tape Program."
Appendix B.-AREA CLASSIFICATIONS
USUAL PLACE OF RESIDENCE . . . • • . . • • . • . App-3
URBAN AND RURAL RESIDENCE . • . . . • • . • . . . App-3
Definition . . • . • • . . . • • . • • . App-3
Farm and nonfarm residence . . . • App-3
REGIONS AND GEOGRAPHIC DIVISIONS • . . • . . • • • • . . . App-3
COUNT I ES . • • • . . • . • . • . • • App-3
URBANIZED AREAS • . • . . . • App-3
STANDARD METROPOLITAN STATISTICAL AREAS • • . . . . App-3
USUAL PLACE OF RESIDENCE
In accordance with census practice dating back to 1790, each person enumerated in the 1970 census was counted as an inhabitant of his usual place of residence, which is generally construed to mean the place where he lives and sleeps most of the time. This place is not necessarily the same as his legal residence, voting residence, or domicile. In the vast majority of cases, however, the use of these different bases of classification would produce substantially the same statistics, although there may be appreciable differences for a few areas. (The Volume I reports of the 1970 Census of Population contain a more com· plete discussion of the residence rules for certain categories of persons whose usual place of residence is not i mmedi· ately clear.)
URBAN AND RURAL RESIDENCE
Definition.-The urban population ~mprises all persons living in urban· ized areas and in places of 2 500 inhabitants or more outside urba~ized areas. More specifically, the urban Population consists of all persons living in (a) places of 2,500 inhabitants
or more incorporated as cities, villages, boroughs (except Alaska), and towns (except in the New England States, New York, and Wisconsin), but ex· cl uding those persons living in the rural portions of extended eities;1 (b) unincorporated places of 2,500 inhabi· tan ts or more; and (c) other territory, incorporated or unincorporated, in· eluded in urbanized areas. The popula· tion not classified as urban constitutes the rural population.
Farm and nonfarm residence.-The rural population is subdivided into the rural-farm population, which com· prises all rural residents living on farms, and the rural-nonfarm population, which comprises the remaining rural population. As in the 1960 cen· sus, the farm population consists of persons living on places of 10 or more acres from which sales of farm pro· ducts amounted to $50 or more in the preceding calendar year or on places of less than 1 O acres from which sales of farm products amounted to $250 or more in the preceding year.
REGIONS AND GEOGRAPHIC DIVISIONS
For statistical presentation, the United States is sometimes divided into re· gions. The regions may be subdivided into geographic divisions, which are combinations of States. Generally, four regions are shown-Northeast, North Central, South, and West-but the first two may be combined into one region, the North. In reports that present statistics for regions, a map
1 Extended cities are so designated because they have one or more large portions (normally at the boundary of the city) with relatively low population density. These portions are classified as ~ural, an? the residents, as a rule, are not included 1n the urban population.
following the contents page shows the States included in each region and division.
COUNTIES
The primary divisions of the States are, in general, termed counties, but in Louisiana these divisions are known as parishes. There are no counties in Alaska. In this State, statistical areas called census divisions were developed for general statistical purposes through the cooperation of the State and the Census Bureau and are treated as county equivalents. In four States (Maryland, Missouri, Nevada, and Vir· gin ia), there are one or more cities which are independent of any county organization and thus constitute pri· mary divisions of their States.
URBANIZED AREAS
An urbanized area, generally, consists of at least one city of 50,000 inhabi· tants or more in 1970 and the sur· rounding closely settled area that meets certain criteria of population density or land use. An urbanized area may be subdivided into the central city or cities, and the remainder of the area or "urban fringe." The central city portion, generally, consists of the population of the city or cities named in the title of the urbanized area.
STANDARD METROPOLITAN STATISTICAL AREAS
Except in the New England States, a standard metropolitan statistical area is a county or group of contiguous counties which contains at least one city of 50,000 inhabitants or more, or "twin cities" with a combined popula· tion of at least 50,000. In addition to the county, or counties, containing
App-3
APPENDIX B-Continued
such a city or cities, contiguous counties are included in an SMSA if, according to certain criteria, they are socially and economically integrated with the central city or cities. In the New England States, SMSA's consist of towns and cities instead of counties.
App-4
Each SMSA must include at least one central city, and the complete title of an SMSA identifies the central city or cities.
The population living in SMSA's is designated as the metropolitan popula-
tion. The population living outside SMSA's constitutes the nonmetropolitan population. The metropolitan population may be subdivided into those living in the central city or cities and those living in the balance of the SMSA.
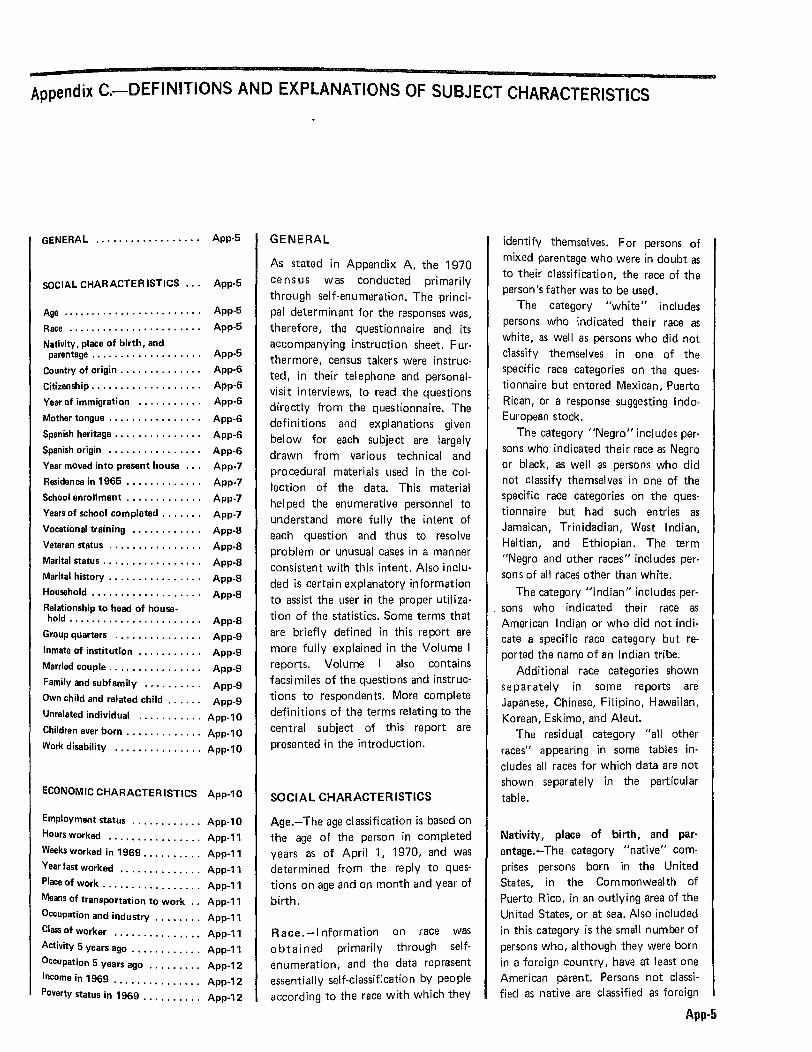
Appendix C.-DEFINITIONS AND EXPLANATIONS OF SUBJECT CHARACTERISTICS
GENERAL . • . . . . . . . . . . . . • • . . App-5
SOCIAL CHARACTERISTICS . . • App-5
Age •...•......••... ·.••...• App-5
Race . . . . . • . . . . . . . . . . . . . . . . . App-5
Nativity, place of birth, and parentage . . . . . . . . . • . . . • . . . . . App-5
Country of origin . . • . . . . . . . . . . . App·6
Citizenship . . . . . . . . • . . . . . . . . . . App-6
Year of immigration • . . • . . . . . . . App·6
Mother tongue . . . . • . • . . . . . . . . . App-6
Spanish heritage . . . . . . . . . • . . . . . App·6
Spanish origin • . • . . . . . . . . . . . . . App-6
Year moved into present house • . . App·?
Residence in 1965 . • . . . . . . . . . . . App·?
School enrollment . • • . . . . • . . . . . App-7
Years of school completed , . . . . . . App-7
Vocational training ... , . . . . . . . . App·8
Veteran status ......•.• , . . • . . . App·8
Marital status .•...•.... , . . • • . . App-8
Marital history . . . . . . . • • . . . . . . . App-8
Household . . • . . . . . . . . . . . . . . • . App·8
Relationship to head of house· hold •... , ••.....•. ,........ App-8
Group quarters . . . . . . . . . . . . . . . App-9
Inmate of institution . . . . . . . . . . . App·9
Married couple . . . . • . . . . . . . . . . . App-9
Family and subfamily . , . . . . . . . . App-9
Own child and related child . . . . . . App·9
Unrelated individual ........... App-10
Children ever born ........•.... App·10
Work disability ............... App·10
ECONOMIC CHARACTERISTICS App-10
Employment status . . . . . . . . . . . . App-1 O
Hours worked .. .. .. .. .. . .. .. . App-11
Weeks Worked in 1969 .....•.... App-11
Year last worked •........•.... App-11
Place of work ......... , . . . . . . . App-11
Means of transportation to work . . App· 11
Occupation and industry . . . • . . . . App· 11
Class of worker .... , . . . . . . . . . • App-11
Activity 5 years ago . . . . . . . . . . . . App-11
Occupation 5 years ago ...••.... App-12
Income in 1969 ........•.....• App-12
Poverty status in 1969 .....•.. , . App-12
GENERAL
As stated in Appendix A, the 1970 census was conducted primarily through self-enumeration. The princi· pal determinant for the responses was, therefore, the questionnaire and its accompanying instruction sheet. Fur· thermore, census takers were instruc· ted, in their telephone and personalvisit interviews, to read the questions directly from the questionnaire. The definitions and explanations given below for each subject are largely drawn from various technical and procedural materials used in the col· lection of the data. This material helped the enumerative personnel to understand more fully the intent of each question and thus to resolve problem or unusual cases in a manner consistent with this intent. Also inclu· ded is certain explanatory information to assist the user in the proper utilization of the statistics. Some terms that are briefly defined in this report are more fully explained in the Volume I reports. Volume I also contains facsimiles of the questions and instruc· tions to respondents. More complete definitions of the terms relating to the central subject of this report are presented in the introduction.
SOCIAL CHARACTERISTICS
Age.-The age classification is based on the age of the person in completed years as of April 1, 1970, and was determined from the reply to ques· tions on age and on month and year of birth.
Race.-1 nformation on race was obtained primarily through self· enumeration, and the data represent essentially self-classification by people according to the race with which they
identify themselves. For persons of mixed parentage who were in doubt as to their classification, the race of the person's father was to be used.
The category "white" includes persons who indicated their race as white, as well as persons who did not classify themselves in one of the specific race categories on the ques· tionnaire but entered Mexican, Puerto Rican, or a response suggesting lndoEuropean stock.
The category "Negro" includes per· sons who indicated their race as Negro or black, as well as persons who did not classify themselves in one of the specific race categories on the questionnaire but had such entries as Jamaican, Trinidadian, West Indian, Haitian, and Ethiopian. The term "Negro and other races" includes per· sons of all races other than white.
The category "Indian" includes persons who indicated their race as American Indian or who did not indi· cate a specific race category but reported the name of an Indian tribe.
Additional race categories shown separately in some reports are Japanese, Chinese, Filipino, Hawaiian, Korean, Eskimo, and Aleut.
The residual category "all other races" appearing in some tables includes all races for which data are not shown separately in the particular table.
Nativity, place of birth, and par· entage.-The category "native" com· prises persons born in the United States, in the Commonwealth of Puerto Rico, in an outlying area of the United States, or at sea. Also included in this category is the small number of persons who, although they were born in a foreign country, have at least one American parent. Persons not classified as native are classified as foreign
App-5
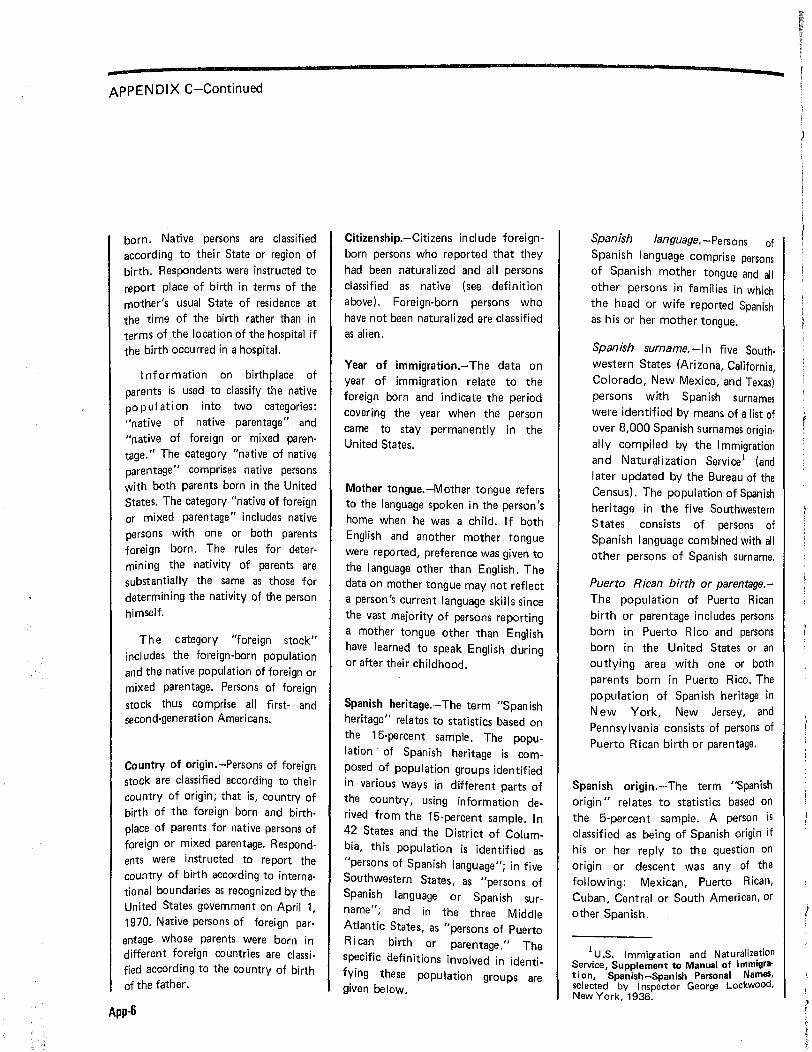
APPENDIX C-Continued
born. Native persons are classified according to their State or region of birth. Respondents were instructed to report place of birth in terms of the mother's usual State of residence at the time of the birth rather than in terms of the location of the hospital if the birth occurred in a hospital.
J nformation on birthplace of parents is used to classify the native population into two categories: "native of native parentage" and "native of foreign or mixed parentage." The category "native of native parentage" comprises native persons with both parents born in the United States. The category "native of foreign or mixed parentage" includes native persons with one or both parents foreign born. The rules for determining the nativity of parents are substantially the same as those for determining the nativity of the person himself.
The category "foreign stock" includes the foreign-born population and the native population of foreign or mixed parentage. Persons of foreign stock thus comprise all first- and second-generation Americans.
Country of origin.-Persons of foreign stock are classified according to their country of origin; that is, country of birth of the foreign born and birthplace of parents for native persons of foreign or mixed parentage. Respondents were instructed to report the country of birth according to international boundaries as recognized by the United States government on April 1, 1970. Native persons of foreign par· entage whose parents were born in different foreign countries are classified according to the country of birth of the father.
App-6
Citizenship.-Citizens include foreignborn persons who reported that they had been naturalized and all persons classified as native (see definition above). Foreign-born persons who have not been naturalized are classified as alien.
Year of immigration.-The data on year of immigration relate to the foreign born and indicate the period covering the year when the person came to stay permanently in the United States.
Mother tongue.-Mother tongue refers to the language spoken in the person's home when he was a child. If both English and another mother tongue were reported, preference was given to the language other than English. The data on mother tongue may not reflect a person's current language skills since the vast majority of persons reporting a mother tongue other than English have learned to speak English during or after their childhood.
Spanish heritage.-The term "Spanish heritage" relates to statistics based on the 15-percent sample. The population · of Spanish heritage is composed of population groups identified in various ways in different parts of the country, using information derived from the 15-percent sample. In 42 States and the District of Columbia, this population is identified as "persons of Spanish language"; in five Southwestern States, as "persons of Spanish language or Spanish surname"; and in the three Middle Atlantic States, as "persons of Puerto Rican birth or parentage." The specific i:lefinitions involved in identifying these population groups are given below.
Spanish language.-Persons of Spanish language comprise persons of Spanish mother tongue and all other persons in families in which the head or wife reported Spanish as his or her mother tongue.
Spanish surname.-ln five South· western States (Arizona, California, Colorado, New Mexico, and Texas) persons with Spanish surnames were identified by means of a list of over 8,000 Spanish surnames origin· ally compiled by the Immigration and Naturalization Service1 (and later updated by the Bureau of the Census). The population of Spanish heritage in the five Southwestern States consists of persons of Spanish language combined with all other persons of Spanish surname.
Puerto Rican birth or parentage.The population of Puerto Rican birth or parentage includes persons born in Puerto Rico and persons born in the United States or an outlying area with one or both parents born in Puerto Rico. The population of Spanish heritage in New York, New Jersey, and Pennsylvania consists of persons of Puerto Rican birth or parentage.
Spanish origin.-The term "Spanish origin" relates to statistics based on the 5-percent sample. A person is classified as being of Spanish origin if his or her reply to the question on origin or descent was any of the following: Mexican, Puerto Rican, Cuban, Central or South American, or other Spanish.
1 U.S. Immigration and Naturaliz~tion Service, Supplement to Manual of lmm1gra· tion, Spanish-Spanish Personal Names, selected by Inspector George Lockwood, New York, 1936.
f ' I f;
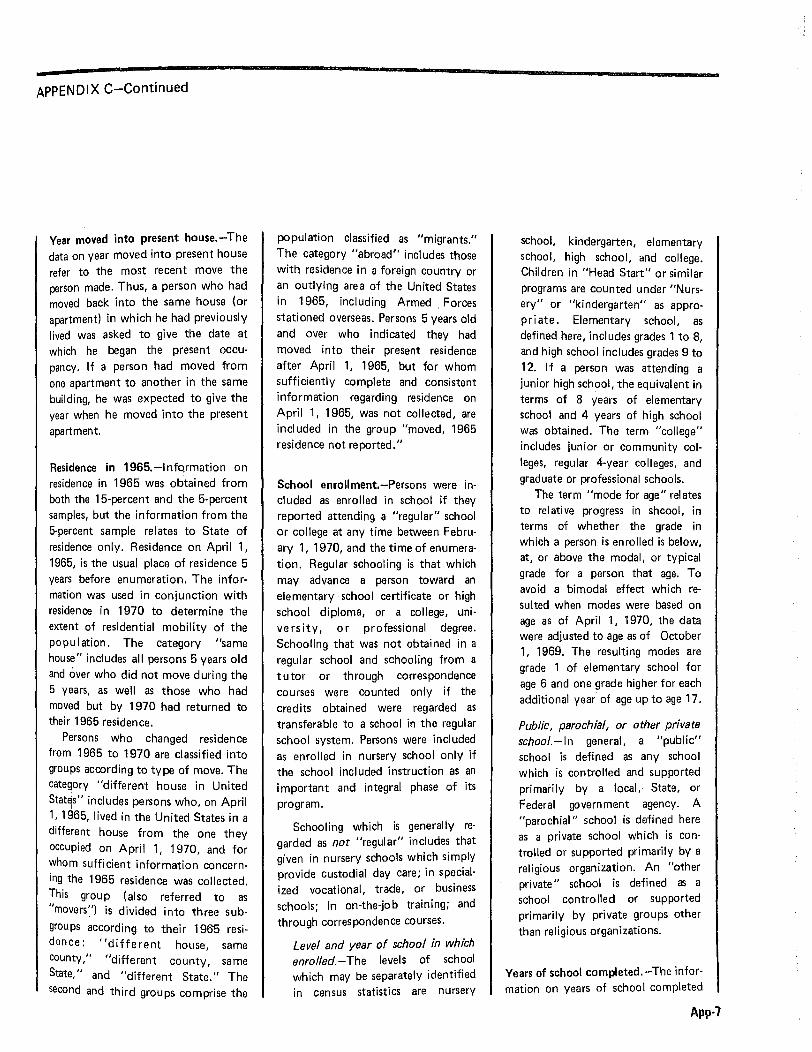
APPENDIX C-Continued
Vear moved into present house. -The data on year moved into present house refer to the most recent move the person made. Thus, a person who had moved back into the same house (or apartment) in which he had previously lived was asked to give the date at which he began the present occupancy. If a person had moved from one apartment to another in the same building, he was expected to give the year when he moved into the present apartment.
Residence in 1965.-lnfQrmation on residence in 1965 was obtained from both the 15-percent and the 5-percent samples, but the information from the 5-percent sample relates to State of residence only. Residence on April 1, 1965, is the usual place of residence 5 years before enumeration. The information was used in conjunction with residence in 1970 to determine the extent of residential mobility of the po pu I ation. The category "same house" includes all persons 5 years old and over who did not move during the 5 years, as well as those who had moved but by 1970 had returned to their 1965 residence.
Persons who changed residence from 1965 to 1970 are classified into groups according to type of move. The category "different house in United Stat~s" includes persons who, on April 1, 1965, lived in the United States in a different house from the one they occupied on April 1, 1970, and for whom sufficient information concerning the 1965 residence was collected. This group (also referred to as "movers'.') is divided into three subgroups according to their 1965 residence: "different house, same county," "different county, same State," and "different State." The second and third groups comprise the
population classified as "migrants." The category "abroad" includes those with residence in a foreign country or an outlying area of the United States in 1965, including Armed . Forces stationed overseas. Persons 5 years old and over who indicated they had moved into their present residence after April 1, 1965, but for whom sufficiently complete and consistent information regarding residence on April 1, 1965, was not collected, are included in the group "moved, 1965 residence not reported."
School enrollment.-Persons were included as enrolled in school if they reported attending a "regular" school or college at any time between February 1, 1970, and the ti me of enumeration. Regular schooling is that which may advance a person toward an elementary school certificate or high school diploma, or a college, uni· versity, or professional degree. Schooling that was not obtained in a regular school and schooling from a tutor or through correspondence courses were counted only if the credits obtained were regarded as transferable to a school in the regular school system. Persons were included as enrolled in nursery school only if the school included instruction as an important and integral phase of its program.
Schooling which is generally re· garded as not "regular" includes that given in nursery schools which simply provide custodial day care; in special· ized vocational, trade, or business schools; in on·the-jo b training; and through correspondence courses.
Level and year of school in which enrolled.-The levels of school which may be separately identified in census statistics are nursery
school, kindergarten, elementary school, high school, and college. Children in "Head Start" or similar programs are counted under "Nursery" or "kindergarten" as appropriate. Elementary school, as defined here, includes grades 1 to 8, and high school includes grades 9 to 12. If a person was attending a junior high school, the equivalent in terms of 8 years of elementary school and 4 years of high school was obtained. The term "college" includes junior or community colleges, regular 4-year colleges, and graduate or professional schools.
The term "mode for age" relates to relative progress in shcool, in terms of whether the grade in which a person is enrolled is below, at, or above the modal, or typical grade for a person that age. To avoid a bimodal effect which resulted when modes were based on age as of April 1, 1970, the data were adjusted to age as of October 1, 1969. The resulting modes are grade 1 of elementary school for age 6 and one grade higher for each additional year of age up to age 17.
Public, parochial, or other private school.-ln general, a "public" school is defined as any school which is controlled and supported primarily by a local, State, or Federal government agency. A "parochial" school is defined here as a private school which is controlled or supported primarily by a religious organization. An "other private" school is defined as a school controlled or supported primarily by private groups other than religious organizations.
Years of school completed.-The infor· mation on years of school completed
App-7
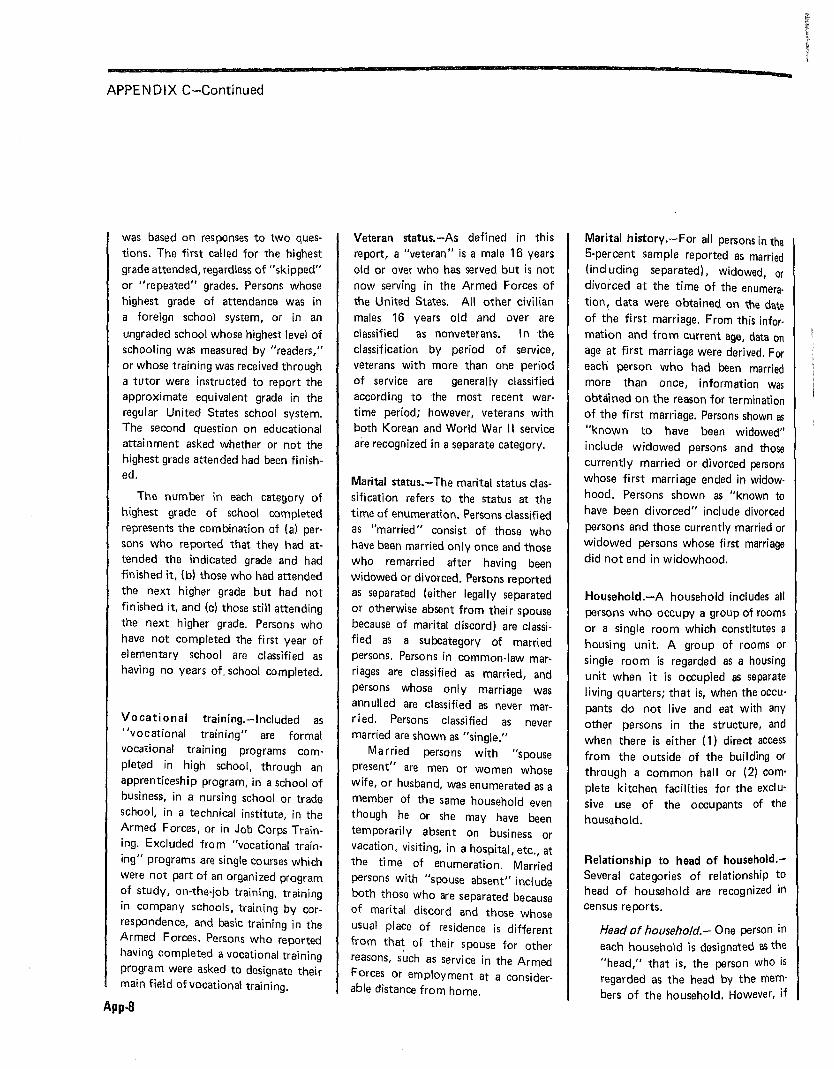
APPENDIX C-Continued
was based on responses to two questions. The first called for the highest grade attended, regardless of "skipped" or "repeated" grades. Persons whose highest grade of attendance was in a foreign school system, or in an
ungraded school whose highest level of schooling was measured by "readers," or whose training was received through a tutor were instructed to report the approximate equivalent grade in the regular United States school system. The second question on educational attainment asked whether or not the highest grade attended had been finished.
The number in each category of highest grade of school completed represents the combination of (a) persons who reported that they had attended the indicated grade and had finished it, {b} those who had attended the next higher grade but had not finished it, and (c) those still attending the next higher grade. Persons who have not completed the first year of elementary school are classified as having no years of. school completed.
Vocational training.-lncluded as ''vocational training" are formal vocational training programs completed in high school, through an apprenticeship program, in a school of business, in a nursing school or trade school, in a technical institute, in the Armed Forces, or in Job Corps Training. Excluded from "vocational training" programs are single courses which were not part of an organized program of study, on-the·job training, training in company schools, training by correspondence, and basic training in the Armed Forces. Persons who reported having completed a vocational training program were asked to designate their main field of vocational training.
App-8
Veteran status.-As defined in this report, a "veteran" is a male 16 years old or over who has served but is not now serving in the Armed Forces of the United States. All other civilian males 16 years old and over are classified as nonveterans. In the classification by period of service, veterans with more than one period of service are generally classified according to the most recent wartime period; however, veterans with both Korean and World War II service are recognized in a separate category.
Marital status.-The marital status classification refers to the status at the time of enumeration. Persons classified as "married" consist of those who have been married only once and those who remarried after having been widowed or divorced. Persons reported as separated (either legally separated or otherwise absent from their spouse because of marital discord) are classified as a subcategory of married persons. Persons in common-law marriages are classified as married, and persons whose only marriage was annulled are classified as never married. Persons classified as never married are shown as "single."
Married persons with "spouse present" are men or women whose wife, or husband, was enumerated as a member of the same household even though he or she may have been temporarily absent on business or vacation, visiting, in a hospital, etc., at the time of enumeration. Married persons with "spouse absent" include both those who are separated because of marital discord and those whose usual place of residence is different from tha~ of their spouse for other reasons, such as service in the Armed Forces or employment at a considerable distance from home.
Marital history.·-For all persons in the 5-percent sample reported as married (including separated), widowed, or divorced at the time of the enurnera· tion, data were obtained on the date of the first marriage. From this infor· mation and from current age, data on age at first marriage were derived. For each person who had been married more than once, information was obtained on the reason for termination of the first marriage. Persons shown as "known to have been widowed" include widowed persons and those currently married or divorced persons whose first marriage ended in widowhood. Persons shown as "known to have been divorced" include divorced persons and those currently married or widowed persons whose first marriage did not end in widowhood.
Household.-A household includes all persons who occupy a group ot rooms or a single room which constitutes a housing unit. A group of rooms or single room is regarded as a housing unit when it is occupied as separate living quarters; that is, when the occu· pants do not live and eat with any other persons in the structure, and when there is either ( 1) direct access from the outside of the building or through a common hall or (2) com· plete kitchen facilities for the exclusive use of the occupants of the household.
Relationship to head of household.Several categories of relationship to head of household are recognized in census reports.
Head of household.- One person in
each household is designated as the "head," that is, the person who is regarded as the head by the members of the household. However, if

APPENDIX C-Continued
a married woman living with her husband was reported as the head, her husband was considered the head for the purpose of simplifying the tabulations.
Two types of household head are distinguished-the head of a family and a primary individual. A family head is a household head living with one or more persons related to him by blood, marriage, or adoption. A primary individual is a household head living alone or with nonrelatives only.
Wife of head.-A woman married to and living with a household head, including women in common-law marriages as wel I as women in formal marriages.
Child of head.-A son, daughter; stepchild, or adopted child of the head of the household of which he is a member, regardless of the child's age or marital status. The category excludes sons-in-law and daughters-in-law. (See definition of "own child" below.)
Other relative of head.-Any person related to the household head by blood, marriage, or adoption, who is not included in one of the specific relationship categories shown in the particular table.
Not related to head.-All persons in the household not related to the head by blood, marriage, or adoption. Roomers, boarders, I odgers, partners, resident employees, wards, and foster children are included in this category.
Group quarters.-All persons not I iving in households are classified by the Bureau of the Census as living in group quarters. Group quarters are located most frequently in institutions, room-
ing houses, military barracks, college dormitories, fraternity and sorority houses, hospitals, monasteries, convents, and ships. A house or apartment is classified as group quarters if there are five or more persons unrelated to the head; or, when no head is designated, if six or more unrelated persons share the unit. Certain types of living quarters, e.g., college dormitories and military barracks, are classified as group quarters regardless of the number of persons in the unit. Two general categories of persons in group quarters are recognized: inmates of institutions and all other persons in group quarters.
Inmate of institution.-Persons under care or custody in institutions at the time of enumeration are classified as "inmate of institution" regardless of their length of stay in that place and regardless of the number of people in that place. Institutions are a subcate· gory of group quarters and include homes, schools, hospitals, or wards for juveniles, for the physically handicapped, or for the mentally handi· capped; hospitals for mental, tuber· cular, or chronic disease patients; homes for unwed mothers; nursing, convalescent and rest homes; homes for the aged and dependent; and correctional institutions.
Married couple.-A married couple is defined as a husband and his wife enumerated as members of the same household. The number of married couples, as shown in this report, is identical to the number of married men with wife present.
A "married couple with own household" is a married couple in which the husband is a household head; the number of such married couples is the same as the number of "husband-wife
families." Married couples without own household are, by census defini· tion, the same as married couples in subfamilies.
Family and subfamily.-According to 1970 census definitions, a family consists of a household head and one or more other persons living in the same household who are related to the head by blood, marriage, or adoption; all persons in a household who are related to the head are regarded as family members. A "husband-wife family" is a family in which the head and his wife are enumerated as members of the same household. Not all households contain families, because the household head may be living alone or with nonrelatives only. The mean size of family is derived by dividing the number of persons in families by the total number of families.
A subfamily is a married couple with or without children, or one parent with one or more single children under 18 years old, living in a household and related to, but not including, the head of the household or his wife. The most common example of a subfamily is a young married couple sharing the home of the husband's or wife's parents. Members of a subfamily are also included among the members of a family. The number of subfamilies, therefore, is not included in the number of families.
Own child and related child.-Statistics on the presence of "own" children may be shown for married couples, families, subfamilies, or women ever married. An "own child" is a child under 18 years of age re ported as a single (never married) son, daughter, stepchild, or adopted child of the
App-9

APPENDIX C-Continued
specified person(s). The term "sons/ daughters" is used when the designated group includes children 18 years old and over; the term includes all sons and daughters regardless of marital status or age. The number of "children living with both parents" includes stepchildren and adopted children as well as sons and daughters born to the couple.
The term "related children" includes not only "own" children, as defined above, but also all other family members, regardless of marital status, who are under 18 years old (except the head or wife).
Unrelated individual.-An unrelated individual may be (1) a household head living alone or with nonrelatives only, (2) a household member who is not related to the head, or (3) a person living in group quarters who is not an inmate of an institution. Unrelated individuals who are household heads are called "primary individuals"; those who are not household heads are called "secondary individuals." In tables on income and poverty status, unrelated individuals are limited to those 14 years of age or older. In statistics on poverty status of unrelated individuals, college students living in dormitories and members of the Armed Forces living in barracks are excluded.
Children ever born.-ln reporting statistics on children ever born, respondents were instructed to include children born to the woman before her present marriage, children no longer living, and children away from home, as well as children born to the woman who were still living in the home.
Work disability.-The information on disability was used to identify persons
App-10
hindered because of a health or physical condition from working at a job. The question refers to a serious illness that has lasted (or is likely to last) for a relatively long time, or a serious physical or mental irnpairment, defect, or handicap. Also determined was whether such persons were able to work at all and how long each person had been limited in his working ability.
ECONOMIC CHARACTERISTICS
Employment status.-According to current definition, the labor force and the various employment status categories relate to the population 16 years old and over. However, in this series of reports, data are sometimes shown for persons 14 and 15 years old as well.
Reference week.-Data on employment status refer to the calendar week prior to the date on which respondents completed their questionnaires or were interviewed by enumerators. Since the week of enumeration was not the same for all persons, the reference week for amployment data is not entirely uniform.
Employed. - Em ployed persons comprise all civilians 16 years old and over who were either (a) "at work"-those who did any work at all as paid employees or in their own business or profession, or on their own farm, or who worked 15 hours or more as unpaid workers on a family farm or in a family business; or (b) were "with a job but not at work"-those who did not wor~ during the reference week but had jobs or businesses from which they were temporarily absent due to illness, bad weather, industrial
dispute, vacation, or other personal reasons. Excluded from the employed are persons whose only activity consisted of work around the house or volunteer work for religious, charitable, and similar organizations.
Unemployed.-Persons are classified as unemployed if they were civilians 16 years old and over and: (a) were neither "at work" nor "with a job, but not at work" during the reference week, (b) were looking for work during the past 4 weeks, and (c) were available to accept a job.
Also included as unemployed are persons who did not work at all during the reference week and were waiting to be called back to a job from which they had been laid off.
Experienced unemployed.-Unemployed persons who have worked at any ti me in the past are classified as the "experienced unemployed."
Civilian labor force.-The civilian labor force consists of persons classified as employed or unemployed in accordance with the criteria described above.
Experienced civilian labor force.The "experienced civilian labor force" comprises the employed and experienced unemployed.
Labor force.-The labor force includes all persons classified in the civilian labor force plus members of the Armed Forces (persons on active duty with the United States Army, Air Force, Navy, Marine Corps, or Coast Guard).
Not in labor force.-All persons 16 years old and over who are not classified as members of the labor
APPENDIX C-Continued
force are defined as "not in labor to rce." This category consists mainly of students, housewives, retired workers, seasonal workers enumerated in an "off" season who were not looking for work, inmates of institutions, disabled persons, and persons doing only incidental unpaid family work (less than 15 hours during the reference week).
Hours worked.-The statistics on hours worked relate to persons "at work" during the reference week and represent the number of hours actually worked at all jobs during that week. They do not necessarily reflect the number of hours usually worked or the scheduled number of hours. The category "at work, full-time" includes persons who worked 35 hours or more during the reference week, and the category "at work, part-ti me" includes persons who worked 1 to 34 hours during the reference week.
Weeks worked in 1969.--Data on weeks worked pertain to the number of weeks during 1969 in which a person did any work for pay or profit (including paid vacation and sick leave) or worked without pay on a family farm or in a family business. Weeks of active service in the Armed Forces are also included.
Year last worked.-The "year last worked" pertains to the most recent year in which a person did any work for pay or profit, or worked without pay on a family farm or in a family business, or was on active duty in the Armed Forces.
Place of work.·-Place of work refers to the geographic location at which civilians and Armed Forces personnel not on leave carried out their occu-
pational or job activities during the calendar week prior to the date on which respondents completed their questionnaires or were interviewed by enumerators.
Means of transportation to work.·~
Means of transportation to work refers to the chief means (i.e., covering the greatest distance) of travel or type of conveyance used in traveling to and from work on the last day the respondent worked at the address given as his or her place of work.
Occupation and industry.-For employed persons the data on occupation and industry refer to the job held during the reference week. For persons employed at two or more jobs, the data refer to the job at which the person worked the greatest number of hours. For the unemployed with work experience and for persons not currently in the labor force who worked at some ti me after 1959, these data refer to the last job the person held. The occupation and industry statistics presented here are based on the detailed systems developed for the 1970 census: see 1970 Census of Population, Classified Index of Indus· tries and Occupations, U.S. Government Printing Office, Washington, D.C., 1971.
The major occupation groups are sometimes combined into four divisions, as follows:
White collar. -Professional, technical, and kindred workers; managers and administrators, except farm; sales workers; and clerical and kindred workers.
Blue collar.-Craftsmen and kindred workers; operatives, except transport; transport equipment operatives; and laborers, except farm.
Farm workers.-F armers and farm managers, farm laborers and farm foremen.
Service workers.-Service workers including private households.
The sequence in which these four divisions appear is not intended to imply that any division has a higher social or skill level than another.
Class of worker .-The information on class of worker refers to the same job as the information on occupation and industry. There are two major classof-worker categories:
1. Wage and salary workers are persons who work for an employer for wages, salary, commission, tips, pay in kind, or pay at piece rates. This category may be subdivided into government or private. Govern
ment workers include employees of any Federal, State, or local governmental unit, regardless of the activity of the particular agency.
2. Self-employed workers are those who work for profit or fees in their own unincorporated business, profession, or trade, or who operate a farm. Also included in this group are the small number of "unpaid family workers," i.e., persons working without pay in a business operated by a person to whom they are related by blood, marriage, or adoption.
Activity 5 years ago. - A person is classified as a "worker in 1965" if he answered "yes" to either (a) working or (b) in the Armed Forces. All other persons are classified as nonworkers in 1965. The number of workers in 1965 may be understated, since there is a tendency for respondents to forget
App-11
APPENDIX C-Continued
intermittent or short periods of employment.
Occupation 5 years ago. - Classification by occupation 5 years ago was based on the Classified Index of Industries and Occupations, referred to above. There are indications that, because of failure of the respondent to recall accurately, the responses on occupation in 1965 are subject to greater error than those on current occupation. Therefore, the occupational classification in 1965 is restricted to the major occupation group.
Income in 1969.-lnformation on money income received in the calendar year 1969 was requested from all persons 14 years old and over. ''Total income" is the algebraic sum of amounts received as wage or salary income, self-employment income, and income other than earnings. Wage or salary income is defined as the total money earnings received for work per· formed as an employee. It represents the amount received before deductions for personal income taxes, Social Security, bond purchases, union dues, etc. Self-employment income is defined as net money income (gross receipts minus operating expenses) from a business, farm, or profession ... !
App-12
enterprise in which the person was engaged on his own account. Selfemployment income may be subdivided into farm and nonfarm selfemployment income. Earnings is the algebraic sum of wage or salary income and self-employment income. Income other than earnings includes money income received from such sources as interest, dividends, net rental income, Social Security benefits, pensions, veterans' payments, unemployment insurance, and public assistance or other governmental payments, and periodic receipts from insurance policies or annuities. Not included as income are money received from the sale of property (unless the recipient was engaged in the business of selling such property), the value of income "in kind," withdrawals of bank deposits, money borrowed, tax refunds, and gifts and lump-sum inheritances or insurance payments.
Family income is computed by summing the income of all family members 14 years old and over; whereas, the income of unrelated individuals or persons 14 years old and over includes only their own income.
The income data presented in census reports are not directly comparable with estimates of aggregate personal income or per capita personal income prepared by the Bureau of Economic Analysis (BEA), formerly
the Office of Business Economics, nor with the distribution of families and individuals by personal income brackets previously published by that agency. For a detailed explanation of the difference between the Census and BEA income definitions and coverage, see U.S. Bureau of the Census, Current Population Reports, Series P-60, No. 75, "Income in 1969 of Families and Persons in the United States" or the 1970 Census of Population Volume I reports.
Poverty status in 1969.-Families 11nd unrelated individuals are classified as being above or below the poverty level, using the poverty index adopted by a Federal I nteragency Committee in 1969. This index provides a range of income cutoffs or "poverty thresh· olds" adjusted to take into account such factors as family size, sex and age of the family head, the number of children, and farm-nonfarm residence. The poverty cutoffs for farm families have been set at 85 percent of the nonfarm levels. These income cutoffs are updated every year to reflect the changes in the Consumer Price Index. The average poverty threshold for a nonfarm family of four was $3,743 in 1969. For a detailed explanation of the poverty definition, see the Volume I reports of the 1970 Census of Popu· lation.

Appendix 0.-ACCURACY OF THE DATA
SOURCES OF ERROR .....•••• App·13
EDITING OF UNACCEPT-ABLE DATA •••.••.••.•••... App·13
ALLOCATION TABLES •.••••.. App-13
SAMPLE DESIGN . . • • . . . • • • . . • App·14
RATIO ESTIMATION .••..••.•• App-14
SAMPLING VARIABILITY .••.. App·16
SOURCES OF ERROR
Human and mechanical errors occur in any mass statistical operation such as a decennial census. Errors during the data collection phase can include failure to obtain required information from respondents, obtaining incorrect or inconsistent information, and recording information in the wrong place or incorrectly. Errors can also occur during the field review of the enumerator's work, the clerical handling of the questionnaires, and the various stages of the electronic processing of the material. Careful efforts are made in every census to keep the errors in each step at an acceptably low level. Quality control and check measures are utilized throughout the census operation. As was done for the 1950 and 1960 censuses, evaluative material on many aspects of the 1970 census will be published as soon as the appropriate data are accumulated and analyzed.
EDITING OF UNACCEPTABLE DATA
The objective of the processing operation is to produce a set of statistics that describes the population as accurately and clearly as possible. To meet this objective, certain unacceptable entries were edited.
In the field, questionnaires were reviewed for completeness by a census
clerk or enumerator, and a followup was made for missing information. The major review occurred in the central processing office, where the editing and coding operation provided an opportunity to correct obvious errors in the respondents' entries for those items which required manual proc· essing.
For a few of the items, the respond· ents' entries were reviewed for reason· ableness or consistency on.the basis of other information on the question· naire. As a rule, however, editing was performed by hand only when it could not be done effectively by machine.
Because of the limitations of computer capacity and other resources, a number of complicated editing steps were not introduced when the effect on the final data was considered to be small. Thus, there may be a small number ot cases having unlikely combinations of characteristics.
As one of the first steps in mechanical editing, the configuration of marks on the questionnaire was scanned electronically to determine whether it contained information for a person or merely spurious marks. If the ques· tionnai re contained entries for at least two of the basic characteristics (rela· tionship, sex, race, age, marital status), or for at least two relevant sample characteristics, the inference was made that the marks represented a person. Names were not used as a criterion of the presence of a person because the electronic scanning was unable to dis· tinguish between a name and any other entry in the name space.
If any characteristics for a person were missing, they were, in most cases, supplied by allocation. Allocations, or assignments of acceptable codes in place of unacceptable entries, were needed most often where an entry for a given item was lacking or where the
information reported for a person on that item was inconsistent with other information for the person. As in earlier censuses, the general procedure for changing unacceptable entries was to assign an entry that was consistent with entries for other persons with similiar characteristics. Thus, a person who was reported as a 20-year-old son of the household head, but for whom marital status was not reported, was assigned the same marital status as that of the last son processed in the same age group. The assignment of acceptable codes in place of blanks or unacceptable entries, it is believed, enhances the usefulness of the data.
The editing process also includes another type of correction; namely, the assignment of a full set of characteristics for a person. When there was indication that a housing unit was occupied but the questionnaire con· tained no information for any person, a previously processed household was selected as a substitute and the ful I set of characteristics for each substitute person was duplicated.
Specific tolerances were established for the number of computer allocations and substitutions that would be permitted. If the number of corrections was beyond tolerance, the questionnaires in which the errors occurred were clerically reviewed. If it was found that the errors resulted from damaged questionnaires, from improper microfilming, from faulty reading by FOSDIC of undamaged questionnaires, or from other types of machine failure, the questionnaires were reprocessed.
ALLOCATION TABLES
Some of the Volume 11 reports contain tables presenting allocation rates for the principal subject of the report and
App·13

APPENDIX D-Continued
showing the extent of allocation of that characteristic cross-classified by other selected characteristics. When such tables are included, they follow the numbered tables and are discussed in the introduction of the report. Additional allocation tables presented in Volume I, Part 1, Characteristics of the Popu I atio n, United States Summary (tables C-1 to C-4} include rates for most of the subjects covered in the census. The information shown in these tables includes (1) the percent of the total population enumerated in the sample, (2) the allocation rate for each subject, and (3) the distributions for each subject before allocation. For a given subject the distribution before allocation may be compared with the corresponding statistics shown in the detailed tables to measure the net effect of allocation. Further explanation of the allocation tables is included in Appendix C of the Volume I reports.
SAMPLE DESIGN
For persons living in housing units at the time of the 1970 census, the housing unit, including all its occupants, was the sampling unit; for persons in group quarters identified in advance of the census, the sampling unit was the person. In nonmail areas, the enumerator canvassed his assigned area and listed all housing units in an address register sequentially in the order in which he first visited the units whether or not he completed the interview. Every fifth line of the address register was designated as a sample line, and the housing units listed on these lines were included in the sample. Each enumerator was given a random line on which he was to start I isti ng and the order of canvassing was indicated in advance,
App-14
although the instructions allowed some latitude in the order of visiting addresses. In mail areas, the list of housing units was prepared prior to Census Day either by employing commercial mailing lists co.rrected through the cooperation of the post office or by listing the units in a process similar to that used in nonmail areas. As in other areas, every fifth housing unit of these lists was designated to be in the sample. In group quarters, all persons were listed and every fifth person was selected for the sample.
This 20-percent sample was subdivided into a 15-percent and a 5-percent sample by designating every fourth 20-percent sample unit as a member of the 5-percent sample. The remaining sample units became the 15·percent sample. Two types of sample questionnaires were used, one for the 5-percent and one for the 15-percent sample units. Some questions were included on both the 5-percent and 15-percent sample forms and therefore appear for a sample of 20 percent of the units in the census.
Other items appeared on either the 15-percent or the 5-percent questionnaires. An item collected on a 20-percent basis may have been tabulated on a 15- or 5-percent basis. The sample rate for tabulation is shown in the headnote of the table if the entire table is based on the same sample. For tables having figures based on different samples, the sample rates are explained under the heading "Sample size" in the introduction.
Although the sampling procedure did not automatically insure an exact 20-percent sample of persons or housing units in each locality, the sample design wa~ unbiased if carried through according to instructions; generally for larger areas the deviation from 20 percent was found to be quite small.
Biases may have arisen, however, when the . enumerator failed to follow his listing and sampling instructions exactly. Quality control procedures were used throughout the census process, however, and where there was clear evidence that the sampling procedures were not properly followed, some enumerators' assignments were returned to the field for resampling. For the United States as a whole 19.4 percent of the population and 19.6 percent of the housing units were enumerated in the sample. The bases for these percentages included several classes of the population for which no attempt at sampling was made. These were the relatively small numbers of persons and housing units (in most States, less than one percent) added to the enumeration from the post-census post office check, the various supple· mental forms, and the special check of vacant units. (If these classes are excluded from the bases, the respective proportions become 19.6 and 19.7 percent.) The ratio estimation procedure described below adjusts the sample data to reflect these classes of population and housing units.
RATIO ESTIMATION
The statistics based on 1970 census sample data are estimates made through the use of ratio estimation procedures, which were applied sepa· rately for population and for housing data for each of the 5·, 15·, and 20-percent samples. The first step in carrying through the ratio estimates was to establish the areas within which separate ratios were to be prepared. These are referred to as "weighting areas." For the 15- and 20·percent samples, the weighting areas contained a minimum population size of 2,500. The weighting areas used for the

APPENDIX 0-Continued
5-percent ratio estimate were larger areas, having a minimum population size of 25,000 and comprising combinations of the weighting areas used for the 15- and 20-percent samples. Weighting areas were established by a mechanical operation on the computer and were defined to conform, as nearly as possible, to areas for which tabulations are produced. Where these areas do not agree (primarily for smaller areas), there may be some differences between complete counts and sample estimates.
The ratio estimation process for population operated in three stages. The first stage employed 19 house· hold-type groups (the first of which was empty by definition). The second stage used two groups, head of house· hold and not head of household, and the third stage used 24 age-sex-race groups.
Group
STAGE I
Male head with own children under 18
1-person household
2 2-person household
3 3-person household
6 6-or-more-person household
Male head without own children under 18
7-12 1-person to 6-or-more-person households
Female head
13-18 1-person to 6-or-more-person households
19 Group quarters persons
STAGE II 20 Head of household
21 Not head of household
(including persons in group quarters}
STAGE 111
Male Negro
22 Age under 5 years
23 5-13
24 14·24
25 25-44
26 45-64
27 65 and older
28-33
Male, not Negro
Same age groups as for Male Negro
Female Negro
34-39 Same age groups as for
40-45
Male Negro
Female, not Negro
Same age groups as for Male Negro
At each stage, for each of the groups, the ratio of the complete count to the weighted sample count of the population in the group was computed and applied to the weight of each sample person in the group. This operation was performed for each of the 19 groups in the first stage, then for the two groups in the second stage and finally for the 24 groups in the third stage. As a rule, the weighted sample counts within each of the 24 groups in the third stage should agree with the complete counts for the weighting areas. Close, although not exact, consistency can be expected for the two groups in the second stage and the 19 groups in the first stage.
There are some exceptions to this general rule, however. As indicated above, there may be differences between the complete counts and sample estimates when the tabulation area is not made up of whole weighting areas.
Furthermore, in order to increase the reliability, a separate ratio was not computed in a group whenever certain criteria pertaining to the complete count of persons and the magnitude of the weight were not met. For example, for the 20-percent sample the com· plete count of persons in a group had to exceed 85 persons and the ratfo of the complete count to the unweighted sample count could not exceed 20. Where these criteria were not met, groups were combined in a specific order until the conditions were met. Where this occurrEid, consistency between the weighted sample and the complete counts would apply as indicated above for the combined group but not necessarily for each of the groups in the combination.
Each sample person was assigned an integral weight to avoid the complications involved in rounding in the final tables. If, for example, the final weight for a 20-percent group was 5.2, onefifth of the persons in the group {selected at random) were assigned a weight of 6 and the remaining fourfifths a weight of 5.
The estimates realize some of the gains in sampling efficiency that would have resulted had the population been stratified into the groups before sampling. The net effect is a reduction in both the sampling error and possible bias of most statistics below what would be obtained by weighting the results of the sample by a uniform factor (e.g., by weighting the 20· percent sample results by a uniform factor of 5). The reduction in sampling error will be trivial for some items and substantial for others. A byproduct of this estimation procedure is that esti· mates for this sample are, in general, consistent with the complete count for the population groups used in the estimation procedure. A more com·
App-15
APPENDIX D-Continued
plete discussion of the technical aspects of these ratio estimates will be presented in a separate report.
SAMPLING VARIABILITY
The estimates from the 20·, 15-, and 5-percent sample tabulations are sub· ject to sampling variability. The standard errors of these estimates can be approximated by using the data in tables A through C. The chances are about 2 out· of 3 that the difference (due to sampling variability) between the sample estimate and the figure that would have been obtained from a complete count of the population is less than the standard error. The chances are about 19 out of 20 that the difference is less than twice the standard error and about 99 out of 100 that it is less than 21/z times the standard error. The amount by which the estimated standard error must be multiplied to obtain other odds deemed more appropriate can be found in most statistical textbooks. The sampling errors may be obtained by using the factors shown in table C in conjunction with table A for absolute numbers and in conjunction with table B for percentages. These tables reflect the effect of simple response variance, but not of bias arising in the collection, processing, and estimation steps nor of the correlated errors enumerators introduce; estimates of the magnitude of some of these factors in the total error are being evaluated and will be published at a later date.
Table A shows approximate standard errors of estimated numbers for most statistics based on the 20-percent sample. In determining the figures for this table, some aspects of the sample design, the estimation process, and the population of the area over which the data have been compiled are ignored.
App-16
Table B shows standard errors of most percentages based on the 20-percent sample. Linear interpolation in tables A and 8 will provide approximate results that are satisfactory for most purposes. Table C provides a factor by which the standard errors shown in tables A or B should be multiplied to adjust for the combined effect of the sample size (i.e., whether a 20-percent, 15-percent, or 5-percent sam pie), the sample design,and the estimation procedure.
To estimate the standard error for a given characteristic based on the 15-or 5·percent sample, or for a more precise estimate for the 20-percent sample, locate in table C the factor applying to the characteristic and sample size used to tabulate the data and multiply this factor by the standard error found in table A or B. If the estimate is not identified in table C, use the factor shown for "all other." Where data are shown as crossclassifications of two characteristics, locate and use the larger factor. Similarly, if an item, although collected on one sample basis, has been tabulated for a smaller sample, use the factor appropriate for the smaller sample.
The standard errors estimated from these tables are not directly applicable to differences between two sample estimates. In order to estimate the standard error of a difference, the tables are to be used somewhat differ· ently in the three following situations:
1. For a difference between the sample figure and one based on a complete count (e.g., arising from comparisons between 1970 sample statistics and complete-count statistics for 1960 or 1950), the standard error is identical with the standard error of the 1970 estimate alone.
2. For a difference between two sample figures (that is, one from 1970 and the other from 1960, or both from the same census year). the standard error is approximately the square root of the sum of the squares of the standard errors of each estimate considered sepa· rately. This formula will represent the actual standard error quite accurately for the difference be· tween estimates of the same charac· teristics in two different areas, or for the difference between separate and uncorrelated characteristics in the same area. If, however, there is a high positive correlation between the two characteristics, the formula will overestimate the true standard error. The approximate standard error for the 1970 sample figure is derived directly from tables A through C. The standard error of a 25-percent 1960 sample figure may be obtained from the relevant 1960 census report or an approximate valLJe may be obtained by multiply· ing the appropriate value in table A or B by 0.9.
3. For a difference between two sample estimates, one of which rep resents a subclass of the other, the tables can be used directly with the difference considered as the sample estimate.
The sampling variability of the medians presented in certain tables (median age, median years of school completed, and median income) depends on the size of the base and .on the distribution on which the median is based. An approximate method 10.r
I. b'I' f an est1· measuring the re 1a 1 1ty o mated median is to determine .an . · ted median interval about the est1ma
APPENDIX 0-Continued
such that there is a stated degree of confidence the true median lies within the interval. As the first step in estimating the upper and lower limits of the interval (that is, the confidence limits) about the median, compute one-half the number on which the
median is based (designated ~). From
table A, following the method outlined in other parts of this section, compute the standard error of an estimated
number equal to ~- Subtract this
N standard error from 2· Cumulate the
frequencies (in the table on which the median is based) until the total first
exceeds the difference between ~and its standard error and by linear interpolation obtain a value corresponding to this number. l n a corresponding
manner, add the standard error to ~, cumulate the frequencies in the table,
and obtain a value in the table on which the median is based corre-
sponding to the sum of ~ and its
standard error. The chances are about 2 out of 3 that the median would lie between these two values. The range for 19 chances out of 20 and for 99 in 100 can be computed in a similar manner by multiplying the standard error by the appropriate factors before subtracting from and adding to onehalf the number reporting the characteristic. Interpolation to obtain the values corresponding to these numbers gives the confidence limits for the median.
The sampling variability of a mean, such as the number of children ever born per 1,000 women or mean income, presented in certain reports, depends on the variability of the distribution on which the mean is
based, the size of the sample, the sample design (for example, the use of households as the sampling unit), and the use of ratio estimates.
An approximation to the variability of the mean may be obtained as fol lows: compute the standard deviation of the distribution on which the mean is based; divide this figure by the square root of one-fifth of the total units in the distribution; multiply this quotient by the factor from table C appropriate to the statistic and the actual sample rate on which the mean is based. If the distribution is not published in the detailed tables, calculate the standard deviation from a comparable distribution for a larger area or for a similar population group; divide by the square root of one-fifth of the units on which the mean of interest is based; multiply the quotient by the factor from table C.
App-17
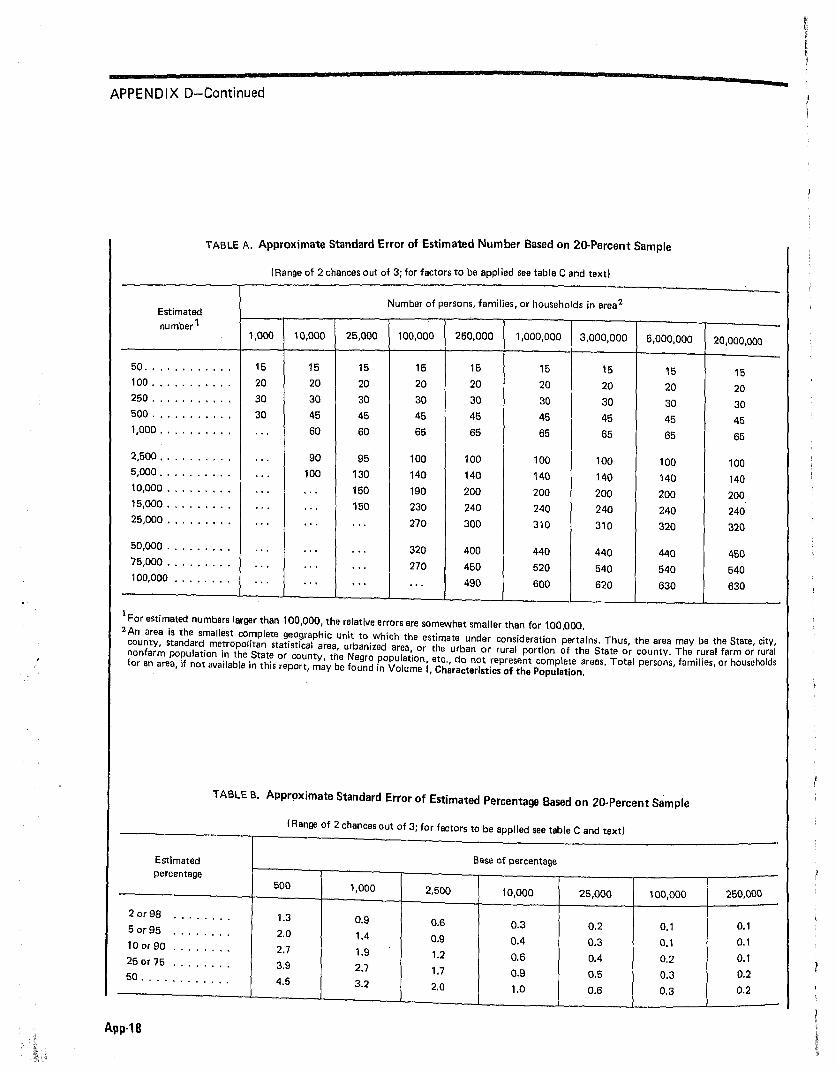
APPENDIX D-Continued
TABLE A. Approximate Standard Error of Estimated Number Based on 20-Percent Sample
(Range of 2 chances out of 3; for factors to be applied see table C and text)
Estimated Number of persons, families, or households in area 2
number 1 1,000 10,000 25,000 100,000 250,000 1,000,000 3,000,000 6,000,000 20,000,000
50 ............ 15 15 15 15 15 15 15 15 15 100 ........... 20 20 20 20 20 20 20 20 20 250 ........... 30 30 30 30 30 30 30 30 30 500 ........... 30 45 45 45 45 45 45 45 45 1,000 .......... . .. 60 60 65 65 65 65 65 65
2,500 .......... . .. 90 95 100 100 100 100 100 100 5,000 .......... . .. 100 130 140 140 140 140 140 140 10,000 ........• ... . .. 150 190 200 200 200 200 200 15,000 •........ .. . . .. 150 230 240 240 240 240 240 25,000 ........• .. . . .. . .. 270 300 310 310 320 320
50,000 ......... .. . . . . . .. 320 400 440 440 440 450 75,000 ......... .. . ... . .. 270 450 520 540 540 540 100,000 ........ .. . ... . .. . .. 490 600 620 630 630
1 For estimated numbers larger than 100,000, the relative errors are somewhat smaller than for 100,000.
2An area is the smallest complete geographic unit to which the estimate under consideration pertains. Thus, the area may be the State, city, county, standard metropolitan statistical area, urbanized area, or the urban or rural portion of the State or county. The rural farm or rural nonfarm population in the State or county, the Negro population, etc. do not represent complete areas. Total persons, families, or households for an area, if not available in this report, may be found in Volume I, Ch~racteristics of the Population.
TABLE B. Appr9ximate Standard Error of Estimated Percentage Based on 20-Percent Sample
(Range of 2 chances out of 3; for factors to be applied see table C and text)
Estimated Base of percentage percentage
500 1,000 2,500 10,000 25,000 100,000 250,000
2or98 ........ 1.3 0.9 0.6 0.3 0.2 0.1 0.1 5 or95 0 o'' o I I 0 2.0 1.4 0.9 0.4 0.3 0.1 0.1 10 or 90 .... . . . . 2.7 1.9 1.2 0.6 0.4 0.2 0.1 25 or 75 . . . . .... 3.9 2.7 1.7 0.9 0.5 0,3 0.2 50 .... . . . . .... 4.5 3.2 2.0 1,0 0.6 0.3 0.2
App-18

APPENDIX D-Continued
I
TAB LE c. Factor to be Applied to Standard Error
(For cross-classifications of two or more items, use the factor for the item having the largest factor for the given sample rate)
SUBJECT
Race ...•...........................................•......•..... Age ...................... , .........•......... , .....•...•..•..... Household relationship .................................•......•..... Families and subfamilies1
..•..•••••••••••.•.• , •••. , , •• , •••••••• , •.•..
Unrelated individuals ................................. , ....•........ Type of group quarters .................................•............ Marital status ..................................... , ..•.......•.... Marital history ........................... , . , ..... , .•..............
State of birth .•...............•...•..................•............ Country of origin
Foreign born ........................... , ..•..... , .•...•........ F~reign .st.05k .................................................. .
Spanish origin .....•...........................•.....•............ Spanish heritage2
.•...••••.••..••.••.••••• , • , •...•••••••.•••••••.••
Nativity and parentage .... , •...•........................•. , •........ Mother tongue ................... , ......... , , .. , , ....•..••........ Citizenship ..........................................•...•........ Year of immigration ...................................•............ Year moved into present house ..........................•............ Residence in 1965 ................... , . , , ....•. , , .....•...•..•..... Rural farm and nonfarm residence ........•... , .. , ............•........
School enrollment ............................... , ....•.•........•. Years of school completed ..............................•...•........ Vocational training ..................•.........•....•...•....... · . · · · Veteran status .......................•............•.... • · · · . · · · · · · Disability ...........................•...................•........
Labor force status or participation ........•..............•...•• ·. · · · · · · Unemployed ........................................ · · · · · · · · · · · · · · Hours worked ................... , .......... , .............•.. , •.... Weeks worked in 1969 ................................ · · · · · · · · · · · · · · Year last worked .....................•.......... , ..•.............. Activity 5 years ago .................................. • · · · · · · · · · · · · · Place of work ......... , ..........•...... , . , ............ , . , ....... , Means of transportation to work ...•.................... · · · · · · · · · · · · · · Occupation .................. , ..................•................. Industry ..............•......• , .................. , ......•........ Class of worker ..................... , ................•......... , , .. Income in 1969
Persons .. Families
1 : : : : : : : : : : : : : : : : : : : : : : : : : : : : : : : : : : : : : : : : : : : : : : : : : : : : : :
Poverty status in 1969 Persons
AllF~t~~;esi.::: : : : : : : : : : : : : : : : : : : : : : : : : : : : : : : : : : : : : : : : : : : : : : : : : : : : .........................................................
20 percent
1.1 0.8 0.5 0.6 1.3 0.6 0.6
1.3
1.7
1.0
0.8 1.1 0.8 0.8 0.8 0.8
1.1 1.1 1.1
1.0 1.0
1.8 1.1 1.0
Factor if sample rate is-
15 percent
1.4 1.0 0.6 0.7 1.5 0.7 0.7
1.6
1.6 1.6
1.6 1.7 1.8
1.9 2.0 2.0
1.0 1.2
0.9
0.9 1.3 0.9 0.9 0.9 0.9 1.3 1.3 1.3 1.3 1.3
1.2 1.2
2.2 1.2 1.2
5 percent
2.5 1.8 1.1 1.3 2.8 1.2 1.4 2.0
2.9
2.9
2.9
3.1
3.3 3.3
3.7 3.7
1.8 2.3 1.7
2.4
1.6 2.4 1.6 1.6 1.6 1.6
2.3 2.3 2.3
2.2 2.3
4.0 2.3 2.2
~0hen deter!Tiining the standard error of a number that relates to f~milies or house.holds rather. than to persons, use the number of families or useholds m the area rather than the population of the area for selecting the appropriate column in table A.
2iabulations of characteristics for persons of Spanish heritage (Puerto Rican birth or parentage, Spanish languag~ or S~anish su~name) ~re based on he 15·percent sample and the appropriate factor is found in the 15-percent column for the subject or for Spanish heritage, whichever 1s the larger.
Tabulations of characteristics for persons of Spanish origin are based on the 5-percent sample, and the appropriate factor is found in the 5·percent column for the subject or for Spanish origin whichever is the larger.
App-19

Appendix E.-PUBLICATION AND COMPUTER SUMMARY TAPE PROGRAM -
Population Census Reports
Volume I. CHARACTERISTICS OF THE
POPULATION This volume consists of 58 "parts"-number 1 for the United States, numbers 2 through 52 for the 50 States and the District of Columbia in alphabetical order, and numbers 53 through 58 for Puerto Rico, Guam, Virgin Islands, American Samoa, Ca.n~I Zone and Trust Territory of the Pac1f1c Islands, respectively. Each part, w~ich is a separate clothbound book, contains four chapters designated as A, B, C, and D. Each chapter (for each of the 58 areas) is issued as an individual paperbound report in four series designated as PC(1)-A, B, C, and D, respectively. The 58 PC( 1 )·A "'.ports ~ave been specially assembled and issued in a clothbound book, designated as Part A.
• Series PC(1l·A. NUMBER OF INHABITANTS
Final official population counts are pre· sented for States, counties by urban and rural residence, standard metropolitan statistical areas (SMSA's), urbanized areas, county subdivisions, all incorporated places, and unincorporated places of 1,000 inhabitants or more.
• Series PC( 1 l·B. GENERAL POPULATION CHARACTERISTICS
Statistics on age, sex, race, marital status, and relationship to head of household are presented for States, counties by urban and rural residence, SMSA's, urbanized areas, county subdivisions, and places of 1 ,000 inhabitants or more.
• Series PC( 1 )-C. GENERAL SOCIAL AND
ECONOMIC CHARACTERISTICS Statistics are presented on nativity and parentage, State or country of birth, Spanish origin, mother tongue, residence 5 years ago, year moved into present house, school enrollment (public or private), years of school completed, vocational training, number of children ever born, family composition, disability, veteran status, employment status, place of work, means of transportation to work, occupation group, industry group; class of worker, and income (by type) in 1969 of families and in· dividuals. Each subject is shown for some or all of the following areas: States, counties (by urban, rural-nonfarm, and rural-farm residence), SMSA's, urbanizeil areas, and places of 2,500 inhabitants or more.
App-20
The results of the 1970 Census of Population. and Housing are being issu d. the form of printed reports, microfiche copies of the printed reports come tin
t . t t d . f'I . ' pu er summary tapes, compu er pnn ou s, an micro 1 m. Listed below are h descriptions of the final report series and computer tapes, as currently pla~ 0:
More detailed ~nf~rm~tion on this program can be obtained by writing to":h · Publications D1stnbut1on Section, Bureau of the Census, Washington Dee 20233. ' ''
• Series PC( 1 )·D. DETAILED CHARACTERISTICS
These reports cover most of the subje~ts shown in Series PC(1)-C, above, presenting the data in considerable detail and crossclassi fied by age, race, and other characteristics. Each subject is shown for some or all of the following areas: States (by urban, rural-nonfarm, and rural-farm residence). SMSA's, and large cities.
Volume JI, SUBJECT REPORTS Each report in this volume, also designated as Series PC(2), concentrates on a particular subject, Detailed information and cross· relationships are generally provided on a national and regional level; in some reports, data for States or SMSA's also are shown. Among the characteristics covered are na· tional origin and race, ferti llty, families, marital status, migration, education, unemployment, occupation, industry, and income.
Housing Census Reports
Volume I. HOUSING CHARACTERISTICS FOR STATES, CITIES, AND COUNTIES
This volume consists of 58 "parts"-number 1 for the United States, numbers 2 through 52 for the 50 States and the District of Columbia in alphabetical order, and numbers 53 through 58 for Puerto Rico, Guam, Virgin Islands, American Samoa, Canal Zone, and Trust Territory of the Pacific Islands, respectively. Each part, which is a separate clothbound book, contains two chapters designated as A and B. Each chapter (for each of the 58 areas) is issued as an individual paperbound report in two series designated as HC(1)·A and B, respectively.
• Series HC(1)-A. GENERAL HOUSING CHARACTERISTICS
Statistics on tenure, kitchen facilities, plumbing facilities, number of rooms, persons per room, units in structure, mobile home, telephone, value, contract rent, and vacancy status are presented for some or all of the following areas: States (by urban and rural residence), SMSA's, urbanized areas, places of 1,000 inhabitants or more, and counties.
• SeriesHC(1)-B. DETAILED HOUSING CHARACTERISTICS
Statistics are presented on a more detailed basis for the subjects included in the Series
HC( 1 )-A reports, as well as on such additional subjects as year moved into unit, year structure built, basement., heating equipment, fuels, air conditioning, water and sewage, appliances, gross rent, and ownership of second home. Each subject Is shown for some or all of the following areas: States (by urban, rural-nonfarm, and rural-fann residence), SMSA's, urbanized areas, places of 2,500 Inhabitants or mora and counties (by rural and rural·fani: residence).
Volume II. METROPOLITAN HOUSING CHARACTERISTICS
These reports, also designated as Series HC(2), cover most of the 1970 census housing subjects in considerable detail and cross-<:lasslflcatlon. There is one report for each SMSA, presenting data for the SMSA and lu central cities and places of 50,000 inhabitants or more, as well as a national summary report.
Volume Ill. BLOCK STATISTICS One report, under the designation Serles HC(3), is issued for each urbanized area showing data for individual blocks on selected housing and population subjects. 'The series also Includes reports for the communities outside urbanized areas which have contracted with the Census Bureau to provide block statistics from the 1970 census.
Volume IV. COMPONENTS OF INVENTORY CHANGE This volume contains data on the dis· position of the 1960 inventory and the source of the 1970 inventory, such as nel_'I construction, conversions, mergers, demol1· tions, and other additions and losses, ~ro.ss· tabulations of 1970 and 1960 characteristics for units that have not changed and charac· teristics of the present and previous resi· dance of recent movers are also provld9<1. Statistics are shown for 15 selected SMSAs and for the United States and regions.
Volume V. RESIDENTIAL FINANCE This volume presents data regarding th~ financing of privately owned nonfarm res· dential properties. Statistics are shown °0~ amount of outstanding mortgage debt, :er ner of acquisition of property• homeo nd expenses and other owner, propert~, .~ed mortgage' characteristics for the 01
States and regions.

APPENDIX E-Continued
Volume VI. PLUMBING FACILITIES AND ESTI·
MATES OF DILAPIDATED HOUSING This volume will present counts of housing units lacking some or all plumbing facilities and estimates of "dilapidated" units with all plumbing facilities. Comparative 1960 and 1970 data will be shown for the United States and regions, States, SMSA's, counties, and places of 10,000 inhabitants or more.
Volume VII. SUBJECT REPORTS Each report in this volume concentrates on a particular subject. Detailed information and cross-classifications are generally pro· vided on a national and regional level; In some reports, data for States or SMSA's are also shown. Among the subjects covered are housing characteristics by household composition, housing of minority groups and senior citizens, and households in mobile homes.
Joint Population-Housing Reports
Series PHC(1). CENSUS TRACTS This series contains one report for each SMSA that is tracted, showing data for most of the population and housing subjects included in the 1970 census.
Series PHC(2). GENERAL DEMOGRAPHIC TRENDS FOR
METR«;>POLITAN AREAS, 1960 TO 1970 This series consists of one report for each State and the District of Columbia as well as ~ ~ational summary report, pr~senting sta~1st1cs for the State and for SMSA's and their cent~al cities and constituent counties. Comparative 1960 and 1970 data are shown on population counts by age and race and on such housing subjects as tenure plumbing facilities, value, and contract rent'.
Series PHC(3). EMPLOYMENT PROFILES OF SELECTED LOW·INCOME AREAS
This ~ries consists of 76 reports each presenti~g statistics on the soci;I and :cono.mic characteristics of the residents of partic~lar low-income area. The data relate
to low-income neighborhoods in 51 cities and ~even rural poverty areas. Each report provides statistics on employment and ~n~'!'ployment, education, vocational an~n!ng, availability for work, job history,
~come, as well as on value or rent and num r of rooms in the housing unit.
Additional Reports
Series PHC(E). EVALUATION REPORTS This open series presents the results of the extensive evaluation program conducted as an integral part of the 1970 census program and relating to such matters as completenes~ of enumeration and quality of the data on characteristics.
Series PHC(R). PROCEDURAL REPORTS This open series presents Information on various administrative and methodological aspects of the 1970 census and will include a comprehensive procedural history of the 1970 census.
Computer Summary Tapes
The major portion of the results of the 1970 census are produced in a set of six tabulation counts. To help meet the needs of census useni, these counts are designed to provide data with much greater subject and geographic detail than it is feasible or desirable to publish in printed reports. The data so tabulated are generally availablesubject to suppression of certain detail where necessary to protect confidentialityon magnetic computer tape, printouts, and microfilm, at the cost of preparing the copy.
First Count-source of the PC( 1 )-A reports; contains about 400 cells of data on the subjects covered in the PC(1 )-8 and HC( 1 )-A reports and tabulated for each of the approximately 260,000 enumeration districts and all areas in the PC(1 )-A reports for the United States.
Second Count-source of the PC(1 )-8, HC( 1 )·A, and part of the PHC(1) reports; contains about 3,500 cells of data covering the subjects in these reports and tabulated for the approximately 36,000 tracts, 3,000 counties, 36,000 county subdivisions, and 10,000 places of 1,000 or more in the United States.
Third Count-source of the HC(3) reports; contains about 260 cells of data on the subjects covered in the PC(1 )-8 and HC(1)-A reports and tabulated for approximately 1,600,000 blocks in the United States.
Fourth Count-source of the PC(1 )-C, HC(1)·8, and part of the PHC(1) reports;
contains about 13,000 cells of data covering the subjects in these reports and tabulated for the approximately 35,000 tracts and 36,000 county subdivisions, and about 6,000 places of 2,600 or more in the United States; also contains about 30,000 cells of data for each county.
Fifth Count-contains approximately 800 cells of population and housing data for 5-digit ZIP code areas in SMSA's and 3-digit ZIP code areas outside SMSA's; the ZIP code data are available only on tape.
Sixth Count-source of the PC( 1 l·D and HC(2) reports; contains about 260,000 cells of data covering the subjects in these reports and tabulated for States, SMSA's, and large cities.
The tapes are generally organized on a State basis, To use the First Count and Third Count tapes, it is necessary to purchase the
·appropriate enumeration district and block maps.
The term "cells" used herein to indicate the scope of subject content of the several counts refers to each figure or statistic in the tabulation for a specific geographic area. For example, in the Third Count, there are six cells for a cross-classification of race by sex: three categories of race (white, Negro, other race) by two categories of sex (male, female).
In addition to the above-mentioned summary tapes, the Census 8 ureau makes available for purchase certain sample tape files containing population and housing characteristics as shown on individual census records. These files contain no names or addresses, and the geographic identification is sufficiently broad to protect con· fidentiality. There are six files, each con· taining a 1-percent national sample of persons and housing units. Three of the files are drawn from the population covered by the census 15-percent sample and three from the population in the census 6-percent sample. Each of these three files provides a different type of geographic information: One identifies individual large SMSA's and, for the rest of the country, groups of counties; the second identifies individual States and, where they are sufficiently large, provides urban-rural and metropolitan· nonmetropolitan detail; and the third identifies State groups and size of place, with each individual record showing selected characteristics of the person's neighbor· hood.
App·21