Embed Size (px)
Citation preview

Birmingham City Council
Equality in Employment
Monitoring Report
2019 to 2020 November 2020
Organisational Development Team

Contents Introduction ...................................................................................................................................................................... 4
Equality Act 2010 .......................................................................................................................................................... 4
Workforce Strategy 2018-2022 ..................................................................................................................................... 5
The scope of this report ................................................................................................................................................ 5
Data notes ..................................................................................................................................................................... 5
Workforce Comparison ..................................................................................................................................................... 6
Workforce breakdown ...................................................................................................................................................... 7
Data for 1st April 2019 – 31st March 2020 ..................................................................................................................... 7
Contract types ........................................................................................................................................................... 7
Age ............................................................................................................................................................................ 7
Disability .................................................................................................................................................................... 8
Ethnic origin .............................................................................................................................................................. 8
Gender ...................................................................................................................................................................... 9
Religious belief ........................................................................................................................................................ 10
Sexual orientation ................................................................................................................................................... 10
Pay and grades ................................................................................................................................................................ 11
Data for 1st April 2019 – 31st March 2020 ................................................................................................................... 11
Grade by Disability ...................................................................................................................................................... 11
Grade by Ethnic Origin ................................................................................................................................................ 12
Grade by Gender ......................................................................................................................................................... 12
Grade by Religious Belief ............................................................................................................................................ 13
Grade by Sexual orientation ....................................................................................................................................... 13
Dignity at Work, Disciplinary and Grievance: .................................................................................................................. 15
Data for 1st April 2019 – 31st March 2020 ................................................................................................................. 15
Overview of Dignity at Work, Disciplinary and Grievance by age ............................................................................... 15
Overview of Dignity at Work, Disciplinary and Grievance by Disability...................................................................... 15
Overview of Dignity at Work, Disciplinary and Grievance by Ethnic Origin ................................................................ 16
Overview of Dignity at Work, Disciplinary and Grievance by Gender ........................................................................ 16
Overview of Dignity at Work, Disciplinary and Grievance by Religious Belief ............................................................ 17
Overview of Dignity at Work, Disciplinary and Grievance by Sexual Orientation ...................................................... 17
Recruitment .................................................................................................................................................................... 18
Data for 1st April 2019 – 31st March 2020 ................................................................................................................... 18
New Starters by Age .................................................................................................................................................... 18
New Starters by Disability ........................................................................................................................................... 18
New Starters by Ethnic Origin ..................................................................................................................................... 19
New Starters by Gender .............................................................................................................................................. 20
New Starters by Religious Belief .................................................................................................................................. 20
Sexual orientation ................................................................................................................................................... 21

Leavers ............................................................................................................................................................................ 22
Data for 1st April 2019 – 31st March 2020 ................................................................................................................... 22
Leavers Data by Age Range ......................................................................................................................................... 22
Leavers Data by Disability ............................................................................................................................................ 22
Leavers Data by Ethnic Origin ...................................................................................................................................... 23
Leavers Data by Gender .............................................................................................................................................. 23
Leavers Data by Religious Belief .................................................................................................................................. 24
Leavers Data by Sexual Orientation ............................................................................................................................. 25
Staff Engagement: ........................................................................................................................................................... 26
Staff Survey ................................................................................................................................................................. 26
Recommended Actions ................................................................................................................................................... 27

Introduction Birmingham City Council aspires to be representative of the city, to lead with an inclusive mindset at all strategic and
operation levels and to be a place where employees can bring their whole authentic selves to work and thrive. To
help us achieve this, we are committed to eliminating discrimination and harassment, and encouraging inclusivity
and diversity amongst our workforce at all levels.
This Equality and Diversity Monitoring Report 2019-20 provides an analysis of equalities data for our workforce over
the period 1st April 2019– 31st March 2020.
This analysis will help us as an employer to identify the areas where we are doing well, as well as the areas where we
could do more to ensure that we have a diverse, resilient workforce that is representative of the city which we serve.
More information about Birmingham City Council’s approach to equality can be found on our Equality and Diversity
portal: https://www.birmingham.gov.uk/info/20218/equality_and_diversity
Equality Act 2010
The Equality Act 2010 was introduced to legally protect people from all forms of discrimination in the workplace and
in wider society. It brings together and replaces nine previous pieces of legislation, making the law easier to
understand and strengthening protections in some situations.
The Act protects people from discrimination, harassment and victimisation on the basis of their ‘protected
characteristics’. These characteristics are:
• Age
• Disability
• Gender reassignment
• Marriage or civil partnership
• Pregnancy and maternity
• Race
• Religion or belief (including the lack of religion or belief)
• Sex (referred to as ‘gender’ for the purpose of this report)
• Sexual orientation
The Equality Act 2010 also created the Public Sector Equality Duty (PSED), which is a legal duty for all public
authorities to consider to how their policies and decisions affect people who are protected under the Act. Under the
PSED, public bodies must carry out their functions with due regard to the need to:
• Eliminate discrimination, harassment, victimisation and any other conduct that is prohibited by or under the
Equality Act 2010;
• Advance equality of opportunity between persons who share a relevant protected characteristic and persons
who do not share it;
• Foster good relations between persons who share a relevant protected characteristic and persons who do
not share it.
Public bodies are required to regularly publish data to demonstrate that they are following the PSED, as well as
setting measurable equality objectives every four years. This Workforce Equality and Diversity Monitoring Report
2017-18 has been produced as part of this requirement.

Workforce Strategy 2018-2022
Our Workforce Strategy 2018-2022 sets out the following vision for Birmingham City Council:
‘To be an employer of choice, demonstrated by a highly performing diverse workforce, capable of managing and
planning innovative and financially robust service delivery to enable the city to grow and ensure every child, citizen
and place matters.’
The development of a diverse, skilled and high performing workforce is central to the achievement of our workforce
strategy. The production of annual Equality in Employment Monitoring Report will enable us to monitor our progress
towards this, demonstrating our successes and identifying where we may need to do more.
The scope of this report
This report will review and analyse equalities data for the following areas:
• Workforce overview and breakdown
• Pay and grading
• Recruitment
• Dignity at Work, Disciplinary and Grievance
• Employees leaving the Council
• Redundancies
• Staff Engagement
Data notes
The workforce data used to compile this report has been produced by Human Resources and covers the period 1st
April 2019– 31st March 2020.
Our reporting is dependent on employees choosing to disclose their personal data to us. The voluntary nature of
these disclosures means that there are some areas where people have chosen not to release their information,
creating gaps in our equalities data. We have now actively started work on how we can encourage staff to disclose
their data and explaining the benefits of them doing this. The introduction of the new HR, Finance and Procurement
system will assist going forwards, as this will involve data capture at every opportunity to improve the data we hold.
There has also been a separate Workforce Race Equity Review which is the first deep dive into the protected
characteristics and we aim to do this level of analysis for other protected characteristics once the data is improved.
However many of the actions covered in the Workforce Race Equity Review will also have a positive impact for other
protected characteristics.

Workforce Comparison 2016/17 2017/18 2018/19 2019/20 Leavers from Leavers from Leavers from Count % Count % Count % Count % 16/17 to 17/18 17/18 to 18/19 18/19 to 19/20
Gender Male 5,753 32.57% 5,339 32.64% 4,679 38.44% 4,714 40.01% -415 -660 35
Female 11,913 67.43% 11,017 67.36% 7,493 61.56% 7,067 59.99% -896 -3,525 -427
Total 17,666 100.00% 16,356 100.00% 12,172 100.00% 11,781 100.00% -1,310 -4,184 -391
Ethnicity Asian or Asian British 2,242 12.69% 2,237 13.68% 1,716 14.10% 1,770 15.02% -5 -521 54
Black or Black British 2,013 11.39% 1,912 11.69% 1,319 10.83% 1,353 11.48% -101 -593 35
Mixed 253 1.43% 266 1.62% 189 1.55% 196 1.66% 13 -77 7
Other 182 1.03% 171 1.04% 132 1.08% 147 1.25% -11 -39 16
Black, Asian and Minority Ethnic (combined)
4,689 26.54% 4,585 28.03% 3,355 27.56% 3,466 29.42% -104 -1,230 111
Prefer not to say 85 0.48% 106 0.65% 72 0.59% 80 0.68% 21 -34 8
Unknown 5,020 28.42% 4,472 27.34% 3,469 28.50% 3,099 26.31% -549 -1,003 -370
White 7,873 44.56% 7,194 43.99% 5,276 43.35% 5,136 43.60% -679 -1,918 -140
Total 17,666 100.00% 16,356 100.00% 12,172 100.00% 11,781 100.00% -1,310 -4,184 -391
Age Range < 20 150 0.85% 136 0.83% 84 0.69% 62 0.53% -14 -53 -22
20 - 29 1,301 7.36% 1,225 7.49% 853 7.00% 748 6.35% -76 -373 -105
30 - 39 2,903 16.43% 2,668 16.31% 1,907 15.67% 1,692 14.36% -235 -761 -215
40 - 49 4,869 27.56% 4,322 26.42% 3,055 25.10% 2,787 23.66% -547 -1,267 -268
50 - 59 6,419 36.33% 6,060 37.05% 4,715 38.74% 4,712 40.00% -359 -1,345 -3
60 - 69 1,795 10.16% 1,727 10.56% 1,385 11.38% 1,594 13.53% -68 -342 209
>= 70 230 1.30% 218 1.33% 174 1.43% 186 1.58% -12 -45 13
Total 17,666 100.00% 16,356 100.00% 12,172 100.00% 11,781 100.00% -1,310 -4,184 -391
Disability No 15,827 89.59% 14,774 90.33% 11,113 91.30% 11,296 95.88% -1,053 -3,662 184
Not assigned 1,154 6.53% 846 5.17% 519 4.26% 30 0.25% -308 -327 -489
Yes 685 3.88% 736 4.50% 541 4.44% 455 3.86% 51 -196 -86
Total 17,666 100.00% 16,356 100.00% 12,172 100.00% 11,781 100.00% -1,310 -4,184 -391

Workforce breakdown
Data for 1st April 2019 – 31st March 2020
Contract types
• 10,117 (86%) of employees at Birmingham City Council are on a permanent contract.
• 1,019 (9%) of staff are on a casual contract.
Age
56% Of employees are aged
over 50
40% Of employees are aged between 50 and 59, this
is the largest group
7% Of employees are aged
under 30
1% Of employees are aged
under 20, this is the smallest group
• 56% of our employees are aged 50-59, making this the largest staff group by age.
• Only 7% of employees are under 30 years old and only 1 percent of employees are under 20.
9%1019 3%
3580%3
86%10117
1%60
2%201
0%18
0%5
0
2000
4000
6000
8000
10000
12000
Casual Fixed termcontract
Not assigned Permanent Secondment Sessional Teachers Temporary
Nu
mb
er o
f em
plo
yees
Contract type
Contract type
Total
1%62
6%748
14%1692
24%2787
40%4712
14%1594
2%186
0
500
1000
1500
2000
2500
3000
3500
4000
4500
5000
< 20 20 - 29 30 - 39 40 - 49 50 - 59 60 - 69 >= 70
Nu
mb
er
of
em
plo
yee
s
Age range
Age Range

• Looking at the age of our workforce over time, there has been very little change from 2015/16 to 2018/19.
The largest change has been in the 50-59 age groups, which has increased from 35.21% in 2015/16 to 56% in
2019/20 but remains consistently the largest age group over the past 5 years.
Disability
96% Of employees do not identify as
having a disability
4% Of employees identify as having a
disability
<1% Of employees’ disability status is
unknown
• Whilst only 4 percent of employees identify as having a disability, we feel that there are many more staff
that have not yet disclosed, and we are actively setting out ways to address this issue as covered in the
outline action plan at the end of this report.
• The overall % within the workforce has stayed the same over the past 12 months.
Ethnic origin
96%11296
0%30
4%455
No Not assigned Yes
0
2000
4000
6000
8000
10000
12000
Disability indicator
Nu
mb
er
of
em
plo
yee
s
Disability
44%, 5136
26%, 3099
1%, 80
1%, 147
2%, 196
11%, 1353
15%, 1770
0 1000 2000 3000 4000 5000 6000
White
Unknown
Prefer not to say
Other
Mixed
Black or Black British
Asian or Asian British
Number of employees
Eth
nic
ori
gin
Ethnic Origin

29% Of employees are from Black/Asian/Minority Ethnic backgrounds
26% Of employees’ ethnic
origin is unknown
44% Of employees are White, this is the largest group
1% Of employees’ ethnic
origin is classed as Other
• The Workforce Race Equity Review looks at Race in more detail and, although only covers a specific point in
time, it does have a number of significant actions that will set out to address both the unknown data gap
and the other issues covered in the report. Some of the actions identified will also have a positive impact on
other protected characteristics.
Gender
60% Of employees are female
40% Of employees are male
• The workforce is 60% female, and 40% male.
• In 2016/17, 32.6% of employees were male (7.4% less than in 2019/20) and 67.4% of employees were
female (7.4% more than in 2019/20). This indicates that, as the workforce has contracted by 5,885
employees since 2016/17, we have lost a considerably higher number of female employees as part of this
process.
• We are looking at widening categories which best describes people’s gender.
• For more information on Gender and pay please see Birmingham City Council’s Gender Pay Gap Report 2018
60%7067
40%4714
0
1000
2000
3000
4000
5000
6000
7000
8000
Female Male
Nu
mb
er
of
em
plo
yee
s
Gender
Gender

Religious belief
58% Of employees’ religious belief is
unknown, this is the largest group
19% Of employees are Christian, this is
the second largest group
<1% Of employees are Jewish, this is
the smallest group
• The data on religious belief is insufficient and, whilst we have reduced the gap from 70% to 58% of unknown,
we still need to do more work on this. There is a project in place that reaches out to staff to explain the
benefits of disclosing their data to close the data gap, and we are hoping that in future reports these gaps
will be reduced.
Sexual orientation
59% Of employees’ sexual orientation is unknown, this is the largest group
1.5% Of employees are Bi-Sexual, Gay or
Lesbian
36% Of employees are heterosexual
58%6795
2%236
3%392
1%160
10%1146 5%
635 0%4
1%130
19%2257
0%26
0
1000
2000
3000
4000
5000
6000
7000
8000
Unknown Sikh Prefer notto say
OtherReligion
No Religion Muslim Jewish Hindu Christian Buddhist
Nu
mb
er
of
em
plo
yee
s
Religious belief
Religious Belief
59%, 6906
4%, 459
0%, 14
1%, 109
36%, 4235
0%, 58
0 1000 2000 3000 4000 5000 6000 7000 8000
Unknown
Prefer not to say
Other
Lesbian or Gay
Heterosexual
Bi-Sexual
Number of employees
Sexu
al o
rie
nta
tio
n
Sexual Orientation

• The data on sexual orientation is insufficient as there are currently 59% of staff not disclosing this
information, whilst this has improved from the previous year (71%), we still need to work on this. There is a
project in place that reaches out to staff to explain the benefits of disclosing their data to close the data gap,
and we are hoping that in future reports these gaps will be reduced.
Pay and grades
Data for 1st April 2019 – 31st March 2020
Age range GR1 GR2 GR3 GR4 GR5 GR6 GR7 JNC Other Grand Total
< 20 3 9 3 0 0 0 0 0 47 62
20 - 29 21 220 190 106 31 3 0 0 177 748
30 - 39 135 389 420 337 155 47 9 6 194 1692
40 - 49 244 541 714 536 297 113 34 21 287 2787
50 - 59 375 975 1239 970 490 195 64 23 381 4712
60 - 69 141 543 389 209 103 29 7 7 166 1594
>= 70 19 82 16 1 2 0 0 0 66 186
Grand Total 938 2759 2971 2159 1078 387 114 57 1318 11781
58% of people aged 20 to 29 work in
GR1, GR2 or GR3 positions
55% of people working in GR4, GR5 or GR6 positions are aged over 50
59% of people working in GR7 or JNC
positions are aged 50-69
• Our largest staff group by grade is grade 3, which constitutes 25% (2,179) of the workforce. This is the same
as the previous year.
• 57 people (under 1%) work at JNC level, this is the smallest staff group by grade.
• The ‘Other’ grade includes a variety of staff, including those who have joined through TUPE, Members,
casual & sessional staff, and those on the JNC youth and community pay scale.
Grade by Disability
Disability GR1 GR2 GR3 GR4 GR5 GR6 GR7 JNC Other Grand Total
No 914 2659 2826 2052 1028 367 112 57 1281 11296
Not assigned 0 4 6 0 0 0 0 0 20 30
Yes 24 96 139 107 50 20 2 0 17 455
Grand Total 938 2759 2971 2159 1078 387 114 57 1318 11781
57% of people with a disability work
in GR1, GR2 or GR3 positions
39% of people with a disability work
in GR4, GR5 or GR6 positions
<1% of people with a disability work
in GR7 or JNC positions
• Whilst the disability data gap needs to be reduced, with the data we do have we can see that we tend to see
a higher percentage of representation in grades under grade 5 which is typical management positions.

Grade by Ethnic Origin
Ethnic origin GR1 GR2 GR3 GR4 GR5 GR6 GR7 JNC Other Grand Total
Asian or Asian British 203 474 453 318 186 44 19 1 72 1770
Black or Black British 131 373 380 263 129 25 6 2 44 1353
Mixed 13 48 59 43 14 6 1 0 12 196
Other 7 53 31 32 15 1 2 0 6 147
Prefer not to say 11 19 18 20 9 1 0 0 2 80
Unknown 116 751 715 426 177 62 19 13 820 3099
White 457 1041 1315 1057 548 248 67 41 362 5136
Grand Total 938 2759 2971 2159 1078 387 114 57 1318 11781
64% of people from a Black, Asian or Minority Ethnic origin work in
GR1, GR2 or GR3 positions.
51% of people working in GR4, GR5 or
GR6 positions are White
18% of people working in GR7 or JNC positions are from a Black, Asian or Minority Ethnic background
As stated previously the data in this area needs to be improved with regards to Ethnicity, but with the data we have
there is much work we need to do to improve experiences of people from Black, Asian or Minority Ethnic origin and
these actions are set out in the Workforce Race Equity Review.
Grade by Gender
Gender GR1 GR2 GR3 GR4 GR5 GR6 GR7 JNC Other Grand Total
Female 830 1706 1643 1209 635 190 50 27 777 7066
Male 108 1053 1328 950 443 197 64 30 541 4714
Grand Total 938 2759 2971 2159 1078 387 114 57 1318 11781
7%
, 83
0
14
%, 1
70
6
14
%, 1
64
3
10
%, 1
20
9
5%
, 63
5
2%
, 19
0
0%
, 50
0%
, 27
7%
, 77
7
1%
, 10
8
9%
, 10
53
11
%, 1
32
8
8%
, 95
0
4%
, 44
3
2%
, 19
7
1%
, 64
0%
, 30
5%
, 54
1
0
200
400
600
800
1000
1200
1400
1600
1800
GR1 GR2 GR3 GR4 GR5 GR6 GR7 JNC Other
Nu
mb
er o
f em
plo
yees
Grade
Gender
Female
Male

63% of people working in GR1, GR2 or
GR3 positions are female
44% of people working in GR4, GR5 or
GR6 positions are male
55% of people working in GR7 or JNC
positions are male
• For more information on Gender and pay please see Birmingham City Council’s Gender Pay Gap Report 2018
Grade by Religious Belief
Religious belief GR1 GR2 GR3 GR4 GR5 GR6 GR7 JNC Other Grand Total
Buddhist 2 7 10 4 0 1 0 0 2 26
Christian 148 361 605 555 287 113 31 20 137 2257
Hindu 20 22 27 21 19 8 2 0 11 130
Jewish 0 0 2 1 1 0 0 0 0 4
Muslim 71 181 178 107 48 10 3 2 35 635
No Religion 70 148 301 270 166 72 22 10 87 1146
Other Religion 10 27 57 35 22 4 0 0 5 160
Prefer not to say 25 66 103 92 56 19 9 0 22 392
Sikh 25 29 58 68 36 6 6 0 8 236
Unknown 567 1918 1630 1006 443 154 41 25 1011 6795
Grand Total 938 2759 2971 2159 1078 387 114 57 1318 11781
28% of people working in GR1, GR2 or GR3 positions have shared that
they have a religious belief
67% of people whose religious belief is unknown work in GR2, GR3 or
GR4 positions
37% of people working in GR7 or JNC positions have shared that they
have a religious belief
• The data on religious belief is insufficient and, whilst we have reduced the gap from 70% to 58% of unknown,
we still need to do more work on this. There is a project in place that reaches out to staff to explain the
benefits of disclosing their data to close the data gap, and we are hoping that in future reports these gaps
will be reduced.
Grade by Sexual orientation
Sexual orientation GR1 GR2 GR3 GR4 GR5 GR6 GR7 JNC Other Grand Total
Bi-Sexual 3 9 19 12 12 0 0 0 3 58
Heterosexual 296 720 1164 966 537 200 68 37 247 4235
Lesbian or Gay 0 10 33 35 17 6 0 2 6 109
Other 4 4 2 4 0 0 0 0 0 14
Prefer not to say 48 78 115 95 64 23 4 2 30 459
Unknown 587 1938 1638 1047 448 158 42 16 1032 6906
Grand Total 938 2759 2971 2159 1078 387 114 57 1318 11781

2% of peoples’ sexual orientation is
Bi-Sexual, Lesbian or Gay or Other across all grades
59% of peoples’ sexual orientation is
unknown across all grades
1% of people whose sexual
orientation is Bi-Sexual, Lesbian or Gay or Other work in GR7 or
JNC positions
• The data on sexual orientation is insufficient currently having 59% of staff not disclosing this information
and, whilst this has improved from previous year (71%) we still need to work on this. There is a project in
place that reaches out to staff to explain the benefits of disclosing their data to close the data gap, and we
are hoping that in future reports these gaps will be reduced.

Dignity at Work, Disciplinary and Grievance: Data for 1st April 2019 – 31st March 2020
Includes all cases that were open during 01/04/2019 – 31/03/2020, even if these cases started before April
2019.
Overview of Dignity at Work, Disciplinary and Grievance by age
Age range Dignity at Work Disciplinary Grievance Grand Total
<24 0 1 1 2
25-34 5 21 3 29
35-49 24 47 18 89
50-54 17 24 15 56
55-59 6 21 15 42
60 > 5 29 12 46
Grand Total 57 143 64 264
72% of Dignity at Work cases were raised by people aged 35 to 54
52% of Disciplinaries involved people
aged over 50
75% of Grievances were raised by
people aged 35 to 59
• 57 staff raised dignity at work issues.
• More dignity at work issues were raised by people in the 35-49 age range.
• More disciplinaries involved people in the 35-49 age range
• The most amount of grievances involved people who were in the 35-49 age range.
Overview of Dignity at Work, Disciplinary and Grievance by Disability
Disability Dignity at Work Disciplinary Grievance Grand Total
Has a disability (or previously had one) 7 5 3 15
Not informed/unknown 50 138 61 249
Grand Total 57 143 64 264
12% of Dignity at Work cases were
raised by people with a disability
3% of Disciplinaries involved people
with a disability
5% of Grievances were raised by
people with a disability
• 7 staff who had a disability raised a dignity at work issue.
• 5 staff that had a disability were involved in a disciplinary.
• There were 3 grievances raised by people who had a disability.

Overview of Dignity at Work, Disciplinary and Grievance by Ethnic Origin
Ethnic origin Dignity at Work Disciplinary Grievance Grand Total
Asian or Asian British 15 30 6 51
Black or Black British 7 20 9 36
Mixed 3 2 0 5
Other 0 1 0 1
Prefer not to say 0 2 1 3
Unknown 10 47 14 71
White 22 41 34 97
Grand Total 57 143 64 264
44% of Dignity at Work cases were
raised by people of a Black, Asian or Minority Ethnic origin
37% of Disciplinaries involved people
of a Black, Asian or Minority Ethnic origin
53% of Grievances were raised by people whose ethnic origin is
White
• There were 25 dignity at work issues raised by staff of a Black, Asian or Minority Ethnic origin.
• The highest number of Dignity at work issues (15) were from people of an Asian or Asian British
origin.
• There were 52 disciplinaries that involved people of a Black, Asian or Minority Ethnic origin.
• The largest group of disciplinaries (41) involved people whose ethnic origin is White.
• The largest group of grievances were raised by people whose ethnic origin is White.
• There were 15 grievances raised by people of a Black, Asian or Minority Ethnic origin.
Overview of Dignity at Work, Disciplinary and Grievance by Gender
Gender Dignity at Work Disciplinary Grievance Grand Total
Female 37 65 28 130
Male 20 78 36 134
Grand Total 57 143 64 264
65% of Dignity at Work cases were
raised by females
55% of Disciplinaries involved males
56% of Grievances were raised by
males
• There were 37 dignity at work issues raised female staff, nearly twice as many as their male
colleagues.
• 78 (55%) of disciplinaries involved males as compared to 65 (45%) that involved females.
• There were 10% (55%) more grievances from male staff as compared to Female staff (45%).

Overview of Dignity at Work, Disciplinary and Grievance by Religious Belief
Religious belief Dignity at Work Disciplinary Grievance Grand Total
Christian 11 23 16 50
Hindu 0 2 0 2
Muslim 1 5 0 6 No Religion 6 8 5 19
Other Religion 3 0 2 5 Prefer not to say 5 6 3 14
Sikh 5 4 0 9 Unknown 26 95 38 159 Grand Total 57 143 64 264
35% of Dignity at Work cases were
raised by people who shared that they have a religious belief
66% of Disciplinaries involved people
whose religious belief is unknown
25% of Grievances were raised by
people whose religious belief is Christian
• There were 20 dignity at work issues raised by people who shared they had a religious belief.
• 34 disciplinaries involved people that shared they had a religious belief.
• There were 18 grievances raised by people who shared they had a religious belief.
Overview of Dignity at Work, Disciplinary and Grievance by Sexual Orientation
Sexual orientation Dignity at Work Disciplinary Grievance Grand Total
Heterosexual 28 40 23 91
Lesbian or Gay 0 2 0 2
Other 0 1 0 1 Prefer not to say 2 5 3 10 Unknown 27 95 38 160 Grand Total 57 143 64 264
49% of Dignity at Work cases were
raised by people who are heterosexual
66% of Disciplinaries involved people
whose sexual orientation is unknown
59% of Grievances were raised by
people whose sexual orientation is unknown
• Whilst there were 28 dignity at work issues raised by people who identified as heterosexual, there were 27
cases raised by people whose sexual orientation is unknown.
• 95 disciplinaries were against people whose sexual orientation is unknown.
• 38 grievances were raised by people whose sexual orientation is unknown.

Recruitment
Data for 1st April 2019 – 31st March 2020
New Starters by Age
34% of new starters were aged
under 30
44% of new starters were aged
between 30 and 49
22% of new starters were aged 50
or over
• 203 starters were from the 20-29 age group this was the largest age group of new starters.
• 34% of new starters were under 30 and 20% were over 50.
New Starters by Disability
40
203
169
146
113
34
6
0
50
100
150
200
250
< 20 20 - 29 30 - 39 40 - 49 50 - 59 60 - 69 >= 70
Nu
mb
er
of
Emp
loye
es
Age Range
Starters by Age Range
697
0 14
0
100
200
300
400
500
600
700
800
No Not assigned Yes
Nu
mb
er
of
Emp
loye
es
Disability
Starters by Disability

98% of new starters declared that they did not have a
disability
2% of new starters declared that they have a disability
• There were 14 people who declared they had a disability that started working for the council. 2% of new
starters declared they had a disability as compared to the 4% of people who declared they have a disability
in the whole council.
New Starters by Ethnic Origin
40% of new starters were of a Black, Asian or Minority Ethnic origin
20% of new starters’ ethnic origin is
unknown
38% of new starters were White
• 20% (140) new starters ethnic origin was unknown, this is a slight improvement on the 26% unknown ethnic
origin status for the whole council. The council is actively working on ways we can encourage new starters to
share their personal data and close the data gap.
• 40% of starters were of a Black, Asian or Minority Ethnic origin as compared to 38% of new starters that
were White.
164
87
18 14 16
140
272
0
50
100
150
200
250
300
Asian or AsianBritish
Black or BlackBritish
Mixed Other Prefer not to say Unknown White
Nu
mb
er
of
Emp
loye
es
Ethnic Origin
Starters by Ethnic Origin
New Starters by Gender
62% of new starters were female
38% of new starters were male
• 444 new starters were female as compared with 267 male starters. As stated earlier in the report we are
looking at widening categories which best describes peoples’ gender
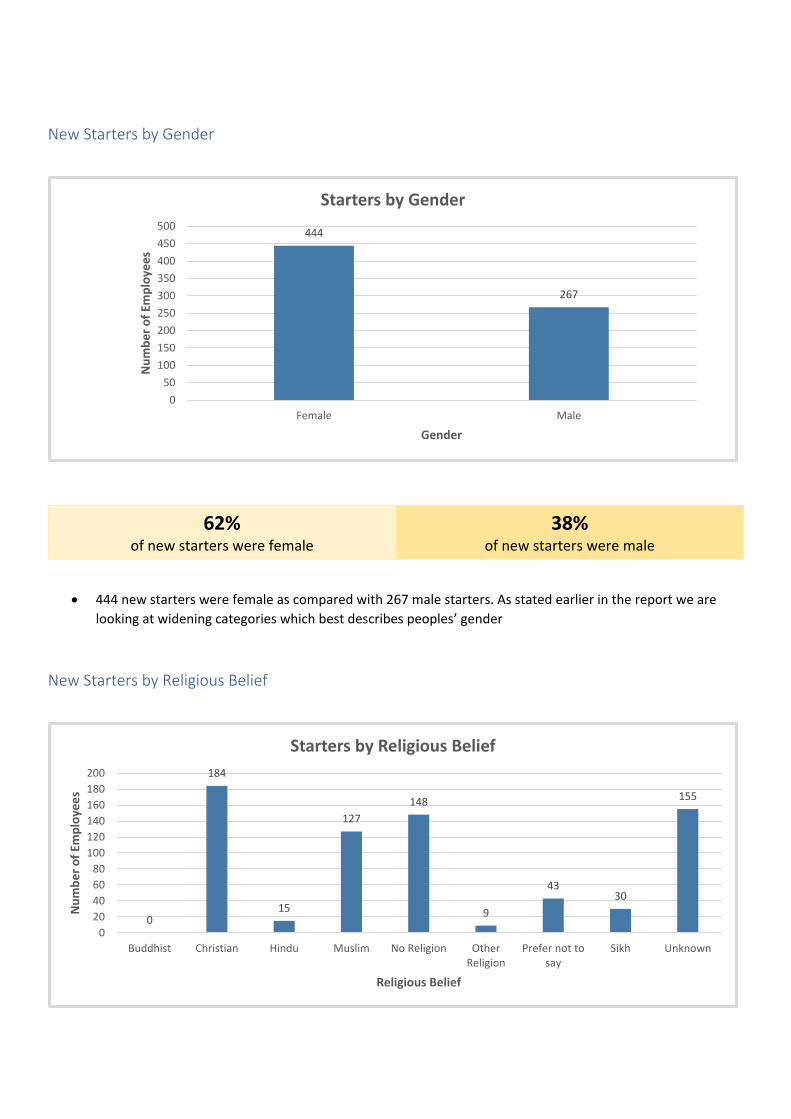
New Starters by Religious Belief
444
267
0
50
100
150
200
250
300
350
400
450
500
Female Male
Nu
mb
er
of
Emp
loye
es
Gender
Starters by Gender
0
184
15
127
148
9
4330
155
0
20
40
60
80
100
120
140
160
180
200
Buddhist Christian Hindu Muslim No Religion OtherReligion
Prefer not tosay
Sikh Unknown
Nu
mb
er
of
Emp
loye
es
Religious Belief
Starters by Religious Belief

51% of new starters shared that they
have a religious belief
22% of new starters’ religious belief is
unknown
26% of new starters’ religious belief was Christian, the largest group
• Whilst 51% of new starters identified they had a religious belief there were 22% whose Religious belief was
unknown. However, when compared to the overall 58% of unknown religious belief in the whole council this
is an improvement. The council is actively working on ways we can encourage new starters to share their
personal data and close the data gap.
Sexual orientation
4% of new starters’ sexual
orientation was Bi-Sexual, Lesbian or Gay
23% of new starters’ sexual orientation is unknown
70% of new starters’ sexual
orientation was heterosexual, the largest group
• 4% of new starters sexual orientation was Bi-Sexual, Lesbian or Gay as compared to the council’s overall
1.5% of employees that identified they are Bi-Sexual, Gay or Lesbian.
• The data on sexual orientation is still insufficient however 23% of new starters’ sexual orientation was
unknown as compared to the current 59% of all staff not disclosing this information, this may be evidencing
a trend of more disclosure in this area.
• There is a project in place that reaches out to new starters to explain the benefits of disclosing their data to
close the data gap and we are hoping that in future reports these gaps will be reduced.
13
496
15 25
162
0
100
200
300
400
500
600
Bi-Sexual Heterosexual Lesbian or Gay Prefer not to say Unknown
Nu
mb
er
of
Emp
loye
es
Sexual Orientation
Starters by Sexual Orientation

Leavers
Data for 1st April 2019 – 31st March 2020
Leavers Data by Age Range
Age range
Death in Service
Dismissal End of Contract
Non Starter
Redundancy Resignation Retirement Settlement Agreement
TUPE out
Grand Total
16-19 0 0 8 0 0 2 0 0 0 10
20-24 0 6 118 0 0 54 0 0 0 178
25-29 0 8 76 0 0 82 0 0 8 174
30-34 0 4 70 4 6 90 0 0 6 180
35-39 0 2 74 0 2 120 0 0 18 216
40-44 4 8 96 0 2 120 0 6 14 250
45-49 4 14 132 2 6 112 2 0 32 304
50-54 10 14 154 0 12 132 4 2 44 372
55-59 6 16 156 2 76 128 48 2 32 466
60-64 6 12 112 0 32 92 74 6 18 352
65+ 6 16 164 0 18 66 110 0 14 394
Grand Total
36 100 1160 8 154 998 238 16 186 2896
12% of people leaving the council
were aged under 29
33% of people leaving the council
were aged 30 to 49
55% of people leaving the council
were aged over 50
• There were 58 dismissals of people who were aged over 50 and 42 for people aged under 50.
• There were 76 redundancies for people in the 55-59 age range.
• There were more resignations (132) from people aged 50-54.
Leavers Data by Disability
Disability Death in Service
Dismissal End of Contract
Non Starter
Redundancy Resignation Retirement Settlement Agreement
TUPE out
Grand Total
No 30 92 1086 8 132 930 212 16 184 2690 Not assigned 2 0 60 0 6 30 10 0 0 108
Yes 4 8 14 0 16 38 16 0 2 98
Grand Total
36 100 1160 8 154 998 238 16 186 2896
8% of people who were dismissed
had a disability
10% of people made redundant had a
disability
4% of people who resigned had a
disability

• Considering we need to close the data gap on people with a disability, 8% of people that were dismissed had
a disability, 10% of redundancies included a person with a disability and 4% of people that resigned had a
disability.
Leavers Data by Ethnic Origin
Ethnic origin
Death in Service
Dismissal End of Contract
Non Starter
Redundancy Resignation Retirement Settlement Agreement
TUPE out
Grand Total
Asian or Asian British
4 18 126 2 20 132 6 2 36 346
Black or Black British
0 10 52 2 24 82 18 2 24 214
Mixed 2 0 14 0 2 18 2 0 4 42
Other 0 0 10 0 2 10 0 0 2 24
Prefer not to say
0 0 2 0 0 16 2 0 4 24
Unknown 12 38 636 0 20 328 56 2 20 1112
White 18 34 320 4 86 412 154 10 96 1134
Grand Total
36 100 1160 8 154 998 238 16 186 2896
22% of people who left the council
were from a Black, Asian or Minority Ethnic background
38% of people who left the council’s
ethnic origin is unknown
39% of people who left the council
were White
• 30% of people who left the council were white as compared to 22% of people who were from a Black, Asian
or Minority Ethnic background.
• 34 dismissals were for people whose ethnic origin was white as compared to 28 people from a Black, Asian
or Minority Ethnic background. However, 38 people who left the council’s ethnic origin is unknown.
• 55% of redundancies were for people whose ethnic background was white as compared to 30% of people
who were from a Black, Asian or Minority Ethnic background. However, we are still missing data for 13% of
people.
• 154 people who retired were from a white ethnic background as compared to 26 people who were from a
Black, Asian or Minority Ethnic background. However, we are still missing data for 56 people.
Leavers Data by Gender
Gender Death in Service
Dismissal End of Contract
Non Starter
Redundancy Resignation Retirement Settlement Agreement
TUPE out
Grand Total
Female 22 54 824 8 102 686 132 12 172 2012
Male 14 46 336 0 52 312 106 4 14 884
Grand Total
36 100 1160 8 154 998 238 16 186 2896

54% of people who were dismissed
were female
71% of people whose contract ended
were female
69% of people who resigned were
female
• 54% of people who were dismissed were female as compared to 46% male.
• 71% of people whose contract ended were female as compared to 29% male.
• 69% of people who resigned were female as compared to 31% male.
Leavers Data by Religious Belief
Religious belief
Death in Service
Dismissal End of Contract
Non Starter
Redundancy Resignation Retirement Settlement Agreement
TUPE out
Grand Total
Christian 4 8 102 2 36 186 68 4 26 436
Hindu 0 2 10 0 2 6 0 0 2 22
Muslim 0 2 60 2 6 52 6 0 12 140
No Religion
8 14 54 2 16 140 8 2 4 248
Other Religion
2 0 8 0 8 18 4 0 6 46
Prefer to not say
0 2 6 0 2 38 8 0 6 62
Sikh 0 0 12 0 0 28 0 0 4 44
Unknown 22 72 908 2 84 530 144 10 126 1898
Grand Total
36 100 1160 8 154 998 238 16 186 2896
24% of people who left the council have shared that they have a
religious belief
66% of people who left the councils’
religious belief is unknown
29% of people who resigned have
shared that they have a religious belief
• There were 12 people who were dismissed that have a religious belief.
• There were 60 people who have a religious belief that were made redundant.
• There were 48 people who retired that have a religious belief.

Leavers Data by Sexual Orientation
Sexual orientation
Death in Service
Dismissal End of Contract
Non Starter
Redundancy Resignation Retirement Settlement Agreement
TUPE out
Grand Total
Bi-Sexual 0 0 2 0 0 8 0 0 2 12 Heterosexual 8 26 202 8 64 390 84 6 50 838
Lesbian or Gay
0 2 8 0 2 20 2 0 0 34
Prefer to not say
2 4 22 0 2 40 6 0 12 88
Unknown 26 68 926 0 86 540 146 10 122 1924
Grand Total
36 100 1160 8 154 998 238 16 186 2896
2% of people who left the councils’
sexual orientation was Bi-Sexual, Lesbian or Gay
66% of people who left the council’s sexual orientation is unknown
3% of people who resigneds’ sexual
orientation was Bi-Sexual, Lesbian or Gay
• 66% of people who left the council’s sexual orientation is unknown. There is a project in place that reaches
out to new starters to explain the benefits of disclosing their data to close the data gap and we are hoping
that in future reports these gaps will be reduced.

Staff Engagement:
Staff Survey 3,653 employees completed the most recent Staff Survey in October 2019.
We did not collect the data with regards to the protected characteristics, however the headlines from the survey
feedback were:
Consistent level of staff who would go above and beyond to help BCC succeed and those who find their work interesting, fulfilling and sufficiently challenging.
Increase (4%) in those who would recommend BCC as a great place to work.
A 7% increase in the amount of staff that are unlikely to look for a job outside BCC.
Similar volumes of staff who feel they have the skills to fulfil the requirements of their job role.
Staff continue to understand the Councils values, vision and behaviours. However, there is a slight increase in the amount of staff who believe we should change these values.
Staff feel that we are managing change better with a 5% increase over the last year with 23% agreeing.
A 4% Improvement in those who feel performance is handled well but still low overall at 27%.
7% increase in the amount of staff who believe that BCC is manged well although still low overall sitting at 27%.
There is no change in the levels of discrimination and bullying experienced within the workplace.
6% increase in those who are likely to stay at BCC as an employee.

Recommended Actions
Recommended actions
What we are going to do Time
frame
1. Io improve our data and clearly articulate the benefits to our
city of gathering meaningful workforce data, work with
management teams to close the gaps in our data.
December
2020
2. Review and re-establish a robust exit interview process and
reporting.
January 2021
3. Fully utilise the workforce planning approach to incorporate a whole
Equality Diversity and Inclusion approach to workforce planning,
highlighting areas of concern and development on a service by service
focus.
January 2021
4. Create a new diversity audit to inform our long-term strategy. We want
to be a learning organisation and better understand how to unblock the
barriers to a fully inclusive workplace.
April 2021
5. To widen the scope of this report to ensure that all protected
characteristics are fully covered in future PSED reports.
August 2021
6. Refresh our approach to Equality Impact Assessments and their
use during Workforce Planning and organisational redesigns.
December
2021
7. Undertake a review across all protected characteristics with the intention
of bringing together one approach for addressing full representation
across the workforce.
April 2022