Embed Size (px)
Citation preview
BIOTECH SUPPLYBIOTECH SUPPLYBIOTECH SUPPLYBIOTECH SUPPLYOctober 8-9, 2012
Crowne Plaza, Foster City, CA
The Supply Chain Challenge:Creating Value
Wayne McDonnellDirector, Advisory
PwC
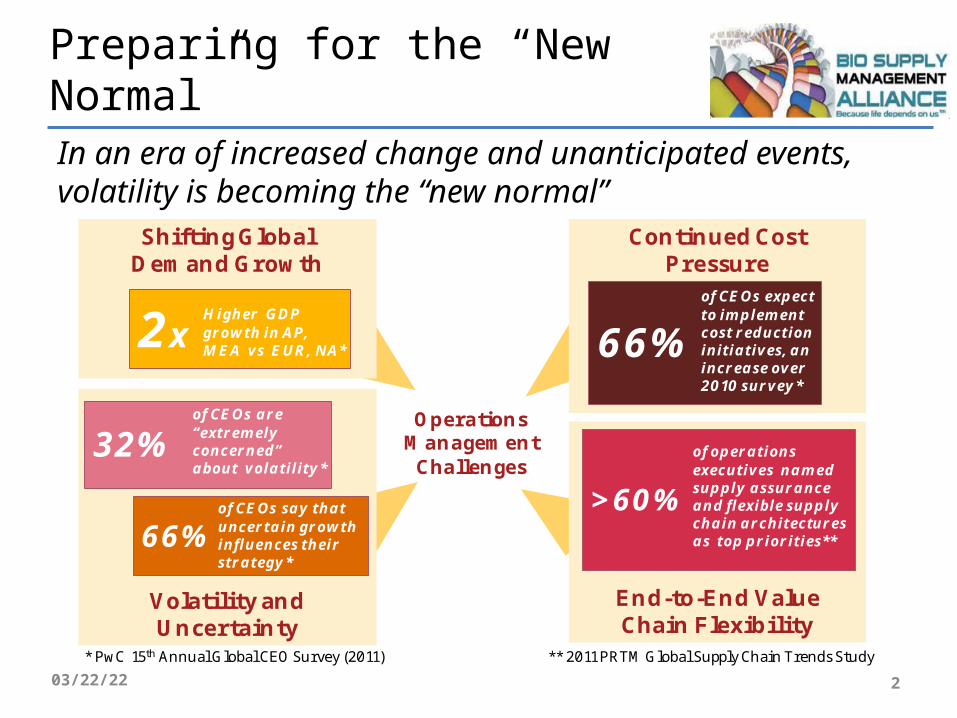
Preparing for the “New Normal”
In an era of increased change and unanticipated events, volatility is becoming the “new normal”
OperationsManagementChallenges
Shifting GlobalDemand Growth
Volatility and Uncertainty
Continued Cost Pressure
End-to-End Value Chain Flexibility
2xHigher GDP growth in AP, MEA vs EUR, NA* 66%
of CEOs expect to implement cost reduction initiatives, an increase over 2010 survey*
32%of CEOs are “extremely concerned” about volatility*
66%of CEOs say that uncertain growth influences their strategy*
>60%
of operations executives named supply assurance and flexible supply chain architectures as top priorities**
* PwC 15th Annual Global CEO Survey (2011) ** 2011 PRTM Global Supply Chain Trends Study
04/19/23 2
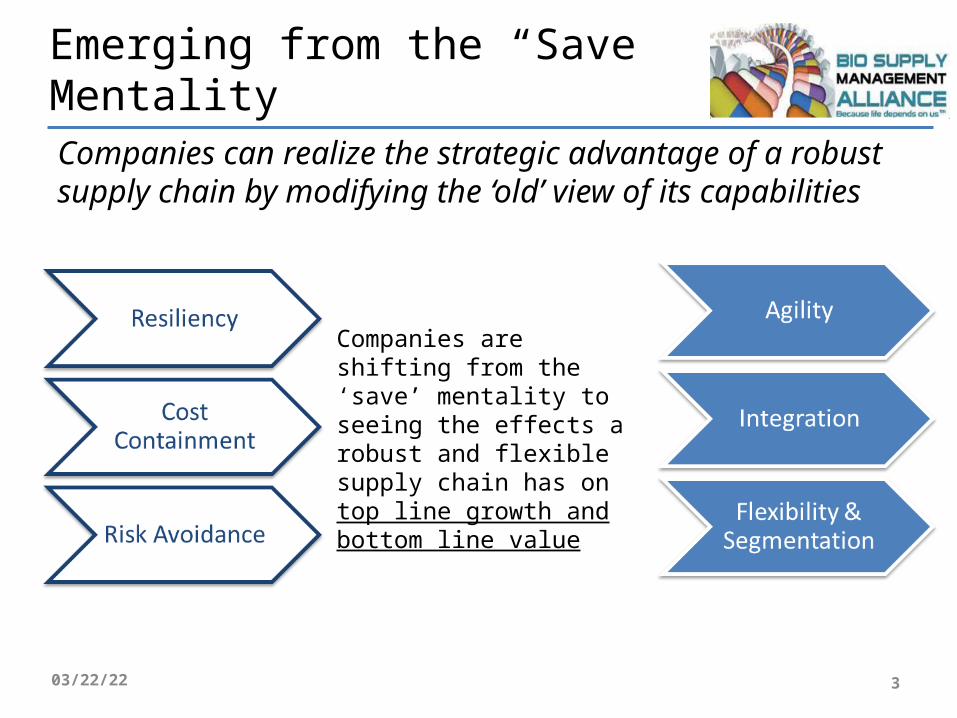
Emerging from the “Save” Mentality
Companies can realize the strategic advantage of a robust supply chain by modifying the ‘old’ view of its capabilities
Companies are shifting from the ‘save’ mentality to seeing the effects a robust and flexible supply chain has on top line growth and bottom line value
04/19/23 3
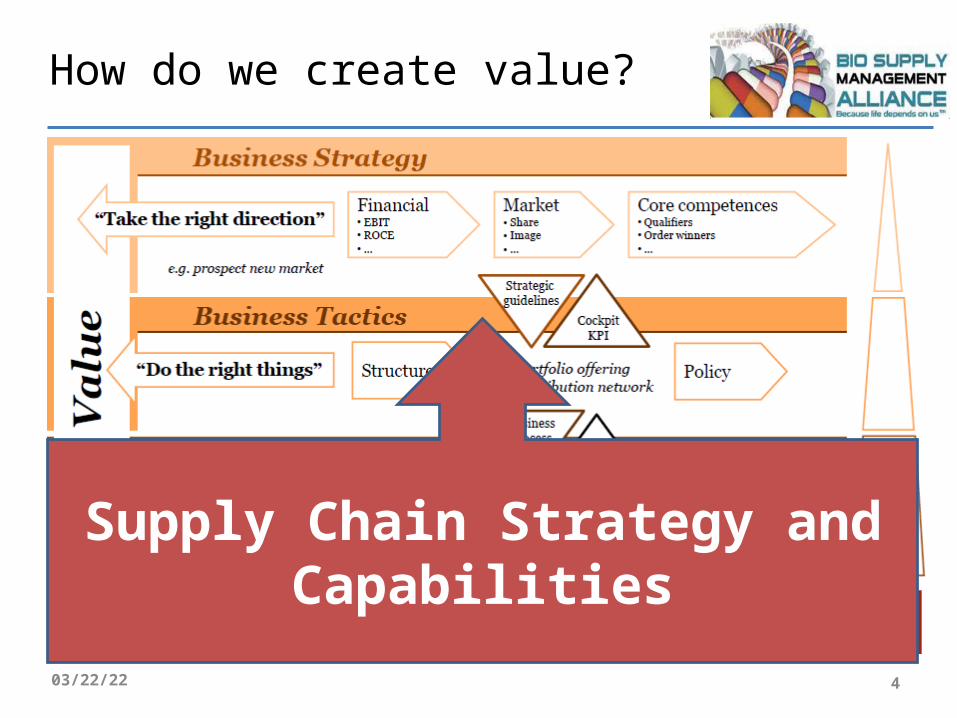
How do we create value?
04/19/23 4
Supply Chain Strategy and Capabilities
.
04/19/23 5
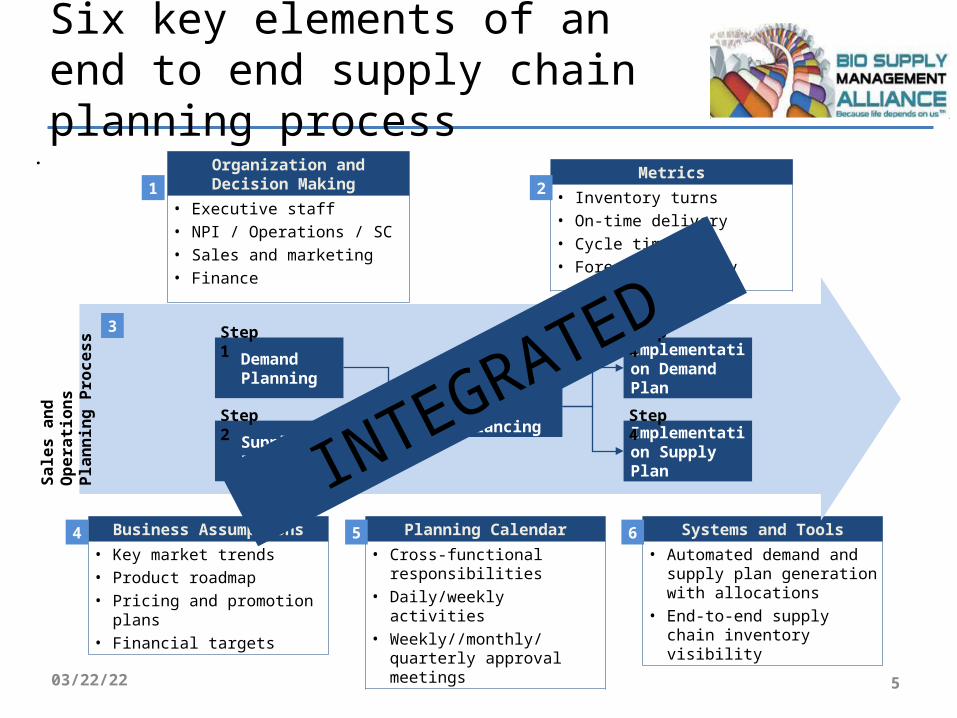
Six key elements of an end to end supply chain planning process
Business Assumptions
• Key market trends• Product roadmap• Pricing and promotion plans• Financial targets
Metrics
• Inventory turns• On-time delivery• Cycle time• Forecast accuracy
Planning Calendar
• Cross-functional responsibilities
• Daily/weekly activities• Weekly//monthly/quarterly
approval meetings
Systems and Tools
• Automated demand and supply plan generation with allocations
• End-to-end supply chain inventory visibility
Organization and Decision Making
• Executive staff• NPI / Operations / SC• Sales and marketing• Finance
4 5 6
1 2
Demand Planning
Supply Planning
Demand / SupplyBalancing
Implementation Supply Plan
3
Implementation Demand Plan
Step 1
Step 2
Step 4
Step 3
Step 4
Sa
les
an
d O
pe
rati
on
s
Pla
nn
ing
Pro
ce
ss
INTEGRATED
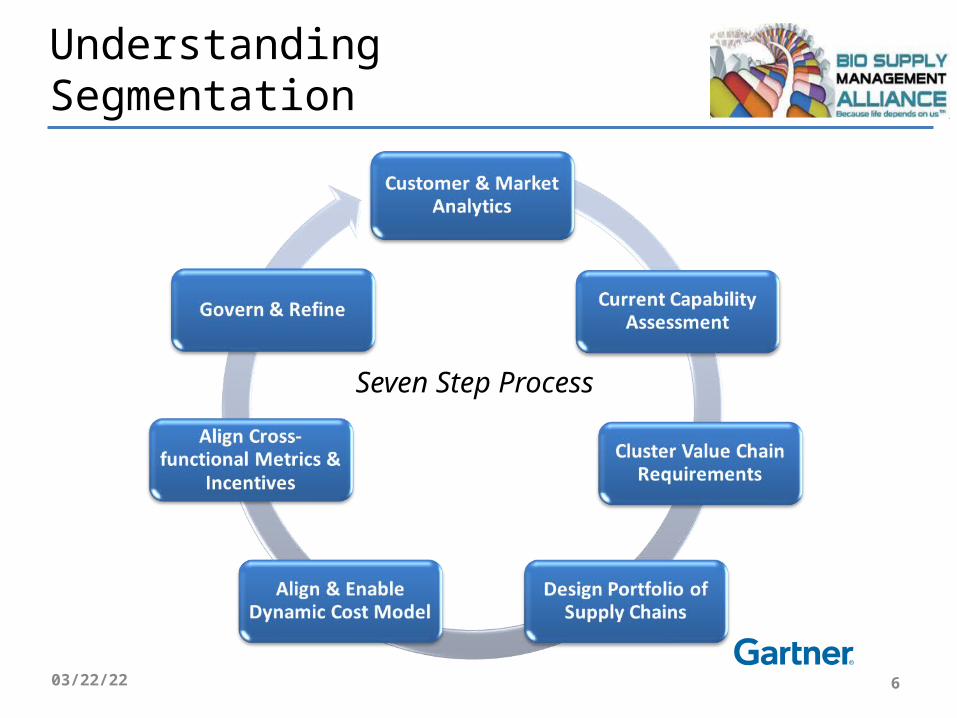
Understanding Segmentation
Seven Step Process
04/19/23 6
04/19/23 7
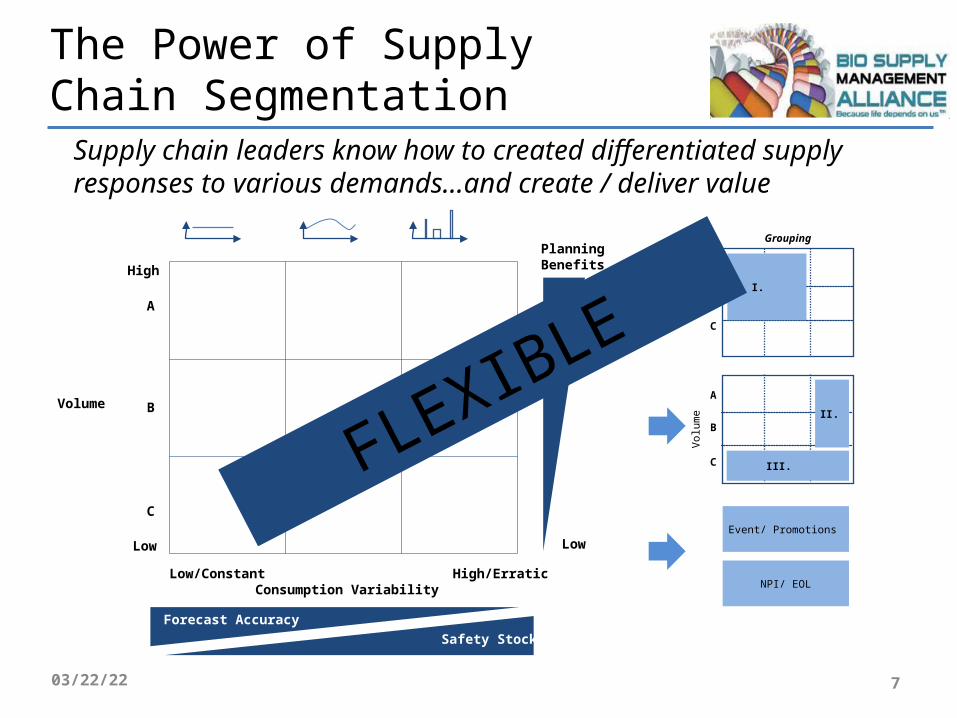
The Power of Supply Chain Segmentation
Supply chain leaders know how to created differentiated supply responses to various demands…and create / deliver value
A
B
C
Volume
Low/Constant High/ErraticConsumption Variability
High
Low
A
B
C
Vol
ume
A
B
C
Vol
ume I.
II.
Event/ Promotions
NPI/ EOL
III.
Forecast Accuracy
Safety Stock
PlanningBenefits
Low
High
Grouping
FLEXIBLE
04/19/23 8
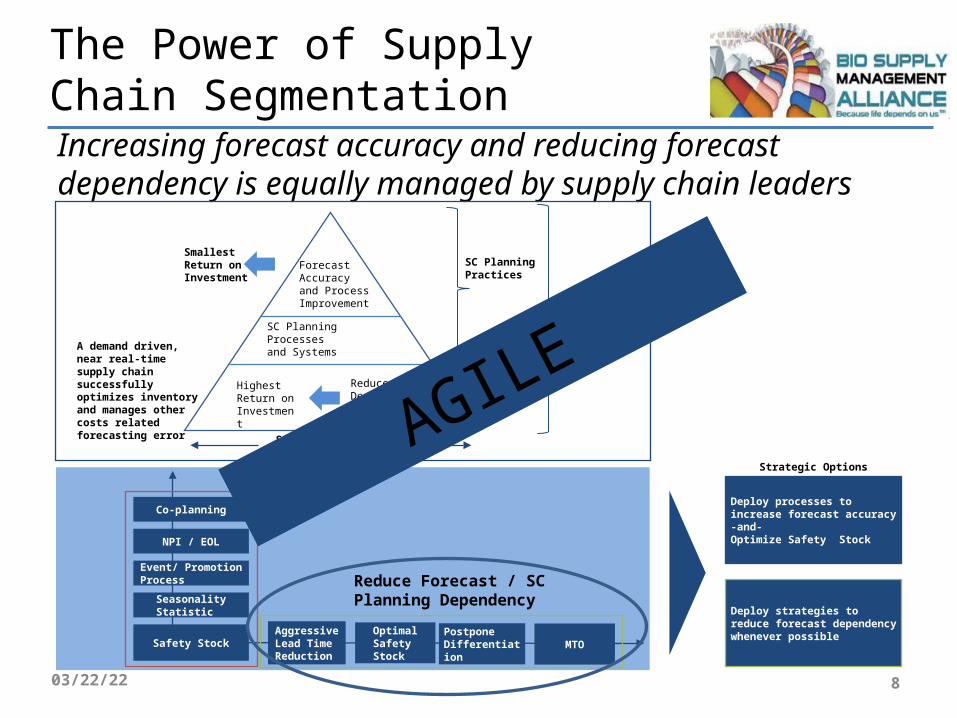
The Power of Supply Chain SegmentationIncreasing forecast accuracy and reducing forecast dependency is equally managed by supply chain leaders
Strategic Options
Reduce Forecast / SC Planning Dependency
Deploy processes toincrease forecast accuracy -and-Optimize Safety Stock
Deploy strategies to reduce forecast dependency whenever possibleAggressive
Lead TimeReduction
Optimal Safety Stock
Postpone Differentiation
MTO
Co-planning
Event/ Promotion Process
Seasonality Statistic
Safety Stock
NPI / EOL
Smallest Return on Investment
SC PlanningPractices
DifferentiatedEnd-to-endSupply ChainModel
Supply Chain/Performance Impact
A demand driven, near real-time supply chain successfully optimizes inventory and manages other costs related forecasting error
Forecast Accuracy and Process Improvement
SC Planning Processesand Systems
Highest Return on Investment
Reduce Dependency on the Forecast AGILE
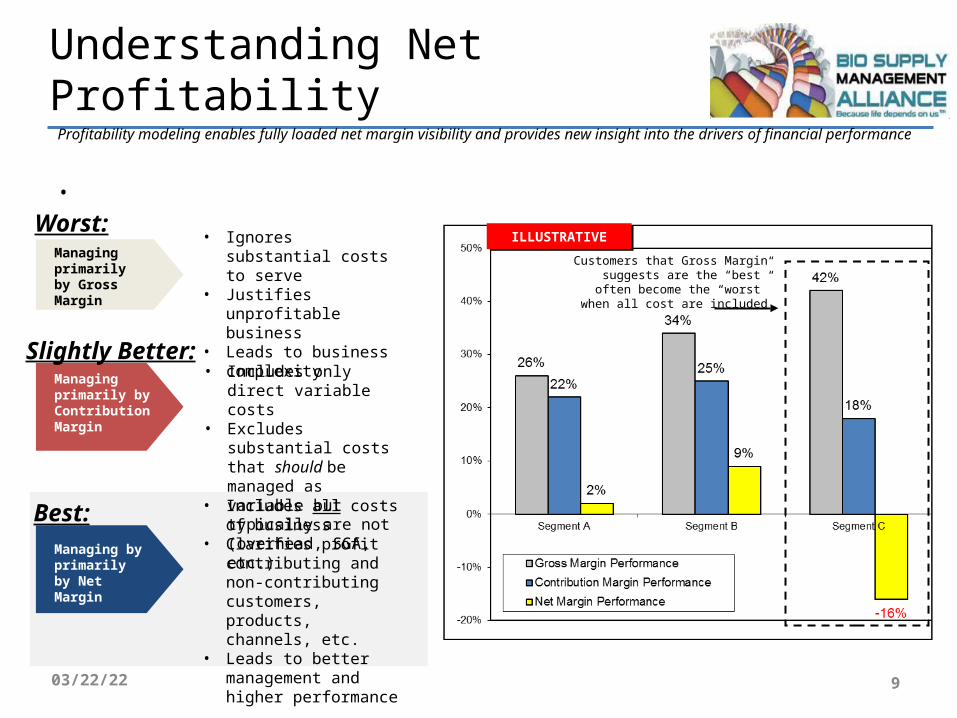
Understanding Net ProfitabilityProfitability modeling enables fully loaded net margin visibility and provides new insight into the drivers of financial performance
•
04/19/23 9
Slightly Better:Managing primarily by Contribution Margin
Worst:Managing primarily by Gross Margin
Best:Managing by primarily by Net Margin
Customers that Gross Margin suggests are the “best” often become the “worst”
when all cost are included
• Ignores substantial costs to serve
• Justifies unprofitable business
• Leads to business complexity
• Includes all costs of business
• Clarifies profit contributing and non-contributing customers, products, channels, etc.
• Leads to better management and higher performance
• Includes only direct variable costs
• Excludes substantial costs that should be managed as variable but typically are not (overhead, SGA, etc.)
ILLUSTRATIVEILLUSTRATIVE
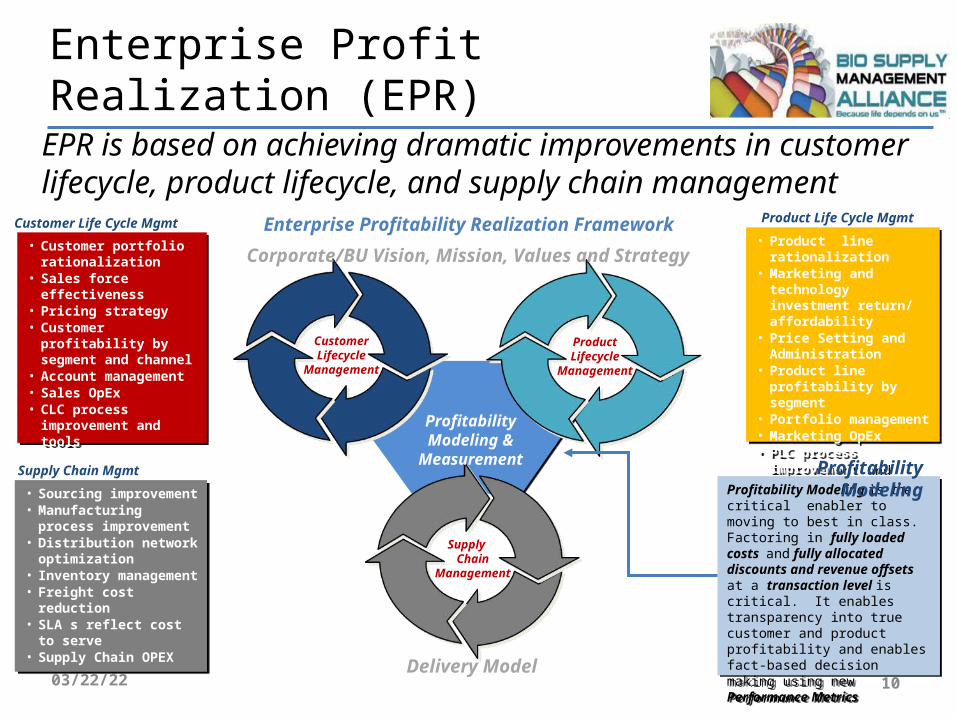
Enterprise Profit Realization (EPR)
04/19/23 10
EPR is based on achieving dramatic improvements in customer lifecycle, product lifecycle, and supply chain management
Customer Lifecycle
Management
Product Lifecycle
Management
Supply Chain
Management
Profitability Modeling &
Measurement
• Customer portfolio rationalization
• Sales force effectiveness• Pricing strategy• Customer profitability by
segment and channel• Account management• Sales OpEx• CLC process improvement
and tools
• Customer portfolio rationalization
• Sales force effectiveness• Pricing strategy• Customer profitability by
segment and channel• Account management• Sales OpEx• CLC process improvement
and tools
Customer Life Cycle Mgmt
• Sourcing improvement• Manufacturing process
improvement• Distribution network
optimization• Inventory management• Freight cost reduction• SLA s reflect cost to serve• Supply Chain OPEX
• Sourcing improvement• Manufacturing process
improvement• Distribution network
optimization• Inventory management• Freight cost reduction• SLA s reflect cost to serve• Supply Chain OPEX
Supply Chain Mgmt
• Product line rationalization• Marketing and technology
investment return/ affordability
• Price Setting and Administration
• Product line profitability by segment
• Portfolio management• Marketing OpEx• PLC process improvement
and tools
• Product line rationalization• Marketing and technology
investment return/ affordability
• Price Setting and Administration
• Product line profitability by segment
• Portfolio management• Marketing OpEx• PLC process improvement
and tools
Product Life Cycle Mgmt
Profitability Modeling is the critical enabler to moving to best in class. Factoring in fully loaded costs and fully allocated discounts and revenue offsets at a transaction level is critical. It enables transparency into true customer and product profitability and enables fact-based decision making using new Performance Metrics
Profitability Modeling is the critical enabler to moving to best in class. Factoring in fully loaded costs and fully allocated discounts and revenue offsets at a transaction level is critical. It enables transparency into true customer and product profitability and enables fact-based decision making using new Performance Metrics
Profitability Modeling
Enterprise Profitability Realization Framework
Delivery Model
Corporate/BU Vision, Mission, Values and Strategy
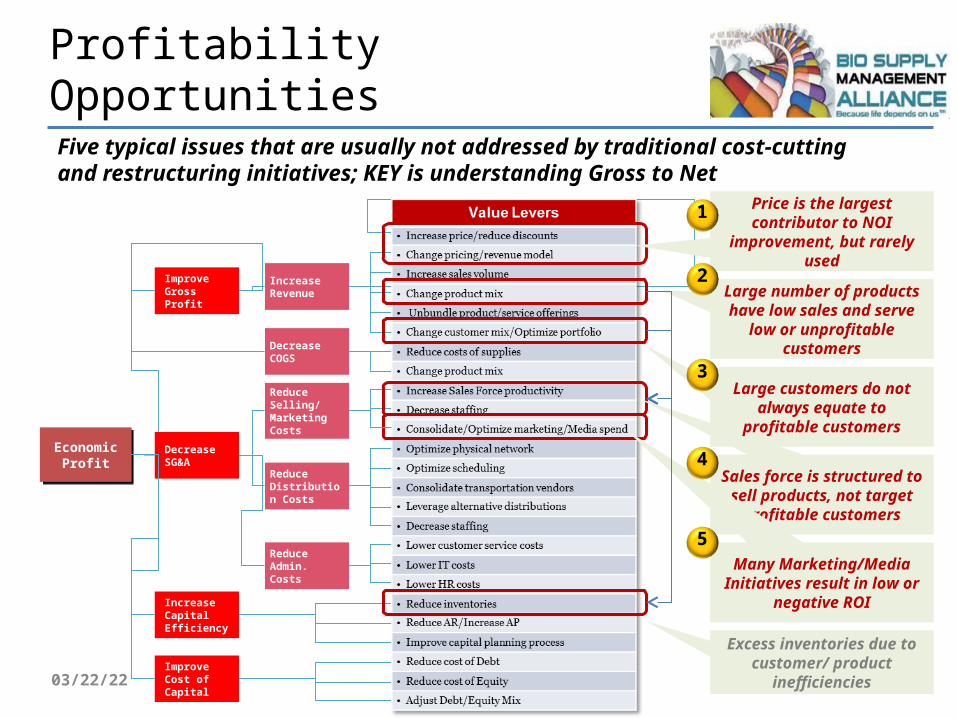
Profitability Opportunities
Five typical issues that are usually not addressed by traditional cost-cutting and restructuring initiatives; KEY is understanding Gross to Net
04/19/23 11
Economic Profit
Economic Profit
Improve Gross Profit
Decrease SG&A
Increase Capital Efficiency
Improve Cost of Capital
Increase Revenue
Decrease COGS
Reduce Selling/ Marketing Costs
Reduce Distribution Costs
Reduce Admin. Costs
Large number of products have low
sales and serve low or unprofitable customers
Price is the largest contributor to NOI improvement, but
rarely used
Sales force is structured to sell
products, not target profitable customers
Many Marketing/Media
Initiatives result in low or negative ROI
Large customers do not always equate to profitable customers
1
2
3
4
5
Excess inventories due to customer/ product
inefficiencies
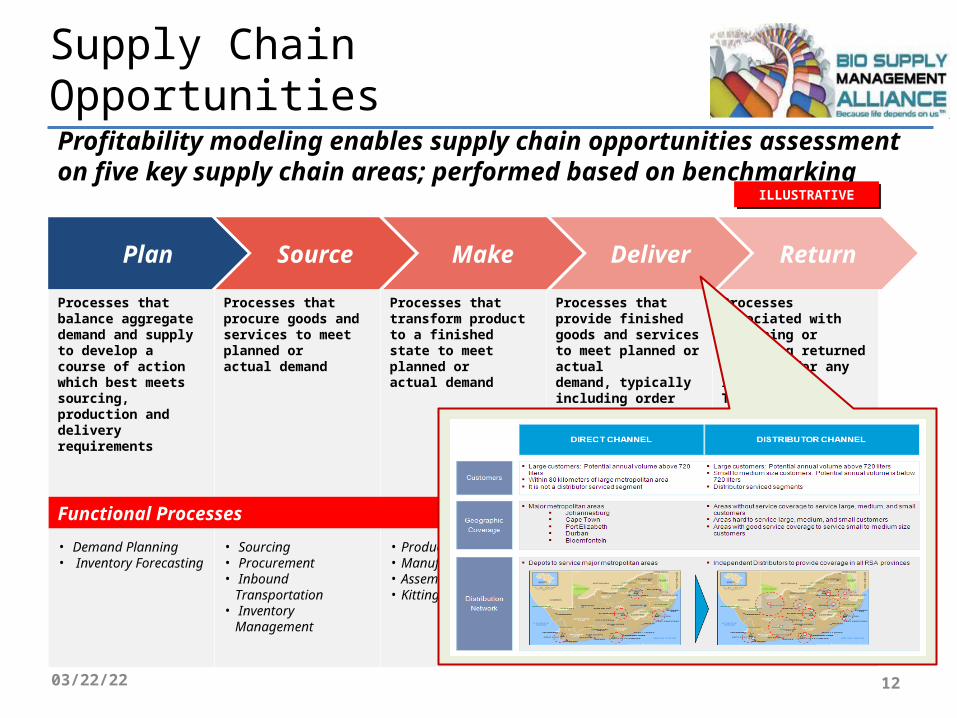
Supply Chain Opportunities
Profitability modeling enables supply chain opportunities assessment on five key supply chain areas; performed based on benchmarking
04/19/23 12
ILLUSTRATIVEILLUSTRATIVE
Processes that balance aggregate demand and supply to develop a course of action which best meets sourcing, production and delivery requirements
Processes that procure goods and services to meet planned oractual demand
Processes that transform product to a finished state to meet planned oractual demand
Processes that provide finished goods and services to meet planned or actualdemand, typically including order management, transportation management, and distribution management
Processes associated with returning or receiving returned products for any reason.These processes extend into post-delivery customer support
Functional Processes
• Demand Planning• Inventory
Forecasting
• Sourcing• Procurement• Inbound
Transportation• Inventory
Management
• Production Scheduling
• Manufacturing• Assembly• Kitting
• Warehousing• Distribution• Outbound
Transportation
• Reverse Logistics
Plan Source Make Deliver Return
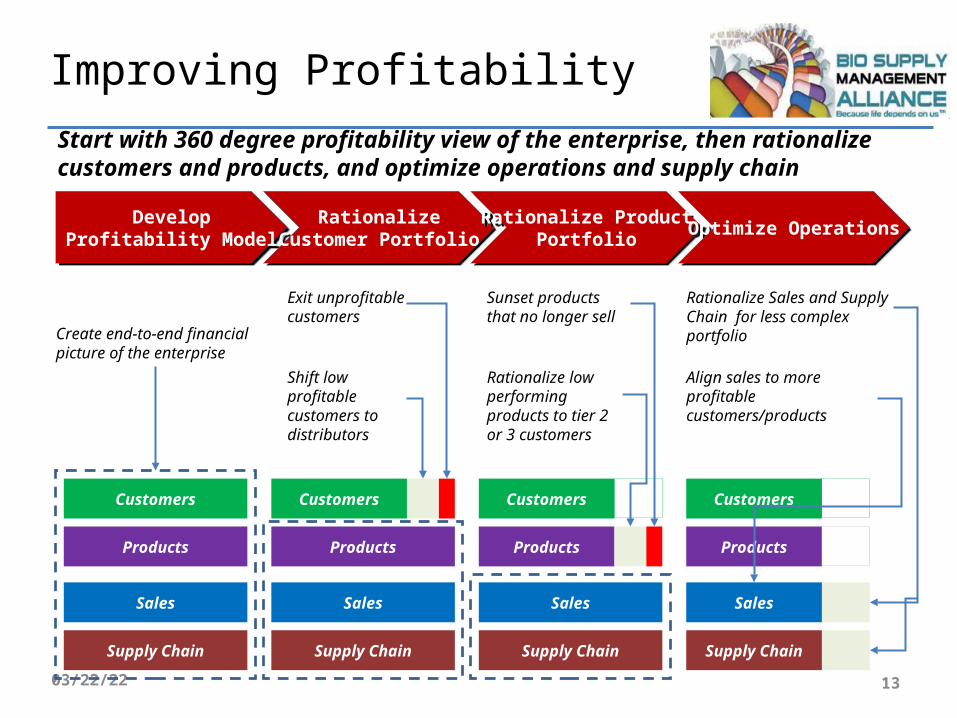
Improving Profitability
Start with 360 degree profitability view of the enterprise, then rationalize customers and products, and optimize operations and supply chain
04/19/23 13
Develop Profitability Model
Develop Profitability Model
Rationalize Customer Portfolio
Rationalize Customer Portfolio
Rationalize Product Portfolio
Rationalize Product Portfolio
Optimize OperationsOptimize
Operations
Customers
Products
Sales
Supply Chain
Customers
Products
Sales
Supply Chain
Exit unprofitable customers
Shift low profitable customers to distributors
Customers
Products
Sales
Supply Chain
Sunset products that no longer sell
Rationalize low performing products to tier 2 or 3 customers
Customers
Products
Sales
Supply Chain
Rationalize Sales and Supply Chain for less complex portfolioCreate end-to-end
financial picture of the enterprise Align sales to more
profitable customers/products
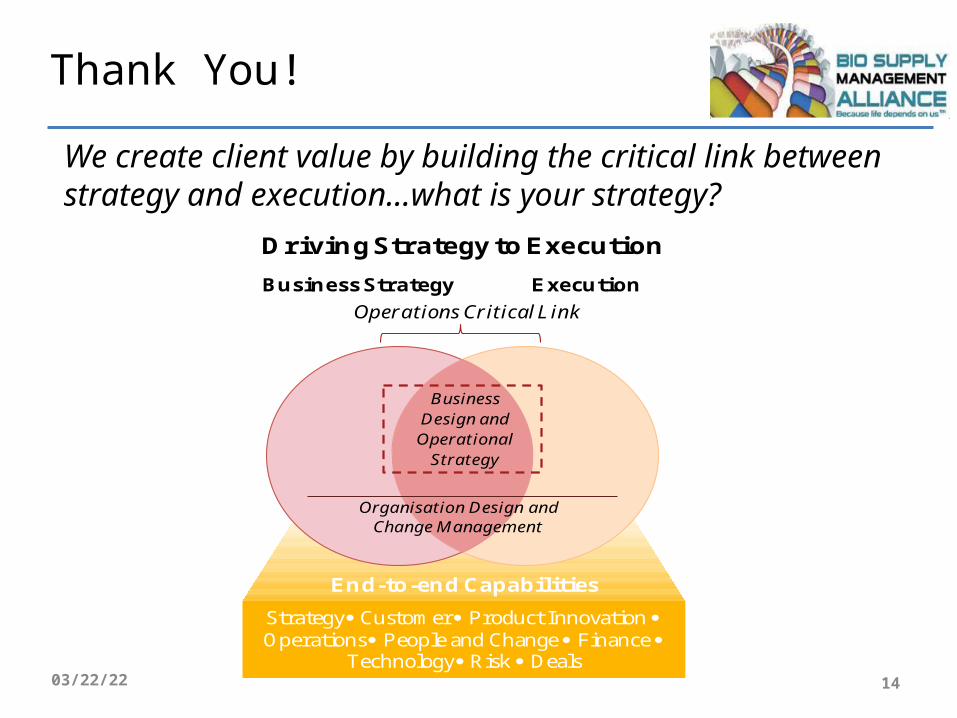
Thank You!
04/19/23 14
We create client value by building the critical link between strategy and execution…what is your strategy?
Driving Strategy to Execution
Business Strategy Execution
End-to-end Capabilities
BusinessDesign and Operational
Strategy
OrganisationDesign andChange Management
Strategy Customer Product Innovation Operations People and Change Finance
Technology Risk Deals
Operations Critical Link