Embed Size (px)
Citation preview

©2004 Burrill & Company. Confidential & Proprietary.
11
Biotech 2006Life Sciences: A Changing Prescription
NY Pharma
October 19th, 2006
G. Steven Burrill, CEOBurrill & Company
©2004 Burrill & Company. Confidential & Proprietary.
22
Burrill Venture Capital Funds Under Management ($ millions)
Burrill Life Sciences Capital Fund III (2006) $300-500
Capital Under Management:• Burrill Life Sciences Capital Fund III (first close 4Q05) $233• Burrill Life Sciences Capital Fund II (2002/2003)* $211• Burrill Life Sciences Capital Fund I
Burrill Biotechnology Capital Fund (1999)* $140Burrill Agbio Capital Funds I & II (1998*/2001) $101
Burrill Nutraceuticals Capital Fund (2000)* $61 $302
Total Under Management at 12/31/05 $746
* Fully invested, including reserves/commitments for subsequent financings in existing portfolio companies
16
©2004 Burrill & Company. Confidential & Proprietary.
33
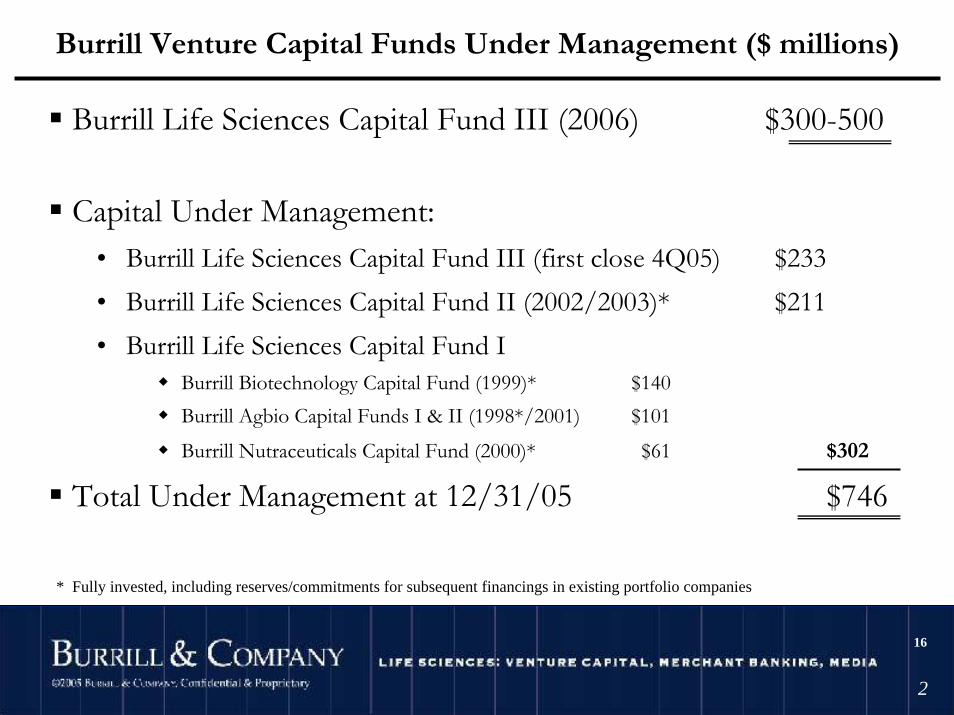
Merchant Banking Group ServicesStrategic Development
Early Stage Research to Product Development & Commercialization
•P&G/Taigen•Wyeth•ViroPharma/Schering Plough
M&A TransactionsTransactions across Life Sciences
•Purdue/Safeguard
•Operon/Quiagen
•ViroPharma/Schering Plough
Spin-Outs & Divestitures
Create a new Company or into an established Entity
•RJR/Targacept
•Baxter/VimRX
•Lilly/Ipsen
•Danisco/Genencor Advisory ServicesStrategic Transaction Advice
•Sugen/Pharmacia
•Acrux/Vivus
Financing
Advisory/Private Placement
•SangStat
•Immune Response
Potential Scope of
Merchant Banking Group
Client Relationship
©2004 Burrill & Company. Confidential & Proprietary.
44
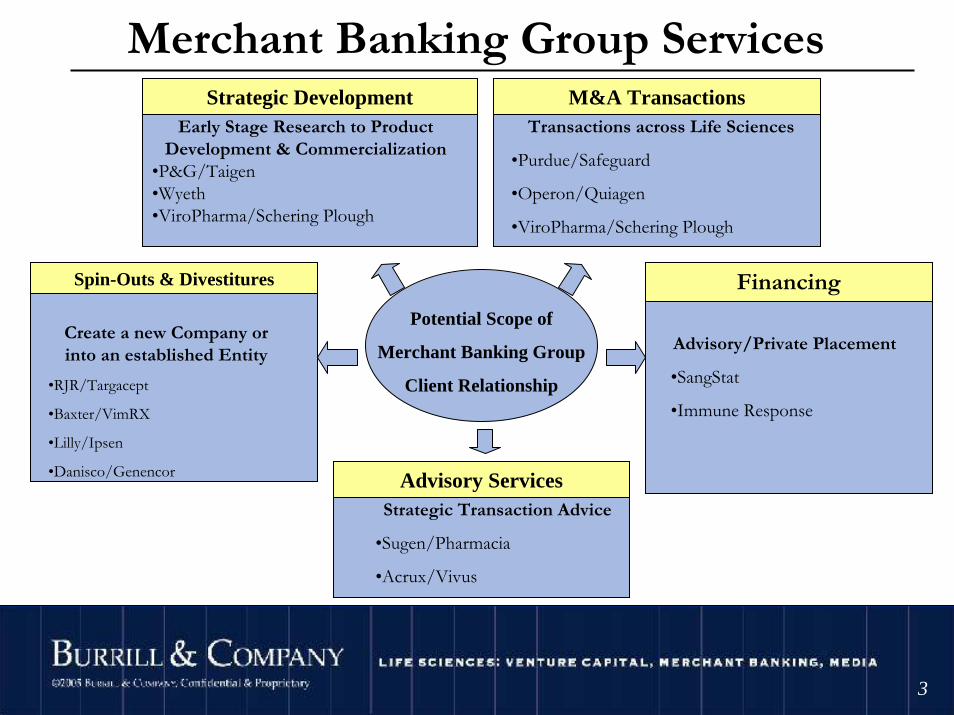
Burrill Created/Hosted Industry Events
For inquires, contact Thea Schwartz at (415) 591-5477 or [email protected]
©2004 Burrill & Company. Confidential & Proprietary.
55
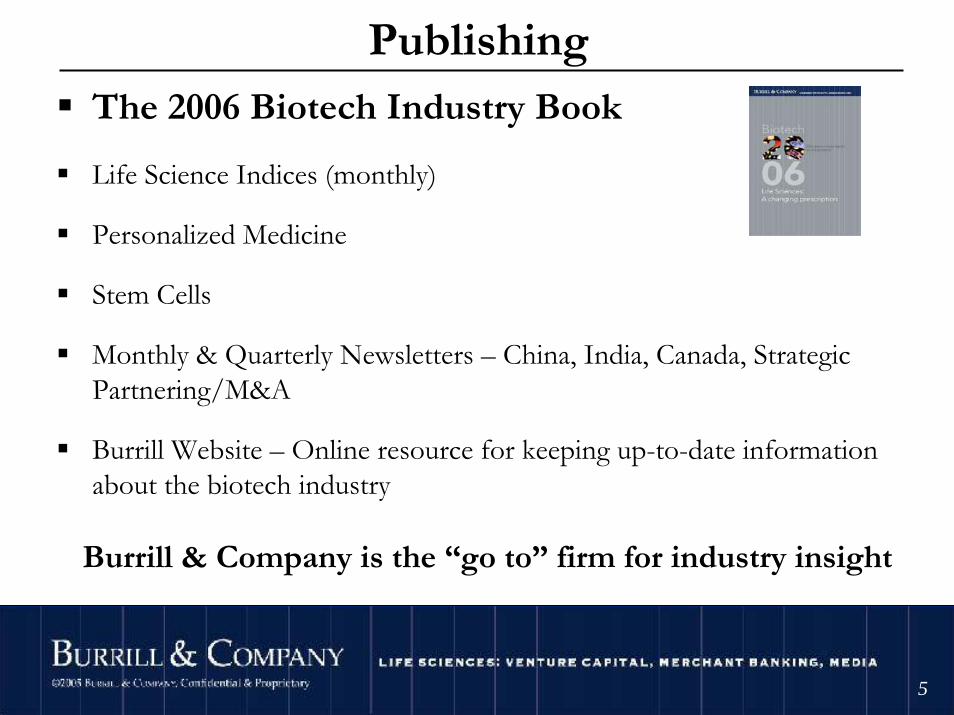
PublishingThe 2006 Biotech Industry Book
Life Science Indices (monthly)
Personalized Medicine
Stem Cells
Monthly & Quarterly Newsletters – China, India, Canada, Strategic Partnering/M&A
Burrill Website – Online resource for keeping up-to-date information about the biotech industry
Burrill & Company is the “go to” firm for industry insight
©2004 Burrill & Company. Confidential & Proprietary.
66
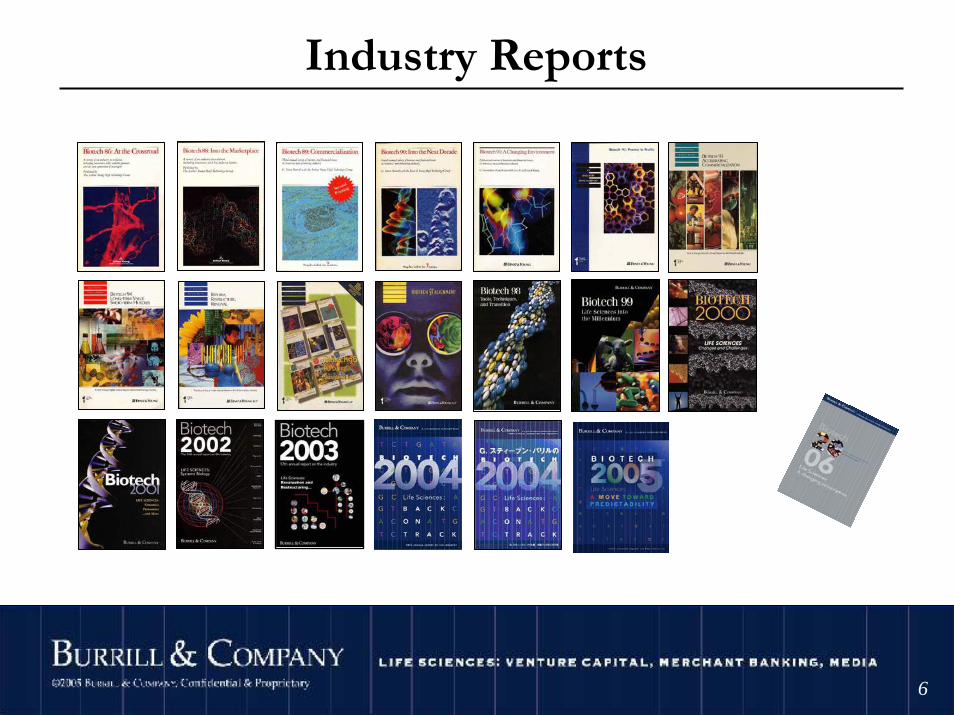
Industry ReportsThe seminal industry report for the last 20 years
To order most recent book visit www.burrillandco.com
©2004 Burrill & Company. Confidential & Proprietary.
77
This presentation is available
for download from our website
www.burrillandco.com
©2004 Burrill & Company. Confidential & Proprietary.
8
So what’s happened in these 20 years?(By the way…Biotech started over 10-15 years earlier…late ’60s/early ’70s…
so it’s a 35 year old industry now!)
©2004 Burrill & Company. Confidential & Proprietary.
99
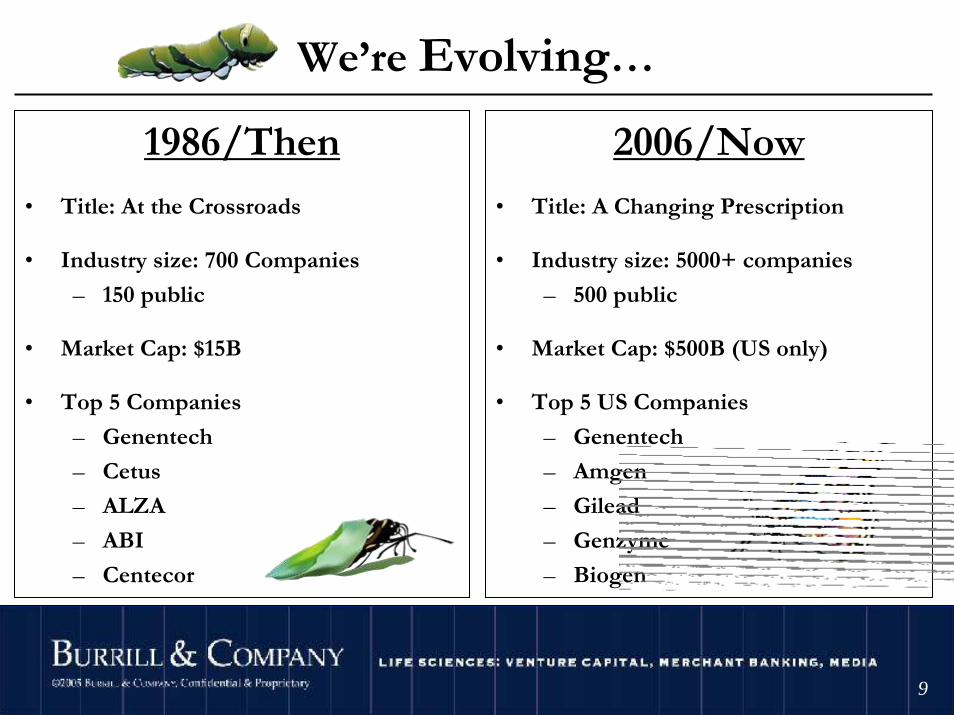
1986/Then
• Title: At the Crossroads
• Industry size: 700 Companies
– 150 public
• Market Cap: $15B
• Top 5 Companies
– Genentech
– Cetus
– ALZA
– ABI
– Centecor
We’re Evolving…
2006/Now
• Title: A Changing Prescription
• Industry size: 5000+ companies
– 500 public
• Market Cap: $500B (US only)
• Top 5 US Companies
– Genentech
– Amgen
– Gilead
– Genzyme
– Biogen

©2004 Burrill & Company. Confidential & Proprietary.
1010
Themes in ’86 book
…At The Crossroads• Science being converted to business• Products coming to market place• Are product liability, regulatory reform, patent court
behavior insurmountable barriers?• Partner or vertically integrate?• Acquisitions by pharma desirable?• How will the industry evolve?
©2004 Burrill & Company. Confidential & Proprietary.
1111
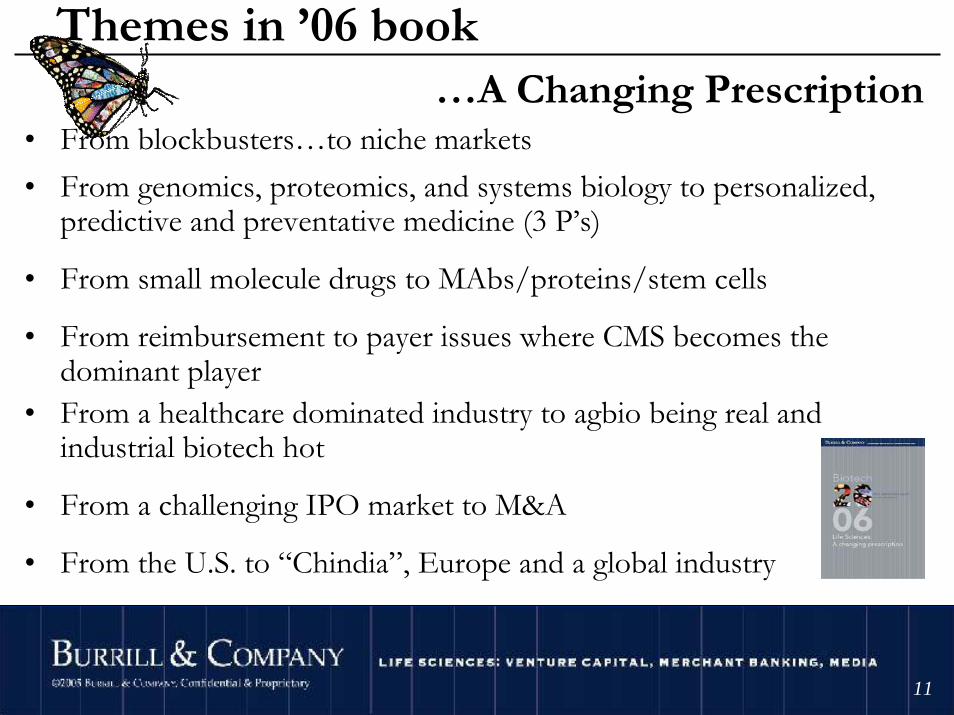
Themes in ’06 book…A Changing Prescription
• From blockbusters…to niche markets• From genomics, proteomics, and systems biology to personalized,
predictive and preventative medicine (3 P’s)
• From small molecule drugs to MAbs/proteins/stem cells
• From reimbursement to payer issues where CMS becomes the dominant player
• From a healthcare dominated industry to agbio being real and industrial biotech hot
• From a challenging IPO market to M&A
• From the U.S. to “Chindia”, Europe and a global industry
©2004 Burrill & Company. Confidential & Proprietary.
1212
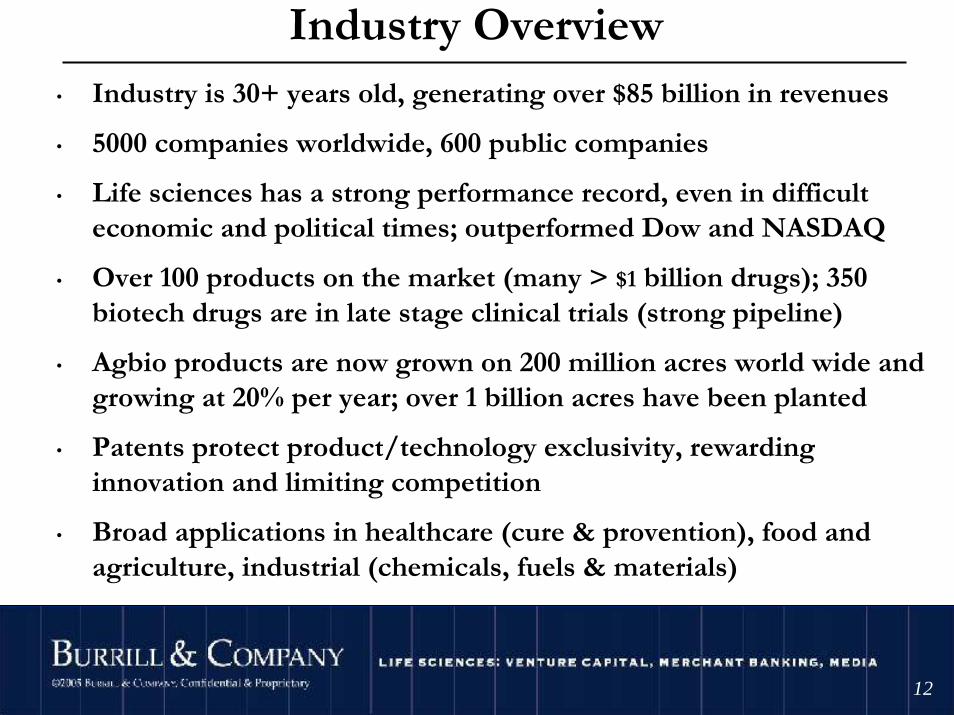
Industry Overview• Industry is 30+ years old, generating over $85 billion in revenues
• 5000 companies worldwide, 600 public companies
• Life sciences has a strong performance record, even in difficulteconomic and political times; outperformed Dow and NASDAQ
• Over 100 products on the market (many > $1 billion drugs); 350 biotech drugs are in late stage clinical trials (strong pipeline)
• Agbio products are now grown on 200 million acres world wide and growing at 20% per year; over 1 billion acres have been planted
• Patents protect product/technology exclusivity, rewarding innovation and limiting competition
• Broad applications in healthcare (cure & provention), food and agriculture, industrial (chemicals, fuels & materials)
©2004 Burrill & Company. Confidential & Proprietary.
1313
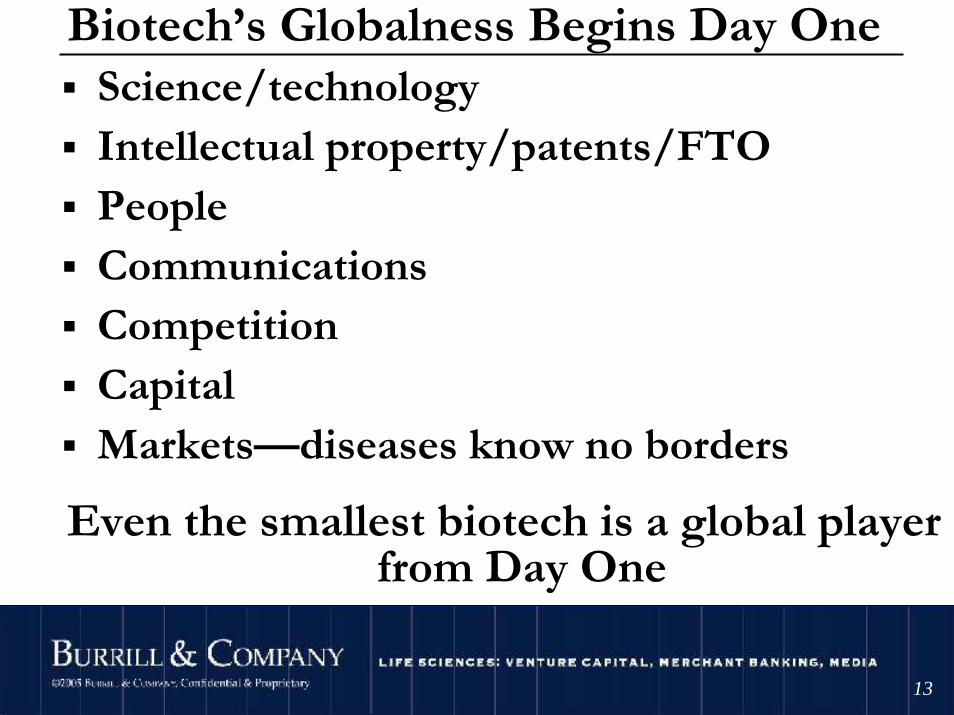
Biotech’s Globalness Begins Day OneScience/technologyIntellectual property/patents/FTOPeopleCommunicationsCompetitionCapitalMarkets—diseases know no borders
Even the smallest biotech is a global player from Day One
©2004 Burrill & Company. Confidential & Proprietary.
1414
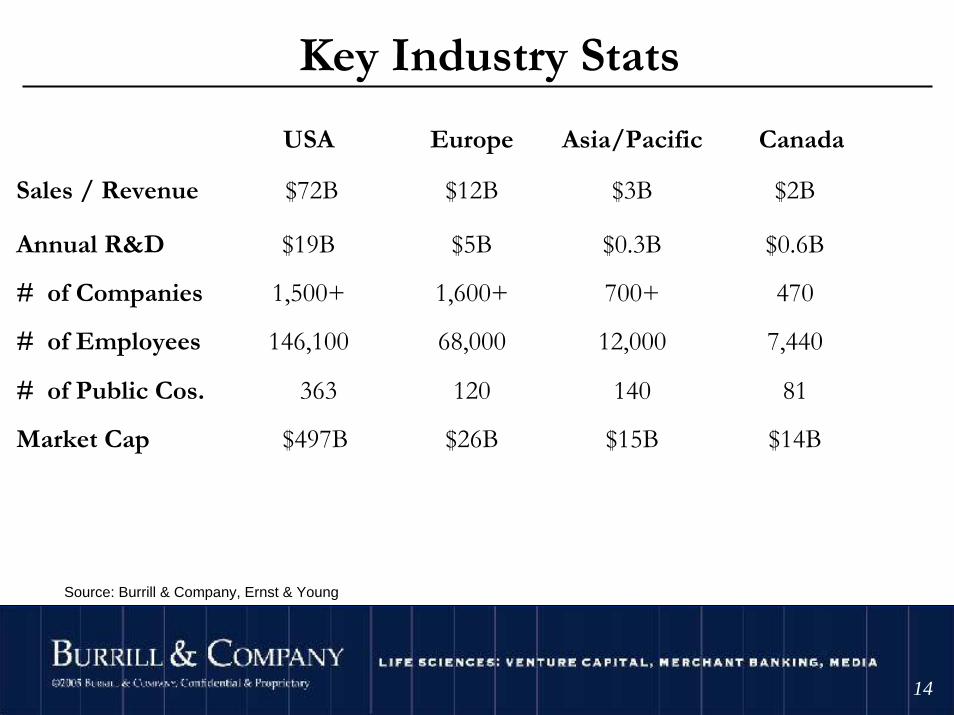
Key Industry Stats
$15B
140
12,000
700+
$0.3B
$3B
Asia/Pacific
$14B
81
7,440
470
$0.6B
$2B
Canada
$26B$497B Market Cap
120 363# of Public Cos.
68,000146,100# of Employees
1,600+1,500+# of Companies
$5B$19BAnnual R&D
$12B$72BSales / Revenue
EuropeUSA
Source: Burrill & Company, Ernst & Young
Total
$89B
$25B
4300+
233,600
700+
$552B
©2004 Burrill & Company. Confidential & Proprietary.
1515
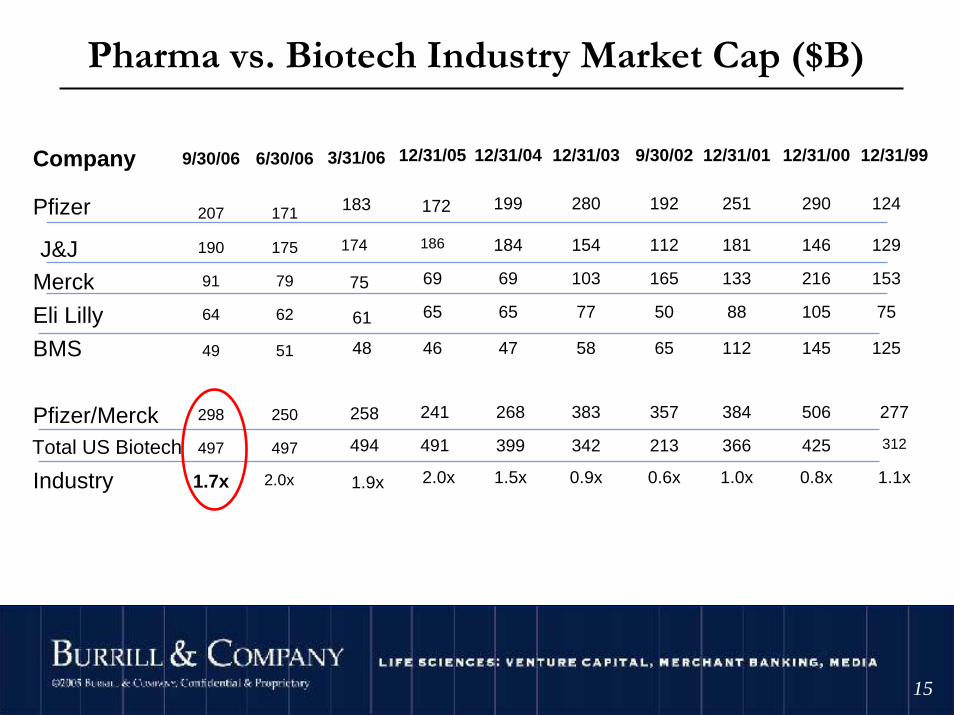
Pharma vs. Biotech Industry Market Cap ($B)
186
2.0x
491
241
46
65
69
172
12/31/05
1.5x
399
268
47
65
69
184
199
12/31/04
Merck
BMS
103
58
0.9x
342
383
77
154
280
12/31/03
165
65
0.6x
213
357
50
112
192
9/30/02Company
312
153
125
12/31/99
1.1x
277
75
129
124
Industry
Total US Biotech
Pfizer/Merck
Eli Lilly
J&J216
145
12/31/00
0.8x
425
506
105
146
290
133
112
12/31/01
1.0x
366
384
88
181
251Pfizer
3/31/06
183
174
75
61
48
258
494
1.9x
91
49
1.7x
497
298
64
190
207
9/30/06
2.0x
497
250
51
62
79
175
171
6/30/06
©2004 Burrill & Company. Confidential & Proprietary.
1616
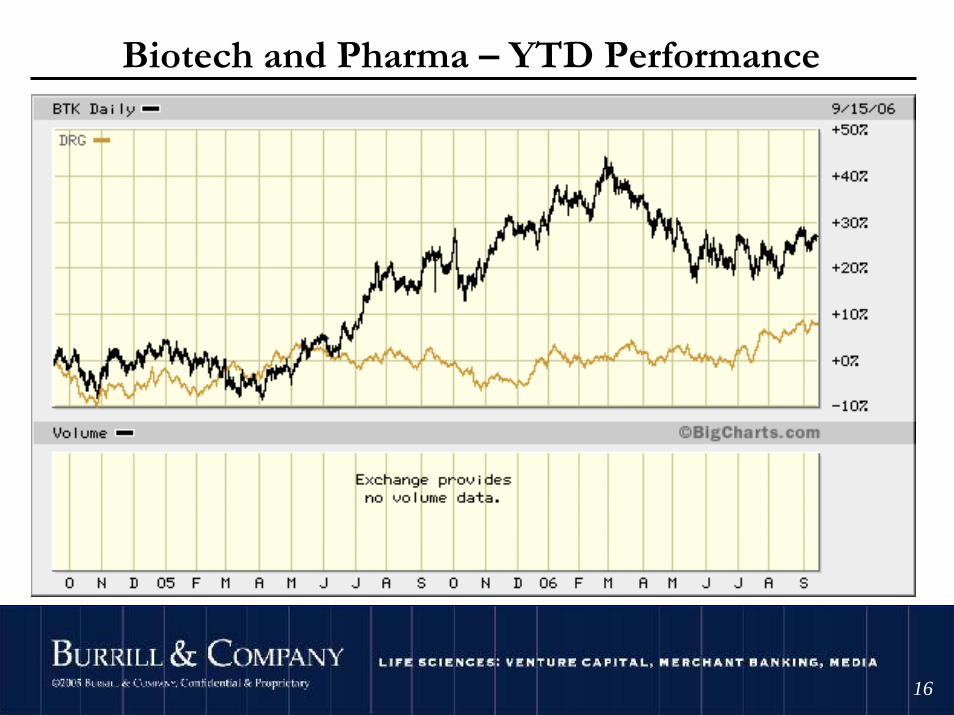
Biotech and Pharma – YTD Performance
©2004 Burrill & Company. Confidential & Proprietary.
1717
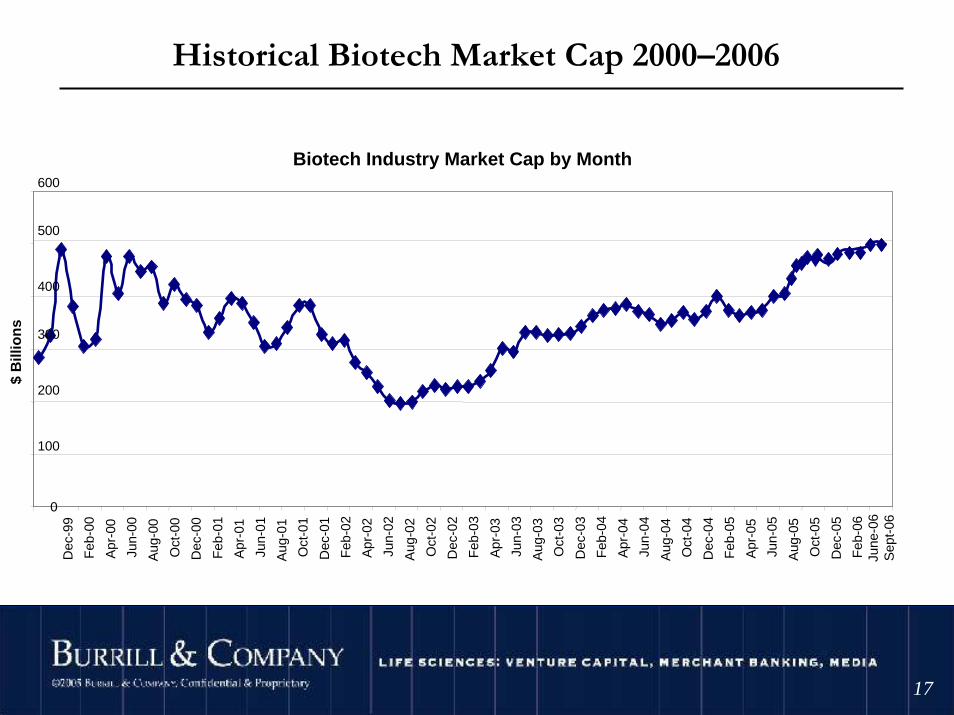
Historical Biotech Market Cap 2000–2006
Biotech Industry Market Cap by Month
0
100
200
300
400
500
600
Dec
-99
Feb
-00
Apr
-00
Jun-
00
Aug
-00
Oct
-00
Dec
-00
Feb
-01
Apr
-01
Jun-
01
Aug
-01
Oct
-01
Dec
-01
Feb
-02
Apr
-02
Jun-
02
Aug
-02
Oct
-02
Dec
-02
Feb
-03
Apr
-03
Jun-
03
Aug
-03
Oct
-03
Dec
-03
Feb
-04
Apr
-04
Jun-
04
Aug
-04
Oct
-04
Dec
-04
Feb
-05
Apr
-05
Jun-
05
Aug
-05
Oct
-05
Dec
-05
Feb
-06
$ B
illio
ns
June
-06
Sep
t-06
©2004 Burrill & Company. Confidential & Proprietary.
1818
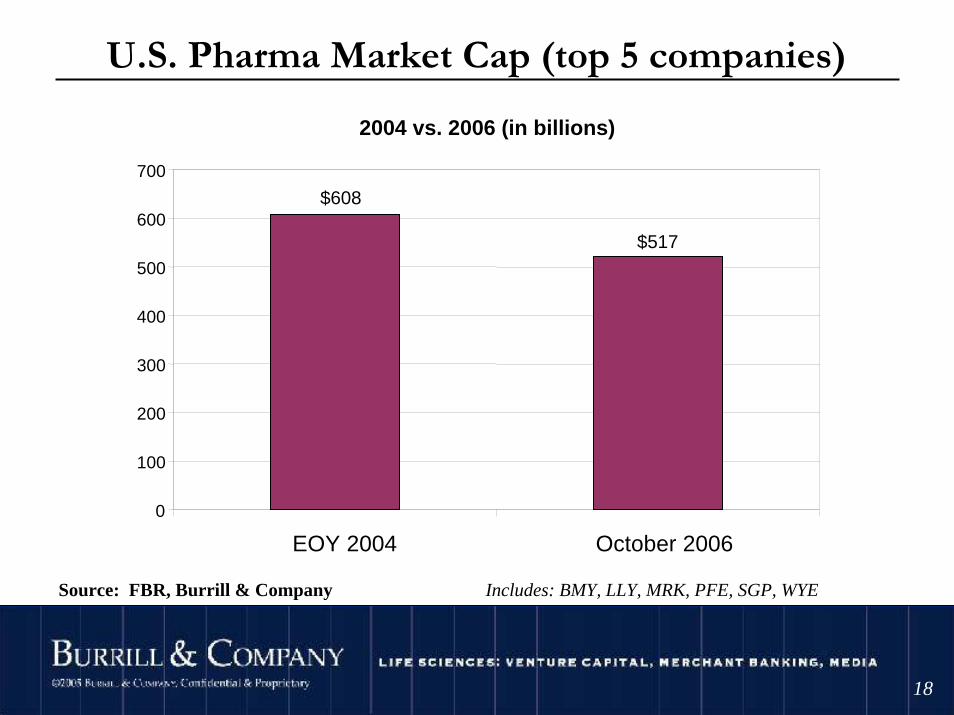
U.S. Pharma Market Cap (top 5 companies)
-25%
Source: FBR, Burrill & Company Includes: BMY, LLY, MRK, PFE, SGP, WYE
2004 vs. 2006 (in billions)
$608
$517
0
100
200
300
400
500
600
700
EOY 2004 October 2006
©2004 Burrill & Company. Confidential & Proprietary.
1919
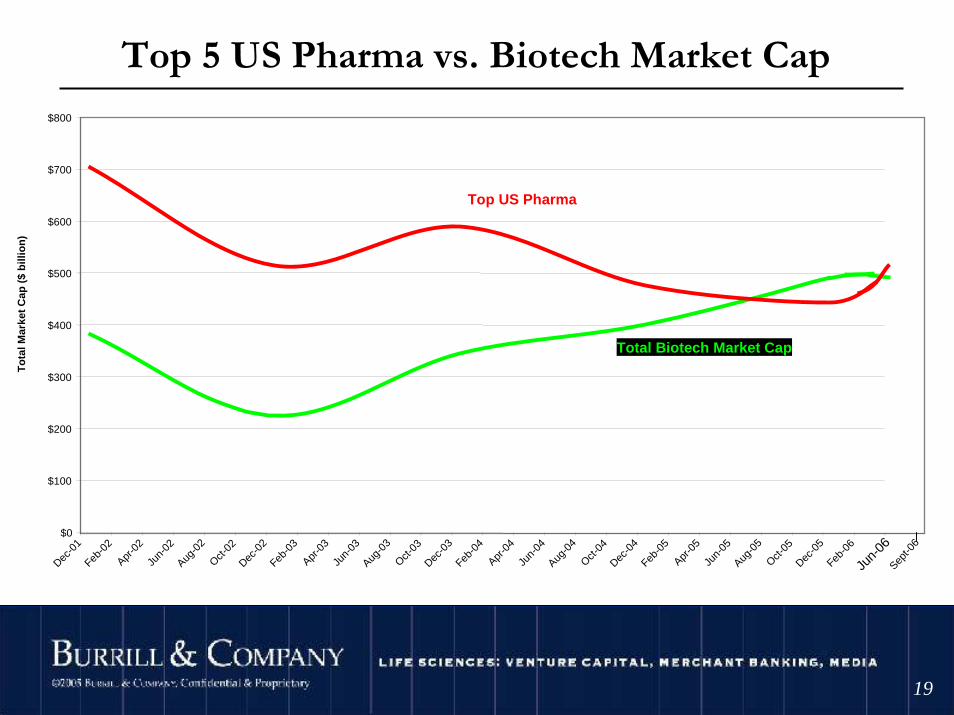
Top 5 US Pharma vs. Biotech Market Cap
$0
$100
$200
$300
$400
$500
$600
$700
$800
Dec-0
1Feb
-02
Apr-0
2Ju
n-02
Aug-0
2Oct-
02Dec
-02
Feb-0
3Apr
-03
Jun-
03Aug
-03
Oct-03
Dec-0
3Feb
-04
Apr-0
4Ju
n-04
Aug-0
4Oct-
04Dec
-04
Feb-0
5Apr
-05
Jun-
05Aug
-05
Oct-05
Dec-0
5Feb
-06
To
tal M
arke
t C
ap (
$ b
illio
n)
Top US Pharma
Total Biotech Market Cap
Sept-0
6
Jun-
06
©2004 Burrill & Company. Confidential & Proprietary.
2020
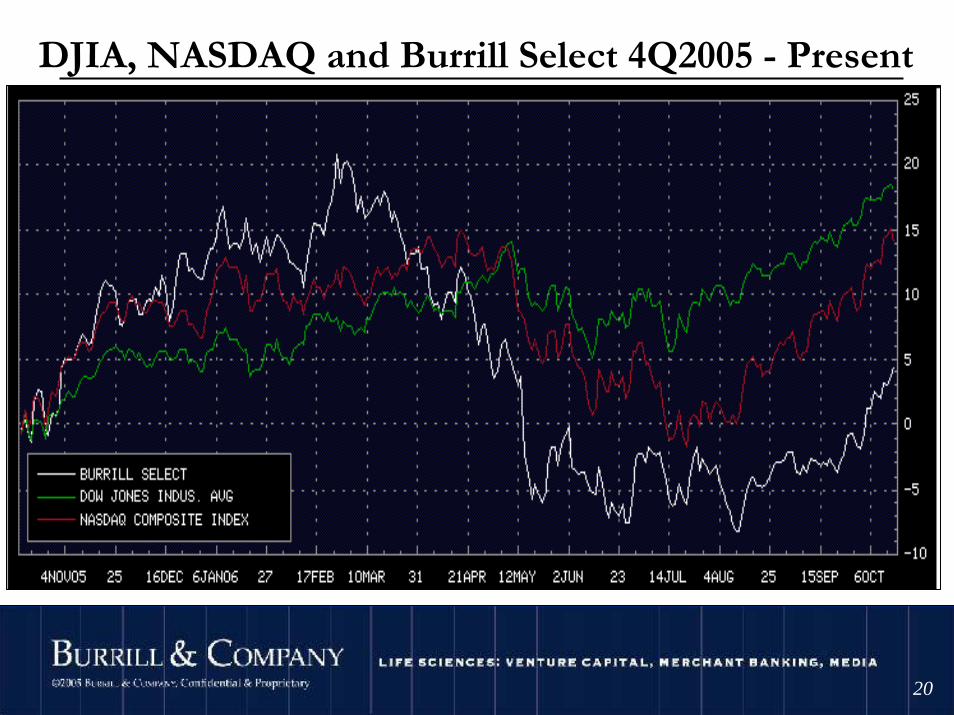
DJIA, NASDAQ and Burrill Select 4Q2005 - Present
©2004 Burrill & Company. Confidential & Proprietary.
21
…so that’s the baseline
Now, what’s really happening…
©2004 Burrill & Company. Confidential & Proprietary.
2222
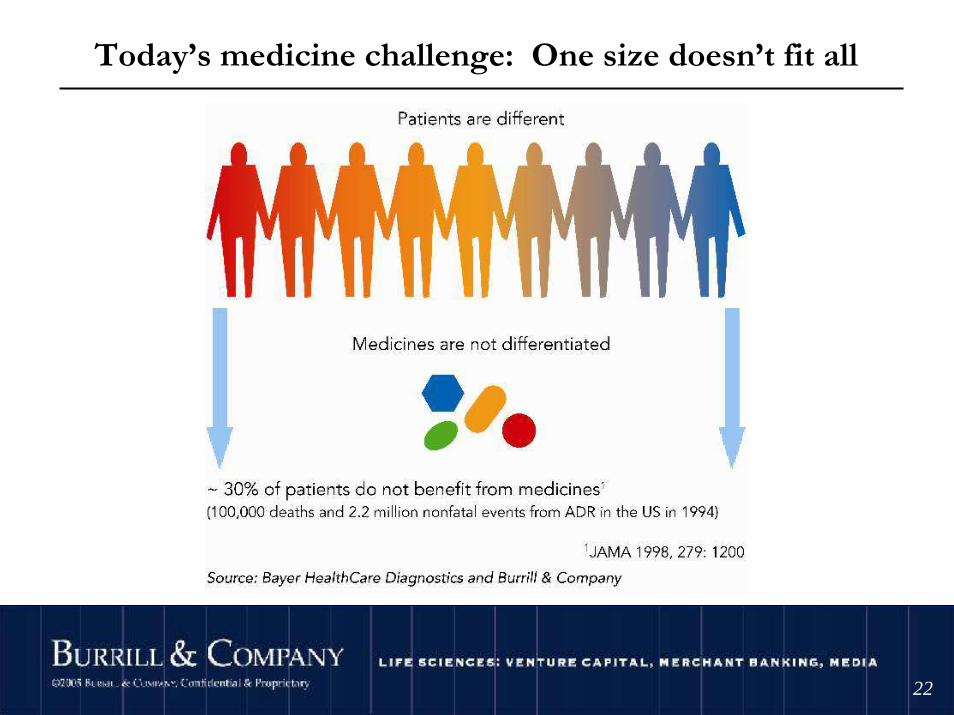
Today’s medicine challenge: One size doesn’t fit all
©2004 Burrill & Company. Confidential & Proprietary.
2323
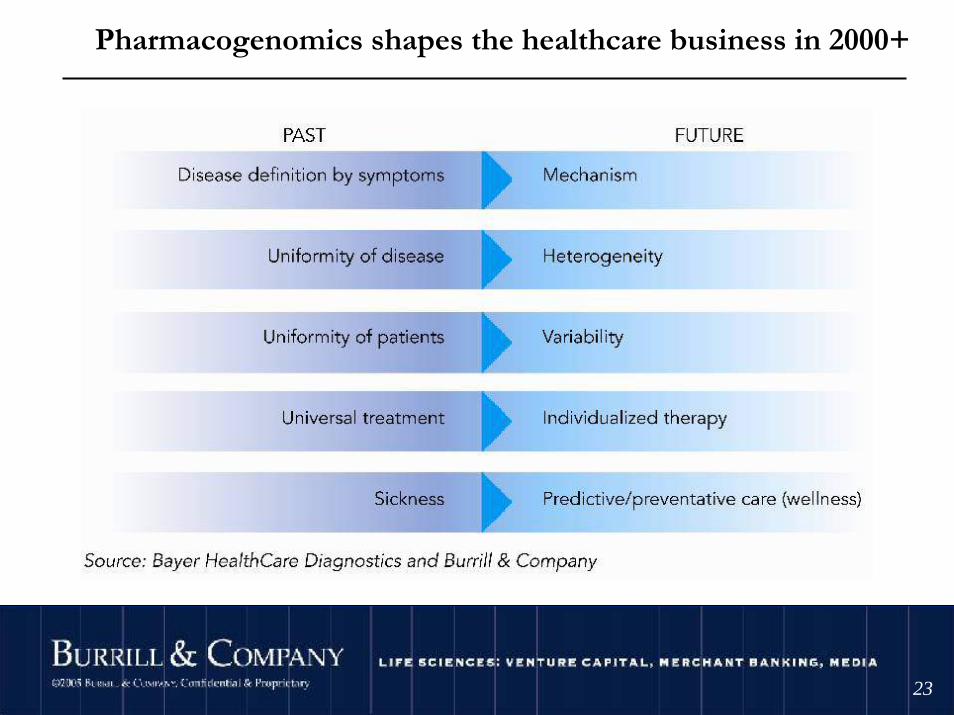
Pharmacogenomics shapes the healthcare business in 2000+

©2004 Burrill & Company. Confidential & Proprietary.
2424
140 Years of Drug Discovery Technology
©2004 Burrill & Company. Confidential & Proprietary.
2525
EVO Devo
Improving PowerSupply/
constant monitoring
Telemetry/Communications/
Telemedicine
Imaging/Visualization Nanotechnology
EHR
IT/digital information
Genomics/Proteomics/Biomarkers
Systems biology(tools, techniques from sequencing to systems)
Redefining Healthcare (Rx/Dx/Device combinations)
(Products/Services/patient care/outcomes)
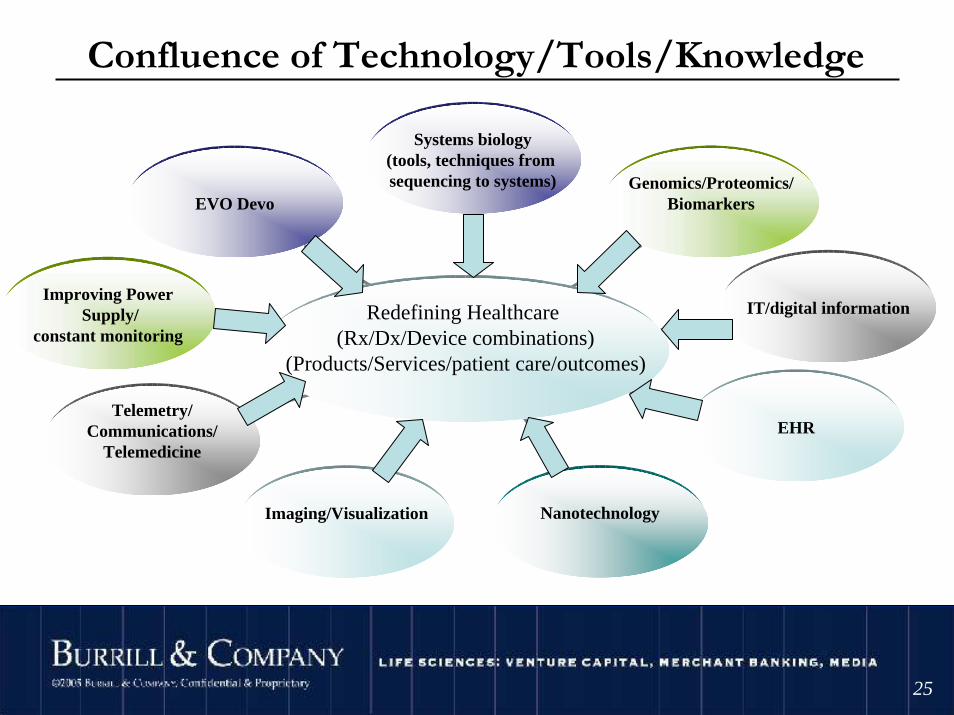
Confluence of Technology/Tools/Knowledge

©2004 Burrill & Company. Confidential & Proprietary.
2626
Innovation Gap Getting Wider
©2004 Burrill & Company. Confidential & Proprietary.
2727
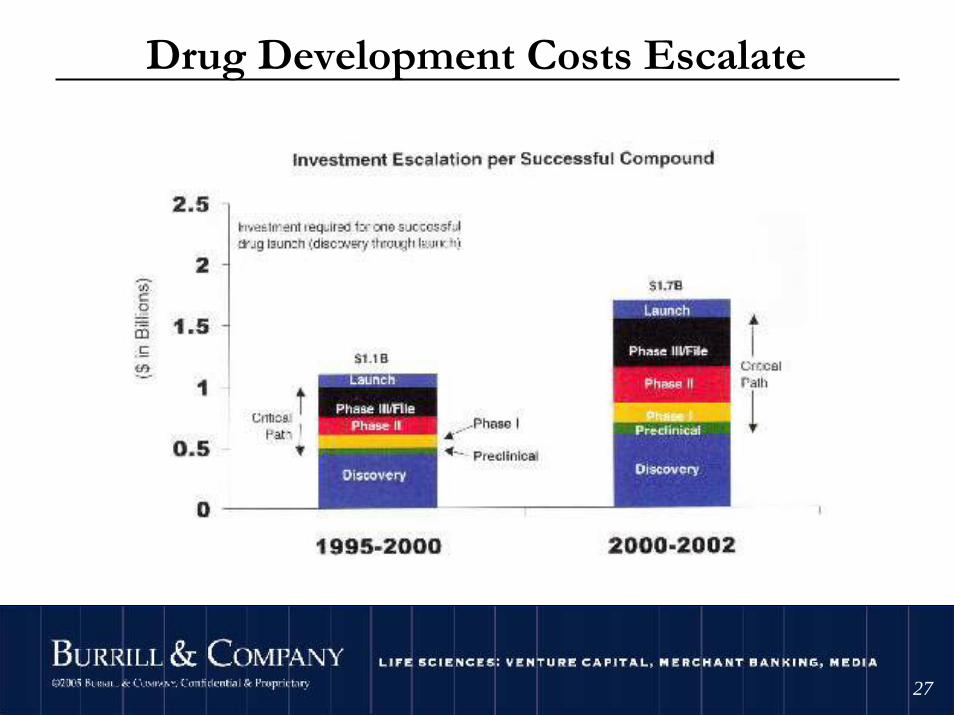
Drug Development Costs Escalate
Source: Windhover’s In Vivo. The Business & Medicine Report. Bain drug economics model, 2003
Costs are becoming prohibitive
©2004 Burrill & Company. Confidential & Proprietary.
2828
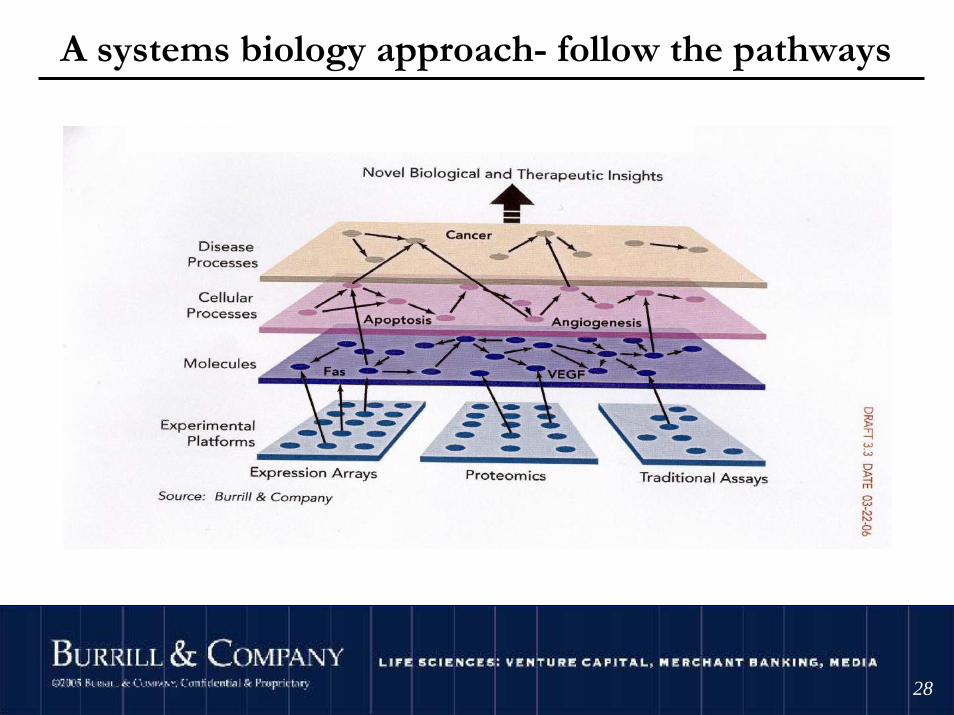
A systems biology approach- follow the pathways
©2004 Burrill & Company. Confidential & Proprietary.
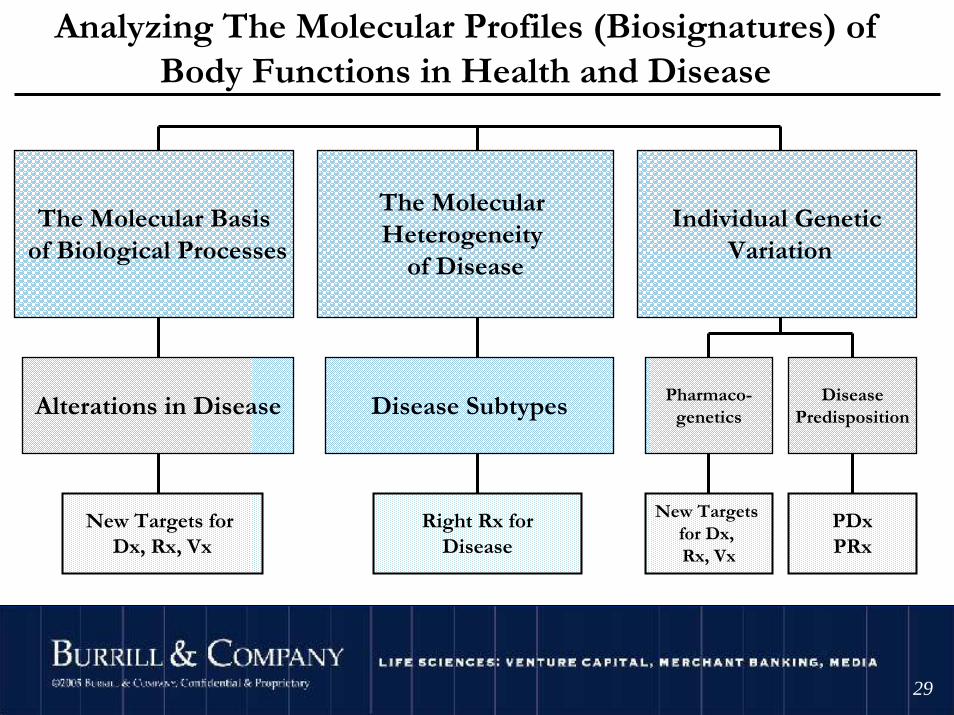
2929
The Molecular Basisof Biological Processes
The Molecular Heterogeneity
of Disease
Individual GeneticVariation
Alterations in Disease Disease Subtypes Pharmaco-genetics
New Targets for Dx, Rx, Vx
Right Rx forDisease
New Targets for Dx, Rx, Vx
DiseasePredisposition
PDxPRx
Analyzing The Molecular Profiles (Biosignatures) of Body Functions in Health and Disease
©2004 Burrill & Company. Confidential & Proprietary.
3030
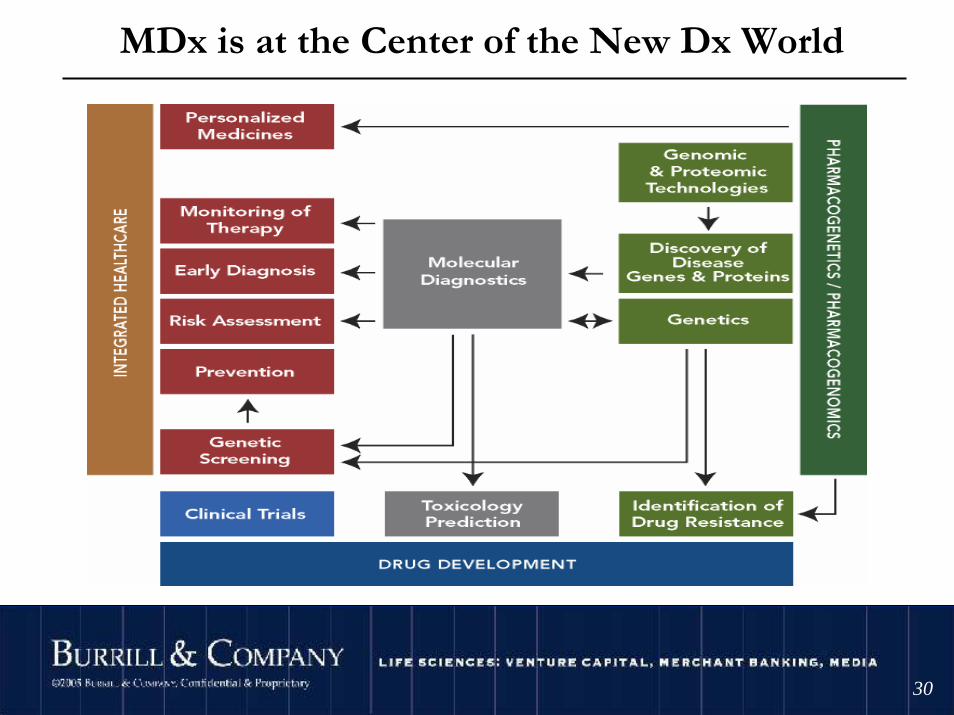
MDx is at the Center of the New Dx World

©2004 Burrill & Company. Confidential & Proprietary.
3131
Selected Targeted TreatmentsPersonalized cancer vaccines
Favrille – FavId for non-Hodgkin's lymphoma
Genitope – MyVax for non-Hodgkin's lymphoma
Gleevec (Novartis) - pH+ CML kinase inhibitor
Iressa (AstraZeneca) – EGFR tyrosine kinase inhibitor
Tarceva (Genentech/OSI) – HER1/EGFR inhibitor
Erbitux (ImClone/BMS) – HER1/EGFR inhibitor
Avastin (Genentech) – VEGF/VEGFR inhibitor
Herceptin (Genentech) – HER2 inhibitor
BilDil (NitroMed) - heart failure in African American patients
Other “Semi Targeted” Treatments (approved or late stage trials)
Nexavar (Bayer/Onyx) – multikinase inhibitor
Tykerb (GSK) - ErbB-2/EGFR inhibitor
Enzastaurin (Lilly) - PKC-Beta, AKT/P13 inhibitor

©2004 Burrill & Company. Confidential & Proprietary.
3232
Obesity Related Diseases• Diabetes – Costs $98 billion
– 90% of Type II diabetics are obese– 70% of those at risk are obese
• Heart Disease – Costs $8.8 billion
• Stroke
• Hypertension - $4.1 billion– Doubles incidence of hypertension
• Gall bladder disease – $3.4 Billion
• Osteoarthritis - $21 billion
• Sleep apnea – more prevalent then diabetes !
• Some forms of cancer

©2004 Burrill & Company. Confidential & Proprietary.
3333
Aging . . . Is it a disease?
About 1.4 million Americans are in their 90s, and another 64,000 are 100 years old or older
Baby boomers represent 30% of the total US population
Per person, seniors consume about five times the drugs of their working-age counterparts
By 2030, 20% of US population will be over 65 years of age
©2004 Burrill & Company. Confidential & Proprietary.
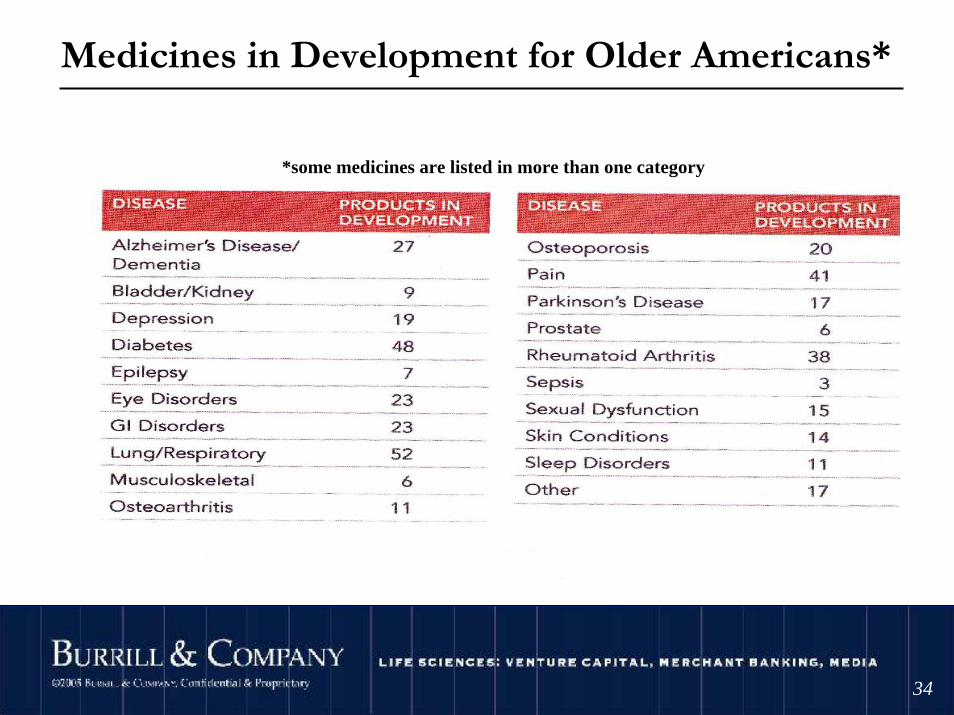
3434
Medicines in Development for Older Americans*
*some medicines are listed in more than one category
©2004 Burrill & Company. Confidential & Proprietary.
3535
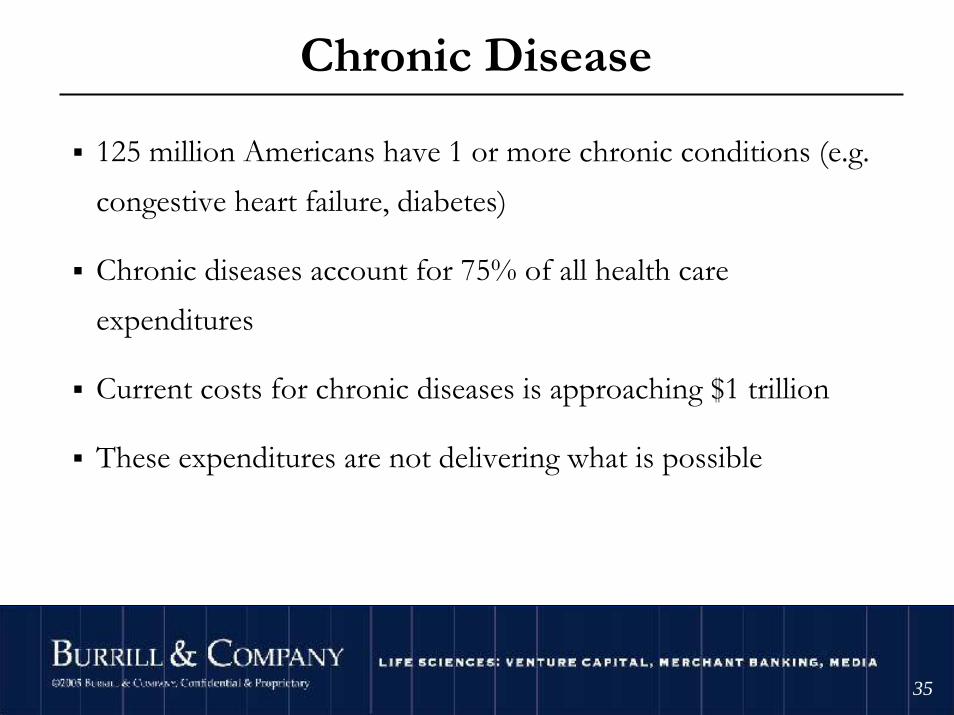
Chronic Disease
125 million Americans have 1 or more chronic conditions (e.g. congestive heart failure, diabetes)
Chronic diseases account for 75% of all health care expenditures
Current costs for chronic diseases is approaching $1 trillion
These expenditures are not delivering what is possible
©2004 Burrill & Company. Confidential & Proprietary.
3636
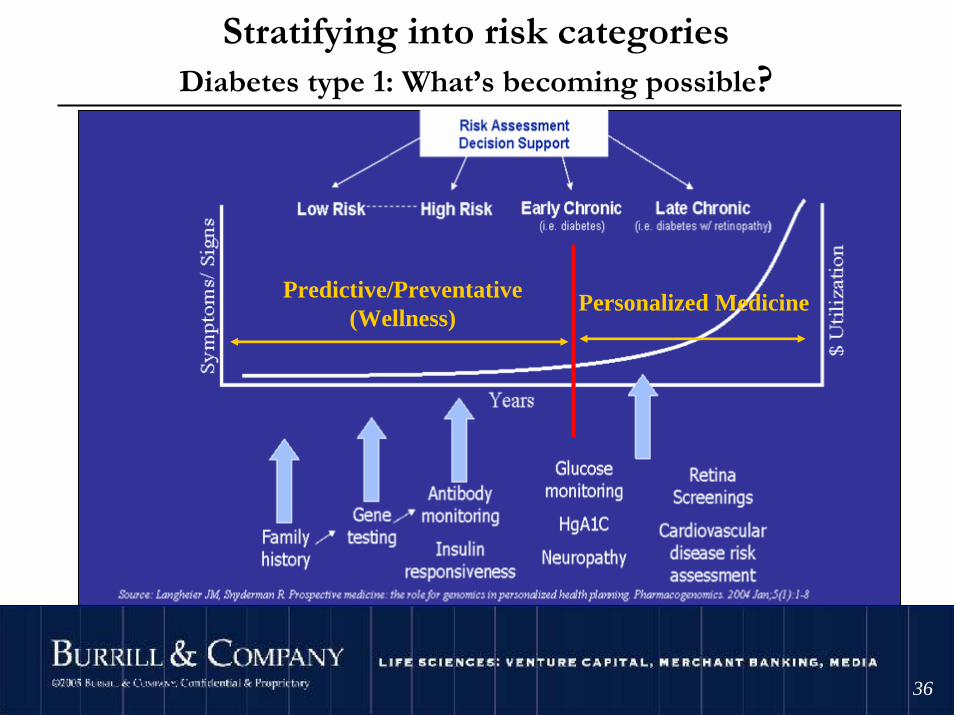
Stratifying into risk categoriesDiabetes type 1: What’s becoming possible?
Predictive/Preventative(Wellness)
Personalized Medicine

©2004 Burrill & Company. Confidential & Proprietary.
3737
What is Driving Personalized Medicine?
Convergence in technology…scientific advances and new technology
Patient care and rising consumerism
Payors (of all types) have economic incentiveGovernment health policy an global spending (e.g.: CMS)
©2004 Burrill & Company. Confidential & Proprietary.
3838
This Confluence of Healthcare Technology is bringing us…
• Targeted therapies (mutation specific), personalized medicine
• Drug/device combinations (drug eluding stents)
• Molecular diagnostics/Algorithm based diagnostics
• Non-invasiveness
• Non-hospital based with constant monitoring…• Increased predictions and prevention
©2004 Burrill & Company. Confidential & Proprietary.
3939
…that’s changing the healthcare economy
• Better outcomes/patients living longer
• Costs going up/more patients treatable…
• …But, US system leaves 25-45m uninsured/underinsured
• Consumer healthcare is here to stay (copays ), individuals empowered and informed
©2004 Burrill & Company. Confidential & Proprietary.
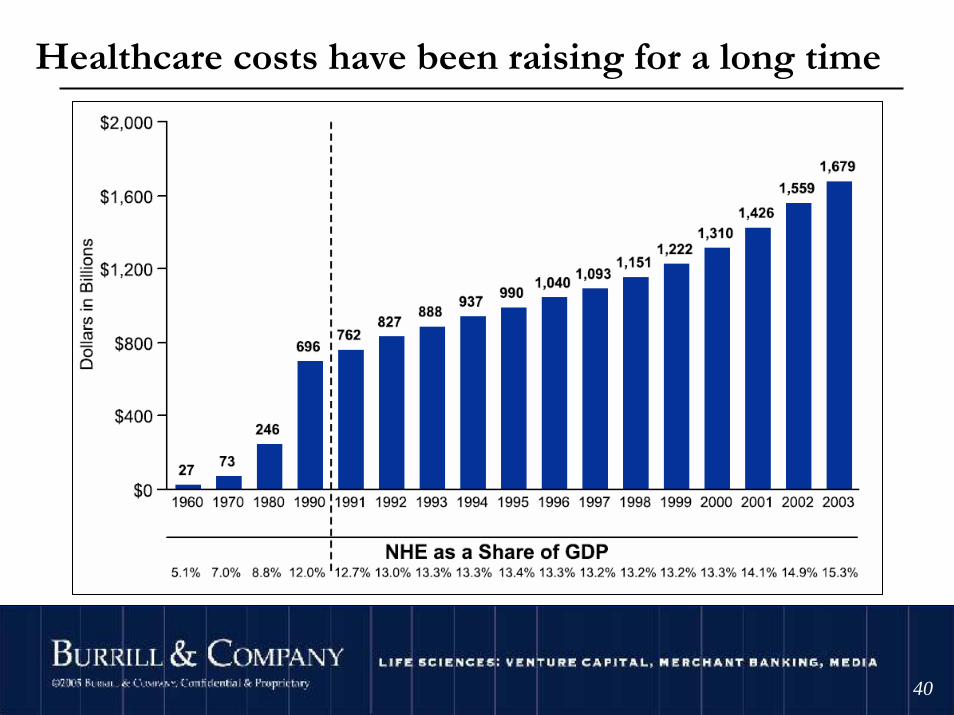
4040
Healthcare costs have been raising for a long time
©2004 Burrill & Company. Confidential & Proprietary.
4141
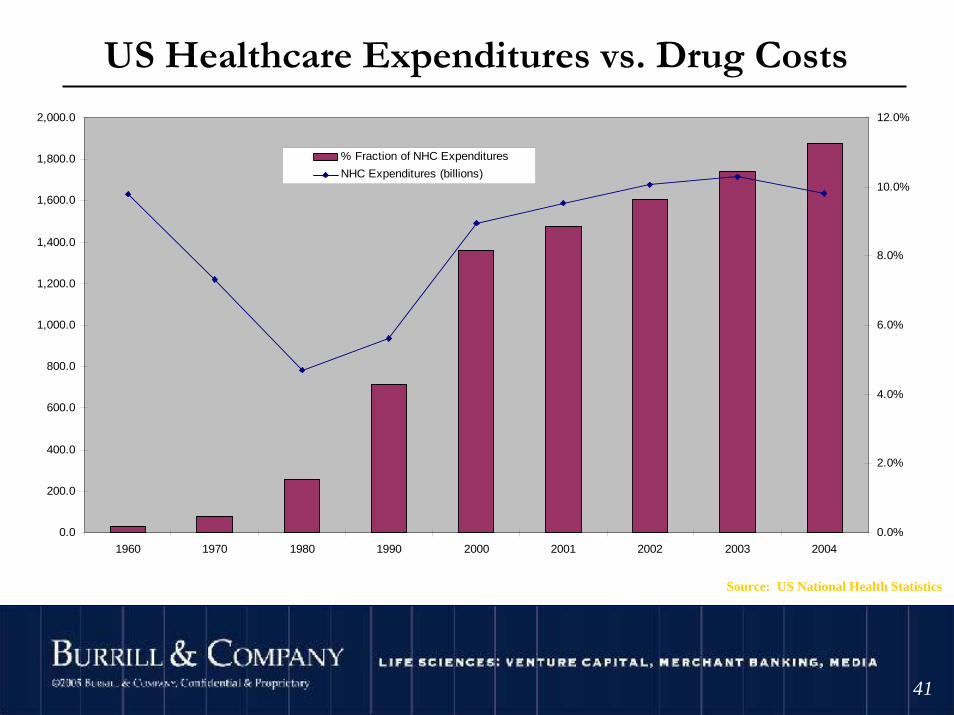
US Healthcare Expenditures vs. Drug Costs
0.0
200.0
400.0
600.0
800.0
1,000.0
1,200.0
1,400.0
1,600.0
1,800.0
2,000.0
1960 1970 1980 1990 2000 2001 2002 2003 2004
0.0%
2.0%
4.0%
6.0%
8.0%
10.0%
12.0%
% Fraction of NHC Expenditures
NHC Expenditures (billions)
Source: US National Health Statistics
©2004 Burrill & Company. Confidential & Proprietary.
4242
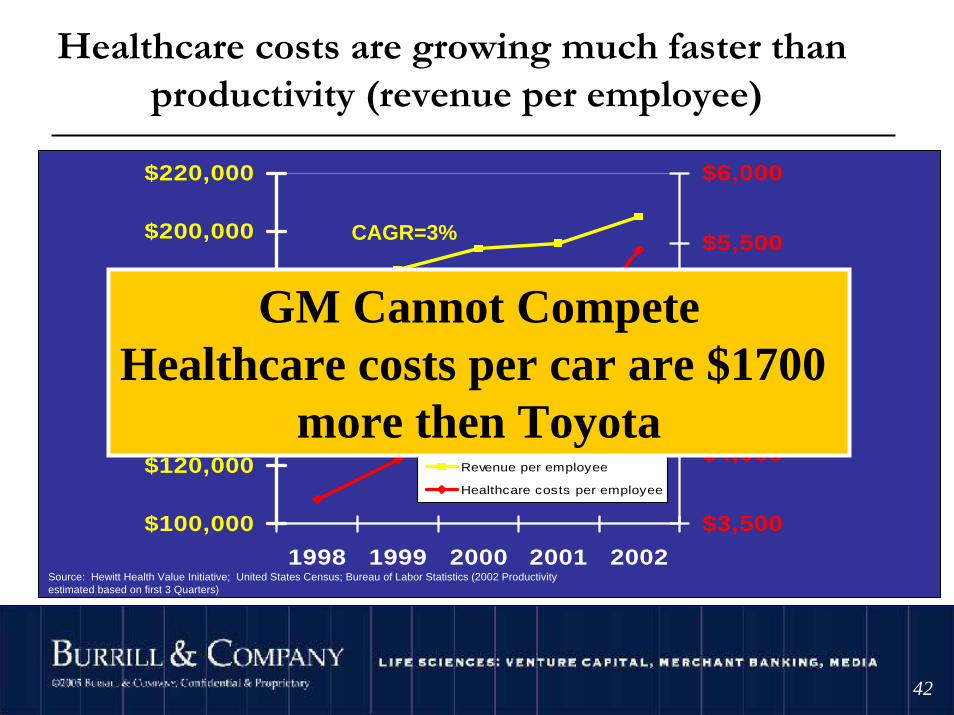
Healthcare costs are growing much faster than productivity (revenue per employee)
$100,000
$120,000
$140,000
$160,000
$180,000
$200,000
$220,000
1998 1999 2000 2001 2002
$3,500
$4,000
$4,500
$5,000
$5,500
$6,000
Revenue per employee
Healthcare costs per employee
Source: Hewitt Health Value Initiative; United States Census; Bureau of Labor Statistics (2002 Productivity estimated based on first 3 Quarters)
CAGR=3%
CAGR=10%
GM Cannot CompeteHealthcare costs per car are $1700
more then Toyota
©2004 Burrill & Company. Confidential & Proprietary.
4343
…So, healthcare cost increases are on everyone’s agenda-
• Politicians/Congress/White House
• Payors/Reimbursors/Insurers
• Physicians/Providers
• Patients/Consumers
…and patients are empowered, have economic costs, and really want to stay well!
©2004 Burrill & Company. Confidential & Proprietary.
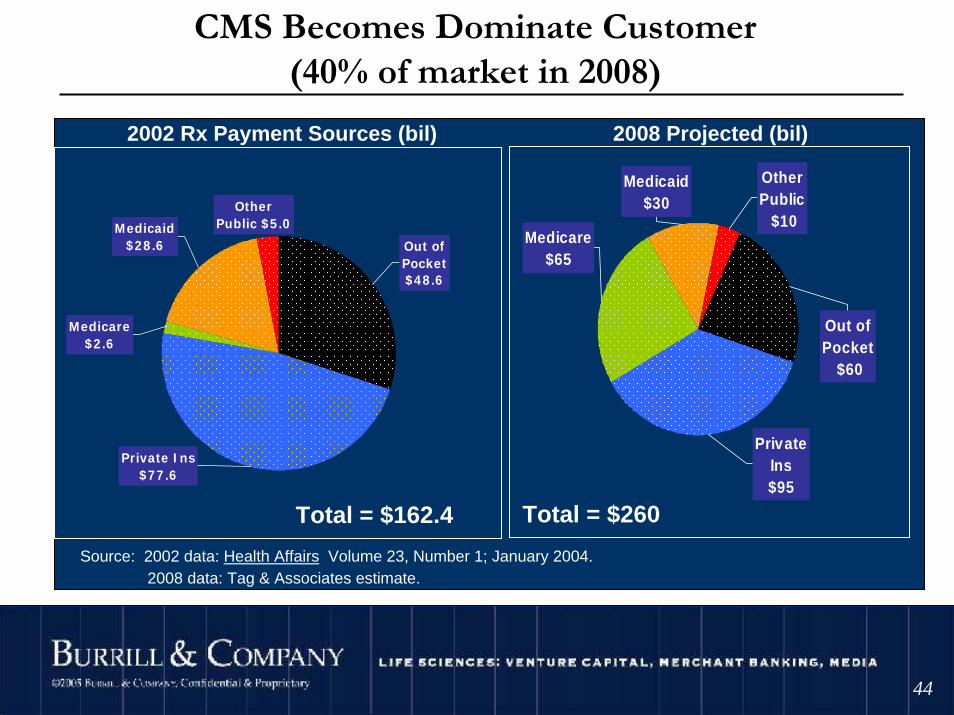
4444
Medicaid$30
Out of Pocket
$60
Other Public $10
Medicare $65
Private Ins $95
2002 Rx Payment Sources (bil) 2008 Projected (bil)
Medicare $2.6
Out of Pocket $48.6
Medicaid $28.6
Private Ins $77.6
Other Public $5.0
Source: 2002 data: Health Affairs Volume 23, Number 1; January 2004. 2008 data: Tag & Associates estimate.
Total = $162.4 Total = $260
CMS Becomes Dominate Customer(40% of market in 2008)
©2004 Burrill & Company. Confidential & Proprietary.
4545
. . . and what’s happeningto big pharma?
Putting Biotech into Context
©2004 Burrill & Company. Confidential & Proprietary.
4646
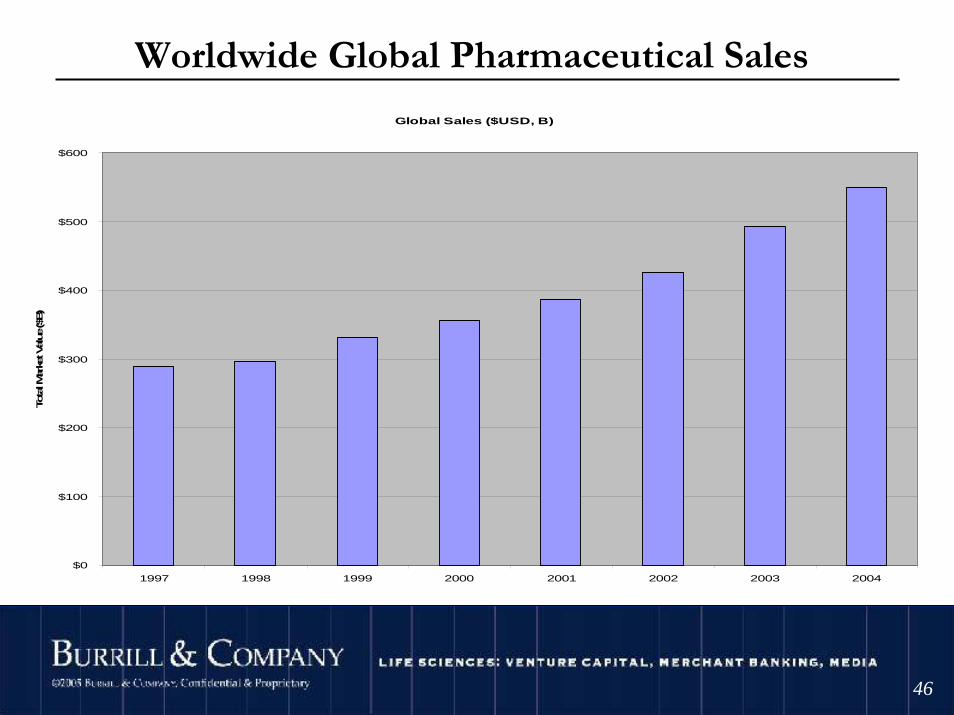
Worldwide Global Pharmaceutical Sales
Global Sales ($USD, B)
$0
$100
$200
$300
$400
$500
$600
1997 1998 1999 2000 2001 2002 2003 2004
Tota
l Mar
ket Value ($
B)
©2004 Burrill & Company. Confidential & Proprietary.
4747
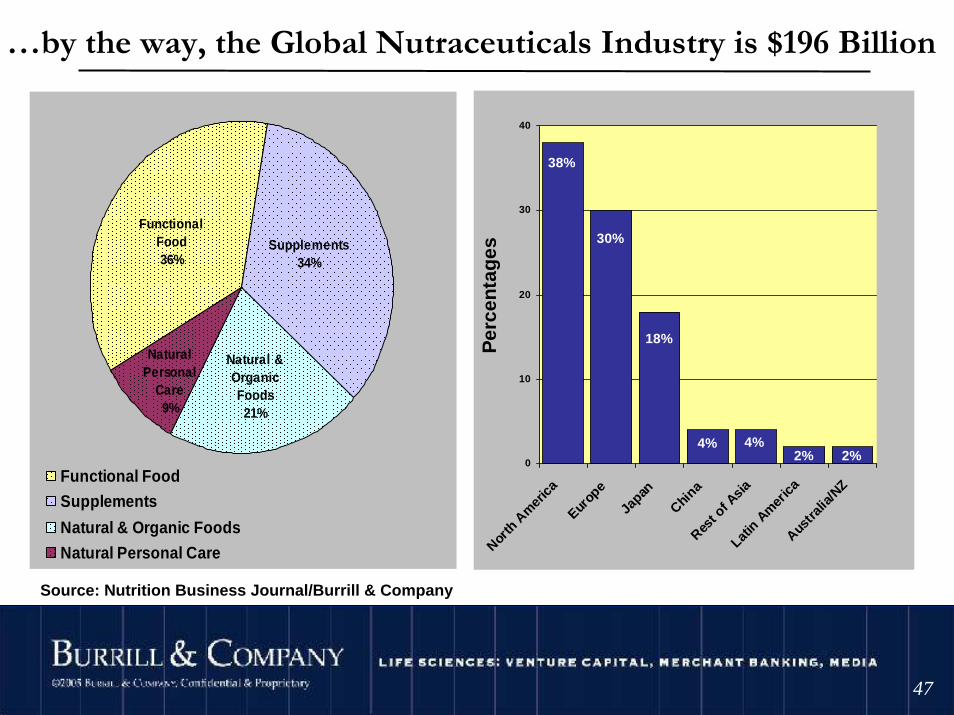
…by the way, the Global Nutraceuticals Industry is $196 Billion
Functional Food36%
Supplements34%
Natural & Organic Foods21%
Natural Personal
Care9%
Functional Food
Supplements
Natural & Organic Foods
Natural Personal Care
2%2%4%4%
18%
30%
38%
0
10
20
30
40
North
Am
erica
Europ
e
Japan
China
Rest o
f Asia
Latin
Am
erica
Austra
lia/N
Z
Per
cen
tag
es
Source: Nutrition Business Journal/Burrill & Company
©2004 Burrill & Company. Confidential & Proprietary.
4848
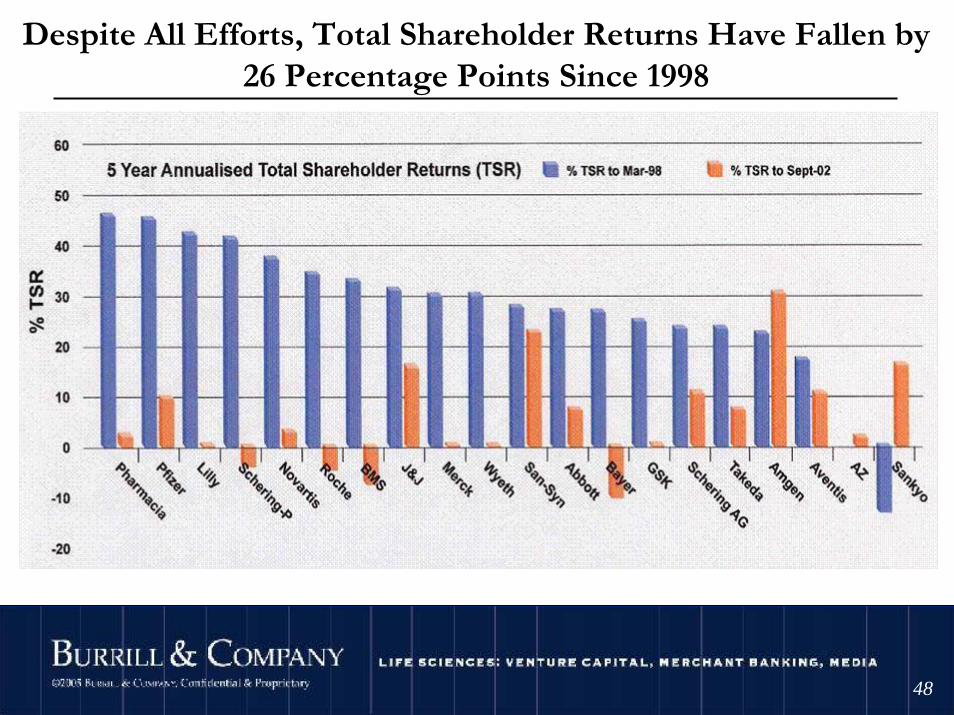
Despite All Efforts, Total Shareholder Returns Have Fallen by26 Percentage Points Since 1998
Source: IBM Life Sciences Solutions
©2004 Burrill & Company. Confidential & Proprietary.
4949
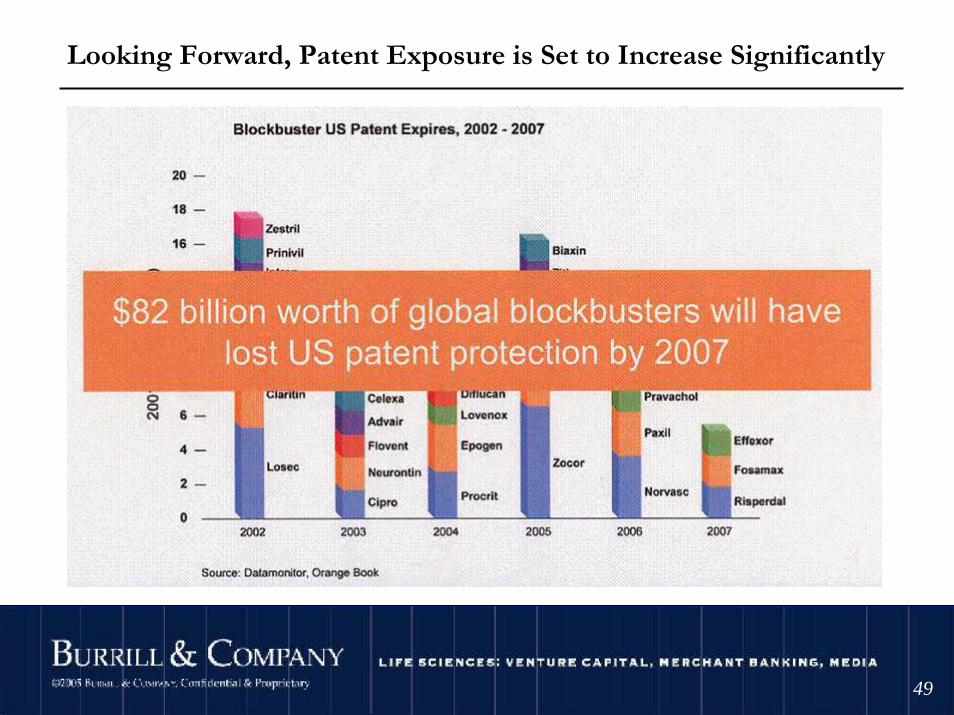
Looking Forward, Patent Exposure is Set to Increase Significantly

©2004 Burrill & Company. Confidential & Proprietary.
5050
Biogeneric Status of Biotech Drugs
©2004 Burrill & Company. Confidential & Proprietary.
5151
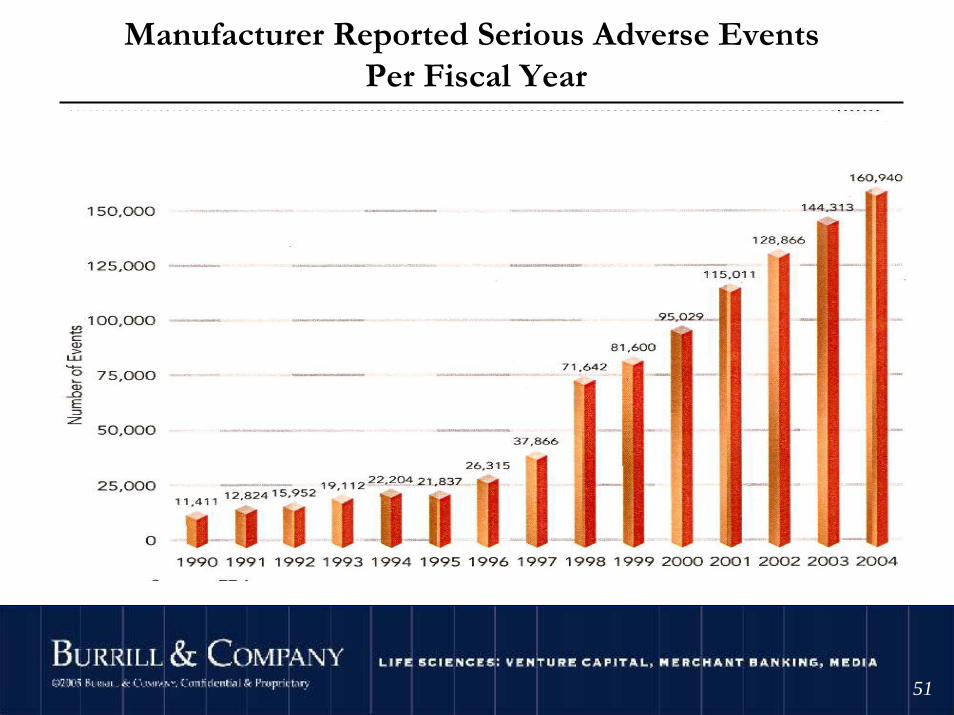
Manufacturer Reported Serious Adverse Events Per Fiscal Year
©2004 Burrill & Company. Confidential & Proprietary.
5252
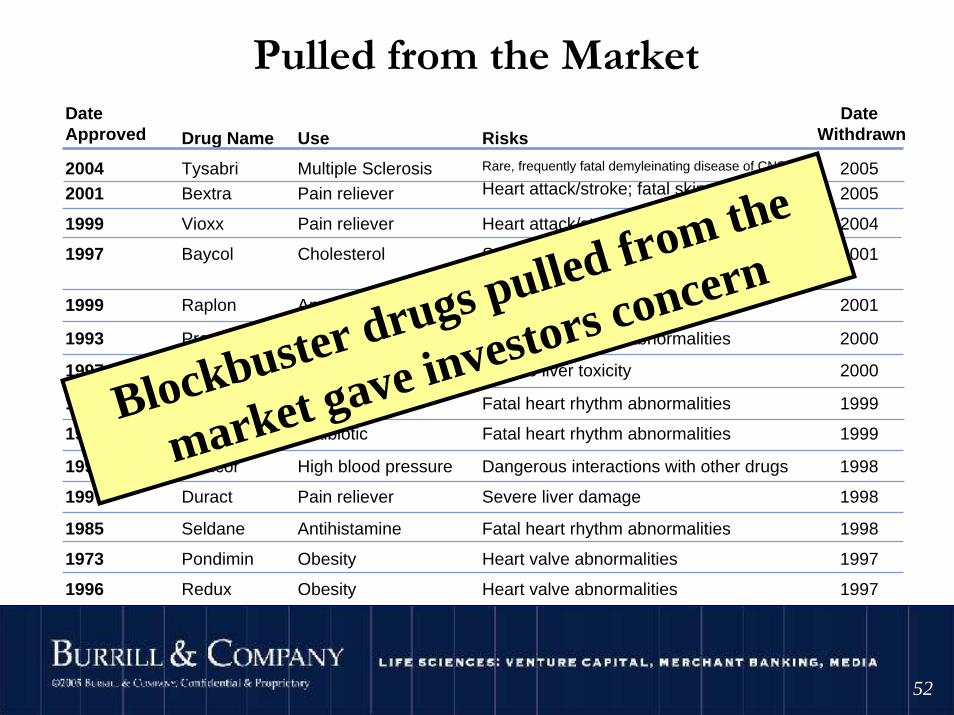
Pulled from the MarketDateApproved Drug Name Use Risks
DateWithdrawn
20042001
TysabriBextra
Multiple SclerosisPain reliever
Rare, frequently fatal demyleinating disease of CNS
Heart attack/stroke; fatal skin reactions
Heart attack/stroke
Severe damage to muscle, that is sometimes fatal
An inability to breathe normally
Fatal heart rhythm abnormalities
1997 Rezulin Type 2 diabetes Severe liver toxicity 2000
1997 Posicor High blood pressure Dangerous interactions with other drugs 1998
1973 Pondimin Obesity Heart valve abnormalities 1997
1997 Duract Pain reliever Severe liver damage 1998
1985 Seldane Antihistamine Fatal heart rhythm abnormalities 1998
1988 Hismanal Antihistamine Fatal heart rhythm abnormalities 1999
1997 Raxar Antibiotic Fatal heart rhythm abnormalities 1999
Heart valve abnormalities
1999 Vioxx Pain reliever
20052005
2004
2001
2001
2000
1997 Baycol Cholesterol
1999 Raplon Anesthesia
1993 Propulsid Heartburn
19971996 Redux Obesity
Blockbuster drugs pulled from the
market gave investors concern
©2004 Burrill & Company. Confidential & Proprietary.
5353
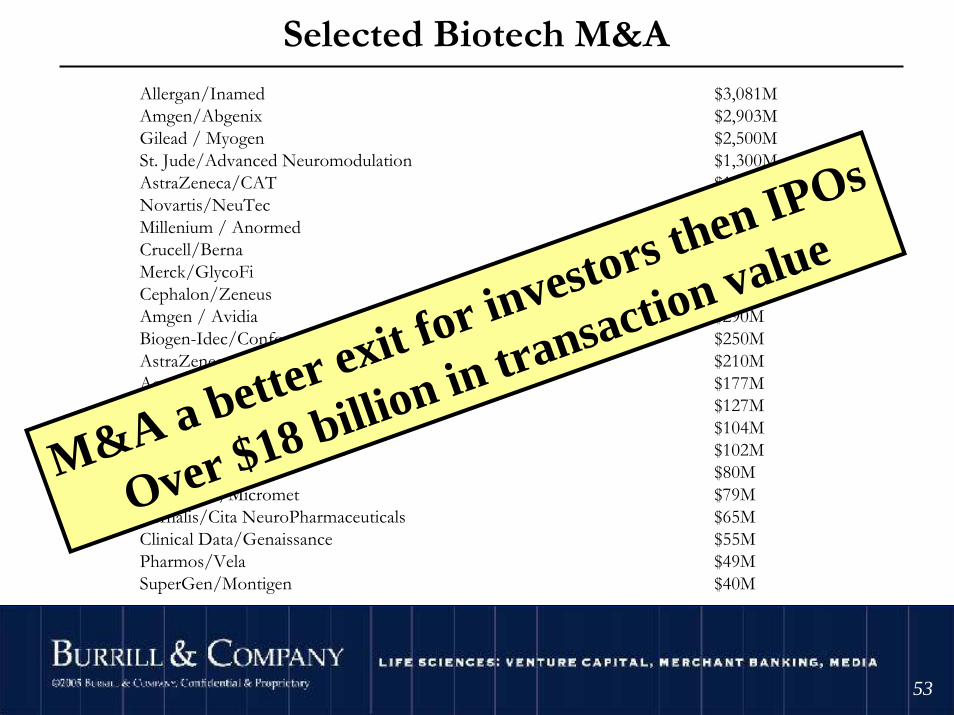
Selected Biotech M&AAllergan/Inamed $3,081MAmgen/Abgenix $2,903MGilead / Myogen $2,500MSt. Jude/Advanced Neuromodulation $1,300MAstraZeneca/CAT $1,071MNovartis/NeuTec $568MMillenium / Anormed $515MCrucell/Berna $451MMerck/GlycoFi $400MCephalon/Zeneus $360MAmgen / Avidia $290MBiogen-Idec/Conforma $250MAstraZeneca/KuDos $210MActavis/Sindan $177MEpix/Predix $127MPSividia/Control Delivery Systems $104MZentiva/Romanian Sicomed $102MMerck/Abmaxis $80MCancerVax/Micromet $79MVernalis/Cita NeuroPharmaceuticals $65MClinical Data/Genaissance $55MPharmos/Vela $49MSuperGen/Montigen $40M
M&A a better exit for investors then IPOs
Over $18 billion in transaction value
©2004 Burrill & Company. Confidential & Proprietary.
5454
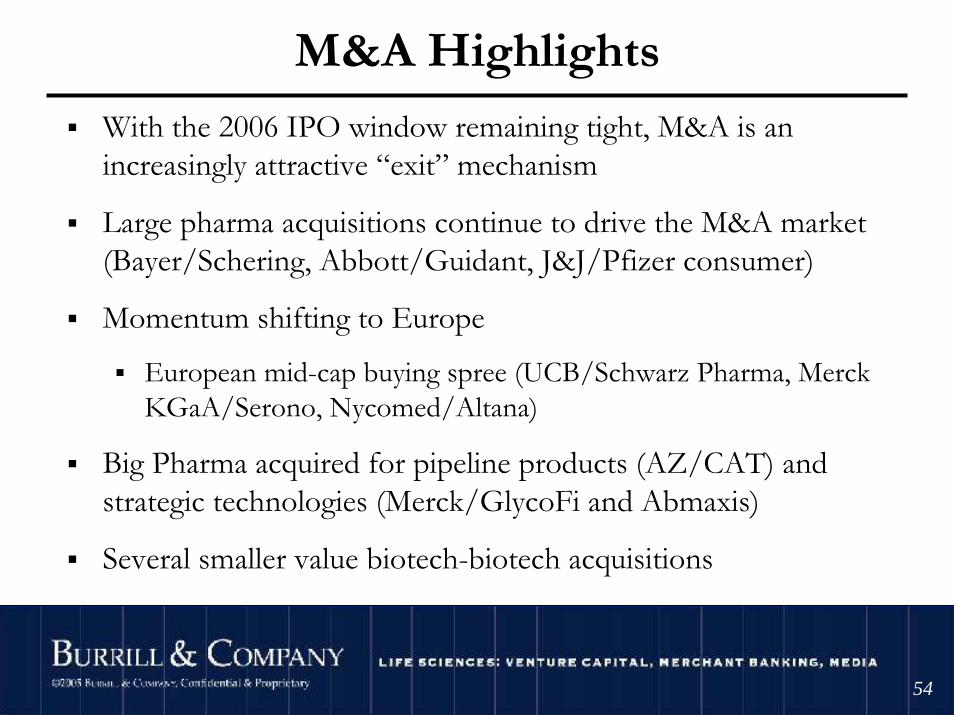
M&A Highlights
With the 2006 IPO window remaining tight, M&A is an increasingly attractive “exit” mechanism
Large pharma acquisitions continue to drive the M&A market (Bayer/Schering, Abbott/Guidant, J&J/Pfizer consumer)
Momentum shifting to Europe
European mid-cap buying spree (UCB/Schwarz Pharma, Merck KGaA/Serono, Nycomed/Altana)
Big Pharma acquired for pipeline products (AZ/CAT) and strategic technologies (Merck/GlycoFi and Abmaxis)
Several smaller value biotech-biotech acquisitions*As of September 2006

©2004 Burrill & Company. Confidential & Proprietary.
5555
Selected Biotech PartneringAtheroGenics /AstraZeneca $1,000MFibroGen / Astellas $815M*Wyeth/Trubion $800MAlnylam / Novartis $700MRoche/Actelion $630MNastech/P&G $577MAffymax / Takeda $535MIdenix/Novartis $525MSGX/Novartis $515MProgenics/Wyeth $417MInfinity/Novartis $400MNuvelo/Bayer $385MKai/Daiichi Sankyo $340MNicOx/Merck $340MAmira/Roche $287MAstraZeneca/Pozen $200MAstraZeneca/Abraxis $200MEnzon/Santaris $200MAstex/Novartis $190MMethylGene/Pharmion $170M
Over $8.2 Billion in Deals

©2004 Burrill & Company. Confidential & Proprietary.
5656
Partnering Highlights
Partnering continues to play an important role in our industry – over $8.2 B in total transaction value
On track to meeting/exceeding partnering transaction values in 2005 (~$17B)
Novartis on a roll with 3 partnering deals signed worth $1.4B total in the last several months
Big Pharma continues to partner early to access key technologies, targets and products
©2004 Burrill & Company. Confidential & Proprietary.
5757
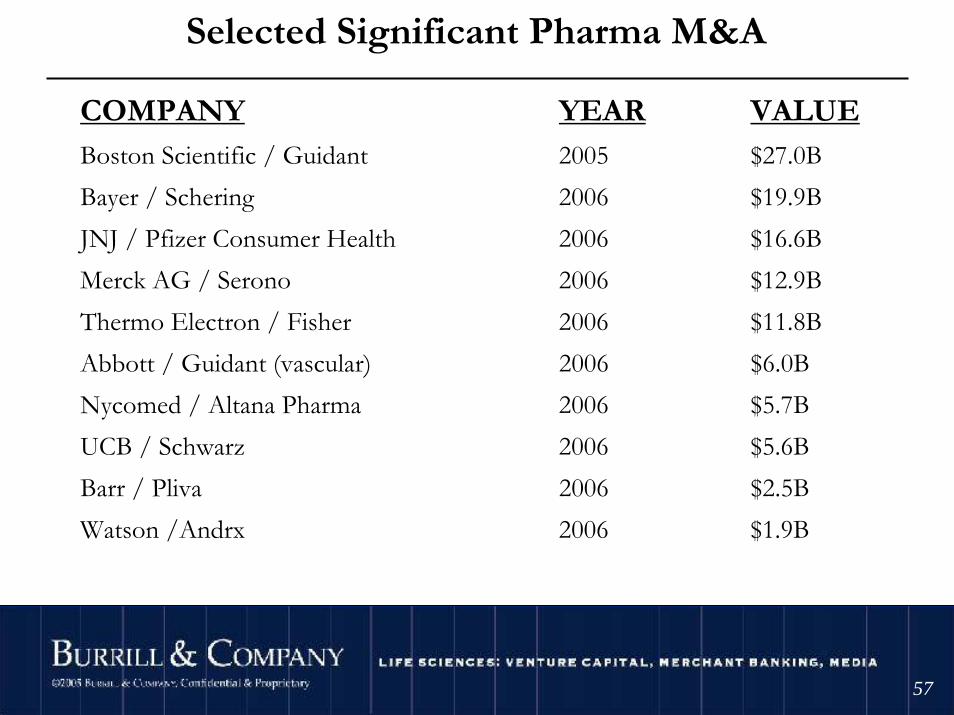
Selected Significant Pharma M&A
COMPANY YEAR VALUE Boston Scientific / Guidant 2005 $27.0BBayer / Schering 2006 $19.9BJNJ / Pfizer Consumer Health 2006 $16.6BMerck AG / Serono 2006 $12.9BThermo Electron / Fisher 2006 $11.8BAbbott / Guidant (vascular) 2006 $6.0BNycomed / Altana Pharma 2006 $5.7BUCB / Schwarz 2006 $5.6BBarr / Pliva 2006 $2.5BWatson /Andrx 2006 $1.9B
*As of September 2006
©2004 Burrill & Company. Confidential & Proprietary.
5858
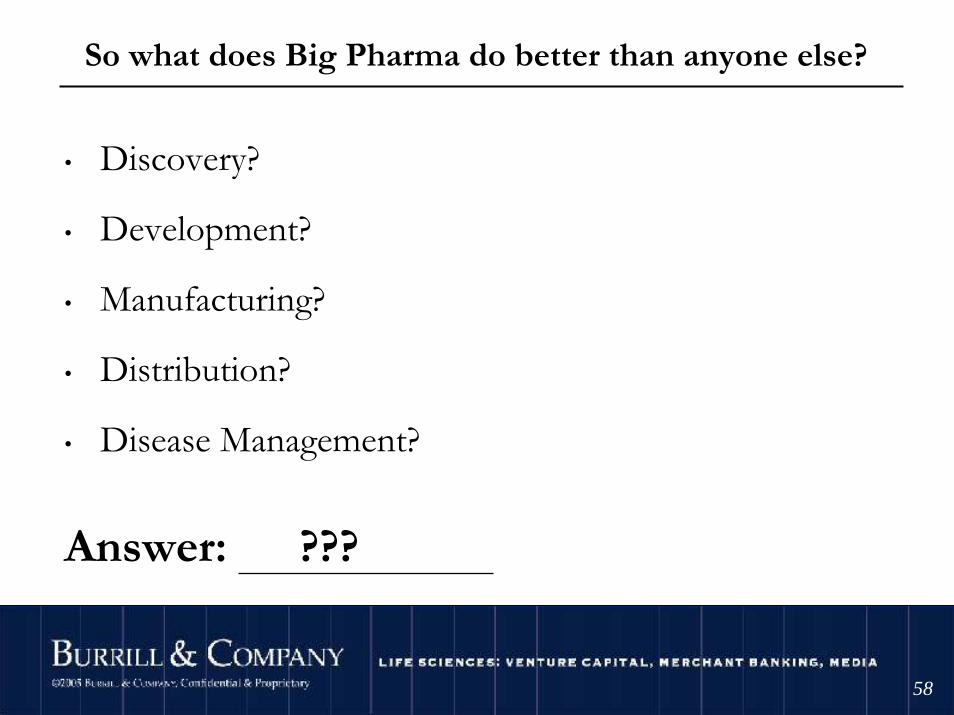
So what does Big Pharma do better than anyone else?
• Discovery?
• Development?
• Manufacturing?
• Distribution?
• Disease Management?
Answer: ???
©2004 Burrill & Company. Confidential & Proprietary.
5959
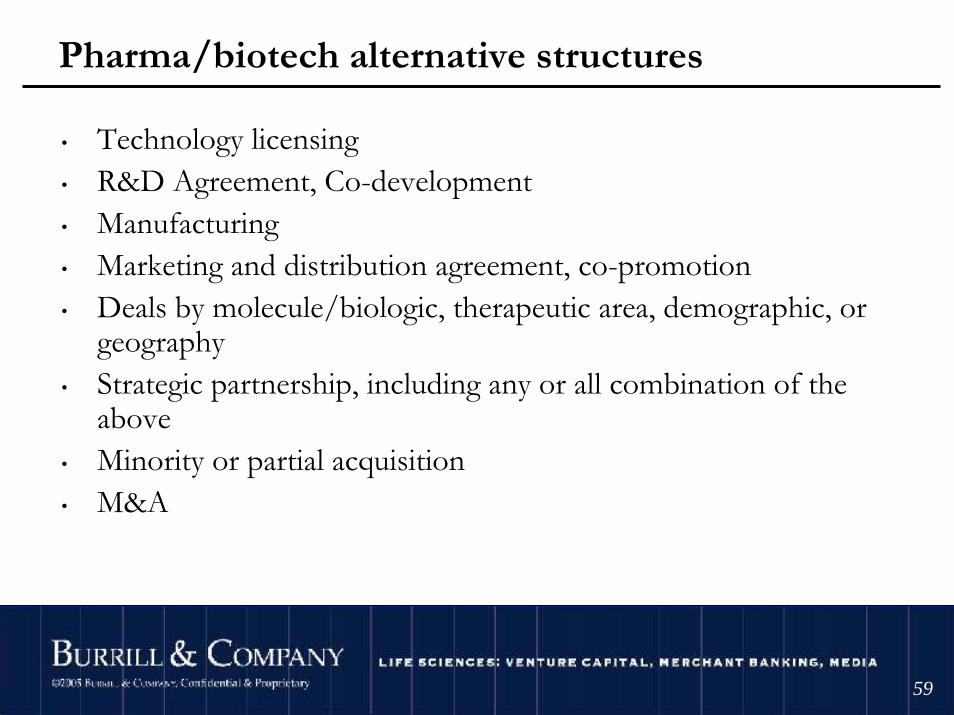
Pharma/biotech alternative structures
• Technology licensing• R&D Agreement, Co-development• Manufacturing• Marketing and distribution agreement, co-promotion• Deals by molecule/biologic, therapeutic area, demographic, or
geography• Strategic partnership, including any or all combination of the
above• Minority or partial acquisition• M&A
©2004 Burrill & Company. Confidential & Proprietary.
6060
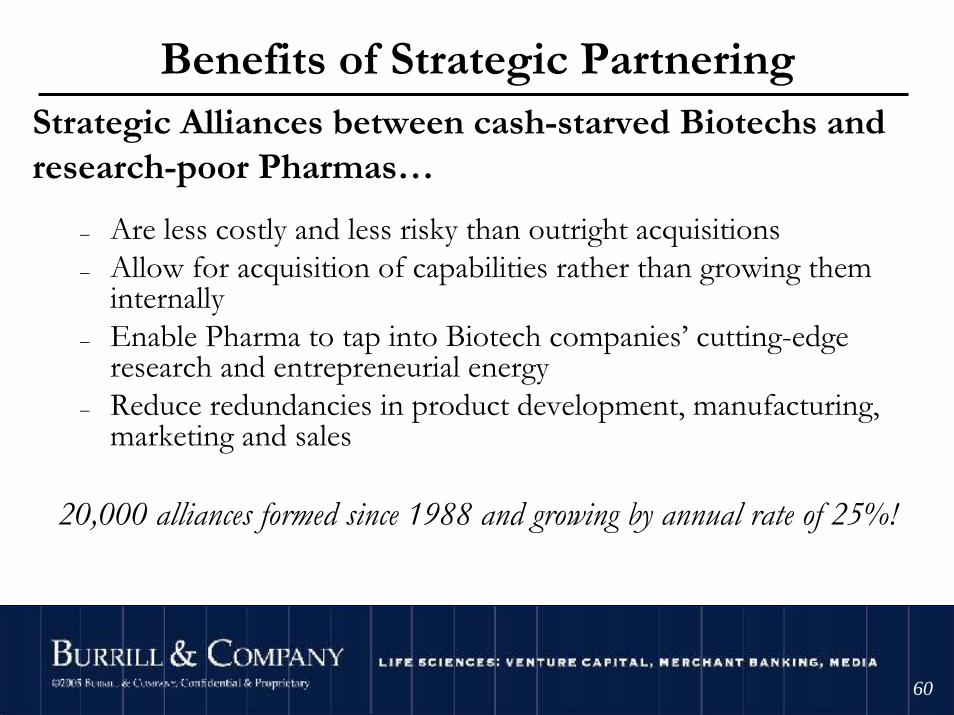
Benefits of Strategic PartneringStrategic Alliances between cash-starved Biotechs and research-poor Pharmas…
– Are less costly and less risky than outright acquisitions – Allow for acquisition of capabilities rather than growing them
internally– Enable Pharma to tap into Biotech companies’ cutting-edge
research and entrepreneurial energy– Reduce redundancies in product development, manufacturing,
marketing and sales
20,000 alliances formed since 1988 and growing by annual rate of 25%!
©2004 Burrill & Company. Confidential & Proprietary.
6161
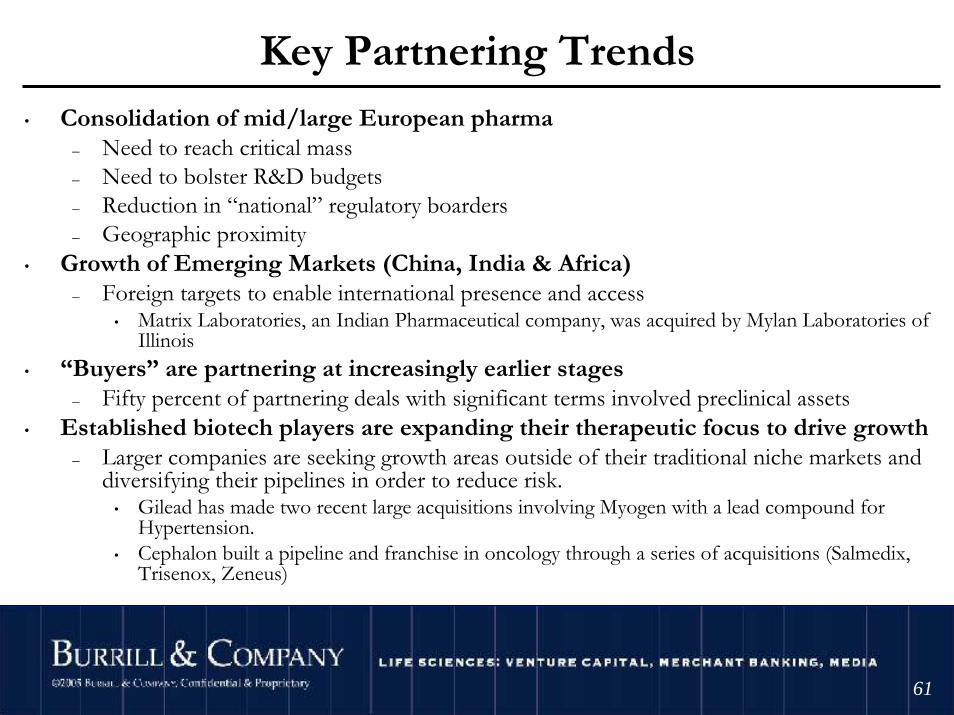
Key Partnering Trends• Consolidation of mid/large European pharma
– Need to reach critical mass– Need to bolster R&D budgets– Reduction in “national” regulatory boarders– Geographic proximity
• Growth of Emerging Markets (China, India & Africa)– Foreign targets to enable international presence and access
• Matrix Laboratories, an Indian Pharmaceutical company, was acquired by Mylan Laboratories of Illinois
• “Buyers” are partnering at increasingly earlier stages– Fifty percent of partnering deals with significant terms involved preclinical assets
• Established biotech players are expanding their therapeutic focus to drive growth– Larger companies are seeking growth areas outside of their traditional niche markets and
diversifying their pipelines in order to reduce risk.• Gilead has made two recent large acquisitions involving Myogen with a lead compound for
Hypertension. • Cephalon built a pipeline and franchise in oncology through a series of acquisitions (Salmedix,
Trisenox, Zeneus)
©2004 Burrill & Company. Confidential & Proprietary.
6262
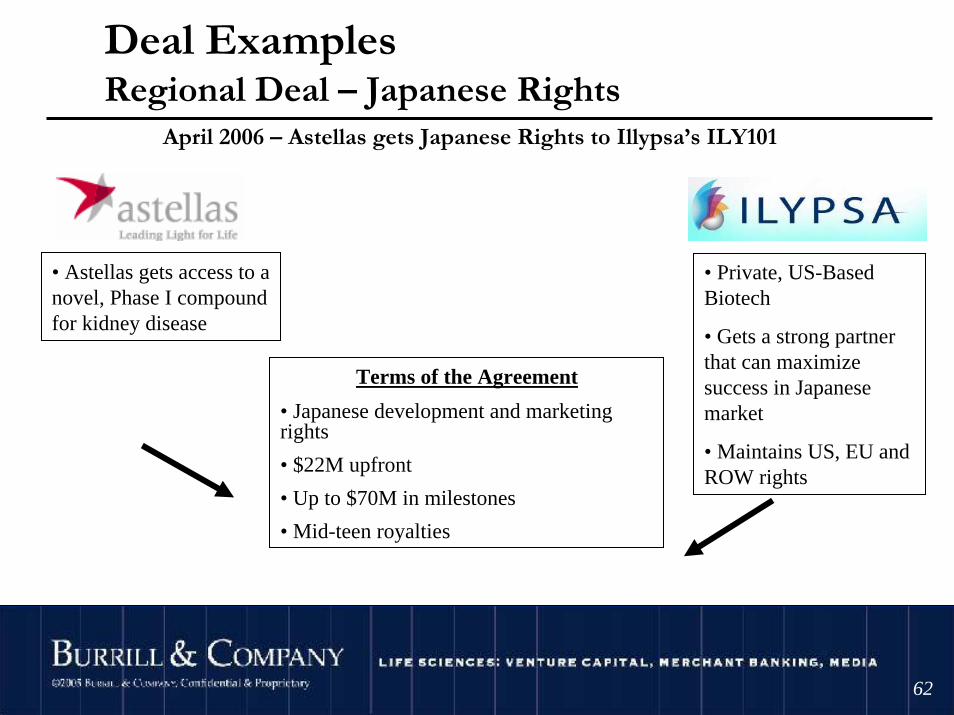
Deal ExamplesRegional Deal – Japanese Rights
• Astellas gets access to a novel, Phase I compound for kidney disease
Terms of the Agreement
• Japanese development and marketing rights
• $22M upfront
• Up to $70M in milestones
• Mid-teen royalties
• Private, US-Based Biotech
• Gets a strong partner that can maximize success in Japanese market
• Maintains US, EU and ROW rights
April 2006 – Astellas gets Japanese Rights to Illypsa’s ILY101

©2004 Burrill & Company. Confidential & Proprietary.
6363
Deal ExamplesCo-Development
• Purdue shares developmental costs and risks
• Can advance multiple programs simultaneously
Terms of the Agreement
• Worldwide co-development and co-promotion deal
• 3 pain programs
• Shionogi funds research first 3 years
• Companies share development expenses
• Co-promote products worldwide
• Shionogi gets access to 3 early stage pain programs
January 2006 – Shionogi and Purdue Collaborate on Pain Therapeutics
©2004 Burrill & Company. Confidential & Proprietary.
6464
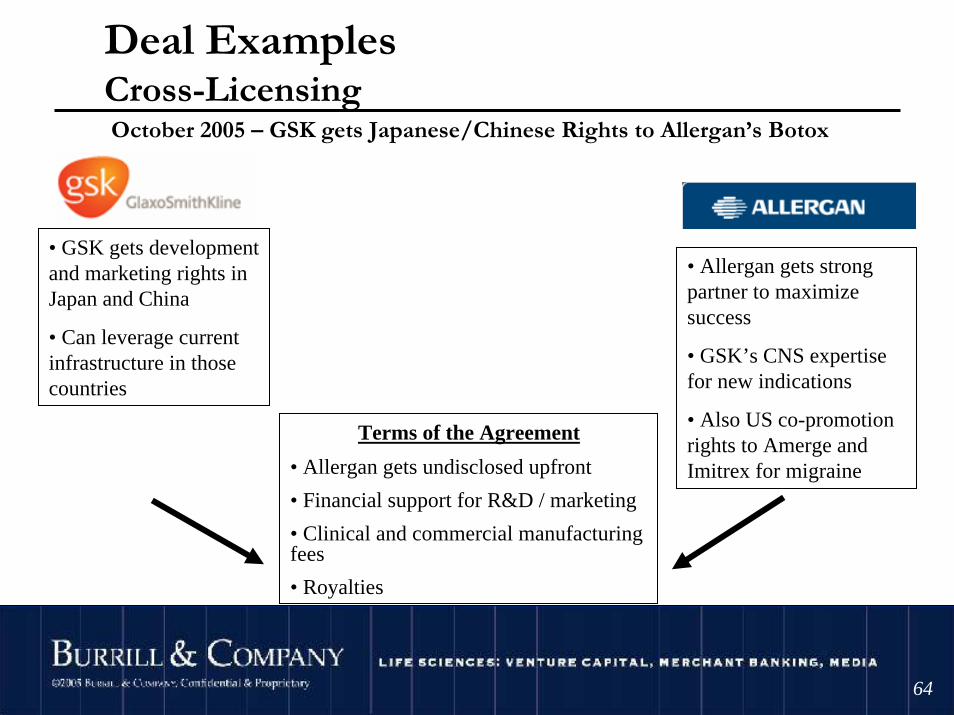
Deal ExamplesCross-Licensing
• Allergan gets strong partner to maximize success
• GSK’s CNS expertise for new indications
• Also US co-promotion rights to Amerge and Imitrex for migraine
Terms of the Agreement
• Allergan gets undisclosed upfront
• Financial support for R&D / marketing
• Clinical and commercial manufacturing fees
• Royalties
• GSK gets development and marketing rights in Japan and China
• Can leverage current infrastructure in those countries
October 2005 – GSK gets Japanese/Chinese Rights to Allergan’s Botox
©2004 Burrill & Company. Confidential & Proprietary.
6565
Wellness: Its time has come
• Rising healthcare costs are impacting individuals
• Rising incidence of chronic disease
• Recognition of the importance of genetic variation
• Scientific knowledge base for:– Personalization– Cost effective technologies
• Financial markets beginning to recognize opportunity
©2004 Burrill & Company. Confidential & Proprietary.
6666
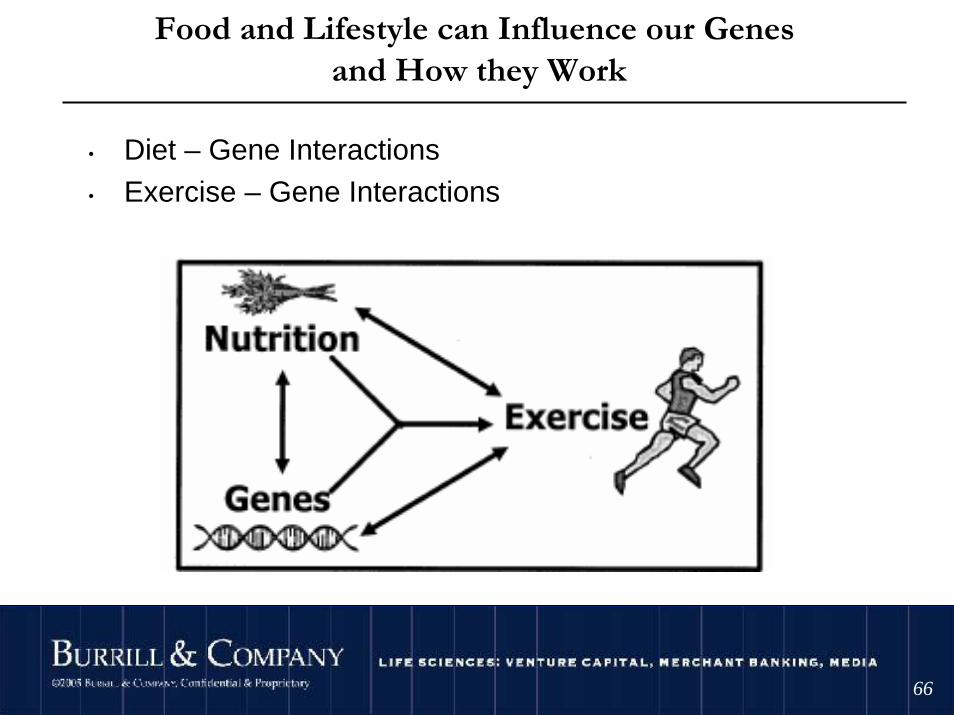
Food and Lifestyle can Influence our Genes and How they Work
• Diet – Gene Interactions• Exercise – Gene Interactions
©2004 Burrill & Company. Confidential & Proprietary.
6767
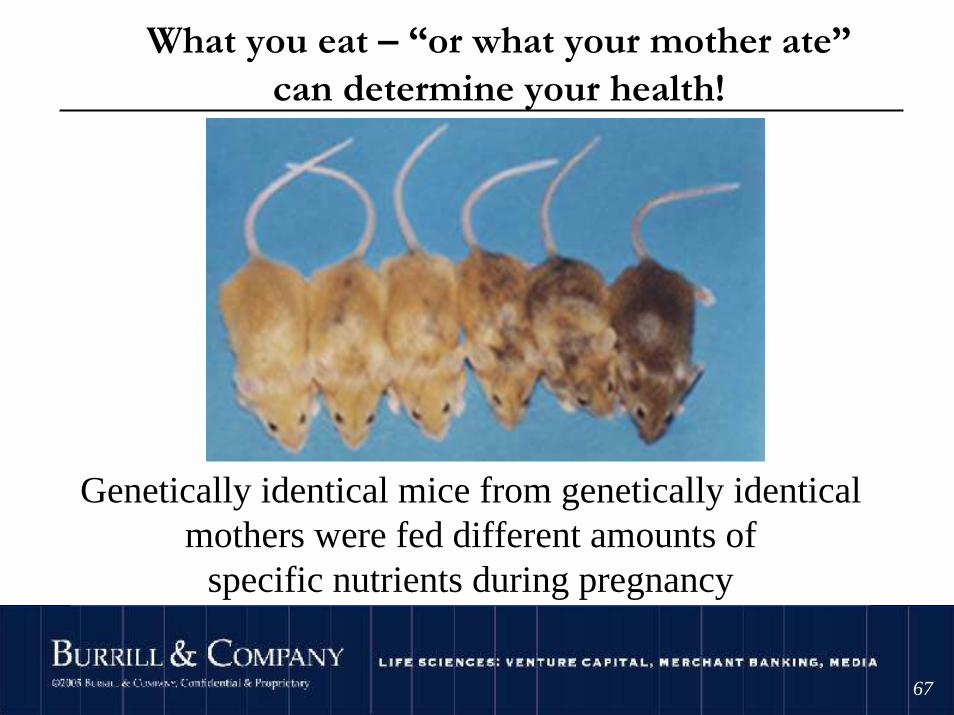
Genetically identical mice from genetically identicalmothers were fed different amounts of
specific nutrients during pregnancy
What you eat – “or what your mother ate”can determine your health!
©2004 Burrill & Company. Confidential & Proprietary.
6868
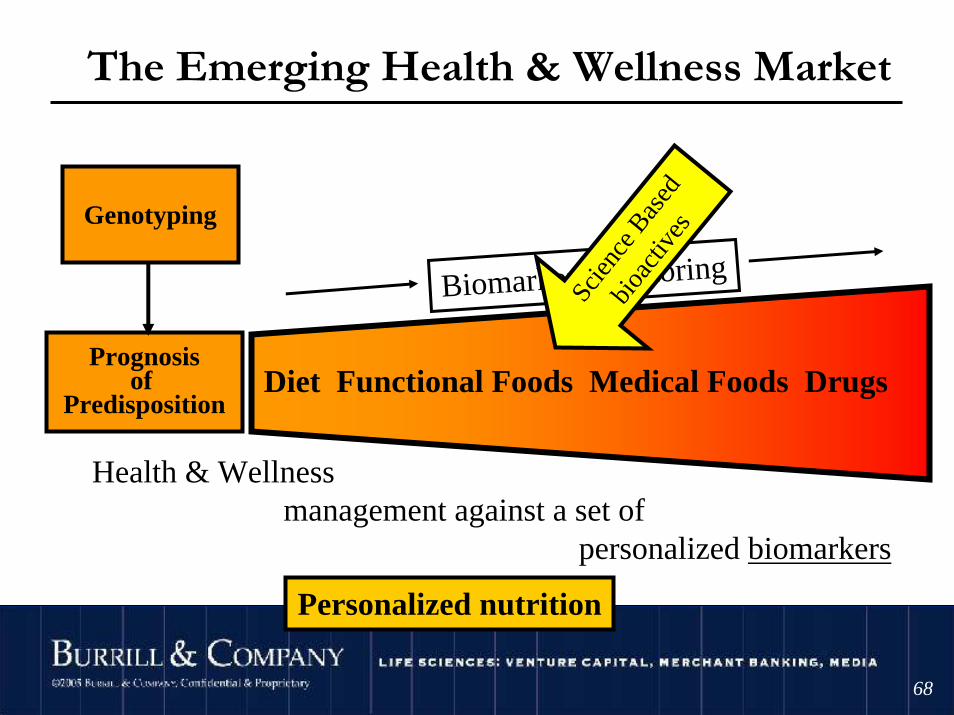
The Emerging Health & Wellness Market
Genotyping
Diet Functional Foods Medical Foods DrugsPrognosis
of Predisposition
Health & Wellness management against a set of
personalized biomarkers
Biomarker monitoring
Personalized nutritionSc
ienc
e Bas
ed
bioa
ctive
s
©2004 Burrill & Company. Confidential & Proprietary.
6969
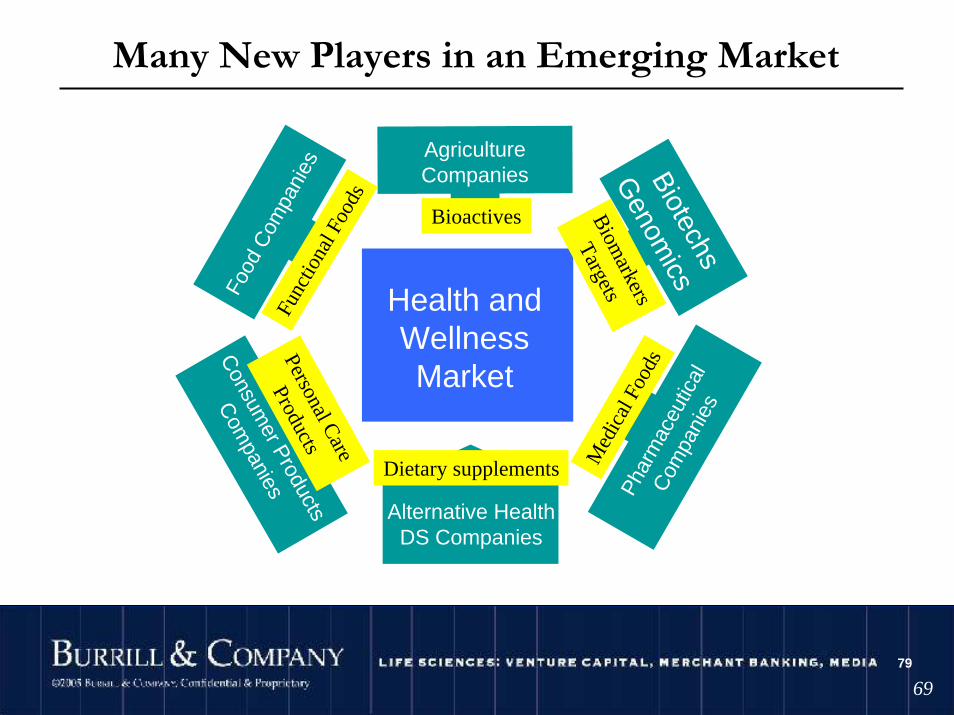
Many New Players in an Emerging Market
Health and WellnessMarket
Food
Com
pani
es
Consum
er Products
Com
panies Phar
mac
eutic
al
Com
pani
es
Biotechs
Genom
ics
AgricultureCompanies
Alternative HealthDS Companies
79
Dietary supplements Med
ical
Foo
ds
Biom
arkers
Targets
Bioactives
Func
tiona
l Foo
ds
Personal Care
Products
©2004 Burrill & Company. Confidential & Proprietary.
7070
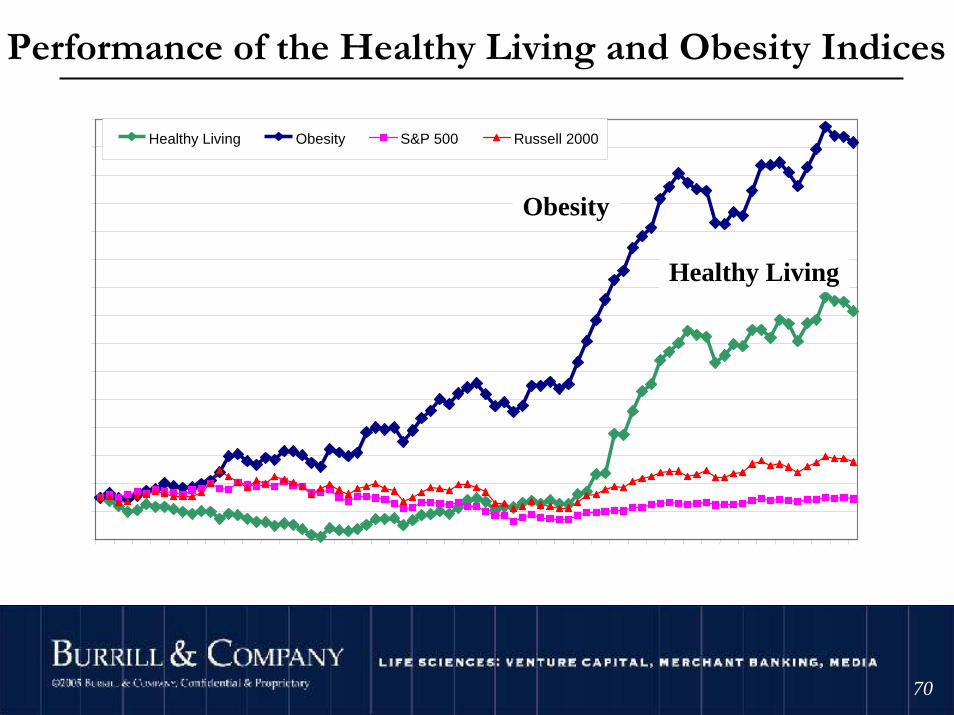
Performance of the Healthy Living and Obesity Indicesvs. the S&P 500 & Russell 2000
40
80
120
160
200
240
280
320
360
400
440
480
520
560
600
640D
ec-9
8F
eb-9
9A
pr-9
9Ju
n-99
Aug
-99
Oct
-99
Dec
-99
Feb
-00
Apr
-00
Jun-
00A
ug-0
0O
ct-0
0D
ec-0
0F
eb-0
1A
pr-0
1Ju
n-01
Aug
-01
Oct
-01
Dec
-01
Feb
-02
Apr
-02
Jun-
02A
ug-0
2O
ct-0
2D
ec-0
2F
eb-0
3A
pr-0
3Ju
n-03
Aug
-03
Oct
-03
Dec
-03
Feb
-04
Apr
-04
Jun-
04A
ug-0
4O
ct-0
4D
ec-0
4F
eb-0
5A
pr-0
5Ju
n-05
Aug
-05
Oct
-05
Healthy Living Obesity S&P 500 Russell 2000
Healthy Living
Obesity
©2004 Burrill & Company. Confidential & Proprietary.
7171
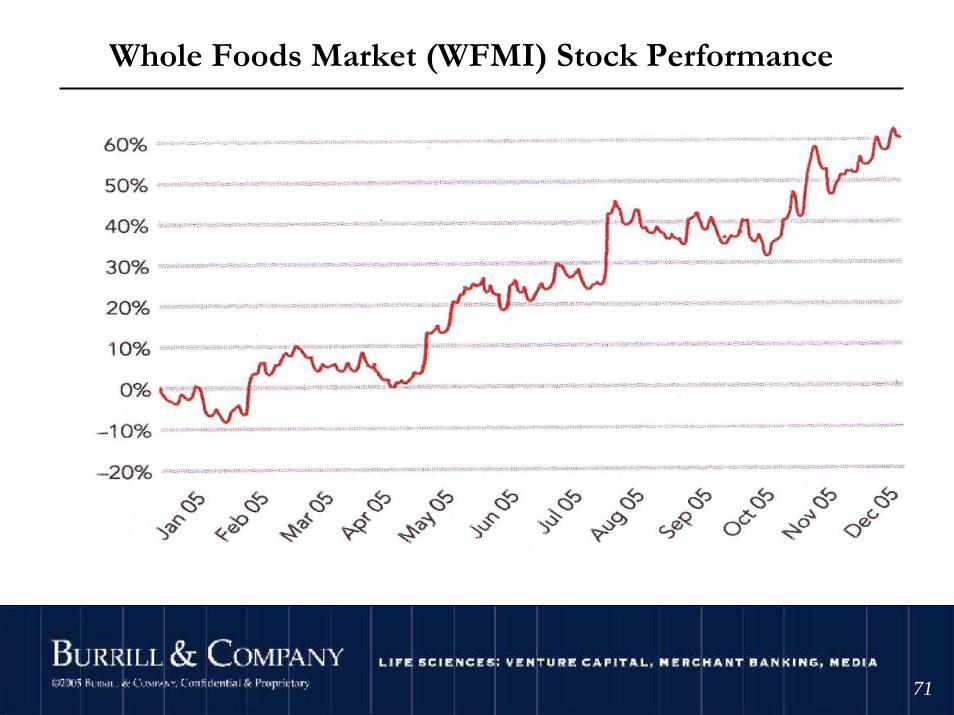
Whole Foods Market (WFMI) Stock Performance
©2004 Burrill & Company. Confidential & Proprietary.
7272
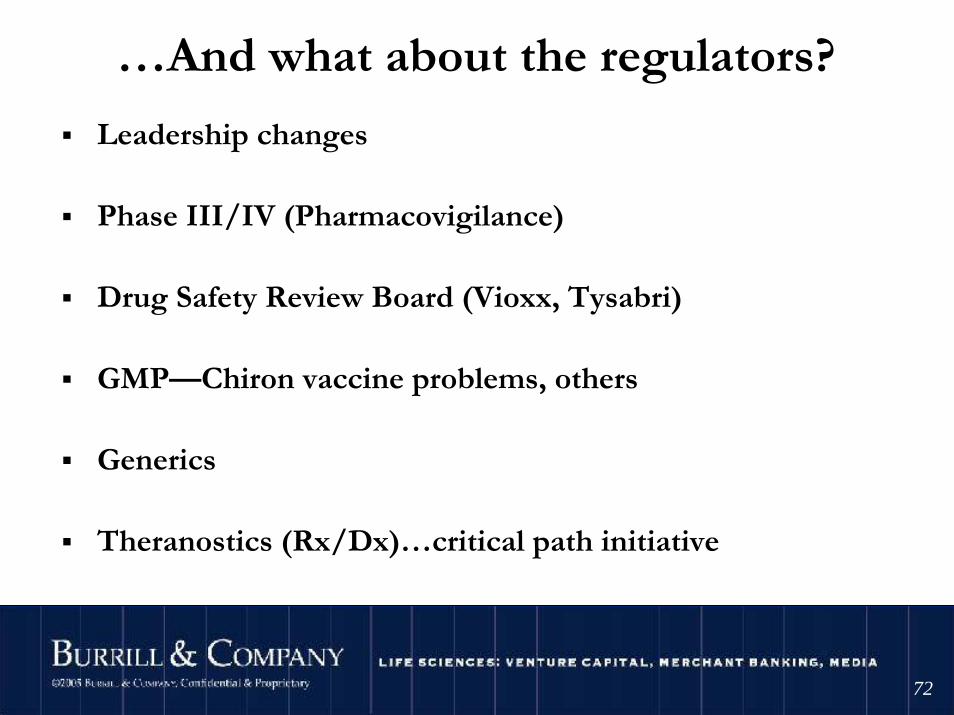
…And what about the regulators?
Leadership changes
Phase III/IV (Pharmacovigilance)
Drug Safety Review Board (Vioxx, Tysabri)
GMP—Chiron vaccine problems, others
Generics
Theranostics (Rx/Dx)…critical path initiative
©2004 Burrill & Company. Confidential & Proprietary.
7373
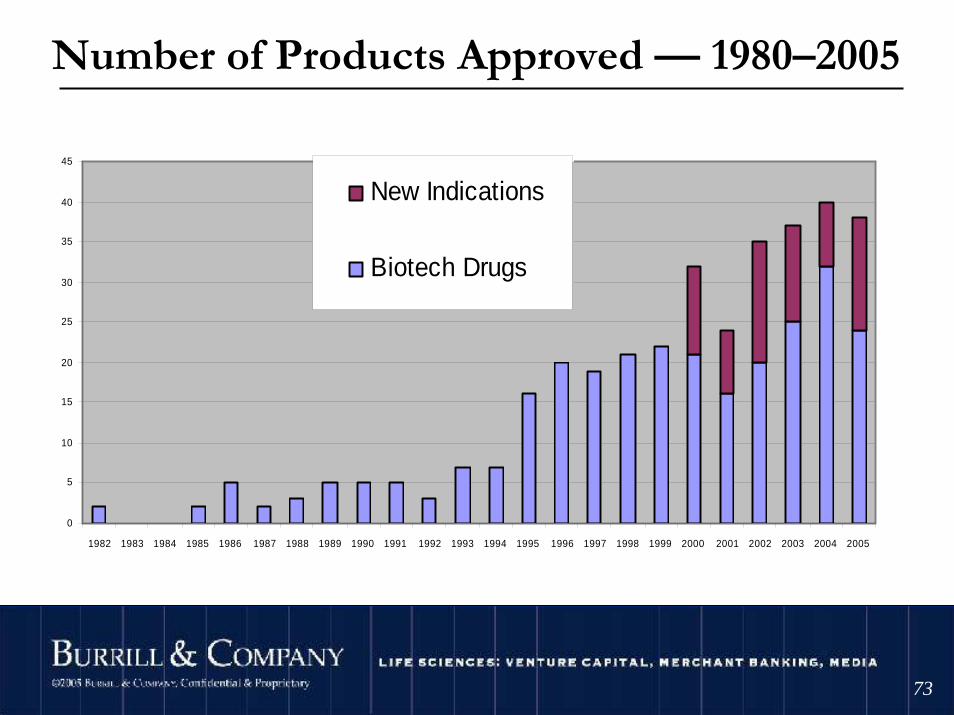
Number of Products Approved — 1980–2005
0
5
10
15
20
25
30
35
40
45
1982 1983 1984 1985 1986 1987 1988 1989 1990 1991 1992 1993 1994 1995 1996 1997 1998 1999 2000 2001 2002 2003 2004 2005
New Indications
Biotech Drugs
©2004 Burrill & Company. Confidential & Proprietary.
7474
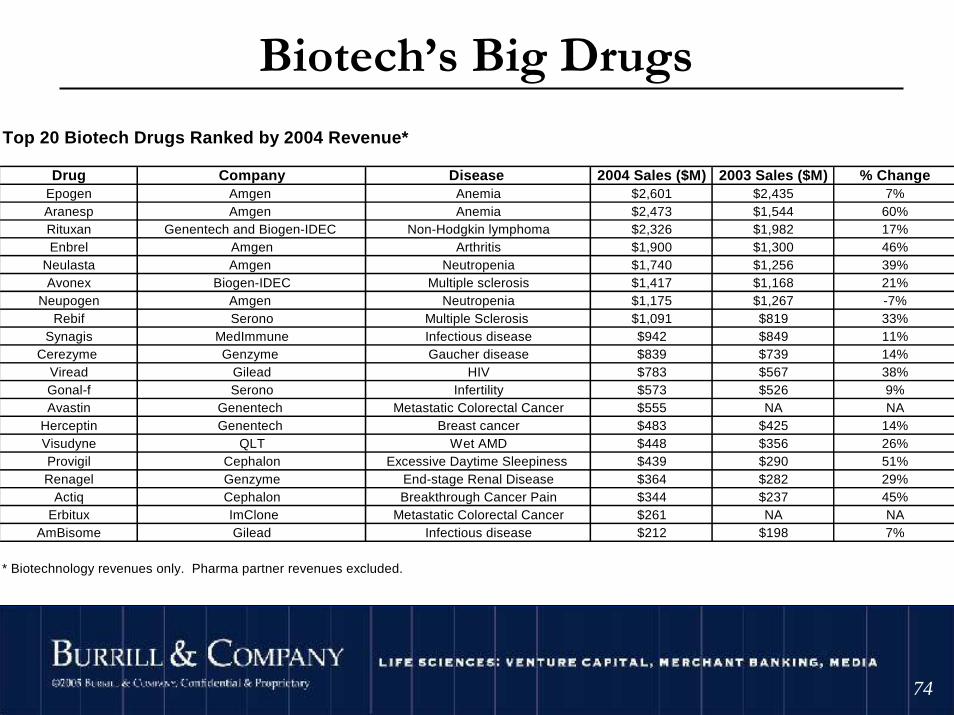
Biotech’s Big Drugs
Top 20 Biotech Drugs Ranked by 2004 Revenue*
Drug Company Disease 2004 Sales ($M) 2003 Sales ($M) % ChangeEpogen Amgen Anemia $2,601 $2,435 7%Aranesp Amgen Anemia $2,473 $1,544 60%Rituxan Genentech and Biogen-IDEC Non-Hodgkin lymphoma $2,326 $1,982 17%Enbrel Amgen Arthritis $1,900 $1,300 46%
Neulasta Amgen Neutropenia $1,740 $1,256 39%Avonex Biogen-IDEC Multiple sclerosis $1,417 $1,168 21%
Neupogen Amgen Neutropenia $1,175 $1,267 -7%Rebif Serono Multiple Sclerosis $1,091 $819 33%
Synagis MedImmune Infectious disease $942 $849 11%Cerezyme Genzyme Gaucher disease $839 $739 14%
Viread Gilead HIV $783 $567 38%Gonal-f Serono Infertility $573 $526 9%Avastin Genentech Metastatic Colorectal Cancer $555 NA NA
Herceptin Genentech Breast cancer $483 $425 14%Visudyne QLT Wet AMD $448 $356 26%Provigil Cephalon Excessive Daytime Sleepiness $439 $290 51%Renagel Genzyme End-stage Renal Disease $364 $282 29%
Actiq Cephalon Breakthrough Cancer Pain $344 $237 45%Erbitux ImClone Metastatic Colorectal Cancer $261 NA NA
AmBisome Gilead Infectious disease $212 $198 7%
* Biotechnology revenues only. Pharma partner revenues excluded.

©2004 Burrill & Company. Confidential & Proprietary.
7575
Biotechnology Drugs in Clinical Development
©2004 Burrill & Company. Confidential & Proprietary.
7676
. . . and the marketplaceis changing too
©2004 Burrill & Company. Confidential & Proprietary.
7777
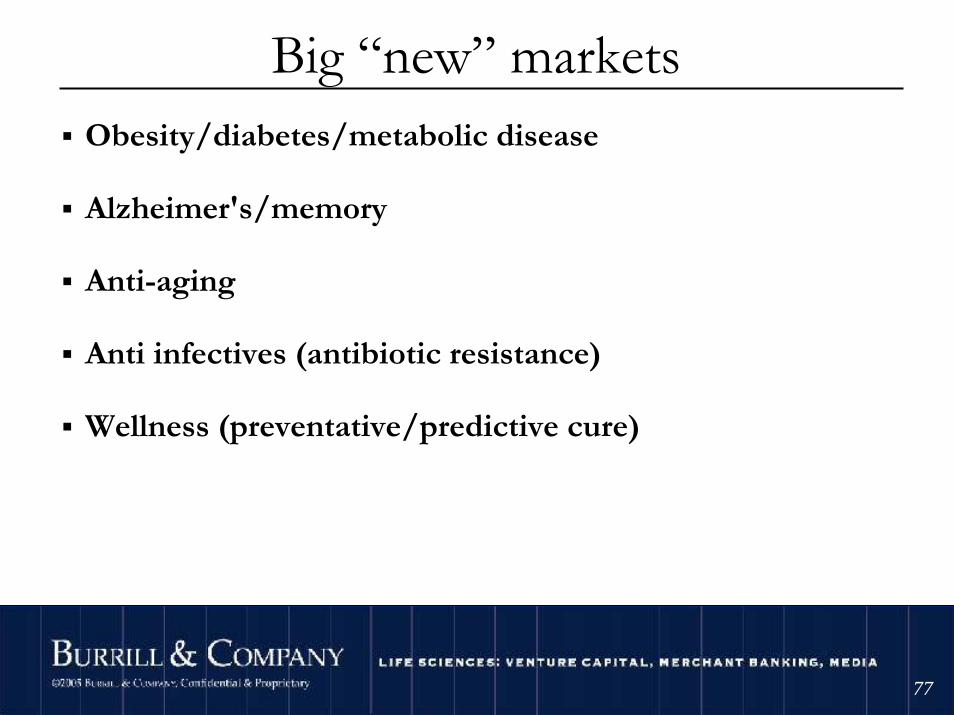
Big “new” marketsObesity/diabetes/metabolic disease
Alzheimer's/memory
Anti-aging
Anti infectives (antibiotic resistance)
Wellness (preventative/predictive cure)
©2004 Burrill & Company. Confidential & Proprietary.
7878
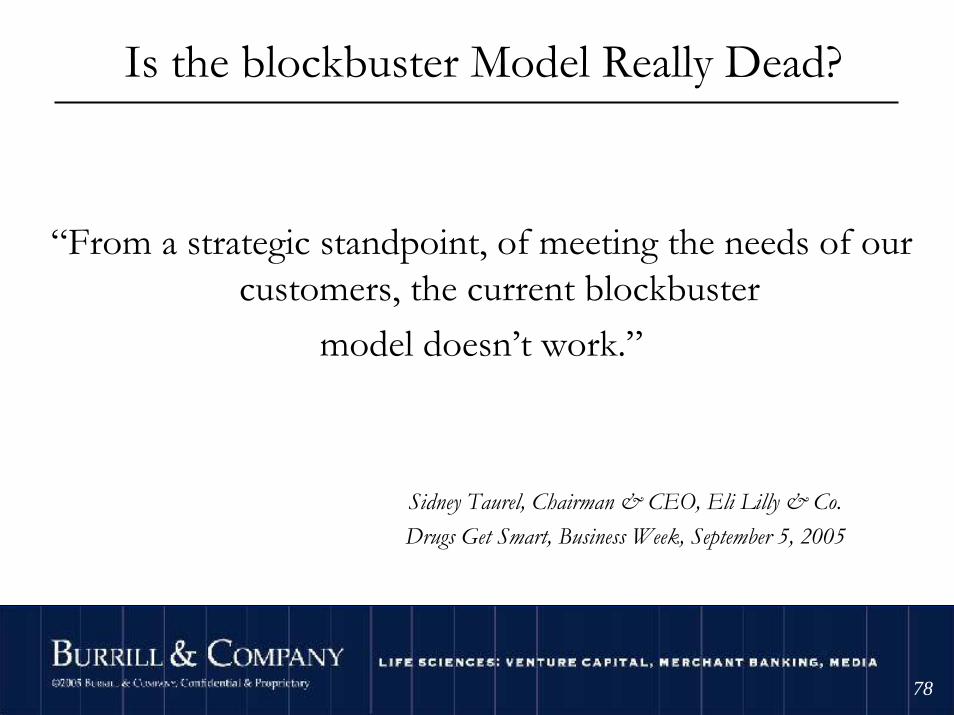
Is the blockbuster Model Really Dead?
“From a strategic standpoint, of meeting the needs of our customers, the current blockbuster
model doesn’t work.”
Sidney Taurel, Chairman & CEO, Eli Lilly & Co.Drugs Get Smart, Business Week, September 5, 2005
©2004 Burrill & Company. Confidential & Proprietary.
7979
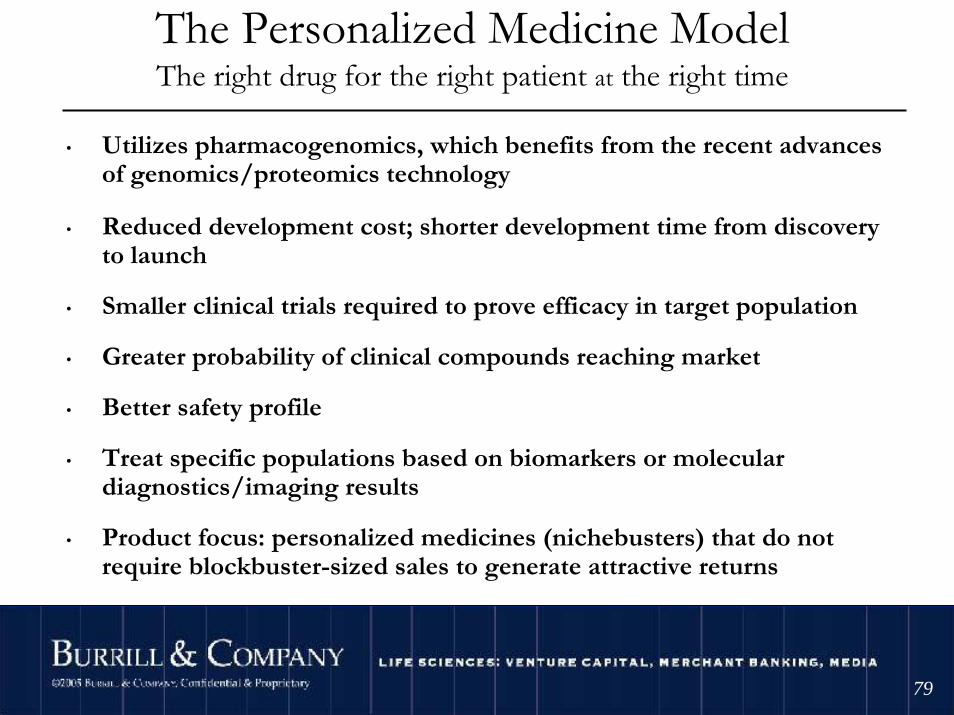
The Personalized Medicine ModelThe right drug for the right patient at the right time
• Utilizes pharmacogenomics, which benefits from the recent advances of genomics/proteomics technology
• Reduced development cost; shorter development time from discovery to launch
• Smaller clinical trials required to prove efficacy in target population
• Greater probability of clinical compounds reaching market
• Better safety profile
• Treat specific populations based on biomarkers or molecular diagnostics/imaging results
• Product focus: personalized medicines (nichebusters) that do not require blockbuster-sized sales to generate attractive returns
©2004 Burrill & Company. Confidential & Proprietary.
8080
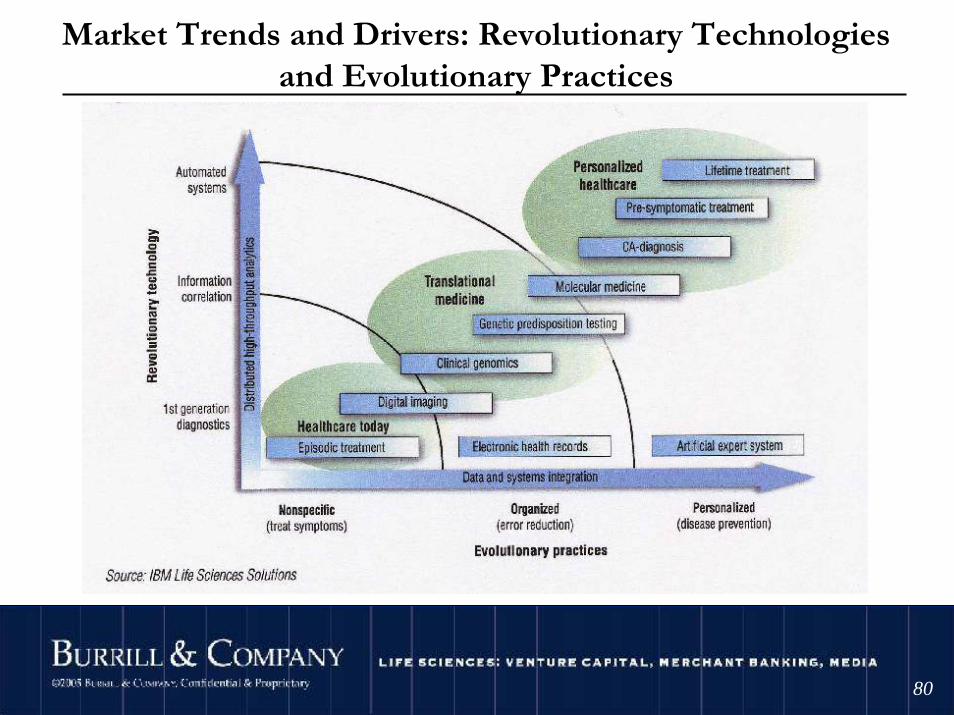
Market Trends and Drivers: Revolutionary Technologiesand Evolutionary Practices
©2004 Burrill & Company. Confidential & Proprietary.
8181
(China/India)» What’s happening?
» Impact
©2004 Burrill & Company. Confidential & Proprietary.
8282
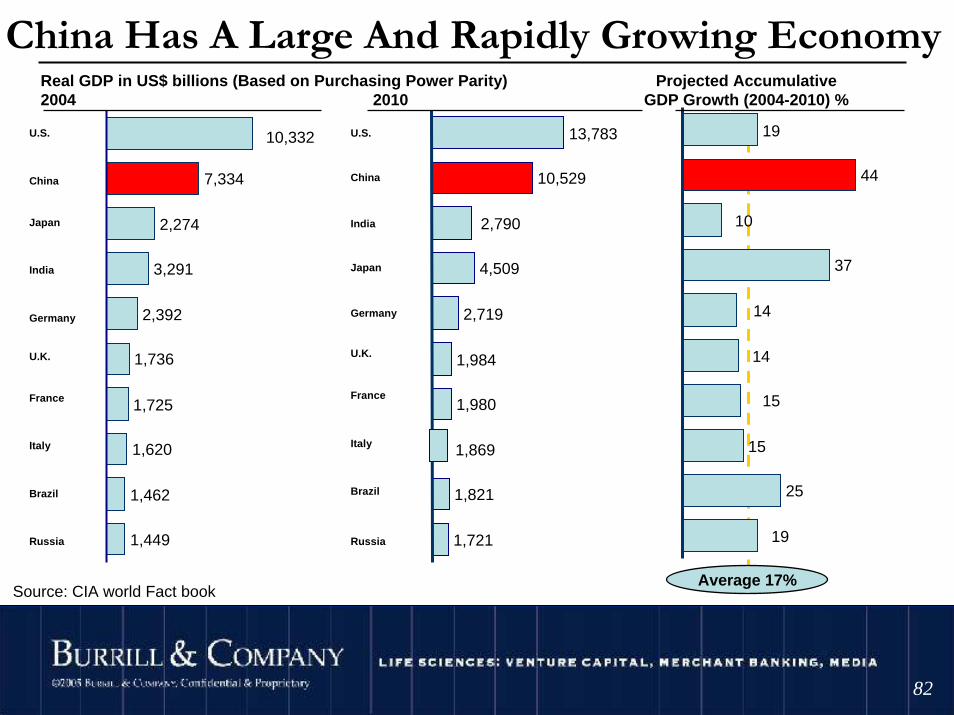
10,529
4,509
2,719
1,984
1,980
1,869
1,821
1,721
13,783
2,790
7,334
3,291
2,392
1,736
1,725
1,620
1,462
1,449
10,332
2,274
44
37
15
25
15
14
10
14
19
19
China Has A Large And Rapidly Growing EconomyProjected Accumulative
GDP Growth (2004-2010) %
Average 17%
Real GDP in US$ billions (Based on Purchasing Power Parity)2004
U.S.
Japan
Germany
France
China
Italy
U.K.
Brazil
Russia
India
2010
Source: CIA world Fact book
U.S.
Japan
Germany
France
U.K.
Italy
China
Brazil
India
Russia
©2004 Burrill & Company. Confidential & Proprietary.
8383
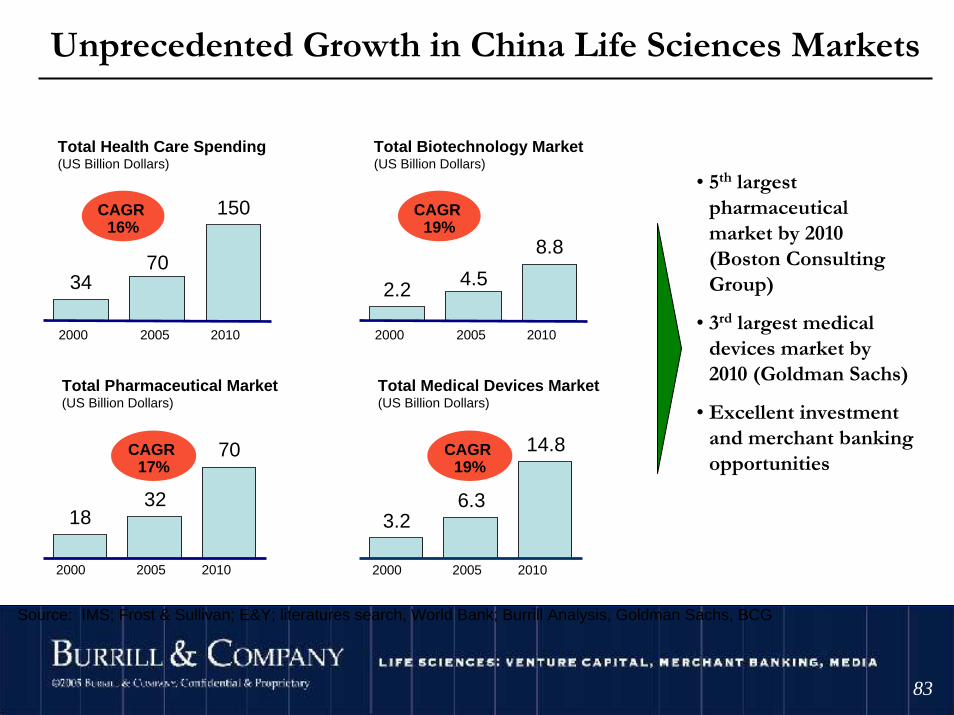
Unprecedented Growth in China Life Sciences Markets
2000 2005 2010
2000 2005 2010
Total Health Care Spending(US Billion Dollars)
Total Pharmaceutical Market(US Billion Dollars)
CAGR 16%
CAGR 17%
2000 2005 2010
2000 2005 2010
Total Biotechnology Market(US Billion Dollars)
Total Medical Devices Market(US Billion Dollars)
CAGR 19%
CAGR 19%
Source: IMS; Frost & Sullivan; E&Y; literatures search, World Bank; Burrill Analysis, Goldman Sachs, BCG
• 5th largest pharmaceutical market by 2010 (Boston Consulting Group)
• 3rd largest medical devices market by 2010 (Goldman Sachs)
• Excellent investment and merchant banking opportunities
34
150
70
1832
70
2.2
8.8
4.5
3.26.3
14.8
©2004 Burrill & Company. Confidential & Proprietary.
8484
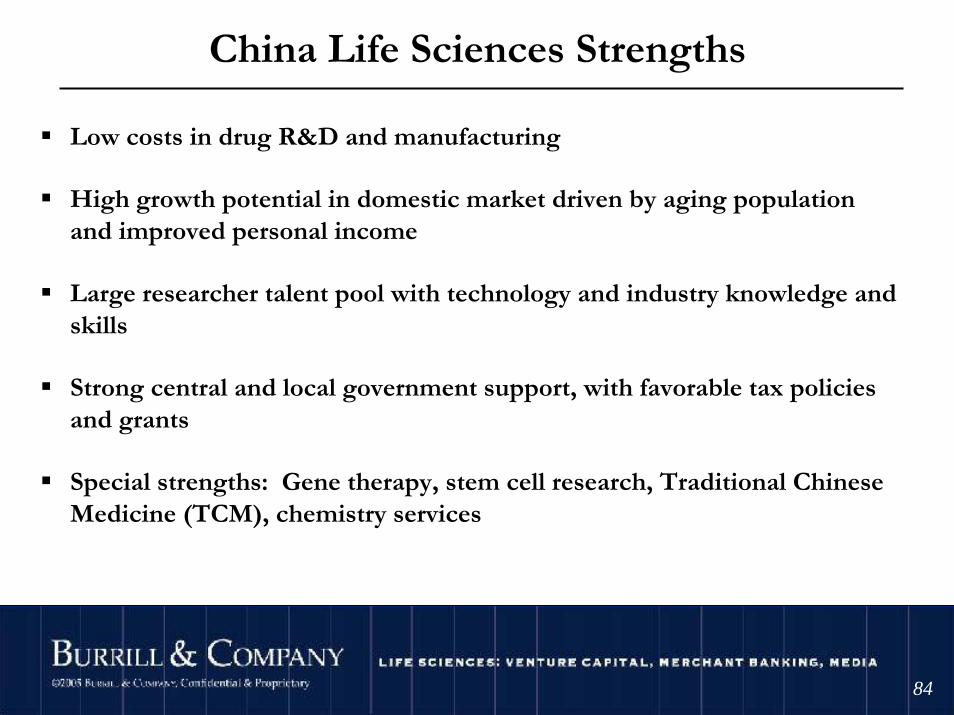
China Life Sciences Strengths
Low costs in drug R&D and manufacturing
High growth potential in domestic market driven by aging population and improved personal income
Large researcher talent pool with technology and industry knowledge and skills
Strong central and local government support, with favorable tax policies and grants
Special strengths: Gene therapy, stem cell research, Traditional Chinese Medicine (TCM), chemistry services
Sources: *IMS Global Health
©2004 Burrill & Company. Confidential & Proprietary.
8585
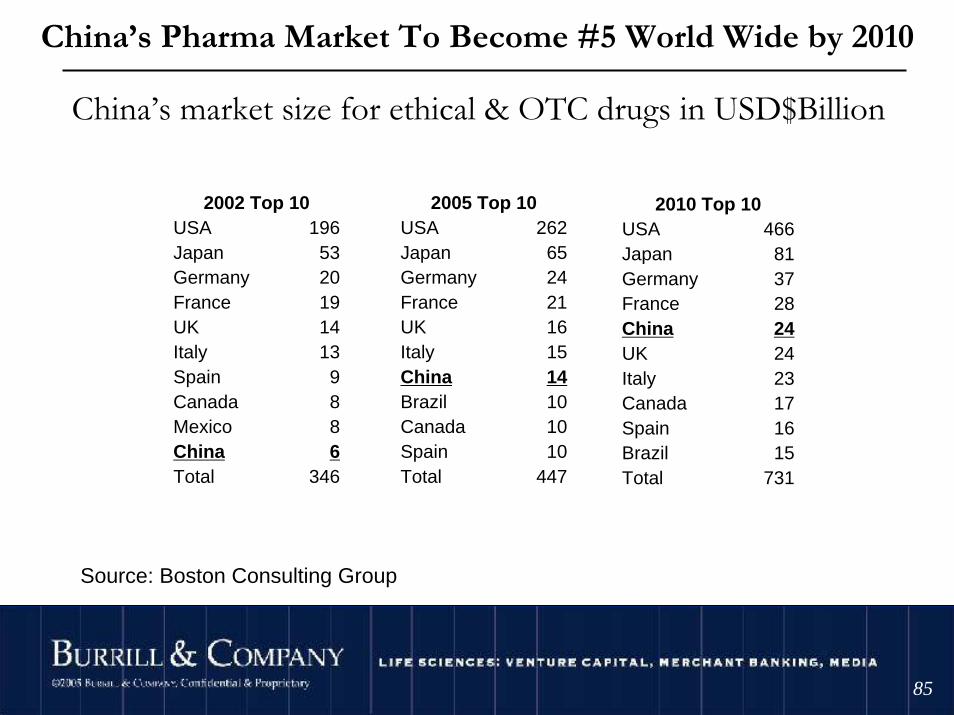
China’s market size for ethical & OTC drugs in USD$Billion
346Total6China8Mexico8Canada9Spain
13Italy14UK19France20Germany53Japan
196USA2002 Top 10
447Total10Spain10Canada10Brazil14China15Italy16UK21France24Germany65Japan
262USA2005 Top 10
731Total15Brazil16Spain17Canada23Italy24UK24China28France37Germany81Japan
466USA2010 Top 10
Source: Boston Consulting Group
China’s Pharma Market To Become #5 World Wide by 2010
©2004 Burrill & Company. Confidential & Proprietary.
8686
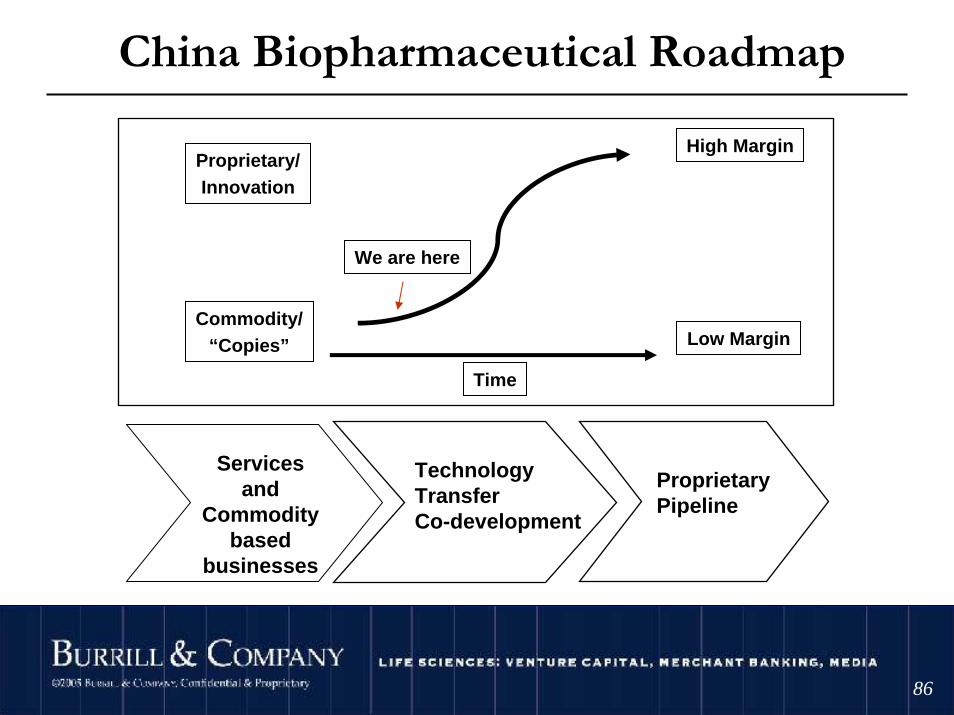
China Biopharmaceutical Roadmap
Time
Commodity/“Copies”
Proprietary/Innovation
Low Margin
High Margin
We are here
Technology TransferCo-development
Proprietary Pipeline
Services and
Commodity based
businesses
©2004 Burrill & Company. Confidential & Proprietary.
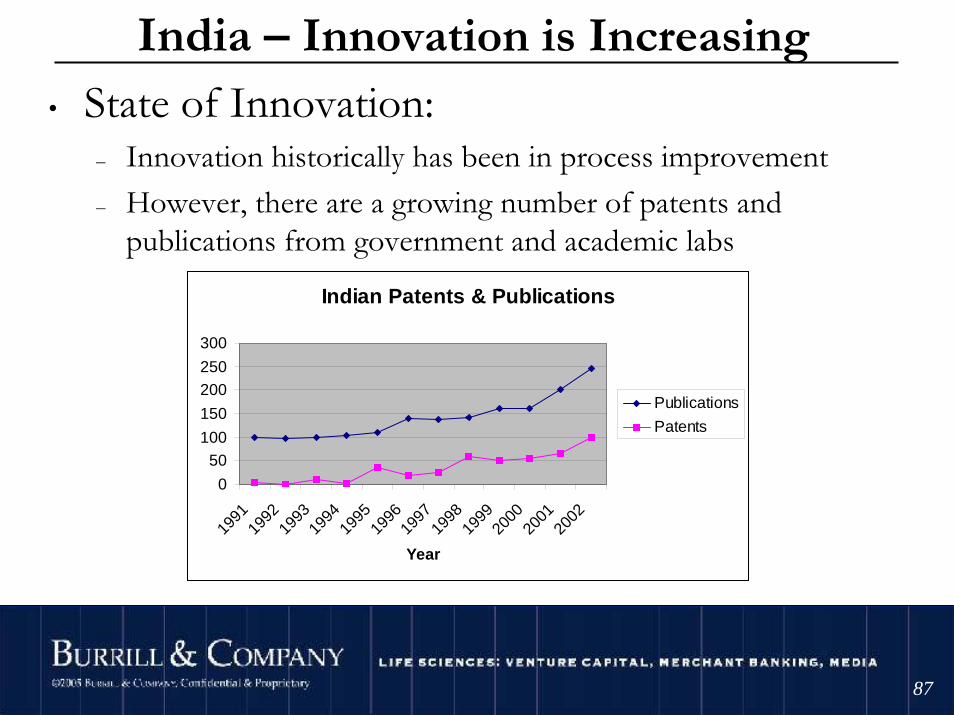
8787
• State of Innovation:– Innovation historically has been in process improvement – However, there are a growing number of patents and
publications from government and academic labs
India – Innovation is Increasing
Indian Patents & Publications
0
50100
150
200250
300
1991
1992
1993
1994
1995
1996
1997
1998
1999
2000
2001
2002
Year
Publications
Patents
-Nature Magazine
©2004 Burrill & Company. Confidential & Proprietary.
8888
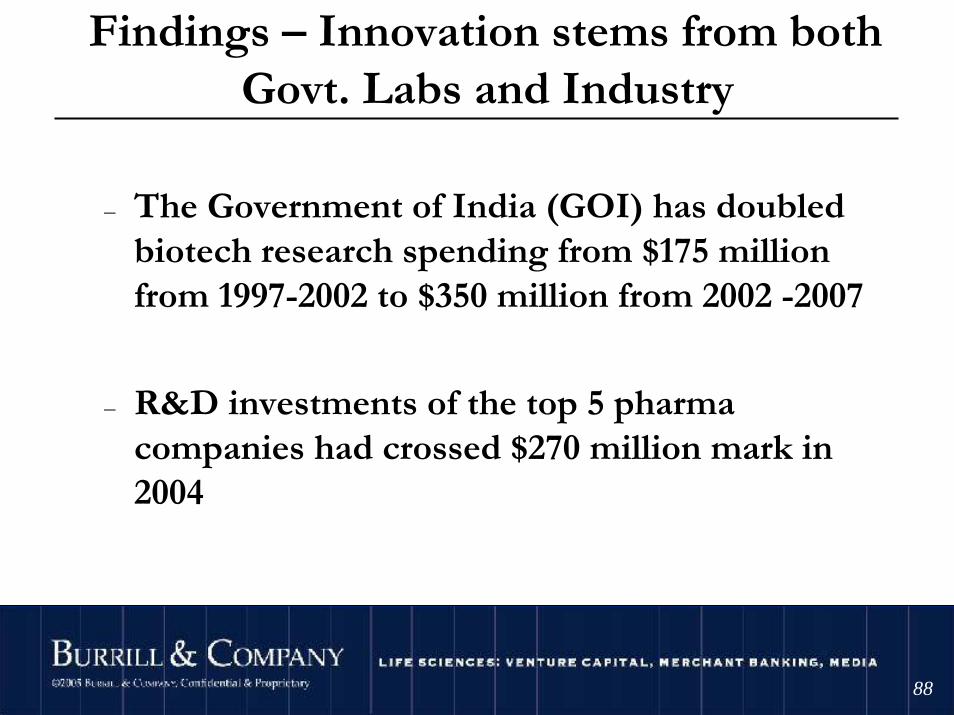
Findings – Innovation stems from bothGovt. Labs and Industry
– The Government of India (GOI) has doubled biotech research spending from $175 million from 1997-2002 to $350 million from 2002 -2007
– R&D investments of the top 5 pharma companies had crossed $270 million mark in 2004
©2004 Burrill & Company. Confidential & Proprietary.
8989
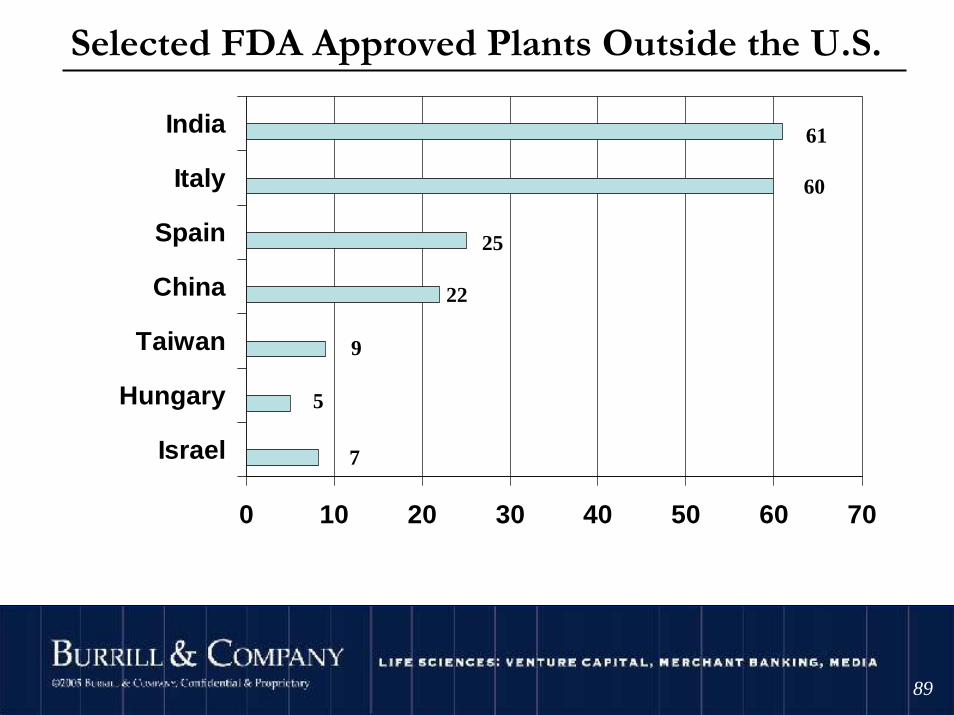
0 10 20 30 40 50 60 70
Israel
Hungary
Taiwan
China
Spain
Italy
India 61
60
25
22
9
5
7
Selected FDA Approved Plants Outside the U.S.
Source: Businessworld Number of Plants
©2004 Burrill & Company. Confidential & Proprietary.
90
Capital Markets
©2004 Burrill & Company. Confidential & Proprietary.
9191
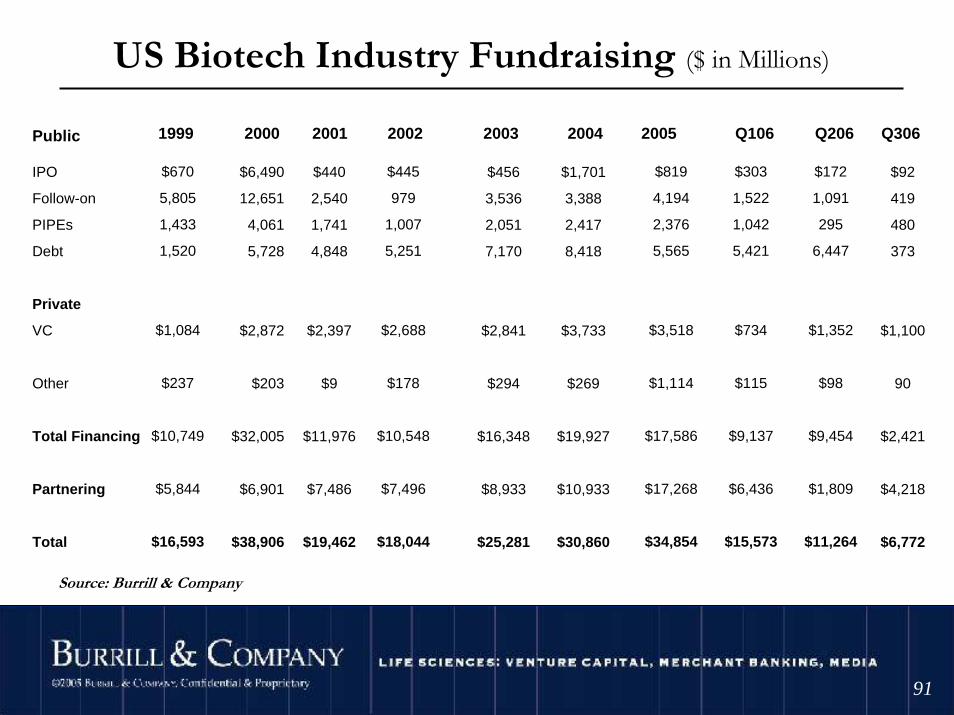
US Biotech Industry Fundraising ($ in Millions)
IPO
Follow-on
PIPEs
Debt
Private
VC
Other
Total Financing
Partnering
Total
$670
5,805
1,433
1,520
$1,084
$237
$10,749
$5,844
$16,593
$6,490
12,651
4,061
5,728
$2,872
$203
$32,005
$6,901
$38,906
$440
2,540
1,741
4,848
$2,397
$9
$11,976
$7,486
$19,462
$445
979
1,007
5,251
$2,688
$178
$10,548
$7,496
$18,044
$456
3,536
2,051
7,170
$2,841
$294
$16,348
$8,933
$25,281
$1,701
3,388
2,417
8,418
$3,733
$269
$19,927
$10,933
$30,860
Public 1999 2000 2001 2002 2003 2004
$819
4,194
2,376
5,565
$3,518
$1,114
$17,586
$17,268
$34,854
2005
Source: Burrill & Company
$303
1,522
1,042
5,421
$734
$115
$9,137
$6,436
$15,573
Q106
$172
1,091
295
6,447
$1,352
$98
$9,454
$1,809
$11,264
$92
419
480
373
$1,100
90
$2,421
$4,218
$6,772
Q206 Q306
©2004 Burrill & Company. Confidential & Proprietary.
9292
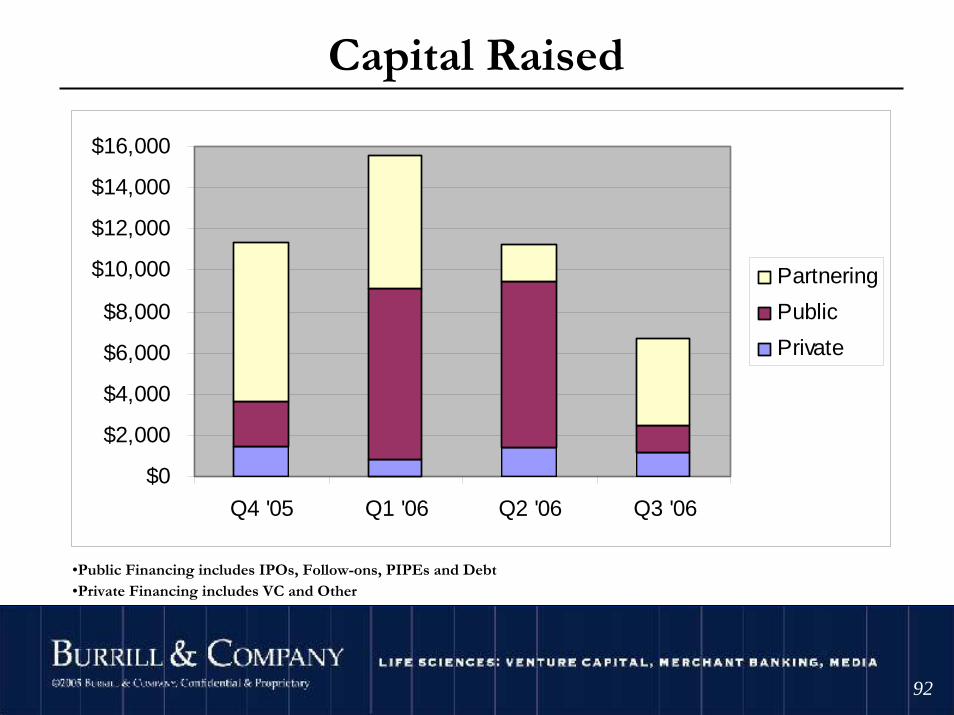
Capital Raised
$0
$2,000
$4,000
$6,000
$8,000
$10,000
$12,000
$14,000
$16,000
Q4 '05 Q1 '06 Q2 '06 Q3 '06
Partnering
Public
Private
•Public Financing includes IPOs, Follow-ons, PIPEs and Debt•Private Financing includes VC and Other
©2004 Burrill & Company. Confidential & Proprietary.
9393
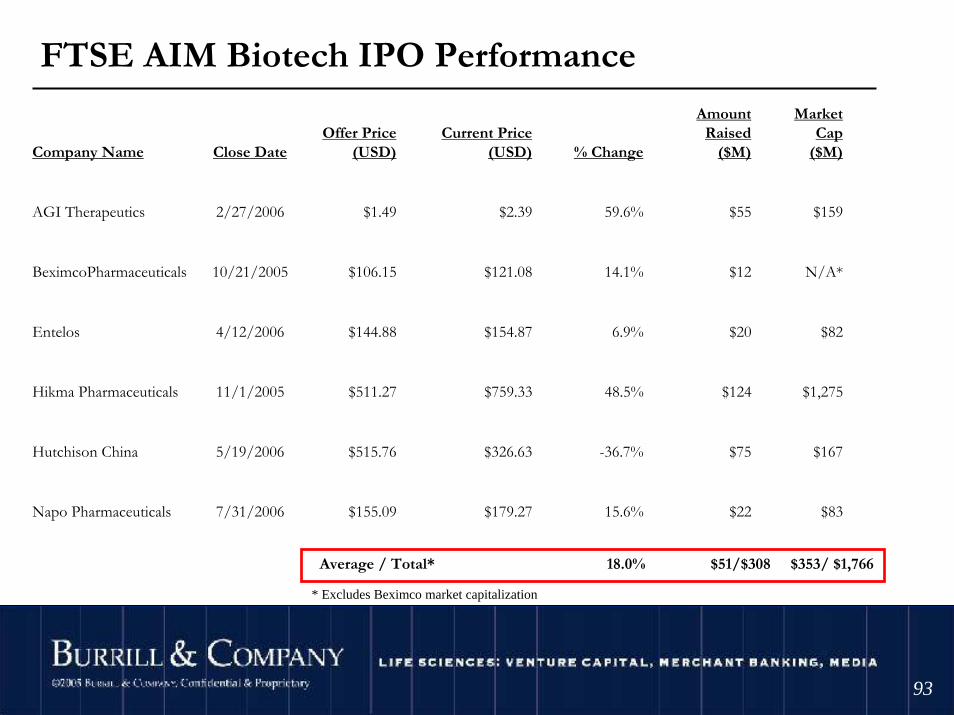
FTSE AIM Biotech IPO Performance
Company Name Close DateOffer Price
(USD)Current Price
(USD) % Change
Amount Raised
($M)
Market Cap
($M)
AGI Therapeutics 2/27/2006 $1.49 $2.39 59.6% $55 $159
BeximcoPharmaceuticals 10/21/2005 $106.15 $121.08 14.1% $12 N/A*
Entelos 4/12/2006 $144.88 $154.87 6.9% $20 $82
Hikma Pharmaceuticals 11/1/2005 $511.27 $759.33 48.5% $124 $1,275
Hutchison China 5/19/2006 $515.76 $326.63 -36.7% $75 $167
Napo Pharmaceuticals 7/31/2006 $155.09 $179.27 15.6% $22 $83
Average / Total* 18.0% $51/$308 $353/ $1,766
* Excludes Beximco market capitalization
©2004 Burrill & Company. Confidential & Proprietary.
9494
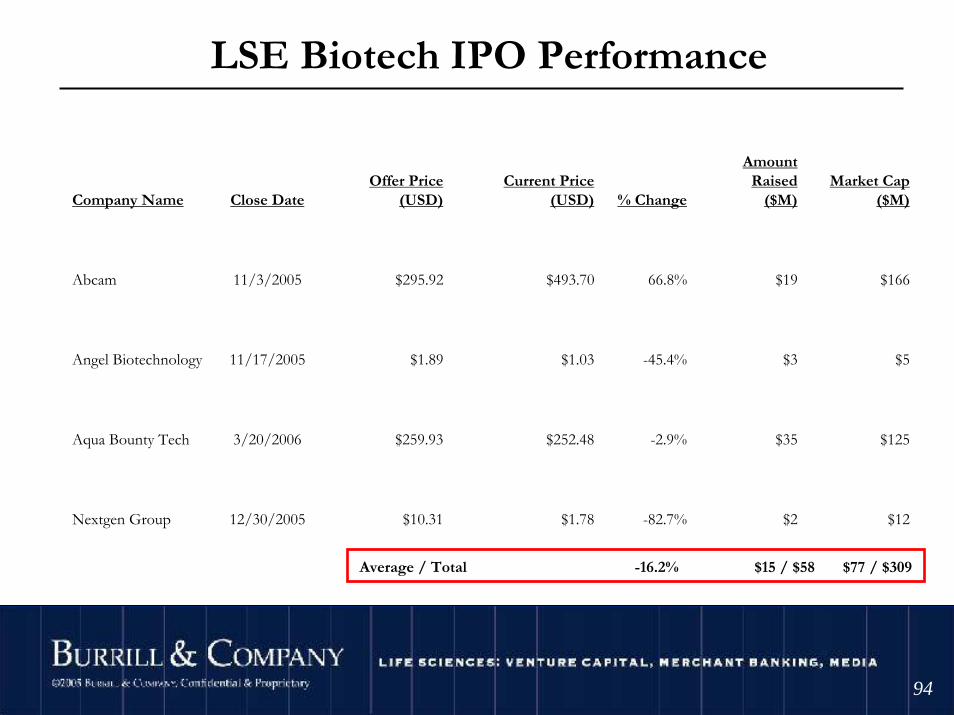
LSE Biotech IPO Performance
Company Name Close DateOffer Price
(USD)Current Price
(USD) % Change
Amount Raised
($M)Market Cap
($M)
Abcam 11/3/2005 $295.92 $493.70 66.8% $19 $166
Angel Biotechnology 11/17/2005 $1.89 $1.03 -45.4% $3 $5
Aqua Bounty Tech 3/20/2006 $259.93 $252.48 -2.9% $35 $125
Nextgen Group 12/30/2005 $10.31 $1.78 -82.7% $2 $12
Average / Total -16.2% $15 / $58 $77 / $309
©2004 Burrill & Company. Confidential & Proprietary.
9595
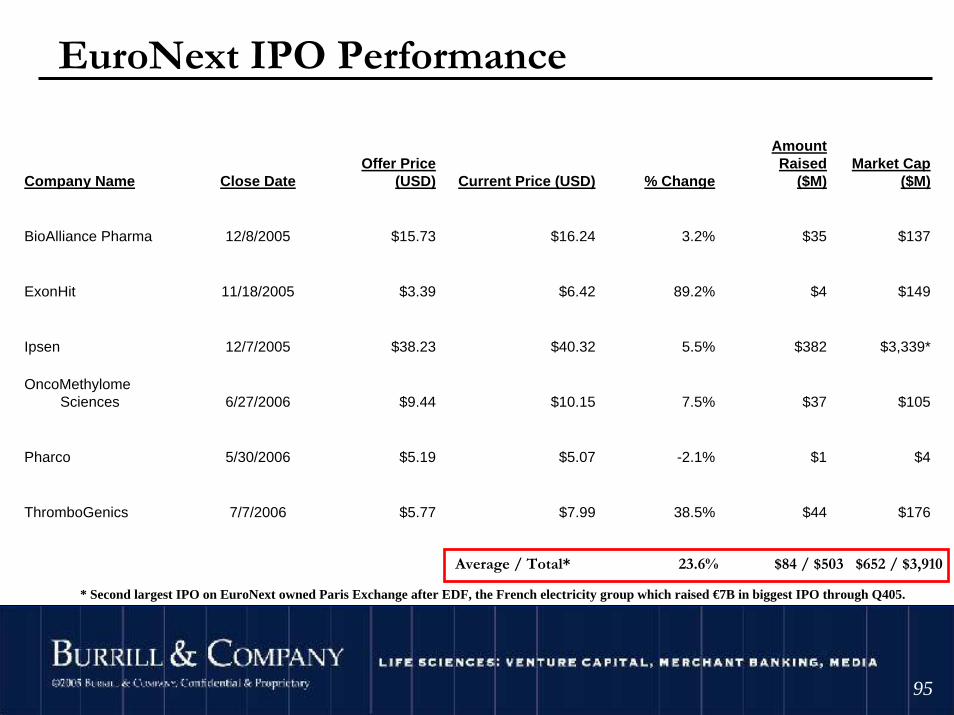
EuroNext IPO Performance
Company Name Close DateOffer Price
(USD) Current Price (USD) % Change
Amount Raised
($M)Market Cap
($M)
BioAlliance Pharma 12/8/2005 $15.73 $16.24 3.2% $35 $137
ExonHit 11/18/2005 $3.39 $6.42 89.2% $4 $149
Ipsen 12/7/2005 $38.23 $40.32 5.5% $382 $3,339*
OncoMethylomeSciences 6/27/2006 $9.44 $10.15 7.5% $37 $105
Pharco 5/30/2006 $5.19 $5.07 -2.1% $1 $4
ThromboGenics 7/7/2006 $5.77 $7.99 38.5% $44 $176
Average / Total* 23.6% $84 / $503 $652 / $3,910
* Second largest IPO on EuroNext owned Paris Exchange after EDF, the French electricity group which raised €7B in biggest IPO through Q405.
©2004 Burrill & Company. Confidential & Proprietary.
9696
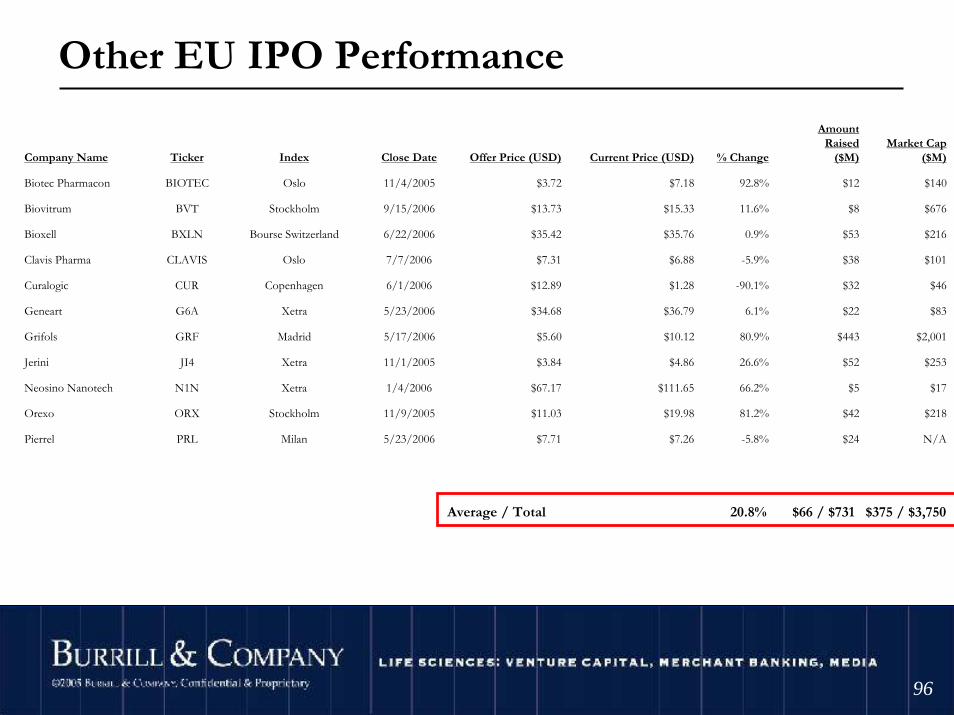
Other EU IPO Performance
Company Name Ticker Index Close Date Offer Price (USD) Current Price (USD) % Change
Amount Raised
($M)Market Cap
($M)
Biotec Pharmacon BIOTEC Oslo 11/4/2005 $3.72 $7.18 92.8% $12 $140
Biovitrum BVT Stockholm 9/15/2006 $13.73 $15.33 11.6% $8 $676
Bioxell BXLN Bourse Switzerland 6/22/2006 $35.42 $35.76 0.9% $53 $216
Clavis Pharma CLAVIS Oslo 7/7/2006 $7.31 $6.88 -5.9% $38 $101
Curalogic CUR Copenhagen 6/1/2006 $12.89 $1.28 -90.1% $32 $46
Geneart G6A Xetra 5/23/2006 $34.68 $36.79 6.1% $22 $83
Grifols GRF Madrid 5/17/2006 $5.60 $10.12 80.9% $443 $2,001
Jerini JI4 Xetra 11/1/2005 $3.84 $4.86 26.6% $52 $253
Neosino Nanotech N1N Xetra 1/4/2006 $67.17 $111.65 66.2% $5 $17
Orexo ORX Stockholm 11/9/2005 $11.03 $19.98 81.2% $42 $218
Pierrel PRL Milan 5/23/2006 $7.71 $7.26 -5.8% $24 N/A
Average / Total 20.8% $66 / $731 $375 / $3,750
©2004 Burrill & Company. Confidential & Proprietary.
9797
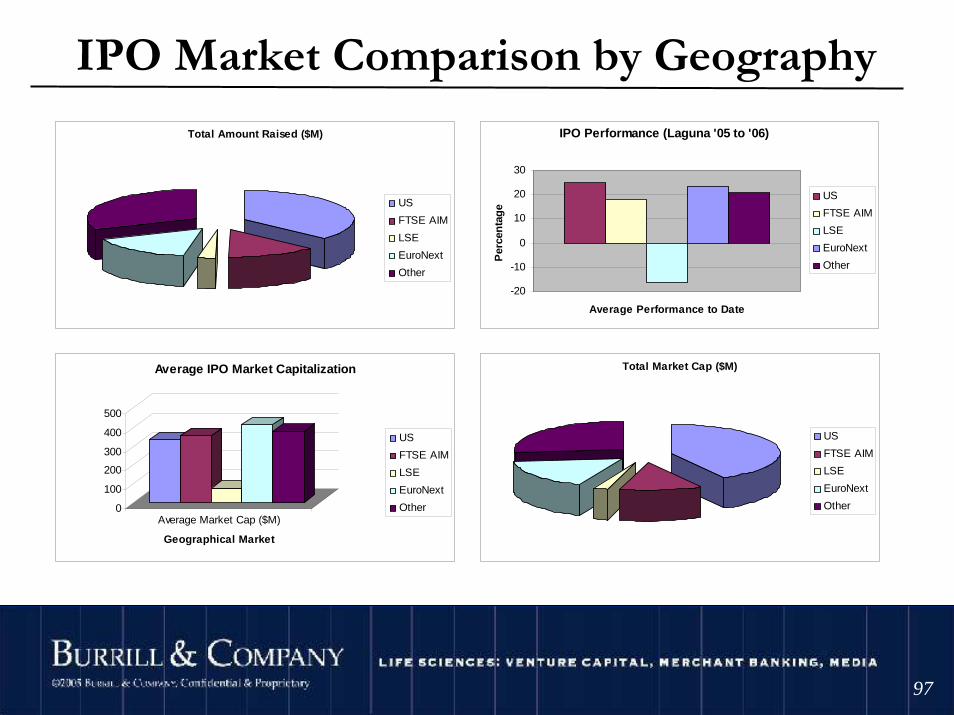
IPO Market Comparison by Geography
Total Amount Raised ($M)
US
FTSE AIM
LSE
EuroNext
Other
IPO Performance (Laguna '05 to '06)
-20
-10
0
10
20
30
Average Performance to Date
Per
cen
tag
e
US
FTSE AIM
LSE
EuroNext
Other
0
100
200
300
400
500
Average Market Cap ($M)
Geographical Market
Average IPO Market Capitalization
US
FTSE AIM
LSE
EuroNext
Other
Total Market Cap ($M)
US
FTSE AIM
LSE
EuroNext
Other
©2004 Burrill & Company. Confidential & Proprietary.
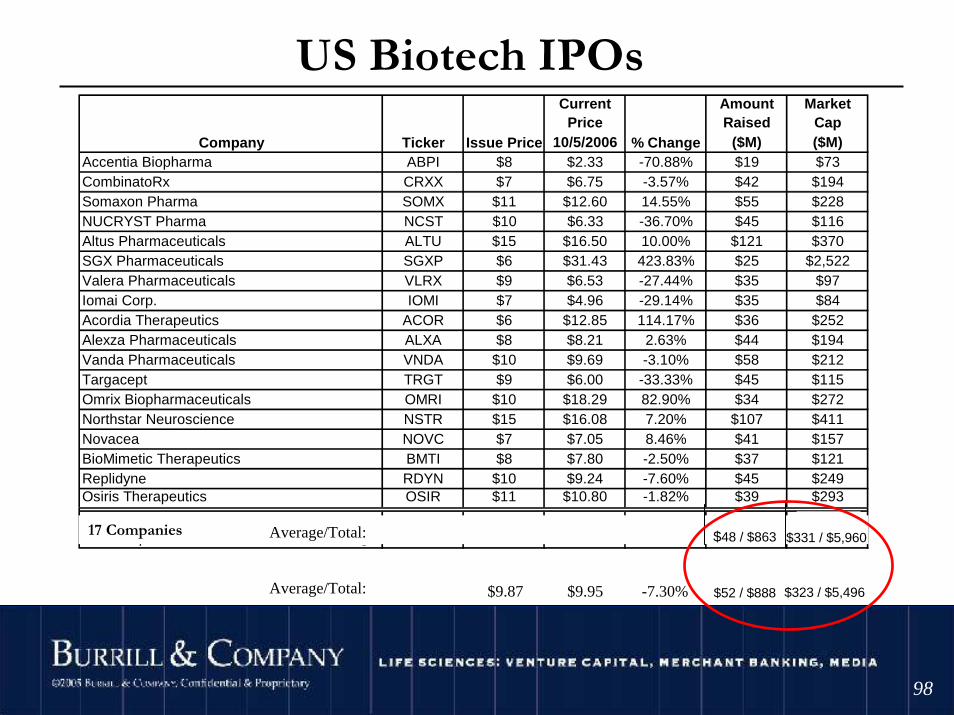
9898
Current Price
Amount Raised
Market Cap
10/5/2006 ($M) ($M)Accentia Biopharma ABPI $8 $2.33 -70.88% $19 $73 CombinatoRx CRXX $7 $6.75 -3.57% $42 $194 Somaxon Pharma SOMX $11 $12.60 14.55% $55 $228 NUCRYST Pharma NCST $10 $6.33 -36.70% $45 $116 Altus Pharmaceuticals ALTU $15 $16.50 10.00% $121 $370 SGX Pharmaceuticals SGXP $6 $31.43 423.83% $25 $2,522 Valera Pharmaceuticals VLRX $9 $6.53 -27.44% $35 $97 Iomai Corp. IOMI $7 $4.96 -29.14% $35 $84 Acordia Therapeutics ACOR $6 $12.85 114.17% $36 $252 Alexza Pharmaceuticals ALXA $8 $8.21 2.63% $44 $194 Vanda Pharmaceuticals VNDA $10 $9.69 -3.10% $58 $212 Targacept TRGT $9 $6.00 -33.33% $45 $115 Omrix Biopharmaceuticals OMRI $10 $18.29 82.90% $34 $272 Northstar Neuroscience NSTR $15 $16.08 7.20% $107 $411 Novacea NOVC $7 $7.05 8.46% $41 $157 BioMimetic Therapeutics BMTI $8 $7.80 -2.50% $37 $121 Replidyne RDYN $10 $9.24 -7.60% $45 $249 Osiris Therapeutics OSIR $11 $10.80 -1.82% $39 $293
18 Companies Average: $9.25 $10.75 24.87% $48 $331
Company Ticker Issue Price % Change
US Biotech IPOs
17 Companies Average/Total:
-7.30% $52 / $888 $323 / $5,496$9.95$9.87
$48 / $863
Average/Total:
$5,960 $331 / $5,960

©2004 Burrill & Company. Confidential & Proprietary.
9999
# of IPOs Amount Raised * Perf. since IPO Ups / Downs
2003 7 $438 M -6% 2 / 5
2004 29 $1,628 M +30% 14 / 14/ 1acq.
2005 17 $819 M +21% 10 / 7
2006 6 $303 M +18% 4 / 2
TOTAL 60 $2,892 M +16% 30 / 29 / 1acq.
IPO Window Summary 2003-2006 (as of 3/31/06)
* Includes over-allotments
©2004 Burrill & Company. Confidential & Proprietary.
100100
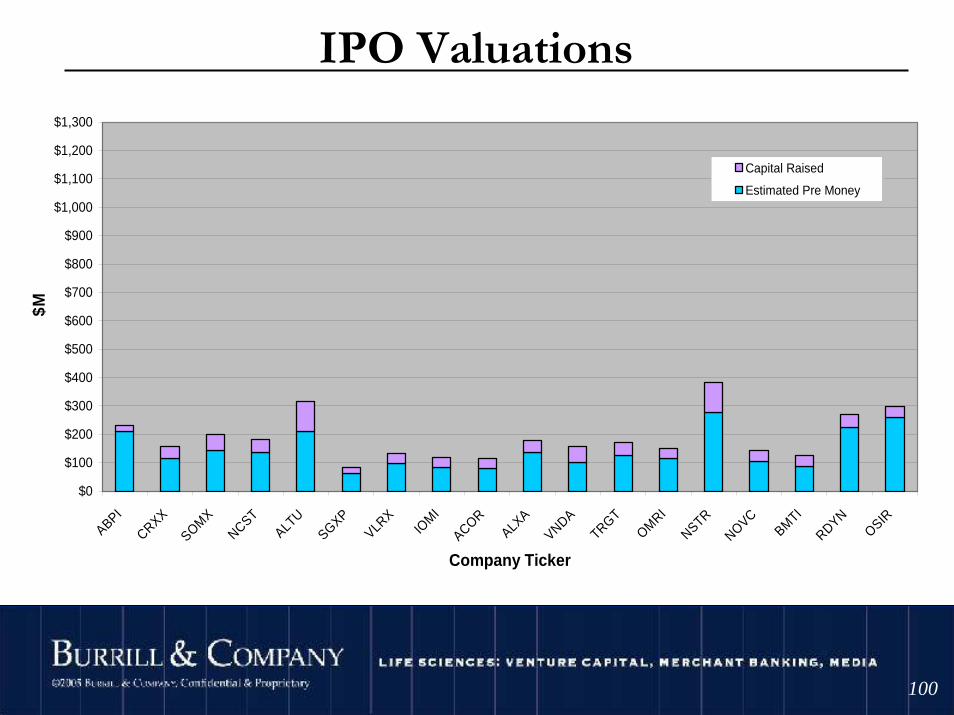
IPO Valuations
$0
$100
$200
$300
$400
$500
$600
$700
$800
$900
$1,000
$1,100
$1,200
$1,300
ABPI
CRXX
SOMX
NCST
ALTU
SGXP
VLRX
IOMI
ACOR
ALXA
VNDA
TRGT
OMRI
NSTR
NOVC
BMTI
RDYN
OSIR
Company Ticker
$M
Capital Raised
Estimated Pre Money
©2004 Burrill & Company. Confidential & Proprietary.
101101
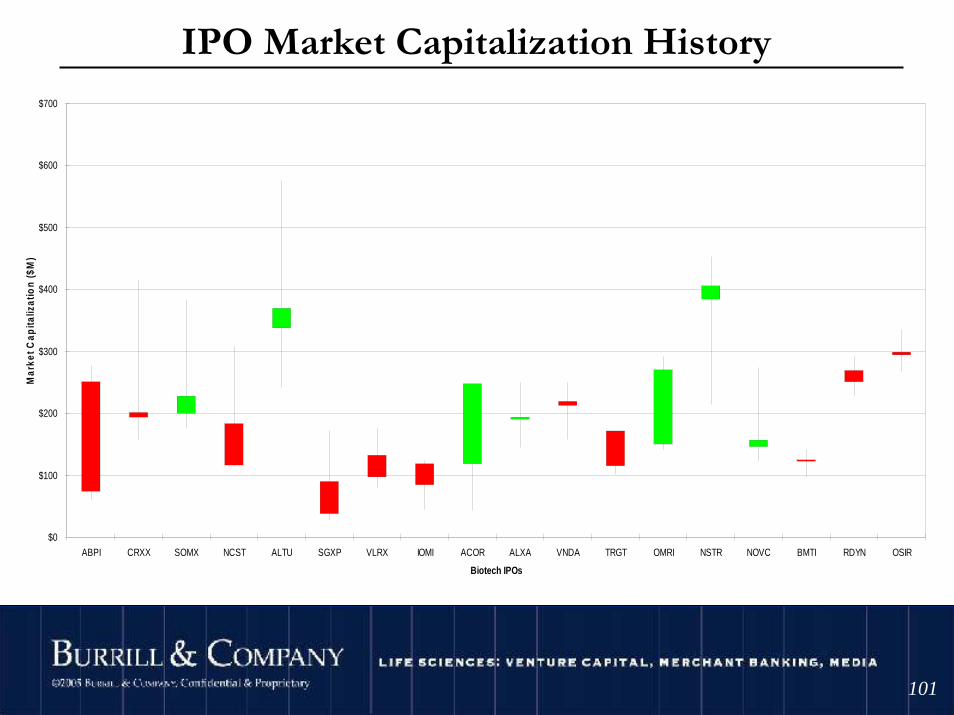
IPO Market Capitalization History
$0
$100
$200
$300
$400
$500
$600
$700
ABPI CRXX SOMX NCST ALTU SGXP VLRX IOMI ACOR ALXA VNDA TRGT OMRI NSTR NOVC BMTI RDYN OSIR
Biotech IPOs
Mar
ket C
apita
lizat
ion
($M
)

©2004 Burrill & Company. Confidential & Proprietary.
102102
• Surge in M&A for US and European biotechs/pharma, changing tactics
• US saw first attempt at hostile takeover (AnorMed rebuffs GENZ, courted by MLNM)
– European M&A competition even higher, survival for mid-sized players
• Expiring patents, encroaching generics, pipeline shortages– Includes enabling tech, not just pipelines
• More global access to capital– More companies choosing to IPO on AIM (~250 companies listed),
and other non-US markets– Interest in biotech from hedge funds– US IPOs slow pace, number of PIPEs continues climb
Financing Events
©2004 Burrill & Company. Confidential & Proprietary.
103103
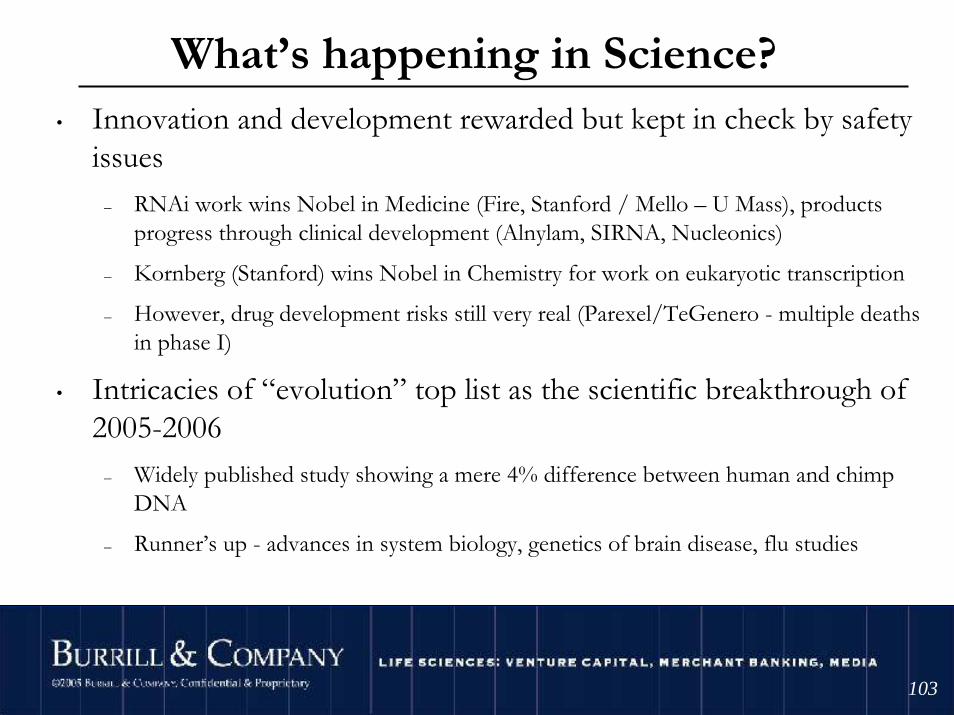
• Innovation and development rewarded but kept in check by safety issues
– RNAi work wins Nobel in Medicine (Fire, Stanford / Mello – U Mass), products progress through clinical development (Alnylam, SIRNA, Nucleonics)
– Kornberg (Stanford) wins Nobel in Chemistry for work on eukaryotic transcription
– However, drug development risks still very real (Parexel/TeGenero - multiple deaths in phase I)
• Intricacies of “evolution” top list as the scientific breakthrough of 2005-2006
– Widely published study showing a mere 4% difference between human and chimp DNA
– Runner’s up - advances in system biology, genetics of brain disease, flu studies
What’s happening in Science?
©2004 Burrill & Company. Confidential & Proprietary.
104104
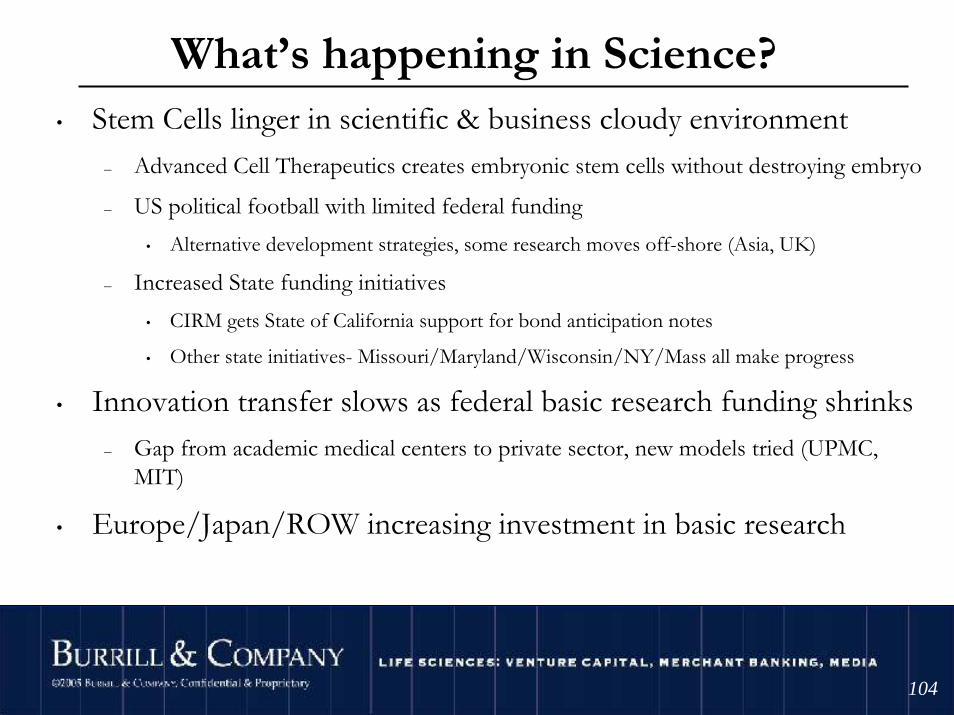
• Stem Cells linger in scientific & business cloudy environment– Advanced Cell Therapeutics creates embryonic stem cells without destroying embryo
– US political football with limited federal funding• Alternative development strategies, some research moves off-shore (Asia, UK)
– Increased State funding initiatives• CIRM gets State of California support for bond anticipation notes
• Other state initiatives- Missouri/Maryland/Wisconsin/NY/Mass all make progress
• Innovation transfer slows as federal basic research funding shrinks– Gap from academic medical centers to private sector, new models tried (UPMC,
MIT)
• Europe/Japan/ROW increasing investment in basic research
What’s happening in Science?

©2004 Burrill & Company. Confidential & Proprietary.
105105
• Complexity of product approvals, market re-entry– FDA approval of 1st Follow-On-Biologic lagged behind EMEA
approval (Omnitrope, Sandoz) but precedent now set (BioSimilars/BioGenerics)
– In-Vitro Diagnostic Multivariate Index Assays (IVDMIAs) may require FDA approval vs. CLIA certification
– Theragnostics– how to find responsive population for best outcomes– Drug safety and pharmacovigilence
• Tysabri re-enters but Bayer hides Trasylol data – IOM report on drug safety- tougher challenges for industry– Off label promotion strenuously challenged– CMS/FDA comparative studies
Regulatory Events

©2004 Burrill & Company. Confidential & Proprietary.
106106
• Hostile US regulatory environment for small companies continues– Sarbanes-Oxley’s excessive burden (section 404)– SBIR grants challenged– SEC disclosure / corporate governance requirements– Costs for listing in U.K. are lower than the U.S.
• Challenges of Part B (prescription drug benefit for seniors)• Medicare Modernization Act incentives for companies seeking to
address costs for expanding aging market• Leadership changes at CMS (McClellan announced departure)• Leadership approval pending at FDA (Andy von Eschenbach)
– Top Women’s Health official Susan Wood quits over Plan B which year later gets approved
• FDA’s New Drug Safety & Critical Path Initiatives- will the approval rate freeze?
Regulatory Events
©2004 Burrill & Company. Confidential & Proprietary.
107107
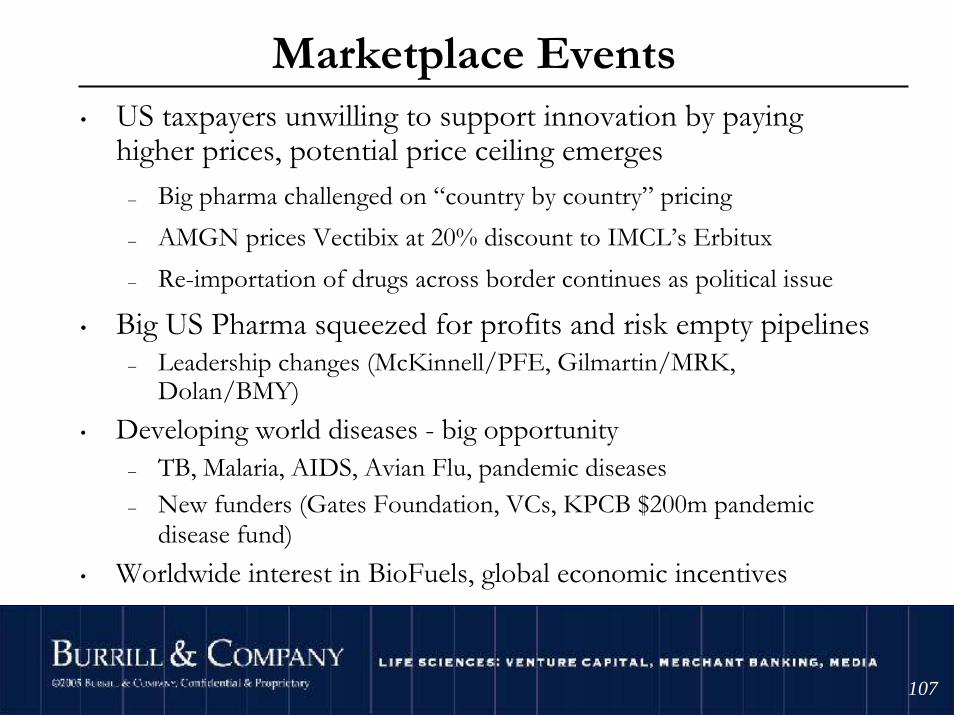
• US taxpayers unwilling to support innovation by paying higher prices, potential price ceiling emerges
– Big pharma challenged on “country by country” pricing– AMGN prices Vectibix at 20% discount to IMCL’s Erbitux– Re-importation of drugs across border continues as political issue
• Big US Pharma squeezed for profits and risk empty pipelines– Leadership changes (McKinnell/PFE, Gilmartin/MRK,
Dolan/BMY)• Developing world diseases - big opportunity
– TB, Malaria, AIDS, Avian Flu, pandemic diseases– New funders (Gates Foundation, VCs, KPCB $200m pandemic
disease fund)• Worldwide interest in BioFuels, global economic incentives
Marketplace Events
©2004 Burrill & Company. Confidential & Proprietary.
108108
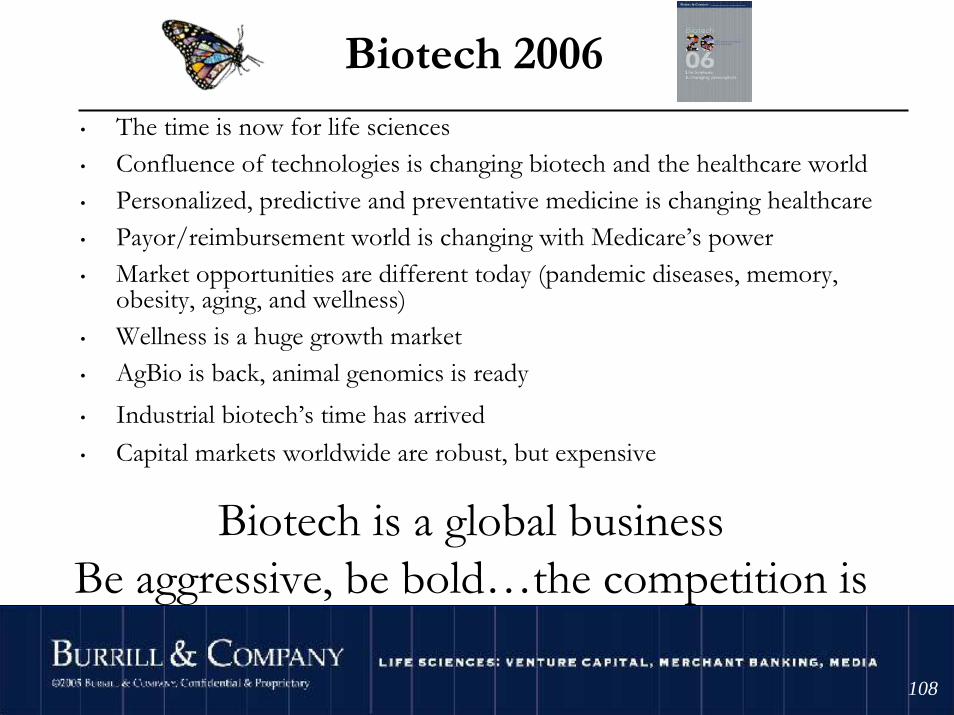
• The time is now for life sciences• Confluence of technologies is changing biotech and the healthcare world• Personalized, predictive and preventative medicine is changing healthcare• Payor/reimbursement world is changing with Medicare’s power• Market opportunities are different today (pandemic diseases, memory,
obesity, aging, and wellness)• Wellness is a huge growth market• AgBio is back, animal genomics is ready• Industrial biotech’s time has arrived• Capital markets worldwide are robust, but expensive
Biotech 2006
Biotech is a global businessBe aggressive, be bold…the competition is
©2004 Burrill & Company. Confidential & Proprietary.
109
the next 12 months will be interesting!
Biotech’s on a roll…

©2004 Burrill & Company. Confidential & Proprietary.
110110
Biotech 2006Life Sciences: A Changing Prescription
NY Pharma
October 19th, 2006
G. Steven Burrill, CEOBurrill & Company


![First part: Deep Learning for Speech recognition · 2017. 4. 4. · a guy on a skate board on the side of a ramp [bear (0.71)] (elephant (0.99jl [brown (0.6B)) [baby [laying (0.61))](https://img.pdfslide.us/doc/110x75/60368da64232a67aab24f1b4/first-part-deep-learning-for-speech-recognition-2017-4-4-a-guy-on-a-skate.jpg)