Embed Size (px)
Citation preview
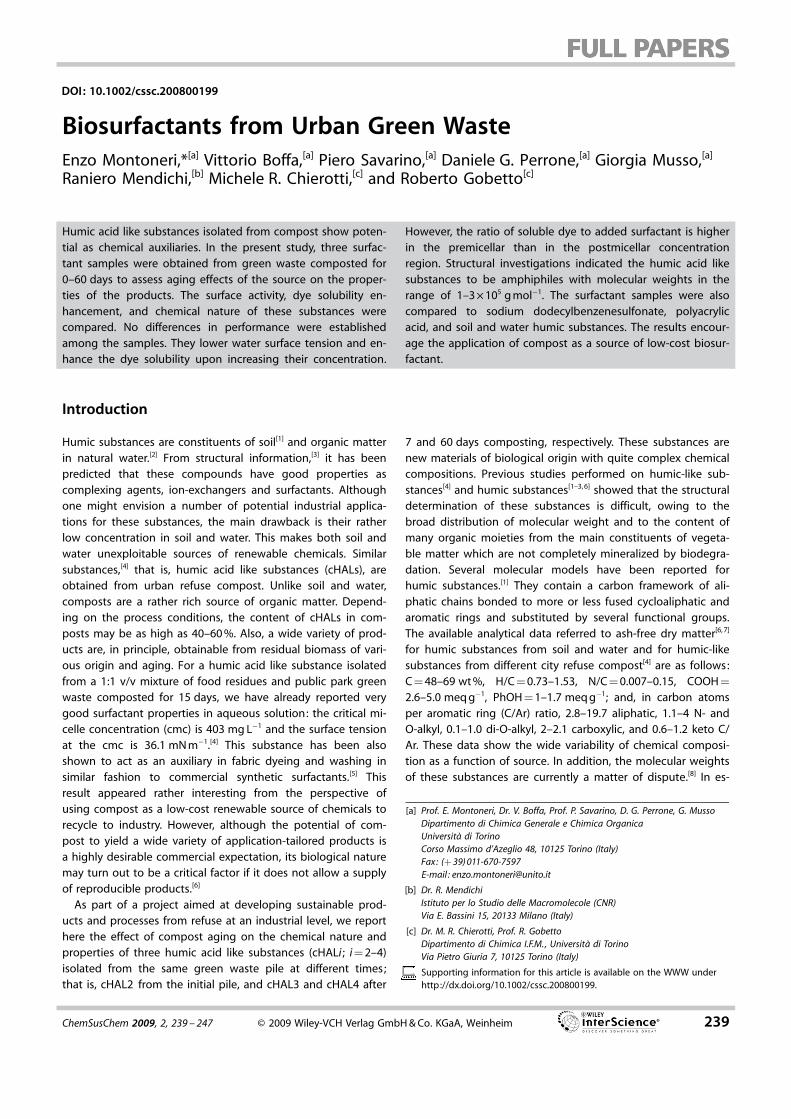
DOI: 10.1002/cssc.200800199
Biosurfactants from Urban Green WasteEnzo Montoneri,*[a] Vittorio Boffa,[a] Piero Savarino,[a] Daniele G. Perrone,[a] Giorgia Musso,[a]
Raniero Mendichi,[b] Michele R. Chierotti,[c] and Roberto Gobetto[c]
Introduction
Humic substances are constituents of soil[1] and organic matterin natural water.[2] From structural information,[3] it has beenpredicted that these compounds have good properties ascomplexing agents, ion-exchangers and surfactants. Althoughone might envision a number of potential industrial applica-tions for these substances, the main drawback is their ratherlow concentration in soil and water. This makes both soil andwater unexploitable sources of renewable chemicals. Similarsubstances,[4] that is, humic acid like substances (cHALs), areobtained from urban refuse compost. Unlike soil and water,composts are a rather rich source of organic matter. Depend-ing on the process conditions, the content of cHALs in com-posts may be as high as 40–60 %. Also, a wide variety of prod-ucts are, in principle, obtainable from residual biomass of vari-ous origin and aging. For a humic acid like substance isolatedfrom a 1:1 v/v mixture of food residues and public park greenwaste composted for 15 days, we have already reported verygood surfactant properties in aqueous solution: the critical mi-celle concentration (cmc) is 403 mg L
�1 and the surface tensionat the cmc is 36.1 mN m�1.[4] This substance has been alsoshown to act as an auxiliary in fabric dyeing and washing insimilar fashion to commercial synthetic surfactants.[5] Thisresult appeared rather interesting from the perspective ofusing compost as a low-cost renewable source of chemicals torecycle to industry. However, although the potential of com-post to yield a wide variety of application-tailored products isa highly desirable commercial expectation, its biological naturemay turn out to be a critical factor if it does not allow a supplyof reproducible products.[6]
As part of a project aimed at developing sustainable prod-ucts and processes from refuse at an industrial level, we reporthere the effect of compost aging on the chemical nature andproperties of three humic acid like substances (cHALi ; i = 2–4)isolated from the same green waste pile at different times;that is, cHAL2 from the initial pile, and cHAL3 and cHAL4 after
7 and 60 days composting, respectively. These substances arenew materials of biological origin with quite complex chemicalcompositions. Previous studies performed on humic-like sub-stances[4] and humic substances[1–3, 6] showed that the structuraldetermination of these substances is difficult, owing to thebroad distribution of molecular weight and to the content ofmany organic moieties from the main constituents of vegeta-ble matter which are not completely mineralized by biodegra-dation. Several molecular models have been reported forhumic substances.[1] They contain a carbon framework of ali-phatic chains bonded to more or less fused cycloaliphatic andaromatic rings and substituted by several functional groups.The available analytical data referred to ash-free dry matter[6, 7]
for humic substances from soil and water and for humic-likesubstances from different city refuse compost[4] are as follows:C = 48–69 wt %, H/C = 0.73–1.53, N/C = 0.007–0.15, COOH =
2.6–5.0 meq g�1, PhOH = 1–1.7 meq g�1; and, in carbon atomsper aromatic ring (C/Ar) ratio, 2.8–19.7 aliphatic, 1.1–4 N- andO-alkyl, 0.1–1.0 di-O-alkyl, 2–2.1 carboxylic, and 0.6–1.2 keto C/Ar. These data show the wide variability of chemical composi-tion as a function of source. In addition, the molecular weightsof these substances are currently a matter of dispute.[8] In es-
[a] Prof. E. Montoneri, Dr. V. Boffa, Prof. P. Savarino, D. G. Perrone, G. MussoDipartimento di Chimica Generale e Chimica OrganicaUniversit� di TorinoCorso Massimo d’Azeglio 48, 10125 Torino (Italy)Fax: (+ 39) 011-670-7597E-mail : [email protected]
[b] Dr. R. MendichiIstituto per lo Studio delle Macromolecole (CNR)Via E. Bassini 15, 20133 Milano (Italy)
[c] Dr. M. R. Chierotti, Prof. R. GobettoDipartimento di Chimica I.F.M., Universit� di TorinoVia Pietro Giuria 7, 10125 Torino (Italy)
Supporting information for this article is available on the WWW underhttp://dx.doi.org/10.1002/cssc.200800199.
Humic acid like substances isolated from compost show poten-tial as chemical auxiliaries. In the present study, three surfac-tant samples were obtained from green waste composted for0–60 days to assess aging effects of the source on the proper-ties of the products. The surface activity, dye solubility en-hancement, and chemical nature of these substances werecompared. No differences in performance were establishedamong the samples. They lower water surface tension and en-hance the dye solubility upon increasing their concentration.
However, the ratio of soluble dye to added surfactant is higherin the premicellar than in the postmicellar concentrationregion. Structural investigations indicated the humic acid likesubstances to be amphiphiles with molecular weights in therange of 1–3 � 105 g mol�1. The surfactant samples were alsocompared to sodium dodecylbenzenesulfonate, polyacrylicacid, and soil and water humic substances. The results encour-age the application of compost as a source of low-cost biosur-factant.
ChemSusChem 2009, 2, 239 – 247 � 2009 Wiley-VCH Verlag GmbH & Co. KGaA, Weinheim 239
sence, it is not proven yetwhether these substances arehigh-molecular-weight polymersor aggregates of small mole-cules. Values over a wide molec-ular weight range (102–108 g mol�1) have been pub-lished[9] for commercial Aldrichhumic acid. For the as-pur-chased product, the molecularweight and the root-mean-square radius were estimated tobe 1.2 � 108 g mol�1 and436.0 nm, respectively, usingmultiangle laser light scattering(MALS). However, for humic acideluted through a size-exclusionchromatography (SEC) column,three peaks in the 1000–30000 g mol�1 range were ob-tained. The lower molecularweight of the fractionated prod-uct led the authors to concludethat humic acid contains aggre-gates of small molecules heldtogether by electrostatic forces and/or hydrogen bonds. Thecontroversy surrounding the molecular weight is not only aca-demic but it involves also expectations or explanations forproperties and, therefore, also for product performance in theintended applications. Under these circumstances, to charac-terize our cHAL2–4 substances, we performed chemical com-position studies as well as surface tension and dynamic lightscattering (DLS) measurements. In addition, to help interpretthe experimental data collected for the above humic acid likesubstances, we performed the same measurements on fourother known materials, namely, Aldrich humic acid (HA) repre-senting major commercial humic acids[6] of biological origin,sodium dodecylbenzenesulfonate (SDBS) representing synthet-ic small-molecule surfactants, and two polyacrylic acids (poly-acrylic acid, PAA; and polyacrylamide, PAM) representing typi-cal synthetic polymeric molecules that have similar carboxylicfunctional groups to the cHAL2–4 and HA substances.
Results
Chemical Composition and Molecular Weight
Table 1 reports the result of our chemical analyses performedon HA and on cHAL2–4. For each substance, the reportedvalues are the averages of determinations performed on fivesamples isolated from the same source of biowaste. The stan-dard deviation values reported in the Experimental Section areestimates of the variability due to the sum of three factors,that is, the homogeneity of the source of biowaste material,the reproducibility of the isolation procedure, and the analyti-cal techniques. The standard deviation for the carbon distribu-tion data is about five times higher than that of microanalytical
data, as a result of the contribution of the potentiometric andNMR spectroscopic measurements to the former. Nevertheless,the differences observed over the three cHALi substances,either for the microanalytical and for most of the carbon types,are above the standard deviation values. This allows us toassess the significant dependence of the chemical nature ofthe isolated cHALi substance on the source of biowaste materi-al.
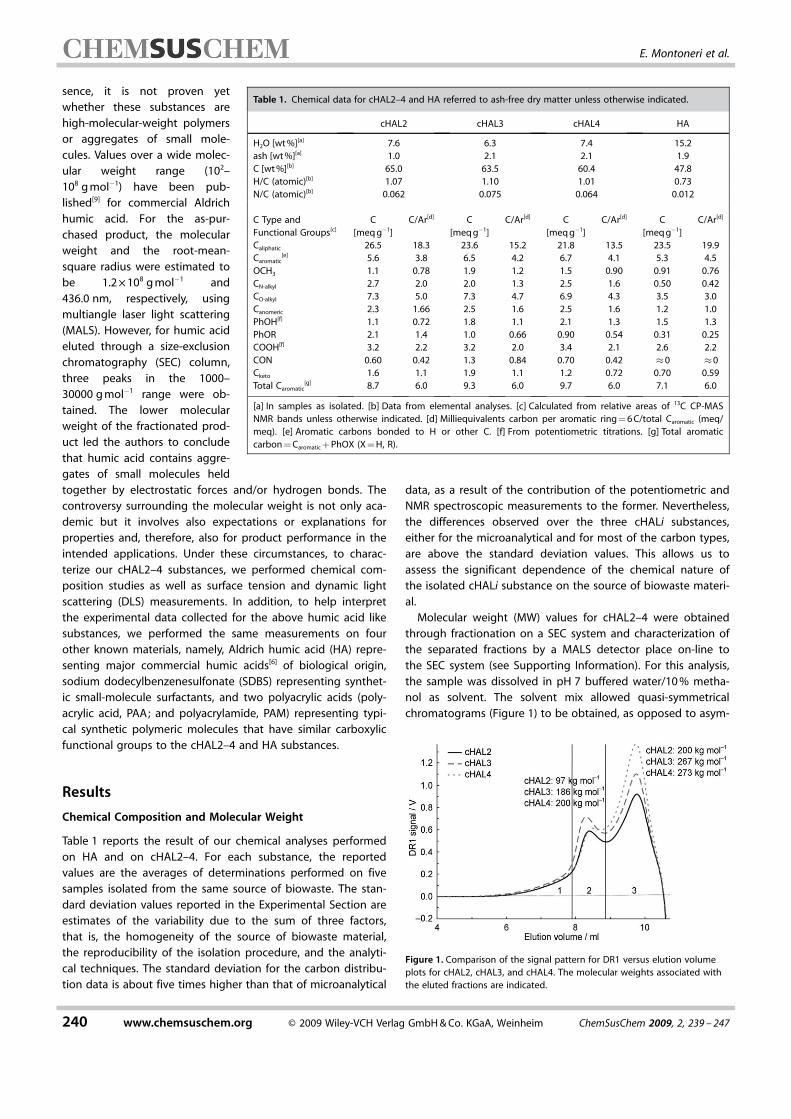
Molecular weight (MW) values for cHAL2–4 were obtainedthrough fractionation on a SEC system and characterization ofthe separated fractions by a MALS detector place on-line tothe SEC system (see Supporting Information). For this analysis,the sample was dissolved in pH 7 buffered water/10 % metha-nol as solvent. The solvent mix allowed quasi-symmetricalchromatograms (Figure 1) to be obtained, as opposed to asym-
Table 1. Chemical data for cHAL2–4 and HA referred to ash-free dry matter unless otherwise indicated.
cHAL2 cHAL3 cHAL4 HA
H2O [wt %][a] 7.6 6.3 7.4 15.2ash [wt %][a] 1.0 2.1 2.1 1.9C [wt %][b] 65.0 63.5 60.4 47.8H/C (atomic)[b] 1.07 1.10 1.01 0.73N/C (atomic)[b] 0.062 0.075 0.064 0.012
C Type andFunctional Groups[c]
CACHTUNGTRENNUNG[meq g�1]C/Ar[d] CACHTUNGTRENNUNG[meq g�1]
C/Ar[d] CACHTUNGTRENNUNG[meq g�1]C/Ar[d] CACHTUNGTRENNUNG[meq g�1]
C/Ar[d]
Caliphatic 26.5 18.3 23.6 15.2 21.8 13.5 23.5 19.9Caromatic
[e] 5.6 3.8 6.5 4.2 6.7 4.1 5.3 4.5OCH3 1.1 0.78 1.9 1.2 1.5 0.90 0.91 0.76CN-alkyl 2.7 2.0 2.0 1.3 2.5 1.6 0.50 0.42CO-alkyl 7.3 5.0 7.3 4.7 6.9 4.3 3.5 3.0Canomeric 2.3 1.66 2.5 1.6 2.5 1.6 1.2 1.0PhOH[f] 1.1 0.72 1.8 1.1 2.1 1.3 1.5 1.3PhOR 2.1 1.4 1.0 0.66 0.90 0.54 0.31 0.25COOH[f] 3.2 2.2 3.2 2.0 3.4 2.1 2.6 2.2CON 0.60 0.42 1.3 0.84 0.70 0.42 �0 �0Cketo 1.6 1.1 1.9 1.1 1.2 0.72 0.70 0.59Total Caromatic
[g] 8.7 6.0 9.3 6.0 9.7 6.0 7.1 6.0
[a] In samples as isolated. [b] Data from elemental analyses. [c] Calculated from relative areas of 13C CP-MASNMR bands unless otherwise indicated. [d] Milliequivalents carbon per aromatic ring = 6 C/total Caromatic (meq/meq). [e] Aromatic carbons bonded to H or other C. [f] From potentiometric titrations. [g] Total aromaticcarbon = Caromatic + PhOX (X = H, R).
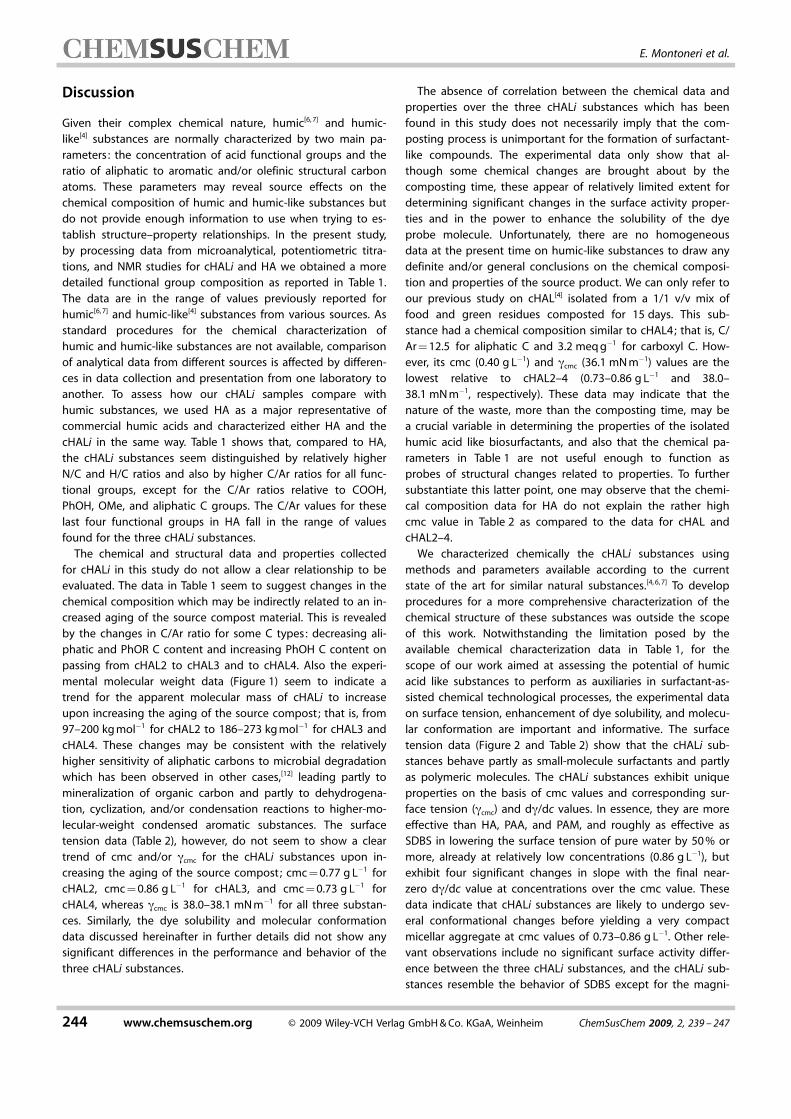
Figure 1. Comparison of the signal pattern for DR1 versus elution volumeplots for cHAL2, cHAL3, and cHAL4. The molecular weights associated withthe eluted fractions are indicated.
240 www.chemsuschem.org � 2009 Wiley-VCH Verlag GmbH & Co. KGaA, Weinheim ChemSusChem 2009, 2, 239 – 247
E. Montoneri et al.
metrical long-tail chromatograms obtained in the purely aque-ous solvent. This fact suggested minimization of any presuma-ble molecular aggregation during column elution by the alco-holic aqueous solvent. With water-soluble synthetic acrylic co-polymers that are capable of yielding large aggregates of mac-romolecules, symmetrical chromatograms have been shown toarise from single non-aggregated polymer molecules.[10]
Each cHALi chromatogram contains two major bands withpeaks (Figure 1) corresponding to molecular weights of 97–300 kg mol�1. Upon comparing the three chromatograms, oneobserves that peaks with similar elution volume arise fromfractions with very different molecular weight. This occurs be-cause the chromatographic separation occurs on the basis ofmolecular size and not necessarily of molecular weight. Mole-cules with similar size may have different conformations andtherefore different molecular weights too. For example, thefact that cHAL2 has the same elution time pattern as cHAL3and cHAL4 but a significantly lower molecular weight impliesthat the former substance has a less compact conformationthan the other two. For each of the three substances, theeluted fractions accounted for 86–90 % of the total samplemass. The online MALS analysis allowed the gyration radius(Rg) to be determined of each molecular mass after elution inthe SEC column. The plots of the Rg = f(MW) experimental func-tion (see Supporting Information) revealed the gyration radiusto be 10–25 nm for the three cHALi samples.
Surface Tension Measurements
The surface tension was measured for all substances listed inFigure 2 and Table 2. The data reported in Figure 2 a show thatcHALi and HA behave partly as SDBS and partly as PAA andPAM. Similar to SDBS, the g versus concentration plots forcHALi and HA solutions reach a well-defined plateau, whereasthe plots for the strongly hydrophilic PAA and PAM solutionsdo not flatten out. On the other hand, unlike SDBS which ex-hibits one sharp slope change at around 0.5 g L
�1, cHALi and
HA feature several slope changes. To show quantitatively thedifference between these substances, each plot in Figure 2 awas divided into four tracts, which were analyzed by linear re-gression analysis (see Table 2). The calculated values for thestandard deviation of the slopes and for the linear regressioncoefficient reveal that linearity is maintained in all cases,expect for the fourth tracts of the cHALi and HA plots wherethe slope values are not significantly different from zero.
Figure 2. Variation in surface tension (g) and dye solubility (DS) as a functionof added substance concentration for aqueous solutions containing SDBS,cHALi, PAA, PAM, or HA. The experimental point values for dye solubility arereported in the Supporting Information.
Table 2. Data extrapolated from g versus c plots in Figure 2.[a]
Data SDBS cHAL2 cHAL3 cHAL4 HA PAA PAM
�dg1/dc [mN L m�1 g�1] 61.1�3.0 71.9�9.9 147.7�27 75.1�6.4 52.8�4.8 3.7�0.11 124�45R1 0.997 0.985 0.995 0.988 0.960 0.991 0.875�dg2/dc [mN L m�1 g�1] 56.7�1.1 20.2�1.4 22.8�1.2 11.1�0.6 10.1�0.4 9.2�0.83 7.0�0.07R2 0.994 0.990 0.989 0.990 0.983 0.980 0.999�dg3/dc [mN L m�1 g�1] 22.1�2.4 6.32�0.30 4.51�0.28 2.52�0.52 3.0�0.19 5.2�0.26 2.8�0.11R3 0.982 0.985 0.966 0.880 0.991 0.987 0.988�dg4/dc [mN L m�1 g�1] 0.52�0.06 0.03�0.01 0.04�0.02 0.03�0.05 0.1�0.3 1.6�0.07 1.1�0.05R4 0.940 [b] [b] [b] [b] 0.992 0.976
pmc1-2 [g L�1][c] 0.08 0.089 0.055 0.11 0.18 1.57 0.17
pmc2-3 [g L�1][c] 0.32 0.28 0.27 0.39 0.79 2.71 2.59
cmc3-4 [g L�1][c] 0.52 0.77 0.86 0.73 1.53 3.59 4.22
gpmc1-2 [mN m�1][c] 49.8 44.9 45.6 41.9 55.80 65.8 53.3gpmc2-3 [mN m�1][c] 38.3 41.1 40.7 38.9 49.74 55.3 36.3gcmc3-4 [mN m�1][c] 34.6 38.0 38.0 38.1 47.48 50.8 31.7
[a] Slope values and their standard deviations for four linear tracts (dgi/dc, i = 1–4), associated linear regression coefficient (Ri, i = 1–4), concentrations atwhich slope changes occur (pmc1-2, pmc2-3, and cmc3-4 ; see footnote [c]), surface tension values at slope change points (gpmc1-2, gpmc2-3, and gcmc3-4).[b] Not significant. [c] Values obtained at the intersection of the following tracts : 1 and 2 for pmc1-2 and gpmc1-2 ; 2 and 3 for pmc2-3 and gpmc2-3 ; 3 and 4for cmc3-4 and gcmc3-4.
ChemSusChem 2009, 2, 239 – 247 � 2009 Wiley-VCH Verlag GmbH & Co. KGaA, Weinheim www.chemsuschem.org 241
Biosurfactants from Urban Waste
Dye Solubility Measurements
The solubility of disperse red 1 (DR1) dye in water in the samesolutions analyzed for surface tension is reported in Figure 2 b.The results show that the three cHALi substances, which yieldsimilar dye solubility (DS) versus concentration plots, enhancethe dye solubility in water in the same way. SDBS and HA areeffective in also enhancing the dye solubility, whereas PAA andPAM are least effective as expected from their low surface ac-tivity. Most dye solubility versus concentration plots exhibit aslope change (dDS/dc) near the cmc indicated by the g versusc plot. This is well evident for all the cHALi substances and lessor not evident for HA and SDBS, respectively. Also, in the pre-micellar region the dye solubility values in the cHALi solutions
are significantly higher than in the HA and SDBS solutions,whereas in the postmicellar region the order of dye solubilityvalues is reversed. This fact results from the marked decreasein dDS/dc exhibited by the cHALi sample in the postmicellarregion.
Dynamic Light Scattering Measurements
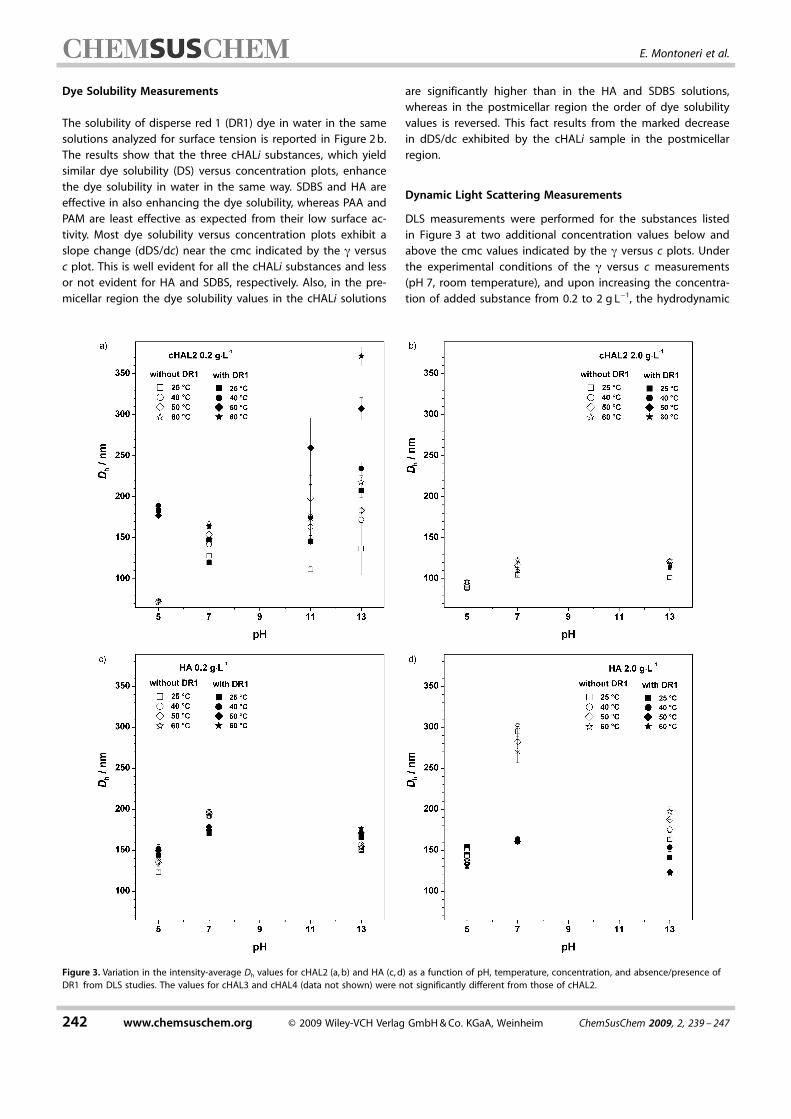
DLS measurements were performed for the substances listedin Figure 3 at two additional concentration values below andabove the cmc values indicated by the g versus c plots. Underthe experimental conditions of the g versus c measurements(pH 7, room temperature), and upon increasing the concentra-tion of added substance from 0.2 to 2 g L
�1, the hydrodynamic
Figure 3. Variation in the intensity-average Dh values for cHAL2 (a, b) and HA (c, d) as a function of pH, temperature, concentration, and absence/presence ofDR1 from DLS studies. The values for cHAL3 and cHAL4 (data not shown) were not significantly different from those of cHAL2.
242 www.chemsuschem.org � 2009 Wiley-VCH Verlag GmbH & Co. KGaA, Weinheim ChemSusChem 2009, 2, 239 – 247
E. Montoneri et al.
diameter (Dh) of HA increased from 192 nm�3.5 nm to295 nm�6.0 nm. For SDBS, as a result of its small molecularsize, the scattered intensity was too low and could not be welldistinguished from the background noise until the concentra-tion was just above the cmc value. A reliable measurement ata concentration of 10 g L
�1 gave a hydrodynamic diameter of3.7 nm�0.1 nm, compared to 2.5 nm reported[11] for sphericalSDBS micelles at room temperature and at a concentration of0.2 m. For the three cHALi substances, the change in Dh valueupon increasing the concentration was barely significant, rang-ing from 125–128 nm�5–10 nm at 0.2 g L
�1 to 104–110 nm�0.9–2.9 nm at 2 g L
�1. For PAA and PAM at 1 g L�1, the Dh
values ere measured as 252 and 34 nm, respectively. For thesesubstances, measurements at higher concentrations were notperformed as a definite cmc value was not indicated by the g
versus c plots (Figure 2).Other DLS measurements were performed for cHALi, HA,
and SDBS at variable temperature and/or pH values to investi-gate further the effect of these parameters on the particle sizein solution. Our measurements for 10 g L
�1 SDBS upon increas-ing the temperature from 25 to 60 8C revealed a slight de-crease in Dh value from 3.79 to 3.39 nm. Figure 4 reports thedata as a function of both temperature and pH for HA andcHAL2. As no important differences were found among thethree cHALi substances, the results for cHAL3 and cHLA4 arenot reported. For cHAL2, the data in Figure 4 show that thesensitivity of Dh versus temperature and/or pH is much higherat 0.2 g L
�1 than at 2 g L�1. So, over the 25–60 8C temperature
range investigated for the 0.2 g L�1 sample the Dh value in-
creased from 71–73 nm at pH 5 to 128–168 nm at pH 7 and to137–218 nm at pH 13, whereas for the 2 g L
�1 sample the Dh
value increased from 90–97 nm at pH 5 to 101–123 nm atpH 7–13. Thus, at a concentration of 0.2 g L
�1 the sensitivity ofDh to temperature is up to two times higher and to pH is be-
tween four and eight times higher compared to that at 2 g L�1.
All changes were found to be reversible upon returning thepH and/or temperature to the starting values. Visual inspectionof the solutions showed no evidence of cloud point up to80 8C. The behavior for HA in terms of Dh versus temperatureand pH is quite different from that of cHAL2. The changes inDh caused by increasing the HA concentration are much largerthan those caused by changing the pH and temperature. Theincrease in Dh value at pH 7 and room temperature from192 nm at 0.2 g L
�1 to 295 nm at 2 g L�1 clearly suggests the
formation of significantly larger molecular aggregates at thehigher concentration. However, no significant effect of temper-ature on the Dh value at all pH values and concentrationscould be assessed as shown by the experimental points andstandard deviation bars in Figure 3. The effect of pH appearsto be minor at 0.2 g L
�1 and quite strong at 2 g L�1. In this
case, no clear trend of Dh increasing with pH is shown; Dh =
130–150 nm at pH 5, Dh = 270–300 nm at pH 7, and Dh = 160–200 nm at pH 13.
Another set of DLS measurements was performed for SDBS,HA, and cHAL2 in the presence of DR1. For SDBS, no importantchanges in Dh were noted upon addition of DR1. On the con-trary, for cHALi and HA the results reported in Figure 3 showimportant changes in Dh upon addition of DR1. For HA, thegreatest effect is apparent in the 2 g L
�1 solution at pH 7–13,where the addition of DR1 causes large reductions in Dh. ForcHAL2, the greatest effect is apparent in the 0.2 g L
�1 solution,where large Dh increments are observed depending on the pHand temperature. The lowest relative increments are observedat pH 7 and the highest (100–200 %) at pH 5. The differencesbetween Dh values at different pH values increase upon in-creasing the temperature. The Dh changes mentioned abovewere reversible upon scanning back and forth over the experi-mental pH and temperature ranges and over the cHAL2 con-centration values.
1H NMR Spectroscopy
1H NMR spectra were recorded for cHAL2 at 0.2 and 2 g L�1.
The spectra exhibited signals (Supporting Information) whichwere assigned according to data reported for other humic andhumic-like substances:[4] that is, at d= 0.9–2.2 ppm for H in ali-phatic C groups for hydrocarbon chains substituted at b or far-ther, or in CH2 and CH3 bonded to aromatic C or to carboxylicor amide groups; at d= 2.9–4.3 ppm for H in methine groupsbonded to aromatic C, or in aliphatic C bonded to O or to N;and at d= 5.5–8.1 ppm for aromatic and olefinic H. Comparedto the spectrum obtained at a concentration of 0.2 g L
�1, therelative intensity of the aliphatic HC signals at d= 0.9–2.2 ppmin the spectrum at 2 g L
�1 decreased from 89 to 70 % relativeto the signals at d= 2.9–4.3 ppm assigned to HC�O and HC�Nand at d= 5.9–8.1 ppm assigned to aromatic and/or olefinic H.Also, within the group of aliphatic HC signals, the relative in-tensity of the signal at d= 2 ppm, arising from H in methylenegroups bonded to carboxylic or amide groups, appeared to in-crease.
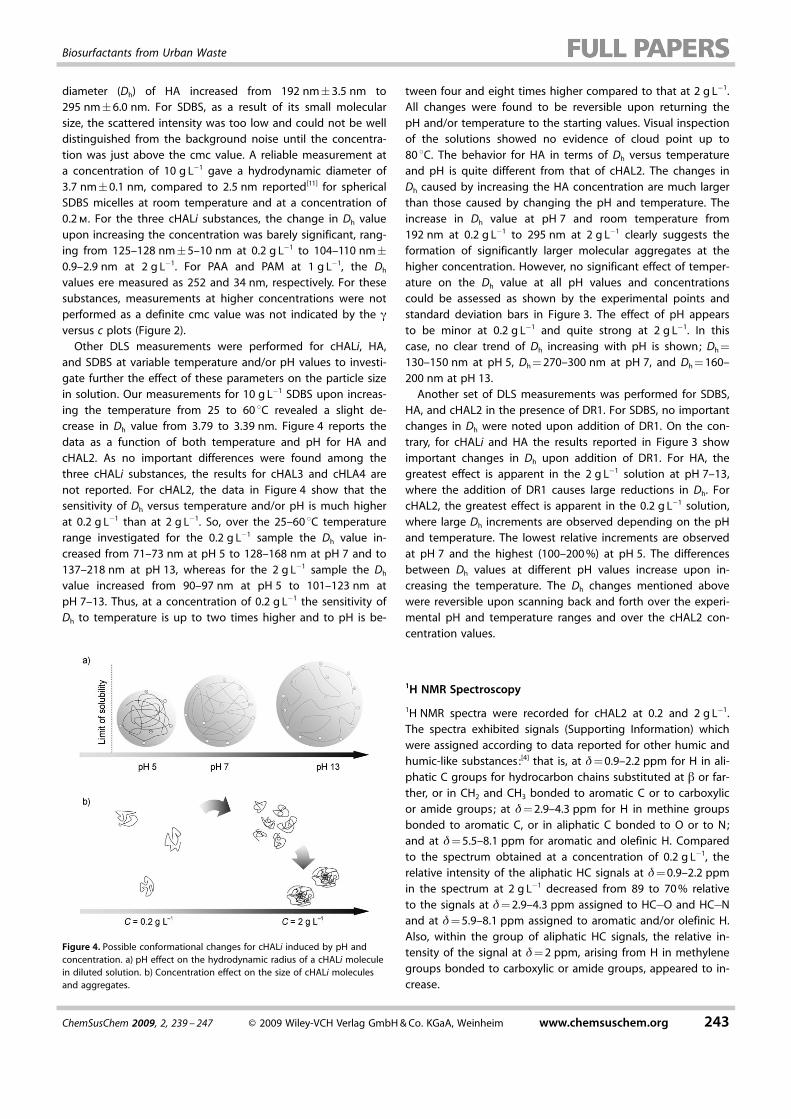
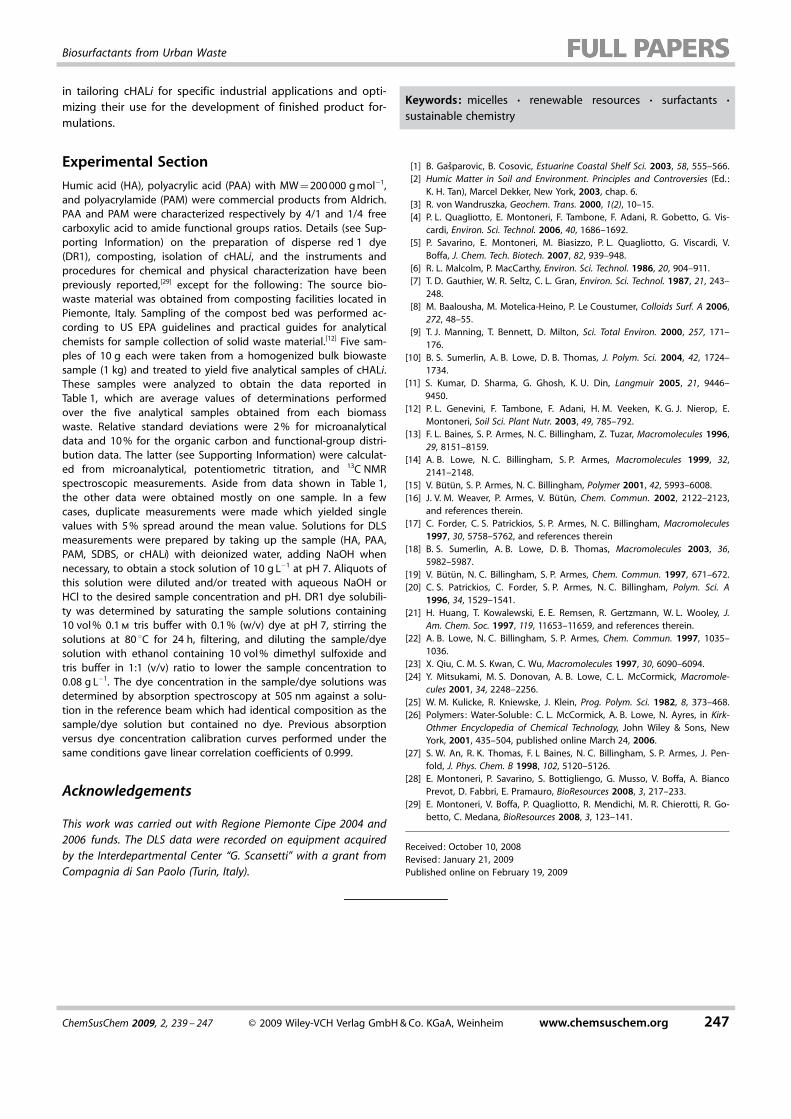
Figure 4. Possible conformational changes for cHALi induced by pH andconcentration. a) pH effect on the hydrodynamic radius of a cHALi moleculein diluted solution. b) Concentration effect on the size of cHALi moleculesand aggregates.
ChemSusChem 2009, 2, 239 – 247 � 2009 Wiley-VCH Verlag GmbH & Co. KGaA, Weinheim www.chemsuschem.org 243
Biosurfactants from Urban Waste
Discussion
Given their complex chemical nature, humic[6, 7] and humic-like[4] substances are normally characterized by two main pa-rameters : the concentration of acid functional groups and theratio of aliphatic to aromatic and/or olefinic structural carbonatoms. These parameters may reveal source effects on thechemical composition of humic and humic-like substances butdo not provide enough information to use when trying to es-tablish structure–property relationships. In the present study,by processing data from microanalytical, potentiometric titra-tions, and NMR studies for cHALi and HA we obtained a moredetailed functional group composition as reported in Table 1.The data are in the range of values previously reported forhumic[6, 7] and humic-like[4] substances from various sources. Asstandard procedures for the chemical characterization ofhumic and humic-like substances are not available, comparisonof analytical data from different sources is affected by differen-ces in data collection and presentation from one laboratory toanother. To assess how our cHALi samples compare withhumic substances, we used HA as a major representative ofcommercial humic acids and characterized either HA and thecHALi in the same way. Table 1 shows that, compared to HA,the cHALi substances seem distinguished by relatively higherN/C and H/C ratios and also by higher C/Ar ratios for all func-tional groups, except for the C/Ar ratios relative to COOH,PhOH, OMe, and aliphatic C groups. The C/Ar values for theselast four functional groups in HA fall in the range of valuesfound for the three cHALi substances.
The chemical and structural data and properties collectedfor cHALi in this study do not allow a clear relationship to beevaluated. The data in Table 1 seem to suggest changes in thechemical composition which may be indirectly related to an in-creased aging of the source compost material. This is revealedby the changes in C/Ar ratio for some C types: decreasing ali-phatic and PhOR C content and increasing PhOH C content onpassing from cHAL2 to cHAL3 and to cHAL4. Also the experi-mental molecular weight data (Figure 1) seem to indicate atrend for the apparent molecular mass of cHALi to increaseupon increasing the aging of the source compost; that is, from97–200 kg mol�1 for cHAL2 to 186–273 kg mol�1 for cHAL3 andcHAL4. These changes may be consistent with the relativelyhigher sensitivity of aliphatic carbons to microbial degradationwhich has been observed in other cases,[12] leading partly tomineralization of organic carbon and partly to dehydrogena-tion, cyclization, and/or condensation reactions to higher-mo-lecular-weight condensed aromatic substances. The surfacetension data (Table 2), however, do not seem to show a cleartrend of cmc and/or gcmc for the cHALi substances upon in-creasing the aging of the source compost; cmc = 0.77 g L
�1 forcHAL2, cmc = 0.86 g L
�1 for cHAL3, and cmc = 0.73 g L�1 for
cHAL4, whereas gcmc is 38.0–38.1 mN m�1 for all three substan-ces. Similarly, the dye solubility and molecular conformationdata discussed hereinafter in further details did not show anysignificant differences in the performance and behavior of thethree cHALi substances.
The absence of correlation between the chemical data andproperties over the three cHALi substances which has beenfound in this study does not necessarily imply that the com-posting process is unimportant for the formation of surfactant-like compounds. The experimental data only show that al-though some chemical changes are brought about by thecomposting time, these appear of relatively limited extent fordetermining significant changes in the surface activity proper-ties and in the power to enhance the solubility of the dyeprobe molecule. Unfortunately, there are no homogeneousdata at the present time on humic-like substances to draw anydefinite and/or general conclusions on the chemical composi-tion and properties of the source product. We can only refer toour previous study on cHAL[4] isolated from a 1/1 v/v mix offood and green residues composted for 15 days. This sub-stance had a chemical composition similar to cHAL4; that is, C/Ar = 12.5 for aliphatic C and 3.2 meq g�1 for carboxyl C. How-ever, its cmc (0.40 g L
�1) and gcmc (36.1 mN m�1) values are thelowest relative to cHAL2–4 (0.73–0.86 g L
�1 and 38.0–38.1 mN m�1, respectively). These data may indicate that thenature of the waste, more than the composting time, may bea crucial variable in determining the properties of the isolatedhumic acid like biosurfactants, and also that the chemical pa-rameters in Table 1 are not useful enough to function asprobes of structural changes related to properties. To furthersubstantiate this latter point, one may observe that the chemi-cal composition data for HA do not explain the rather highcmc value in Table 2 as compared to the data for cHAL andcHAL2–4.
We characterized chemically the cHALi substances usingmethods and parameters available according to the currentstate of the art for similar natural substances.[4, 6, 7] To developprocedures for a more comprehensive characterization of thechemical structure of these substances was outside the scopeof this work. Notwithstanding the limitation posed by theavailable chemical characterization data in Table 1, for thescope of our work aimed at assessing the potential of humicacid like substances to perform as auxiliaries in surfactant-as-sisted chemical technological processes, the experimental dataon surface tension, enhancement of dye solubility, and molecu-lar conformation are important and informative. The surfacetension data (Figure 2 and Table 2) show that the cHALi sub-stances behave partly as small-molecule surfactants and partlyas polymeric molecules. The cHALi substances exhibit uniqueproperties on the basis of cmc values and corresponding sur-face tension (gcmc) and dg/dc values. In essence, they are moreeffective than HA, PAA, and PAM, and roughly as effective asSDBS in lowering the surface tension of pure water by 50 % ormore, already at relatively low concentrations (0.86 g L
�1), butexhibit four significant changes in slope with the final near-zero dg/dc value at concentrations over the cmc value. Thesedata indicate that cHALi substances are likely to undergo sev-eral conformational changes before yielding a very compactmicellar aggregate at cmc values of 0.73–0.86 g L
�1. Other rele-vant observations include no significant surface activity differ-ence between the three cHALi substances, and the cHALi sub-stances resemble the behavior of SDBS except for the magni-
244 www.chemsuschem.org � 2009 Wiley-VCH Verlag GmbH & Co. KGaA, Weinheim ChemSusChem 2009, 2, 239 – 247
E. Montoneri et al.
tude of their effect on g, which does not necessarily imply anysimilarity in molecular size. Indeed, the capacity to lower signif-icantly the surface tension at low concentrations is not restrict-ed to small molecules. Several synthetic polymethacrylates[13–15]
with molecular weights of 11 000–26 700 g mol�1 exhibit cmcand gcmc values as low as 0.2 g L
�1 and 37 mN m�1, respectively.The effect on the surface tension depends mostly on the hy-drophilic–lipophilic balance of the surfactant, rather than onthe molecular weight.
For cHALi and HA, the hydrodynamic diameters (Dh) in the100–300 nm range (Figure 3) suggest that these substancesare constituted by macromolecules with molecular weights inthe range of 104–105 g mol�1 or higher and/or by their aggre-gates rather than being composed of small-molecule micelles.Data published for SDBS and synthetic acrylic polymers reportDh values of 3–16 nm for polymer molecules and micelles ofsmall-molecule surfactants[10, 15, 16] and from 18 to several hun-dred nm for aggregates of polymer molecules[10, 13–15, 17–25] withmolecular weights of 0.1–80 � 105 g mol�1. These findings agreewell with the molecular weight data from SEC-MALS for thecHALi substances (Figure 1). We realized, however, that theabove DLS measurements were not sufficient to prove the for-mation of postmicellar aggregates for cHALi and to assess, foreither cHALi and HA, the presence of single molecules or pre-micellar aggregates at concentrations lower than the cmc. AspH and temperature, in addition to concentration, are knownto affect the aggregation of amphiphilic polymers,[26] we inves-tigated also the effects of these two latter parameters on Dh.
For SDBS at 10 g L�1, our measurements revealed a slight de-
crease in Dh value from 3.79 to 3.39 nm upon increasing thetemperature from 25 to 60 8C. The reduction in size of thespherical SDBS micelles[11] is likely ascribed to increasing ioniza-tion of SO3Na groups and repulsion between sulfonated aro-matic rings in the external shell. As a result, the lipophilic ali-phatic carbon chains in the inner core, trying to segregate fur-ther from the strongly hydrophilic shell environment, areforced closer together. Contrary to this trend, for the humicacid like substances, the typical data reported for cHAL2 inFigure 3 reveal significant increases in Dh upon increasing thetemperature. For cHAL2–4, an organized assembly with well-segregated hydrophobic aliphatic and hydrophilic carbon moi-eties, as shown by SDBS,[11] is not likely on the basis of the sizeincrease with increasing temperature. A second observationfor cHAL2–4 is that their size is much more sensitive to pH at aconcentration of 0.2 g L
�1 than at 2 g L�1. Thus, the molecular
conformations and/or assemblies at the two concentrationvalues must be very different. The observed changes in Dh maybe caused either by a change of the single molecules from acompact to an expanded coil conformation (Figure 4 a) or fromthe formation of aggregates of single molecules (Figure 4 b).
The g versus concentration plots at pH 7 (Figure 2) indicatethat at 0.2 g L
�1 the cHALi particles occupy the air–water inter-face. As this behavior is unlikely for well-organized mi-celles,[15, 26] we favor the hypothesis that the cHALi moleculesat 0.2 g L
�1 are unimers in a coil conformation. These mole-cules at pH 5 acquire a rather compact structure owing to in-tramolecular attraction between nonpolar segments, which
causes the decrease in Dh value observed for cHAL2 (Figure 3)from 128–168 nm at pH 7 to 71–73 nm at pH 5. Such aggrega-tion will ultimately lead to the precipitation of humic acid likesubstances at lower pH which was, in this study, the basis fortheir isolation from the compost source material (see Experi-mental Section). On the contrary, increasing pH values lead toan increased ionization of acid groups, charge-to-charge repul-sion, and expansion and solvation of the unimer coils. It maybe calculated from Figure 3 that, starting at pH 5 and roomtemperature, the relative size enlargements caused by increas-ing the pH and/or temperature amount to 77–204 %. Interest-ingly, whereas the compact structure at pH 5 is rather insensi-tive to temperature changes, the sensitivity of Dh to tempera-ture increases with increasing pH.
The situation at a concentration of 2 g L�1 is quite different.
As suggested by the g versus concentration plots in Figure 2,the cHAL2–4 molecules at 2 g L
�1 are likely present as compactmicellar aggregates occupying the bulk water phase. Figure 3shows that, compared to the unimer coils at 0.2 g L
�1, the mi-cellar aggregates at 2 g L
�1 are much less sensitive to pH andtemperature changes. It may be calculated from the experi-mental data that upon increasing the temperature to 60 8C,the percentage increase in Dh relative to the value at 25 8C is8 % at pH 5, 17 % at pH 7, and 20 % at pH 13, whereas the per-cent increase relative to the value at pH 5 at constant tempera-ture is 17–27 % at pH 7 and 13–31 % at pH 13. This situationmay arise from micellar aggregates where some segregationbetween hydrophobic and hydrophilic carbon moieties occurs.Compared to the unimer coils, in these aggregates the ar-rangement of acid groups causes less charge-to-charge repul-sion with increasing ionization of carboxylic and/or phenolgroups. These structural changes were supported also by1H NMR spectra for cHAL2 performed at 0.2 and 2 g L
�1. Thesespectra showed very different patterns (see Results section).For example, compared to the spectrum at 0.2 g L
�1, in thespectrum at 2 g L
�1 the relative intensity of the aliphatic HCsignals at d= 0.9–2.2 ppm decreased from 89 to 70 % relativeto that of the signals at d= 2.9–4.3 ppm assigned to HC�Oand HC�N and at d= 5.9–8.1 ppm assigned to aromatic and/orolefinic H centers. Also, within the group of aliphatic HC sig-nals, the relative intensity of the signal at d= 2 ppm, arisingfrom H in methylene groups bonded to carboxylic or amidegroups, appeared to increase. The spectral pattern changeupon increasing the concentration of cHAL2 is consistent withthe above proposed molecular conformational change fromunimer coil to micellar aggregates. According to previous workreporting similar spectral changes for synthetic polyacry-lates[10, 15, 18] upon micellization, segmental mobility in the mi-celle core is severely restricted and this causes the 1H NMR sig-nals arising from HC moieties in the micellar core to excessive-ly broaden and/or decrease in intensity relative to the signalsarising from the hydrophilic external units.
The above-described behavior of cHALi is remarkably differ-ent to that of HA. The data in Figure 3 reveal how the low sen-sitivity or insensitivity to temperature and pH exhibited by thehumic acid at 0.2 g L
�1 clearly distinguishes it from cHAL2 atthe same concentration. Consistent with previous work on the
ChemSusChem 2009, 2, 239 – 247 � 2009 Wiley-VCH Verlag GmbH & Co. KGaA, Weinheim www.chemsuschem.org 245
Biosurfactants from Urban Waste
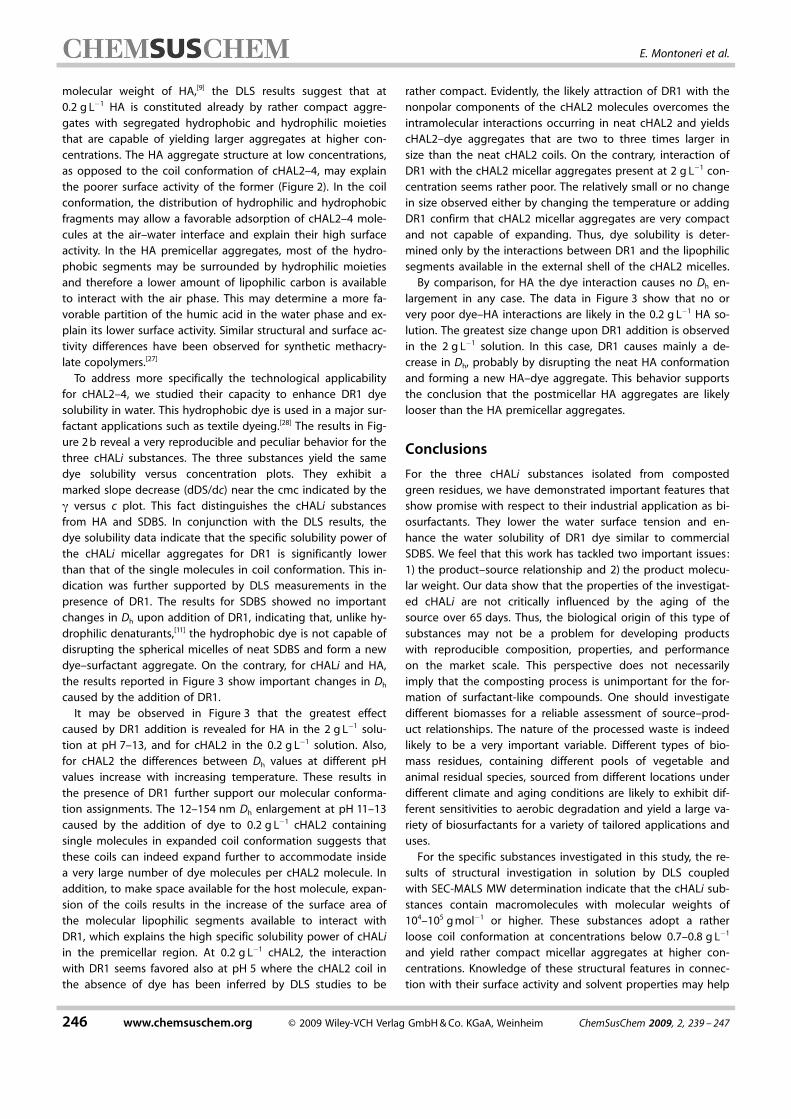
molecular weight of HA,[9] the DLS results suggest that at0.2 g L
�1 HA is constituted already by rather compact aggre-gates with segregated hydrophobic and hydrophilic moietiesthat are capable of yielding larger aggregates at higher con-centrations. The HA aggregate structure at low concentrations,as opposed to the coil conformation of cHAL2–4, may explainthe poorer surface activity of the former (Figure 2). In the coilconformation, the distribution of hydrophilic and hydrophobicfragments may allow a favorable adsorption of cHAL2–4 mole-cules at the air–water interface and explain their high surfaceactivity. In the HA premicellar aggregates, most of the hydro-phobic segments may be surrounded by hydrophilic moietiesand therefore a lower amount of lipophilic carbon is availableto interact with the air phase. This may determine a more fa-vorable partition of the humic acid in the water phase and ex-plain its lower surface activity. Similar structural and surface ac-tivity differences have been observed for synthetic methacry-late copolymers.[27]
To address more specifically the technological applicabilityfor cHAL2–4, we studied their capacity to enhance DR1 dyesolubility in water. This hydrophobic dye is used in a major sur-factant applications such as textile dyeing.[28] The results in Fig-ure 2 b reveal a very reproducible and peculiar behavior for thethree cHALi substances. The three substances yield the samedye solubility versus concentration plots. They exhibit amarked slope decrease (dDS/dc) near the cmc indicated by theg versus c plot. This fact distinguishes the cHALi substancesfrom HA and SDBS. In conjunction with the DLS results, thedye solubility data indicate that the specific solubility power ofthe cHALi micellar aggregates for DR1 is significantly lowerthan that of the single molecules in coil conformation. This in-dication was further supported by DLS measurements in thepresence of DR1. The results for SDBS showed no importantchanges in Dh upon addition of DR1, indicating that, unlike hy-drophilic denaturants,[11] the hydrophobic dye is not capable ofdisrupting the spherical micelles of neat SDBS and form a newdye–surfactant aggregate. On the contrary, for cHALi and HA,the results reported in Figure 3 show important changes in Dh
caused by the addition of DR1.It may be observed in Figure 3 that the greatest effect
caused by DR1 addition is revealed for HA in the 2 g L�1 solu-
tion at pH 7–13, and for cHAL2 in the 0.2 g L�1 solution. Also,
for cHAL2 the differences between Dh values at different pHvalues increase with increasing temperature. These results inthe presence of DR1 further support our molecular conforma-tion assignments. The 12–154 nm Dh enlargement at pH 11–13caused by the addition of dye to 0.2 g L
�1 cHAL2 containingsingle molecules in expanded coil conformation suggests thatthese coils can indeed expand further to accommodate insidea very large number of dye molecules per cHAL2 molecule. Inaddition, to make space available for the host molecule, expan-sion of the coils results in the increase of the surface area ofthe molecular lipophilic segments available to interact withDR1, which explains the high specific solubility power of cHALiin the premicellar region. At 0.2 g L
�1 cHAL2, the interactionwith DR1 seems favored also at pH 5 where the cHAL2 coil inthe absence of dye has been inferred by DLS studies to be
rather compact. Evidently, the likely attraction of DR1 with thenonpolar components of the cHAL2 molecules overcomes theintramolecular interactions occurring in neat cHAL2 and yieldscHAL2–dye aggregates that are two to three times larger insize than the neat cHAL2 coils. On the contrary, interaction ofDR1 with the cHAL2 micellar aggregates present at 2 g L
�1 con-centration seems rather poor. The relatively small or no changein size observed either by changing the temperature or addingDR1 confirm that cHAL2 micellar aggregates are very compactand not capable of expanding. Thus, dye solubility is deter-mined only by the interactions between DR1 and the lipophilicsegments available in the external shell of the cHAL2 micelles.
By comparison, for HA the dye interaction causes no Dh en-largement in any case. The data in Figure 3 show that no orvery poor dye–HA interactions are likely in the 0.2 g L
�1 HA so-lution. The greatest size change upon DR1 addition is observedin the 2 g L
�1 solution. In this case, DR1 causes mainly a de-crease in Dh, probably by disrupting the neat HA conformationand forming a new HA–dye aggregate. This behavior supportsthe conclusion that the postmicellar HA aggregates are likelylooser than the HA premicellar aggregates.
Conclusions
For the three cHALi substances isolated from compostedgreen residues, we have demonstrated important features thatshow promise with respect to their industrial application as bi-osurfactants. They lower the water surface tension and en-hance the water solubility of DR1 dye similar to commercialSDBS. We feel that this work has tackled two important issues:1) the product–source relationship and 2) the product molecu-lar weight. Our data show that the properties of the investigat-ed cHALi are not critically influenced by the aging of thesource over 65 days. Thus, the biological origin of this type ofsubstances may not be a problem for developing productswith reproducible composition, properties, and performanceon the market scale. This perspective does not necessarilyimply that the composting process is unimportant for the for-mation of surfactant-like compounds. One should investigatedifferent biomasses for a reliable assessment of source–prod-uct relationships. The nature of the processed waste is indeedlikely to be a very important variable. Different types of bio-mass residues, containing different pools of vegetable andanimal residual species, sourced from different locations underdifferent climate and aging conditions are likely to exhibit dif-ferent sensitivities to aerobic degradation and yield a large va-riety of biosurfactants for a variety of tailored applications anduses.
For the specific substances investigated in this study, the re-sults of structural investigation in solution by DLS coupledwith SEC-MALS MW determination indicate that the cHALi sub-stances contain macromolecules with molecular weights of104–105 g mol�1 or higher. These substances adopt a ratherloose coil conformation at concentrations below 0.7–0.8 g L
�1
and yield rather compact micellar aggregates at higher con-centrations. Knowledge of these structural features in connec-tion with their surface activity and solvent properties may help
246 www.chemsuschem.org � 2009 Wiley-VCH Verlag GmbH & Co. KGaA, Weinheim ChemSusChem 2009, 2, 239 – 247
E. Montoneri et al.
in tailoring cHALi for specific industrial applications and opti-mizing their use for the development of finished product for-mulations.
Experimental Section
Humic acid (HA), polyacrylic acid (PAA) with MW = 200 000 g mol�1,and polyacrylamide (PAM) were commercial products from Aldrich.PAA and PAM were characterized respectively by 4/1 and 1/4 freecarboxylic acid to amide functional groups ratios. Details (see Sup-porting Information) on the preparation of disperse red 1 dye(DR1), composting, isolation of cHALi, and the instruments andprocedures for chemical and physical characterization have beenpreviously reported,[29] except for the following: The source bio-waste material was obtained from composting facilities located inPiemonte, Italy. Sampling of the compost bed was performed ac-cording to US EPA guidelines and practical guides for analyticalchemists for sample collection of solid waste material.[12] Five sam-ples of 10 g each were taken from a homogenized bulk biowastesample (1 kg) and treated to yield five analytical samples of cHALi.These samples were analyzed to obtain the data reported inTable 1, which are average values of determinations performedover the five analytical samples obtained from each biomasswaste. Relative standard deviations were 2 % for microanalyticaldata and 10 % for the organic carbon and functional-group distri-bution data. The latter (see Supporting Information) were calculat-ed from microanalytical, potentiometric titration, and 13C NMRspectroscopic measurements. Aside from data shown in Table 1,the other data were obtained mostly on one sample. In a fewcases, duplicate measurements were made which yielded singlevalues with 5 % spread around the mean value. Solutions for DLSmeasurements were prepared by taking up the sample (HA, PAA,PAM, SDBS, or cHALi) with deionized water, adding NaOH whennecessary, to obtain a stock solution of 10 g L
�1 at pH 7. Aliquots ofthis solution were diluted and/or treated with aqueous NaOH orHCl to the desired sample concentration and pH. DR1 dye solubili-ty was determined by saturating the sample solutions containing10 vol % 0.1 m tris buffer with 0.1 % (w/v) dye at pH 7, stirring thesolutions at 80 8C for 24 h, filtering, and diluting the sample/dyesolution with ethanol containing 10 vol % dimethyl sulfoxide andtris buffer in 1:1 (v/v) ratio to lower the sample concentration to0.08 g L
�1. The dye concentration in the sample/dye solutions wasdetermined by absorption spectroscopy at 505 nm against a solu-tion in the reference beam which had identical composition as thesample/dye solution but contained no dye. Previous absorptionversus dye concentration calibration curves performed under thesame conditions gave linear correlation coefficients of 0.999.
Acknowledgements
This work was carried out with Regione Piemonte Cipe 2004 and2006 funds. The DLS data were recorded on equipment acquiredby the Interdepartmental Center “G. Scansetti” with a grant fromCompagnia di San Paolo (Turin, Italy).
Keywords: micelles · renewable resources · surfactants ·sustainable chemistry
[1] B. Gasparovic, B. Cosovic, Estuarine Coastal Shelf Sci. 2003, 58, 555–566.[2] Humic Matter in Soil and Environment. Principles and Controversies (Ed. :
K. H. Tan), Marcel Dekker, New York, 2003, chap. 6.[3] R. von Wandruszka, Geochem. Trans. 2000, 1(2), 10–15.[4] P. L. Quagliotto, E. Montoneri, F. Tambone, F. Adani, R. Gobetto, G. Vis-
cardi, Environ. Sci. Technol. 2006, 40, 1686–1692.[5] P. Savarino, E. Montoneri, M. Biasizzo, P. L. Quagliotto, G. Viscardi, V.
Boffa, J. Chem. Tech. Biotech. 2007, 82, 939–948.[6] R. L. Malcolm, P. MacCarthy, Environ. Sci. Technol. 1986, 20, 904–911.[7] T. D. Gauthier, W. R. Seltz, C. L. Gran, Environ. Sci. Technol. 1987, 21, 243–
248.[8] M. Baalousha, M. Motelica-Heino, P. Le Coustumer, Colloids Surf. A 2006,
272, 48–55.[9] T. J. Manning, T. Bennett, D. Milton, Sci. Total Environ. 2000, 257, 171–
176.[10] B. S. Sumerlin, A. B. Lowe, D. B. Thomas, J. Polym. Sci. 2004, 42, 1724–
1734.[11] S. Kumar, D. Sharma, G. Ghosh, K. U. Din, Langmuir 2005, 21, 9446–
9450.[12] P. L. Genevini, F. Tambone, F. Adani, H. M. Veeken, K. G. J. Nierop, E.
Montoneri, Soil Sci. Plant Nutr. 2003, 49, 785–792.[13] F. L. Baines, S. P. Armes, N. C. Billingham, Z. Tuzar, Macromolecules 1996,
29, 8151–8159.[14] A. B. Lowe, N. C. Billingham, S. P. Armes, Macromolecules 1999, 32,
2141–2148.[15] V. B�t�n, S. P. Armes, N. C. Billingham, Polymer 2001, 42, 5993–6008.[16] J. V. M. Weaver, P. Armes, V. B�t�n, Chem. Commun. 2002, 2122–2123,
and references therein.[17] C. Forder, C. S. Patrickios, S. P. Armes, N. C. Billingham, Macromolecules
1997, 30, 5758–5762, and references therein[18] B. S. Sumerlin, A. B. Lowe, D. B. Thomas, Macromolecules 2003, 36,
5982–5987.[19] V. B�t�n, N. C. Billingham, S. P. Armes, Chem. Commun. 1997, 671–672.[20] C. S. Patrickios, C. Forder, S. P. Armes, N. C. Billingham, Polym. Sci. A
1996, 34, 1529–1541.[21] H. Huang, T. Kowalewski, E. E. Remsen, R. Gertzmann, W. L. Wooley, J.
Am. Chem. Soc. 1997, 119, 11653–11659, and references therein.[22] A. B. Lowe, N. C. Billingham, S. P. Armes, Chem. Commun. 1997, 1035–
1036.[23] X. Qiu, C. M. S. Kwan, C. Wu, Macromolecules 1997, 30, 6090–6094.[24] Y. Mitsukami, M. S. Donovan, A. B. Lowe, C. L. McCormick, Macromole-
cules 2001, 34, 2248–2256.[25] W. M. Kulicke, R. Kniewske, J. Klein, Prog. Polym. Sci. 1982, 8, 373–468.[26] Polymers : Water-Soluble: C. L. McCormick, A. B. Lowe, N. Ayres, in Kirk-
Othmer Encyclopedia of Chemical Technology, John Wiley & Sons, NewYork, 2001, 435–504, published online March 24, 2006.
[27] S. W. An, R. K. Thomas, F. L Baines, N. C. Billingham, S. P. Armes, J. Pen-fold, J. Phys. Chem. B 1998, 102, 5120–5126.
[28] E. Montoneri, P. Savarino, S. Bottigliengo, G. Musso, V. Boffa, A. BiancoPrevot, D. Fabbri, E. Pramauro, BioResources 2008, 3, 217–233.
[29] E. Montoneri, V. Boffa, P. Quagliotto, R. Mendichi, M. R. Chierotti, R. Go-betto, C. Medana, BioResources 2008, 3, 123–141.
Received: October 10, 2008Revised: January 21, 2009Published online on February 19, 2009
ChemSusChem 2009, 2, 239 – 247 � 2009 Wiley-VCH Verlag GmbH & Co. KGaA, Weinheim www.chemsuschem.org 247
Biosurfactants from Urban Waste