Embed Size (px)
Citation preview

BIOCYCLE first published asurvey report on biosolids com-posting in the United States in1983. Twenty-seven years ago,the survey identified a total of61 “full-time” projects, with an-other 29 expected to begin
within a year. The national survey skippeda year and was conducted again in 1985,and then annually through 1998 (see“Biosolids Composting In The UnitedStates,” January 1999). By that point,there were 321 projects in the U.S., with274 operating facilities.
In May of this year, following an inquiryabout the number of biosolids composting
operations in the U.S. — and not beingable to provide an accurate estimate — wedecided to conduct the nationwide surveyonce again. The process took a number ofmonths, but the results are encouraging.BioCycle’s 16th Nationwide Survey, donein collaboration with the North EastBiosolids & Residuals Association (NE-BRA), identified a total of 265 biosolidscomposting projects in the United States,with a total of 258 in operation.
Table 1 summarizes the compostingmethods utilized at the operating biosolidscomposting facilities. Similar to the 1998data, the most utilized composting method
BIOCYCLE DECEMBER 2010 35
Table 1. Summary of composting methods utilizedby U.S. projects
System Type
Aerated static pile 108Windrow 83In-vessel 46Aerated windrow1 8Static pile 4Enclosed aerated static pile2 4Vermicomposting 1Not specified3 9
Total projects 265
1Windrow on in-slab aeration system. 2Engineered tarpenclosure with aeration. 3Unable to confirm compostingmethod utilized.
BIOSOLIDS COMPOSTING IN THE UNITED STATES — 2010 UPDATEBioCycle and the North East Biosolids& Residuals Association joined forcesto update the list of biosolids compostingfacilities around the country, identifyinga total of 265 projects.Part I
Ned Beecher and Nora Goldstein
BIOCYCLE NATIONWIDE SURVEY
Lee County, Florida — windrowcomposting inside fabric structures.

is aerated static pile (total of 108), followedby windrow composting (83). There are 46facilities using in-vessel systems, with theremainder employing aerated windrows(windrows built on a floor with aerationtrenches), static piles, enclosed aeratedstatic piles (engineered technology usingtarps and forced aeration) or vermicom-posting. And interestingly, the number ofprojects in construction is almost identical(6 in 1998 and 5 in 2010).
The primary difference between the1998 and 2010 data is the number of pro-jects in development (permitting, de-sign/bidding, planning, consideration andpilot). In 1998, BioCycle found a total of 47projects in development. In 2010, only oneproject is in planning and there is one pi-lot. The difference could be attributed inlarge part to the 12-year gap in data gath-ering. Conducting a survey annually cre-ates the ability to track projects throughthe various stages of development. It alsoprovides an opportunity to create a fairlyextensive network of contacts within thebiosolids composting community — stateagencies, municipal governments and con-sulting engineers, as well as individualproject managers. In 2010, BioCycle and NEBRA focused ini-tially at the state agency level, contactingstate biosolids coordinators and askingthem to review the list of biosolids com-posting projects identified in their state in1998. Most states were able to update thelistings, noting facilities still in operation,those no longer operating and any newprojects. In almost every case, data wasonly provided on operating facilities ver-sus projects in development. We also con-tacted projects directly to confirm andelaborate on the information we had. As-sistance also was provided by the U.S.EPA regional biosolids coordinators. Fi-
36 BIOCYCLE DECEMBER 2010
Table 2. 2010 BioCycle/NEBRA survey of U.S. biosolids composting projects
BiosolidsQuantity Composting
State/Location Status/Operator (dry tons/yr) Method
ALASKAFairbanks Operational (Golden Heart Utilities) 1,525 ASPARIZONAApache Junction: Operational WindrowSuperstition Mountain CFD
Pinetop-Lakeside Operational In-vessel(Bedminster); AW
Vicksburg Operational (Synagro Arizona 16,210 WindrowSoils Compost)
ARKANSASBentonville Operational Windrow (Scarab)Eureka Springs Operational WindrowHot Springs Operational ASPN. Little Rock Operational (American Composting) WindrowCALIFORNIAArcata Operational 192 ASPChino: Inland Empire Util. Agency Operational 37,500 ASP (In-building)Dos Palos: Central Valley Operational (Synagro Technologies) 13,880 Windrow Fortuna Operational 112 WindrowLas Virgenes Operational 1,586 In-vessel (Siemens IPS)Los Angeles: Griffith Park Operational 1,250 ASPLos Angeles Cty. San. District Construction 25,000 Enc. ASP (GORE)Lost Hills Operational (Liberty Compost) 64,062 WindrowMorro Bay Operational 91 WindrowOjai Valley Operational (San Joaquin) 557 WindrowRedland Operational 3,186 Windrow
(One Stop Landscape Supply)Santa Maria Operational (Engel & Gray) 2,686 Windrow (Scarab)Santa Rosa Operational 934 In-vesselSouth Kern Operational (Synagro Technologies) 41,465 ASP1
COLORADOClear Creek Cty.: Climax Mine Operational (Parker Ag) 1,000 ASPDelta WWTP Operational 250 WindrowFountain: Midway Landfill Operational (Waste Management Windrow
of CO and A-1 Organics) (MASP)Glenwood Springs Operational (South Canyon 500 AW
Solid Waste)Granby Operational 100 In-vessel (ECS2;
Luck Now)Gunnison Operational ASPKeenesburg/Rattler Ridge3 Operational (A-1 Organics) Windrow (MASP)Pitkin County Operational ASPPlatteville Operational (A-1 Organics) WindrowSilt Operational AWSummit County Resource Operational 5.5 Windrow (MASP)Allocation Park
Tri-Lakes Operational ASPVail: Upper Eagle Valley Operational ASPWoodland Park Operational ASPCONNECTICUTFairfield Operational 650 In-vessel (Siemens
IPS; Kuhn)DELAWAREMilford Operational (Blessings Greenhouse) WindrowSeaford Operational 106 ASPFLORIDALee County Operational 2,850 Windrow (Backhus;
Roto-Mix)Miami-Dade Water Sewer: Operational (seasonal) ASPSouth Plant
Ocala Operational (CompostUSA) AWOkahumpka Operational (C&C Peat) 4,722 Windrow Reedy Creek Operational 2,900 ASP and windrow
(Scarab)Sarasota Operational In-vessel (Purac)
Guide To Table 2COMPOSTING METHODS:ASP=Aerated static pile; AW=Aerated windrow;Enc. ASP=Covered, aerated pile (using propri-etary technology); MASP=Modified aerobicstatic pile (combining AW and static pile) thatutilizes a catalyst
VENDORS CITED:Mixers: Kuhn-Knight; Luck Now; Roto-Mix;Supreme InternationalWindrow Turners: Backhus; KW (Resource Re-covery International); Scarab; WildcatIn-Vessel – Agitated Bay: CSC Paygro;Siemens International Process Systems; Trans-formIn-Vessel – Tunnels: Engineered Compost Sys-tems (ECS); Gicom; Green Mountain Technolo-gies; Waste Solutions (WS)Enclosed ASP: ECS; GORE Cover; ManagedOrganic Recycling (MOR)Other: Bedminster (Rotary drum); American BioTech (ABT) and Purac (vertical silo)

nally, BioCycle queried equipment ven-dors for project updates. We greatly ap-preciate everyone’s assistance in provid-ing information. We also welcomefeedback on the 2010 data, e.g., facilitiesmissed or ones included that are no longerin operation. Please send updates to Ce-leste Madtes ([email protected]).
NATIONAL OVERVIEWTable 2 provides the state-by-state
breakdown of biosolids composting pro-jects in the U.S. The “Guide To Table 2”sidebar explains what the abbreviationsstand for as well as provides the full com-pany names of the vendors cited. In thesecond column of Table 2 (“Status”), whena company name is noted after the term“Operational,” it indicates that this pri-vate entity owns and operates the facilityor is the operator contracted by the mu-nicipal agency. If no company name is list-ed, the facility is owned and operated bythe public agency.
Based on the survey data, we estimatethat 7.8 percent of the biosolids generatedin the U.S. are composted. This number isbased on the actual dry tons/year providedby facilities (477,009 dry tons/year), plusan estimate to account for the facilities notproviding tonnage data (82,546 drytons/year). That total was used as the ba-sis to calculate our national estimate of562,000 dry tons/year of biosolids com-posted. A national survey on biosolids enduse and disposal, conducted by NEBRA incollaboration with several other entities(see “Biosolids Management In The U.S.,”March 2008), calculated that a total of7,180,000 dry tons of biosolids were gener-ated in the U.S. in 2004. This nationalnumber was used to calculate the BioCy-cle/NEBRA estimate of 7.8 percent.
In terms of geographic distribution ofprojects, 44 of the 50 states have biosolidscomposting projects. The six states with nobiosolids composing reported are Alaba-ma, Illinois, Louisiana, Minnesota, Mis-sissippi and Nebraska. (Wisconsin doesnot have a full-scale project, but a pilot isbeing conducted by the Appleton Wastew-ater Treatment Plant in conjunction withthe Outagamie County Department of Sol-id Waste.)
Of the 44 states reporting biosolids com-posting projects, the number per statebreaks down as follows: 26 states have lessthan 5 projects; 9 states have between 5 and10 projects; 7 have between 10 and 20 pro-jects. Two states have more than 20 projects— New York (25) and Washington (24).
Aside from a few states, there is no ob-vious link between the climate and thecomposting method. Many years ago, thetrend was toward windrow composting inthe Central and Southwest states, and in-vessel and aerated static piles in theNortheast, Mid-Atlantic and the PacificNorthwest. While climate still plays a role,other factors such as emissions regula-
BIOCYCLE DECEMBER 2010 37
Table 2. 2010 BioCycle/NEBRA survey of U.S. biosolids composting projects (cont’d.)
BiosolidsQuantity Composting
State/Location Status/Operator (dry tons/yr) Method
GEORGIAAlto Operational (Wilcorp Environmental) Windrow (Backhus)Dalton Utilities Operational (Harvest Farms) In-vesselNoonan Utilities Operational n/aPlains Operational (ERTH Products) 8,400 ASPHAWAIIMaui Eko Compost Operational (EKO Compost) 3,090 ASPU.S. Navy Barbers Point Operational (One Stop Landscape Supply) 990 ASPIDAHOCoeur d'Alene Operational 840 ASPLewiston Operational (EKO Systems) ASPINDIANAAngola Operational (Soil Solutions) Windrow (Backhus)Elkhart Operational WindrowSouth Bend Operational WindrowIOWA Davenport Operational 5,500 ASP (In-building)KANSASOlathe Operational 850 WindrowTopeka: Oakland WWTP Operational 2,400 WindrowKENTUCKYFranklin Operational (Triple M Land Farms) WindrowLouisville: Headden Septic Construction WindrowTank Service
Paducah Operational Windrow (Scarab)West Liberty Operational WindrowMAINEKennebunk Operational (Nest and Sons, Inc.) 160 ASPKennebunkport Operational 62 ASPKingfield Operational ASPLewiston-Auburn Operational 2,169 In-vesselLincoln Sanitary District Operational 114 ASPOld Town Operational 154 ASPParis Utility District Operational 84 ASPRockland Operational (Interstate Septic Systems Inc.) In-vesselRumford-Mexico Operational 416 ASPScarborough Operational 506 ASPUnity: Hawk Ridge Operational (New England Organics) 8,500 In-vessel (Gicom)Wilton Operational 39 ASPYarmouth Operational 132 ASP (In-building)MARYLANDAberdeen Operational ASPBaltimore City/Orgro/ Operational 5,720 In-vessel Veolia Water (CSC Paygro)
Havre de Grace Operational 300 ASPPerryville Operational (Maryland Environmental Service) ASPMASSACHUSETTSBarre Operational 60 ASPBridgewater Operational 304 ASPDartmouth Operational 900 In-vessel (Siemens IPS)Ipswich Operational (Agresource) ~1,000 ASPMarlborough Operational (WeCare Organics) 2,064 In-vessel
(Bedminster); AWNantucket Operational In-vessel
(Bedminster); AWNorthbridge Operational n/aPepperell Operational 140 Static pileSomerset Operational 1,360 ASPSouthbridge Operational (Veolia) 5,355 ASPWilliamstown/Hoosuc Operational 5,100 ASPMICHIGAN Ishpeming Operational 2,000 In-vessel (ECS2; Kuhn)Midland Operational 70 Windrow
(summer only)

tions, siting and public perception, ad-vancements in process control and avail-ability of bulking agents may dictate tech-nology decisions. For example, air qualitymanagement districts in California havebeen tightening their rules on VOCs andrelated emissions from composting facili-ties over the past decade. As a result, somefacilities in climates that typically lendthemselves to open-air windrow compost-ing — but located in air districts with se-vere noncompliance — are utilizing aerat-ed static piles with negative air flow andbiofiltration, or enclosed aerated staticpiles with proprietary aeration and covertechnologies.
The most common bulking agents(amendments) used in biosolids compostingare wood chips made from yard trimmingsor recycled wood waste. Some facilities re-port using sawdust; several also blend inash from boiler plants or incinerators.
PRIDE IN THE PRODUCTWhile gathering information from pro-
ject managers, we noted consistent enthu-siasm about the biosolids compost product.This enthusiasm carried over to facilitywebsites (mostly found by searching on thecity or town, then clicking on “wastewater
38 BIOCYCLE DECEMBER 2010
Table 2. 2010 BioCycle/NEBRA survey of U.S. biosolids composting projects (cont’d.)
BiosolidsQuantity Composting
State/Location Status/Operator (dry tons/yr) Method
MISSOURIKansas City Operational WindrowNixa Operational ASPSedalia Operational 320 ASP (ECS4)Springfield Operational WindrowSt. Peters Operational 1,320 ASP (ECS5)MONTANABig Sky Operational 130 In-vessel (ECS)Butte/Silver Bow Operational (Big Butte Compost) 4,000 AWHamilton Operational 50 Windrow (Roto-Mix)Kalispell Operational (Glacier Cold, LLC) 50 ASPLivingston Operational 200 In-vessel (ECS)Missoula Operational (EKO Compost) ASPNEBRASKA Beatrice Operational Windrow (Brown Bear)Grand Island Operational Windrow (Wildcat)Holdredge Operational WindrowKearney Operational Windrow (Wildcat)Lexington Operational Windrow (Wildcat)Omaha (for city of Bellevue) Operational WindrowNEVADABently Agrowdynamics Operational 2,767 WindrowNEW HAMPSHIREClaremont Operational ASPDover Operational ASPMerrimack Operational 1,841 In-vessel (Siemens IPS)Milford Operational ASPNEW JERSEYBuena Borough Operational ASPBurlington County Operational 9,500 In-vessel (Siemens IPS)Cape May County MUA Operational 3,300 In-vessel (Purac)Ocean County Util. Authority Operational 9,500 Windrow (Scarab)Sussux County MUA Operational ASPNEW MEXICO Albuquerque Operational Windrow (Scarab)Artesia Operational 200 Windrow (Brown Bear)Belen Operational Windrow (Brown Bear)Carlsbad Operational 153 WindrowClovis Operational Windrow (Scarab)Farmington Operational WindrowHobbs Operational WindrowLos Alamos County Operational WindrowRoswell Operational Static pileSanta Ana Pueblo Operational WindrowSanta Fe Operational Windrow (Scarab;
Roto-Mix )Tucumcari Operational WindrowNEW YORKArcade Operational 65 In-vesselAttica Operational 180 ASPBath Operational 2,000 In-vessel (Transform;
Supreme)Chenago Cty. Operational 230 ASPClifton Springs Operational 40 ASPDelaware Cty. Co-Composting Operational 7,000 In-vessel (Conporec/
Siemens IPS)Endicott Operational 488 ASPFt. Edwards: Washington Operational 600 ASPCounty SD 11
Gowanda Operational 149 ASP (In-building; ECS1)Greene Operational 12 In-vesselLockport Operational 786 In-vessel (Siemens IPS)Madison County Operational 65 ASP (Kuhn)Manchester-Shortsville Operational 73 ASPMedina Operational 62 ASPMt. Morris Operational 70 Windrow
South Kern, California — aerated static pilecomposting with biofiltration of process air.

treatment”). Links to “compost”showed detailed instructions onusing the compost, describedvarious blends available andtheir various applications, pric-ing, hours of operation and pho-tos of the product being usedand the results.
While some facilities give theircompost away at no charge,most sell the compost andblends at varying prices. For ex-ample, the city of Denton,Texas, which composts about3,200 dry tons/year of biosolids,sells its finished compost in bulkfor $25/cubic yard (cy). The pricerange reported by facilities isfrom $6 to $30+/cy. The value ofbiosolids compost is well-recog-nized in professional markets,commanding fairly high prices,typically in various soil blendsand engineered soils. End usesinclude golf course design, ath-letic field construction, high-profile landscaping projects andstate Departments of Trans-portation roadside applications(e.g., for vegetation establish-ment, slope stabilization andplantings). Having a paying market for the
biosolids compost is an expectedoutcome of most projects today.For example, one fairly new pro-ject in Stafford County, Vir-
ginia, operated by the Rappahannock Re-gional Solid Waste Management Board,set out these market establishment goalsfor its finished product, Rappa-Grow: “Toproduce a high quality soil amendmentmade from biosolids and shredded yardwaste; To sell 20 five-gallon buckets of fin-ished compost each week for the first year,ultimately diverting 4,000 tons of biosolidsand selling up to 1,000 tons of compost an-nually; and To teach 225 residents how tocompost and divert more than 100 tons oforganic waste from the landfill each year.”
In one state, a satisfied biosolids com-post user (a grower) sent a brief note to thetreatment plant commending the nice re-sults experienced in using the city’sbiosolids compost. “If you told me the com-post would help this much I would thinkyou were blowing smoke,” he wrote. “But Iguess I can’t think that way. I soil testedthe field. The organic matter and the cal-cium change are awesome!”
GENERAL TRENDS, CURRENT OBSTACLESFindings of the BioCycle/NEBRA sur-
vey of biosolids composting projects in theU.S. indicate that this managementmethod for wastewater treatment solidsis holding its own. The total number ofprojects is slightly lower in 2010 than in1998, but new facilities are opening andsome existing ones are expanding.
BIOCYCLE DECEMBER 2010 39
Table 2. 2010 BioCycle/NEBRA survey of U.S. biosolids composting projects (cont’d.)
BiosolidsQuantity Composting
State/Location Status/Operator (dry tons/yr) Method
NEW YORK (cont’d.)Newfane Operational 293 In-vesselOntario Operational (LBD Enterprises) 53 ASPRockland County Operational 5,600 In-vessel (Siemens IPS)Schenectady Operational 2,086 In-vessel (ABT)Sodus Operational 20 n/aWappinger Falls: Operational 220 In-vesselTri-Municipal Sewage
Waterville Operational 250 ASPWebster Operational 112 ASPWeedsport Operational 36 AWYorktown Heights Operational 300 ASPNORTH CAROLINABanner Elk Operational n/aBeech Mountain Operational ASPBurlington Operational WindrowBurnsville Operational ASPDallas Operational (Earth Farms, LLC) Windrow (Backhus)Delway Operational (McGill Environmental) ASP (In-building)City of Goldsboro Operational 640 In-vessel (Siemens
IPS; Roto-Mix)Hickory-Catawba Operational 3,129 In-vessel Lexington Operational ASPMerry Oaks Operational (McGill Environmental) ASP (In-building)Morganton Operational ASPRockingham Operational ASPShelby Operational 4,818 In-vessel (Siemens IPS)Valdese Operational ASPOHIOAkron Operational 13,000 In-vessel (Paygro)Columbus Operational 9,000 ASPHamilton WWTP Operational 1,400 In-vessel (WS)Lake County: Mentor WWTF Operational 2,500 ASPOKLAHOMAArdmore Operational 520 In-vessel (Siemens
IPS; Roto-Mix)Grove Operational Windrow (Brown Bear)Oklahoma City-North Canadian Operational WindrowTahlequah Operational WindrowYukon Operational WindrowOREGONGrants Pass: Redwood Operational 769 AWSewer District
Klamath Falls Operational 400 ASPNewberg Operational 682 In-vessel (WS)PENNSYLVANIAAthens: Valley Joint Authority Operational 350 ASPCentre County: University Operational 2,500 In-vessel (Siemens IPS)Area Joint Authority
Indiana Operational 50 ASP (In-building) (Roto-Mix)
Manheim Operational (J.P. Mascaro) ASPMansfield Operational AWMechanicsburg Construction 220 ASPSpringettsbury Twp. Operational ASPTremont Operational WindrowWest Hanover Township Operational (WeCare Organics) 229 Vermicomposting
(Vermitech)RHODE ISLANDBristol Operational 475 In-vessel (Siemens IPS)SOUTH CAROLINAFlorence Operational ASPGrand Strand Water & Sewer/ Operational 700 ASPMyrtle Beach
Kingstree Operational (Williamsburg Recycling) 1,600 In-vessel

“Growth in the biosolids composting mar-ket continues to be steady,” says TimO’Neil, president of Engineered CompostSystems in Seattle, Washington. “We con-tinue to see more of a market for biosolidscomposting in places with reasonable ac-cess to amendment to mix with thebiosolids. One of the biggest challengeswe see is competition from cogeneration— burning wood for energy.”
O’Neil adds that although there is flexi-bility in the types of bulking agent used forcomposting with biosolids, the bottom lineis the biology of the system. “You canskimp, but only to a certain point,” he says.“We have people who use a relatively lowratio of carbon amendments to biosolids.Having a system that is thermally efficientmeans that they can hit PFRP (Process toFurther Reduce Pathogens), but it doesn’tmean they will have a nice smelling com-post. With agitated systems, you can getaway with a little less amendment, butwith static systems you need the bulkingagent for the structure.”
In many parts of the country, land ap-plication of Class B biosolids is still a low-er cost option than composting. In otherplaces, relatively low landfill tipping feesare drawing in more biosolids, especiallywhen access to land application sites de-creases due to land development and/orpublic opposition to current beneficial usepractices.
What is abundantly clear from the con-versations we had with composting facili-
40 BIOCYCLE DECEMBER 2010
Table 2. 2010 BioCycle/NEBRA survey of U.S. biosolids composting projects (cont’d.)
BiosolidsQuantity Composting
State/Location Status/Operator (dry tons/yr) Method
SOUTH DAKOTARapid City Operational 2,100 In-vessel (Siemens IPS)TENNESSEELa Follette Operational ~200 ASPSevierville: Sevier SWA Operational 4,015 In-vessel (Bedminster);
WindrowTEXASAustin: Hornsby Bend WWTP Operational 6,000 Windrow (Scarab)Austin: LCRA Highland Lakes Operational WindrowBelton: Brazos River Authority Operational Windrow (Scarab)Bryan Operational Windrow (Scarab)Copperas Cove Operational Windrow (Scarab)Denton Operational 3,200 Windrow (Scarab)McAllen Operational Windrow (Scarab)San Antonio: Leon Creek Operational (Garden-Ville/Texas Disp.) 17,600 Windrow (Scarab)San Antonio: New Earth Soils Operational 18,700 Windrow (Backhus)Texarkana Operational 1,294 Windrow (KW)UTAHAmerican Fork: Timpanogos Operational Enc. ASP (GORE)Spec. Serv. District
Brigham City Operational WindrowCentral Davis County Operational Windrow (Roto-Mix)Central Weber Operational WindrowCoalville Operational WindrowOrem Operational ASPPark City: Snydersville Basin Operational ASPProvo Operational WindrowSalt Lake City: Central Valley Construction Enc. ASP/Windrow
(MOR, Transform,Scarab, Roto-Mix)
South Davis County Operational ASP/WindrowSpringville Operational WindrowSt. George Operational WindrowSyracuse: Operational 2,500 WindrowNorth Davis Sewer District
Tremonton Operational ASPWest Jordan: South Valley WRF Operational Windrow (Scarab)VERMONTBennington Operational 160 In-vessel (Siemens IPS)Springfield Operational 150 ASPWilmington Operational 12 In-vessel
(Green Mountain)VIRGINIAFranklin Operational ASPHarrisonburg/Rockingham Operational 4,250 ASPLivingston Operational ASP (Kuhn; ECS6)Luray Operational n/aNew Market Operational ASPSpotsylvania County Operational 12,000 ASP (Kuhn)Stafford: Rappahannock Operational WindrowRegional SWMB
Virginia Beach: Operational 4,180 ASPHamptonRoads San. District
Waverly Operational (McGill Environmental) ASP (In-building)WASHINGTONArlington Operational 500 ASP (ECS7)Benton County: Planning 748 n/aHorn Rapids Landfill
Chelan County Operational 139 WindrowCheney Operational 260 ASP (In-building;
Roto-Mix)Columbia County Operational n/aEntiat Operational 25 WindrowEverett Operational 500 Enc. ASP (ECS)Forks: Olympic Corrections Operational 10 ASPCenter WWTP
St. Peters, Missouri — aerated static pilecomposting with stationary mixer to blendbiosolids and ground yard trimmings.
ty operators is that they are having a pos-itive experience with their facilities, bothin terms of their operations and the qual-ity — and widespread popularity — oftheir end products. Whereas in 1998 therewere more stories related to challengeswith odor emissions, this survey did notfind that being reported. The level ofknowledge about how to effectively con-trol odors and troubleshoot other opera-tional challenges (e.g., too wet, too dry) ishigh, and there are plenty of veteran com-posters in most states who can assist theircolleagues when problems arise. Clearly,the successful track record of facilities op-erating for decades builds greater confi-dence in the process and product. Addi-tionally, vendors of compostingequipment, who also now have decades ofexperience under their belts withbiosolids composting, are an ongoingsource of assistance — as are new prod-ucts and technologies to improve processcontrol and product quality.
One trend to track is more regionaliza-tion of biosolids composting, with largerfacilities designed to process biosolidsfrom other treatment plants in their area.Part II in the January 2011 issue will ex-plore that trend in more depth based oninterviews with several of these largerprojects.
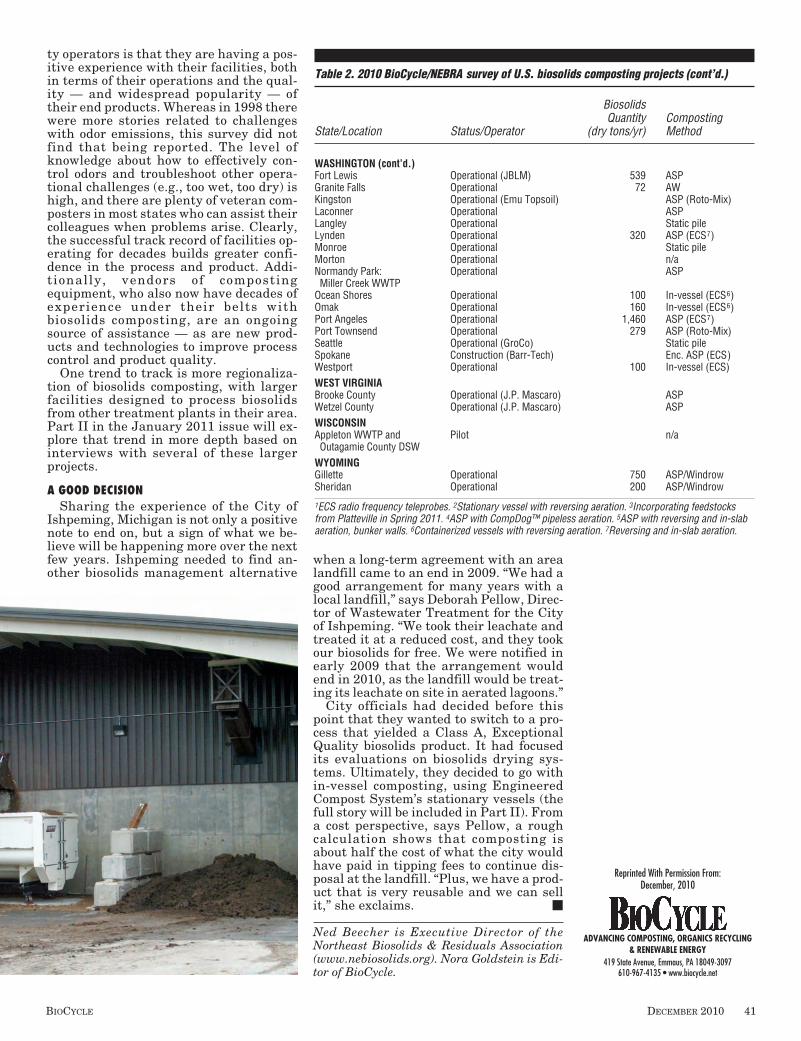
A GOOD DECISIONSharing the experience of the City of
Ishpeming, Michigan is not only a positivenote to end on, but a sign of what we be-lieve will be happening more over the nextfew years. Ishpeming needed to find an-other biosolids management alternative
when a long-term agreement with an arealandfill came to an end in 2009. “We had agood arrangement for many years with alocal landfill,” says Deborah Pellow, Direc-tor of Wastewater Treatment for the Cityof Ishpeming. “We took their leachate andtreated it at a reduced cost, and they tookour biosolids for free. We were notified inearly 2009 that the arrangement wouldend in 2010, as the landfill would be treat-ing its leachate on site in aerated lagoons.”
City officials had decided before thispoint that they wanted to switch to a pro-cess that yielded a Class A, ExceptionalQuality biosolids product. It had focusedits evaluations on biosolids drying sys-tems. Ultimately, they decided to go within-vessel composting, using EngineeredCompost System’s stationary vessels (thefull story will be included in Part II). Froma cost perspective, says Pellow, a roughcalculation shows that composting isabout half the cost of what the city wouldhave paid in tipping fees to continue dis-posal at the landfill. “Plus, we have a prod-uct that is very reusable and we can sellit,” she exclaims. �
Ned Beecher is Executive Director of theNortheast Biosolids & Residuals Association(www.nebiosolids.org). Nora Goldstein is Edi-tor of BioCycle.
BIOCYCLE DECEMBER 2010 41
Table 2. 2010 BioCycle/NEBRA survey of U.S. biosolids composting projects (cont’d.)
BiosolidsQuantity Composting
State/Location Status/Operator (dry tons/yr) Method
WASHINGTON (cont’d.)Fort Lewis Operational (JBLM) 539 ASPGranite Falls Operational 72 AWKingston Operational (Emu Topsoil) ASP (Roto-Mix)Laconner Operational ASPLangley Operational Static pileLynden Operational 320 ASP (ECS7)Monroe Operational Static pileMorton Operational n/aNormandy Park: Operational ASPMiller Creek WWTP
Ocean Shores Operational 100 In-vessel (ECS6)Omak Operational 160 In-vessel (ECS6)Port Angeles Operational 1,460 ASP (ECS7)Port Townsend Operational 279 ASP (Roto-Mix)Seattle Operational (GroCo) Static pileSpokane Construction (Barr-Tech) Enc. ASP (ECS)Westport Operational 100 In-vessel (ECS)WEST VIRGINIABrooke County Operational (J.P. Mascaro) ASPWetzel County Operational (J.P. Mascaro) ASPWISCONSINAppleton WWTP and Pilot n/aOutagamie County DSW
WYOMINGGillette Operational 750 ASP/WindrowSheridan Operational 200 ASP/Windrow
1ECS radio frequency teleprobes. 2Stationary vessel with reversing aeration. 3Incorporating feedstocksfrom Platteville in Spring 2011. 4ASP with CompDog™ pipeless aeration. 5ASP with reversing and in-slabaeration, bunker walls. 6Containerized vessels with reversing aeration. 7Reversing and in-slab aeration.
ADVANCING COMPOSTING, ORGANICS RECYCLING& RENEWABLE ENERGY
419 State Avenue, Emmaus, PA 18049-3097610-967-4135 • www.biocycle.net
Reprinted With Permission From:December, 2010