Embed Size (px)
Citation preview
Biosensors and Bioelectronics 48 (2013) 145–152
Contents lists available at SciVerse ScienceDirect
Biosensors and Bioelectronics
0956-56http://d
n CorrE-m1 Th
journal homepage: www.elsevier.com/locate/bios
Ultrafast molecular motor driven nanoseparation and biosensing
Mercy Lard a,1, Lasse ten Siethoff b,1, Saroj Kumar b, Malin Persson b, Geertruy te Kronnie c,Heiner Linke a, Alf Månsson b,n
a The Nanometer Structure Consortium (nmC@LU), Division of Solid State Physics, Lund University, SE-221 00 Lund, Swedenb Department of Chemistry and Biomedical Sciences, Linnaeus University, SE-391 82 Kalmar, Swedenc Department of Women's and Children's Health, University of Padova, 35131 Padova, Italy
a r t i c l e i n f o
Article history:Received 16 January 2013Received in revised form27 March 2013Accepted 28 March 2013Available online 6 April 2013
Keywords:Actin filamentDiagnosticsElectron beam lithographyHeavy meromyosinNanoseparationMonte-Carlo simulation
63/$ - see front matter & 2013 Elsevier B.V. Ax.doi.org/10.1016/j.bios.2013.03.071
esponding author. Tel.: +46 480 446 243; fax:ail address: [email protected] (A. Månsson).ese authors contributed equally to this work
a b s t r a c t
Portable biosensor systems would benefit from reduced dependency on external power supplies as wellas from further miniaturization and increased detection rate. Systems built around self-propelledbiological molecular motors and cytoskeletal filaments hold significant promise in these regards as theyare built from nanoscale components that enable nanoseparation independent of fluidic pumping.Previously reported microtubule-kinesin based devices are slow, however, compared to several existingbiosensor systems. Here we demonstrate that this speed limitation can be overcome by using the fasteractomyosin motor system. Moreover, due to lower flexural rigidity of the actin filaments, smaller featurescan be achieved compared to microtubule-based systems, enabling further miniaturization. Using adevice designed through optimization by Monte Carlo simulations, we demonstrate extensive myosindriven enrichment of actin filaments on a detector area of less than 10 μm2, with a concentration half-time of approximately 40 s. We also show accumulation of model analyte (streptavidin at nanomolarconcentration in nanoliter effective volume) detecting increased fluorescence intensity within secondsafter initiation of motor-driven transportation from capture regions. We discuss further optimizations ofthe system and incorporation into a complete biosensing workflow.
& 2013 Elsevier B.V. All rights reserved.
1. Introduction
Portable biosensors with increased sensitivity, rate of detectionand capacity for multiplexing (Giljohann and Mirkin, 2009; Jokerstet al., 2010; Ng et al., 2010) are of appreciable interest forimproved point-of-care medical diagnostics and related applica-tions. Realizations of high-performance devices have been pro-posed using nanostructures (Giljohann and Mirkin, 2009; Leeet al., 2004; Nam et al., 2003; Zhang et al., 2005a, 2005b)combined with microfluidics/nanofluidics for specific concentra-tion of analytes from a complex sample mixture (Jokerst et al.,2010; Ng et al., 2010; Whitesides, 2006). However, particularlynanofluidics requires strong driving forces for liquid transport(Månsson et al., 2005), and depends on bulky accessory equipmentsuch as pumps and various control devices (Jokerst et al., 2010;Whitesides, 2006). One way to circumvent these problems wouldbe to use Adenosine-5'-triphosphate (ATP)-driven biological mole-cular motors for separation and concentration of analyte mole-cules on detector sites (Fischer et al., 2009; Korten et al., 2010;
ll rights reserved.
+46 480 446 262.
.
Lin et al., 2008). In this process, the analyte molecules are linked tomotor-propelled cytoskeletal filament shuttles (Bachand et al.,2006; Brunner et al., 2007; Hess et al., 2001; Månsson et al.,2004; Ramachandran et al., 2006) and guided on nanopatternedsurfaces (Ashikari et al., 2012; Bunk et al., 2005b; Byun et al., 2007;Hess et al., 2001; Nicolau et al., 1999; Sundberg et al., 2006b;Suzuki et al., 1997) to the desired sites. In addition to advantagesover microfluidics driven separation, the actual detection ofanalytes may be achieved in unique ways using motor drivendevices e.g. by the actual observation of cotransportation offilaments and analytes (e.g. Korten et al., 2013). One automatedapproach that combines this unique biosensing principle withseparation is transportation of analytes to a pre-determineddetection site that can be readily reached only by motor driventransportation. Whereas proof-of-principle devices of this typehave been reported using the microtubule-kinesin motor system(Fischer et al., 2009; Lin et al., 2008) these devices have shownorders of magnitude, lower rates of detection than other high-sensitivity methods (Georganopoulou et al., 2005; Mulvaney et al.,2009; Nam et al., 2003; Rissin et al., 2010).
A way to overcome the limitations in speed may be to usemyosin-propelled actin filaments that are ten-fold faster thankinesin-propelled microtubules. This idea is supported by therecent demonstration of consistent heavy meromyosin (HMM)
M. Lard et al. / Biosensors and Bioelectronics 48 (2013) 145–152146
driven transportation of a large number of antibody–antigencomplexes (Kumar et al., 2012). Moreover, the low flexural rigidity(Vikhorev et al., 2008a) of actin filaments compared to micro-tubules would enable more extensive miniaturization that mayalso contribute to further increased detection rate. We thushypothesize that actin filaments can be concentrated by myosindriven transport, orders of magnitude faster than in previousmotor driven devices (Fischer et al., 2009; Lin et al., 2008).Moreover, we expect that the use of actin filaments allows furtherminiaturization, e.g. of the detector site, with favorable effects onthe signal/noise ratio (Katira and Hess, 2010b). With the aim totest these ideas, we first present experiments using a genericconcentrator device to validate a Monte-Carlo simulation approach(Nitta et al., 2006, 2008) that is then used for rational design ofan optimized device. Experiments employing the latter deviceshowed rates of concentration that were nearly two orders ofmagnitude faster than in earlier motor-driven devices but alsofaster than key amplification steps in non-motor based diagnostictests (Georganopoulou et al., 2005; Nam et al., 2003). Moreover,further miniaturization compared to microtubule-kinesin devices,allowed actin filament capture and subsequent guidance to detec-tor site of less than 10 μm2 total area. We discuss furtheroptimizations and the most effective incorporation of the testeddevice into complete workflows for high-sensitivity detection ofanalytes in, for example, clinical diagnostics and environmentalmonitoring.
2. Materials and methods
2.1. Nanostructuring and surface preparation
An SiO2 layer of 825 nm thickness was grown by wet thermaloxidation on a Si wafer followed by covering with lift-off resist(LOR 0.7A; Microchem Corporation, Newton, MA, USA) using spincoating at 1500 RPM for 30 s and subsequent baking at 180 1C for15 min on a hot plate. Next, polymethylmethacrylate, (PMMA950A5; Microchem Corporation, Newton, MA, USA)was spin-coated on top at 6000 RPM for 60 s, followed by bakingat 160 1C for 15 min. This PMMA resist layer was exposed byelectron-beam lithography (EBL; Raith 150, Dortmund, Germany)giving top line widths of approximately 185 nm in the PMMA. ThePMMA was then developed with methyl isobutyl ketone andisopropanol (MIBK:IPA; Merck KGaA, Darmstadt, Germany) at aratio of 1:3 for 1 min, followed by rinsing with IPA for 30 s. Next,the sample was subjected to O2 plasma ashing in a Plasma Preen at5 mBar for 15 s. Then, the LOR layer was etched with MF-319:H2O(Microposit MF-319 Developer, Rohm and Haas Electronic Materi-als, Coventry, UK) in the ratio 1:1 for 4 min and rinsed with H2Ofor 30 s to halt etching. The resulting width of the bottomchannel was 260 nm, with an under-cut of approximately 40 nmfrom the opening of the top channel (Fig. 1b). The sample was thentreated with another plasma ashing step at 5 mBar for 15 s inorder to remove possible LOR residue on the bottom of thechannel and making the PMMA hydrophilic and thereby incapableof supporting motility. Finally, the sample was silanized, in achemical vapor phase deposition (CVD) process (Bunk et al.,2005a; Sundberg et al., 2003), with trimethylchlorosilane (TMCS,497%, GC, Sigma-Aldrich, Sweden AB, Stockholm, Sweden) in aclosed glass container inside a glove box, with sub-ppm levels ofO2 and H2O. As a final step before the in vitro motility assayprocedure, the sample was steamed in a deionized water bath for30 s to wet the channels and remove possible air bubbles. Thesurfaces were rinsed in distilled water for 10 min prior to use.The above account describes the key steps in producing thefirst generation concentration device. The second-generation
concentration device was fabricated in a similar way but withoutany LOR layer (Fig. 4a).
2.2. Protein preparations and in vitro motility assays
Myosin II was purified from rabbit fast skeletal muscle (Sataet al., 1993) and then digested by α-chymotrypsin to yield HMM(Kron et al., 1991). Actin filaments were prepared from rabbitskeletal muscle (Pardee and Spudich, 1982) and fluorescentlylabeled with Alexa Fluor 488s phalloidin (APh) or tetramethylr-hodamineisothiocyanate (TRITC)–phalloidin (RhPh; MolecularProbes Invitrogen, Eugene, OR) (Balaz and Mansson, 2005).
Flow cells were constructed from one cover-slip and onenanostructured chip on top with double-sided sticky tape asspacers. All solutions that were added to the flow cell were basedon buffer A (1 mM MgCl2, 10 mM 3-(N-morpholino)propanesulfo-nic acid MOPS, 0.1 mM K2-ethylene glycol tetraacetic acid (EGTA),pH 7.4) and all proteins were diluted in buffer B (buffer A with1 mM dithiothreitol (DTT) and 50 mM KCl). The flow cell was pre-incubated essentially as described previously (Kron et al., 1991;Sundberg et al., 2006b): (i) HMM (120 μg mL−1) for 4 min, (ii)bovine serum albumin (BSA; 1 mg mL−1) for 1 min, (iii) blockingactin (1 μM unlabeled sheared actin filaments with 1 mM MgATP)for 2 min. These pre-incubation steps were followed by (iv) washwith a50 assay solution (buffer A with 10 mM DTT, 1 mM MgATP,35 mM KCl, ionic strength 50 mM) and (v) addition of actinfilaments at 10 nM (second generation) or 100 nM (first genera-tion). After an incubation period of 1 min, flow cells were washedwith buffer B and (vi) incubated with rigor solution (r60) for initialobservation in the microscope. The latter solution had the samecomposition as the a50 solution but without MgATP and with 45 mMinstead of 35 mM KCl, giving an ionic strength 60 mM.An anti bleach mixture of 3 mg mL−1 glucose, 100 μg mL−1 glucoseoxidase and 870 UmL−1 catalase was added. Soon after the recordingwas started, flow cells were (vii) incubated with a60 solution (r60with 1 mM MgATP and an ATP re-generating system: 2.5 mMcreatine phosphate and 3.5 U mL−1 creatine phosphokinase). Forthe second generation concentrator device the procedure was similaras described above, but the incubation step with block actin andsubsequent washing steps (steps iii and iv) were omitted.
To demonstrate analyte concentration we rinsed the secondgeneration device after previous use with (i) a130 solution (similarto a60 but with an ionic strength of 130 mM) and (ii) buffer Bbefore incubation with (iii) 10 nM biotinylated APh labeled actinfilaments for one minute. The flow cell was then rinsed with (iv)buffer B and, incubated with (v) TRITC–streptavidin (2 nM) for oneminute. To block remaining sites on streptavidin and avoid cross-linking of filaments via streptavidin–biotin links, the flow cell wasthen rinsed with (vi) biotin (30 μM). Subsequently, (vii) buffer Bwas infused. Flow cells were then incubated with (viii) r60solution and observed in the microscope before motility wasinduced by (ix) addition of a60 solution.
2.3. Data collection and analysis of in vitro motility assays
Fluorescently labeled actin filaments were observed usinga Nikon Eclipse TE300 inverted fluorescence microscope (NikonCorporation, Tokyo, Japan) equipped with a temperature-regulatedNikon (100� 1.4 NA) oil immersion objective and TRITC (Ex. 540/25, DM 565, and BA 605/25) and FITC (Ex. 465–495, DM 505, andBA 515–555) filter sets. A cooled Hammamtsu EMCCD camera(C9100-12) was used to record image sequences (Persson et al.,2010) which were then analyzed using algorithms developed inthe MATLAB (Mathworks Inc., Natick, MA; Mansson and Tagerud,2003). Image sequences were further analyzed using Image J(Rasband, W.S., ImageJ, U S National Institutes of Health, Bethesda,
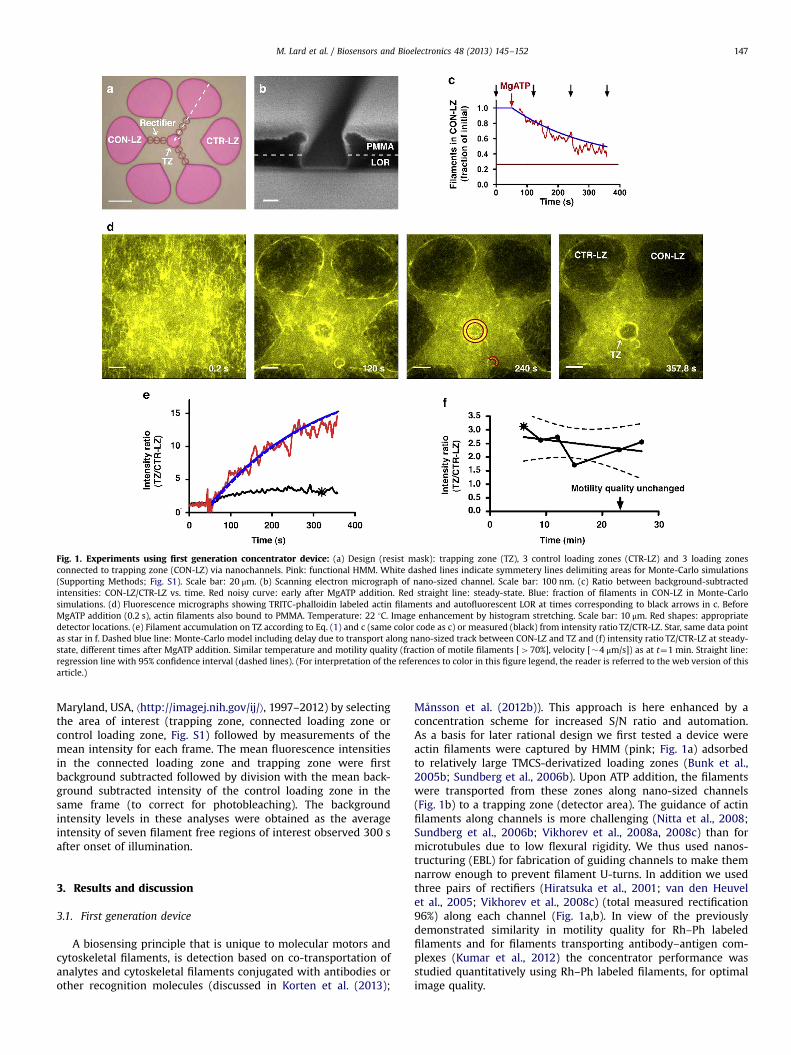
Fig. 1. Experiments using first generation concentrator device: (a) Design (resist mask): trapping zone (TZ), 3 control loading zones (CTR-LZ) and 3 loading zonesconnected to trapping zone (CON-LZ) via nanochannels. Pink: functional HMM. White dashed lines indicate symmetery lines delimiting areas for Monte-Carlo simulations(Supporting Methods; Fig. S1). Scale bar: 20 μm. (b) Scanning electron micrograph of nano-sized channel. Scale bar: 100 nm. (c) Ratio between background-subtractedintensities: CON-LZ/CTR-LZ vs. time. Red noisy curve: early after MgATP addition. Red straight line: steady-state. Blue: fraction of filaments in CON-LZ in Monte-Carlosimulations. (d) Fluorescence micrographs showing TRITC-phalloidin labeled actin filaments and autofluorescent LOR at times corresponding to black arrows in c. BeforeMgATP addition (0.2 s), actin filaments also bound to PMMA. Temperature: 22 1C. Image enhancement by histogram stretching. Scale bar: 10 μm. Red shapes: appropriatedetector locations. (e) Filament accumulation on TZ according to Eq. (1) and c (same color code as c) or measured (black) from intensity ratio TZ/CTR-LZ. Star, same data pointas star in f. Dashed blue line: Monte-Carlo model including delay due to transport along nano-sized track between CON-LZ and TZ and (f) intensity ratio TZ/CTR-LZ at steady-state, different times after MgATP addition. Similar temperature and motility quality (fraction of motile filaments [470%], velocity [�4 μm/s]) as at t¼1 min. Straight line:regression line with 95% confidence interval (dashed lines). (For interpretation of the references to color in this figure legend, the reader is referred to the web version of thisarticle.)
M. Lard et al. / Biosensors and Bioelectronics 48 (2013) 145–152 147
Maryland, USA, ⟨http://imagej.nih.gov/ij/⟩, 1997–2012) by selectingthe area of interest (trapping zone, connected loading zone orcontrol loading zone, Fig. S1) followed by measurements of themean intensity for each frame. The mean fluorescence intensitiesin the connected loading zone and trapping zone were firstbackground subtracted followed by division with the mean back-ground subtracted intensity of the control loading zone in thesame frame (to correct for photobleaching). The backgroundintensity levels in these analyses were obtained as the averageintensity of seven filament free regions of interest observed 300 safter onset of illumination.
3. Results and discussion
3.1. First generation device
A biosensing principle that is unique to molecular motors andcytoskeletal filaments, is detection based on co-transportation ofanalytes and cytoskeletal filaments conjugated with antibodies orother recognition molecules (discussed in Korten et al. (2013);
Månsson et al. (2012b)). This approach is here enhanced by aconcentration scheme for increased S/N ratio and automation.As a basis for later rational design we first tested a device wereactin filaments were captured by HMM (pink; Fig. 1a) adsorbedto relatively large TMCS-derivatized loading zones (Bunk et al.,2005b; Sundberg et al., 2006b). Upon ATP addition, the filamentswere transported from these zones along nano-sized channels(Fig. 1b) to a trapping zone (detector area). The guidance of actinfilaments along channels is more challenging (Nitta et al., 2008;Sundberg et al., 2006b; Vikhorev et al., 2008a, 2008c) than formicrotubules due to low flexural rigidity. We thus used nanos-tructuring (EBL) for fabrication of guiding channels to make themnarrow enough to prevent filament U-turns. In addition we usedthree pairs of rectifiers (Hiratsuka et al., 2001; van den Heuvelet al., 2005; Vikhorev et al., 2008c) (total measured rectification96%) along each channel (Fig. 1a,b). In view of the previouslydemonstrated similarity in motility quality for Rh–Ph labeledfilaments and for filaments transporting antibody–antigen com-plexes (Kumar et al., 2012) the concentrator performance wasstudied quantitatively using Rh–Ph labeled filaments, for optimalimage quality.
M. Lard et al. / Biosensors and Bioelectronics 48 (2013) 145–152148
The background-subtracted fluorescence intensity ratio (Fig. 1c)between loading zones connected to trapping zones (CON-LZ;Fig. 1a) and control loading zones (CTR-LZ) without such connec-tion, reports the approximate change in the number of filamentson the connected loading zones corrected for photobleaching, (seefurther Fig. S2). This ratio decreased (Fig. 1d, Movie S1) with anexponential time course that was well reproduced (Fig. 1c) byMonte-Carlo simulations for a similar geometry and filamentsliding velocity (details below). The expected ratio betweenaverage filament density in the trapping zone at infinite time (atsteady-state; CT
SS) and at time 0 s (Ci) is given by (SupportingInformation Results and Discussion):
CTSS
Ci≈
kþfðkþ þ k�Þ
AL
ATþ 1
� �ð1Þ
Here, the quantities k+ and k− are rate constants of filament-transitions from the loading zone and trapping zone, respectively.Further, f is the fraction of motile filaments and AL and AT is thearea of the connected loading zones and the trapping zone,respectively. For the experiment in Fig. 1, with 3 connected loadingzones, AL/AT≈3438 μm2/123 μm2≈27.9 and kþf =ðkþ þ k�Þ≈0:7 (1-fraction of filaments remaining in connected loading zones atsteady-state; straight line in Fig. 1c). From Eq. (1) and the observedtime course in Fig. 1c the number of filaments in the trapping zoneis predicted to increase as indicated by the red line in Fig. 1e to asteady-state value about 20 times the initial value. This is about 10times larger than the observed increase (2.470.2 times; n¼5;black line in Fig. 1e), a difference that we attribute to loss offilaments (Fig. S3) from the trapping zone at high filamentdensities. That similar detachment of filaments from the trappingzone did not occur at moderate and low filament densities isindicated by a nearly constant intensity ratio between trappingzone and control loading zone for 420 min after attainment ofsteady-state (Fig. 1f).
The detachment and the associated deviation between experi-ments and simulations are likely to be seriously aggravated by thepresence of blocking actin. The blocking actin filaments are notfluorescence labeled and added at about 1 μM prior to addition offluorescence labeled actin filaments (added at nannomolar con-centrations). The purpose is to block rigor HMM heads that mayotherwise interfere with the transportation of fluorescent actinfilaments but a large fraction of the blocking actin filaments areactually motile (Sundberg et al., 2006a) and will compete withfluorescent filaments for HMM binding sites. The competition isparticularly severe when the filaments become enriched in thetrapping zone, emphasizing the importance of omitting blockingactin when using nanostructured concentration devices. This isalso done in the tests below.
The filament density distribution in the trapping zone wasspatially non-uniform (Fig. 1d) with 2.770.3 times (mean7-standard error of the mean [SEM]; n¼3) higher filament density(from intensity data) within 1 μm from the trapping zone edgethan at the center. Filaments also exhibited high local density inthe semi-circular part of the rectifier structure. This suggests thatthe signal-to-noise ratio would be enhanced with detectorslocated in such regions (see highlighted red regions in Fig. 1d)and that the trapping zones may be modified to circular loops (seebelow).
3.2. Monte-Carlo simulations for rational concentrator design
For cytoskeletal filaments propelled by molecular motorson a surface without chemical or topographical patterns (flatsurfaces) the instantaneous angular changes in sliding directionare expected to be the Gaussian with mean 0 rad and standarddeviation, SD¼ ffiffiffiffiffiffiffiffiffiffiffiffiffiffiffiffiffi
vfΔt=LPp
where vf is the sliding velocity, Δt is the
time interval between subsequent updates in sliding direction and LPis the filament persistence length (Duke et al., 1995; Nitta and Hess,2005; Vikhorev et al., 2008a, 2008c). At walls, designed to guideapproaching filaments with close to 100% probability (as used here),the random diffusion-like motion is prevented (Clemmens et al.,2003a, 2003b; Sundberg et al., 2006b; van den Heuvel et al., 2005) asthe filaments are forced to follow the walls.
On the above grounds, we simulated the behavior of anensemble of actin filaments in a concentrator device similar tothat in Fig. 1 using a Monte-Carlo approach (Nitta et al., 2006,2008). In the present study the simulations were implemented inthe Matlab with the filament behavior at the walls treated aspreviously (Månsson et al., 2012a). Further details are given in thesupporting information but it is of relevance to mention here thatthe loading zone shape was defined by a combination of anelliptical and triangular region (Fig. S1).
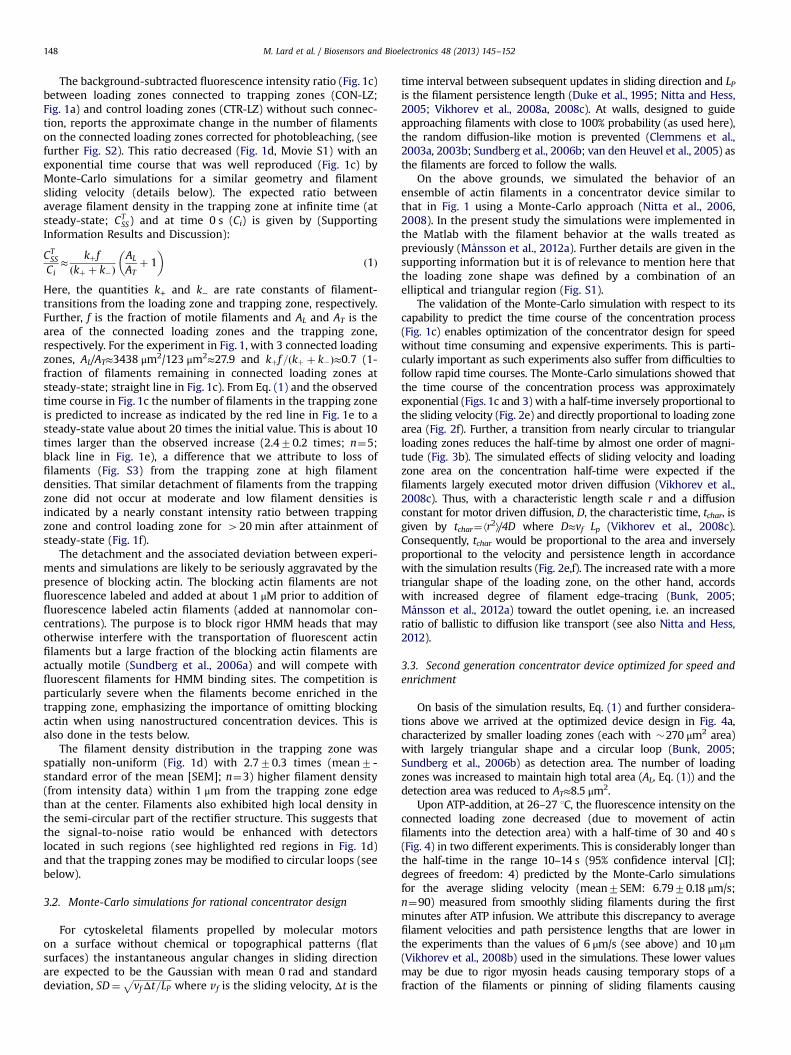
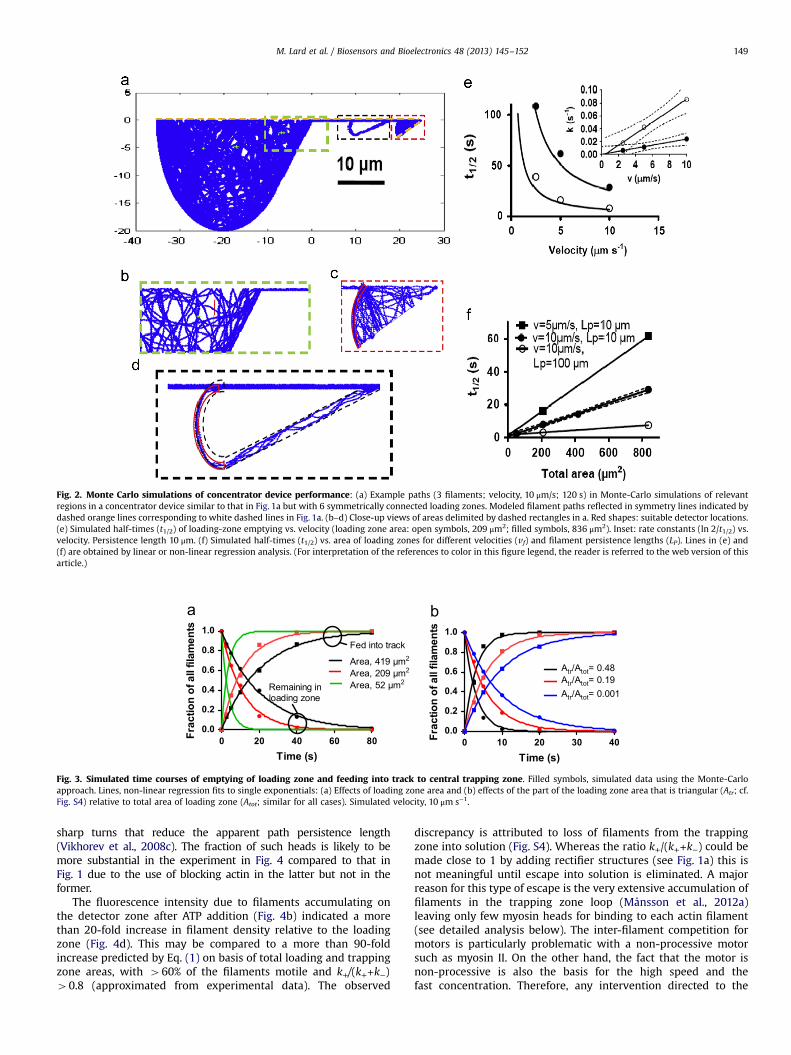
The validation of the Monte-Carlo simulation with respect to itscapability to predict the time course of the concentration process(Fig. 1c) enables optimization of the concentrator design for speedwithout time consuming and expensive experiments. This is parti-cularly important as such experiments also suffer from difficulties tofollow rapid time courses. The Monte-Carlo simulations showed thatthe time course of the concentration process was approximatelyexponential (Figs. 1c and 3) with a half-time inversely proportional tothe sliding velocity (Fig. 2e) and directly proportional to loading zonearea (Fig. 2f). Further, a transition from nearly circular to triangularloading zones reduces the half-time by almost one order of magni-tude (Fig. 3b). The simulated effects of sliding velocity and loadingzone area on the concentration half-time were expected if thefilaments largely executed motor driven diffusion (Vikhorev et al.,2008c). Thus, with a characteristic length scale r and a diffusionconstant for motor driven diffusion, D, the characteristic time, tchar, isgiven by tchar¼⟨r2⟩/4D where D≈vf Lp (Vikhorev et al., 2008c).Consequently, tchar would be proportional to the area and inverselyproportional to the velocity and persistence length in accordancewith the simulation results (Fig. 2e,f). The increased rate with a moretriangular shape of the loading zone, on the other hand, accordswith increased degree of filament edge-tracing (Bunk, 2005;Månsson et al., 2012a) toward the outlet opening, i.e. an increasedratio of ballistic to diffusion like transport (see also Nitta and Hess,2012).
3.3. Second generation concentrator device optimized for speed andenrichment
On basis of the simulation results, Eq. (1) and further considera-tions above we arrived at the optimized device design in Fig. 4a,characterized by smaller loading zones (each with �270 μm2 area)with largely triangular shape and a circular loop (Bunk, 2005;Sundberg et al., 2006b) as detection area. The number of loadingzones was increased to maintain high total area (AL, Eq. (1)) and thedetection area was reduced to AT≈8.5 μm2.
Upon ATP-addition, at 26–27 1C, the fluorescence intensity on theconnected loading zone decreased (due to movement of actinfilaments into the detection area) with a half-time of 30 and 40 s(Fig. 4) in two different experiments. This is considerably longer thanthe half-time in the range 10–14 s (95% confidence interval [CI];degrees of freedom: 4) predicted by the Monte-Carlo simulationsfor the average sliding velocity (mean7SEM: 6.7970.18 μm/s;n¼90) measured from smoothly sliding filaments during the firstminutes after ATP infusion. We attribute this discrepancy to averagefilament velocities and path persistence lengths that are lower inthe experiments than the values of 6 μm/s (see above) and 10 μm(Vikhorev et al., 2008b) used in the simulations. These lower valuesmay be due to rigor myosin heads causing temporary stops of afraction of the filaments or pinning of sliding filaments causing
0 10 20 30 400.0
0.2
0.4
0.6
0.8
1.0
Atr/Atot= 0.48Atr/Atot= 0.19Atr/Atot= 0.001
Time (s)
Frac
tion
of a
ll fil
amen
ts
0 20 40 60 800.0
0.2
0.4
0.6
0.8
1.0
Area, 52 μm2
Area, 419 μm2
Fed into track
Remaining inloading zone
Area, 209 μm2
Time (s)
Frac
tion
of a
ll fil
amen
ts
Fig. 3. Simulated time courses of emptying of loading zone and feeding into track to central trapping zone. Filled symbols, simulated data using the Monte-Carloapproach. Lines, non-linear regression fits to single exponentials: (a) Effects of loading zone area and (b) effects of the part of the loading zone area that is triangular (Atr; cf.Fig. S4) relative to total area of loading zone (Atot; similar for all cases). Simulated velocity, 10 μm s−1.
Fig. 2. Monte Carlo simulations of concentrator device performance: (a) Example paths (3 filaments; velocity, 10 μm/s; 120 s) in Monte-Carlo simulations of relevantregions in a concentrator device similar to that in Fig. 1a but with 6 symmetrically connected loading zones. Modeled filament paths reflected in symmetry lines indicated bydashed orange lines corresponding to white dashed lines in Fig. 1a. (b–d) Close-up views of areas delimited by dashed rectangles in a. Red shapes: suitable detector locations.(e) Simulated half-times (t1/2) of loading-zone emptying vs. velocity (loading zone area: open symbols, 209 μm2; filled symbols, 836 μm2). Inset: rate constants (ln 2/t1/2) vs.velocity. Persistence length 10 μm. (f) Simulated half-times (t1/2) vs. area of loading zones for different velocities (vf) and filament persistence lengths (LP). Lines in (e) and(f) are obtained by linear or non-linear regression analysis. (For interpretation of the references to color in this figure legend, the reader is referred to the web version of thisarticle.)
M. Lard et al. / Biosensors and Bioelectronics 48 (2013) 145–152 149
sharp turns that reduce the apparent path persistence length(Vikhorev et al., 2008c). The fraction of such heads is likely to bemore substantial in the experiment in Fig. 4 compared to that inFig. 1 due to the use of blocking actin in the latter but not in theformer.
The fluorescence intensity due to filaments accumulating onthe detector zone after ATP addition (Fig. 4b) indicated a morethan 20-fold increase in filament density relative to the loadingzone (Fig. 4d). This may be compared to a more than 90-foldincrease predicted by Eq. (1) on basis of total loading and trappingzone areas, with 460% of the filaments motile and k+/(k++k−)40.8 (approximated from experimental data). The observed
discrepancy is attributed to loss of filaments from the trappingzone into solution (Fig. S4). Whereas the ratio k+/(k++k−) could bemade close to 1 by adding rectifier structures (see Fig. 1a) this isnot meaningful until escape into solution is eliminated. A majorreason for this type of escape is the very extensive accumulation offilaments in the trapping zone loop (Månsson et al., 2012a)leaving only few myosin heads for binding to each actin filament(see detailed analysis below). The inter-filament competition formotors is particularly problematic with a non-processive motorsuch as myosin II. On the other hand, the fact that the motor isnon-processive is also the basis for the high speed and thefast concentration. Therefore, any intervention directed to the
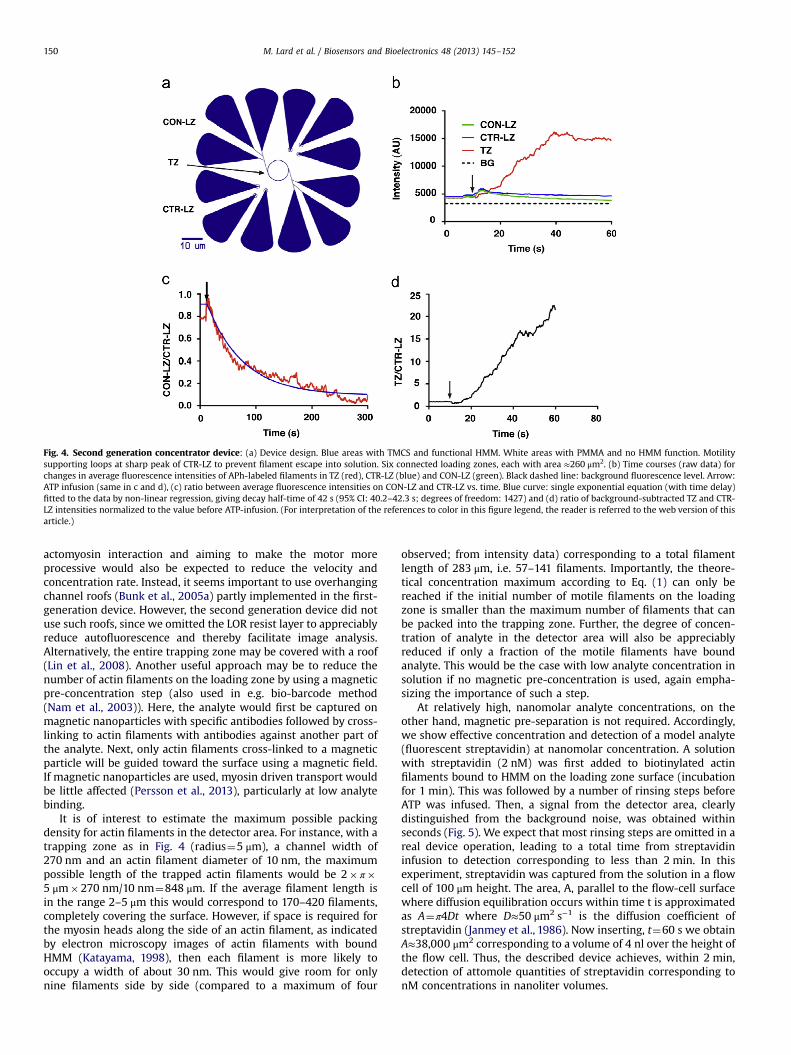
Fig. 4. Second generation concentrator device: (a) Device design. Blue areas with TMCS and functional HMM. White areas with PMMA and no HMM function. Motilitysupporting loops at sharp peak of CTR-LZ to prevent filament escape into solution. Six connected loading zones, each with area ≈260 μm2. (b) Time courses (raw data) forchanges in average fluorescence intensities of APh-labeled filaments in TZ (red), CTR-LZ (blue) and CON-LZ (green). Black dashed line: background fluorescence level. Arrow:ATP infusion (same in c and d), (c) ratio between average fluorescence intensities on CON-LZ and CTR-LZ vs. time. Blue curve: single exponential equation (with time delay)fitted to the data by non-linear regression, giving decay half-time of 42 s (95% CI: 40.2–42.3 s; degrees of freedom: 1427) and (d) ratio of background-subtracted TZ and CTR-LZ intensities normalized to the value before ATP-infusion. (For interpretation of the references to color in this figure legend, the reader is referred to the web version of thisarticle.)
M. Lard et al. / Biosensors and Bioelectronics 48 (2013) 145–152150
actomyosin interaction and aiming to make the motor moreprocessive would also be expected to reduce the velocity andconcentration rate. Instead, it seems important to use overhangingchannel roofs (Bunk et al., 2005a) partly implemented in the first-generation device. However, the second generation device did notuse such roofs, since we omitted the LOR resist layer to appreciablyreduce autofluorescence and thereby facilitate image analysis.Alternatively, the entire trapping zone may be covered with a roof(Lin et al., 2008). Another useful approach may be to reduce thenumber of actin filaments on the loading zone by using a magneticpre-concentration step (also used in e.g. bio-barcode method(Nam et al., 2003)). Here, the analyte would first be captured onmagnetic nanoparticles with specific antibodies followed by cross-linking to actin filaments with antibodies against another part ofthe analyte. Next, only actin filaments cross-linked to a magneticparticle will be guided toward the surface using a magnetic field.If magnetic nanoparticles are used, myosin driven transport wouldbe little affected (Persson et al., 2013), particularly at low analytebinding.
It is of interest to estimate the maximum possible packingdensity for actin filaments in the detector area. For instance, with atrapping zone as in Fig. 4 (radius¼5 μm), a channel width of270 nm and an actin filament diameter of 10 nm, the maximumpossible length of the trapped actin filaments would be 2� π�5 μm�270 nm/10 nm¼848 μm. If the average filament length isin the range 2–5 μm this would correspond to 170–420 filaments,completely covering the surface. However, if space is required forthe myosin heads along the side of an actin filament, as indicatedby electron microscopy images of actin filaments with boundHMM (Katayama, 1998), then each filament is more likely tooccupy a width of about 30 nm. This would give room for onlynine filaments side by side (compared to a maximum of four
observed; from intensity data) corresponding to a total filamentlength of 283 μm, i.e. 57–141 filaments. Importantly, the theore-tical concentration maximum according to Eq. (1) can only bereached if the initial number of motile filaments on the loadingzone is smaller than the maximum number of filaments that canbe packed into the trapping zone. Further, the degree of concen-tration of analyte in the detector area will also be appreciablyreduced if only a fraction of the motile filaments have boundanalyte. This would be the case with low analyte concentration insolution if no magnetic pre-concentration is used, again empha-sizing the importance of such a step.
At relatively high, nanomolar analyte concentrations, on theother hand, magnetic pre-separation is not required. Accordingly,we show effective concentration and detection of a model analyte(fluorescent streptavidin) at nanomolar concentration. A solutionwith streptavidin (2 nM) was first added to biotinylated actinfilaments bound to HMM on the loading zone surface (incubationfor 1 min). This was followed by a number of rinsing steps beforeATP was infused. Then, a signal from the detector area, clearlydistinguished from the background noise, was obtained withinseconds (Fig. 5). We expect that most rinsing steps are omitted in areal device operation, leading to a total time from streptavidininfusion to detection corresponding to less than 2 min. In thisexperiment, streptavidin was captured from the solution in a flowcell of 100 μm height. The area, A, parallel to the flow-cell surfacewhere diffusion equilibration occurs within time t is approximatedas A¼π4Dt where D≈50 μm2 s−1 is the diffusion coefficient ofstreptavidin (Janmey et al., 1986). Now inserting, t¼60 s we obtainA≈38,000 μm2 corresponding to a volume of 4 nl over the height ofthe flow cell. Thus, the described device achieves, within 2 min,detection of attomole quantities of streptavidin corresponding tonM concentrations in nanoliter volumes.
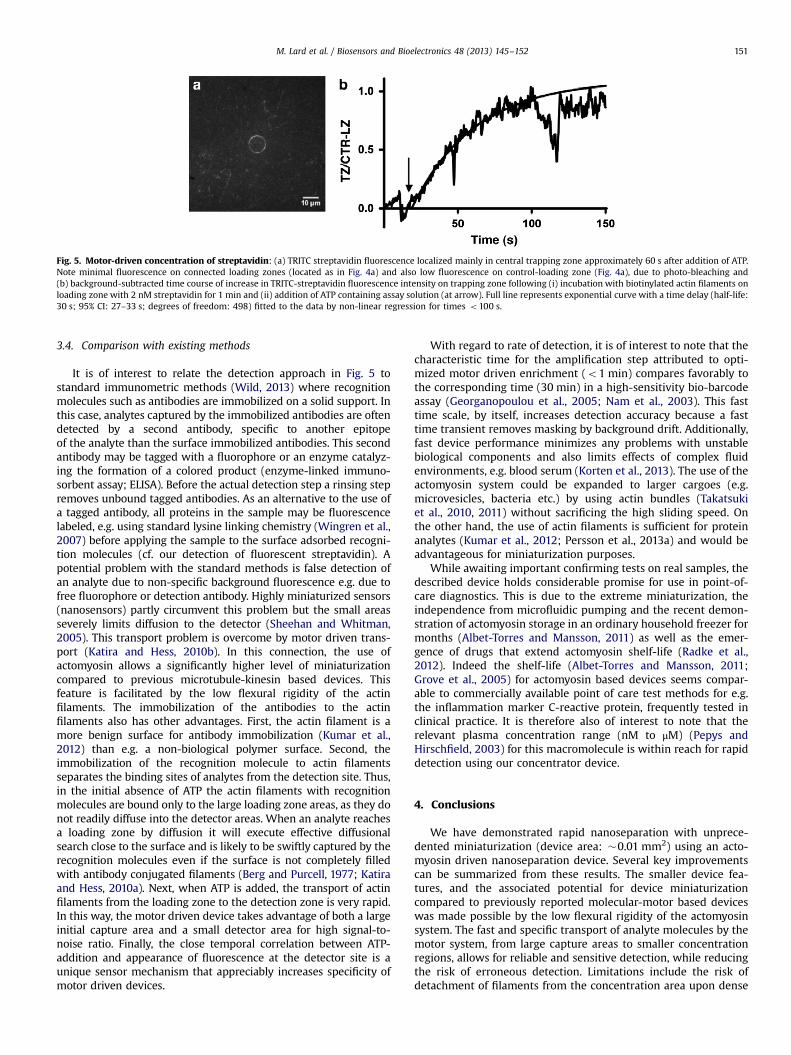
Fig. 5. Motor-driven concentration of streptavidin: (a) TRITC streptavidin fluorescence localized mainly in central trapping zone approximately 60 s after addition of ATP.Note minimal fluorescence on connected loading zones (located as in Fig. 4a) and also low fluorescence on control-loading zone (Fig. 4a), due to photo-bleaching and(b) background-subtracted time course of increase in TRITC-streptavidin fluorescence intensity on trapping zone following (i) incubation with biotinylated actin filaments onloading zone with 2 nM streptavidin for 1 min and (ii) addition of ATP containing assay solution (at arrow). Full line represents exponential curve with a time delay (half-life:30 s; 95% CI: 27–33 s; degrees of freedom: 498) fitted to the data by non-linear regression for times o100 s.
M. Lard et al. / Biosensors and Bioelectronics 48 (2013) 145–152 151
3.4. Comparison with existing methods
It is of interest to relate the detection approach in Fig. 5 tostandard immunometric methods (Wild, 2013) where recognitionmolecules such as antibodies are immobilized on a solid support. Inthis case, analytes captured by the immobilized antibodies are oftendetected by a second antibody, specific to another epitopeof the analyte than the surface immobilized antibodies. This secondantibody may be tagged with a fluorophore or an enzyme catalyz-ing the formation of a colored product (enzyme-linked immuno-sorbent assay; ELISA). Before the actual detection step a rinsing stepremoves unbound tagged antibodies. As an alternative to the use ofa tagged antibody, all proteins in the sample may be fluorescencelabeled, e.g. using standard lysine linking chemistry (Wingren et al.,2007) before applying the sample to the surface adsorbed recogni-tion molecules (cf. our detection of fluorescent streptavidin). Apotential problem with the standard methods is false detection ofan analyte due to non-specific background fluorescence e.g. due tofree fluorophore or detection antibody. Highly miniaturized sensors(nanosensors) partly circumvent this problem but the small areasseverely limits diffusion to the detector (Sheehan and Whitman,2005). This transport problem is overcome by motor driven trans-port (Katira and Hess, 2010b). In this connection, the use ofactomyosin allows a significantly higher level of miniaturizationcompared to previous microtubule-kinesin based devices. Thisfeature is facilitated by the low flexural rigidity of the actinfilaments. The immobilization of the antibodies to the actinfilaments also has other advantages. First, the actin filament is amore benign surface for antibody immobilization (Kumar et al.,2012) than e.g. a non-biological polymer surface. Second, theimmobilization of the recognition molecule to actin filamentsseparates the binding sites of analytes from the detection site. Thus,in the initial absence of ATP the actin filaments with recognitionmolecules are bound only to the large loading zone areas, as they donot readily diffuse into the detector areas. When an analyte reachesa loading zone by diffusion it will execute effective diffusionalsearch close to the surface and is likely to be swiftly captured by therecognition molecules even if the surface is not completely filledwith antibody conjugated filaments (Berg and Purcell, 1977; Katiraand Hess, 2010a). Next, when ATP is added, the transport of actinfilaments from the loading zone to the detection zone is very rapid.In this way, the motor driven device takes advantage of both a largeinitial capture area and a small detector area for high signal-to-noise ratio. Finally, the close temporal correlation between ATP-addition and appearance of fluorescence at the detector site is aunique sensor mechanism that appreciably increases specificity ofmotor driven devices.
With regard to rate of detection, it is of interest to note that thecharacteristic time for the amplification step attributed to opti-mized motor driven enrichment (o1 min) compares favorably tothe corresponding time (30 min) in a high-sensitivity bio-barcodeassay (Georganopoulou et al., 2005; Nam et al., 2003). This fasttime scale, by itself, increases detection accuracy because a fasttime transient removes masking by background drift. Additionally,fast device performance minimizes any problems with unstablebiological components and also limits effects of complex fluidenvironments, e.g. blood serum (Korten et al., 2013). The use of theactomyosin system could be expanded to larger cargoes (e.g.microvesicles, bacteria etc.) by using actin bundles (Takatsukiet al., 2010, 2011) without sacrificing the high sliding speed. Onthe other hand, the use of actin filaments is sufficient for proteinanalytes (Kumar et al., 2012; Persson et al., 2013a) and would beadvantageous for miniaturization purposes.
While awaiting important confirming tests on real samples, thedescribed device holds considerable promise for use in point-of-care diagnostics. This is due to the extreme miniaturization, theindependence from microfluidic pumping and the recent demon-stration of actomyosin storage in an ordinary household freezer formonths (Albet-Torres and Mansson, 2011) as well as the emer-gence of drugs that extend actomyosin shelf-life (Radke et al.,2012). Indeed the shelf-life (Albet-Torres and Mansson, 2011;Grove et al., 2005) for actomyosin based devices seems compar-able to commercially available point of care test methods for e.g.the inflammation marker C-reactive protein, frequently tested inclinical practice. It is therefore also of interest to note that therelevant plasma concentration range (nM to μM) (Pepys andHirschfield, 2003) for this macromolecule is within reach for rapiddetection using our concentrator device.
4. Conclusions
We have demonstrated rapid nanoseparation with unprece-dented miniaturization (device area: �0.01 mm2) using an acto-myosin driven nanoseparation device. Several key improvementscan be summarized from these results. The smaller device fea-tures, and the associated potential for device miniaturizationcompared to previously reported molecular-motor based deviceswas made possible by the low flexural rigidity of the actomyosinsystem. The fast and specific transport of analyte molecules by themotor system, from large capture areas to smaller concentrationregions, allows for reliable and sensitive detection, while reducingthe risk of erroneous detection. Limitations include the risk ofdetachment of filaments from the concentration area upon dense
M. Lard et al. / Biosensors and Bioelectronics 48 (2013) 145–152152
accumulation of filaments. This can be addressed by using a ceilingabove the detection area, which will also aid in improving thelevel of concentration and detection. In a real-world application ofthe concetrator device, integration of a detector into the detectionregion, e.g. optical (Bunk, 2005; Lard et al., 2013) magnetoresistive(Schotter et al., 2004) or amperometric (Gao et al., 2011), willallow automatic read-out. In a complete point-of-care diagnosticsworkflow, the concentrator device would most favorably becombined with initial capture of analyte on magnetic particlesfor magnetic pre-separation as in other high-sensitivity detectionmethods (Nam et al., 2003). Such separation would also helpalleviate deleterious effects of body fluids on actomyosin function(Korten et al., 2013), a critical step toward the use of this methodwith real samples, such as blood serum.
Acknowledgments
This work was funded by the Carl Trygger Foundation, EuropeanUnion Seventh Framework Program (FP7/2007–2011) under GrantAgreement number 228971 (MONAD), the Swedish Research Council(Projects ♯621-2007-6137 and ♯621-2010-5146), The Crafoord Foun-dation, the Faculty of Natural Sciences and Engineering at LinnaeusUniversity, the Nanometer Structure Consortium (nmC@LU), and theKnut and Alice Wallenberg Foundation.
Appendix A. Supplementary Information
Supplementary data associated with this article can be found inthe online version at http://dx.doi.org/10.1016/j.bios.2013.03.071.
References
Albet-Torres, N., Mansson, A., 2011. Langmuir 27 (11), 7108–7112.Ashikari, N., Shitaka, Y., Fujita, K., Kojima, H., Oiwa, K., Sakaue, H., Takahagi, T.,
Suzuki, H., 2012. Japanese Journal of Applied Physics 51 (2), 02BL03.Bachand, G.D., Rivera, S.B., Carroll-Portillo, A., Hess, H., Bachand, M., 2006. Small 2
(3), 381–385.Balaz, M., Mansson, A., 2005. Analytical Biochemistry 338 (2), 224–236.Berg, H.C., Purcell, E.M., 1977. Biophysical Journal 20 (2), 193–219.Brunner, C., Wahnes, C., Vogel, V., 2007. Lab Chip 7 (10), 1263–1271.Bunk, R., 2005. Solid State Physics,. Lund Institute of Technology, Lund University,
Lund.Bunk, R., Sundberg, M., Mansson, A., Nicholls, I.A., Omling, P., Tagerud, S., Montelius, L.,
2005a. Nanotechnology 16 (6), 710–717.Bunk, R., Sundberg, M., Nicholls, I.A., Omling, P., Tågerud, S., Månsson, A., Montelius, L.,
2005b. Nanotechnology 16, 710–717.Byun, K.E., Kim, M.G., Chase, P.B., Hong, S.H., 2007. Langmuir 23 (19), 9535–9539.Clemmens, J., Hess, H., Howard, J., Vogel, V., 2003a. Langmuir 19 (5), 1738–1744.Clemmens, J., Hess, H., Lipscomb, R., Hanein, Y., Bohringer, K.F., Matzke, C.M.,
Bachand, G.D., Bunker, B.C., Vogel, V., 2003b. Langmuir 19 (26), 10967–10974.Duke, T., Holy, T.E., Leibler, S., 1995. Physical Review Letters 74 (2), 330–333.Fischer, T., Agarwal, A., Hess, H., 2009. Nature Nanotechnology 4 (3), 162–166.Gao, W., Dong, H., Lei, J., Ji, H., Ju, H., 2011. Chemical Communications (Cambridge)
47 (18), 5220–5222.Georganopoulou, D.G., Chang, L., Nam, J.M., Thaxton, C.S., Mufson, E.J., Klein, W.L.,
Mirkin, C.A., 2005. Proceedings of the National Academy of Sciences 102 (7),2273–2276.
Giljohann, D.A., Mirkin, C.A., 2009. Nature 462 (7272), 461–464.Grove, T.J., Puckett, K.A., Brunet, N.M., Mihajlovic, G., McFadden, L.A., Peng, X.O.,
von Molnar, S., Moerland, T.S., Chase, P.B., 2005. IEEE Transactions on AdvancedPackaging 28 (4), 556–563.
Hess, H., Clemmens, J., Qin, D., Howard, J., Vogel, V., 2001. Nano Letters 1 (5),235–239.
Hiratsuka, Y., Tada, T., Oiwa, K., Kanayama, T., Uyeda, T.Q.P., 2001. BiophysicalJournal 81 (3), 1555–1561.
Janmey, P.A., Peetermans, J., Zaner, K.S., Stossel, T.P., Tanaka, T., 1986. Journal ofBiological Chemistry 261 (18), 8357–8362.
Jokerst, J.V., Jacobson, J.W., Bhagwandin, B.D., Floriano, P.N., Christodoulides, N.,McDevitt, J.T., 2010. Analytical Chemistry 82 (5), 1571–1579.
Katayama, E., 1998. Journal of Molecular Biology 278 (2), 349–367.Katira, P., Hess, H., 2010a. Nano Letters 10 (2), 567–572.Katira, P., Hess, H., 2010b. Nano Letters 10 (2), 567–572.
Korten, S., Albet-Torres, N., Paderi, F., Ten Siethoff, L., Diez, S., Korten, T.,Te Kronnie, G., Mansson, A., 2013. Lab Chip 13 (5), 866–876.
Korten, T., Månsson, A., Diez, S., 2010. Current Opinion in Biotechnology 21, 477–488.Kron, S.J., Toyoshima, Y.Y., Uyeda, T.Q., Spudich, J.A., 1991. Methods Enzymology
196, 399–416.Kumar, S., ten Siethoff, L., Persson, M., Lard, M., te Kronnie, G., Linke, H., Månsson, A.,
2012. PLoS ONE 7 (10), e46298.Lard, M., Siethoff, L.T., Mansson, A., Linke, H., 2013. Scientific Reports 3, 1092.Lee, K.B., Kim, E.Y., Mirkin, C.A., Wolinsky, S.M., 2004. Nano Letters 4 (10),
1869–1872.Lin, C.T., Kao, M.T., Kurabayashi, K., Meyhofer, E., 2008. Nano Letters 8 (4),
1041–1046.Mansson, A., Tagerud, S., 2003. Analytical Biochemistry 314 (2), 281–293.Mulvaney, S.P., Myers, K.M., Sheehan, P.E., Whitman, L.J., 2009. Biosensors and
Bioelectronics 24 (5), 1109–1115.Månsson, A., Bunk, R., Sundberg, M., Montelius, L., 2012a. Journal of Biomedicine
and Biotechnology 2012, 647265.Månsson, A., Kumar, S., Lard, M., Ten Siethoff, L., Persson, M., Albet-Torres, N.,
Te Kronnie, G., Linke, H., 2012b. Journal of Muscle Research and Cell Motility 33, 279.Månsson, A., Sundberg, M., Balaz, M., Bunk, R., Nicholls, I.A., Omling, P., Tågerud, S.,
Montelius, L., 2004. Biochemical and Biophysical Research Communications 314(2), 529–534.
Månsson, A., Sundberg, M., Bunk, R., Balaz, M., Nicholls, I.A., Omling, P., Tegenfeldt, J.O.,Tågerud, S., Montelius, L., 2005. IEEE Transactions on Advanced Packaging 28 (4),547–555.
Nam, J.M., Thaxton, C.S., Mirkin, C.A., 2003. Science 301 (5641), 1884–1886.Ng, A.H., Uddayasankar, U., Wheeler, A.R., 2010. Analytical and Bioanalytical
Chemistry 397 (3), 991–1007.Nicolau, D.V., Suzuki, H., Mashiko, S., Taguchi, T., Yoshikawa, S., 1999. Biophysical
Journal 77 (2), 1126–1134.Nitta, T., Hess, H., 2005. Nano Letters 5 (7), 1337–1342.Nitta, T., Hess, H., Cellular and Molecular Bioengineering 6 (1), 2013, 109–115.Nitta, T., Tanahashi, A., Hirano, M., Hess, H., 2006. Lab Chip 6 (7), 881–885.Nitta, T., Tanahashi, A., Obara, Y., Hirano, M., Razumova, M., Regnier, M., Hess, H.,
2008. Nano Letters 8 (8), 2305–2309.Pardee, J.D., Spudich, J.A., 1982. Methods in Cell Biology 24, 271–289.Pepys, M.B., Hirschfield, G.M., 2003. Journal of Clinical Investigation 111 (12),
1805–1812.Persson, M., Albet-Torres, N., Ionov, L., Sundberg, M., Hook, F., Diez, S., Mansson, A.,
Balaz, M., 2010. Langmuir 26 (12), 9927–9936.Persson, M., Gullberg, M., Tolf, C., Lindberg, A.M., Mansson, A., Kocer, A., 2013. PloS
ONE 8 (2), e55931.Radke, M.B., Taft, M.H., Preller, N., Heissler, S.H., Steinke, N., Manstein, D.J., 2012.
Biophysical Journal 102 (3, S1), 354a.Ramachandran, S., Ernst, K.H., Bachand, G.D., Vogel, V., Hess, H., 2006. Small 2 (3),
330–334.Rissin, D.M., Kan, C.W., Campbell, T.G., Howes, S.C., Fournier, D.R., Song, L., Piech, T.,
Patel, P.P., Chang, L., Rivnak, A.J., Ferrell, E.P., Randall, J.D., Provuncher, G.K.,Walt, D.R., Duffy, D.C., 2010. Nature Biotechnology 28 (6), 595–599.
Sata, M., Sugiura, S., Yamashita, H., Momomura, S., Serizawa, T., 1993. CirculationResearch 73 (4), 696–704.
Schotter, J., Kamp, P.B., Becker, A., Puhler, A., Reiss, G., Bruckl, H., 2004. Biosensorsand Bioelectronics 19 (10), 1149–1156.
Sheehan, P.E., Whitman, L.J., 2005. Nano Letters 5 (4), 803–807.Sundberg, M., Balaz, M., Bunk, R., Rosengren-Holmberg, J.P., Montelius, L.,
Nicholls, I.A., Omling, P., Tågerud, S., Månsson, A., 2006a. Langmuir 22 (17),7302–7312.
Sundberg, M., Bunk, R., Albet-Torres, N., Kvennefors, A., Persson, F., Montelius, L.,Nicholls, I.A., Ghatnekar-Nilsson, S., Omling, P., Tagerud, S., Mansson, A., 2006b.Langmuir 22 (17), 7286–7295.
Sundberg, M., Rosengren, J.P., Bunk, R., Lindahl, J., Nicholls, I.A., Tagerud, S., Omling, P.,Montelius, L., Mansson, A., 2003. Analytical Biochemistry 323 (1), 127–138.
Suzuki, H., Yamada, A., Oiwa, K., Nakayama, H., Mashiko, S., 1997. BiophysicalJournal 72 (5), 1997–2001.
Takatsuki, H., Rice, K.M., Asano, S., Day, B.S., Hino, M., Oiwa, K., Ishikawa, R.,Hiratsuka, Y., Uyeda, T.Q., Kohama, K., Blough, E.R., 2010. Small 6 (3), 452–457.
Takatsuki, H., Tanaka, H., Rice, K.M., Kolli, M.B., Nalabotu, S.K., Kohama, K., Famouri,P., Blough, E.R., 2011. Nanotechnology 22 (24), 245101.
Vikhorev, P.G., Vikhoreva, N.N., Mansson, A., 2008a. Biophysical Journal 95 (12),5809–5819.
Vikhorev, P.G., Vikhoreva, N.N., Mansson, A., 2008b. Biophysical Journal 95 (12),5809–5819.
Vikhorev, P.G., Vikhoreva, N.N., Sundberg, M., Balaz, M., Albet-Torres, N., Bunk, R.,Kvennefors, A., Liljesson, K., Nicholls, I.A., Nilsson, L., Omling, P., Tagerud, S.,Montelius, L., Mansson, A., 2008c. Langmuir 24 (23), 13509–13517.
van den Heuvel, M.G.L., Butcher, C.T., Smeets, R.M.M., Diez, S., Dekker, C., 2005.Nano Letters 5 (6), 1117–1122.
Whitesides, G.M., 2006. Nature 442 (7101), 368–373.Wild, D., 2013. The Immunoassay Handbook, 4th ed. Elsevier, Oxford.Wingren, C., Ingvarsson, J., Dexlin, L., Szul, D., Borrebaeck, C.A., 2007. Proteomics 7
(17), 3055–3065.Zhang, C.Y., Yeh, H.C., Kuroki, M.T., Wang, T.H., 2005a. Nature Materials 4 (11), 826–831.Zheng, G., Patolsky, F., Cui, Y., Wang, W.U., Lieber, C.M., 2005b. Nature Biotechnol-
ogy 23 (10), 1294–1301.