Embed Size (px)
Citation preview
BioSense Platform Quick Start Guide to Using ESSENCE 1
December 2017
BioSense Platform Quick Start Guide to Using ESSENCE 2
Quick Start Guide to Using ESSENCE CONTENTS
1 Overview, 1
2 Access, 4
Log In to ESSENCE, 4
Get Oriented to Home Page, 4
3 Data Completeness, 6
4 Basic Monitoring, 7
Check Alert List, 7
Create, Visualize, and Save a Query, 9
View Your Dashboard (myESSENCE), 15
Visualize Statistical Alerts: The “Map Portal” Tab, 17
Share Queries and Visualization, 18
Generate Reports, 20
Request Technical Assistance, 21
5 Activities Common to Users and Site Administrators, 22
Technical Assistance: support.syndromicsurveillance.org
The National Syndromic Surveillance Program (NSSP) promotes and advances development of the
cloud-based BioSense Platform, a secure integrated electronic health information system that hosts
standardized analytic tools and facilitates collaborative processes. The BioSense Platform is a product
of the Centers for Disease Control and Prevention (CDC).
BioSense Platform Quick Start Guide to Using ESSENCE 1
Quick Start Guide to Using ESSENCE
1. Overview NSSP’s BioSense Platform hosts the Electronic Surveillance System for the Early Notification of Community-
based Epidemics (ESSENCE)—a system that will let you analyze events of public health interest, monitor
healthcare data for events that could affect public health, and share data and analyses.
This quick start guide supports NSSP ESSENCE v.1.21 and will help you access and navigate the system’s main
features. This guide is NOT intended to be a comprehensive user’s manual.
Version 1.21 updates include:
New access control system
Improved graph overlay functionality (examples on pages 11 and 12)
Ability to query multiple user-defined text fields when building free-text queries (not just chief
compliant, CC/DD or triage notes) (examples on page 9)
Ability to view data details (line list) of more than 5,000 records (examples on pages 16 and 17)
Overlay graphs can be saved in myESSENCE and the Report Manager (examples on pages 12 and 18)
A few reminders before getting started:
Browser: Use Chrome or Edge to access full ESSENCE functionality. Some functionality in other browsers
is limited.
Data: ESSENCE provides insight into the data sent to the BioSense Platform. Emergency department
data are a primary source. Currently, the system can include data from many patient classes
(e.g., emergency, inpatient, and outpatient data). In time, other types of data will become available,
such as LabCorp and prescription drug data.
Terminology: Within ESSENCE, the different data sources provide different levels of detail. For example,
note the distinction between column header “REGION” and the term “HHS REGION.” “REGION” refers to
COUNTY-level data (approximated by ESSENCE) for detailed data sources below the state level. “HHS
REGION” denotes the U.S. Department of Health and Human Services’ ten regional offices that directly
serve state and local organizations.
BioSense Platform Quick Start Guide to Using ESSENCE 2
Data Sources: Several sources feed data to ESSENCE. These data sources allow you to view data by
either patient location or hospital location. Below are the names of the data sources and the views
associated with them.
o Patient Location (Full Details): Use is typically limited to users associated with sites. Enables a query
of data based on where the patient lives. Will return complete list of available patient details. All
binned patient syndromes are returned in a query (e.g., fever, GI).
o Patient Location and Visit (Full Details): Use is typically limited to users associated with sites.
Enables a query of data based on where the patient lives. Will return complete list of available
patient details. A single patient syndrome is returned for a query (e.g., fever).
o Patient Location (Limited Details–HHS Region): All users will have access to data source. Enables a
query based on the region where a patient lives. Will return a limited set of available patient details.
All binned patient syndromes are returned in a query.
o Facility Location (Full Details): Use is typically limited to users associated with sites. Enables a query
of data based on the hospital location where a patient sought treatment. Will return a complete list
of available patient details. Patient’s chief complaint can be binned into multiple categories.
o Facility Location and Visit (Full Details): Use is typically limited to users associated with sites.
Enables a query of data based on hospital location where a patient sought treatment.
Will return complete list of available patient details. A single patient syndrome is returned for a
query (e.g., fever).
o Facility Location (Limited Details–HHS Region): All users will have access to this data source.
Enables a query based on the region in which the hospital is located (where the patient sought
treatment). Will return a limited set of available patient details. All binned patient syndromes are
returned in a query.
o Chief Complaint Query Validation Tool: All users will have access to this data source. Limited view
of Chief Complaint (CC) and Diagnosis Discharge (DD) information. Allows users to train a new
definition against the largest possible universe of keyword occurrences. After fine-tuning the
definition (e.g., figuring out what keywords to include or exclude), a user may copy this definition to
an advanced query of site facilities or patients (data for which the user has access to view).
o Department of Defense (DOD) Data: These data are not in ESSENCE. Will eventually provide
snapshot of DoD beneficiary encounters throughout the United States.
o Veterans Affairs Data: These data are not in ESSENCE. Will eventually provide snapshot of Veterans
Affairs beneficiary encounters throughout the United States.
o ASPR Electronic Medical Record (EMR) Data: U.S. Department of Health and Human Services (HHS)
Office of the Assistant Secretary for Preparedness and Response (ASPR) group collects EMR data
from disaster medical assistance team (DMAT) operation sites deployed to provide medical care
during a disaster or other event. Regions in which DMATs are deployed will have access to the
facilities included in this dataset.
BioSense Platform Quick Start Guide to Using ESSENCE 3
o Air Quality Data: All users will have access to this data source. Data are provided via a web service
that compiles various air quality metrics (e.g., ozone, particulate matter, air quality index) across the
United States. More information is available at this link: www.airnow.gov.
o Weather Data: All users will have access to this data source. Various weather variables (e.g., total
precipitation, snowfall, wind speed) collected from the National Weather Service Form 6 are
provided in this dataset across all weather stations throughout the United States. More information
is available at this link: http://w2.weather.gov/climate/f6.php?wfo=gld.
How do the statistical algorithms work?
A 30-day baseline of data is used to calculate alerts. The Poisson/Regression/Exponentially
Weighted Moving Average switch algorithm is the default temporal alerting algorithm
developed by Johns Hopkins University–Applied Physics Laboratory (JHU–APL) for ESSENCE.
For more information on the detector algorithms, please click the “More” tab and select
Detector Algorithms. Additional information describing these algorithms will be provided in
future user guides.
BioSense Platform Quick Start Guide to Using ESSENCE 4
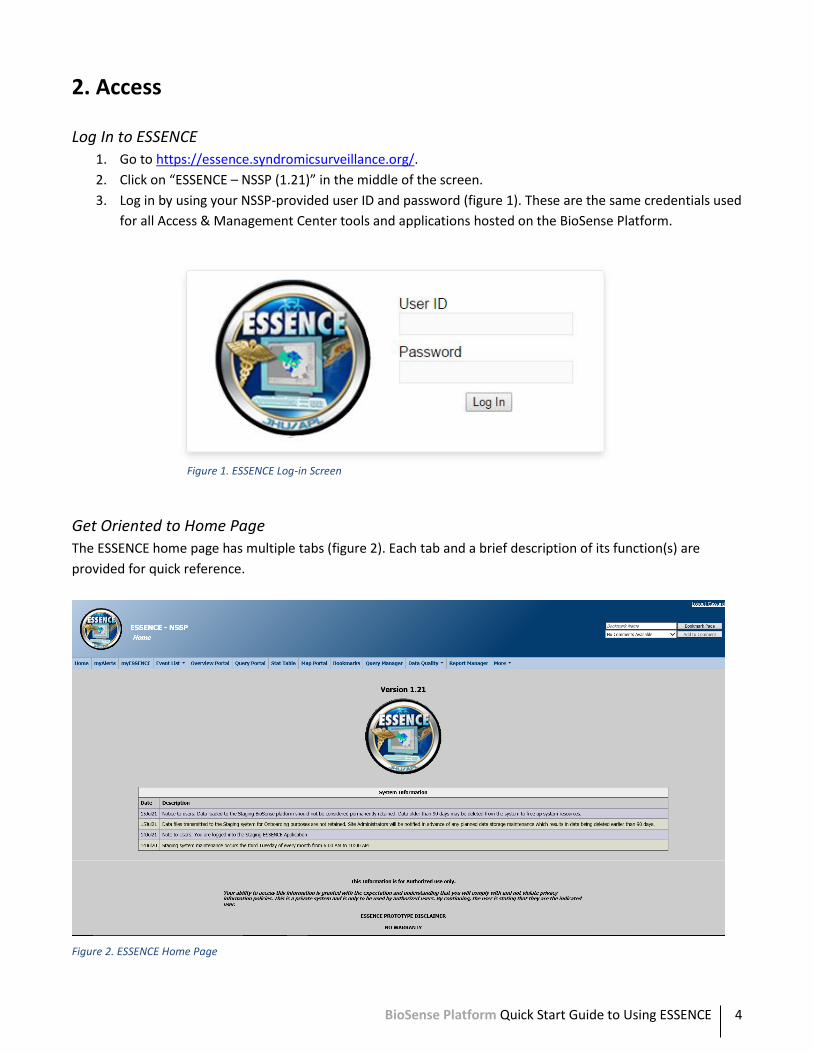
2. Access
Log In to ESSENCE
1. Go to https://essence.syndromicsurveillance.org/.
2. Click on “ESSENCE – NSSP (1.21)” in the middle of the screen.
3. Log in by using your NSSP-provided user ID and password (figure 1). These are the same credentials used
for all Access & Management Center tools and applications hosted on the BioSense Platform.
Get Oriented to Home Page
The ESSENCE home page has multiple tabs (figure 2). Each tab and a brief description of its function(s) are
provided for quick reference.
Figure 2. ESSENCE Home Page
Figure 1. ESSENCE Log-in Screen
BioSense Platform Quick Start Guide to Using ESSENCE 5
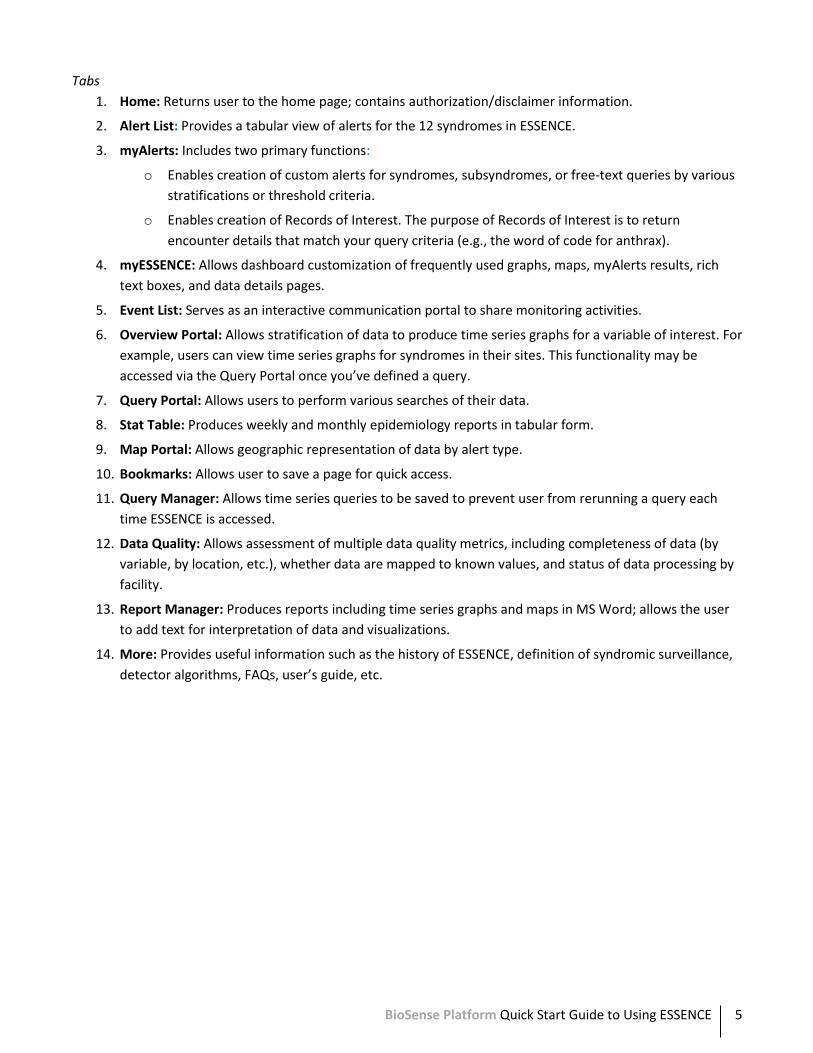
Tabs
1. Home: Returns user to the home page; contains authorization/disclaimer information.
2. Alert List: Provides a tabular view of alerts for the 12 syndromes in ESSENCE.
3. myAlerts: Includes two primary functions:
o Enables creation of custom alerts for syndromes, subsyndromes, or free-text queries by various
stratifications or threshold criteria.
o Enables creation of Records of Interest. The purpose of Records of Interest is to return
encounter details that match your query criteria (e.g., the word of code for anthrax).
4. myESSENCE: Allows dashboard customization of frequently used graphs, maps, myAlerts results, rich
text boxes, and data details pages.
5. Event List: Serves as an interactive communication portal to share monitoring activities.
6. Overview Portal: Allows stratification of data to produce time series graphs for a variable of interest. For
example, users can view time series graphs for syndromes in their sites. This functionality may be
accessed via the Query Portal once you’ve defined a query.
7. Query Portal: Allows users to perform various searches of their data.
8. Stat Table: Produces weekly and monthly epidemiology reports in tabular form.
9. Map Portal: Allows geographic representation of data by alert type.
10. Bookmarks: Allows user to save a page for quick access.
11. Query Manager: Allows time series queries to be saved to prevent user from rerunning a query each
time ESSENCE is accessed.
12. Data Quality: Allows assessment of multiple data quality metrics, including completeness of data (by
variable, by location, etc.), whether data are mapped to known values, and status of data processing by
facility.
13. Report Manager: Produces reports including time series graphs and maps in MS Word; allows the user
to add text for interpretation of data and visualizations.
14. More: Provides useful information such as the history of ESSENCE, definition of syndromic surveillance,
detector algorithms, FAQs, user’s guide, etc.
BioSense Platform Quick Start Guide to Using ESSENCE 6
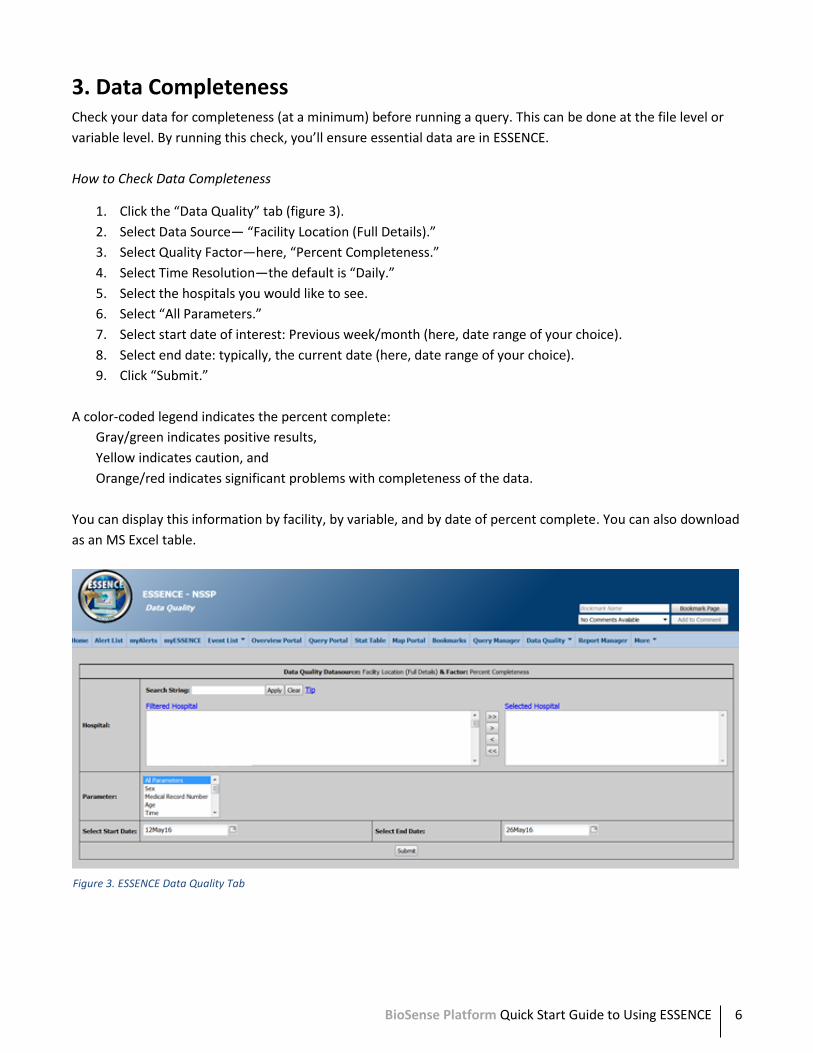
3. Data Completeness Check your data for completeness (at a minimum) before running a query. This can be done at the file level or
variable level. By running this check, you’ll ensure essential data are in ESSENCE.
How to Check Data Completeness
1. Click the “Data Quality” tab (figure 3).
2. Select Data Source— “Facility Location (Full Details).”
3. Select Quality Factor—here, “Percent Completeness.”
4. Select Time Resolution—the default is “Daily.”
5. Select the hospitals you would like to see.
6. Select “All Parameters.”
7. Select start date of interest: Previous week/month (here, date range of your choice).
8. Select end date: typically, the current date (here, date range of your choice).
9. Click “Submit.”
A color-coded legend indicates the percent complete:
Gray/green indicates positive results,
Yellow indicates caution, and
Orange/red indicates significant problems with completeness of the data.
You can display this information by facility, by variable, and by date of percent complete. You can also download
as an MS Excel table.
Figure 3. ESSENCE Data Quality Tab
BioSense Platform Quick Start Guide to Using ESSENCE 7
4. Basic Monitoring
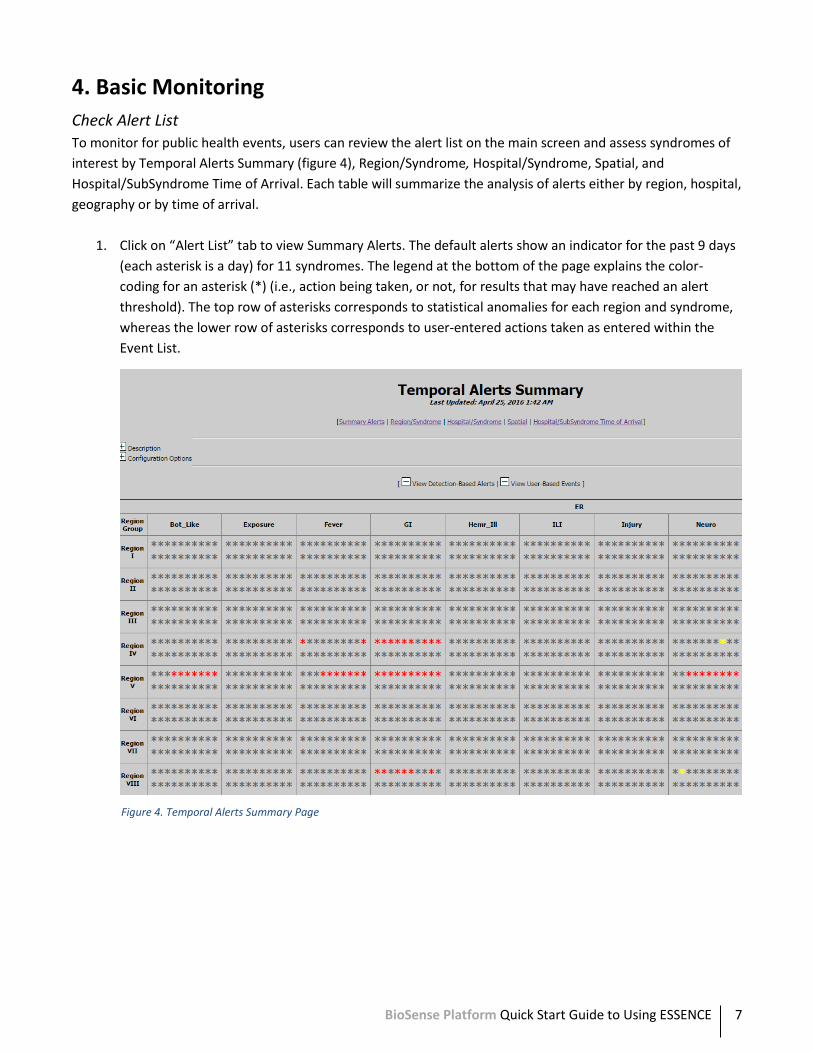
Check Alert List
To monitor for public health events, users can review the alert list on the main screen and assess syndromes of
interest by Temporal Alerts Summary (figure 4), Region/Syndrome, Hospital/Syndrome, Spatial, and
Hospital/SubSyndrome Time of Arrival. Each table will summarize the analysis of alerts either by region, hospital,
geography or by time of arrival.
1. Click on “Alert List” tab to view Summary Alerts. The default alerts show an indicator for the past 9 days
(each asterisk is a day) for 11 syndromes. The legend at the bottom of the page explains the color-
coding for an asterisk (*) (i.e., action being taken, or not, for results that may have reached an alert
threshold). The top row of asterisks corresponds to statistical anomalies for each region and syndrome,
whereas the lower row of asterisks corresponds to user-entered actions taken as entered within the
Event List.
Figure 4. Temporal Alerts Summary Page
BioSense Platform Quick Start Guide to Using ESSENCE 8
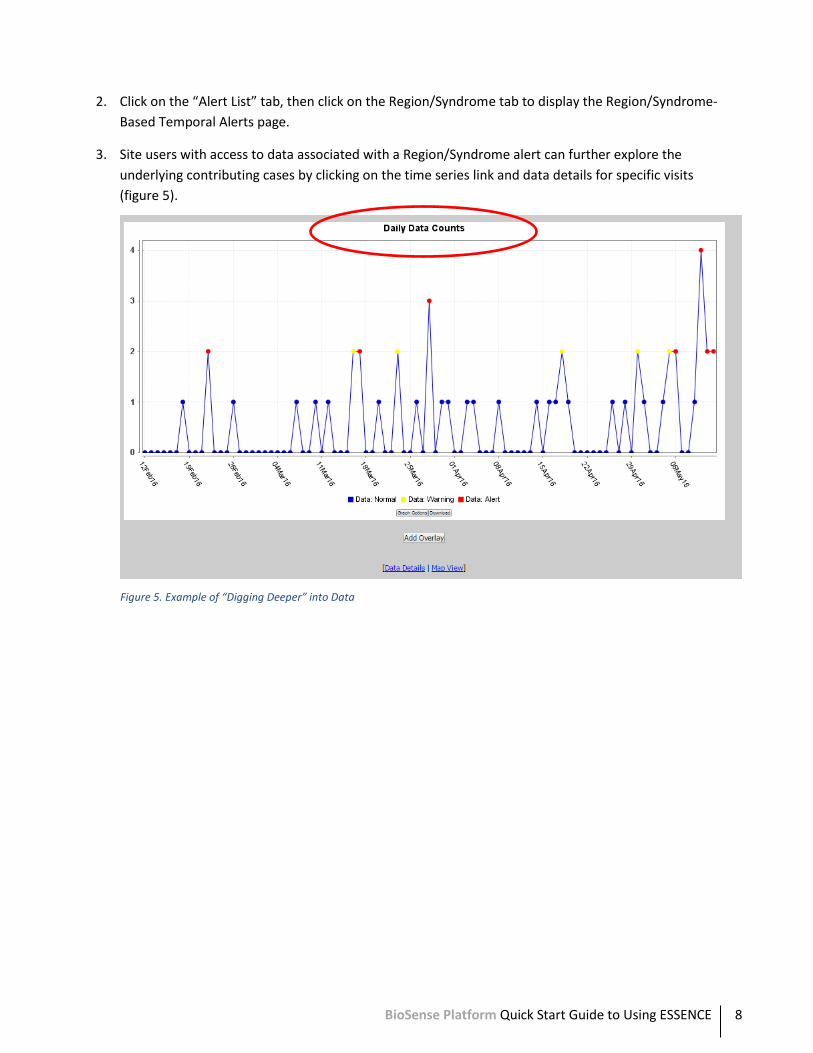
2. Click on the “Alert List” tab, then click on the Region/Syndrome tab to display the Region/Syndrome-
Based Temporal Alerts page.
3. Site users with access to data associated with a Region/Syndrome alert can further explore the
underlying contributing cases by clicking on the time series link and data details for specific visits
(figure 5).
Figure 5. Example of “Digging Deeper” into Data
BioSense Platform Quick Start Guide to Using ESSENCE 9
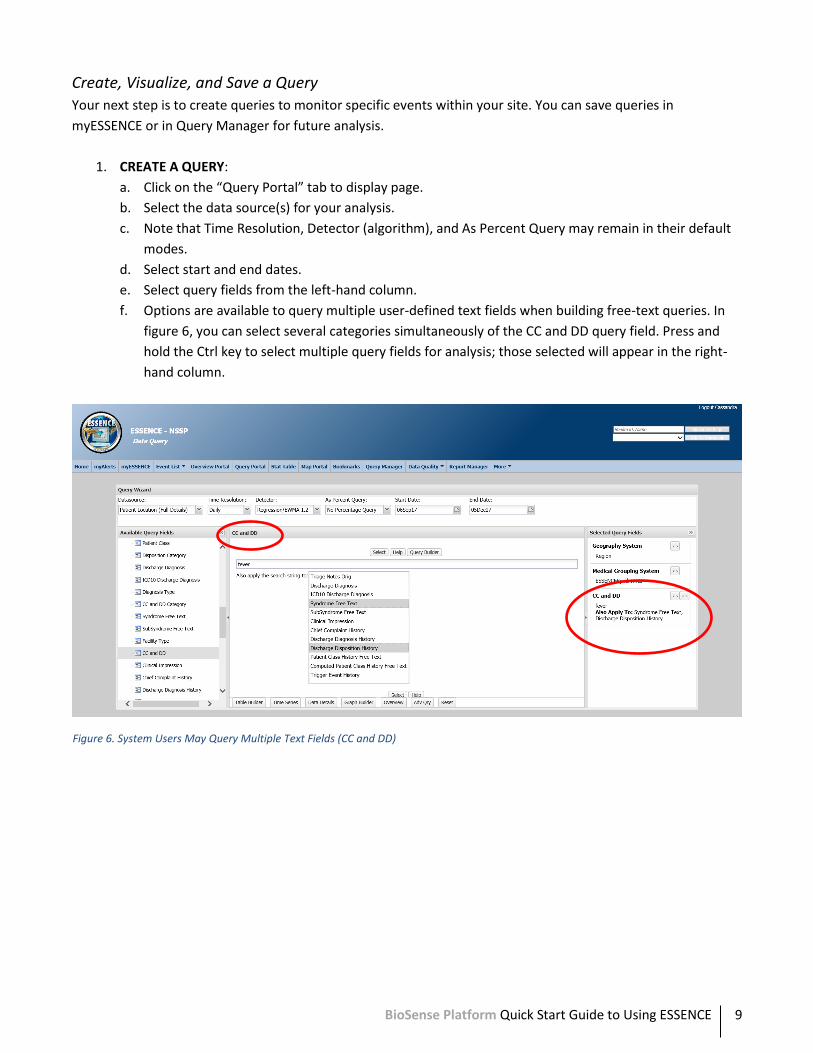
Create, Visualize, and Save a Query
Your next step is to create queries to monitor specific events within your site. You can save queries in
myESSENCE or in Query Manager for future analysis.
1. CREATE A QUERY:
a. Click on the “Query Portal” tab to display page.
b. Select the data source(s) for your analysis.
c. Note that Time Resolution, Detector (algorithm), and As Percent Query may remain in their default
modes.
d. Select start and end dates.
e. Select query fields from the left-hand column.
f. Options are available to query multiple user-defined text fields when building free-text queries. In
figure 6, you can select several categories simultaneously of the CC and DD query field. Press and
hold the Ctrl key to select multiple query fields for analysis; those selected will appear in the right-
hand column.
Figure 6. System Users May Query Multiple Text Fields (CC and DD)
BioSense Platform Quick Start Guide to Using ESSENCE 10
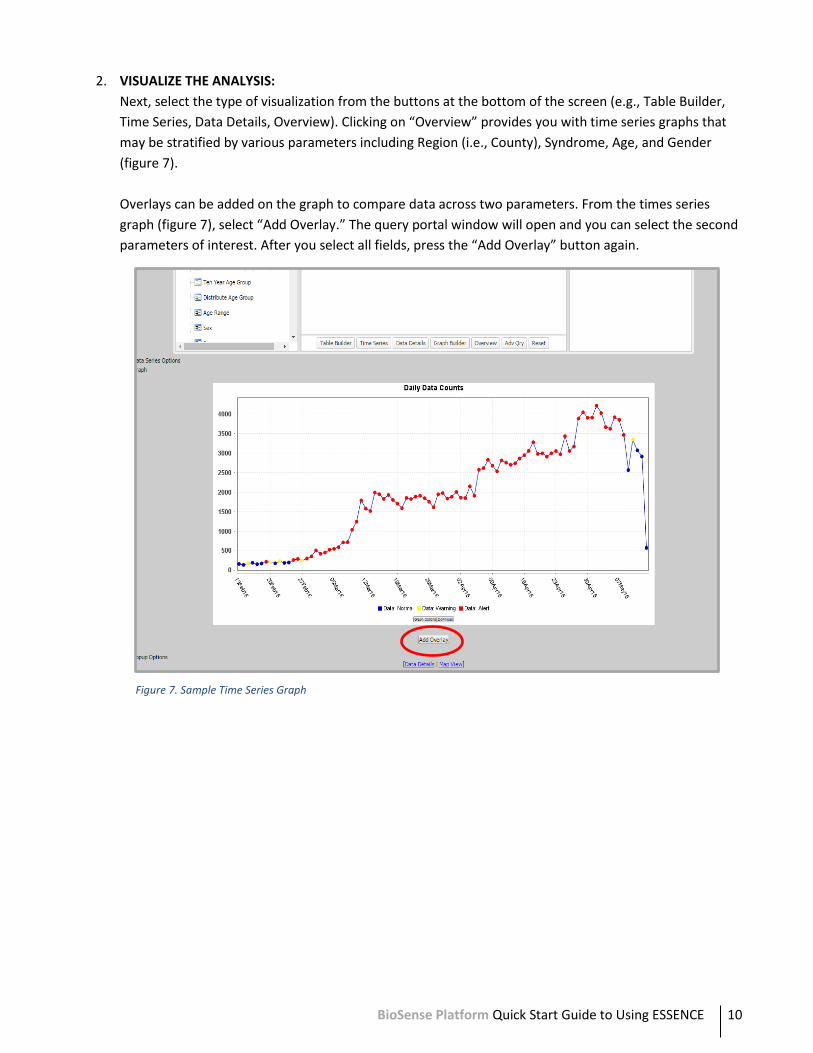
2. VISUALIZE THE ANALYSIS:
Next, select the type of visualization from the buttons at the bottom of the screen (e.g., Table Builder,
Time Series, Data Details, Overview). Clicking on “Overview” provides you with time series graphs that
may be stratified by various parameters including Region (i.e., County), Syndrome, Age, and Gender
(figure 7).
Overlays can be added on the graph to compare data across two parameters. From the times series
graph (figure 7), select “Add Overlay.” The query portal window will open and you can select the second
parameters of interest. After you select all fields, press the “Add Overlay” button again.
Figure 7. Sample Time Series Graph
BioSense Platform Quick Start Guide to Using ESSENCE 11
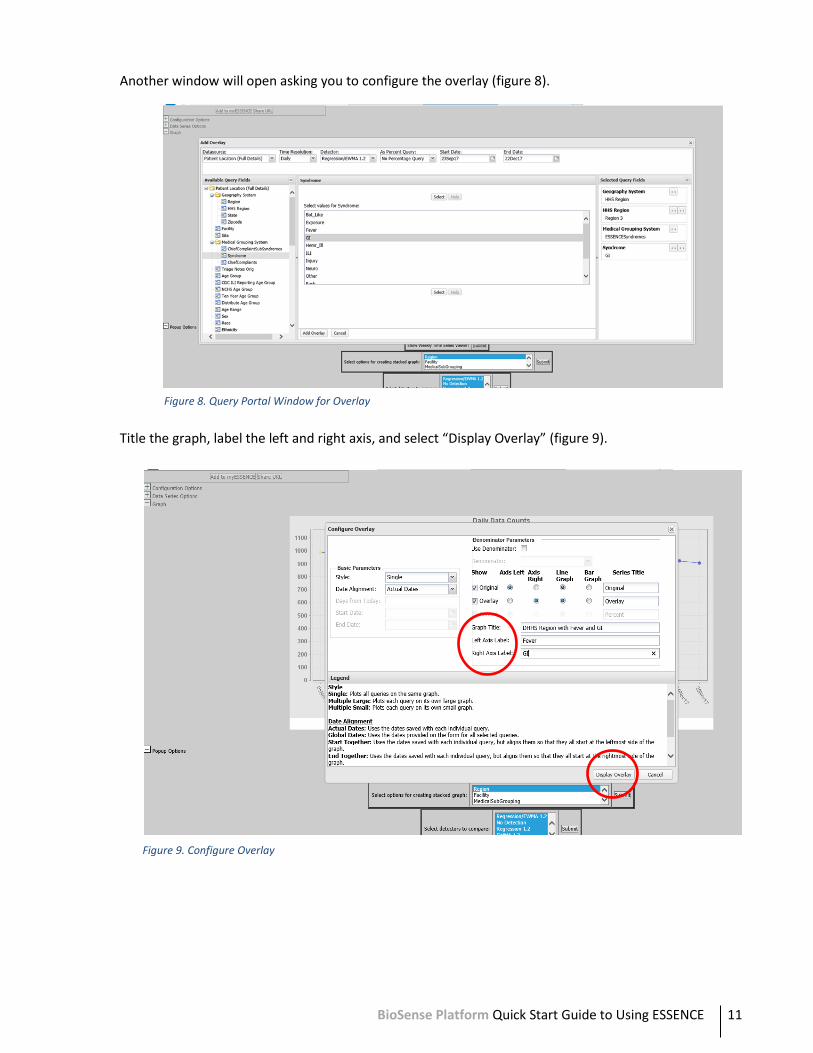
Another window will open asking you to configure the overlay (figure 8).
Title the graph, label the left and right axis, and select “Display Overlay” (figure 9).
Figure 8. Query Portal Window for Overlay
Figure 9. Configure Overlay
BioSense Platform Quick Start Guide to Using ESSENCE 12
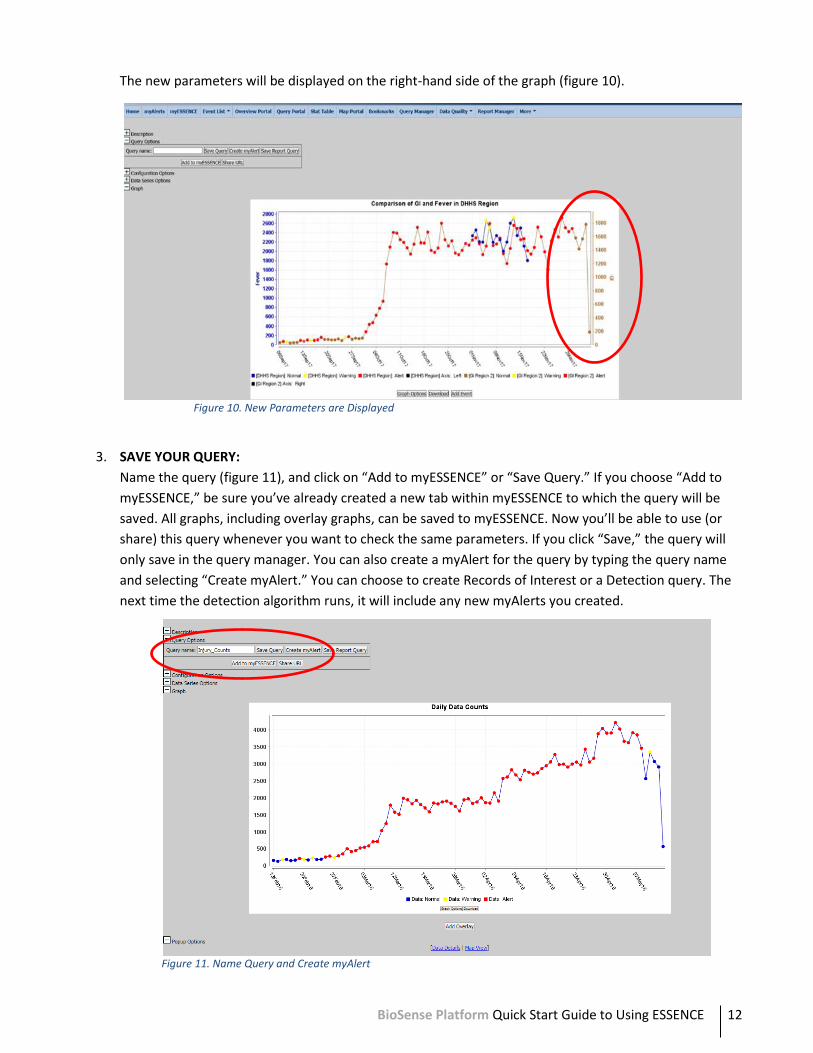
The new parameters will be displayed on the right-hand side of the graph (figure 10).
3. SAVE YOUR QUERY:
Name the query (figure 11), and click on “Add to myESSENCE” or “Save Query.” If you choose “Add to
myESSENCE,” be sure you’ve already created a new tab within myESSENCE to which the query will be
saved. All graphs, including overlay graphs, can be saved to myESSENCE. Now you’ll be able to use (or
share) this query whenever you want to check the same parameters. If you click “Save,” the query will
only save in the query manager. You can also create a myAlert for the query by typing the query name
and selecting “Create myAlert.” You can choose to create Records of Interest or a Detection query. The
next time the detection algorithm runs, it will include any new myAlerts you created.
Figure 11. Name Query and Create myAlert
Figure 10. New Parameters are Displayed
BioSense Platform Quick Start Guide to Using ESSENCE 13
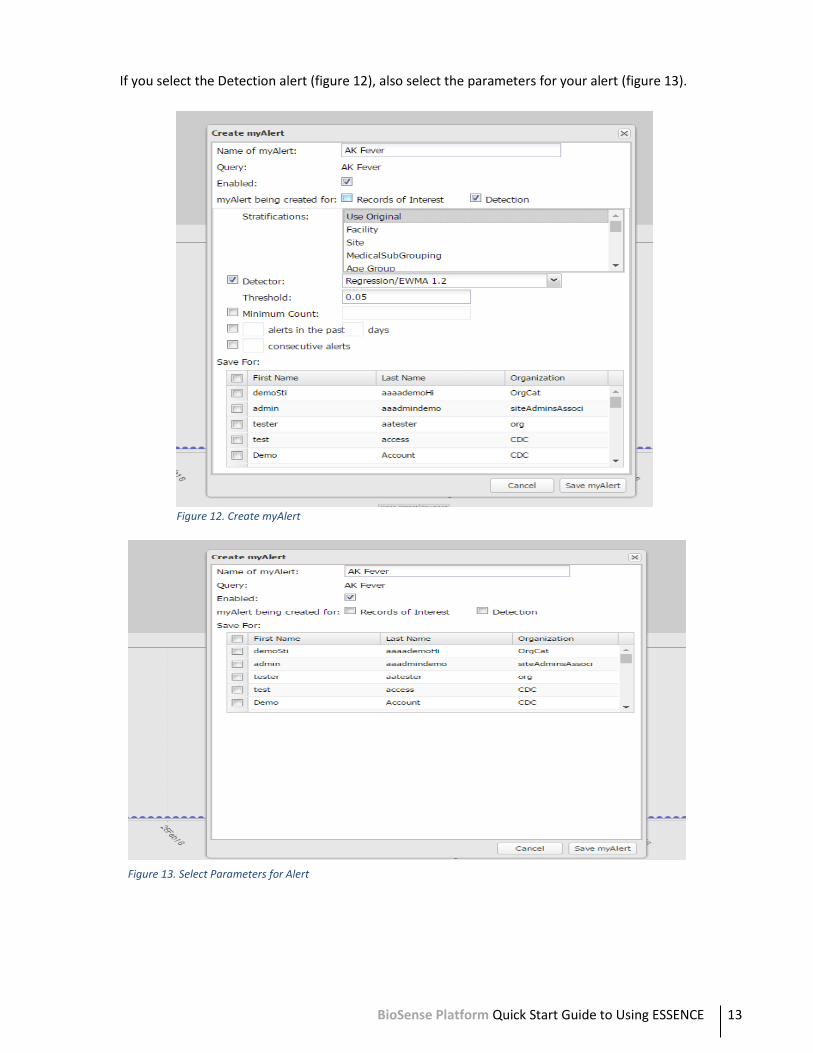
If you select the Detection alert (figure 12), also select the parameters for your alert (figure 13).
Figure 12. Create myAlert
Figure 13. Select Parameters for Alert
BioSense Platform Quick Start Guide to Using ESSENCE 14
4. MODIFY QUERIES:
Queries may be modified or enhanced by clicking on the plus sign (+) next to Configuration Options. This will
show the fields available in the Query Portal.
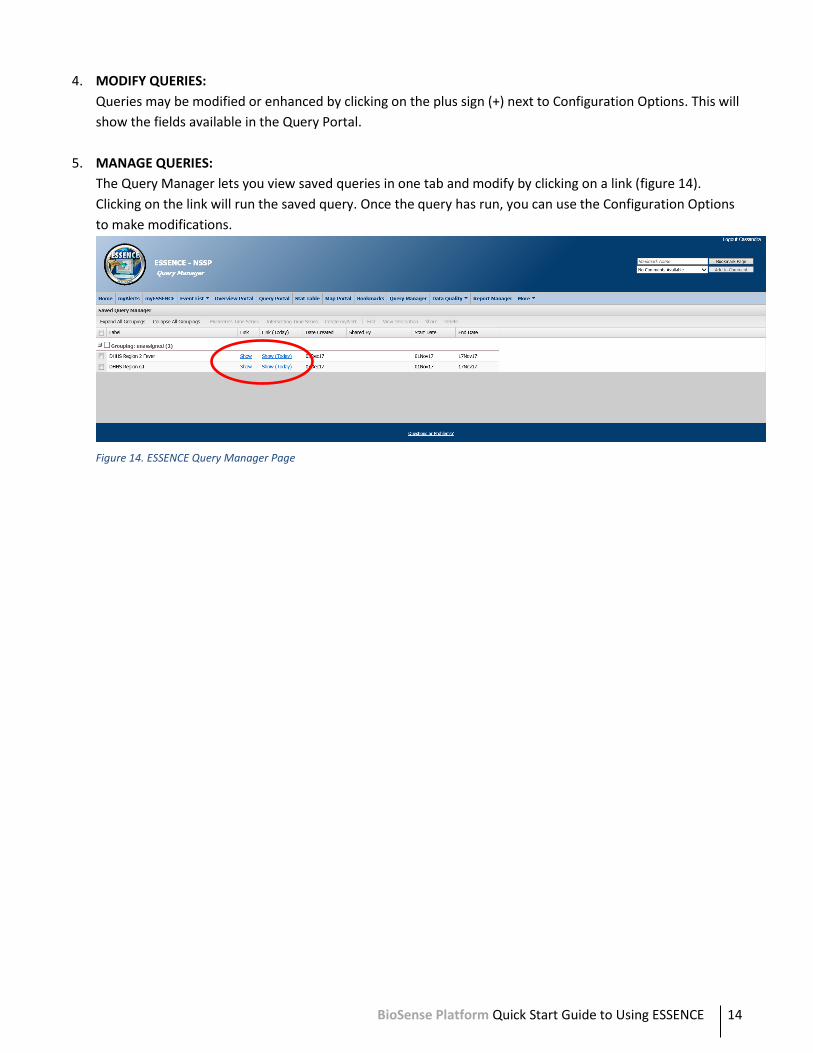
5. MANAGE QUERIES:
The Query Manager lets you view saved queries in one tab and modify by clicking on a link (figure 14).
Clicking on the link will run the saved query. Once the query has run, you can use the Configuration Options
to make modifications.
Figure 14. ESSENCE Query Manager Page
BioSense Platform Quick Start Guide to Using ESSENCE 15
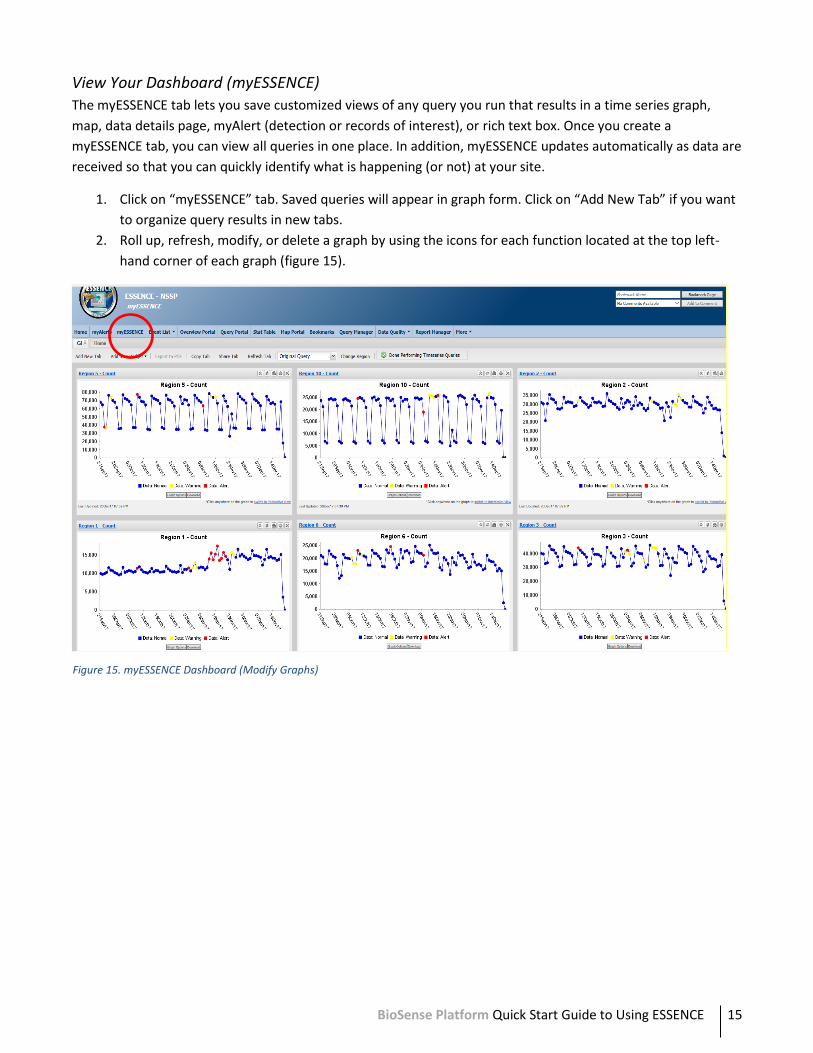
View Your Dashboard (myESSENCE)
The myESSENCE tab lets you save customized views of any query you run that results in a time series graph,
map, data details page, myAlert (detection or records of interest), or rich text box. Once you create a
myESSENCE tab, you can view all queries in one place. In addition, myESSENCE updates automatically as data are
received so that you can quickly identify what is happening (or not) at your site.
1. Click on “myESSENCE” tab. Saved queries will appear in graph form. Click on “Add New Tab” if you want
to organize query results in new tabs.
2. Roll up, refresh, modify, or delete a graph by using the icons for each function located at the top left-
hand corner of each graph (figure 15).
Figure 15. myESSENCE Dashboard (Modify Graphs)
BioSense Platform Quick Start Guide to Using ESSENCE 16
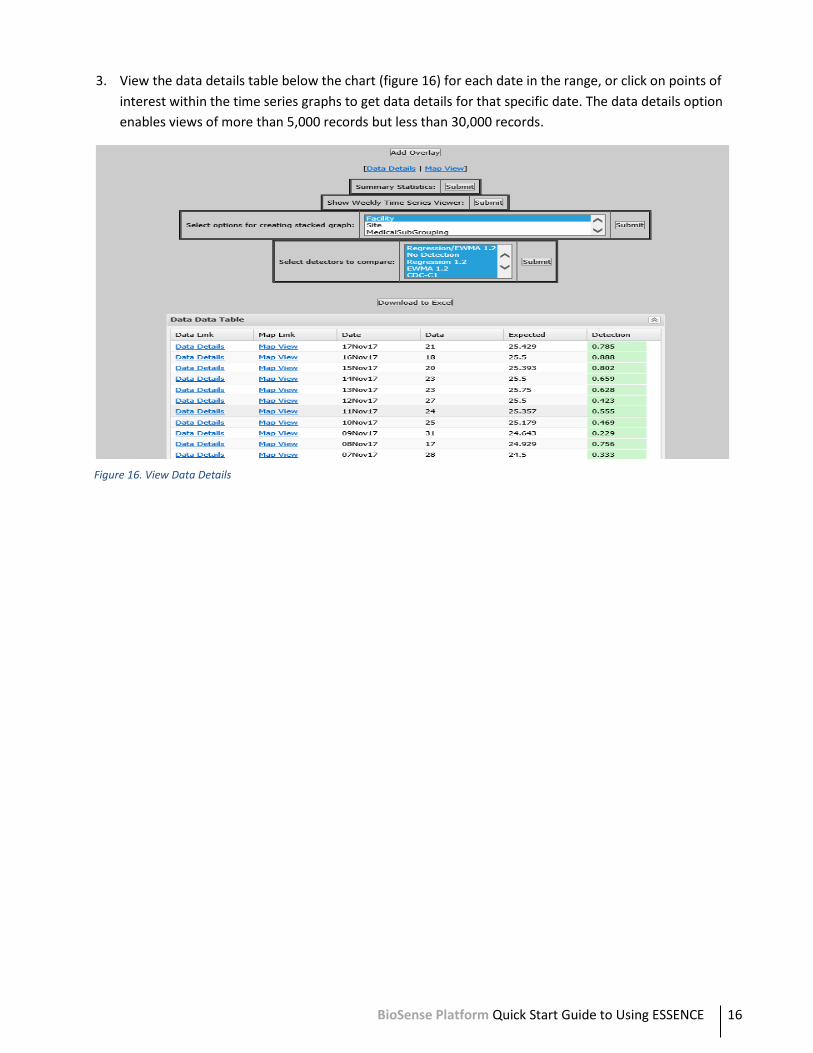
3. View the data details table below the chart (figure 16) for each date in the range, or click on points of
interest within the time series graphs to get data details for that specific date. The data details option
enables views of more than 5,000 records but less than 30,000 records.
Figure 16. View Data Details
BioSense Platform Quick Start Guide to Using ESSENCE 17
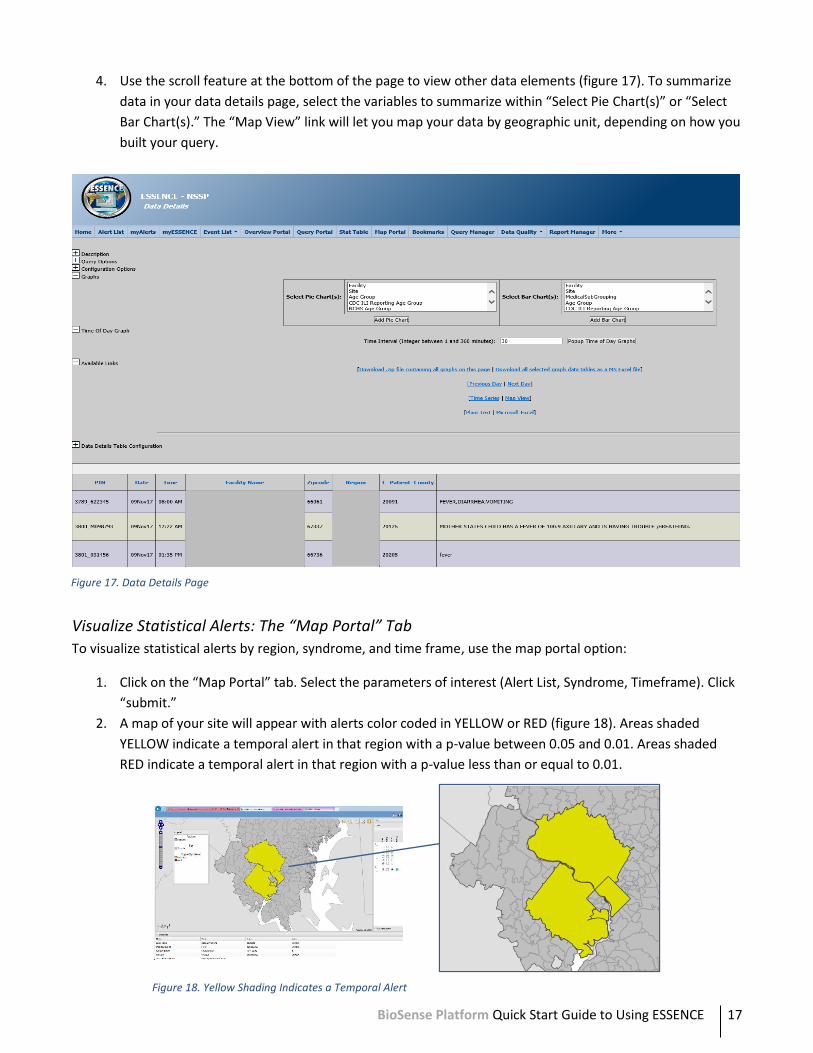
4. Use the scroll feature at the bottom of the page to view other data elements (figure 17). To summarize
data in your data details page, select the variables to summarize within “Select Pie Chart(s)” or “Select
Bar Chart(s).” The “Map View” link will let you map your data by geographic unit, depending on how you
built your query.
Visualize Statistical Alerts: The “Map Portal” Tab
To visualize statistical alerts by region, syndrome, and time frame, use the map portal option:
1. Click on the “Map Portal” tab. Select the parameters of interest (Alert List, Syndrome, Timeframe). Click
“submit.”
2. A map of your site will appear with alerts color coded in YELLOW or RED (figure 18). Areas shaded
YELLOW indicate a temporal alert in that region with a p-value between 0.05 and 0.01. Areas shaded
RED indicate a temporal alert in that region with a p-value less than or equal to 0.01.
Figure 17. Data Details Page
Figure 18. Yellow Shading Indicates a Temporal Alert
BioSense Platform Quick Start Guide to Using ESSENCE 18
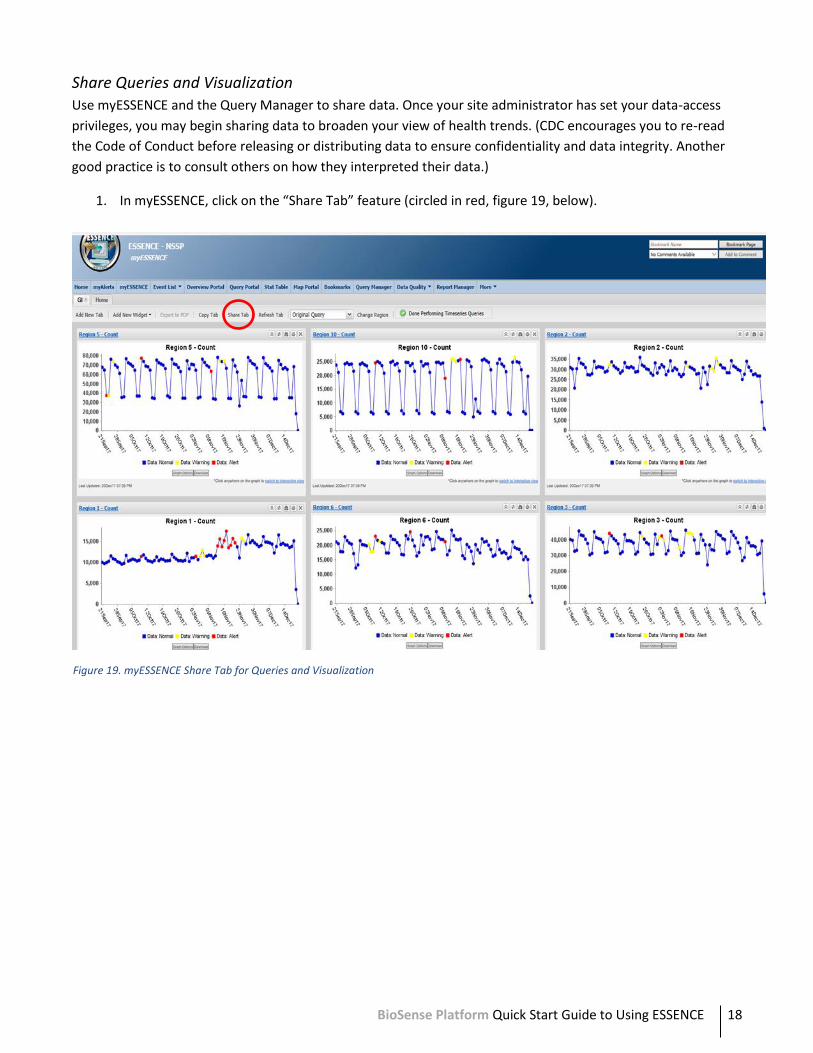
Share Queries and Visualization
Use myESSENCE and the Query Manager to share data. Once your site administrator has set your data-access
privileges, you may begin sharing data to broaden your view of health trends. (CDC encourages you to re-read
the Code of Conduct before releasing or distributing data to ensure confidentiality and data integrity. Another
good practice is to consult others on how they interpreted their data.)
1. In myESSENCE, click on the “Share Tab” feature (circled in red, figure 19, below).
Figure 19. myESSENCE Share Tab for Queries and Visualization
BioSense Platform Quick Start Guide to Using ESSENCE 19
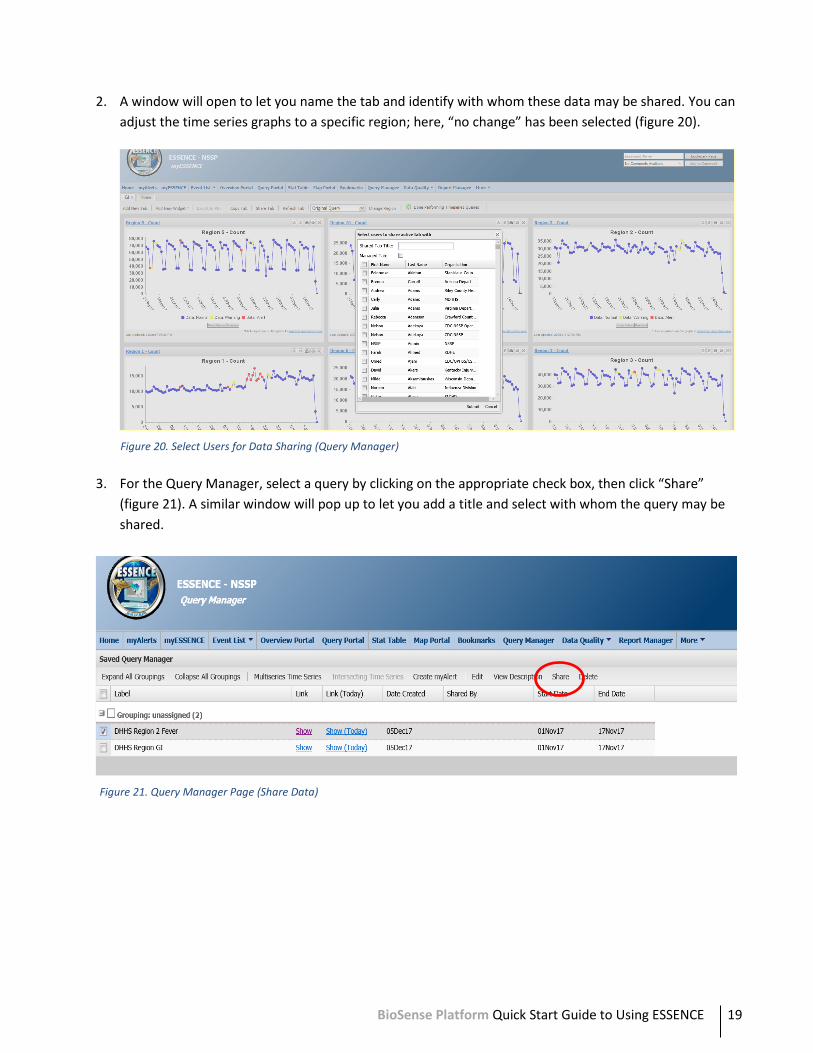
2. A window will open to let you name the tab and identify with whom these data may be shared. You can
adjust the time series graphs to a specific region; here, “no change” has been selected (figure 20).
3. For the Query Manager, select a query by clicking on the appropriate check box, then click “Share”
(figure 21). A similar window will pop up to let you add a title and select with whom the query may be
shared.
Figure 20. Select Users for Data Sharing (Query Manager)
Figure 21. Query Manager Page (Share Data)
BioSense Platform Quick Start Guide to Using ESSENCE 20
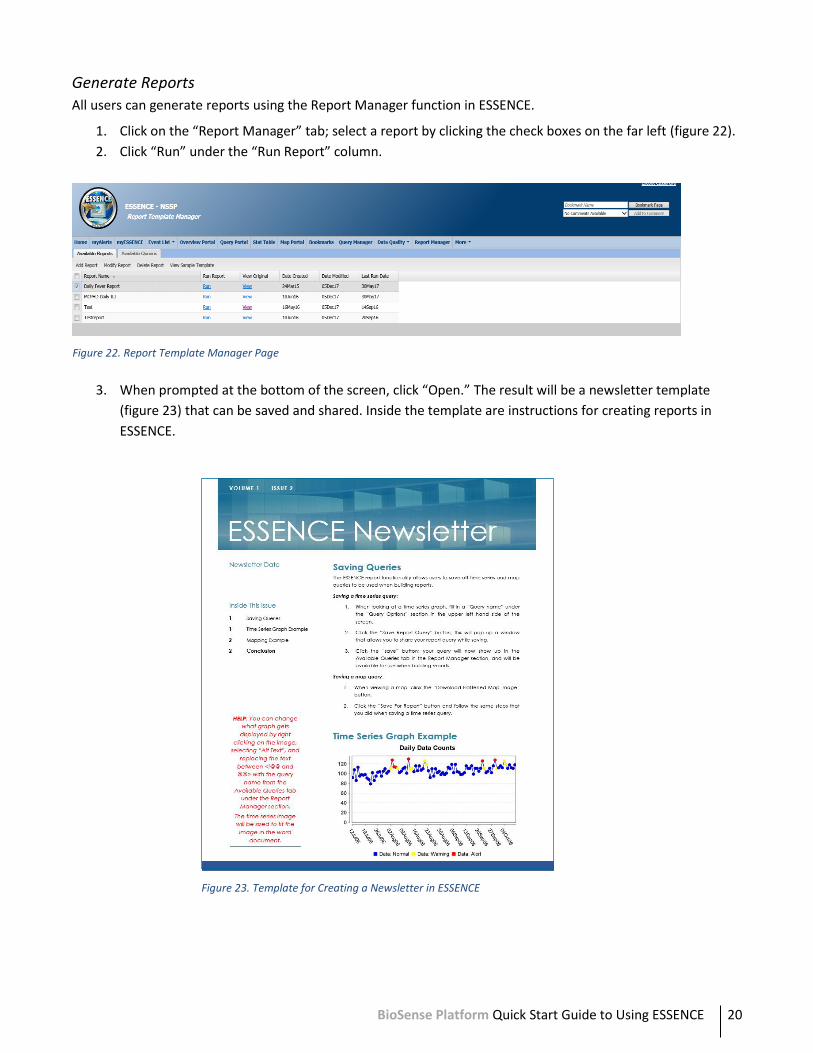
Generate Reports
All users can generate reports using the Report Manager function in ESSENCE.
1. Click on the “Report Manager” tab; select a report by clicking the check boxes on the far left (figure 22).
2. Click “Run” under the “Run Report” column.
3. When prompted at the bottom of the screen, click “Open.” The result will be a newsletter template
(figure 23) that can be saved and shared. Inside the template are instructions for creating reports in
ESSENCE.
Figure 22. Report Template Manager Page
Figure 23. Template for Creating a Newsletter in ESSENCE
BioSense Platform Quick Start Guide to Using ESSENCE 21
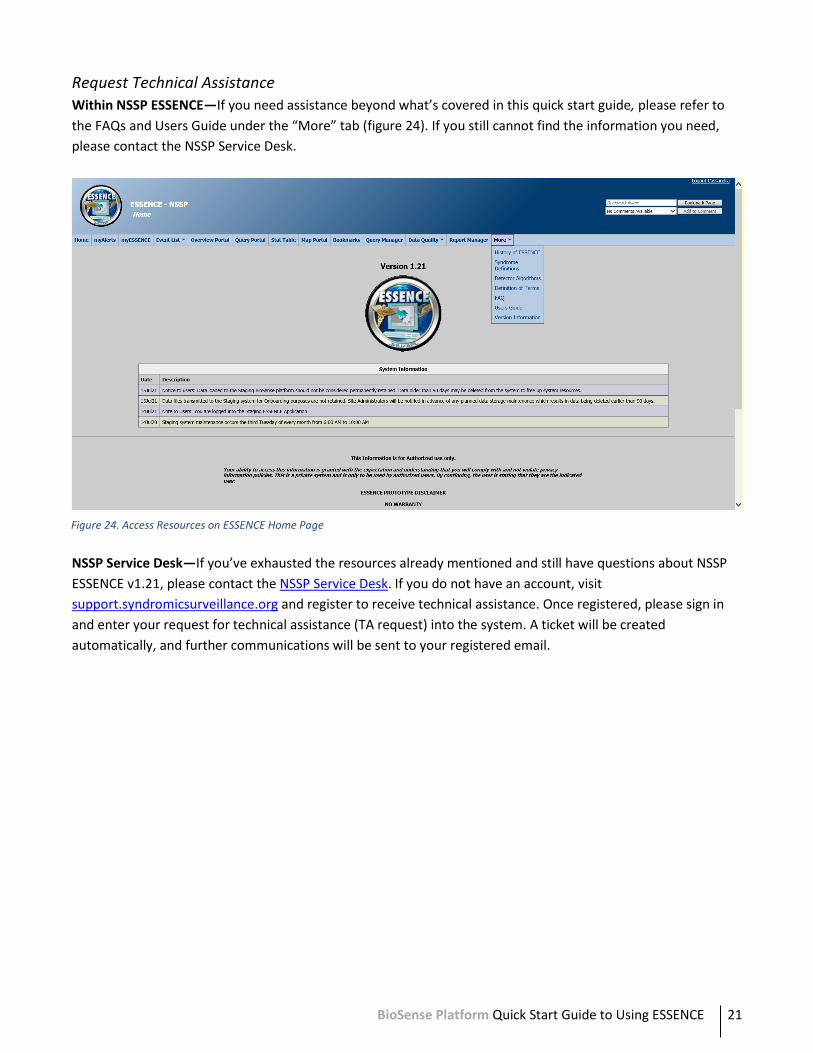
Request Technical Assistance
Within NSSP ESSENCE—If you need assistance beyond what’s covered in this quick start guide, please refer to
the FAQs and Users Guide under the “More” tab (figure 24). If you still cannot find the information you need,
please contact the NSSP Service Desk.
NSSP Service Desk—If you’ve exhausted the resources already mentioned and still have questions about NSSP
ESSENCE v1.21, please contact the NSSP Service Desk. If you do not have an account, visit
support.syndromicsurveillance.org and register to receive technical assistance. Once registered, please sign in
and enter your request for technical assistance (TA request) into the system. A ticket will be created
automatically, and further communications will be sent to your registered email.
Figure 24. Access Resources on ESSENCE Home Page
BioSense Platform Quick Start Guide to Using ESSENCE 22
5. Activities Common to Users and Site Administrators
1. Log in to ESSENCE.
2. Check data access rules created by the site administrator for your site. Create a query on the data
source or data sources (i.e., Patient Location [Full Details], or Patient Location and Visit [Full Details],
or Facility Location [Full Details], or Facility Location and Visit [Full Details] at aggregate or data-details
level) that your site administrator has set up for you. Create a time series graph.
3. Check data access rules created by a site administrator NOT affiliated with your site (if applicable).
Create a query on the data source(s) included in that rule (i.e., Patient Location [Full Details], or
Patient Location and Visit [Full Details], or Facility Location [Full Details], or Facility Location and Visit
[Full Details] at aggregate or data-details level) that the site administrator has set up for you. Create a
time series graph.
4. Check the national picture. Create a query on the data source Patient Location (Limited Details by HHS
Region). Select HHS Region(s) and create a time series graph.
5. Check your data quality. Run a daily, weekly, and monthly data quality report for percent
completeness on ER Data by Facility and by selecting a particular facility in your site for a date range of
your choice.
6. Run a daily, weekly, and monthly data quality report for percent mapped to known values on ER Data
by Facility and by selecting a particular facility in your site for a date range of your choice.
7. Download the data quality report to an MS Excel spreadsheet.
8. Run data quality frequencies on age.
9. View data quality alerts for a time period of your choice.
10. Click Alert list and view the summary alerts for the HHS region. Investigate an alert of interest.
11. Click “Region/Syndrome” tab, and investigate an alert of interest.
12. View the alerts by hospital/syndrome, and investigate the alerts that are level RED for your site.
13. View the spatial alert list, and investigate the alerts that are level RED for zip codes in your site.
14. View the alert list by time of arrival for each syndrome with RED alerts for hospitals in certain zip
codes.
15. Select the data source Patient Location (Full Details), and create a query to investigate ED visits of
patients aged 18–44 years in a site with fever from a date range of your choice, and create a table
showing syndrome by sex and patient class or other variables of your choice.
16. Download the table to MS Excel.
17. Create a time series graph using the same data source and parameters as item 15.
BioSense Platform Quick Start Guide to Using ESSENCE 23
18. Save the query with a name of your choice.
19. Add this time series graph to myESSENCE.
20. Select an alert or warning data point on the graph, and examine the line-level details.
21. Generate different charts (pie chart, bar charts, and pop-up charts) to determine patient breakdown
by gender and race.
22. Download the tables to MS Excel.
23. Download the zip file for the graphs.
24. Select Facility Location (Full Details), and create a graph of your choice investigating ED visits of
patients aged 18–44 years in hospitals in your site or in a particular region of your site for a period of
your choice, and label the graph with title, axis labels, etc.
25. Return to the query portal; select Patient Location (Limited Details by HHS Region) from the list of
data sources; and generate a time series graph of ED visits by patients aged 5–17 years in the fever
syndrome, your HHS Region, and from a date range of your choice.
26. Select add overlay; select Patient Location (Limited Details by HHS Region) from the list of data
sources; and generate an overlay onto the time series graph in line 25 by patients aged 5–17 years in
the fever syndrome, a different HHS region, and from the same date range used in line 25.
27. Click “Configuration Options” to modify the variables in your query. Modify the variables of interest in
the overview to generate a time series graph investigating ED visits by patients aged 5–17 years with
fever by sex or another parameter of your choice.
28. Go to the “Query manager” to find the query you saved in item 18.
29. Share the saved query with another user.
30. Create and save a myAlert query to detect counts of fever in children younger than 5 years of age that
occurred in the past 30 days.
31. Create a records of interest myAlert for patients in your site with GI syndrome.
32. Go to the “myAlerts” tab, and click Manage Alert Definitions to view all alerts created and to share the
alert query with another user.
33. Delete an alert.
34. Add a tab in myESSENCE with a name of your choice.
35. Find the query saved in item 18 in myESSENCE, and add it to the tab you created.
36. Share the new tab in myESSENCE with a user of your choice.
37. Click the query name on the graph to generate a map of the time series graph in the myESSENCE tab.
BioSense Platform Quick Start Guide to Using ESSENCE 24
38. Change the layers of the map to show the location of hospitals in your site and the distribution of ED
visits by HHS region.
39. Add labels to the map.
40. Click the picture of disk to save the shapefile of the map on the bottom right under result.
41. Return to the query portal; create a time series graph to investigate ED visits of patients
aged 5–17 years in a site with fever from a date range of your choice; and save it as a report query.
42. Generate an external report for publishing.
43. Bookmark the query created in item 24.
44. Explore using the segregated Chief Complaint Query Tool to develop a new definition. In the Query
Portal, select the data source Chief Complaint Query Validation.
45. Query Chief Complaint Free Text, Discharge Diagnosis, and CC and DD for keywords relevant to
developing an outcome definition for anything related to a drug overdose.
46. Select the CC and DD query field, and select three free-text strings to query simultaneously.
47. Subsequent to identification of relevant keywords, apply a query definition in the Query Portal to
identify details of relevant cases.
48. After completing these tasks, log out from ESSENCE.