Embed Size (px)
Citation preview

BIOSENOSRSBIO 580
Error analysis in biosensingWEEK-14Fall Semester
Faculty: Dr. Javed H. Niazi KMFaculty of Engineering & Natural SciencesSabanci University
Topics that will be covered in the course
History of biosensor development, applications and requirements of biosensors and classification
Principles of molecular recognition and transduction signal acquisition
Sources of Biological Recognition elements – enzymes/proteins, ssDNAs, antibody and Others
Design considerations for use of recognition elements in biosensors
Modeling of reactions for various biosensor applications‐ electrochemical, optical, piezoelectric, colorimetric, fluorometric
and others.
Modification of sensor surfaces and immobilization techniques
Covalent modification of surfaces using surface chemistry
Self Assembled Monolayers (SAM) and adsorptions
Other ways to immobilize biological macromolecules on various solid surfaces
Detection methods and Physical Sensors
Electrodes/transducers – electrochemical (amperometric, potentiometric, and conductimetric transductions)
Other sensors ‐ for e.g., optical sensors (colorimetric/fluorimetric/luminometric sensors), Surface Plasmon Resonance (SPR)
sensors, and piezoelectric resonators.
Fabrication of biosensors
Miniaturization‐application of nano‐materials, nanoparticles, carbon nanotubes (CNTs) and others
Biocompatibility – stability, reproducibility and repeatability of biomolecules on transducer surfaces
Data acquisition, statistical and error analysis
Inter and Intra‐assays and Coefficient of variation (CV)
Signal to noise ratio
Normalization/optimization and signal retrieval
Examples of commercial biosensors

Click here!! Google Books: Smart biosensor technology By George K. Knopf, Amarjeet S. Bassi


Google book for mathematical modeling and error analysis

In probability theory and statistics, the relative standard deviation (RSD or %RSD) is the absolute value of the coefficient of variation. It is often expressed as a percentage. A similar term that is sometimes used is the relative variance which is the square of the coefficient of variation. Also, the relative standard error is a measure of a statistical estimate's reliability obtained by dividing the standard error by the estimate; then multiplied by 100 to be expressed as a percentThe relative standard deviation is widely used in analytical chemistry to express the precision and repeatability of an assay.
(standard deviation of array X) 100 / (average of array X) = relative standard deviation
Relative standard deviation
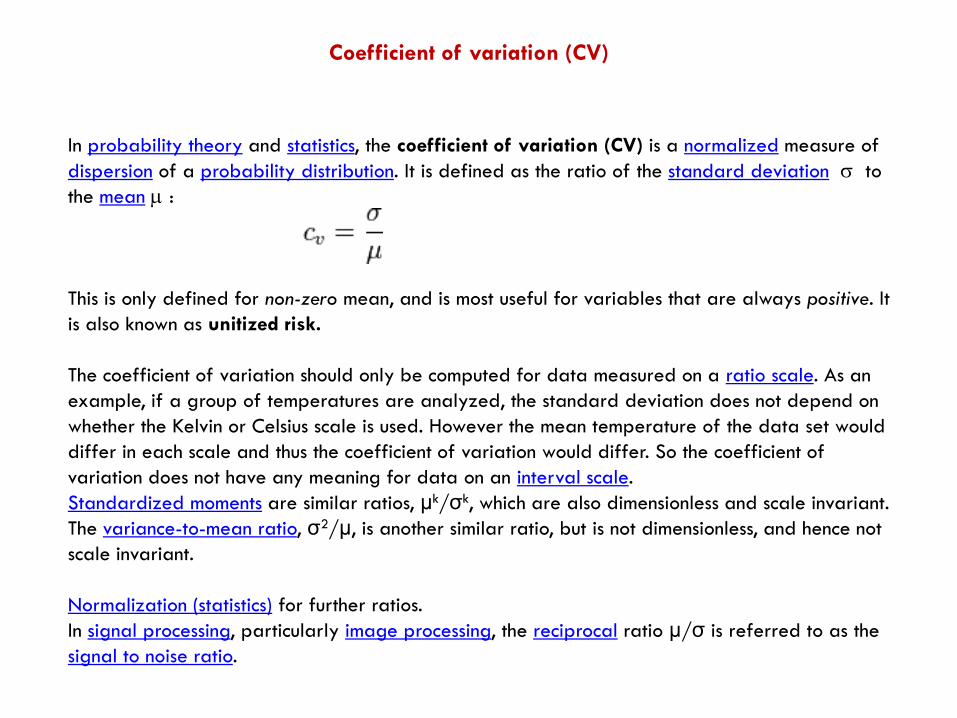
In probability theory and statistics, the coefficient of variation (CV) is a normalized measure of dispersion of a probability distribution. It is defined as the ratio of the standard deviation σ to the mean μ :
This is only defined for non-zero mean, and is most useful for variables that are always positive. It is also known as unitized risk.
The coefficient of variation should only be computed for data measured on a ratio scale. As an example, if a group of temperatures are analyzed, the standard deviation does not depend on whether the Kelvin or Celsius scale is used. However the mean temperature of the data set would differ in each scale and thus the coefficient of variation would differ. So the coefficient of variation does not have any meaning for data on an interval scale.Standardized moments are similar ratios, μk/σk, which are also dimensionless and scale invariant. The variance-to-mean ratio, σ2/μ, is another similar ratio, but is not dimensionless, and hence not scale invariant.
Normalization (statistics) for further ratios.In signal processing, particularly image processing, the reciprocal ratio μ/σ is referred to as the signal to noise ratio.
Coefficient of variation (CV)
AdvantagesThe coefficient of variation is useful because the standard deviation of data must always be understood in the context of the mean of the data. The coefficient of variation is a dimensionless number. So when comparing between data sets with different units or widely different means, one should use the coefficient of variation for comparison instead of the standard deviation.
Response timeThis response is characteristic of well-damped,inherent second-order systems. A single parameter from theresponse curve is usually reported, such as T95, the 95% responsetime, defined as the time required for the amplitude of the signalto change from its initial steady state value to 95% of the finalsteady state value.
Dynamic Delay and Dynamic Error
The dynamic delay has been used historically to describe the delay, lag, or temporal displacement between physical transients and the sensor responses to those transients.
The dynamic delay is specified solely by properties of the biosensorand external mass transfer.
The dynamic error, a related term, is the difference between the actual value of the variable at a given moment and the value simultaneously reported by the sensor.
The dynamic error is the product of the dynamic delay and the instantaneous rate of analyte change.
The dynamic delay and dynamic error have been adapted for in vitro characterization of biosensors exposed to concentration challenges in the form oflinear ramps
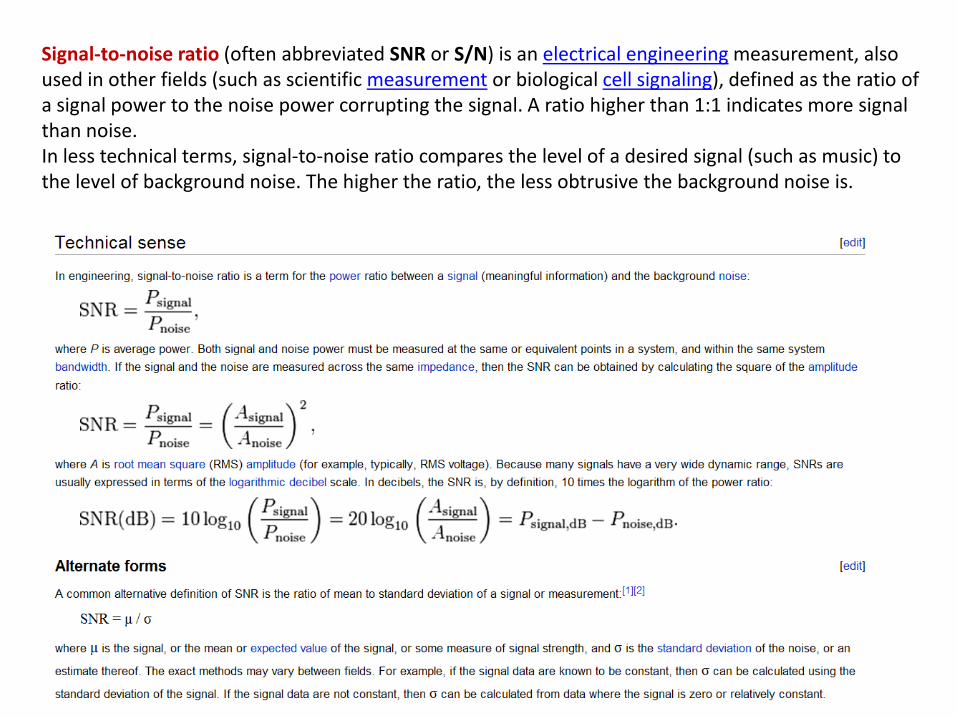
Signal‐to‐noise ratio (often abbreviated SNR or S/N) is an electrical engineering measurement, also used in other fields (such as scientific measurement or biological cell signaling), defined as the ratio of a signal power to the noise power corrupting the signal. A ratio higher than 1:1 indicates more signal than noise.In less technical terms, signal‐to‐noise ratio compares the level of a desired signal (such as music) to the level of background noise. The higher the ratio, the less obtrusive the background noise is.

Assay Quality Control
Results produced by a given laboratory for each assay are consistent over time and that results produced by different laboratories from the same samples are comparable.
One published study has investigated within- and between-laboratory variation in Elisa results in the USA (Kreider 1991b). Results varied significantly and substantially among different laboratories (the greater source of variation) and among different days in the same laboratory.
This suggests that single determinations on individual serum samples are not likely to give a reliable estimate of antibody titre. The large variability within laboratories further indicates the need for standard reference pools of positive serum to be included in assays in order to substantiate assay results.
Murray et al. (1993) have discussed in some detail the sources of variability of assay results. While these authors concentrated on biochemical assays the same basic principles apply equally well to serology. Each assay must be validated to identify and quantify sources of variation in results. We must also keep in mind that there are non-assay sources of variation. These can be grouped into those factors which precede the assay (how and when a sample is taken, how it is manipulated, stored, transported, and identified) and those which come after (for example transcription errors in report generation).
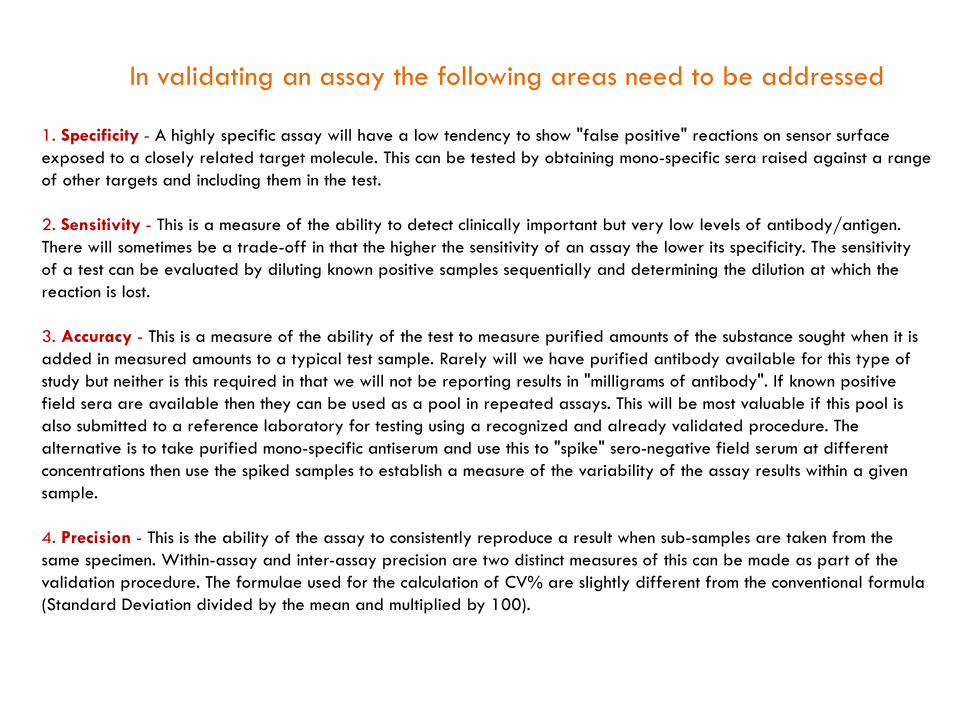
1. Specificity - A highly specific assay will have a low tendency to show "false positive" reactions on sensor surface exposed to a closely related target molecule. This can be tested by obtaining mono-specific sera raised against a range of other targets and including them in the test.
2. Sensitivity - This is a measure of the ability to detect clinically important but very low levels of antibody/antigen. There will sometimes be a trade-off in that the higher the sensitivity of an assay the lower its specificity. The sensitivity of a test can be evaluated by diluting known positive samples sequentially and determining the dilution at which the reaction is lost.
3. Accuracy - This is a measure of the ability of the test to measure purified amounts of the substance sought when it is added in measured amounts to a typical test sample. Rarely will we have purified antibody available for this type of study but neither is this required in that we will not be reporting results in "milligrams of antibody". If known positive field sera are available then they can be used as a pool in repeated assays. This will be most valuable if this pool is also submitted to a reference laboratory for testing using a recognized and already validated procedure. The alternative is to take purified mono-specific antiserum and use this to "spike" sero-negative field serum at different concentrations then use the spiked samples to establish a measure of the variability of the assay results within a given sample.
4. Precision - This is the ability of the assay to consistently reproduce a result when sub-samples are taken from the same specimen. Within-assay and inter-assay precision are two distinct measures of this can be made as part of the validation procedure. The formulae used for the calculation of CV% are slightly different from the conventional formula (Standard Deviation divided by the mean and multiplied by 100).
In validating an assay the following areas need to be addressed
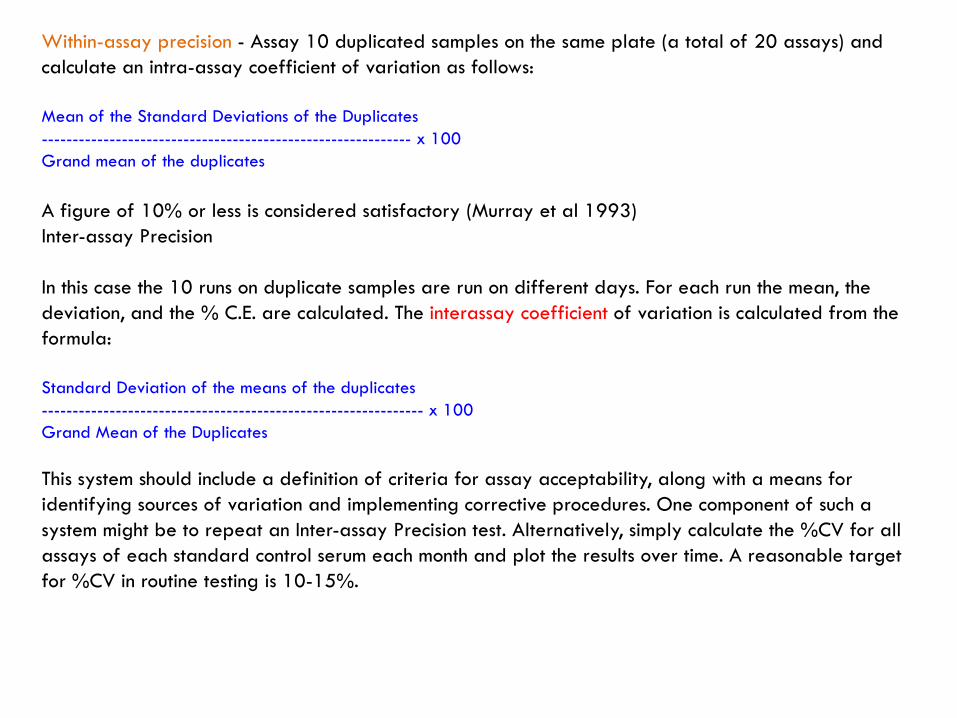
Within-assay precision - Assay 10 duplicated samples on the same plate (a total of 20 assays) and calculate an intra-assay coefficient of variation as follows:
Mean of the Standard Deviations of the Duplicates------------------------------------------------------------ x 100Grand mean of the duplicates
A figure of 10% or less is considered satisfactory (Murray et al 1993)Inter-assay Precision
In this case the 10 runs on duplicate samples are run on different days. For each run the mean, the deviation, and the % C.E. are calculated. The interassay coefficient of variation is calculated from the formula:
Standard Deviation of the means of the duplicates-------------------------------------------------------------- x 100Grand Mean of the Duplicates
This system should include a definition of criteria for assay acceptability, along with a means for identifying sources of variation and implementing corrective procedures. One component of such a system might be to repeat an Inter-assay Precision test. Alternatively, simply calculate the %CV for all assays of each standard control serum each month and plot the results over time. A reasonable target for %CV in routine testing is 10-15%.