Embed Size (px)
Citation preview

11/27/13
1
Epigenetics – Histone modifications
Biosciences 741: Genomics Fall, 2013 Week 14
Epigenetics in Health and Disease by I. Kovalchuk and O. Kovalchuk (2012).

11/27/13
2
The inter-relationship of histone modifications and histone methylation in plants
• In the met1 mutant (a DNA methylase), the loss of CpG methylation leads to the loss of H3K9 methylation (showing that the former can cause the latter).
• On the other hand, the KYP mutant (Kryptonite; an H3K9 methylase) results in the loss of H3K9 methylation but does not alter the level of CpG methylation.
• The evidence in animals is less clear, and might work in both directions.
Chromatin marks define functional ���categories of genes
• Active (on) - H3K4me3, H3K9ac, phosphorylated RNA pol II.
• Permissive (stalled) - H3K4me3, H3K9ac, RNA pol II not phosphorylated.
• Bivalent (poised, inducible) - H3K4me3, H3K27me3.
• Repressive (off) - H3K9me3, H3K27me3.
11/27/13
3
Transcriptionally active chromatin is associated with H3K4me and H3K9ac. Inactive chromatin requires the removal of H3K4me and H3K9ac, followed by blocking this location with H3K9me.
HP1 binds H3K9me, and recruits DNMTs, which methylate DNA. MeCP2 binds methylated DNA, and recruits HDACs, which remove additional histone acetyl groups.
Epigenetics in Health and Disease by I. Kovalchuk and O. Kovalchuk (2012).
Epigenetics in Health and Disease by I. Kovalchuk and O. Kovalchuk (2012).
Significance of histone modifications - me1 and ac usually stimulate transcription, but me2 and me3 effects are position-dependent.
11/27/13
4
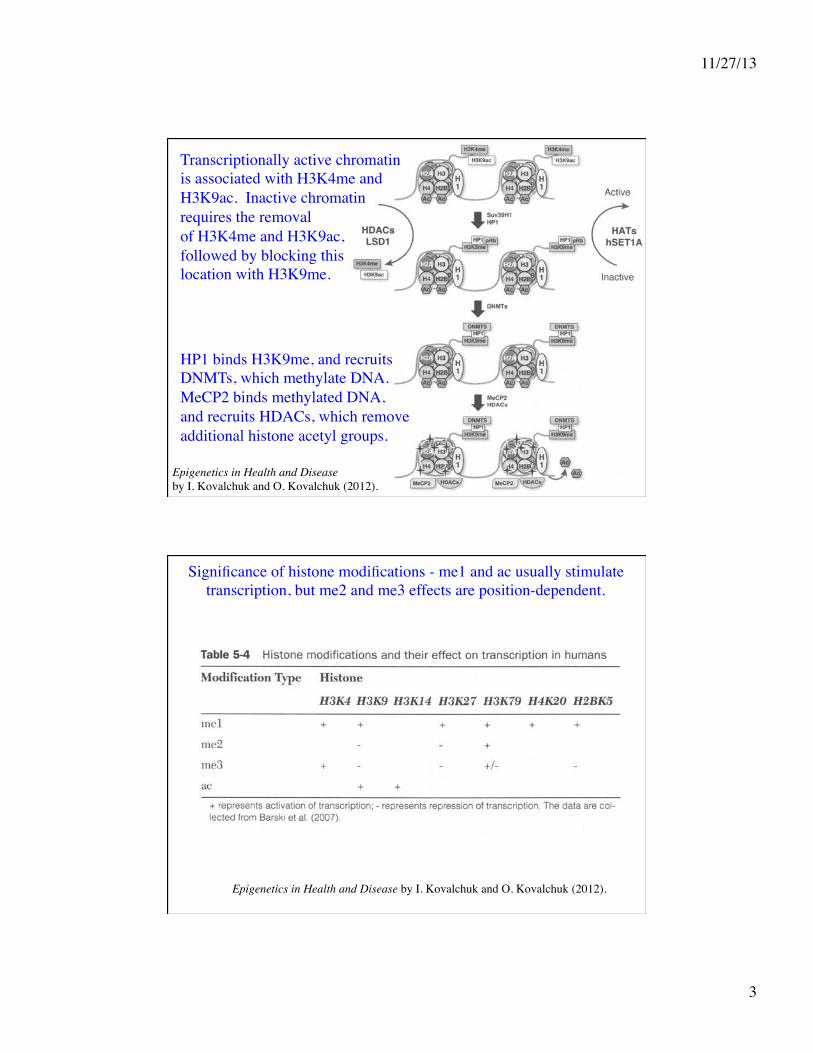
Top - histone methylation can influence transcription by bringing separate regions of chromatin together, forming loops.
Bottom - “pioneering factors” (PF, sequence-specific DNA binding proteins) can recruit DNA methylation and histone modification factors (CM), which make the chromatin more accessible for the Pre-initiation complex (PIC) and RNA polymerase II (RNAPII).
Greer & Shi (2012) Nat. Rev. Genet. 13, 343-357
Greer & Shi (2012) Nat. Rev. Genet. 13, 343-357
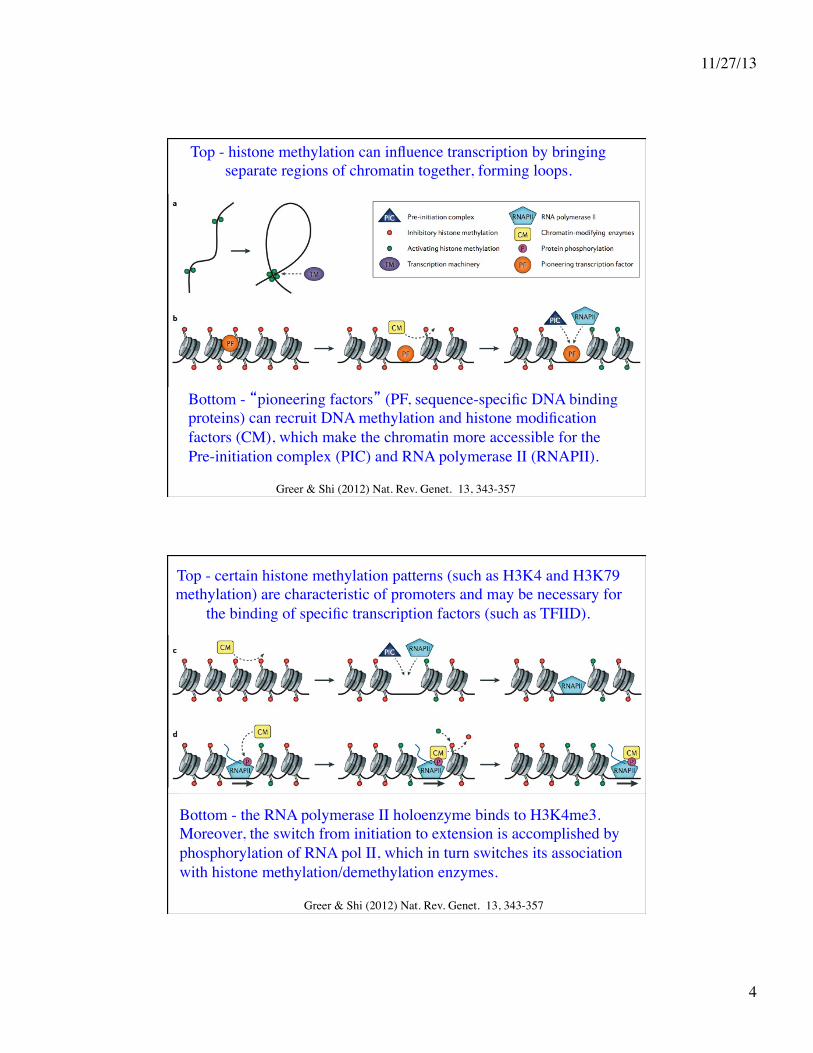
Top - certain histone methylation patterns (such as H3K4 and H3K79 methylation) are characteristic of promoters and may be necessary for
the binding of specific transcription factors (such as TFIID).
Bottom - the RNA polymerase II holoenzyme binds to H3K4me3. Moreover, the switch from initiation to extension is accomplished by phosphorylation of RNA pol II, which in turn switches its association with histone methylation/demethylation enzymes.
11/27/13
5
Greer & Shi (2012) Nat. Rev. Genet. 13, 343-357
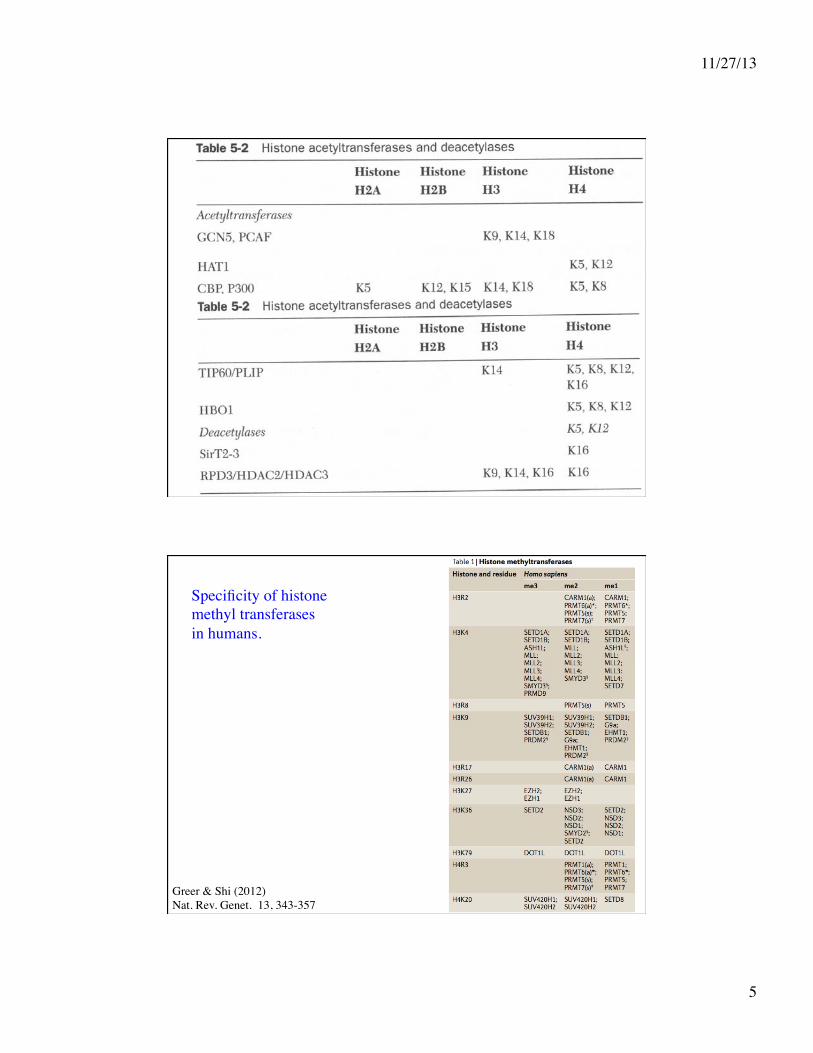
Specificity of histone methyl transferases in humans.

11/27/13
6
Greer & Shi (2012) Nat. Rev. Genet. 13, 343-357
Specificity of histone demethylase enzymes in humans.
Cancer is associated with decreases in histone methylation
Greer & Shi (2012) Nat. Rev. Genet. 13, 343-357

11/27/13
7
Chromosomal translocations that disrupt histone methyl transferases or histone demethylases are associated with cancer and cognitive defects.
Greer & Shi (2012) Nat. Rev. Genet. 13, 343-357
Greer & Shi (2012) Nat. Rev. Genet. 13, 343-357
Top - another possibility is that chromatin is replicated by following DNA methylation signals (there is some evidence for this).
Bottom - a fourth possibility is that histones with pre-existing modifications (or variant histones) may be recruited to certain sites.

11/27/13
8
Top - replication of chromatin might proceed through semiconservative assembly of half-nucleosomes.
Bottom - another possibility is fully conservative partitioning of intact nucleosomes between daughter chromatids.
Greer & Shi (2012) Nat. Rev. Genet. 13, 343-357
Histone variants • Histone variants, such as H2A.Z, are distinct proteins that are
encoded by separate genes. Their genes are evolutionarily related to the histone gene family.
• H2A.Z is mainly associated with the promoter region of active genes that lack DNA methylation. It is deposited by the ATP-dependent chromatin-remodeling complex SWR1. It destabilizes nucleosomes and helps to stimulate transcription.
• H2AX is another histone variant. It is associated with DNA strand breaks and helps to recruit DNA repair enzymes.
• H3.1 and H3.2 differ by a single amino acid and are deposited into chromatin during DNA replication. H3.3 is deposited independently of replication in quiescent, G1, and G2 cells, and is specifically associated with the promoters of active genes.

11/27/13
9
H2A.Z and H3.3 histone genes
• Most histones are synthesized and assembled into nucleosomes in parallel with DNA synthesis. However, the H2A.Z and H3.3 variants are synthesized from genes that are expressed throughout the cell cycle, and these histones therefore must be actively substituted for existing histone molecules within individual nucleosomes.
• H2A.Z typically occurs in nucleosomes as a heterodimer with H2A, which it likely destabilizes due to the divergent structure of its dimerization region.
• In Arabidopsis, H2A.Z antagonizes, and is antagonized by, DNA methylation.
• H3.3 differs from H3.1 and H3.2 at only four amino acids. Its role is unclear but may help to facilitate the insertion of H2A.Z.
Jin et al. (2009) Nat. Genet. 41, 941-945.
Figure 1 H3.3/H2A.Z NCPs mark ‘nucleosome-free regions’ of active promoters. Tags in non- overlapping 20-bp windows relative to the aligned transcription start sites (TSSs) were tallied in the gene set. The tag counts were normalized by the total numbers of bases. In a–f, island-filtered 5’ tags were used and the profiles were further normalized by the total number of island-filtered tags in the library. TSSs for 1,000 highly active (red), intermediately active (cyan) and silent genes (black). (f) Profile of H2A.Z-containing NCPs isolated in high salt.
11/27/13
10
Jin et al. (2009) Nat. Genet. 41, 941-945.
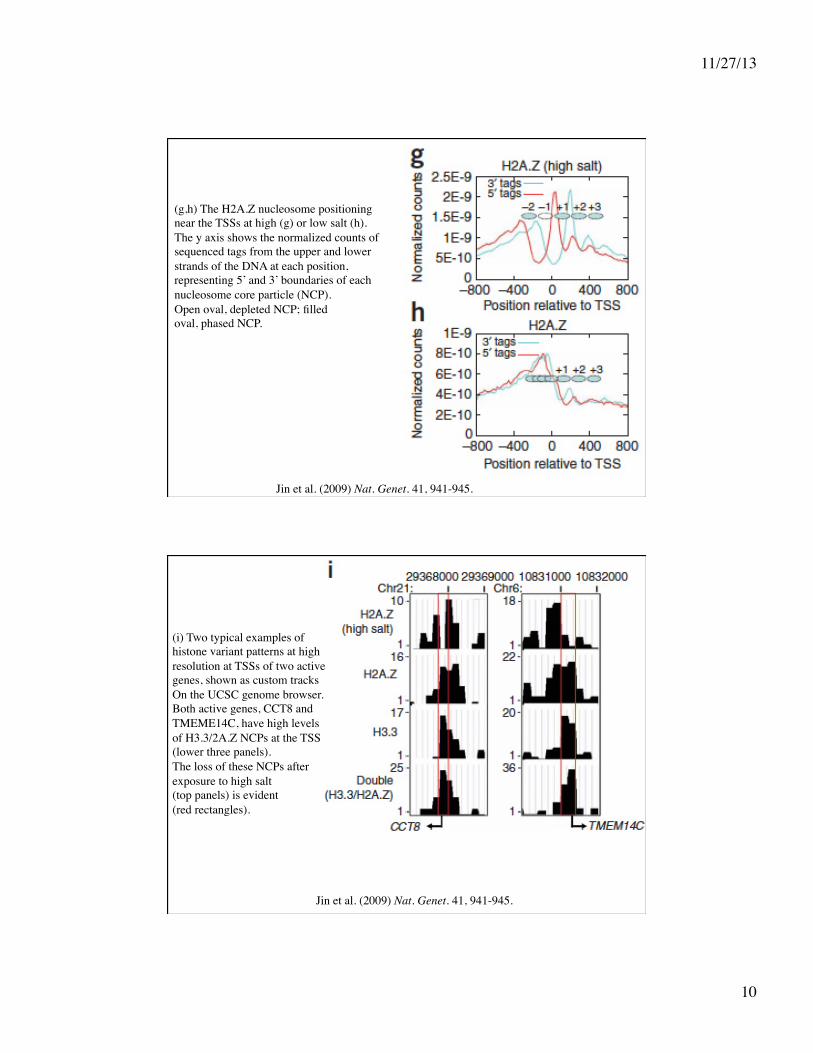
(g,h) The H2A.Z nucleosome positioning near the TSSs at high (g) or low salt (h). The y axis shows the normalized counts of sequenced tags from the upper and lower strands of the DNA at each position, representing 5’ and 3’ boundaries of each nucleosome core particle (NCP). Open oval, depleted NCP; filled oval, phased NCP.
Jin et al. (2009) Nat. Genet. 41, 941-945.
(i) Two typical examples of histone variant patterns at high resolution at TSSs of two active genes, shown as custom tracks On the UCSC genome browser. Both active genes, CCT8 and TMEME14C, have high levels of H3.3/2A.Z NCPs at the TSS (lower three panels). The loss of these NCPs after exposure to high salt (top panels) is evident (red rectangles).
11/27/13
11
Jin et al. (2009) Nat. Genet. 41, 941-945.
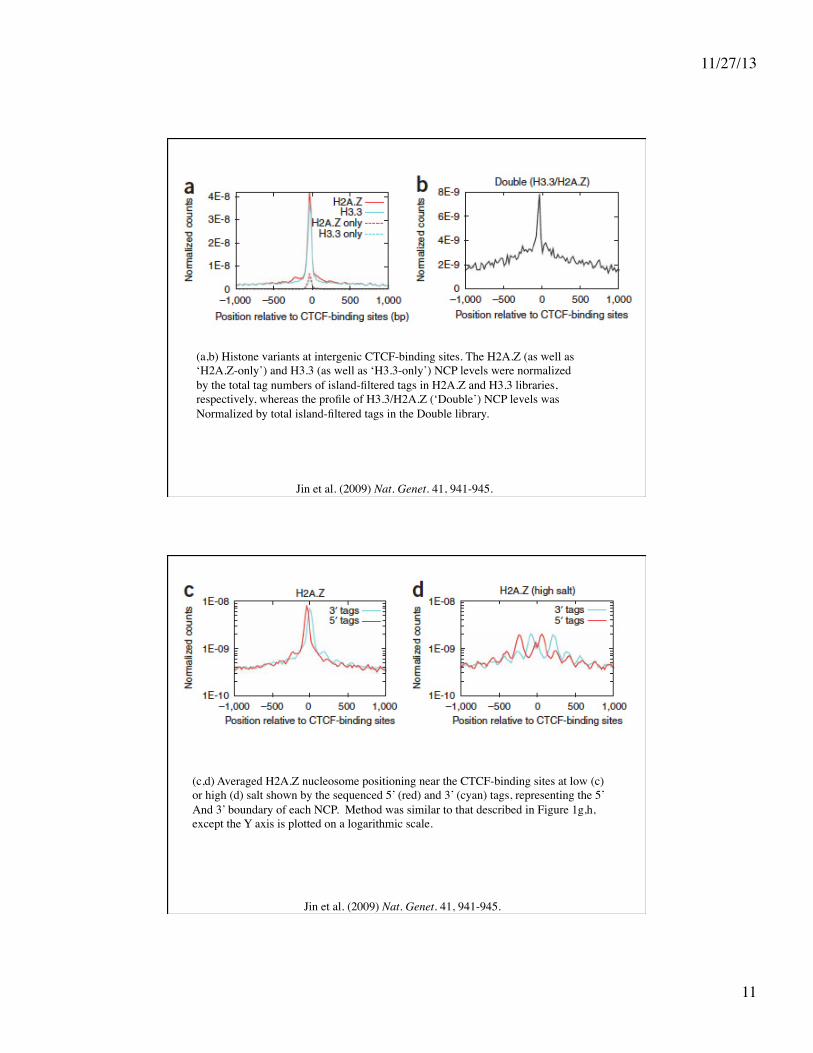
(a,b) Histone variants at intergenic CTCF-binding sites. The H2A.Z (as well as ‘H2A.Z-only’) and H3.3 (as well as ‘H3.3-only’) NCP levels were normalized by the total tag numbers of island-filtered tags in H2A.Z and H3.3 libraries, respectively, whereas the profile of H3.3/H2A.Z (‘Double’) NCP levels was Normalized by total island-filtered tags in the Double library.
Jin et al. (2009) Nat. Genet. 41, 941-945.
(c,d) Averaged H2A.Z nucleosome positioning near the CTCF-binding sites at low (c) or high (d) salt shown by the sequenced 5’ (red) and 3’ (cyan) tags, representing the 5’ And 3’ boundary of each NCP. Method was similar to that described in Figure 1g,h, except the Y axis is plotted on a logarithmic scale.

11/27/13
12
Jin et al. (2009) Nat. Genet. 41, 941-945.
(e) Histone variants at ENCODE DNase I hypersensitive (HS) sites. All DNase I HS sites were aligned and normalized to the same length and were partitioned into 20 blocks. Island-filtered tags in each block were tallied and normalized by the total number of bases in each block. Outside the DNase I HS sites, island-filtered tags were tallied in 50-bp windows in the 2-kb upstream and downstream regions and normalized similarly. At the end, the profile was also normalized by the total number of island-filtered tags in each sample. (f) In HeLa cells, H3.3/H2A.Z NCPs are enriched only at HeLa DNase I hypersensitive sites (red) but not at sites (cyan) that are DNase I hypersensitive in CD4+ T cells but not in HeLa.
Profiles of histone variants indicated above each panel in and around gene bodies for 1,000 highly active (red), intermediately active (cyan) or silent (black) genes. For each gene, island-filtered tags were summed according to their shifted positions in 1-kb windows from 5 kb upstream of the TSS (txStart) to the txStart and from the TTS (txEnd) to 5 kb downstream of the TSS. Within the gene bodies, island-filtered tags were summed according to their shifted positions in windows equal to 5% of the gene length. All window tag counts were normalized by the total number of bases in the windows.
Jin et al. (2009) Nat. Genet. 41, 941-945.
11/27/13
13
Jin et al. (2009) Nat. Genet. 41, 941-945.
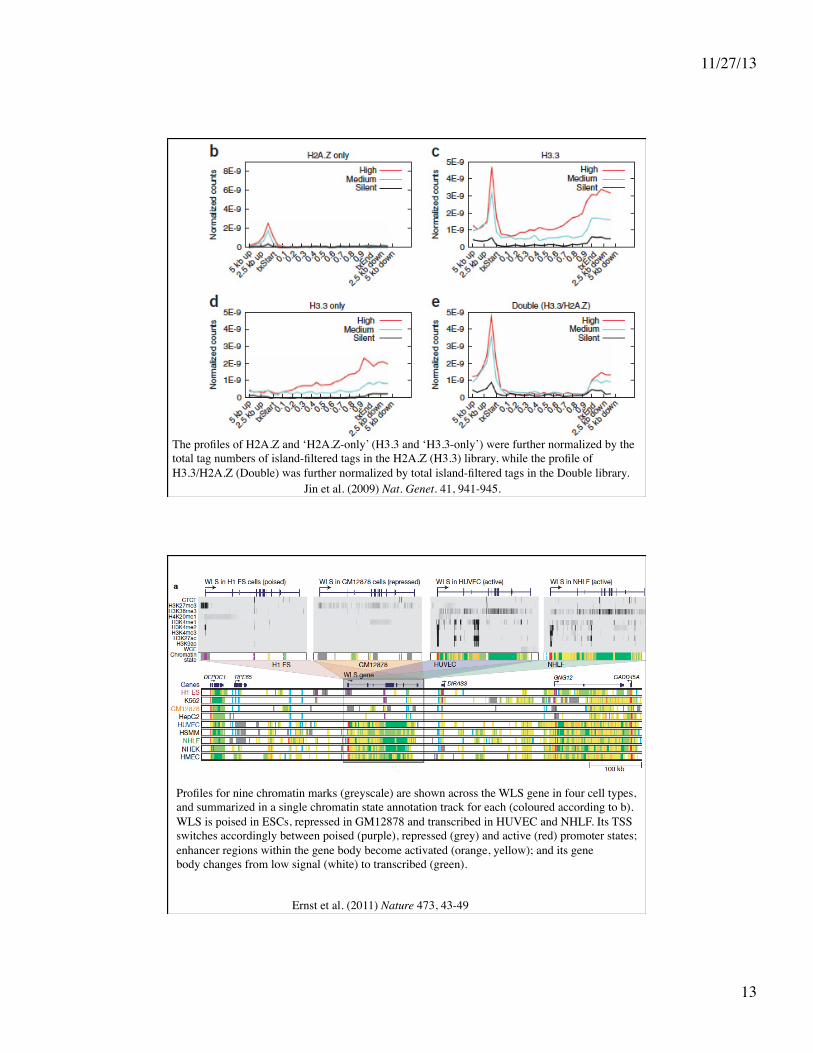
The profiles of H2A.Z and ‘H2A.Z-only’ (H3.3 and ‘H3.3-only’) were further normalized by the total tag numbers of island-filtered tags in the H2A.Z (H3.3) library, while the profile of H3.3/H2A.Z (Double) was further normalized by total island-filtered tags in the Double library.
Ernst et al. (2011) Nature 473, 43-49
Profiles for nine chromatin marks (greyscale) are shown across the WLS gene in four cell types, and summarized in a single chromatin state annotation track for each (coloured according to b). WLS is poised in ESCs, repressed in GM12878 and transcribed in HUVEC and NHLF. Its TSS switches accordingly between poised (purple), repressed (grey) and active (red) promoter states; enhancer regions within the gene body become activated (orange, yellow); and its gene body changes from low signal (white) to transcribed (green).
11/27/13
14
Ernst et al. (2011) Nature 473, 43-49
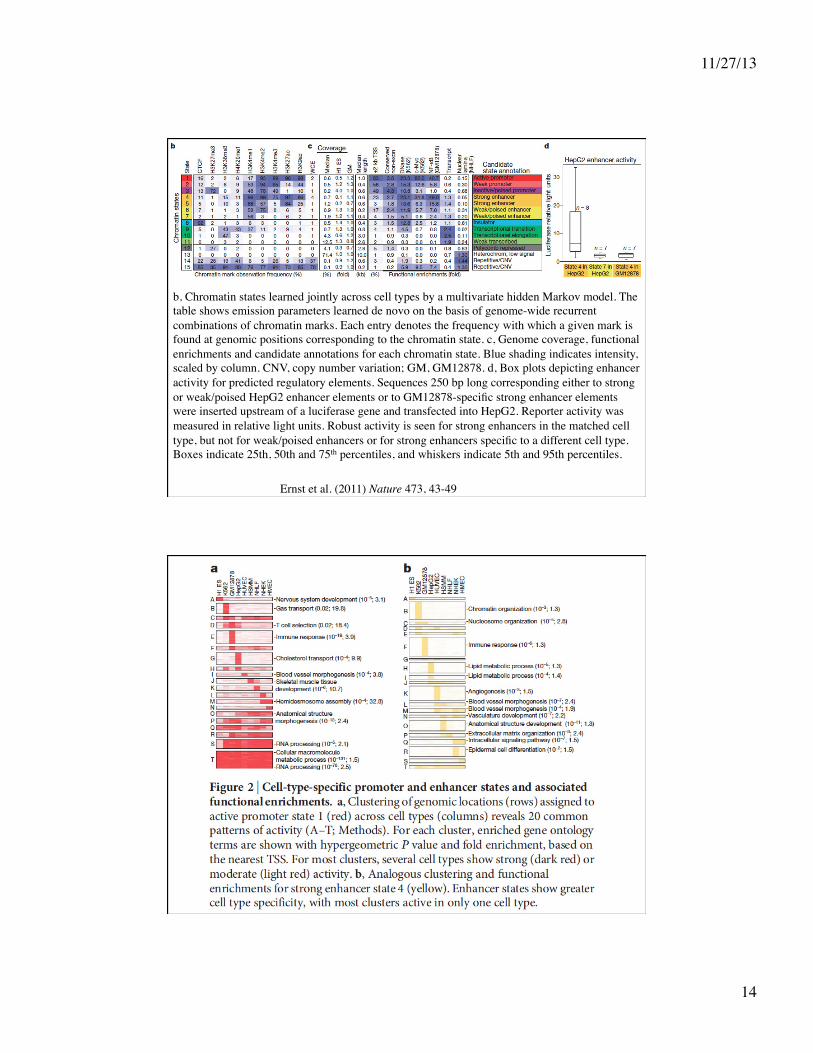
b, Chromatin states learned jointly across cell types by a multivariate hidden Markov model. The table shows emission parameters learned de novo on the basis of genome-wide recurrent combinations of chromatin marks. Each entry denotes the frequency with which a given mark is found at genomic positions corresponding to the chromatin state. c, Genome coverage, functional enrichments and candidate annotations for each chromatin state. Blue shading indicates intensity, scaled by column. CNV, copy number variation; GM, GM12878. d, Box plots depicting enhancer activity for predicted regulatory elements. Sequences 250 bp long corresponding either to strong or weak/poised HepG2 enhancer elements or to GM12878-specific strong enhancer elements were inserted upstream of a luciferase gene and transfected into HepG2. Reporter activity was measured in relative light units. Robust activity is seen for strong enhancers in the matched cell type, but not for weak/poised enhancers or for strong enhancers specific to a different cell type. Boxes indicate 25th, 50th and 75th percentiles, and whiskers indicate 5th and 95th percentiles.

11/27/13
15

11/27/13
16
Disease-related SNPs occur within enhancers (as defined by chromatin marks)
that are activated in relevant cell types

11/27/13
17
Discussion Topics • Discuss the roles of H3K4, H3K9, and H3K27 modifications in the
regulation of transcription (both positive and negative regulation).
• How (and why) does the expression of the standard histone genes (H1, H2A, H2B, H3, H4), as compared to H2 and H3 variants such as H2A.Z and H3.3, correlate with the cell cycle? With gene activation?
• Discuss the difference in chromatin marks between specific portions of genes such as promoters, enhancers, insulators, transcription start sites, and transcription termination sites.
• How did Ernst et al. use chromatin structure to identify enhancers vs. promoters? How did they link particular enhancers to particular genes? To particular transcription factors? How did they test these hypotheses? Identify relevant SNPs?


![SDG8-Mediated Histone Methylation and RNA Processing ... · SDG8-Mediated Histone Methylation and RNA Processing Function in the Response to Nitrate Signaling1[OPEN] Ying Li,a,b,c,2](https://img.pdfslide.us/doc/110x75/5f0254e17e708231d403beb6/sdg8-mediated-histone-methylation-and-rna-processing-sdg8-mediated-histone-methylation.jpg)