Embed Size (px)
Citation preview
BIOS Performance and Power Tuning
Guidelines for Dell PowerEdge 12th
Generation Servers
Configuring the server BIOS for optimal performance and power efficiency
John Beckett
Solutions Performance Analysis
Enterprise Solutions Group

BIOS Performance and Power Tuning Guidelines for Dell PowerEdge 12th Generation Servers
ii
This document is for informational purposes only and may contain typographical errors and
technical inaccuracies. The content is provided as is, without express or implied warranties of any
kind.
© 2012 Dell Inc. All rights reserved. Dell and its affiliates cannot be responsible for errors or omissions
in typography or photography. Dell, the Dell logo, and PowerEdge are trademarks of Dell Inc. Intel and
Xeon are registered trademarks of Intel Corporation in the U.S. and other countries. Microsoft, Hyper-
V, Windows, and Windows Server are either trademarks or registered trademarks of Microsoft
Corporation in the United States and/or other countries. Novell and SUSE are registered trademarks of
Novell, Inc. in the United States and other countries. Other trademarks and trade names may be used
in this document to refer to either the entities claiming the marks and names or their products. Dell
disclaims proprietary interest in the marks and names of others.
December 2012 | Version 1.0

BIOS Performance and Power Tuning Guidelines for Dell PowerEdge 12th Generation Servers
iii
Contents
Executive summary ............................................................................................................................................... 5
Introduction ........................................................................................................................................................... 5
BIOS features overview ........................................................................................................................................ 5
Test methodology ................................................................................................................................................. 6
Power collection methodology ....................................................................................................................... 7
BIOS Memory Settings section ............................................................................................................................ 7
Memory settings ................................................................................................................................................ 9
Memory operating mode ............................................................................................................................... 10
Performance impacts of Advanced ECC and Optimizer Mode ...............................................................13
Node Interleave ............................................................................................................................................... 14
BIOS Processor Settings section ...................................................................................................................... 16
Logical Processor ............................................................................................................................................ 16
QPI Speed ......................................................................................................................................................... 18
Alternate RTID setting..................................................................................................................................... 19
Virtualization technology ................................................................................................................................... 19
Processor prefetchers .................................................................................................................................... 19
Execute disable ................................................................................................................................................ 19
Number of cores per processor ................................................................................................................... 19
Logical processor idling ................................................................................................................................. 20
BIOS System Profile Settings section ............................................................................................................... 20
System Profiles comparison ...........................................................................................................................21
Performance and power comparisons of System Profiles ...................................................................... 22
Turbo Boost...................................................................................................................................................... 28
C-States and C1E options ...............................................................................................................................31
Monitor/Mwait ................................................................................................................................................. 32
Collaborative CPU Performance Control ................................................................................................... 33
Memory Management section .......................................................................................................................... 33
Memory frequency .......................................................................................................................................... 34
Memory operating voltage ............................................................................................................................ 34
Conclusion ........................................................................................................................................................... 34
References ............................................................................................................................................................ 36
BIOS Performance and Power Tuning Guidelines for Dell PowerEdge 12th Generation Servers
iv
Tables
Table 1. System performance profiles ...........................................................................................................21
Table 2. Recommended BIOS settings for Dell PowerEdge 12th
generation servers ........................... 35
Figures
Figure 1. System Setup screen ........................................................................................................................... 8
Figure 2. System BIOS Settings screen ............................................................................................................ 9
Figure 3. Memory Settings screen................................................................................................................... 10
Figure 4. Memory Mode performance ............................................................................................................ 11
Figure 5. Memory operating modes performance ........................................................................................12
Figure 6. Comparison of memory mode effects ...........................................................................................13
Figure 7. Memory latency impacts of memory modes ............................................................................... 14
Figure 8. Node interleave disabled vs. enabled ............................................................................................. 15
Figure 9. System BIOS Settings – Processor Settings screen .................................................................... 16
Figure 10. Logical Processor performance on integer workloads ............................................................... 17
Figure 11. Logical processor performance on floating-point workloads .................................................. 18
Figure 12. System BIOS Settings – System Profiles Settings screen ........................................................... 20
Figure 13. SPECpower_ssJ2008 comparison ................................................................................................. 23
Figure 14. Performance and power comparison — 400.perlbench(peak) ................................................ 24
Figure 15. Performance and power comparison — 471.omnetpp(base) ................................................... 25
Figure 16. Performance and power comparison — 410.bwaves(base) ...................................................... 26
Figure 17. Additional Options Exposed by the Custom System Profile ..................................................... 27
Figure 18. Performance and power results — 471.omnetpp(base) ............................................................. 28
Figure 19. Performance and power results — 473.astar(base) ..................................................................... 29
Figure 20. Performance and power results — 445.gomk(base)................................................................... 30
Figure 21. Windows system profile comparison .............................................................................................31
Figure 22. Linux system profile comparison.................................................................................................... 32
Figure 23. System BIOS Settings options ......................................................................................................... 33

BIOS Performance and Power Tuning Guidelines for Dell PowerEdge 12th Generation Servers
5
Executive summary Dell™ PowerEdge™ 12
th generation servers offer many BIOS-level options in System Setup that can
affect the performance of various workload types and drive significant impacts for power efficiency.
Due to the expanded array of features from the Intel®
Xeon®
processor E5 family and Dell’s enhanced
platform offerings, navigating the System Setup screens can be a challenging task without
understanding more about how various options can improve performance for some workloads;
especially when performance and power efficiency trade-offs must be considered.
An understanding of specific BIOS options is crucial for tuning the server. This white paper measures
the impact of many of these variables from a performance and power efficiency standpoint to provide
general performance and power efficiency tuning guidelines. To help explain these guidelines and
recommendations, this white paper lists various comparisons made between BIOS options affecting
the memory subsystem, processor features, and System Profile.
Introduction Dell PowerEdge 12
th generation servers include the Intel Xeon processor E5-2400, E5-2600, and E5-
4600 product families. These processor types bring up to eight cores per socket, faster memory
subsystems up to 1600MT/s, up to four memory channels per socket, and PCI Express®
3.0 expansion
slots. In addition, the inter-processor communication path known as Intel QuickPath Interconnect
(QPI) now supports up to 8.0GT/s transfer speed.
This white paper focuses on the impact of BIOS options on a variety of general server workloads based
in large part on standard industry server benchmarks. In addition, the various System Profile options
available to the customer are compared from a performance and power standpoint. All testing was
done on with the Intel Xeon processor E5-2600 product family, but most BIOS effects should be
similar across 12th
generation PowerEdge servers. The tuning guidelines in this white paper are aimed
primarily at general enterprise customers, and are not applicable to specialized workloads such High
Performance Computing (HPC) clusters.
BIOS features overview This white paper focuses on three primary sections of the BIOS setup: Memory, Processor, and System
Profile. Although other BIOS sections exist, these three are the primary focus areas for performance
tuning, so this white paper covers these areas in-depth. Most of these BIOS options are common
across 12th
generation PowerEdge server platforms.
The Memory section of the BIOS Setup provides configuration options that affect the Memory Subsystem. Many of these options have a direct impact on performance or RAS features, so the key areas are covered. Elements such as Memory Mode and Node Interleaving are discussed in significant detail. See Memory Performance Guidelines for Dell PowerEdge 12th Generation Servers for a much more in-depth look at memory options and configuration guidance. The Processor Settings Screen includes configuration options to manipulate various CPU-specific
features, some of which require specific OS support to function correctly. Here, settings such as
Logical Processor, Virtualization Technology, processor prefetchers, QPI Speed, and Number of Cores
per Processor reside, which are explored below.
BIOS Performance and Power Tuning Guidelines for Dell PowerEdge 12th Generation Servers
6
The System Profile Settings section is the last critical area for performance tuning focus. Here, the
overall System Profile can be selected, which in turn governs the settings of many sub-options. These
sub-options can have a great impact on overall system performance and power efficiency; so along
with exploring overall System Profile choices, the impact of manipulating these sub-options are
explored, which are only exposed when the Custom Power Profile is selected.
It is important to note that at the time of writing, the state of these sub-options depends on the last
System Profile that was used, and that there is no true default for options such as Turbo Mode, C-
States, C1E, Memory Frequency, and others found in this section.
Test methodology Memory bandwidth was measured using a version of the common STREAM benchmark, developed by
John McAlpin of the University of Virginia. The version used for this test was compiled with OpenMP
(parallel) support and optimized for the new generation of Intel Xeon processors. When testing overall
system memory bandwidth, optimal results are achieved by running the STREAM benchmark with one
thread per physical core. Although STREAM uses four separate vector kernels during the course of
measurement (Add, Scale, Copy, and Triad), the Triad value is used for the purposes of this white
paper. STREAM results are returned in values of MB/sec.
Latency measurements were taken using the lat_mem_rd subtest, part of the LMBENCH benchmark.
Lat_mem_rd measures memory read latency for varying memory sizes and strides. The results are
reported in nanoseconds per load. The entire memory hierarchy is measured, including onboard
cache latency and size, external cache latency and size, and main memory latency. For the purposes
of this white paper, the focus is main memory latency. Both local and remote NUMA node main
memory latency are explored with lat_mem_rd, localizing the process and forcing memory access to
local or remote using the numactl tool in Linux. The last 20 lines of output from main memory
measurements of lat_mem_rd are averaged, and each test is executed for three iterations. The median
average result for each test type was selected to report latency results for this white paper.
In addition, the concept of “loaded latency” is explored for some configurations. This is intended to
represent average memory latencies when the NUMA node is already under heavy load. The workload
chosen to provide the heavy memory load is STREAM, and n-1 real cores on a single socket were used
with separate single threaded STREAM processes to load the local NUMA node targeted for latency
experiments. The single free core on the physical processor under test was tasked to run the latency
measurement, measuring memory latency to the local NUMA node. As with other latency
measurements, the last 20 lines of output were averaged to produce the final loaded latency value.
Each loaded latency test was run three times, and the median loaded latency average was used for the
official result.
SPECrate metrics from SPEC CPU2006 (hereafter referred to as SPECint_rate_base2006 and
SPECfp_rate_base2006) were also chosen for performance characterization, as they are the leading
industry standard CPU-centric benchmarks that use all available processor cores and threads. Each
benchmark is comprised of multiple sub-benchmarks, each tailored to model different common
computing tasks or scientific workloads, broken out into either integer or floating point. Both int_rate
and fp_rate are throughput-based benchmarks. The “base” portion of the benchmark name indicates
that a standardized set of compiler options were used to create the benchmark binaries. The
SPECfp_rate_base2006 benchmark in particular can be used as a proxy for scientific workloads, and
BIOS Performance and Power Tuning Guidelines for Dell PowerEdge 12th Generation Servers
7
tends to be more sensitive to memory frequency and bandwidth differences than
SPECint_rate_base2006. All CPU2006 measurements were conducted with the Novell®
SUSE®
Linux
Enterprise Server (SLES) 11 SP2 operating system.
SPECjbb2005 evaluates the performance of server side Java by emulating a three-tier client/server
system (with emphasis on the middle tier). The benchmark exercises the implementations of the JVM
(Java Virtual Machine), JIT (Just-In-Time) compiler, garbage collection, threads and some aspects of
the operating system. All logical processors on the system are exercised, and although considerable
memory is allocated for the benchmark in the form of Java heap, this benchmark is generally less
sensitive to memory frequency and bandwidth differences. SPECjbb2005 was run on the Microsoft®
Windows Server®
2008 Enterprise Edition R2 SP1 operating system.
SPECpower_ssj2008 is the first industry standard performance-per-watt benchmark. Like
SPECjbb2005, it is a Java-based benchmark with some workload similarities to JBB2005. However,
the workload is run in different load levels, from 100% down to “active idle” in 10% increments. Active
Idle is defined as a state where the system is ready to perform work, but there are no work requests.
Performance and power data is collected for each workload interval using a separate benchmark
controller system, an accepted power analyzer, and a temperature monitor. The controller system
logs all power and temperature data, and communicates with the System under Test (SUT) to control
workload levels and pull result files at the end of the benchmark run. SPECpower_ssj2008 was run on
the Microsoft Windows Server 2008 Enterprise x64 Edition R2 SP1 operating system.
Power collection methodology
Power measurements were taken with a Yokogawa model WT210 Power Analyzer and power data was
logged for all configurations tested for power consumption. The Yokogawa WT210 analyzer is the
most popular power analyzer type at the time that this white paper was written that was used for the
first industry standard Server Power/Performance Benchmark, SPECpower_ssj2008. The logged power
data was averaged for the particular workloads that were characterized for power. Comparisons that
used the SPECpower_ssj2008 benchmark required no manual intervention for power data analysis, as
this benchmark integrates power collection at each load level.
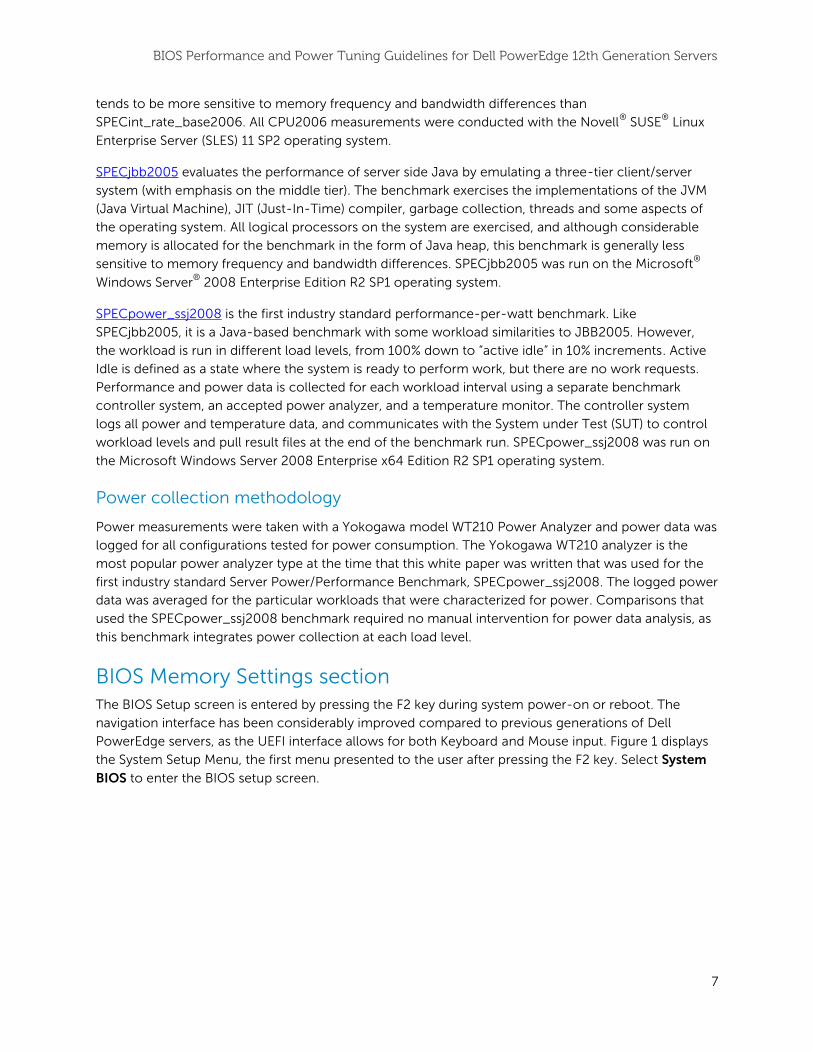
BIOS Memory Settings section The BIOS Setup screen is entered by pressing the F2 key during system power-on or reboot. The
navigation interface has been considerably improved compared to previous generations of Dell
PowerEdge servers, as the UEFI interface allows for both Keyboard and Mouse input. Figure 1 displays
the System Setup Menu, the first menu presented to the user after pressing the F2 key. Select System
BIOS to enter the BIOS setup screen.
BIOS Performance and Power Tuning Guidelines for Dell PowerEdge 12th Generation Servers
8
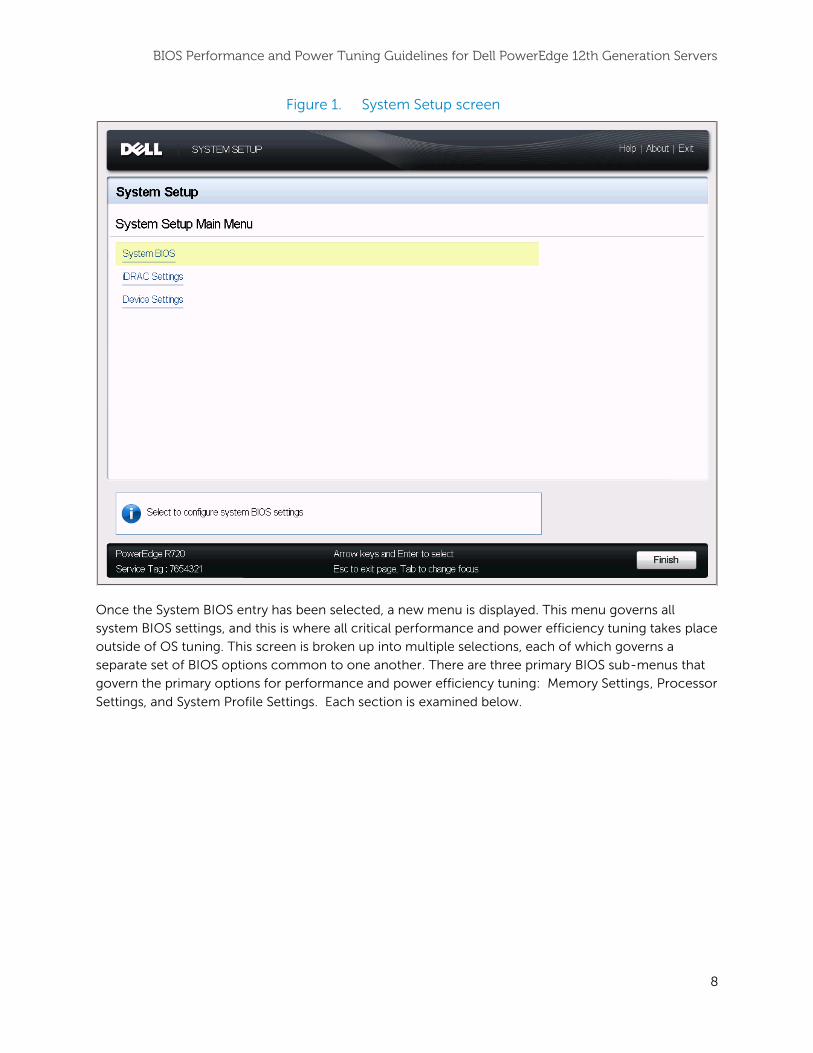
Figure 1. System Setup screen
Once the System BIOS entry has been selected, a new menu is displayed. This menu governs all
system BIOS settings, and this is where all critical performance and power efficiency tuning takes place
outside of OS tuning. This screen is broken up into multiple selections, each of which governs a
separate set of BIOS options common to one another. There are three primary BIOS sub-menus that
govern the primary options for performance and power efficiency tuning: Memory Settings, Processor
Settings, and System Profile Settings. Each section is examined below.
BIOS Performance and Power Tuning Guidelines for Dell PowerEdge 12th Generation Servers
9
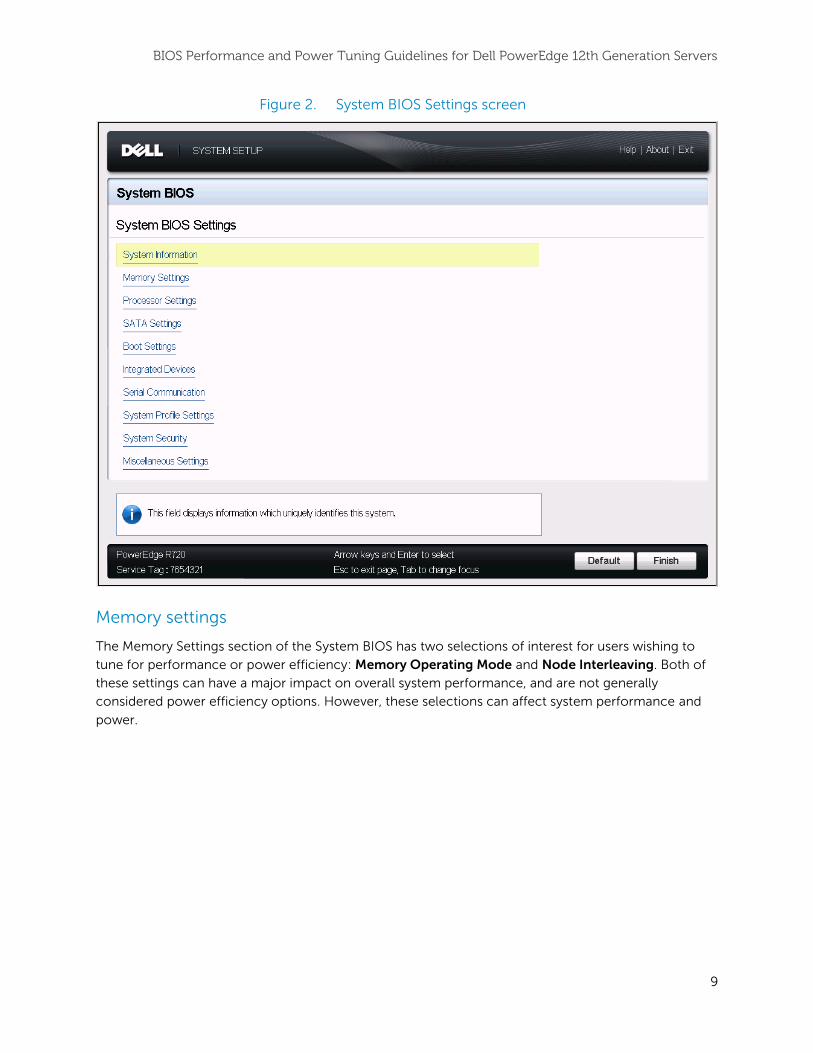
Figure 2. System BIOS Settings screen
Memory settings
The Memory Settings section of the System BIOS has two selections of interest for users wishing to
tune for performance or power efficiency: Memory Operating Mode and Node Interleaving. Both of
these settings can have a major impact on overall system performance, and are not generally
considered power efficiency options. However, these selections can affect system performance and
power.
BIOS Performance and Power Tuning Guidelines for Dell PowerEdge 12th Generation Servers
10
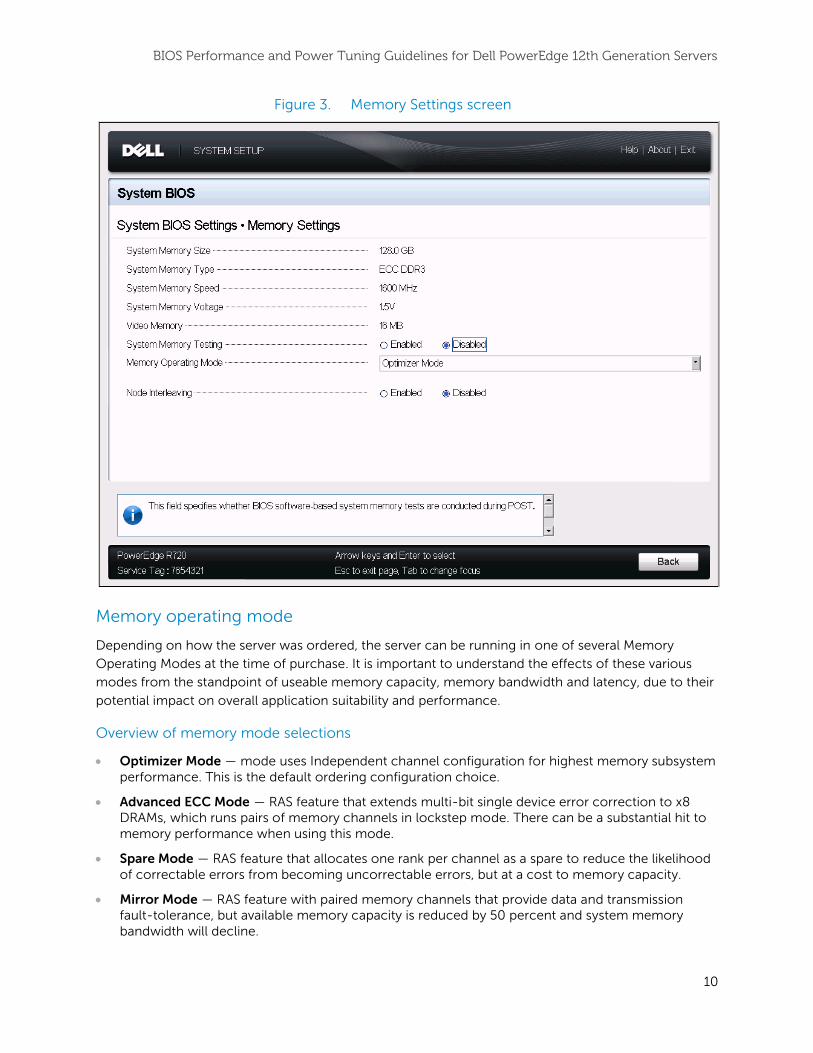
Figure 3. Memory Settings screen
Memory operating mode
Depending on how the server was ordered, the server can be running in one of several Memory
Operating Modes at the time of purchase. It is important to understand the effects of these various
modes from the standpoint of useable memory capacity, memory bandwidth and latency, due to their
potential impact on overall application suitability and performance.
Overview of memory mode selections
Optimizer Mode — mode uses Independent channel configuration for highest memory subsystem performance. This is the default ordering configuration choice.
Advanced ECC Mode — RAS feature that extends multi-bit single device error correction to x8 DRAMs, which runs pairs of memory channels in lockstep mode. There can be a substantial hit to memory performance when using this mode.
Spare Mode — RAS feature that allocates one rank per channel as a spare to reduce the likelihood of correctable errors from becoming uncorrectable errors, but at a cost to memory capacity.
Mirror Mode — RAS feature with paired memory channels that provide data and transmission fault-tolerance, but available memory capacity is reduced by 50 percent and system memory bandwidth will decline.
BIOS Performance and Power Tuning Guidelines for Dell PowerEdge 12th Generation Servers
11
Spare with Advanced ECC Mode — RAS feature that extends multi-bit single device error correction to x8 DRAMs, which runs pairs of memory channels in lockstep mode, where one memory rank per channel is used as a spare to reduce the likelihood of uncorrectable errors. There can be a substantial impact to memory performance when using this mode, and a cost to memory capacity.
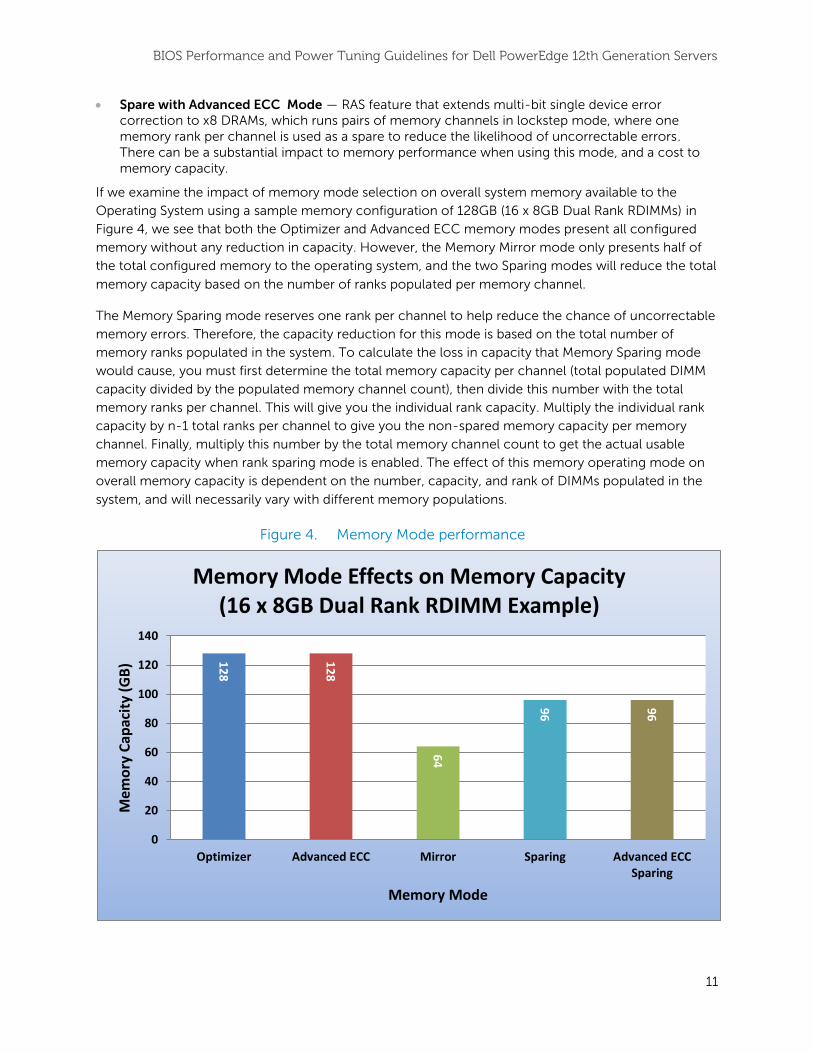
If we examine the impact of memory mode selection on overall system memory available to the
Operating System using a sample memory configuration of 128GB (16 x 8GB Dual Rank RDIMMs) in
Figure 4, we see that both the Optimizer and Advanced ECC memory modes present all configured
memory without any reduction in capacity. However, the Memory Mirror mode only presents half of
the total configured memory to the operating system, and the two Sparing modes will reduce the total
memory capacity based on the number of ranks populated per memory channel.
The Memory Sparing mode reserves one rank per channel to help reduce the chance of uncorrectable
memory errors. Therefore, the capacity reduction for this mode is based on the total number of
memory ranks populated in the system. To calculate the loss in capacity that Memory Sparing mode
would cause, you must first determine the total memory capacity per channel (total populated DIMM
capacity divided by the populated memory channel count), then divide this number with the total
memory ranks per channel. This will give you the individual rank capacity. Multiply the individual rank
capacity by n-1 total ranks per channel to give you the non-spared memory capacity per memory
channel. Finally, multiply this number by the total memory channel count to get the actual usable
memory capacity when rank sparing mode is enabled. The effect of this memory operating mode on
overall memory capacity is dependent on the number, capacity, and rank of DIMMs populated in the
system, and will necessarily vary with different memory populations.
Figure 4. Memory Mode performance
12
8
12
8
64
96
96
0
20
40
60
80
100
120
140
Optimizer Advanced ECC Mirror Sparing Advanced ECCSparing
Mem
ory
Cap
acit
y (G
B)
Memory Mode
Memory Mode Effects on Memory Capacity (16 x 8GB Dual Rank RDIMM Example)
BIOS Performance and Power Tuning Guidelines for Dell PowerEdge 12th Generation Servers
12
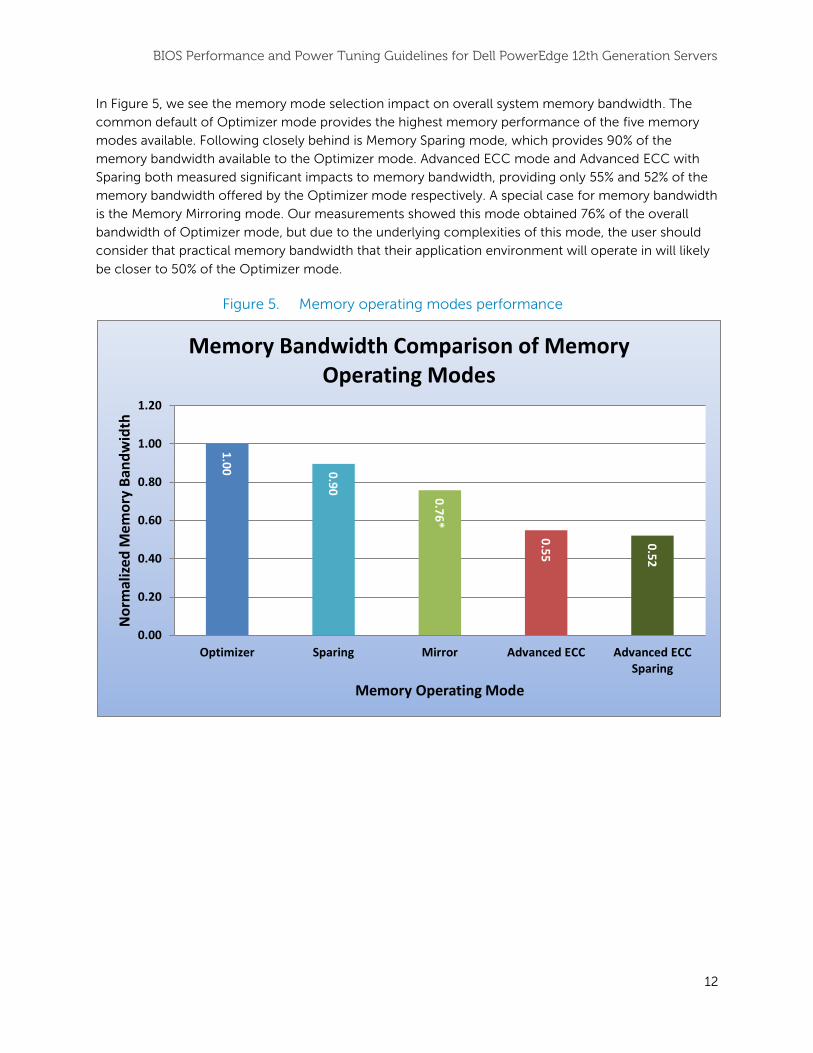
In Figure 5, we see the memory mode selection impact on overall system memory bandwidth. The
common default of Optimizer mode provides the highest memory performance of the five memory
modes available. Following closely behind is Memory Sparing mode, which provides 90% of the
memory bandwidth available to the Optimizer mode. Advanced ECC mode and Advanced ECC with
Sparing both measured significant impacts to memory bandwidth, providing only 55% and 52% of the
memory bandwidth offered by the Optimizer mode respectively. A special case for memory bandwidth
is the Memory Mirroring mode. Our measurements showed this mode obtained 76% of the overall
bandwidth of Optimizer mode, but due to the underlying complexities of this mode, the user should
consider that practical memory bandwidth that their application environment will operate in will likely
be closer to 50% of the Optimizer mode.
Figure 5. Memory operating modes performance
1.0
0 0.9
0 0
.76
*
0.5
5
0.5
2
0.00
0.20
0.40
0.60
0.80
1.00
1.20
Optimizer Sparing Mirror Advanced ECC Advanced ECCSparing
No
rmal
ized
Mem
ory
Ban
dw
idth
Memory Operating Mode
Memory Bandwidth Comparison of Memory Operating Modes
BIOS Performance and Power Tuning Guidelines for Dell PowerEdge 12th Generation Servers
13
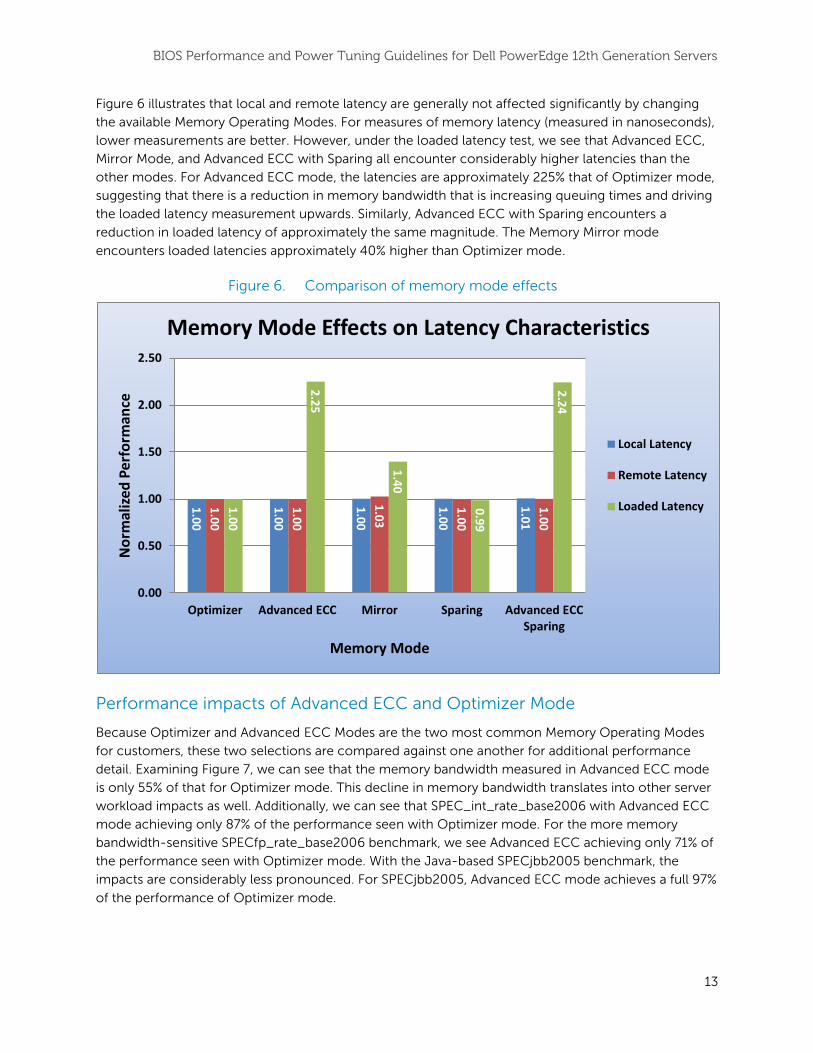
Figure 6 illustrates that local and remote latency are generally not affected significantly by changing
the available Memory Operating Modes. For measures of memory latency (measured in nanoseconds),
lower measurements are better. However, under the loaded latency test, we see that Advanced ECC,
Mirror Mode, and Advanced ECC with Sparing all encounter considerably higher latencies than the
other modes. For Advanced ECC mode, the latencies are approximately 225% that of Optimizer mode,
suggesting that there is a reduction in memory bandwidth that is increasing queuing times and driving
the loaded latency measurement upwards. Similarly, Advanced ECC with Sparing encounters a
reduction in loaded latency of approximately the same magnitude. The Memory Mirror mode
encounters loaded latencies approximately 40% higher than Optimizer mode.
Figure 6. Comparison of memory mode effects
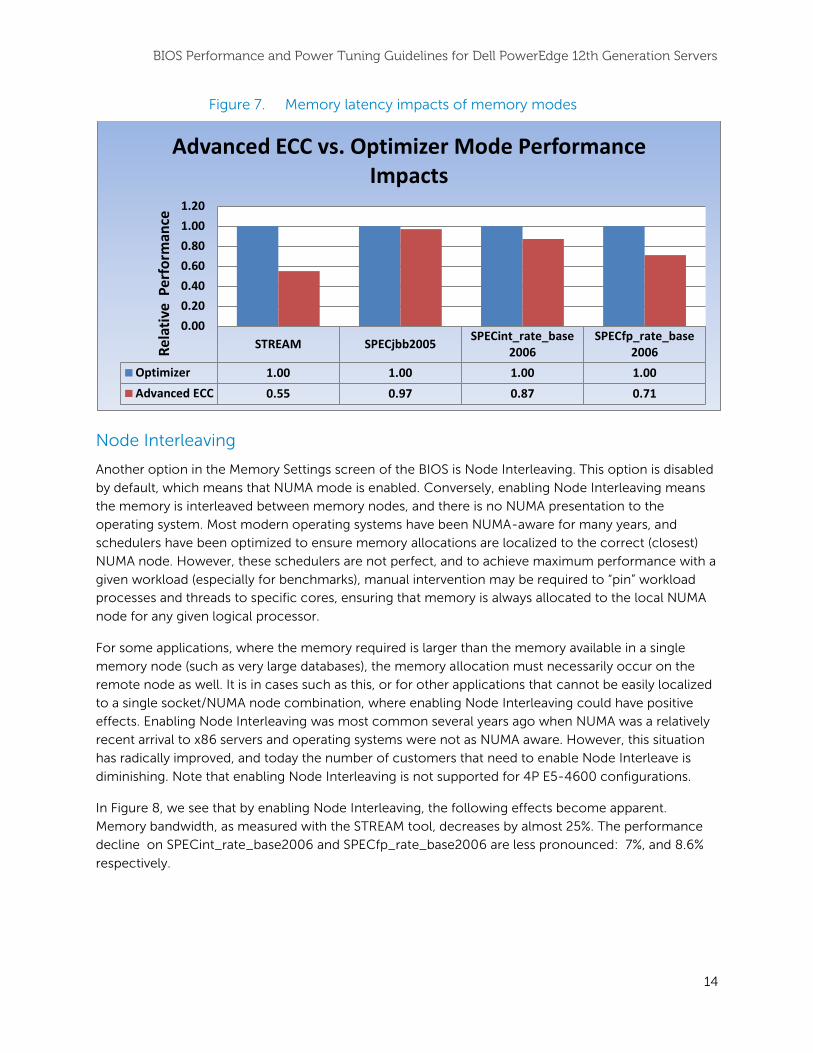
Performance impacts of Advanced ECC and Optimizer Mode
Because Optimizer and Advanced ECC Modes are the two most common Memory Operating Modes
for customers, these two selections are compared against one another for additional performance
detail. Examining Figure 7, we can see that the memory bandwidth measured in Advanced ECC mode
is only 55% of that for Optimizer mode. This decline in memory bandwidth translates into other server
workload impacts as well. Additionally, we can see that SPEC_int_rate_base2006 with Advanced ECC
mode achieving only 87% of the performance seen with Optimizer mode. For the more memory
bandwidth-sensitive SPECfp_rate_base2006 benchmark, we see Advanced ECC achieving only 71% of
the performance seen with Optimizer mode. With the Java-based SPECjbb2005 benchmark, the
impacts are considerably less pronounced. For SPECjbb2005, Advanced ECC mode achieves a full 97%
of the performance of Optimizer mode.
1.0
0
1.0
0
1.0
0
1.0
0
1.0
1
1.0
0
1.0
0
1.0
3
1.0
0
1.0
0
1.0
0
2.2
5
1.4
0
0.9
9
2.2
4
0.00
0.50
1.00
1.50
2.00
2.50
Optimizer Advanced ECC Mirror Sparing Advanced ECCSparing
No
rmal
ized
Per
form
ance
Memory Mode
Memory Mode Effects on Latency Characteristics
Local Latency
Remote Latency
Loaded Latency
BIOS Performance and Power Tuning Guidelines for Dell PowerEdge 12th Generation Servers
14
Figure 7. Memory latency impacts of memory modes
Node Interleaving
Another option in the Memory Settings screen of the BIOS is Node Interleaving. This option is disabled
by default, which means that NUMA mode is enabled. Conversely, enabling Node Interleaving means
the memory is interleaved between memory nodes, and there is no NUMA presentation to the
operating system. Most modern operating systems have been NUMA-aware for many years, and
schedulers have been optimized to ensure memory allocations are localized to the correct (closest)
NUMA node. However, these schedulers are not perfect, and to achieve maximum performance with a
given workload (especially for benchmarks), manual intervention may be required to “pin” workload
processes and threads to specific cores, ensuring that memory is always allocated to the local NUMA
node for any given logical processor.
For some applications, where the memory required is larger than the memory available in a single
memory node (such as very large databases), the memory allocation must necessarily occur on the
remote node as well. It is in cases such as this, or for other applications that cannot be easily localized
to a single socket/NUMA node combination, where enabling Node Interleaving could have positive
effects. Enabling Node Interleaving was most common several years ago when NUMA was a relatively
recent arrival to x86 servers and operating systems were not as NUMA aware. However, this situation
has radically improved, and today the number of customers that need to enable Node Interleave is
diminishing. Note that enabling Node Interleaving is not supported for 4P E5-4600 configurations.
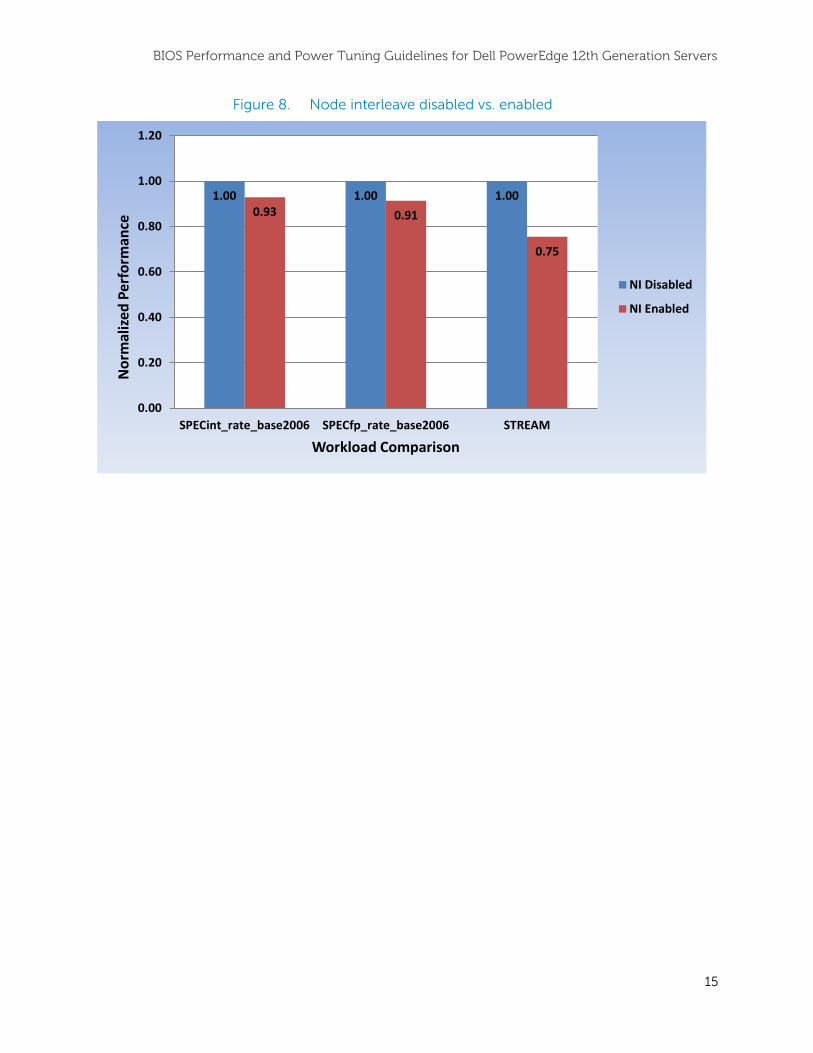
In Figure 8, we see that by enabling Node Interleaving, the following effects become apparent.
Memory bandwidth, as measured with the STREAM tool, decreases by almost 25%. The performance
decline on SPECint_rate_base2006 and SPECfp_rate_base2006 are less pronounced: 7%, and 8.6%
respectively.
STREAM SPECjbb2005SPECint_rate_base
2006SPECfp_rate_base
2006
Optimizer 1.00 1.00 1.00 1.00
Advanced ECC 0.55 0.97 0.87 0.71
0.00
0.20
0.40
0.60
0.80
1.00
1.20
Rel
ativ
e P
erfo
rman
ce
Advanced ECC vs. Optimizer Mode Performance Impacts
BIOS Performance and Power Tuning Guidelines for Dell PowerEdge 12th Generation Servers
15
Figure 8. Node interleave disabled vs. enabled
1.00 1.00 1.00 0.93 0.91
0.75
0.00
0.20
0.40
0.60
0.80
1.00
1.20
SPECint_rate_base2006 SPECfp_rate_base2006 STREAM
No
rmal
ized
Per
form
ance
Workload Comparison
NI Disabled
NI Enabled
BIOS Performance and Power Tuning Guidelines for Dell PowerEdge 12th Generation Servers
16
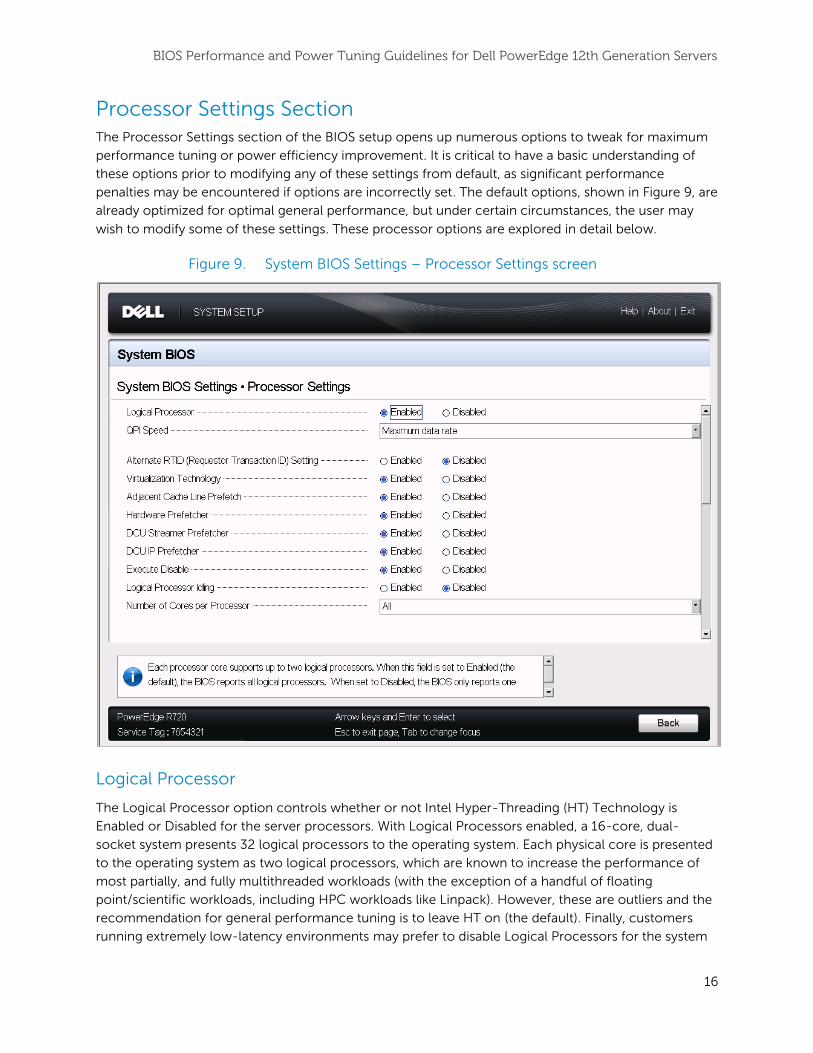
Processor Settings Section The Processor Settings section of the BIOS setup opens up numerous options to tweak for maximum
performance tuning or power efficiency improvement. It is critical to have a basic understanding of
these options prior to modifying any of these settings from default, as significant performance
penalties may be encountered if options are incorrectly set. The default options, shown in Figure 9, are
already optimized for optimal general performance, but under certain circumstances, the user may
wish to modify some of these settings. These processor options are explored in detail below.
Figure 9. System BIOS Settings – Processor Settings screen
Logical Processor
The Logical Processor option controls whether or not Intel Hyper-Threading (HT) Technology is
Enabled or Disabled for the server processors. With Logical Processors enabled, a 16-core, dual-
socket system presents 32 logical processors to the operating system. Each physical core is presented
to the operating system as two logical processors, which are known to increase the performance of
most partially, and fully multithreaded workloads (with the exception of a handful of floating
point/scientific workloads, including HPC workloads like Linpack). However, these are outliers and the
recommendation for general performance tuning is to leave HT on (the default). Finally, customers
running extremely low-latency environments may prefer to disable Logical Processors for the system
BIOS Performance and Power Tuning Guidelines for Dell PowerEdge 12th Generation Servers
17
latency improvement offered, but again this is a special case and is not recommended for most
computing environments.
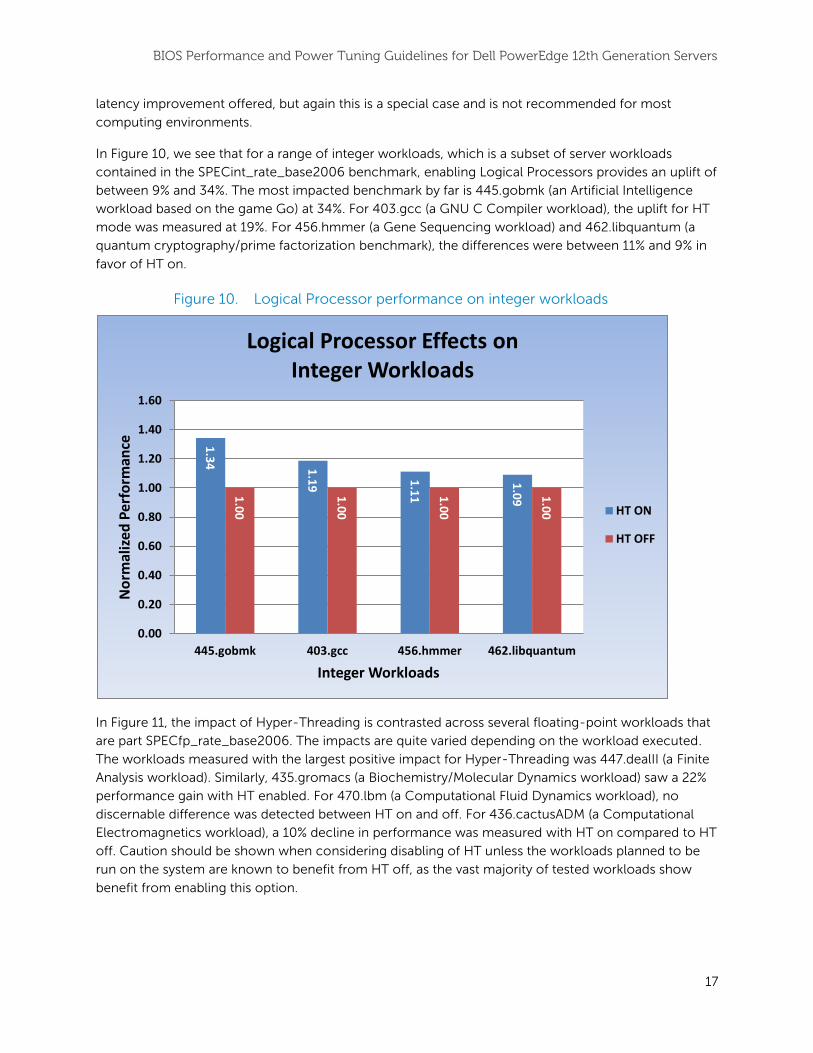
In Figure 10, we see that for a range of integer workloads, which is a subset of server workloads
contained in the SPECint_rate_base2006 benchmark, enabling Logical Processors provides an uplift of
between 9% and 34%. The most impacted benchmark by far is 445.gobmk (an Artificial Intelligence
workload based on the game Go) at 34%. For 403.gcc (a GNU C Compiler workload), the uplift for HT
mode was measured at 19%. For 456.hmmer (a Gene Sequencing workload) and 462.libquantum (a
quantum cryptography/prime factorization benchmark), the differences were between 11% and 9% in
favor of HT on.
Figure 10. Logical Processor performance on integer workloads
In Figure 11, the impact of Hyper-Threading is contrasted across several floating-point workloads that
are part SPECfp_rate_base2006. The impacts are quite varied depending on the workload executed.
The workloads measured with the largest positive impact for Hyper-Threading was 447.dealII (a Finite
Analysis workload). Similarly, 435.gromacs (a Biochemistry/Molecular Dynamics workload) saw a 22%
performance gain with HT enabled. For 470.lbm (a Computational Fluid Dynamics workload), no
discernable difference was detected between HT on and off. For 436.cactusADM (a Computational
Electromagnetics workload), a 10% decline in performance was measured with HT on compared to HT
off. Caution should be shown when considering disabling of HT unless the workloads planned to be
run on the system are known to benefit from HT off, as the vast majority of tested workloads show
benefit from enabling this option.
1.3
4 1.1
9
1.1
1
1.0
9
1.0
0
1.0
0
1.0
0
1.0
0
0.00
0.20
0.40
0.60
0.80
1.00
1.20
1.40
1.60
445.gobmk 403.gcc 456.hmmer 462.libquantum
No
rmal
ized
Per
form
ance
Integer Workloads
Logical Processor Effects on Integer Workloads
HT ON
HT OFF

BIOS Performance and Power Tuning Guidelines for Dell PowerEdge 12th Generation Servers
18
Figure 11. Logical processor performance on floating-point workloads
QPI Speed
The Intel QuickPath Interconnect (QPI) Speed option in the Processor section governs the frequency
of the QPI links between the populated processors. Depending on the platform and processor type,
the number of QPI links can differ between systems, but the maximum link frequency across all E5-
2400, E5-2600, and E5-4600 processors tops out at 8.0 GT/sec, depending on the processor. The
user should be aware that standard and basic bin Intel processors of this architecture support slower
QPI link speeds than the advanced parts provide.
There can be up to four available selections for this BIOS option. Maximum Data Rate is the default,
which indicates that the BIOS will run the QPI links at the maximum frequency supported by the
processor. For processors that support a maximum of 8.0 GT/sec, three other options are presented:
8.0 GT/s, 7.2 GT/s, and 6.4 GT/s.
For best performance, the QPI link speed should be left at the maximized setting, for any reduction in
QPI speed will affect the performance of non-local memory accesses and cache coherency traffic. In
addition, access to non-local I/O devices from a particular core can be slowed by the reduction of QPI
link speed. However, in some cases it may be advisable to reduce QPI speed where power
considerations outweigh the performance cost. For users considering reducing the QPI link speeds,
memory and I/O accesses should be localized to the nearest NUMA node to minimize the
performance impact.
1.3
0
1.2
2
1.0
0
0.9
0
1.0
0
1.0
0
1.0
0
1.0
0
0.00
0.20
0.40
0.60
0.80
1.00
1.20
1.40
447.dealII 435.gromacs 470.lbm 436.cactusADM
No
rmal
ized
Per
form
ance
Floating-Point Workloads
Logical Processor Effects on Floating-Point Workloads
HT ON
HT OFF
BIOS Performance and Power Tuning Guidelines for Dell PowerEdge 12th Generation Servers
19
Alternate RTID setting
This setting manipulates Requestor Transaction IDs, which are QPI resources. This option is disabled
by default, and generally should be left at this setting, as no workloads have been identified as
benefitting from the manipulation of this option.
NOTE: Enabling this option almost always results in negative impacts to overall system performance,
and that few similarities exist between this option previous-generation architectures.
Virtualization technology When this option is enabled, the BIOS will enable processor Virtualization features and provide the
virtualization support to the OS through the DMAR table. In general, only virtualized environments
such as VMware®
ESX™, Microsoft Hyper-V®
, Red Hat®
KVM, and other virtualized operating systems
will take advantage of these features. Disabling this feature is not known to significantly alter the
performance or power characteristics of the system, so leaving this option Enabled is advised for most
cases.
Processor prefetchers
All 12th
generation Dell PowerEdge systems have several processor prefetching options available under
the Processor Settings section of the BIOS setup. The default settings for these options is Enabled.
Generally, Dell does not recommend disabling them, as in most cases they are a net performance
enhancement. However, for very random, memory-intensive workloads, the user can try disabling
these settings to evaluate whether this may increase performance of virtualized workloads.
The following available options are listed below (not all of which are available across all Xeon E5-series
processors):
Adjacent Cache Line Prefetch
Hardware Prefetcher
DCU Streamer Prefetcher
DCU IP Prefetcher
Execute disable
This is a security feature designed to prevent certain types of buffer overflow attacks by enforcing
specific areas of memory that applications can execute code. In general, it is best to leave this option
Enabled for the security benefits, as no real performance advantage has been detected by disabling
this feature in BIOS.
Number of cores per processor
This BIOS option can control the number of cores presented to the Operating System from each
populated processor socket. In general, it is uncommon to artificially reduce the core count for a
given system, but under some circumstances, limited performance improvements to Intel Turbo Boost
Technology and potentially larger shared caches may benefit some customers. Most computing
environments tend to benefit more from larger numbers of processing cores, so disabling cores to

BIOS Performance and Power Tuning Guidelines for Dell PowerEdge 12th Generation Servers
20
gain nominal performance enhancements must be carefully weighed prior to changing this setting
from the default.
Logical processor idling
This option is related to Power Capping, and should only be enabled if the operating environment
supports the LPI interface. At of the time that this whitepaper was written, Windows Server 2012 and
some new Linux kernels have support for this feature. Generally, this option should be left at the
default of Disabled unless specific power capping support is required. Enabling this feature has been
known to cause issues on older Linux kernels.
System Profile Settings section The System Profile Settings section of the BIOS Setup is the last major area that this white paper
explores. Dell PowerEdge 12th
generation platforms provide a new class of BIOS settings known as
“System Profiles” that govern the values set for multiple sub-options. Table 1 lists the four System
Profiles that exist at the time of writing this white paper. Each profile is selected for a particular
purpose. As shown in Figure 12 and in the following sections, these four profiles can have a major
impact on both power efficiency and performance.
Figure 12. System BIOS Settings – System Profiles Settings screen
BIOS Performance and Power Tuning Guidelines for Dell PowerEdge 12th Generation Servers
21
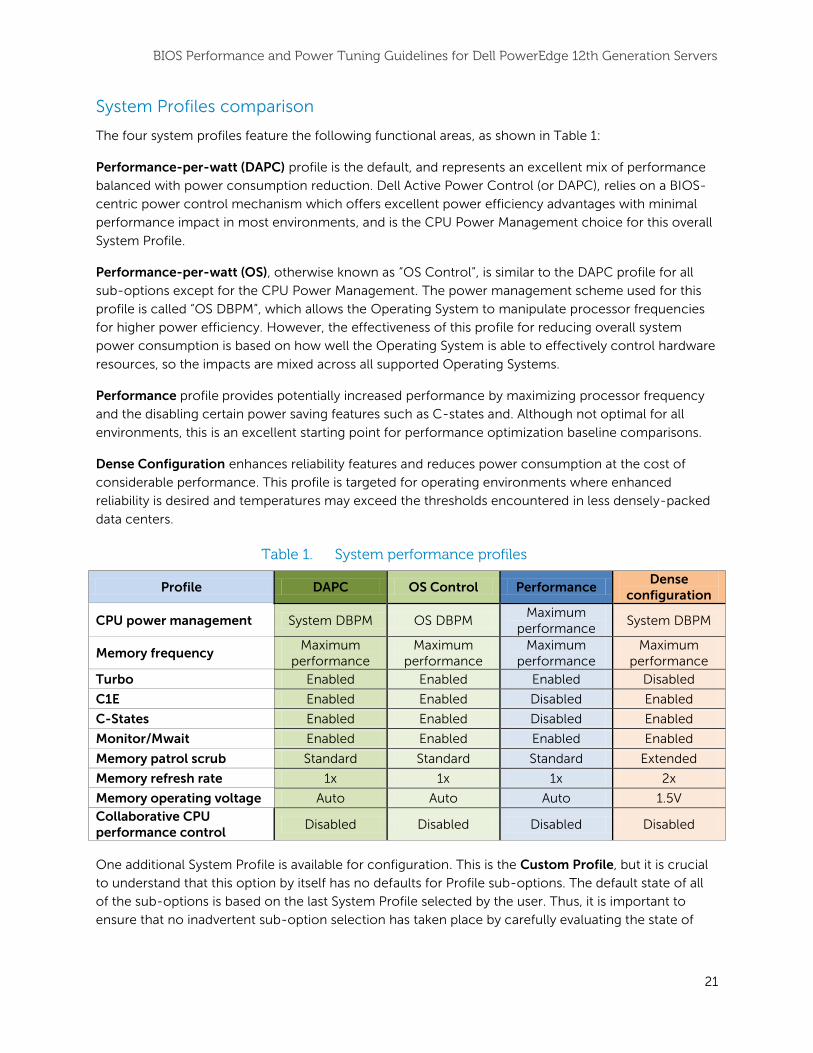
System Profiles comparison
The four system profiles feature the following functional areas, as shown in Table 1:
Performance-per-watt (DAPC) profile is the default, and represents an excellent mix of performance
balanced with power consumption reduction. Dell Active Power Control (or DAPC), relies on a BIOS-
centric power control mechanism which offers excellent power efficiency advantages with minimal
performance impact in most environments, and is the CPU Power Management choice for this overall
System Profile.
Performance-per-watt (OS), otherwise known as “OS Control”, is similar to the DAPC profile for all
sub-options except for the CPU Power Management. The power management scheme used for this
profile is called “OS DBPM”, which allows the Operating System to manipulate processor frequencies
for higher power efficiency. However, the effectiveness of this profile for reducing overall system
power consumption is based on how well the Operating System is able to effectively control hardware
resources, so the impacts are mixed across all supported Operating Systems.
Performance profile provides potentially increased performance by maximizing processor frequency
and the disabling certain power saving features such as C-states and. Although not optimal for all
environments, this is an excellent starting point for performance optimization baseline comparisons.
Dense Configuration enhances reliability features and reduces power consumption at the cost of
considerable performance. This profile is targeted for operating environments where enhanced
reliability is desired and temperatures may exceed the thresholds encountered in less densely-packed
data centers.
Table 1. System performance profiles
Profile DAPC OS Control Performance Dense
configuration
CPU power management System DBPM OS DBPM Maximum
performance System DBPM
Memory frequency Maximum
performance Maximum
performance Maximum
performance Maximum
performance
Turbo Enabled Enabled Enabled Disabled
C1E Enabled Enabled Disabled Enabled
C-States Enabled Enabled Disabled Enabled
Monitor/Mwait Enabled Enabled Enabled Enabled
Memory patrol scrub Standard Standard Standard Extended
Memory refresh rate 1x 1x 1x 2x
Memory operating voltage Auto Auto Auto 1.5V
Collaborative CPU performance control
Disabled Disabled Disabled Disabled
One additional System Profile is available for configuration. This is the Custom Profile, but it is crucial
to understand that this option by itself has no defaults for Profile sub-options. The default state of all
of the sub-options is based on the last System Profile selected by the user. Thus, it is important to
ensure that no inadvertent sub-option selection has taken place by carefully evaluating the state of
BIOS Performance and Power Tuning Guidelines for Dell PowerEdge 12th Generation Servers
22
each setting once the Custom Profile is selected. Another great resource can be found in the Dell
PowerEdge 12th
Generation Server System Profiles white paper.
Performance and power comparisons of System Profiles
To evaluate the performance and power impacts of the four available System Profiles, the industry
standard SPECpower_ssj2008 performance-per-watt benchmark was used to characterize these
options. In addition, one Custom profile was selected for this comparison, and was set by selecting the
Performance Profile followed by selecting Custom. The C1E and C-States options were then enabled.
This custom profile provides the benefits of locking in maximum processor frequency, while providing
for some opportunity to save power at lower workload levels and at idle. In the chart, this is
represented as Performance + C-States/C1E.
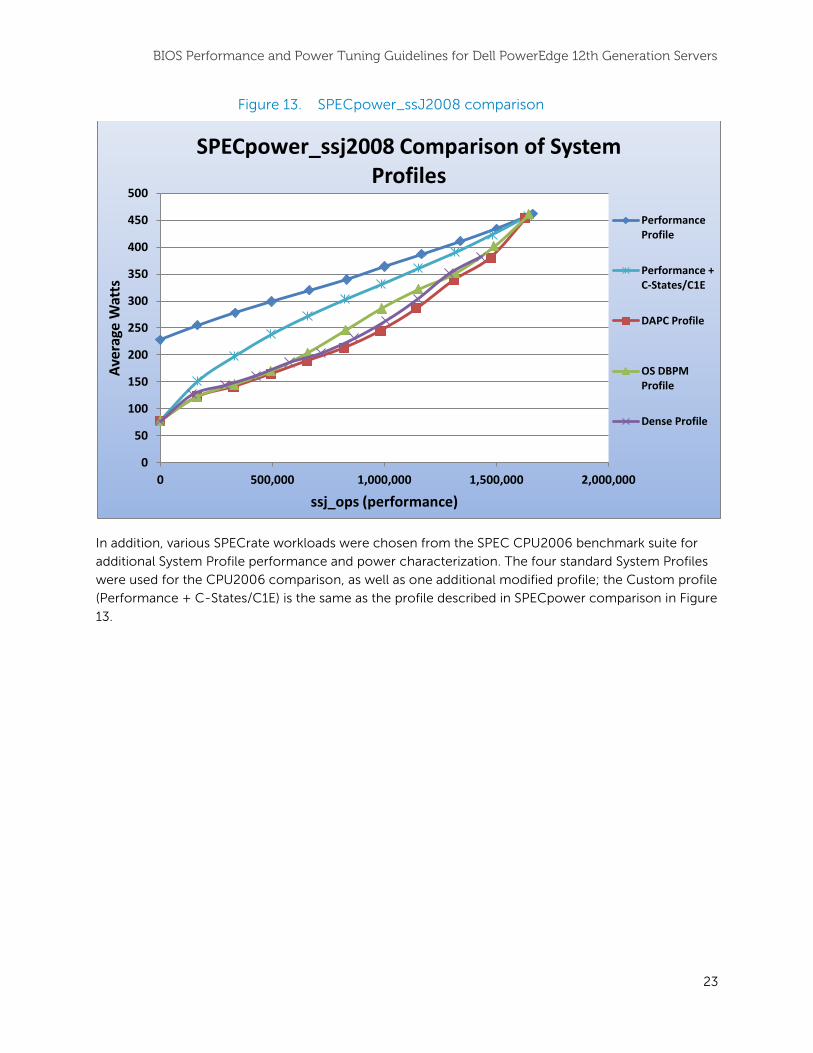
Examining Figure 13, each System Profile was measured and the performance/watt curve displayed on
the graph. The points on each line indicate the load level, starting with active idle up to 100% in 10%
intervals. The X-axis represents the performance level for each load level, and the Y-axis represents
the average watts measured for that load level. For better performance-per-watt configurations, the
performance will be as high as possible while consuming a minimum amount of power. It should be
understood that the system hardware configuration chosen to compare these System Profiles is one
optimized for maximum performance, not power efficiency, and contained the highest TDP
processors and 128GB of 1600MHz memory, so alternate system configurations will offer different
performance and power characteristics. However, the approximate shape of the efficiency curves
should be generally accurate regardless of processor and memory configuration.
The DAPC System Profile represents the best performance-per-watt combination for this benchmark
across all workload intervals, using the least amount of power while offering maximum performance
levels within 2% of that provided by the Performance System Profile. The Dense and OS Control
profiles vie for second place and the shape of the curves look similar to one another at first glance.
However, the Dense Profile achieves only 86% of the 100% workload interval performance that was
achieved with the Performance Profile. The Performance System Profile provided the highest
performance levels, but at considerable cost to power. This was especially true at idle, but the choice
of processors and the large memory configuration are driving a great deal of this high idle, which tend
to be more greatly affected by the reduction in power saving modes that this profile utilizes. The
Custom Profile, Performance + C-States/C1E is capable of achieving within 1% of the maximum
ssj_ops of the Performance System Profile, but the idle power is radically reduced due the two power
saving options turned on in this custom profile.
BIOS Performance and Power Tuning Guidelines for Dell PowerEdge 12th Generation Servers
23
Figure 13. SPECpower_ssJ2008 comparison
In addition, various SPECrate workloads were chosen from the SPEC CPU2006 benchmark suite for
additional System Profile performance and power characterization. The four standard System Profiles
were used for the CPU2006 comparison, as well as one additional modified profile; the Custom profile
(Performance + C-States/C1E) is the same as the profile described in SPECpower comparison in Figure
13.
0
50
100
150
200
250
300
350
400
450
500
0 500,000 1,000,000 1,500,000 2,000,000
Ave
rage
Wat
ts
ssj_ops (performance)
SPECpower_ssj2008 Comparison of System Profiles
PerformanceProfile
Performance +C-States/C1E
DAPC Profile
OS DBPMProfile
Dense Profile

BIOS Performance and Power Tuning Guidelines for Dell PowerEdge 12th Generation Servers
24
The 400.perlbench workload (a PERL programming language benchmark) in Figure 14 was compared
with the four System Profiles (plus Custom Performance + C-States) to chart the impacts to
performance and power utilization. This workload, as all CPU2006 rate sub benchmarks, is fully
multithreaded such that all logical processors will be fully utilized for the duration of the test. This test
type limits the ability for some Profiles to engage in significant power saving at this highest utilization
level. For all Profiles excepting Dense, the performance variance was less than 1%. However, some
nominal power savings were detected from the Custom profile as well as through System DBPM
(DAPC), ranging from 3% to 4% average wattage reduction. The OS DBPM profile performed
equivalently with the Performance Profile, at slightly higher power utilization. For the Dense
Configuration system profile, there were noticeable impacts to both power and performance.
Compared with the baseline Performance profile, the Dense Profile only achieved 87% of the
performance, but at 79% of the power.
Figure 14. Performance and power comparison — 400.perlbench(peak)
1.0
0
0.9
9
0.9
9
1.0
0 0.8
7
1.0
0
0.9
7
0.9
6
1.0
1
0.7
9
0.00
0.20
0.40
0.60
0.80
1.00
1.20
Performance Perf/C-StatesOn
System DBPM OS DBPM DENSENo
rmal
ized
Po
wer
an
d P
erfo
rman
ce
System Profile
400.perlbench(peak) Performance and Power System Profile Comparison
Performance
Average Watts
BIOS Performance and Power Tuning Guidelines for Dell PowerEdge 12th Generation Servers
25
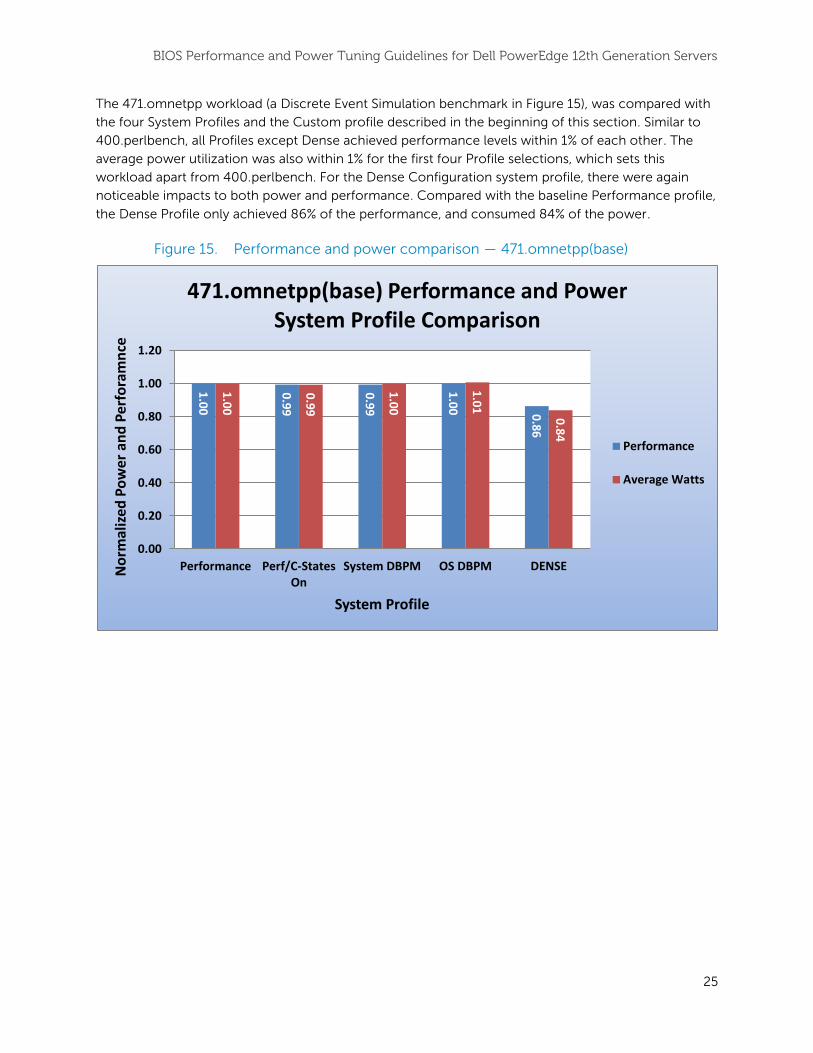
The 471.omnetpp workload (a Discrete Event Simulation benchmark in Figure 15), was compared with
the four System Profiles and the Custom profile described in the beginning of this section. Similar to
400.perlbench, all Profiles except Dense achieved performance levels within 1% of each other. The
average power utilization was also within 1% for the first four Profile selections, which sets this
workload apart from 400.perlbench. For the Dense Configuration system profile, there were again
noticeable impacts to both power and performance. Compared with the baseline Performance profile,
the Dense Profile only achieved 86% of the performance, and consumed 84% of the power.
Figure 15. Performance and power comparison — 471.omnetpp(base)
1.0
0
0.9
9
0.9
9
1.0
0 0.8
6
1.0
0
0.9
9
1.0
0
1.0
1 0
.84
0.00
0.20
0.40
0.60
0.80
1.00
1.20
Performance Perf/C-StatesOn
System DBPM OS DBPM DENSENo
rmal
ized
Po
wer
an
d P
erfo
ram
nce
System Profile
471.omnetpp(base) Performance and Power System Profile Comparison
Performance
Average Watts

BIOS Performance and Power Tuning Guidelines for Dell PowerEdge 12th Generation Servers
26
In Figure 16, we see that for the floating-point workload 410.bwaves (a Fluid Dynamics/blast wave
simulator workload), performance levels across the first four profile selections was equivalent.
Therefore, no significant impact should be taken away from this comparison. The Dense Configuration
profile again showed a large performance impact at 85% of that achieved by the Performance profile.
The average power utilization was 88% of that measured from the Performance profile.
Figure 16. Performance and power comparison — 410.bwaves(base)
1
.00
1.0
0
1.0
0
1.0
0
0.8
5
1.0
0
1.0
0
1.0
1
1.0
1
0.8
8
0.75
0.80
0.85
0.90
0.95
1.00
1.05
Performance Perf/C-StatesOn
System DBPM OS DBPM DENSENo
rmal
ized
Po
wer
an
d P
erfo
rman
ce
System Profile
410.bwaves(base) Performance and Power System Profile Comparison
Performance
Average Watts
BIOS Performance and Power Tuning Guidelines for Dell PowerEdge 12th Generation Servers
27
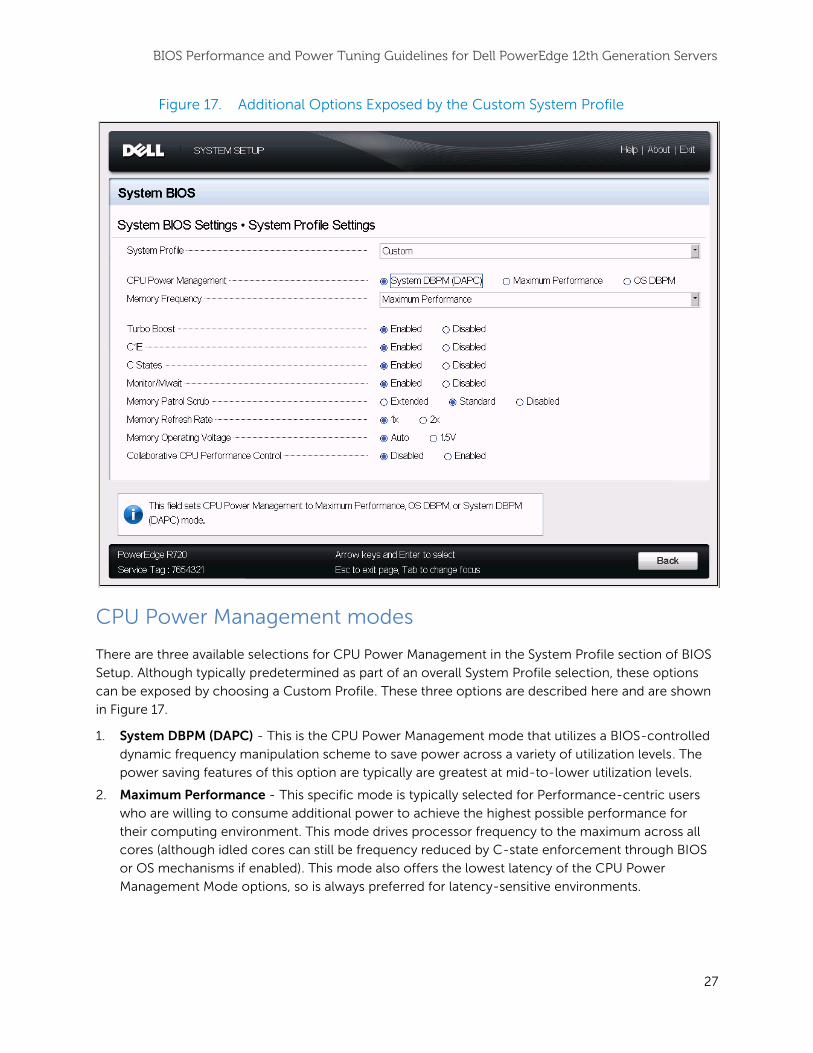
Figure 17. Additional Options Exposed by the Custom System Profile
CPU Power Management modes
There are three available selections for CPU Power Management in the System Profile section of BIOS
Setup. Although typically predetermined as part of an overall System Profile selection, these options
can be exposed by choosing a Custom Profile. These three options are described here and are shown
in Figure 17.
1. System DBPM (DAPC) - This is the CPU Power Management mode that utilizes a BIOS-controlled
dynamic frequency manipulation scheme to save power across a variety of utilization levels. The
power saving features of this option are typically are greatest at mid-to-lower utilization levels.
2. Maximum Performance - This specific mode is typically selected for Performance-centric users
who are willing to consume additional power to achieve the highest possible performance for
their computing environment. This mode drives processor frequency to the maximum across all
cores (although idled cores can still be frequency reduced by C-state enforcement through BIOS
or OS mechanisms if enabled). This mode also offers the lowest latency of the CPU Power
Management Mode options, so is always preferred for latency-sensitive environments.
BIOS Performance and Power Tuning Guidelines for Dell PowerEdge 12th Generation Servers
28
3. OS DBPM – This CPU Power Management mode is another performance-per-watt option that
relies on the operating system to dynamically control individual core frequency dynamically. Both
Windows®
and Linux can take advantage of this mode to reduce frequency of idled or under-
utilized cores in order to save power.
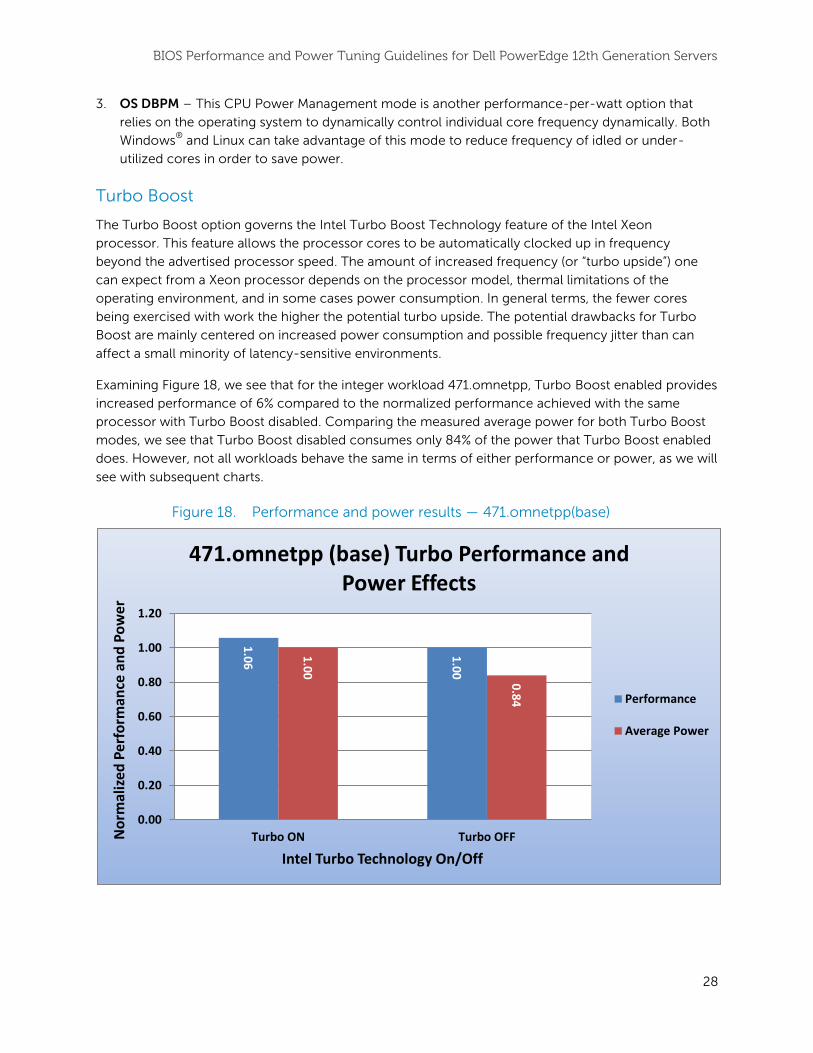
Turbo Boost
The Turbo Boost option governs the Intel Turbo Boost Technology feature of the Intel Xeon
processor. This feature allows the processor cores to be automatically clocked up in frequency
beyond the advertised processor speed. The amount of increased frequency (or “turbo upside”) one
can expect from a Xeon processor depends on the processor model, thermal limitations of the
operating environment, and in some cases power consumption. In general terms, the fewer cores
being exercised with work the higher the potential turbo upside. The potential drawbacks for Turbo
Boost are mainly centered on increased power consumption and possible frequency jitter than can
affect a small minority of latency-sensitive environments.
Examining Figure 18, we see that for the integer workload 471.omnetpp, Turbo Boost enabled provides
increased performance of 6% compared to the normalized performance achieved with the same
processor with Turbo Boost disabled. Comparing the measured average power for both Turbo Boost
modes, we see that Turbo Boost disabled consumes only 84% of the power that Turbo Boost enabled
does. However, not all workloads behave the same in terms of either performance or power, as we will
see with subsequent charts.
Figure 18. Performance and power results — 471.omnetpp(base)
1.0
6
1.0
0
1.0
0 0
.84
0.00
0.20
0.40
0.60
0.80
1.00
1.20
Turbo ON Turbo OFFNo
rmal
ized
Per
form
ance
an
d P
ow
er
Intel Turbo Technology On/Off
471.omnetpp (base) Turbo Performance and Power Effects
Performance
Average Power
BIOS Performance and Power Tuning Guidelines for Dell PowerEdge 12th Generation Servers
29
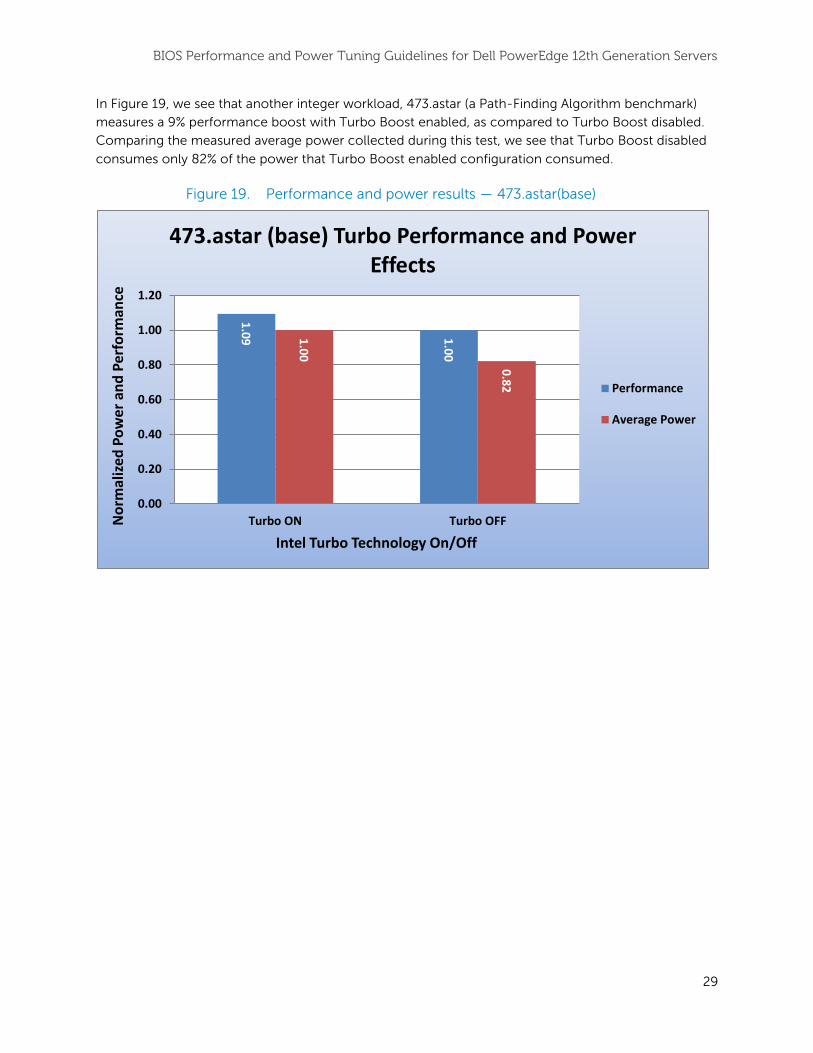
In Figure 19, we see that another integer workload, 473.astar (a Path-Finding Algorithm benchmark)
measures a 9% performance boost with Turbo Boost enabled, as compared to Turbo Boost disabled.
Comparing the measured average power collected during this test, we see that Turbo Boost disabled
consumes only 82% of the power that Turbo Boost enabled configuration consumed.
Figure 19. Performance and power results — 473.astar(base)
1.0
9
1.0
0
1.0
0
0.8
2
0.00
0.20
0.40
0.60
0.80
1.00
1.20
Turbo ON Turbo OFFNo
rmal
ized
Po
wer
an
d P
erfo
rman
ce
Intel Turbo Technology On/Off
473.astar (base) Turbo Performance and Power Effects
Performance
Average Power
BIOS Performance and Power Tuning Guidelines for Dell PowerEdge 12th Generation Servers
30
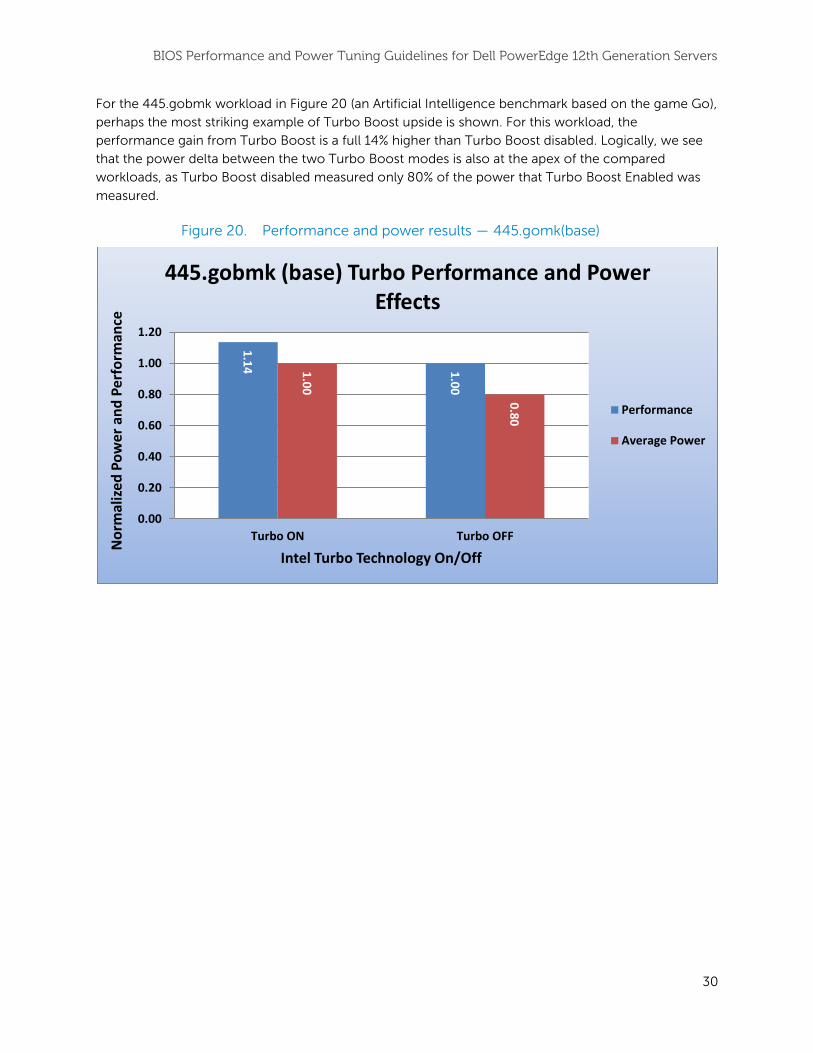
For the 445.gobmk workload in Figure 20 (an Artificial Intelligence benchmark based on the game Go),
perhaps the most striking example of Turbo Boost upside is shown. For this workload, the
performance gain from Turbo Boost is a full 14% higher than Turbo Boost disabled. Logically, we see
that the power delta between the two Turbo Boost modes is also at the apex of the compared
workloads, as Turbo Boost disabled measured only 80% of the power that Turbo Boost Enabled was
measured.
Figure 20. Performance and power results — 445.gomk(base)
1.1
4 1.0
0
1.0
0
0.8
0
0.00
0.20
0.40
0.60
0.80
1.00
1.20
Turbo ON Turbo OFF
No
rmal
ized
Po
wer
an
d P
erfo
rman
ce
Intel Turbo Technology On/Off
445.gobmk (base) Turbo Performance and Power Effects
Performance
Average Power

BIOS Performance and Power Tuning Guidelines for Dell PowerEdge 12th Generation Servers
31
C-States and C1E options
The C-States and C1E options are both processor power-saving features that can apply at a variety of
system load levels, and are crucial for environments that need some level of power efficiency. In
Figure 21, we compare the four standard System Profiles and include the Custom profile of
Performance/C-States (described above) for idle power utilizations under Windows. With the
inclusion of this manual profile setting, we can see that C-States + C1E have a major hand in reducing
idle power for all System Profiles that enable these options. By disabling C-States in the Performance
System Profile, the idle power is increased by 66% compared to all other profiles which have these
options enabled.
Figure 21. Windows system profile comparison
1.0
0
0.3
4
0.3
4
0.3
4
0.3
4
0.00
0.20
0.40
0.60
0.80
1.00
1.20
Ave
rage
Wat
ts
System Profile
Idle Power System Profile Comparison in Windows
BIOS Performance and Power Tuning Guidelines for Dell PowerEdge 12th Generation Servers
32
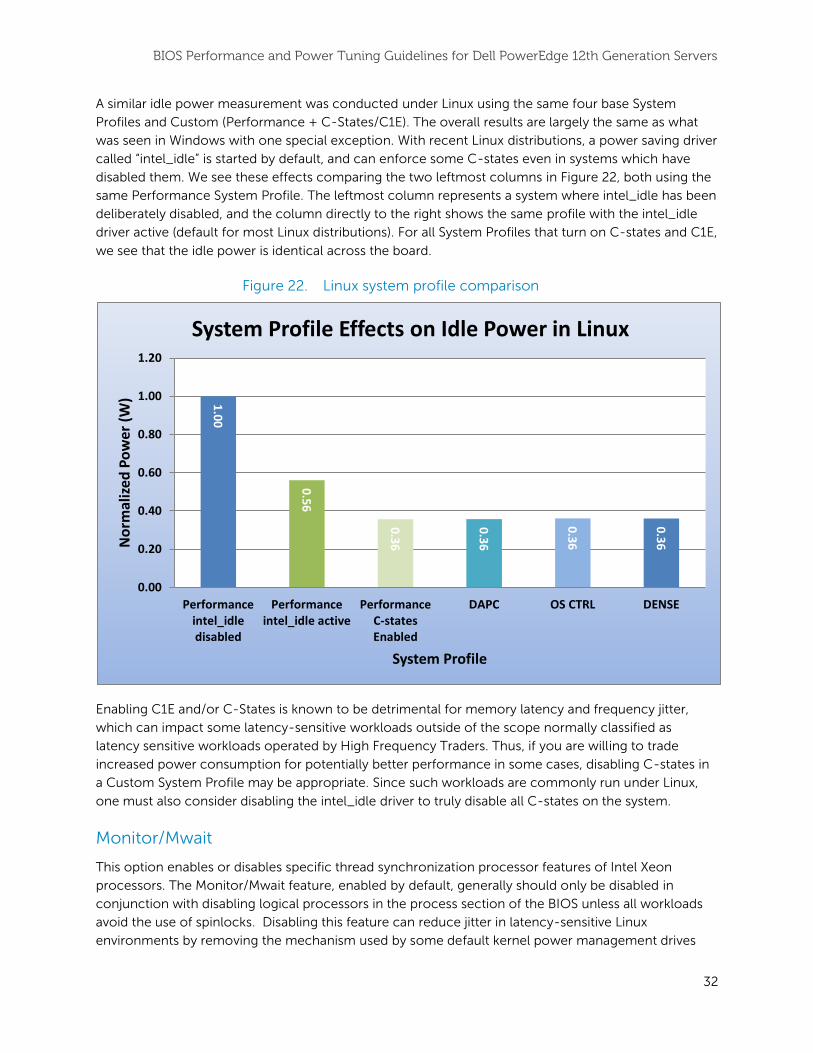
A similar idle power measurement was conducted under Linux using the same four base System
Profiles and Custom (Performance + C-States/C1E). The overall results are largely the same as what
was seen in Windows with one special exception. With recent Linux distributions, a power saving driver
called “intel_idle” is started by default, and can enforce some C-states even in systems which have
disabled them. We see these effects comparing the two leftmost columns in Figure 22, both using the
same Performance System Profile. The leftmost column represents a system where intel_idle has been
deliberately disabled, and the column directly to the right shows the same profile with the intel_idle
driver active (default for most Linux distributions). For all System Profiles that turn on C-states and C1E,
we see that the idle power is identical across the board.
Figure 22. Linux system profile comparison
Enabling C1E and/or C-States is known to be detrimental for memory latency and frequency jitter,
which can impact some latency-sensitive workloads outside of the scope normally classified as
latency sensitive workloads operated by High Frequency Traders. Thus, if you are willing to trade
increased power consumption for potentially better performance in some cases, disabling C-states in
a Custom System Profile may be appropriate. Since such workloads are commonly run under Linux,
one must also consider disabling the intel_idle driver to truly disable all C-states on the system.
Monitor/Mwait
This option enables or disables specific thread synchronization processor features of Intel Xeon
processors. The Monitor/Mwait feature, enabled by default, generally should only be disabled in
conjunction with disabling logical processors in the process section of the BIOS unless all workloads
avoid the use of spinlocks. Disabling this feature can reduce jitter in latency-sensitive Linux
environments by removing the mechanism used by some default kernel power management drives
1.0
0
0.5
6
0.3
6
0.3
6
0.3
6
0.3
6
0.00
0.20
0.40
0.60
0.80
1.00
1.20
Performanceintel_idledisabled
Performanceintel_idle active
PerformanceC-statesEnabled
DAPC OS CTRL DENSE
No
rmal
ized
Po
wer
(W
)
System Profile
System Profile Effects on Idle Power in Linux
BIOS Performance and Power Tuning Guidelines for Dell PowerEdge 12th Generation Servers
33
such as intel_idle that will enforce limited C-state use, even if C-states and C1E are manually disabled
in BIOS. Disabling the Monitor/Mwait option will automatically prevent the intel_idle driver from
starting.
Collaborative CPU Performance Control
This BIOS switch allows for interaction between the BIOS and the operating system to dynamically
control processor frequency for optimal power efficiency. This option is targeted primarily for
Windows Server 2012, so it can be safely left disabled. Furthermore, this option is only compatible with
the System DBPM CPU Power Management (DAPC) mode.
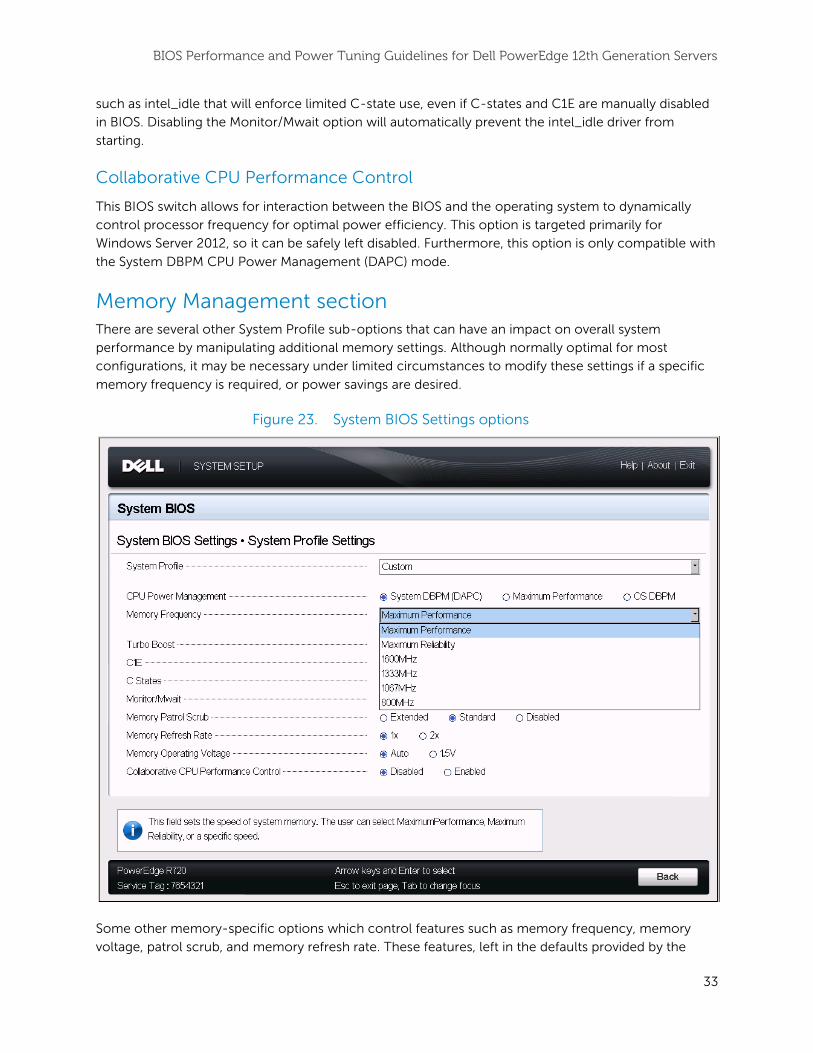
Memory Management section There are several other System Profile sub-options that can have an impact on overall system
performance by manipulating additional memory settings. Although normally optimal for most
configurations, it may be necessary under limited circumstances to modify these settings if a specific
memory frequency is required, or power savings are desired.
Figure 23. System BIOS Settings options
Some other memory-specific options which control features such as memory frequency, memory
voltage, patrol scrub, and memory refresh rate. These features, left in the defaults provided by the
BIOS Performance and Power Tuning Guidelines for Dell PowerEdge 12th Generation Servers
34
Performance System Profile, are typically optimal for performance. In cases where additional power
savings is desired or where higher than default memory frequencies are needed for certain 3 DIMM per
channel memory configurations, two options in particular should be noted for possible manipulation.
Memory Patrol Scrub and Memory Refresh rates are not normally modified from defaults for
performance tuning. Increasing the Memory Refresh rates may increase memory reliability but with a
negative impact on memory subsystem performance under some circumstances.
Memory frequency
This option governs the BIOS memory frequency. The variables that govern maximum memory
frequency include the maximum rated frequency of the DIMMs, the DIMMs per channel population,
the processor choice, and this BIOS option. For cases where 3 DIMMs per channel are utilized and
1333MT/s frequency is needed, the system may not default to this memory frequency automatically. In
that situation, manual selection of 1333MT/s may be necessary, along with a memory voltage
adjustment.
In cases where additional power savings is required, and the customer is willing to trade some
performance for this result, the memory frequency can be reduced for power savings. Reference the
Memory Performance Guidelines for Dell PowerEdge 12th Generation Servers for additional resources
to help guide decision making.
Memory operating voltage
The Memory Operating Voltage selection determines what voltage is used for the populated DIMMs in
a given system configuration. The two options are Auto and 1.5V. For Low Voltage memory, the
default selection of Auto will ensure that the DIMMs are running at 1.35V, which will reduce overall
power consumption. For some 3 DIMM per channel memory configurations, it may be necessary to
manually select 1.5V in conjunction with 1333MT/s in order to achieve this frequency.
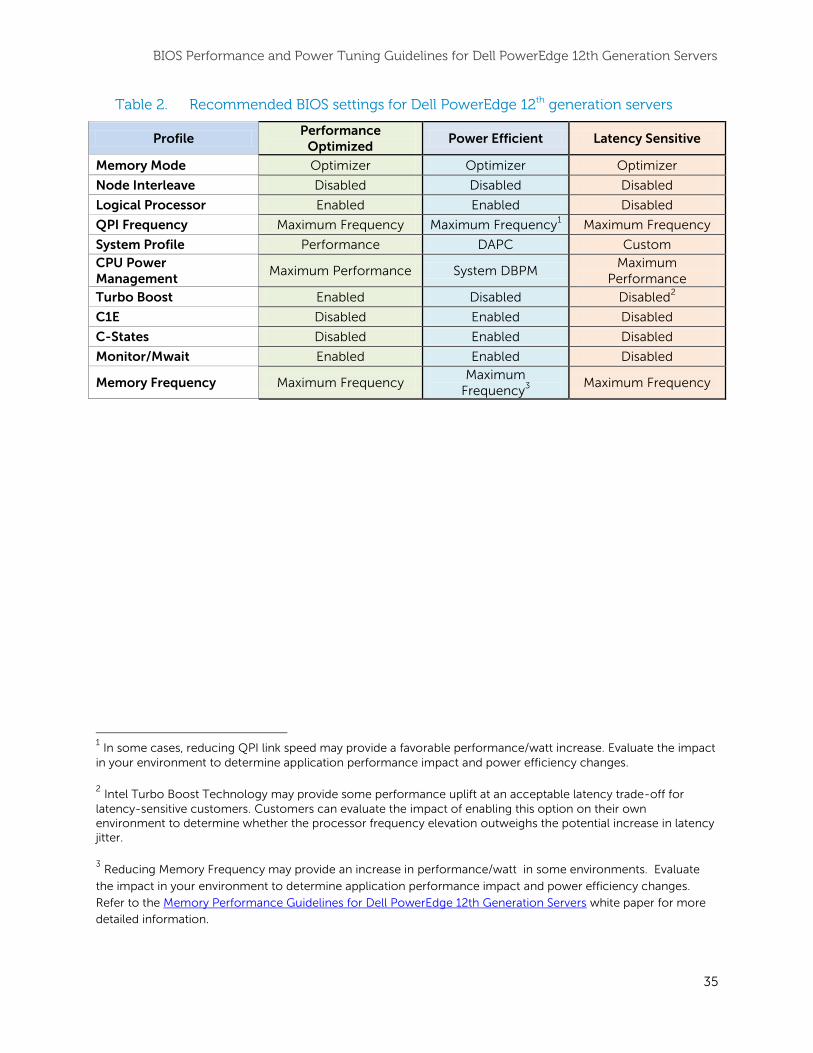
Conclusion Table 2 provides a set of recommended BIOS settings for configuring Dell PowerEdge 12
th generation
servers for one of three scenarios. The Performance Optimized column represents the recommended
options that should be used when tuning a server for optimal performance in most general computing
scenarios. The Power Efficient column represents the recommendations for tuning for optimal power
efficiency while still retaining high performance characteristics. Finally, the Latency Sensitive column
represents BIOS tuning recommendations for customers running in low latency environments that
benefit from reduced frequency jitter and consistent, low system latency characteristics.
BIOS Performance and Power Tuning Guidelines for Dell PowerEdge 12th Generation Servers
35
Table 2. Recommended BIOS settings for Dell PowerEdge 12th generation servers
Profile Performance
Optimized Power Efficient Latency Sensitive
Memory Mode Optimizer Optimizer Optimizer
Node Interleave Disabled Disabled Disabled
Logical Processor Enabled Enabled Disabled
QPI Frequency Maximum Frequency Maximum Frequency1 Maximum Frequency
System Profile Performance DAPC Custom
CPU Power Management
Maximum Performance System DBPM Maximum
Performance
Turbo Boost Enabled Disabled Disabled2
C1E Disabled Enabled Disabled
C-States Disabled Enabled Disabled
Monitor/Mwait Enabled Enabled Disabled
Memory Frequency Maximum Frequency Maximum
Frequency3
Maximum Frequency
1 In some cases, reducing QPI link speed may provide a favorable performance/watt increase. Evaluate the impact
in your environment to determine application performance impact and power efficiency changes.
2 Intel Turbo Boost Technology may provide some performance uplift at an acceptable latency trade-off for
latency-sensitive customers. Customers can evaluate the impact of enabling this option on their own environment to determine whether the processor frequency elevation outweighs the potential increase in latency jitter.
3 Reducing Memory Frequency may provide an increase in performance/watt in some environments. Evaluate
the impact in your environment to determine application performance impact and power efficiency changes.
Refer to the Memory Performance Guidelines for Dell PowerEdge 12th Generation Servers white paper for more
detailed information.
BIOS Performance and Power Tuning Guidelines for Dell PowerEdge 12th Generation Servers
36
References
1. Memory Performance Guidelines for Dell PowerEdge 12th Generation Servers white paper
2. Configuring Low-Latency Environments on the Dell PowerEdge 12th Generation Servers white
paper
3. HPC Performance on the Dell PowerEdge 12th Generation Servers white paper
4. Dell PowerEdge 12th Generation Servers BIOS Configuration technical brief
5. Dell PowerEdge 12th Generation Server System Profiles white paper