Embed Size (px)
Citation preview
Date: 9 Dec 2015
3. Essential principleof good trial conduct3.4 Trial monitoring
(a) Elements andmotivation
(b) Group sequentialdesigns
(c) Example: sepsis trial
(c) Examples fromsections 2.3-2.4
Bios 6648- pg 1
Bios 6648: Design & conduct of clinical researchSection 3 - Essential principle of good trial conduct
3. Essential principle of good trial conduct
3.1 Masking (blinding)3.2 Treatment allocation (randomization)3.3 Study quality control3.4 Trial monitoring:
Interim decision and group sequential designs:(a) Elements and motivation for trial monitoring(b) Overview of group sequential designs(c) Examples:
I Sepsis trialI Other examples from sections 2.3-2.4:
Date: 9 Dec 2015
3. Essential principleof good trial conduct3.4 Trial monitoring
(a) Elements andmotivation
(b) Group sequentialdesigns
(c) Example: sepsis trial
(c) Examples fromsections 2.3-2.4
Bios 6648- pg 2
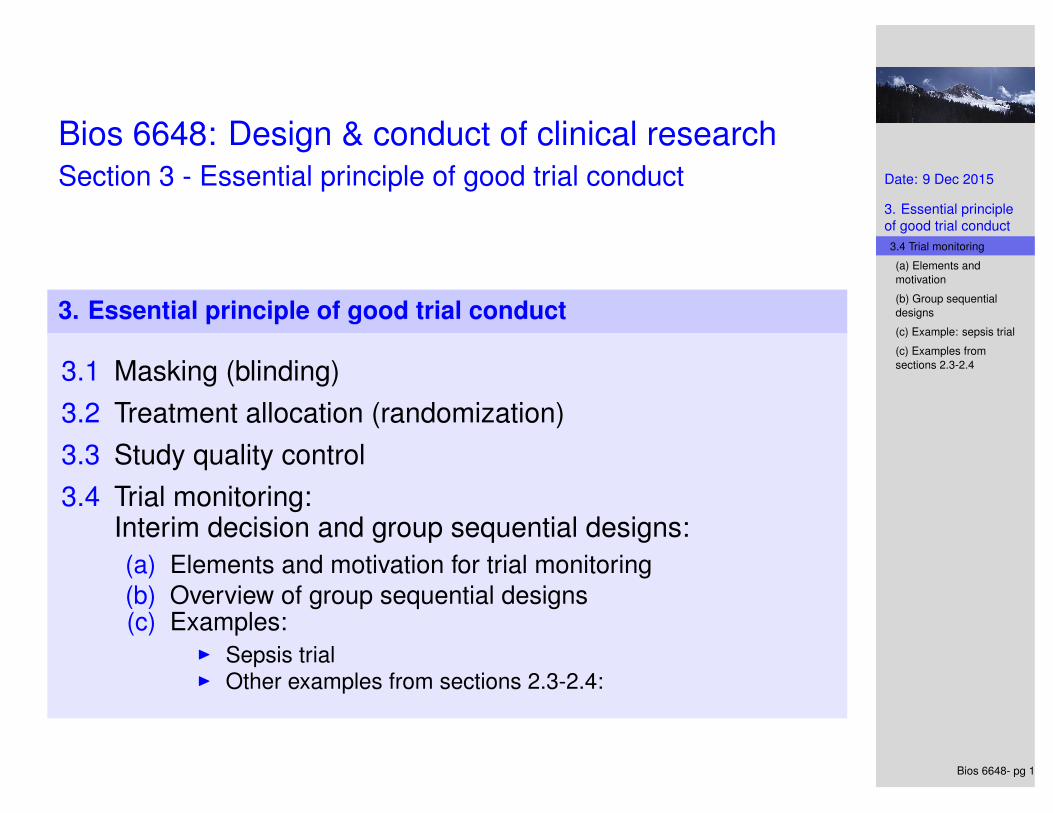
3.4 Trial monitoring
(c) Example: Sepsis trial
I Recall the design setting:I Randomized double-blind placebo controlled clinical trialI Patients admitted to ICU with gram-negative sepsis.I Treatments: Antibody to bacterial endotoxin versus placebo.I Primary outcome: 14-day mortalityI Probability model: binomialI Functional: θk = πk : true underlying probability of death
before 14 days.I Contrast: θ = θ1 − θ0 (risk difference; notice that θ < 0
indicates benefit of antibody).

Date: 9 Dec 2015
3. Essential principleof good trial conduct3.4 Trial monitoring
(a) Elements andmotivation
(b) Group sequentialdesigns
(c) Example: sepsis trial
(c) Examples fromsections 2.3-2.4
Bios 6648- pg 3
(c) Example: Sepsis trial
Evaluation of trial information
I N = 850 per group.I Alternative hypothesis:θ0 ≈ 0.3 and θ1 ≈ 0.23.
I Standard error of the estimated effect is given by:
se(θ̂) =
√VN
=
√0.3 × 0.7 + 0.23 × 0.77
850= 0.02134
I Inference at the boundary:I Critical value: −1.96se = −0.04183I 95% CI at critical value: (−0.084, 0.0)I Hypotheses discriminated:
Null hypothesis: H∅ : θ ≥ 0.0
Alternative hypothesis: H+ : θ ≤ −0.08365
Date: 9 Dec 2015
3. Essential principleof good trial conduct3.4 Trial monitoring
(a) Elements andmotivation
(b) Group sequentialdesigns
(c) Example: sepsis trial
(c) Examples fromsections 2.3-2.4
Bios 6648- pg 4
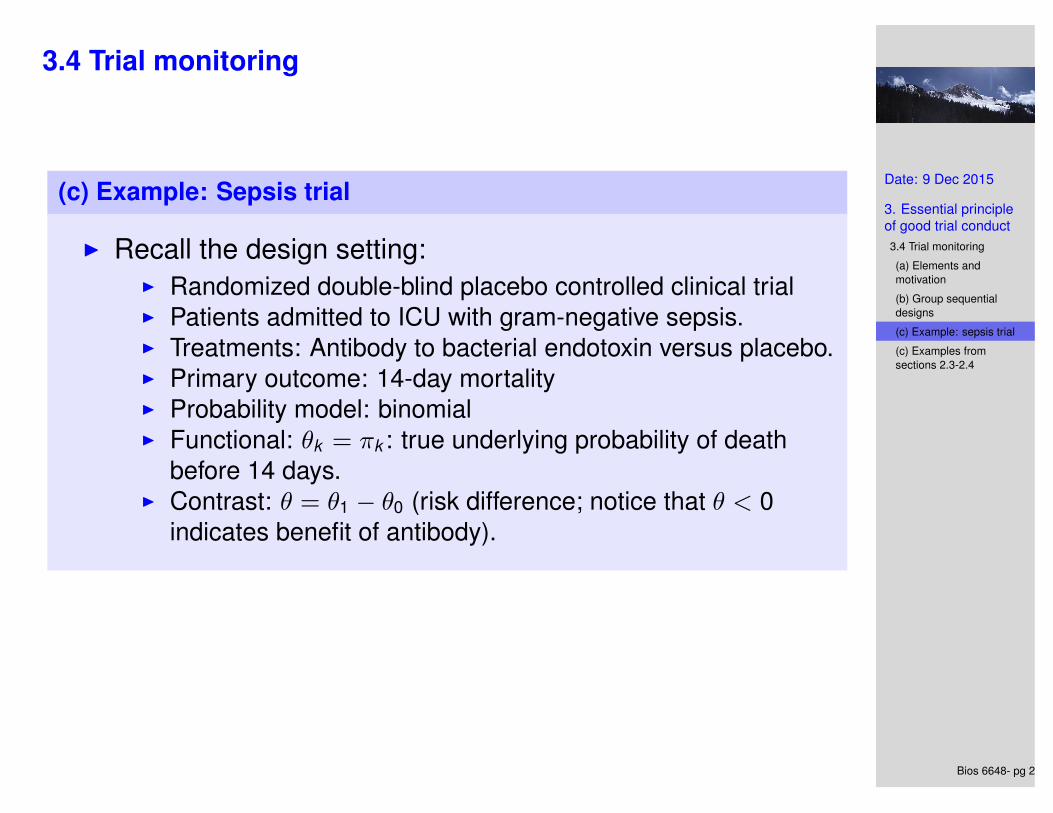
(c) Example: Sepsis trial
Equivalent design in RCTdesign
I seqDesign command for fixed-sample trial:> dsmb.fix <- seqDesign(prob.model="proportions",
arms=2, size=.025, power="calculate",null.hypothesis= c(.30, .30),alt.hypothesis=c(0.23,0.30), sample.size=1700,test.type="less")
> dsmb.fixPROBABILITY MODEL and HYPOTHESES:
Theta is difference in probabilities (Treatment - Comparison)One-sided hypothesis test of a lesser alternative:
Null hypothesis : Theta >= 0.00 (size = 0.0250)Alternative hypothesis : Theta <= -0.07 (power = 0.9066)
(Fixed sample test)
STOPPING BOUNDARIES: Sample Mean scaleEfficacy Futility
Time 1 (N= 1700) -0.0418 -0.0418

Date: 9 Dec 2015
3. Essential principleof good trial conduct3.4 Trial monitoring
(a) Elements andmotivation
(b) Group sequentialdesigns
(c) Example: sepsis trial
(c) Examples fromsections 2.3-2.4
Bios 6648- pg 5
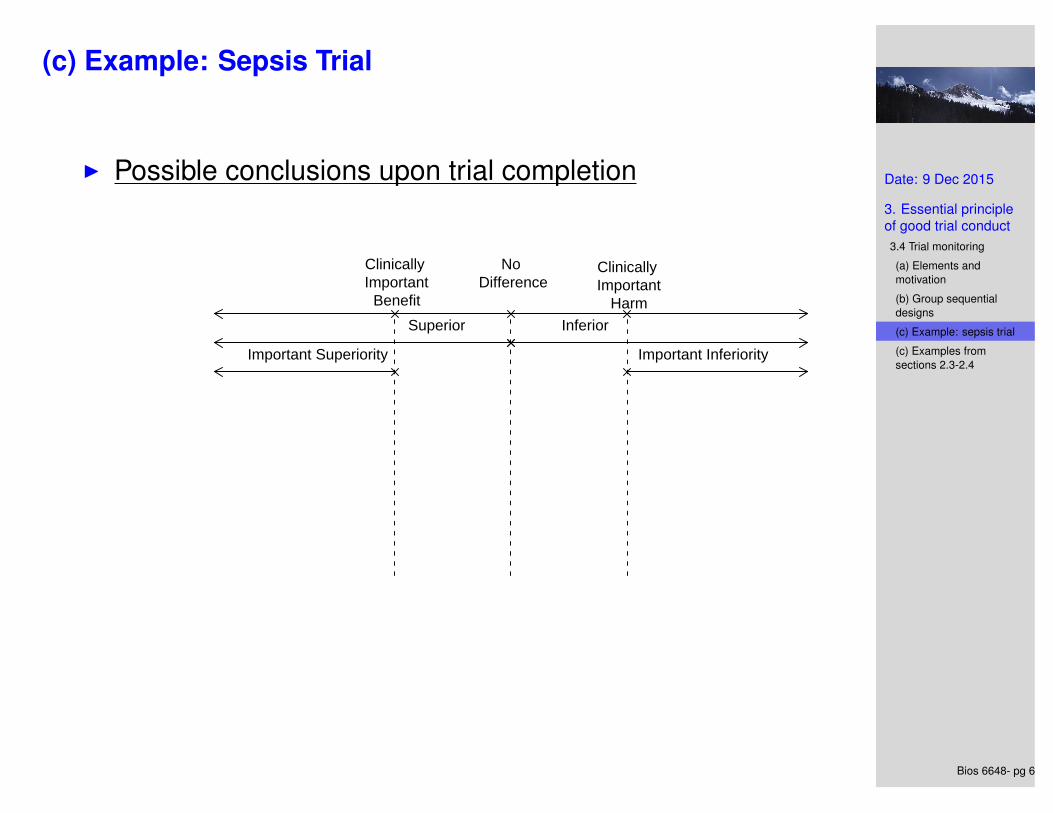
(c) Example: Sepsis Trial
I Possible conclusions upon trial completion
No Difference
Clinically Important
Benefit
Clinically Important
Harm
Date: 9 Dec 2015
3. Essential principleof good trial conduct3.4 Trial monitoring
(a) Elements andmotivation
(b) Group sequentialdesigns
(c) Example: sepsis trial
(c) Examples fromsections 2.3-2.4
Bios 6648- pg 6
(c) Example: Sepsis Trial
I Possible conclusions upon trial completion
No Difference
Clinically Important
Benefit
Clinically Important
Harm
Superior Inferior
Important Superiority Important Inferiority

Date: 9 Dec 2015
3. Essential principleof good trial conduct3.4 Trial monitoring
(a) Elements andmotivation
(b) Group sequentialdesigns
(c) Example: sepsis trial
(c) Examples fromsections 2.3-2.4
Bios 6648- pg 7
(c) Example: Sepsis Trial
I Possible conclusions upon trial completion
(
(
(
(
(
(
)
)
)
)
)
)
No Difference
Clinically Important
Benefit
Clinically Important
Harm
Superior Inferior
Important Superiority Important Inferiority
A
B
C
D
E
F
Pot
entia
l CI u
pon
tria
l com
plet
ion
I E, F⇒ Use new antibodyI A, B, C, D⇒ Do not use new antibody

Date: 9 Dec 2015
3. Essential principleof good trial conduct3.4 Trial monitoring
(a) Elements andmotivation
(b) Group sequentialdesigns
(c) Example: sepsis trial
(c) Examples fromsections 2.3-2.4
Bios 6648- pg 8
(c) Example: Sepsis Trial
I Possible conclusions at interim analysis
(
(
(
(
(
(
)
)
)
)
)
)
No Difference
Clinically Important
Benefit
Clinically Important
Harm
Superior Inferior
Important Superiority Important Inferiority
A
B
C
D
E
F
Pot
entia
l CI a
t int
erim
ana
lysi
s
I F⇒ Stop?: use new antibodyI D, E⇒ Continue trialI B, C⇒ Stop: futility - important benefits have been ruled
out.I A⇒ Stop: harmful
Date: 9 Dec 2015
3. Essential principleof good trial conduct3.4 Trial monitoring
(a) Elements andmotivation
(b) Group sequentialdesigns
(c) Example: sepsis trial
(c) Examples fromsections 2.3-2.4
Bios 6648- pg 9
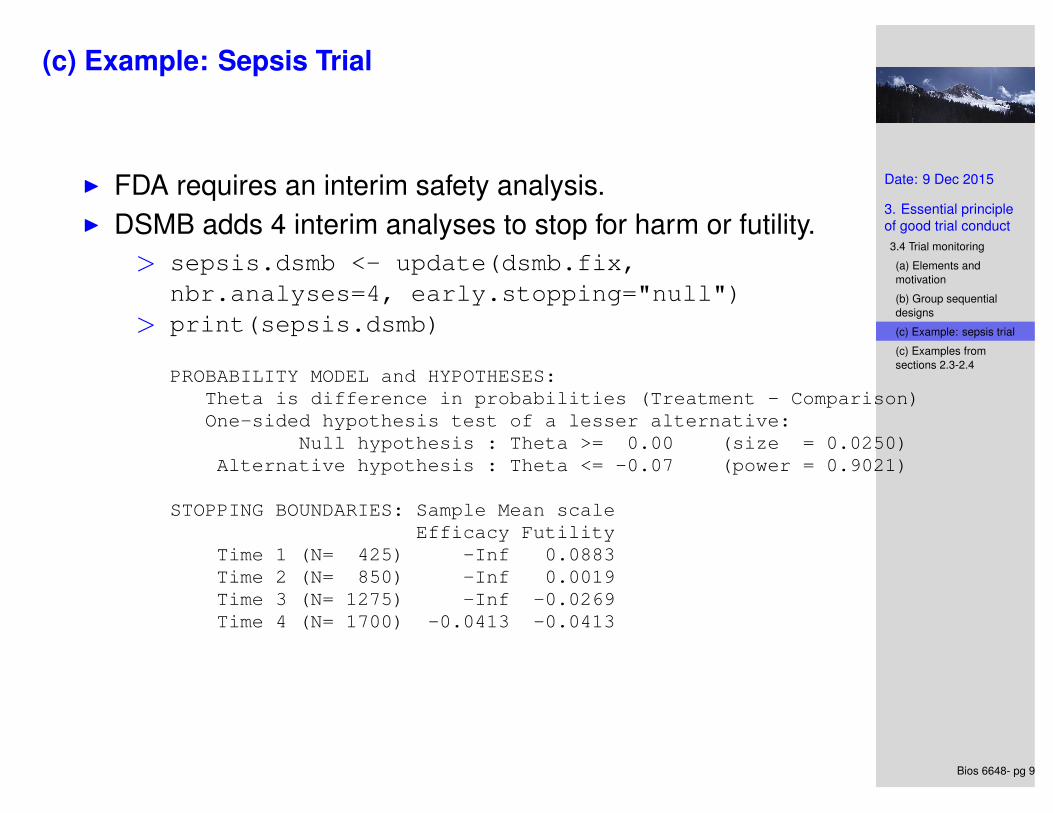
(c) Example: Sepsis Trial
I FDA requires an interim safety analysis.I DSMB adds 4 interim analyses to stop for harm or futility.
> sepsis.dsmb <- update(dsmb.fix,nbr.analyses=4, early.stopping="null")
> print(sepsis.dsmb)
PROBABILITY MODEL and HYPOTHESES:Theta is difference in probabilities (Treatment - Comparison)One-sided hypothesis test of a lesser alternative:
Null hypothesis : Theta >= 0.00 (size = 0.0250)Alternative hypothesis : Theta <= -0.07 (power = 0.9021)
STOPPING BOUNDARIES: Sample Mean scaleEfficacy Futility
Time 1 (N= 425) -Inf 0.0883Time 2 (N= 850) -Inf 0.0019Time 3 (N= 1275) -Inf -0.0269Time 4 (N= 1700) -0.0413 -0.0413
Date: 9 Dec 2015
3. Essential principleof good trial conduct3.4 Trial monitoring
(a) Elements andmotivation
(b) Group sequentialdesigns
(c) Example: sepsis trial
(c) Examples fromsections 2.3-2.4
Bios 6648- pg 10
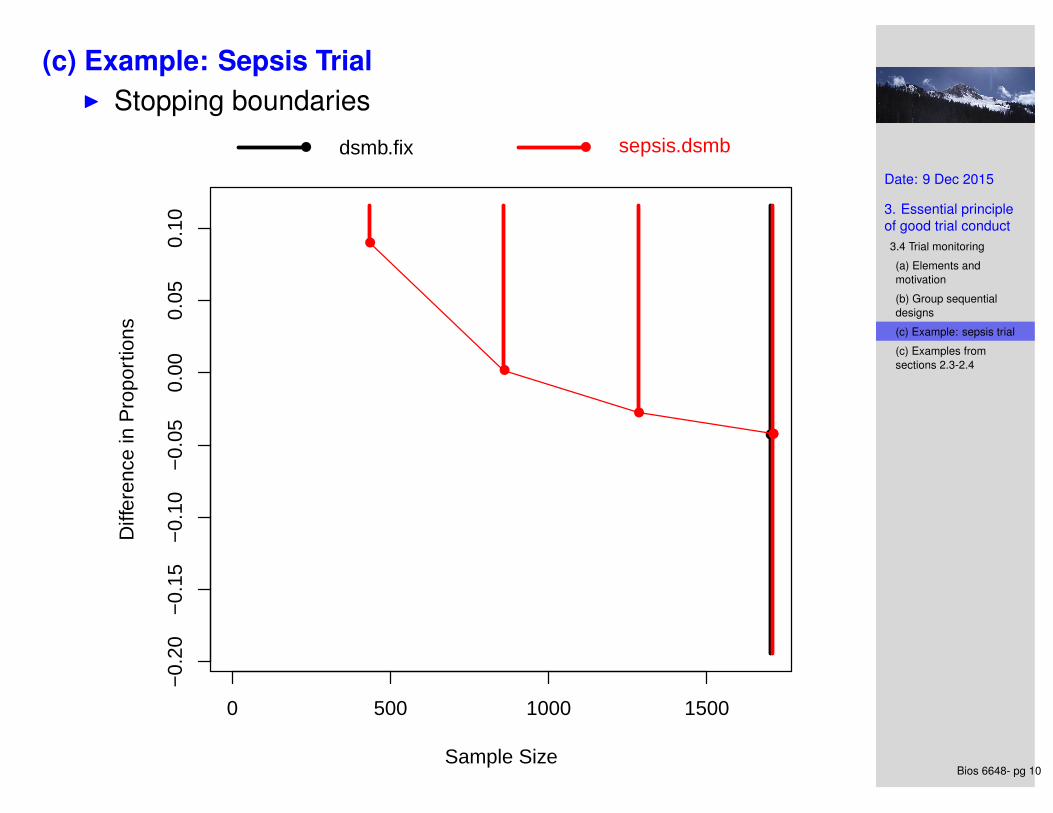
(c) Example: Sepsis TrialI Stopping boundaries
0 500 1000 1500
−0.
20−
0.15
−0.
10−
0.05
0.00
0.05
0.10
Sample Size
Diff
eren
ce in
Pro
port
ions
● dsmb.fix ● sepsis.dsmb
●●●
●
●
●
●

Date: 9 Dec 2015
3. Essential principleof good trial conduct3.4 Trial monitoring
(a) Elements andmotivation
(b) Group sequentialdesigns
(c) Example: sepsis trial
(c) Examples fromsections 2.3-2.4
Bios 6648- pg 11
(c) Example: Sepsis Trial
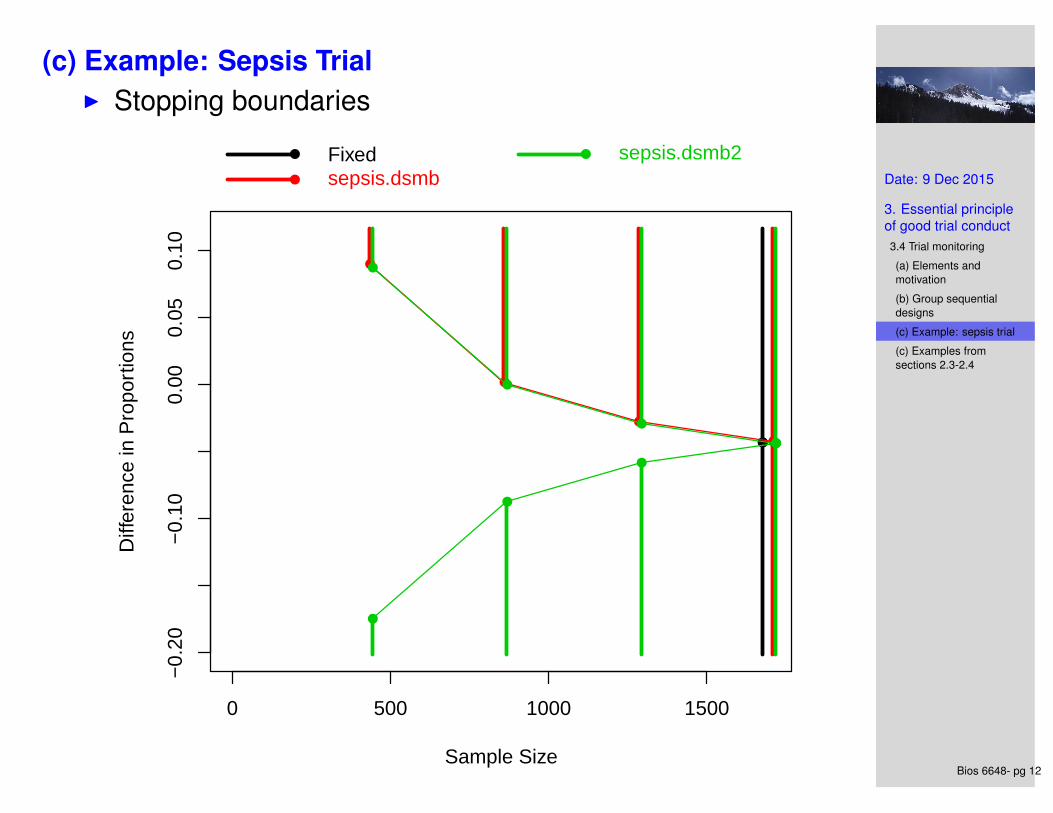
I Now suppose that we want 4 interim analyses withstopping for either futility or efficacy:> sepsis.dsmb2 <- update(dsmb.fix,
nbr.analyses=4, P=c(1,1),early.stopping="both")
> print(sepsis.dsmb2)PROBABILITY MODEL and HYPOTHESES:
Theta is difference in probabilities (Treatment - Comparison)One-sided hypothesis test of a lesser alternative:
Null hypothesis : Theta >= 0.00 (size = 0.0250)Alternative hypothesis : Theta <= -0.07 (power = 0.8947)(Emerson & Fleming (1989) symmetric test)
STOPPING BOUNDARIES: Sample Mean scaleEfficacy Futility
Time 1 (N= 425) -0.1710 0.0855Time 2 (N= 850) -0.0855 0.0000Time 3 (N= 1275) -0.0570 -0.0285Time 4 (N= 1700) -0.0427 -0.0427
Date: 9 Dec 2015
3. Essential principleof good trial conduct3.4 Trial monitoring
(a) Elements andmotivation
(b) Group sequentialdesigns
(c) Example: sepsis trial
(c) Examples fromsections 2.3-2.4
Bios 6648- pg 12
(c) Example: Sepsis TrialI Stopping boundaries
0 500 1000 1500
−0.
20−
0.10
0.00
0.05
0.10
Sample Size
Diff
eren
ce in
Pro
port
ions
● Fixed● sepsis.dsmb
● sepsis.dsmb2
●●●
●
●
●
●
●
●
●
●
●
●
●
●

Date: 9 Dec 2015
3. Essential principleof good trial conduct3.4 Trial monitoring
(a) Elements andmotivation
(b) Group sequentialdesigns
(c) Example: sepsis trial
(c) Examples fromsections 2.3-2.4
Bios 6648- pg 13
(c) Example: Sepsis Trial
I For interim analyses with efficacy and futility stopping, butwith less early conservatism for futility:> sepsis.dsmb3 <- update(dsmb.fix,
nbr.analyses=4, P=c(1,0.8),early.stopping="both")
> print(sepsis.dsmb3)
PROBABILITY MODEL and HYPOTHESES:Theta is difference in probabilities (Treatment - Comparison)One-sided hypothesis test of a lesser alternative:
Null hypothesis : Theta >= 0.00 (size = 0.0250)Alternative hypothesis : Theta <= -0.07 (power = 0.8888)
STOPPING BOUNDARIES: Sample Mean scaleEfficacy Futility
Time 1 (N= 425) -0.1697 0.0473Time 2 (N= 850) -0.0848 -0.0097Time 3 (N= 1275) -0.0566 -0.0310Time 4 (N= 1700) -0.0424 -0.0424

Date: 9 Dec 2015
3. Essential principleof good trial conduct3.4 Trial monitoring
(a) Elements andmotivation
(b) Group sequentialdesigns
(c) Example: sepsis trial
(c) Examples fromsections 2.3-2.4
Bios 6648- pg 14
(c) Example: Sepsis Trial
I For interim analyses with efficacy and futility stopping, butwith less early conservatism for futility:> sepsis.dsmb4 <- update(dsmb.fix,
nbr.analyses=4, P=c(1,0.5),early.stopping="both")
> print(sepsis.dsmb4)
PROBABILITY MODEL and HYPOTHESES:Theta is difference in probabilities (Treatment - Comparison)One-sided hypothesis test of a lesser alternative:
Null hypothesis : Theta >= 0.00 (size = 0.0250)Alternative hypothesis : Theta <= -0.07 (power = 0.8652)
STOPPING BOUNDARIES: Sample Mean scaleEfficacy Futility
Time 1 (N= 425) -0.1658 0.0087Time 2 (N= 850) -0.0829 -0.0207Time 3 (N= 1275) -0.0553 -0.0337Time 4 (N= 1700) -0.0415 -0.0415
Date: 9 Dec 2015
3. Essential principleof good trial conduct3.4 Trial monitoring
(a) Elements andmotivation
(b) Group sequentialdesigns
(c) Example: sepsis trial
(c) Examples fromsections 2.3-2.4
Bios 6648- pg 15
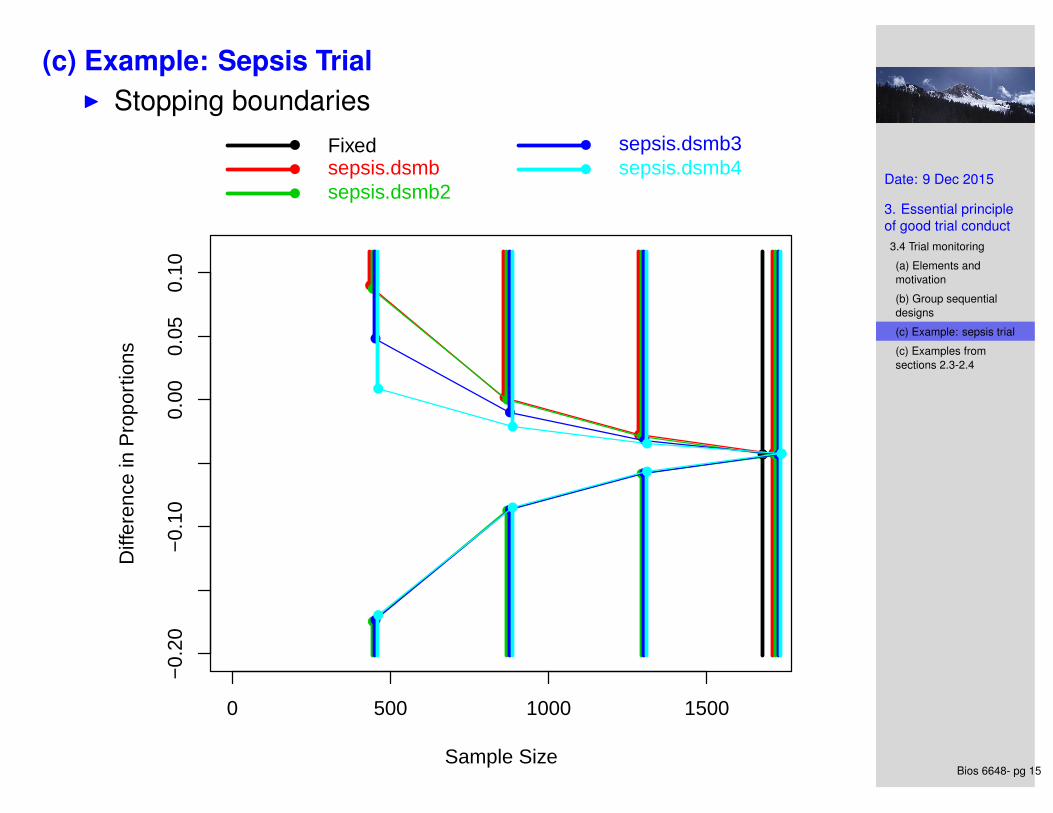
(c) Example: Sepsis TrialI Stopping boundaries
0 500 1000 1500
−0.
20−
0.10
0.00
0.05
0.10
Sample Size
Diff
eren
ce in
Pro
port
ions
● Fixed● sepsis.dsmb● sepsis.dsmb2
● sepsis.dsmb3● sepsis.dsmb4
●●●
●
●
●
●
●
●
●
●
●
●
●
●
●
●
●
●
●
●
●●
●
●
●
●
●
●
●●

Date: 9 Dec 2015
3. Essential principleof good trial conduct3.4 Trial monitoring
(a) Elements andmotivation
(b) Group sequentialdesigns
(c) Example: sepsis trial
(c) Examples fromsections 2.3-2.4
Bios 6648- pg 16
(c) Example: Sepsis Trial
I How to compare the properties of these designs:> seqPlotPower(sepsis.dsmb, sepsis.dsmb2,
sepsis.dsmb3, sepsis.dsmb4)> seqPlotPower(sepsis.dsmb, sepsis.dsmb2,
sepsis.dsmb3, sepsis.dsmb4,reference=sepsis.dsmb)
> seqPlotASN(sepsis.dsmb, sepsis.dsmb2,sepsis.dsmb3, sepsis.dsmb4)
> seqPlotInference(sepsis.dsmb2)> seqPlotInference(sepsis.dsmb3)> seqPlotInference(sepsis.dsmb4)
> seqPlotStopProb(sepsis.dsmb2)> seqPlotStopProb(sepsis.dsmb3)
> seqPlotStopProb(sepsis.dsmb4)

Date: 9 Dec 2015
3. Essential principleof good trial conduct3.4 Trial monitoring
(a) Elements andmotivation
(b) Group sequentialdesigns
(c) Example: sepsis trial
(c) Examples fromsections 2.3-2.4
Bios 6648- pg 17
(c) Example: Sepsis Trial
I Comparing power (adding futility-only stopping):
−0.08 −0.06 −0.04 −0.02 0.00
0.0
0.2
0.4
0.6
0.8
1.0
Difference in Proportions
Pow
er (
Low
er)
dsmb.fix sepsis.dsmb

Date: 9 Dec 2015
3. Essential principleof good trial conduct3.4 Trial monitoring
(a) Elements andmotivation
(b) Group sequentialdesigns
(c) Example: sepsis trial
(c) Examples fromsections 2.3-2.4
Bios 6648- pg 18
(c) Example: Sepsis Trial
I Comparing power (adding futility and efficacy stopping):
−0.08 −0.06 −0.04 −0.02 0.00
0.0
0.2
0.4
0.6
0.8
1.0
Difference in Proportions
Pow
er (
Low
er)
Fixedsepsis.dsmb
sepsis.dsmb2
Date: 9 Dec 2015
3. Essential principleof good trial conduct3.4 Trial monitoring
(a) Elements andmotivation
(b) Group sequentialdesigns
(c) Example: sepsis trial
(c) Examples fromsections 2.3-2.4
Bios 6648- pg 19
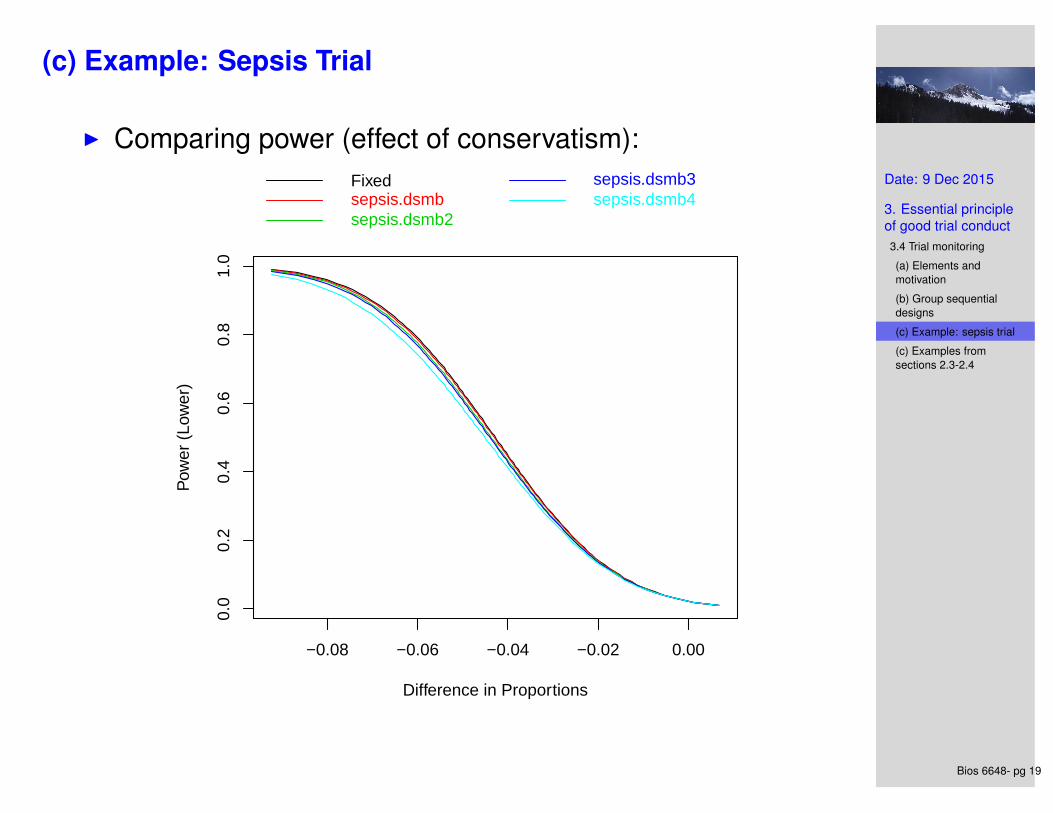
(c) Example: Sepsis Trial
I Comparing power (effect of conservatism):
−0.08 −0.06 −0.04 −0.02 0.00
0.0
0.2
0.4
0.6
0.8
1.0
Difference in Proportions
Pow
er (
Low
er)
Fixedsepsis.dsmbsepsis.dsmb2
sepsis.dsmb3sepsis.dsmb4

Date: 9 Dec 2015
3. Essential principleof good trial conduct3.4 Trial monitoring
(a) Elements andmotivation
(b) Group sequentialdesigns
(c) Example: sepsis trial
(c) Examples fromsections 2.3-2.4
Bios 6648- pg 20
(c) Example: Sepsis Trial
I Comparing power (sepsis.dsmb as reference):
−0.08 −0.06 −0.04 −0.02 0.00
−0.
04−
0.03
−0.
02−
0.01
0.00
Difference in Proportions
Rel
ativ
e P
ower
(Lo
wer
)sepsis.dsmbFixedsepsis.dsmb
sepsis.dsmb2sepsis.dsmb3sepsis.dsmb4

Date: 9 Dec 2015
3. Essential principleof good trial conduct3.4 Trial monitoring
(a) Elements andmotivation
(b) Group sequentialdesigns
(c) Example: sepsis trial
(c) Examples fromsections 2.3-2.4
Bios 6648- pg 21
(c) Example: Sepsis Trial
I Comparing expected sample size (ASN): addingfutility-only stopping:
−0.08 −0.04 0.00
1100
1300
1500
1700
Difference in Proportions
Sam
ple
Siz
e
Average Sample Size
dsmb.fixsepsis.dsmb
−0.08 −0.04 0.00
1100
1300
1500
1700
Difference in Proportions
Sam
ple
Siz
e
75th percentile
dsmb.fixsepsis.dsmb

Date: 9 Dec 2015
3. Essential principleof good trial conduct3.4 Trial monitoring
(a) Elements andmotivation
(b) Group sequentialdesigns
(c) Example: sepsis trial
(c) Examples fromsections 2.3-2.4
Bios 6648- pg 22
(c) Example: Sepsis Trial
I Comparing expected sample size (ASN): futility andefficacy stopping:
−0.08 −0.04 0.00
1200
1400
1600
1800
Difference in Proportions
Sam
ple
Siz
e
Average Sample Size
Fixedsepsis.dsmbsepsis.dsmb2
−0.08 −0.04 0.00
1200
1400
1600
1800
Difference in Proportions
Sam
ple
Siz
e
75th percentile
Fixedsepsis.dsmbsepsis.dsmb2
Date: 9 Dec 2015
3. Essential principleof good trial conduct3.4 Trial monitoring
(a) Elements andmotivation
(b) Group sequentialdesigns
(c) Example: sepsis trial
(c) Examples fromsections 2.3-2.4
Bios 6648- pg 23
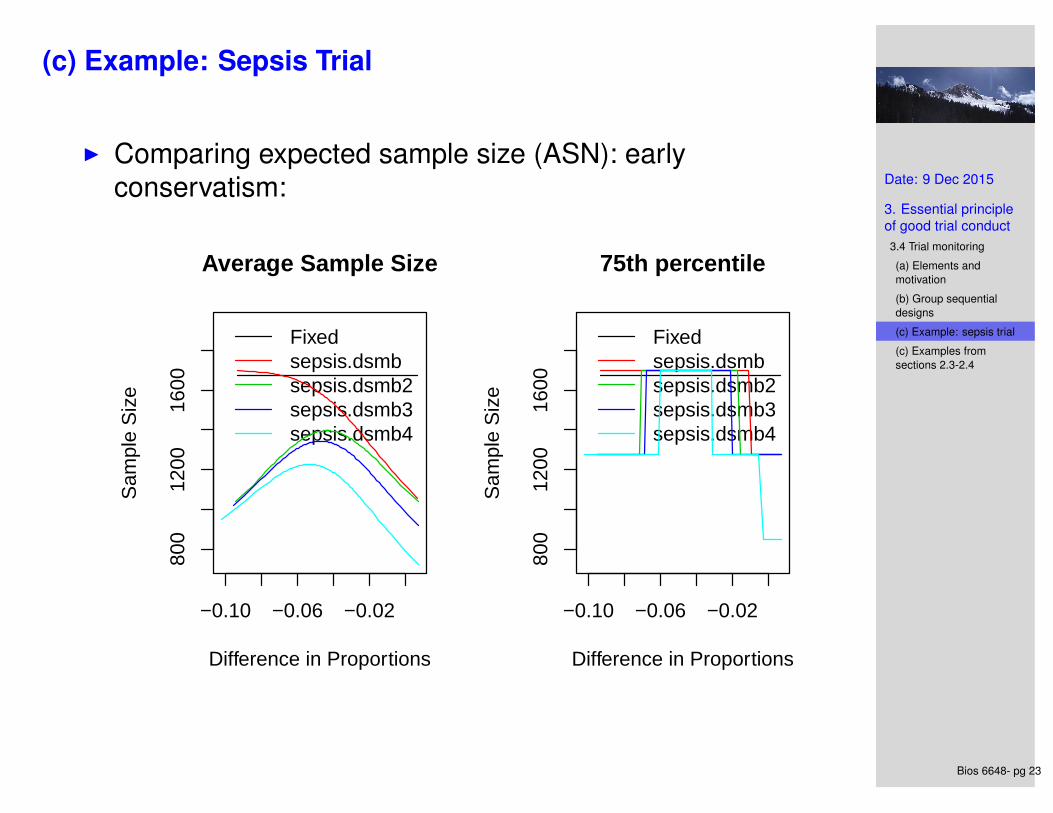
(c) Example: Sepsis Trial
I Comparing expected sample size (ASN): earlyconservatism:
−0.10 −0.06 −0.02
800
1200
1600
Difference in Proportions
Sam
ple
Siz
e
Average Sample Size
Fixedsepsis.dsmbsepsis.dsmb2sepsis.dsmb3sepsis.dsmb4
−0.10 −0.06 −0.02
800
1200
1600
Difference in Proportions
Sam
ple
Siz
e
75th percentile
Fixedsepsis.dsmbsepsis.dsmb2sepsis.dsmb3sepsis.dsmb4
Date: 9 Dec 2015
3. Essential principleof good trial conduct3.4 Trial monitoring
(a) Elements andmotivation
(b) Group sequentialdesigns
(c) Example: sepsis trial
(c) Examples fromsections 2.3-2.4
Bios 6648- pg 24
Some general patterns
I Decreasing early conservatism gave smaller ASN forunimportant benefits.
I Decreasing early conservatism also reduces power forefficacy.

Date: 9 Dec 2015
3. Essential principleof good trial conduct3.4 Trial monitoring
(a) Elements andmotivation
(b) Group sequentialdesigns
(c) Example: sepsis trial
(c) Examples fromsections 2.3-2.4
Bios 6648- pg 25
General behavior of interim analyses
I For any given sample size, adding interim analysesreduces power.
I For any given power, adding interim analyses increasesthe sample size.
I Having fewer interim analyses:I Leads to properties (maximal sample size, power, etc) that
are closer to those of a fixed sample study.I However, ASN may be larger and stopping probabilities
lower.I Having more early conservatism:
I Leads to properties (maximal sample size, power, etc) thatare closer to those of a fixed sample study.
I However, ASN may be larger and stopping probabilitieslower.
Date: 9 Dec 2015
3. Essential principleof good trial conduct3.4 Trial monitoring
(a) Elements andmotivation
(b) Group sequentialdesigns
(c) Example: sepsis trial
(c) Examples fromsections 2.3-2.4
Bios 6648- pg 26
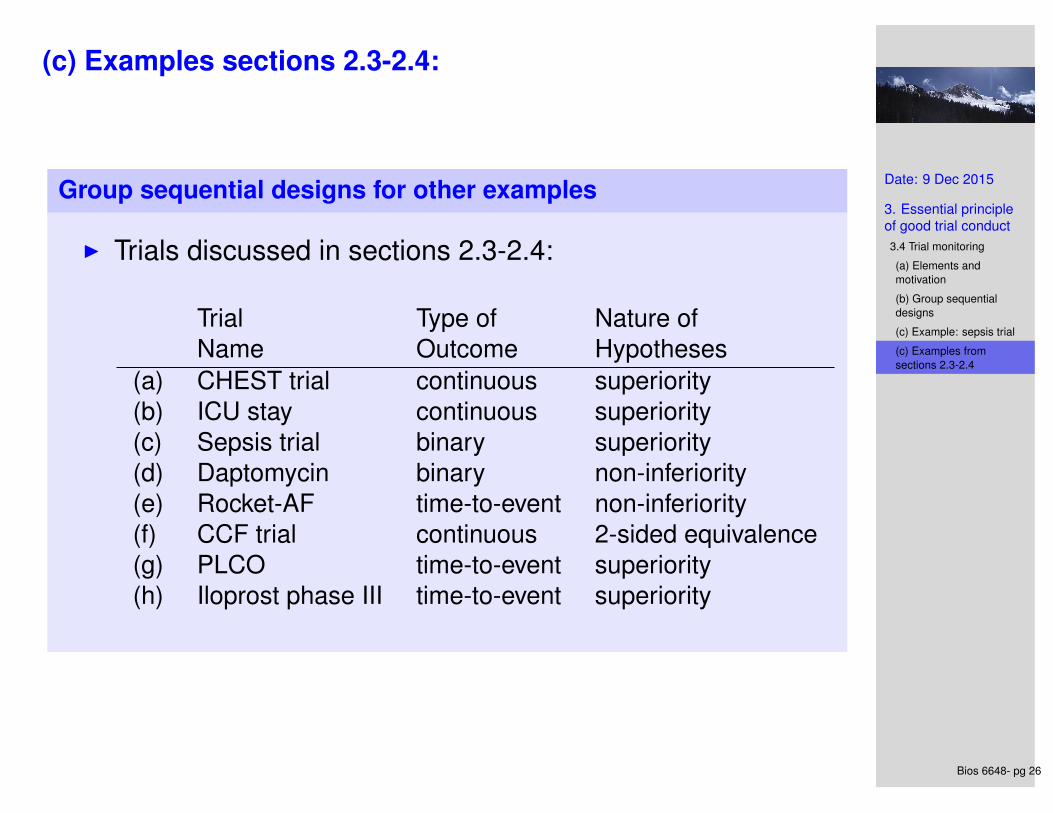
(c) Examples sections 2.3-2.4:
Group sequential designs for other examples
I Trials discussed in sections 2.3-2.4:
Trial Type of Nature ofName Outcome Hypotheses
(a) CHEST trial continuous superiority(b) ICU stay continuous superiority(c) Sepsis trial binary superiority(d) Daptomycin binary non-inferiority(e) Rocket-AF time-to-event non-inferiority(f) CCF trial continuous 2-sided equivalence(g) PLCO time-to-event superiority(h) Iloprost phase III time-to-event superiority
Date: 9 Dec 2015
3. Essential principleof good trial conduct3.4 Trial monitoring
(a) Elements andmotivation
(b) Group sequentialdesigns
(c) Example: sepsis trial
(c) Examples fromsections 2.3-2.4
Bios 6648- pg 27
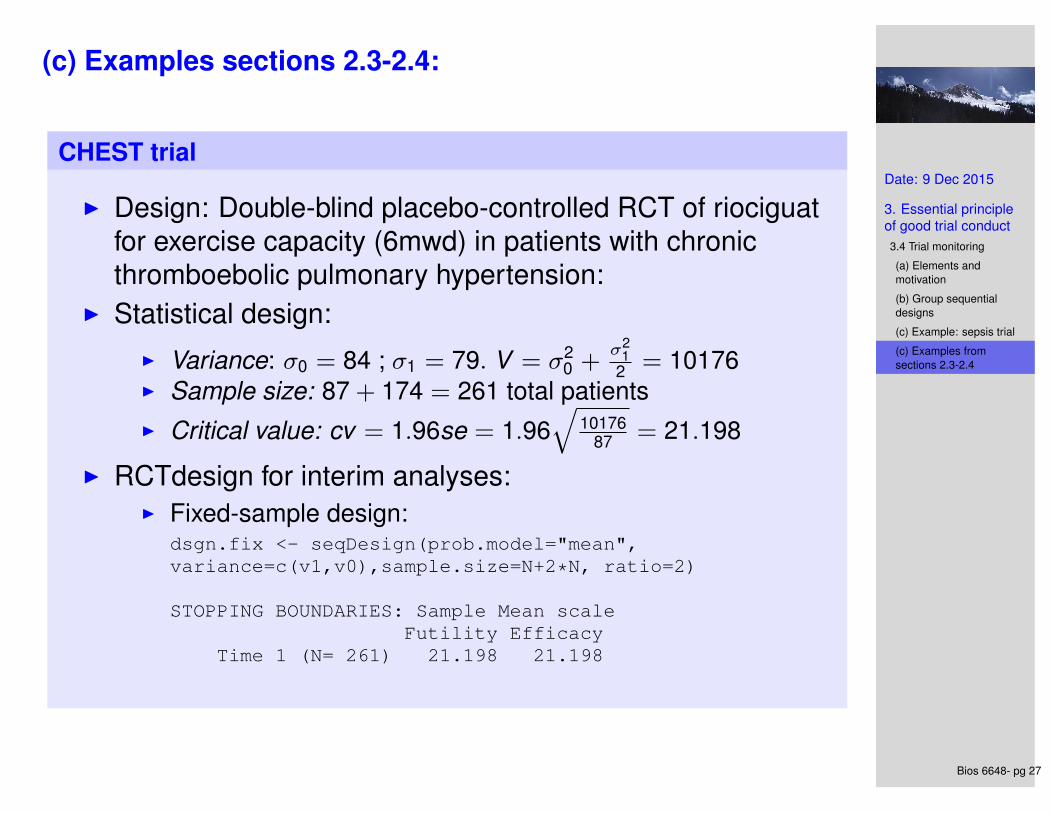
(c) Examples sections 2.3-2.4:
CHEST trial
I Design: Double-blind placebo-controlled RCT of riociguatfor exercise capacity (6mwd) in patients with chronicthromboebolic pulmonary hypertension:
I Statistical design:I Variance: σ0 = 84 ; σ1 = 79. V = σ2
0 +σ2
12 = 10176
I Sample size: 87 + 174 = 261 total patientsI Critical value: cv = 1.96se = 1.96
√10176
87 = 21.198
I RCTdesign for interim analyses:I Fixed-sample design:
dsgn.fix <- seqDesign(prob.model="mean",variance=c(v1,v0),sample.size=N+2*N, ratio=2)
STOPPING BOUNDARIES: Sample Mean scaleFutility Efficacy
Time 1 (N= 261) 21.198 21.198

Date: 9 Dec 2015
3. Essential principleof good trial conduct3.4 Trial monitoring
(a) Elements andmotivation
(b) Group sequentialdesigns
(c) Example: sepsis trial
(c) Examples fromsections 2.3-2.4
Bios 6648- pg 28
(c) Examples sections 2.3-2.4:
CHEST trial
I Group sequential design:dsgn.ia <- update(dsgn.fix,nbr.analyses=2)STOPPING BOUNDARIES: Sample Mean scale
Futility EfficacyTime 1 (N= 130.5) 0.000 42.669Time 2 (N= 261.0) 21.334 21.334
I Design evaluation;seqPlotInference(dsgn.ia)seqPlotPower(dsgn.ia,reference=T)seqPlotASN(dsgn.ia,prob=NULL)seqPlotStopProb(dsgn.ia)
I Other potential interim analysis plans;dsgn.iaA <- update(dsgn.fix,nbr.analyses=2,P=c(0.8,1.0))dsgn.iaB <- update(dsgn.fix,nbr.analyses=2,early.stopping="null")dsgn.iaB <- update(dsgn.fix,nbr.analyses=2,P=c(1,Inf))dsgn.iaC <- update(dsgn.fix,nbr.analyses=2,P=c(0.8,Inf))
Date: 9 Dec 2015
3. Essential principleof good trial conduct3.4 Trial monitoring
(a) Elements andmotivation
(b) Group sequentialdesigns
(c) Example: sepsis trial
(c) Examples fromsections 2.3-2.4
Bios 6648- pg 29
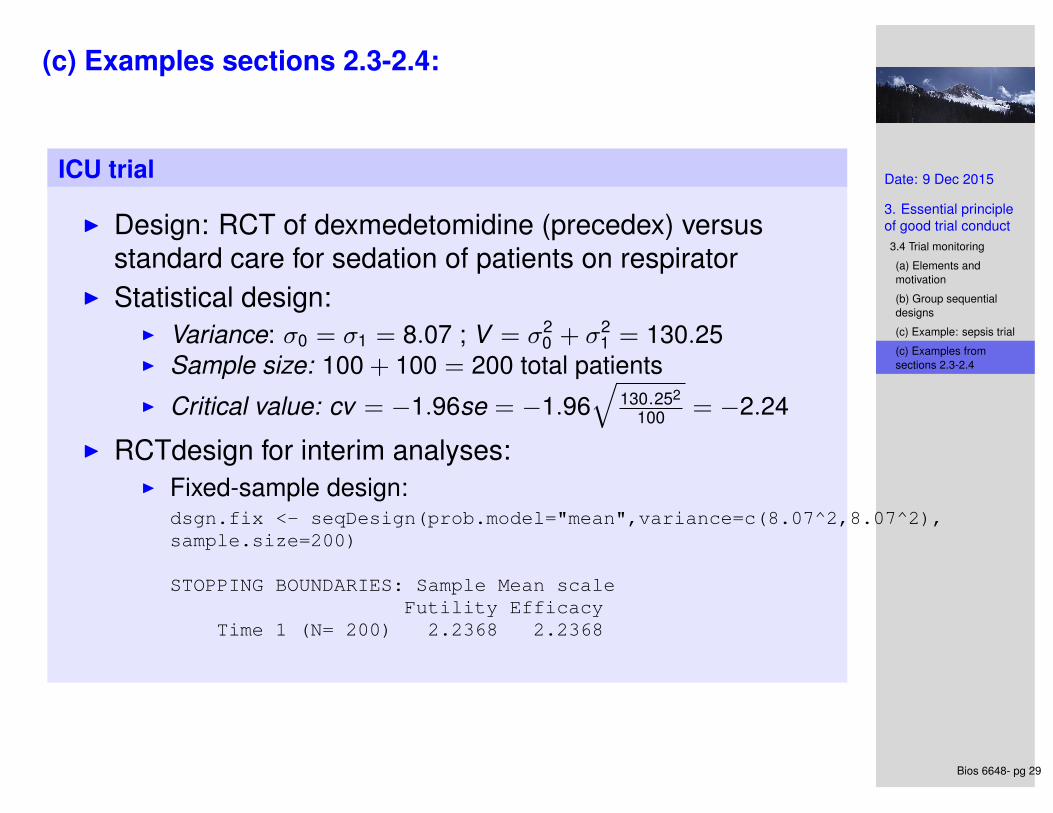
(c) Examples sections 2.3-2.4:
ICU trial
I Design: RCT of dexmedetomidine (precedex) versusstandard care for sedation of patients on respirator
I Statistical design:I Variance: σ0 = σ1 = 8.07 ; V = σ2
0 + σ21 = 130.25
I Sample size: 100 + 100 = 200 total patientsI Critical value: cv = −1.96se = −1.96
√130.252
100 = −2.24
I RCTdesign for interim analyses:I Fixed-sample design:
dsgn.fix <- seqDesign(prob.model="mean",variance=c(8.07^2,8.07^2),sample.size=200)
STOPPING BOUNDARIES: Sample Mean scaleFutility Efficacy
Time 1 (N= 200) 2.2368 2.2368

Date: 9 Dec 2015
3. Essential principleof good trial conduct3.4 Trial monitoring
(a) Elements andmotivation
(b) Group sequentialdesigns
(c) Example: sepsis trial
(c) Examples fromsections 2.3-2.4
Bios 6648- pg 30
(c) Examples sections 2.3-2.4:
ICU trial
I Group sequential design:dsgn.ia <- update(dsgn.fix,nbr.analyses=2)STOPPING BOUNDARIES: Sample Mean scale
Futility EfficacyTime 1 (N= 100) 0.0000 4.5026Time 2 (N= 200) 2.2513 2.2513
I Design evaluation;seqPlotInference(dsgn.ia)seqPlotPower(dsgn.ia,reference=T)seqPlotASN(dsgn.ia,prob=NULL)seqPlotStopProb(dsgn.ia)
I Other potential interim analysis plans;dsgn.iaA <- update(dsgn.fix,nbr.analyses=2,P=c(0.8,1.0))dsgn.iaB <- update(dsgn.fix,nbr.analyses=2,early.stopping="null")dsgn.iaB <- update(dsgn.fix,nbr.analyses=2,P=c(1,Inf))dsgn.iaC <- update(dsgn.fix,nbr.analyses=2,P=c(0.8,Inf))

Date: 9 Dec 2015
3. Essential principleof good trial conduct3.4 Trial monitoring
(a) Elements andmotivation
(b) Group sequentialdesigns
(c) Example: sepsis trial
(c) Examples fromsections 2.3-2.4
Bios 6648- pg 31
(c) Examples sections 2.3-2.4:
Daptomycin trial
I Design: RCT of daptomycin versus standard care fortreatment of S. aureus bacteremia and endocarditis
I Statistical design:I Variance: θ0(1− θ0) + θ1(1− θ1) ;
V ≈ 0.65× 0.35× 2 = 0.455I Sample size: 90 + 90 = 180 total patientsI Critical value (for superiority):
cv = 1.96se = 1.96√
0.45590 = 0.139
I RCTdesign for interim analyses:I Fixed-sample design:
dsgn.fix <- seqDesign(prob.model="proportions",test.type="equivalence",null.hypo=c(p0,p0),alt.hypo=c(p1,p0),variance="null",sample.size=N*2,power="calculate")PROBABILITY MODEL and HYPOTHESES:
Theta is difference in probabilities (Treatment - Comparison)Equivalence test:
Lower hypothesis : Theta <= -0.1394 (size = 0.025)Upper hypothesis : Theta >= 0.1394 (size = 0.025)
(Fixed sample test)
STOPPING BOUNDARIES: Sample Mean scalea d
Time 1 (N= 180) 0 0

Date: 9 Dec 2015
3. Essential principleof good trial conduct3.4 Trial monitoring
(a) Elements andmotivation
(b) Group sequentialdesigns
(c) Example: sepsis trial
(c) Examples fromsections 2.3-2.4
Bios 6648- pg 32
(c) Examples sections 2.3-2.4:
Daptomycin trial
I Group sequential design:dsgn.ia <- update(dsgn.fix,nbr.analyses=2)
PROBABILITY MODEL and HYPOTHESES:Theta is difference in probabilities (Treatment - Comparison)Equivalence test:
Lower hypothesis : Theta <= -0.1403 (size = 0.025)Upper hypothesis : Theta >= 0.1403 (size = 0.025)
STOPPING BOUNDARIES: Sample Mean scalea d
Time 1 (N= 90) -0.1403 0.1403Time 2 (N= 180) 0.0000 0.0000
I Other potential interim analysis plans;dsgn.ia0.5 <- update(dsgn.fix,nbr.analyses=2,P=0.5)
I Design evaluation;seqPlotInference(dsgn.ia,dsgn.ia0.5)seqPlotPower(dsgn.ia,dsgn.ia.0.5reference=T)seqPlotASN(dsgn.ia,dsgn.ia0.5,prob=NULL)seqPlotStopProb(dsgn.ia)

Date: 9 Dec 2015
3. Essential principleof good trial conduct3.4 Trial monitoring
(a) Elements andmotivation
(b) Group sequentialdesigns
(c) Example: sepsis trial
(c) Examples fromsections 2.3-2.4
Bios 6648- pg 33
(c) Examples sections 2.3-2.4:
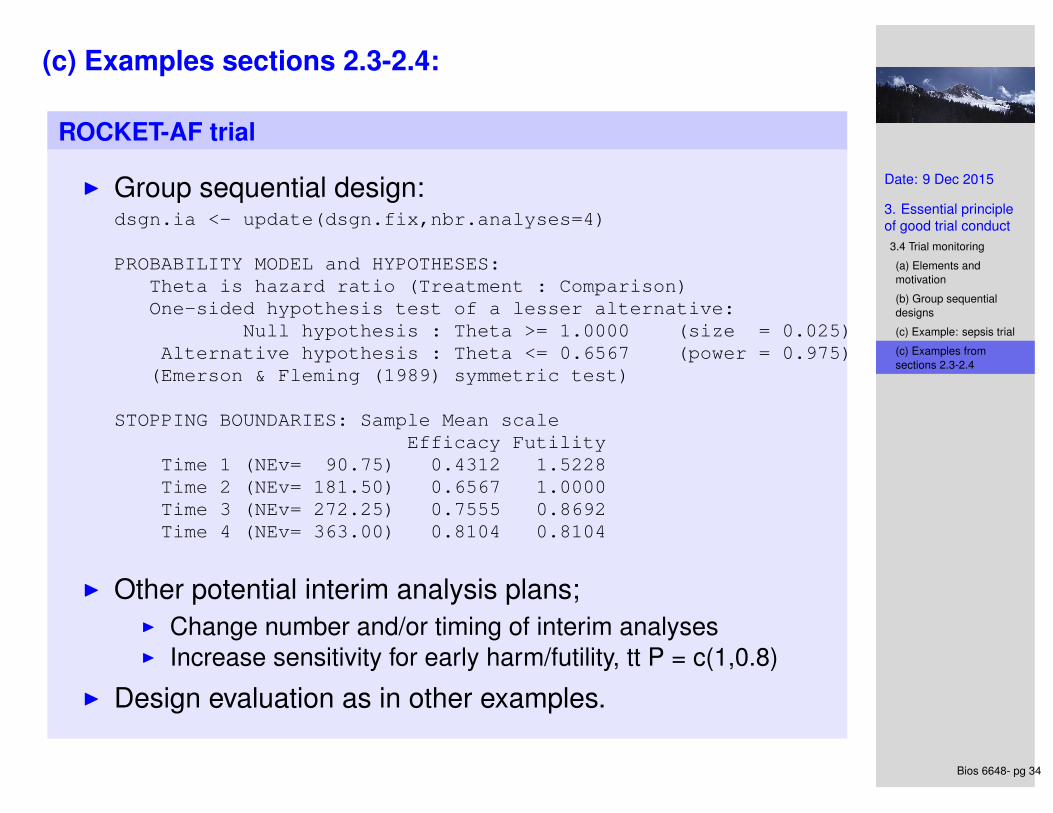
ROCKET-AF trial
I Design: RCT of rivaroxaban versus warfarin for preventionstroke or systemic embolism in patients with non-valvularatrial fibrillation.
I Statistical design:I Variance: The primary endpoint is time to event, so V = 4.I Sample size: D = 363 events.I Critical value (for superiority):
cv = e1.96se = e1.96√
4363 = 0.8104
I RCTdesign for interim analyses:I Fixed-sample design:
dsgn.fix <- seqDesign(prob.model="hazard",sample.size=363,test.type="less")
PROBABILITY MODEL and HYPOTHESES:Theta is hazard ratio (Treatment : Comparison)One-sided hypothesis test of a lesser alternative:
Null hypothesis : Theta >= 1.0000 (size = 0.025)Alternative hypothesis : Theta <= 0.6627 (power = 0.975)(Fixed sample test)
STOPPING BOUNDARIES: Sample Mean scaleEfficacy Futility
Time 1 (NEv= 363) 0.814 0.814
Date: 9 Dec 2015
3. Essential principleof good trial conduct3.4 Trial monitoring
(a) Elements andmotivation
(b) Group sequentialdesigns
(c) Example: sepsis trial
(c) Examples fromsections 2.3-2.4
Bios 6648- pg 34
(c) Examples sections 2.3-2.4:
ROCKET-AF trial
I Group sequential design:dsgn.ia <- update(dsgn.fix,nbr.analyses=4)
PROBABILITY MODEL and HYPOTHESES:Theta is hazard ratio (Treatment : Comparison)One-sided hypothesis test of a lesser alternative:
Null hypothesis : Theta >= 1.0000 (size = 0.025)Alternative hypothesis : Theta <= 0.6567 (power = 0.975)
(Emerson & Fleming (1989) symmetric test)
STOPPING BOUNDARIES: Sample Mean scaleEfficacy Futility
Time 1 (NEv= 90.75) 0.4312 1.5228Time 2 (NEv= 181.50) 0.6567 1.0000Time 3 (NEv= 272.25) 0.7555 0.8692Time 4 (NEv= 363.00) 0.8104 0.8104
I Other potential interim analysis plans;I Change number and/or timing of interim analysesI Increase sensitivity for early harm/futility, tt P = c(1,0.8)
I Design evaluation as in other examples.
Date: 9 Dec 2015
3. Essential principleof good trial conduct3.4 Trial monitoring
(a) Elements andmotivation
(b) Group sequentialdesigns
(c) Example: sepsis trial
(c) Examples fromsections 2.3-2.4
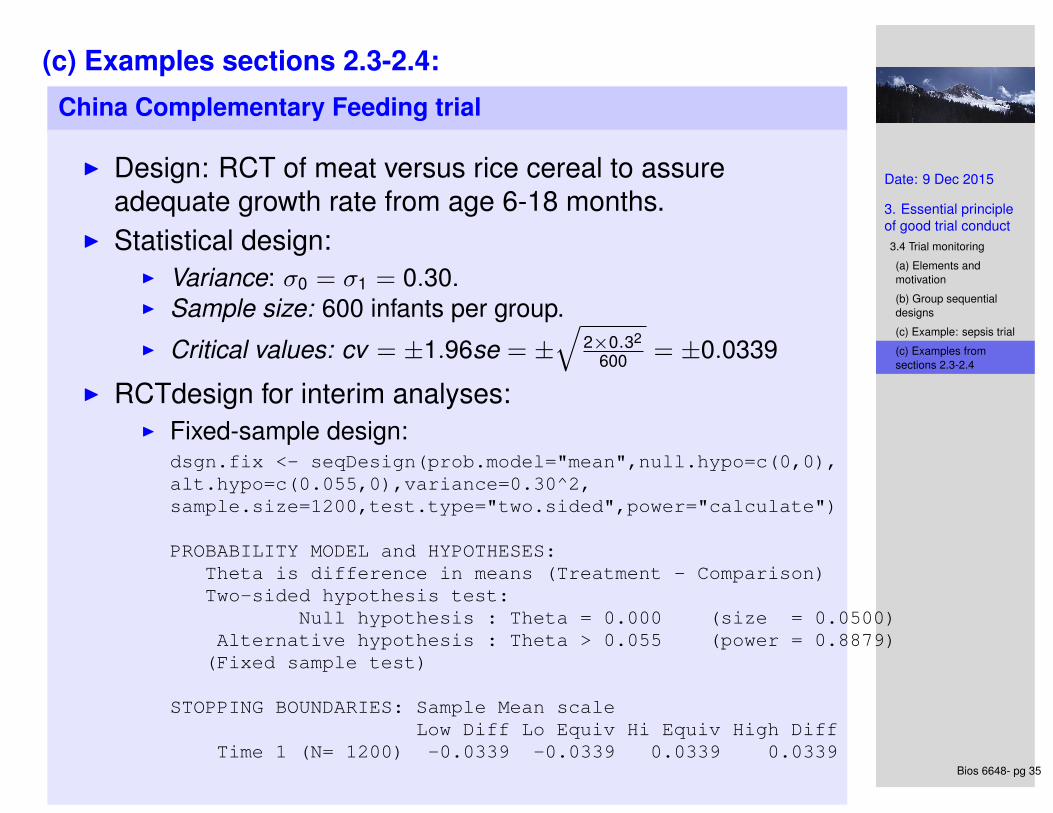
Bios 6648- pg 35
(c) Examples sections 2.3-2.4:
China Complementary Feeding trial
I Design: RCT of meat versus rice cereal to assureadequate growth rate from age 6-18 months.
I Statistical design:I Variance: σ0 = σ1 = 0.30.I Sample size: 600 infants per group.I Critical values: cv = ±1.96se = ±
√2×0.32
600 = ±0.0339
I RCTdesign for interim analyses:I Fixed-sample design:
dsgn.fix <- seqDesign(prob.model="mean",null.hypo=c(0,0),alt.hypo=c(0.055,0),variance=0.30^2,sample.size=1200,test.type="two.sided",power="calculate")
PROBABILITY MODEL and HYPOTHESES:Theta is difference in means (Treatment - Comparison)Two-sided hypothesis test:
Null hypothesis : Theta = 0.000 (size = 0.0500)Alternative hypothesis : Theta > 0.055 (power = 0.8879)(Fixed sample test)
STOPPING BOUNDARIES: Sample Mean scaleLow Diff Lo Equiv Hi Equiv High Diff
Time 1 (N= 1200) -0.0339 -0.0339 0.0339 0.0339
Date: 9 Dec 2015
3. Essential principleof good trial conduct3.4 Trial monitoring
(a) Elements andmotivation
(b) Group sequentialdesigns
(c) Example: sepsis trial
(c) Examples fromsections 2.3-2.4
Bios 6648- pg 36
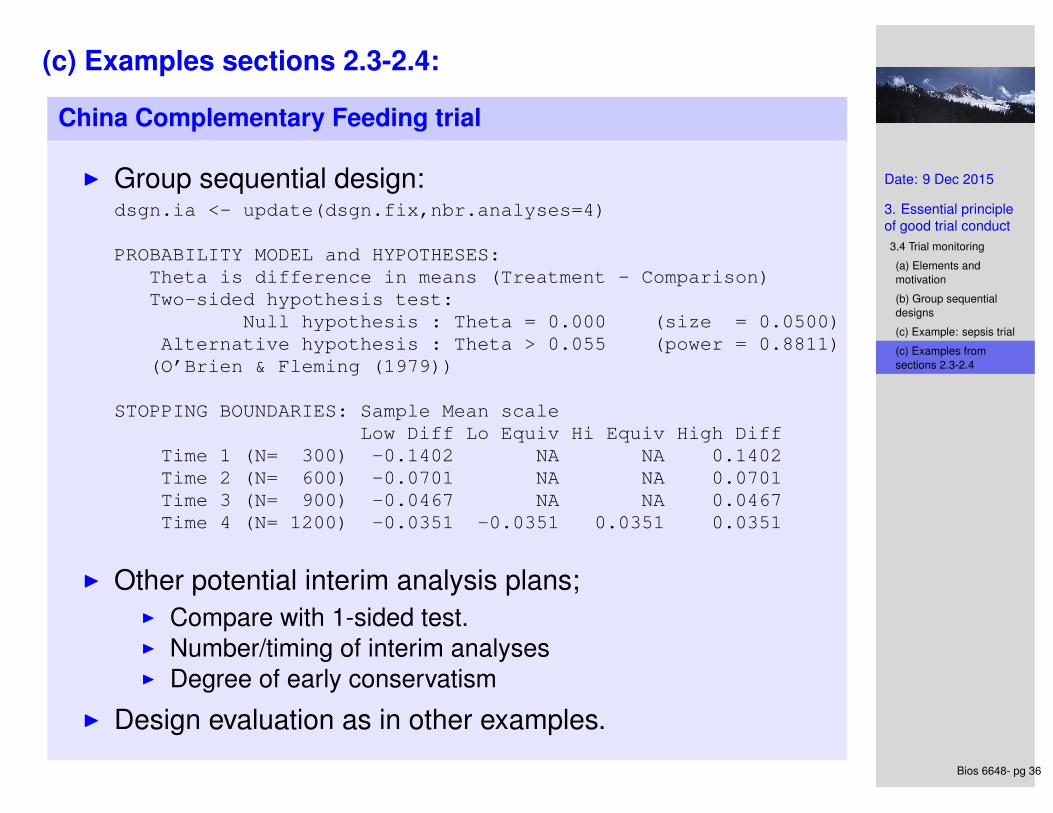
(c) Examples sections 2.3-2.4:
China Complementary Feeding trial
I Group sequential design:dsgn.ia <- update(dsgn.fix,nbr.analyses=4)
PROBABILITY MODEL and HYPOTHESES:Theta is difference in means (Treatment - Comparison)Two-sided hypothesis test:
Null hypothesis : Theta = 0.000 (size = 0.0500)Alternative hypothesis : Theta > 0.055 (power = 0.8811)
(O’Brien & Fleming (1979))
STOPPING BOUNDARIES: Sample Mean scaleLow Diff Lo Equiv Hi Equiv High Diff
Time 1 (N= 300) -0.1402 NA NA 0.1402Time 2 (N= 600) -0.0701 NA NA 0.0701Time 3 (N= 900) -0.0467 NA NA 0.0467Time 4 (N= 1200) -0.0351 -0.0351 0.0351 0.0351
I Other potential interim analysis plans;I Compare with 1-sided test.I Number/timing of interim analysesI Degree of early conservatism
I Design evaluation as in other examples.
Date: 9 Dec 2015
3. Essential principleof good trial conduct3.4 Trial monitoring
(a) Elements andmotivation
(b) Group sequentialdesigns
(c) Example: sepsis trial
(c) Examples fromsections 2.3-2.4
Bios 6648- pg 37
(c) Examples sections 2.3-2.4:
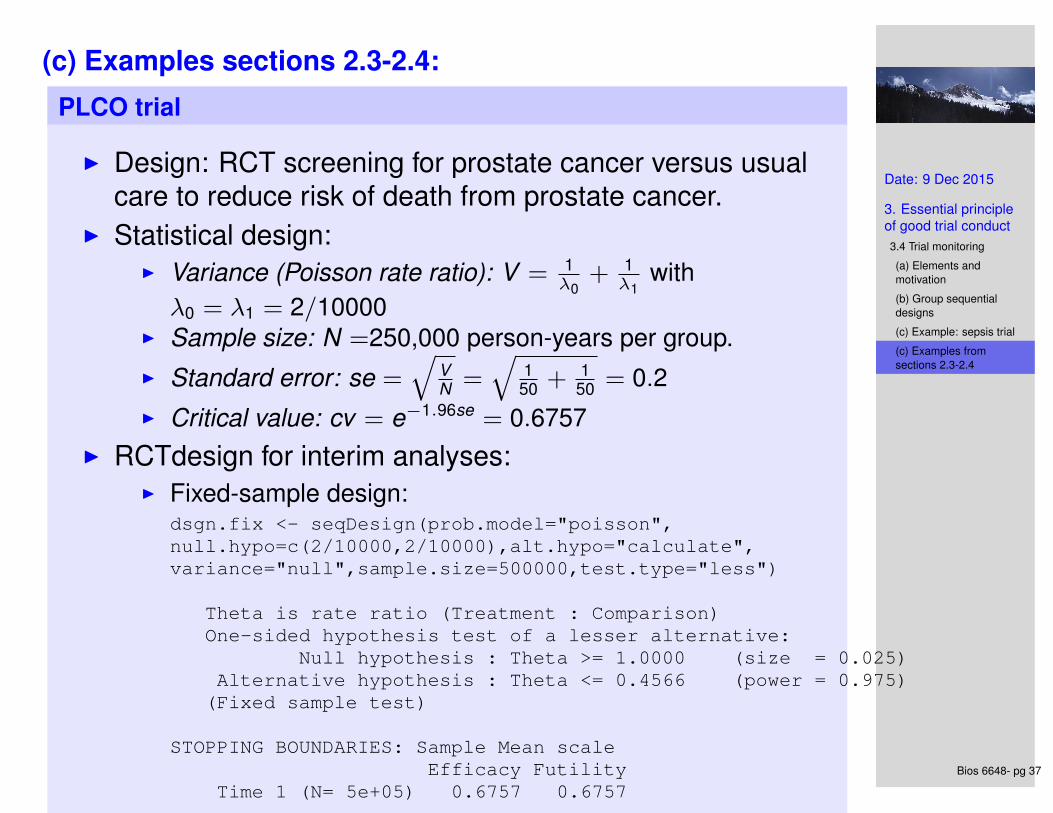
PLCO trial
I Design: RCT screening for prostate cancer versus usualcare to reduce risk of death from prostate cancer.
I Statistical design:I Variance (Poisson rate ratio): V = 1
λ0+ 1
λ1with
λ0 = λ1 = 2/10000I Sample size: N =250,000 person-years per group.I Standard error: se =
√VN =
√1
50 + 150 = 0.2
I Critical value: cv = e−1.96se = 0.6757I RCTdesign for interim analyses:
I Fixed-sample design:dsgn.fix <- seqDesign(prob.model="poisson",null.hypo=c(2/10000,2/10000),alt.hypo="calculate",variance="null",sample.size=500000,test.type="less")
Theta is rate ratio (Treatment : Comparison)One-sided hypothesis test of a lesser alternative:
Null hypothesis : Theta >= 1.0000 (size = 0.025)Alternative hypothesis : Theta <= 0.4566 (power = 0.975)(Fixed sample test)
STOPPING BOUNDARIES: Sample Mean scaleEfficacy Futility
Time 1 (N= 5e+05) 0.6757 0.6757
Date: 9 Dec 2015
3. Essential principleof good trial conduct3.4 Trial monitoring
(a) Elements andmotivation
(b) Group sequentialdesigns
(c) Example: sepsis trial
(c) Examples fromsections 2.3-2.4
Bios 6648- pg 38
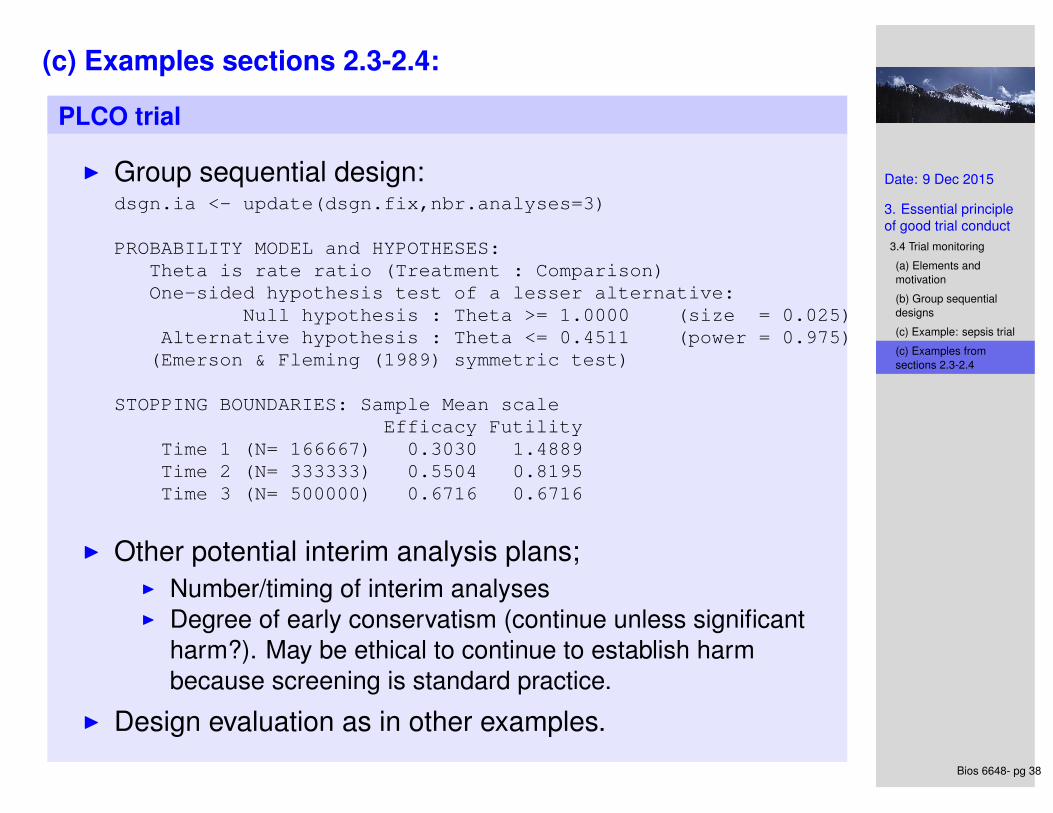
(c) Examples sections 2.3-2.4:
PLCO trial
I Group sequential design:dsgn.ia <- update(dsgn.fix,nbr.analyses=3)
PROBABILITY MODEL and HYPOTHESES:Theta is rate ratio (Treatment : Comparison)One-sided hypothesis test of a lesser alternative:
Null hypothesis : Theta >= 1.0000 (size = 0.025)Alternative hypothesis : Theta <= 0.4511 (power = 0.975)
(Emerson & Fleming (1989) symmetric test)
STOPPING BOUNDARIES: Sample Mean scaleEfficacy Futility
Time 1 (N= 166667) 0.3030 1.4889Time 2 (N= 333333) 0.5504 0.8195Time 3 (N= 500000) 0.6716 0.6716
I Other potential interim analysis plans;I Number/timing of interim analysesI Degree of early conservatism (continue unless significant
harm?). May be ethical to continue to establish harmbecause screening is standard practice.
I Design evaluation as in other examples.

Date: 9 Dec 2015
3. Essential principleof good trial conduct3.4 Trial monitoring
(a) Elements andmotivation
(b) Group sequentialdesigns
(c) Example: sepsis trial
(c) Examples fromsections 2.3-2.4
Bios 6648- pg 39
(c) Examples sections 2.3-2.4:
Iloprost phase III trial
I Design: Double-blind placebo-controlled RCT of iloprostfor prevention of lung cancer in patients with resectedstage 1 lung cancer.
I Statistical design:I Variance (hazard ratio): V = 4I Sample size: D = 160I Critical value: cv = e−1.96
√4
160 = 0.7335I RCTdesign for interim analyses:
I Fixed-sample design:dsgn.fix <- seqDesign(prob.model="hazard",sample.size=160,test.type="less")
PROBABILITY MODEL and HYPOTHESES:Theta is hazard ratio (Treatment : Comparison)One-sided hypothesis test of a lesser alternative:
Null hypothesis : Theta >= 1.0000 (size = 0.025)Alternative hypothesis : Theta <= 0.5381 (power = 0.975)(Fixed sample test)
STOPPING BOUNDARIES: Sample Mean scaleEfficacy Futility
Time 1 (NEv= 160) 0.7335 0.7335
Date: 9 Dec 2015
3. Essential principleof good trial conduct3.4 Trial monitoring
(a) Elements andmotivation
(b) Group sequentialdesigns
(c) Example: sepsis trial
(c) Examples fromsections 2.3-2.4
Bios 6648- pg 40
(c) Examples sections 2.3-2.4:
Iloprost phase III trial
I Group sequential design:dsgn.ia <- update(dsgn.fix,nbr.analyses=5)
PROBABILITY MODEL and HYPOTHESES:Theta is hazard ratio (Treatment : Comparison)One-sided hypothesis test of a lesser alternative:
Null hypothesis : Theta >= 1.000 (size = 0.025)Alternative hypothesis : Theta <= 0.529 (power = 0.975)
(Emerson & Fleming (1989) symmetric test)
STOPPING BOUNDARIES: Sample Mean scaleEfficacy Futility
Time 1 (NEv= 32) 0.2036 2.5988Time 2 (NEv= 64) 0.4512 1.1725Time 3 (NEv= 96) 0.5883 0.8993Time 4 (NEv= 128) 0.6717 0.7876Time 5 (NEv= 160) 0.7273 0.7273
I Other potential interim analysis plans;I Number/timing of interim analysesI Degree of early conservatism (allow sensitivity for early
futility?).I Design evaluation as in other examples.