Embed Size (px)
Citation preview
BioQUEST / SCALE-IT Module
From Omics Data to Knowledge Case 1: Microarrays
Namyong Lee Minnesota State University, Mankato
Matthew Macauley Clemson University
Sumona Mondal Clarkson University
Fusheng Tang University of Arkansas, Little Rock
Goals
Provide a guideline for teachers in different disciplines to explore different -omics data.
The instructor will guide the students through a tutorial of the experimental process, including: data retrieval, statistical design and analysis, biological analysis, and model validation.
Module Outline
1. Introduce Microarray and RNAseq technology.
2. Locate available public expression data
3. Formulate questions from the dataset.
4. Design computational and statistical experiments.
5. Interpret biological significance of identified genes. (UniProt, IntAct, and Reactome will be used.)
6. Validate the biological model (using ATLAS).
Step 1: Introduce gene expression and microarray and RNAseq technology.
How is gene expression measured?
Introduce microarrays and RNAseq. Compare and contrast these two.
What is gene expression?
Step 2: Locate available public expression data
ArrayExpress is a database of gene expression and other microarray data at the European Bioinformatics Institute (EBI)
www.ebi.ac.uk/arrayexpress/
6
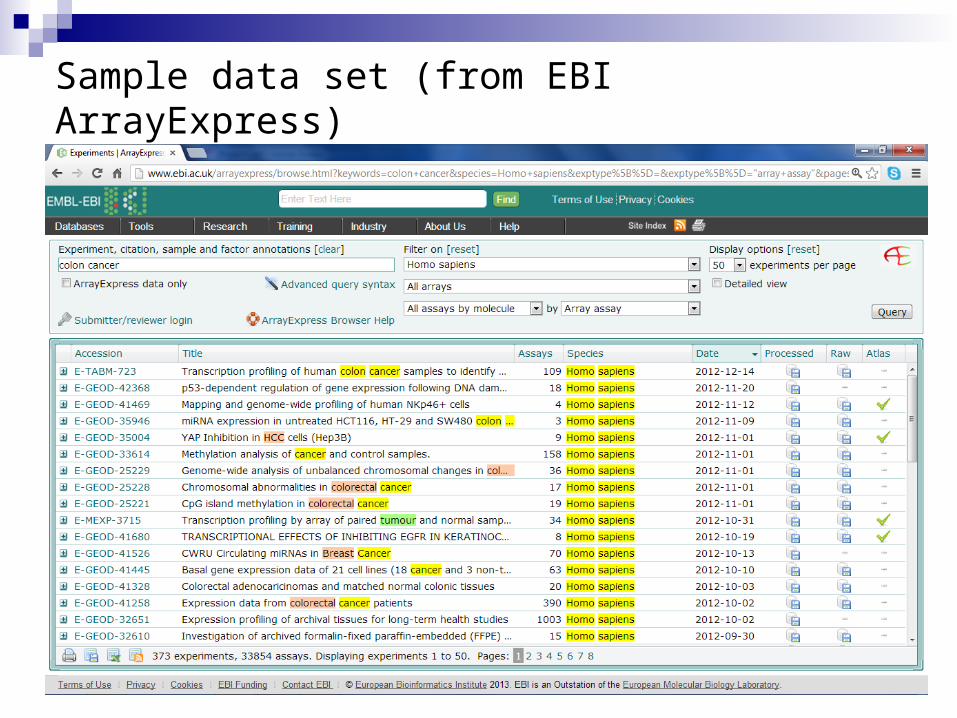
Sample data set (from EBI ArrayExpress)
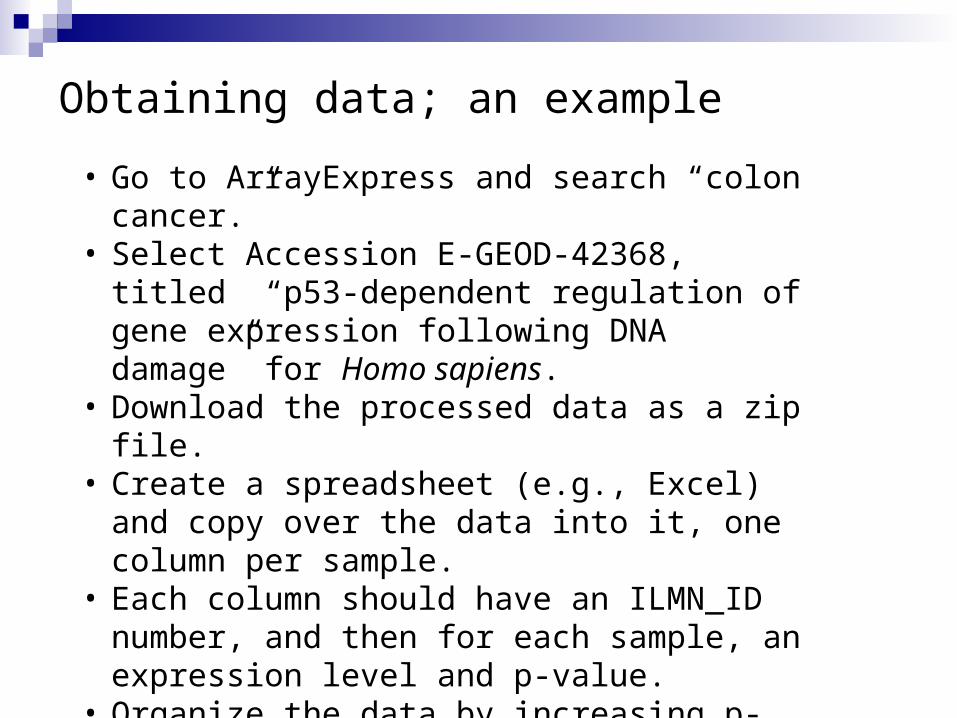
Obtaining data; an example
• Go to ArrayExpress and search “colon cancer.”• Select Accession E-GEOD-42368, titled “p53-
dependent regulation of gene expression following DNA damage” for Homo sapiens.
• Download the processed data as a zip file. • Create a spreadsheet (e.g., Excel) and copy over
the data into it, one column per sample. • Each column should have an ILMN_ID number,
and then for each sample, an expression level and p-value.
• Organize the data by increasing p-values.• Use david.abcc.ncifcrf.gov/ to locate gene
names from ILMN_IDs.
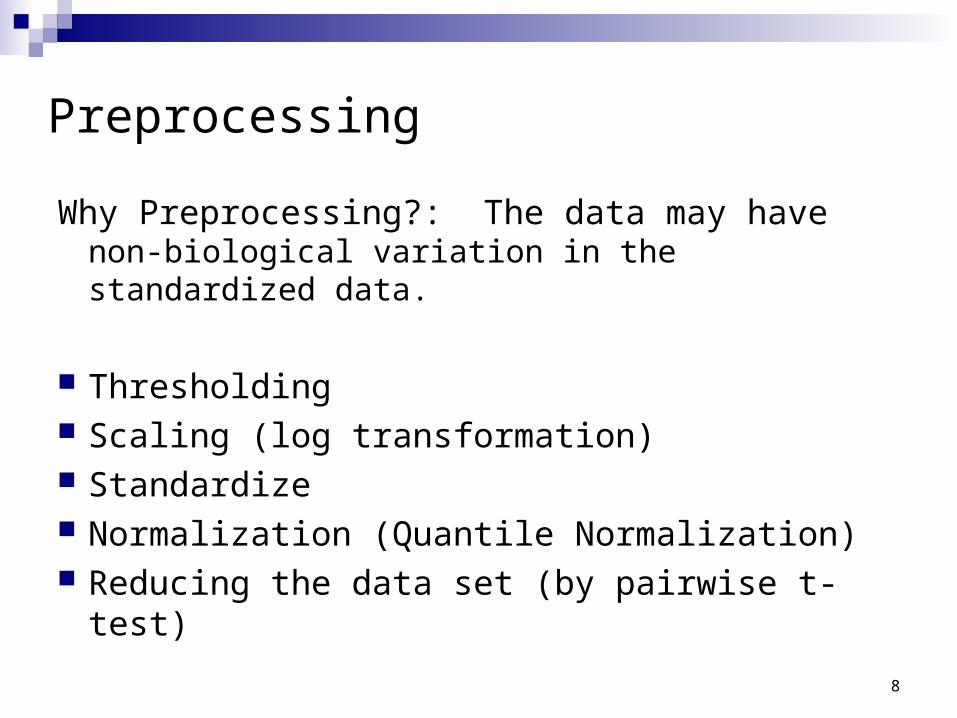
Preprocessing
Why Preprocessing?: The data may have non-biological variation in the standardized data.
Thresholding Scaling (log transformation) Standardize Normalization (Quantile Normalization) Reducing the data set (by pairwise t-test)
8
9
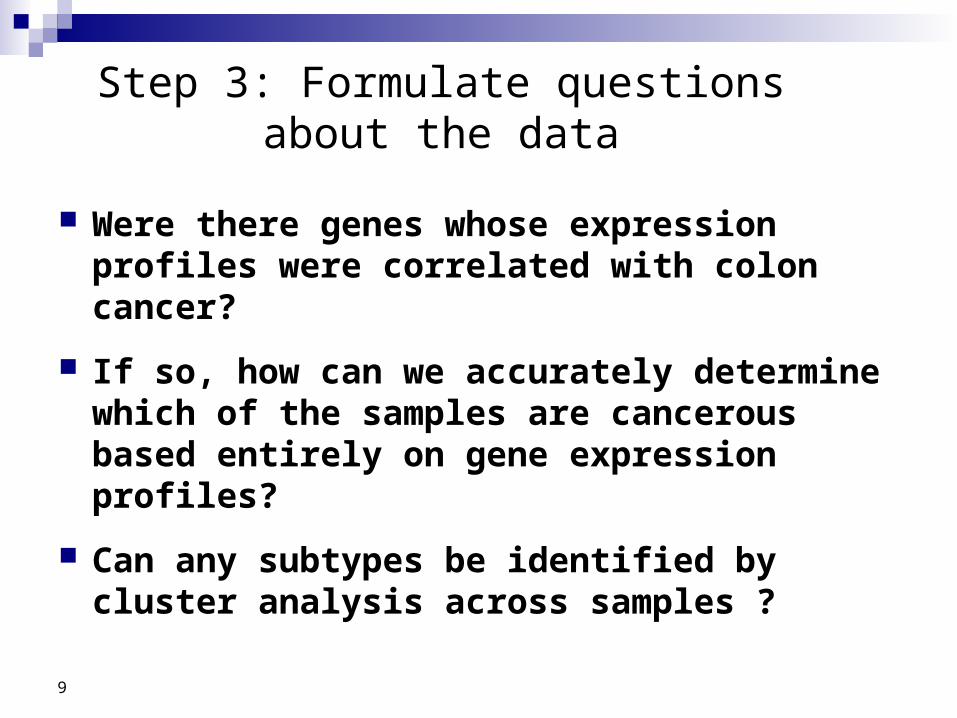
Were there genes whose expression profiles were correlated with colon cancer?
If so, how can we accurately determine which of the samples are cancerous based entirely on gene expression profiles?
Can any subtypes be identified by cluster analysis across samples ?
Step 3: Formulate questions about the data
10
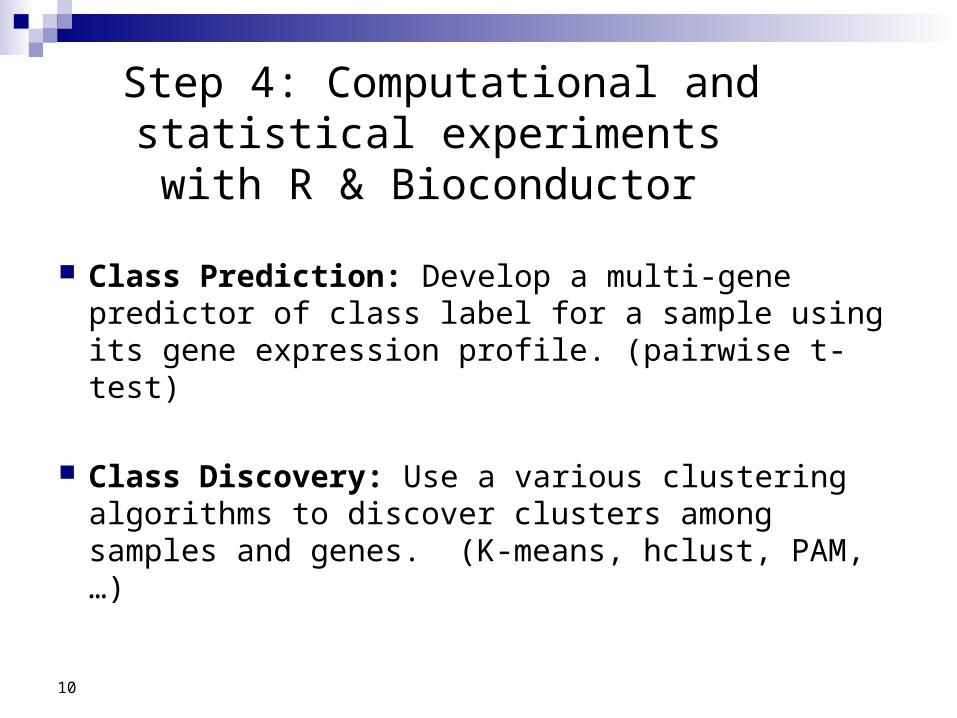
Class Prediction: Develop a multi-gene predictor of class label for a sample using its gene expression profile. (pairwise t-test)
Class Discovery: Use a various clustering algorithms to discover clusters among samples and genes. (K-means, hclust, PAM,…)
Step 4: Computational and statistical experiments with R & Bioconductor
11
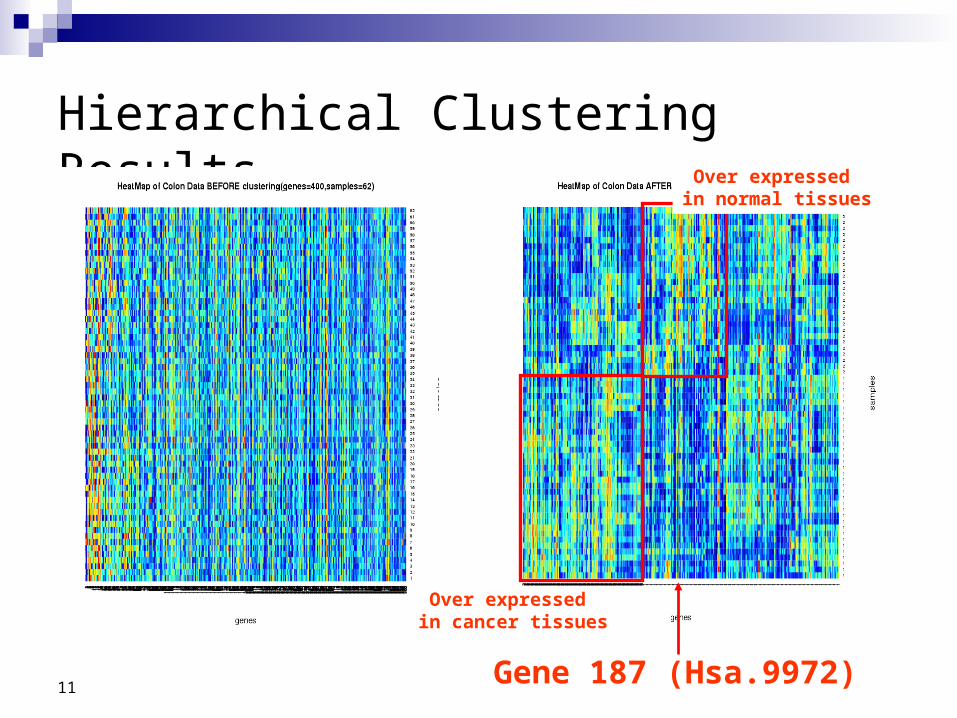
Hierarchical Clustering Results
Over expressed in cancer tissues
Over expressed in normal tissues
Gene 187 (Hsa.9972)
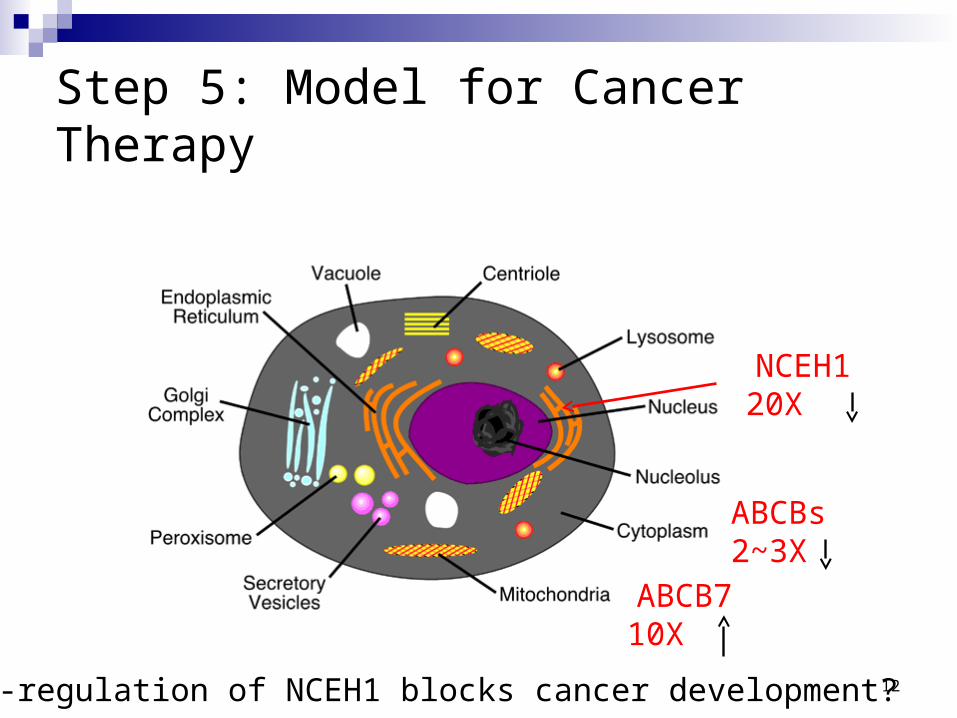
Step 5: Model for Cancer Therapy
12
NCEH1 20X
ABCBs 2~3X
ABCB7 10X
Down-regulation of NCEH1 blocks cancer development?
Step 6: Validation of Model
Search PubMed for NCEH1 and cancer
http://www.ncbi.nlm.nih.gov/pubmed/17052608
13

14
Thank you!