Embed Size (px)
Citation preview
BIOPROTA: Key Issues in Biosphere Aspects of Assessment of the Long-term Impact of Contaminant Releases Associated with Radioactive Waste Management Theme 2 Task 1: Model Review and Comparison for Spray Irrigation Pathway
Main Contributors, U Bergstrom (Task Leader), A Albrecht, B Kanyar, G Smith, M C Thorne, H Yoshida and M Wasiolek
June 2005
BIOPROTA
BIOPROTA Theme 2, Task 1, April 2005, Model Review and Comparison for Spray Irrigation Pathway
1
Contents
1 Introduction, Scope and Objectives 6 1.1 Background 6 1.2 Objectives of the Spray Irrigation Task 6 1.3 Participants 7
2 Current Model Descriptions 8 2.1 Conceptual and Mathematical Model 8
2.1.1 ANDRA 8 2.1.2 EPRI 10 2.1.3 JGC/ NUMO 12 2.1.4 Nirex/ MTA 15 2.1.5 Studsvik 15 2.1.6 University of Veszprem, Hungary 17 2.1.7 YMP 17
2.2 Comparison of Mathematical Models 19 2.2.1 Processes and parameters 19 2.2.2 ICRU definitions of Key Parameters in the Irrigation Pathway 20 2.2.3 Equations 20 2.2.4 Parameters 21
3 Test Calculation 25
4 Results 26 4.1 ANDRA 26 4.2 EPRI 26 4.3 JGC 27 4.4 Nirex 28 4.5 Studsvik 28 4.6 University of Veszprem 29 4.7 YMP 29 4.8 Summary results 29 4.9 Comparison 32
5 Discussion 35
6 Conclusions 37
7 References 38
Appendix A: Assessment Context A1
Appendix B: Biosphere System Description B1
Appendix C: NIREX Additional Information C1
BIOPROTA
BIOPROTA Theme 2, Task 1, April 2005, Model Review and Comparison for Spray Irrigation Pathway
2
FOREWORD
Assessing the impacts of releases of radioactivity into the environment rely on a great variety of factors. Important among these is an effectively justified level of understanding of radionuclide behaviour in the environment, the associated migration pathways and the processes that contribute to radionuclide accumulation and dispersion among and within specific environmental media. In addition, evaluating the consequences of any radionuclide releases on human health rely on the use of appropriate physiological and dosimetric models for calculating doses and risks. Assessment methods have been developed over several decades based on knowledge of the ecosystems involved, as well as monitoring of previous radionuclide releases to the environment, laboratory experiments and other research.
It is recognised that in some cases data for these assessments are sparse. Particular difficulties arise in the case of long-lived radionuclides, because of the difficulty of setting up relatively long-term monitoring and experimental programmes, and because the biosphere systems themselves will change over the relevant periods, due to natural processes and the potential for interference by mankind.
It is also the case that much radio-ecological research has tended to focus on relatively few radionuclides, eg. Sr-90 and Cs-137. While this research has been relevant to operational effluent discharges and accidental releases, other radionuclides tend to dominate long term impacts as may arise from the migration of radionuclides from solid radioactive waste repositories. Examples include C-14, Cl-36, Se-79, Tc-99, Np-237. The viability of geological disposal concepts and the long-term sustainability of radioactive effluent discharges, together with the safe and effective management of contaminated land and surface stores for solid radioactive wastes can only be considered in the light of a good understanding of the environmental behaviour of such longer lived radionuclides. However, the number of radionuclides involved is relatively small, and the number of important processes associated with migration and accumulation in the biosphere, and the related radiation exposure of humans and other biota, is also relatively limited.
The International Atomic Energy Agency's BIOMASS Theme 1 has provided a basis for identifying, justifying and describing biosphere systems for the purpose of radiological assessment. The development of conceptual and mathematical models has been set out and a protocol developed for the application of data to these models. However the BIOMASS Project did not address the details of uncertainties arising from weaknesses in the information base.
BIOPROTA Concept BIOPROTA provides a forum to address uncertainties in the assessment of the radiological impact of releases of long-lived radionuclides into the biosphere. The programme of work carried out under the auspices of BIOPROTA focuses on these key radionuclides and the various biosphere migration and accumulation mechanisms relevant to those radionuclides. It is understood that there are radio-ecological and other data and information issues which are common to specific assessments required in many countries. The mutual support within a
BIOPROTA
BIOPROTA Theme 2, Task 1, April 2005, Model Review and Comparison for Spray Irrigation Pathway
3
commonly focused project is intended to make more efficient use of skills and resources, and support a transparent and traceable basis for the choices of parameter values as well as for the wider interpretation of information used in the assessments.
The BIOPROTA Project up to December 2004 has been managed and supported financially by:
Organisation Representative Role of organisation Website
Agence Nationale pour la Gestion des Déchets Radioactifs (ANDRA)
Elisabeth Leclerc-Cessac
ANDRA is responsible for the management of radioactive waste in France.
www.andra.fr
Empresa Nacional de Residuos Radiactivos, S.A. (ENRESA)
Julio Astudilio
ENRESA is responsible for the management of radioactive wastes generated in Spain and the decommissioning of nuclear power plants.
www.enresa.es
Nexia Solutions Ltd (formerly BNFL Research & Technology)
Mark Willans Nexia Solutions is a UK BNFL subsiduary company providing technology solutions and services across the nuclear fuel cycle.
www.nexiasolutions.com
United Kingdom Nirex Limited (Nirex)
Paul Degnan Nirex is the radioactive waste management agency with responsibility to develop and advise on safe, environmentally sound and publicly acceptable options for the long-term management of radioactive materials in the UK.
www.nirex.co.uk
Nuclear Waste Management Organization of Japan (NUMO)
Shigeru Okuyama
NUMO is the implementing body for the final disposal of vitrified high-level waste packaged from the spent fuel reprocessing plant. It is a government approved organization responsible for identification of a disposal site, and for the construction, operation and maintenance of the repository, closure of the facility, and post-closure institutional control.
www.numo.or.jp
Posiva Oy Ari Ikonen Posiva is responsible for the management of disposal of spent fuel produced in power reactors in Finland, including siting, licencing, construction and operation of the repository.
www.posiva.fi
Svensk Kärnbränslehantering AB (SKB)
Ulrik Kautsky SKB is responsible for management of Swedish radioactive waste, planning of waste repositories, waste logistics and site selection, including safety analysis, research and development of methods.
www.skb.se
BIOPROTA
BIOPROTA Theme 2, Task 1, April 2005, Model Review and Comparison for Spray Irrigation Pathway
4
Since January 2005, the Project has been additionally managed and supported financially by:
Organisation Representative Role of organisation Website
Electricité de France (EDF)
Carine Damois EDF is been the main producer of electricity in France. The Laboratoire National Hydraulique et Environnement (LNHE) department works on migration of pollutants in the ground, waste management, water quality, soil contamination, ecotoxicology, ecology, microbiology, health risk assessment, but also fluvial and maritime hydraulics, resource management, industrial flows and combustion, meteorology and air quality.
www.edf.fr
Korea Atomic Energy Research Institute (KAERI)
Yong-Soo Hwang
Kaeri is developing the Korean reference concept for permanent disposal of high-level radioactive waste including spent nuclear fuel and assessing the long term post-closure safety and repository performance.
www.kaeri.re.kr
National Cooperative for the Disposal of Radioactive waste (Nagra)
Frits van Dorp Nagra has more than 30 years experience in the development of disposal concepts for all categories of radioactive waste. Over the years, Nagra has built up extensive technical know-how and has applied this in site characterisation and performance assessment of deep geological repositories.
www.nagra.ch
Nuclear Research Institute Rez (NRI)
Ales Laciok In the Czech Republic, NRI is the research, development and engineering organisation responsible for the development of nuclear power technologies, utilization of radionuclides and radiation in industry and medicine, and with a role to undertake fundamental research to support the long-term management and disposal of radioactive wastes.
www.nri.cz
The BIOPROTA output is made available for use of others, but the participants and supporting organisations take no responsibility for the use of the material.
General Objectives Overall the intention is to make available the best sources of information to justify modelling assumptions. Particular emphasis is placed on key data required for the assessment of long-lived radionuclide migration and accumulation in the biosphere, and the associated radiological impact, following discharge to the environment or release from solid waste disposal facilities.
The project is driven by assessment needs identified from previous and on-going assessment projects. Where common needs are identified within different assessment projects in different countries, a common effort can be applied to finding solutions. Such solutions may readily take account of the BIOMASS Theme 1 Data Protocol, among other things.
BIOPROTA
BIOPROTA Theme 2, Task 1, April 2005, Model Review and Comparison for Spray Irrigation Pathway
5
The modelling assumptions considered include the treatment of various features, events and processes (FEPs) of the systems under investigation, the mathematical representation of those FEPs and the choice of parameter values to adopt within those mathematical representations.
The work programme has been organised in three themes:
Theme 1: Development of a Specialised Data-Base for Key Radionuclides and Process Data
Theme 2: Modelling Testing and Development Tasks
Theme 3: Site Characterisation, Experiments and Monitoring.
A full list of all the reports that have been produced under each theme is available from the BIOPROTA website (www.bioprota.com).
Objectives of the Spray Irrigation Modelling Task The objective of Task 1 within Theme 2 was to investigate the modelling of the concentrations of radionuclides on vegetation arising from interception by growing crops using contaminated irrigation water and the consequent contamination of the food consumed by humans.
This Task 1 report includes model descriptions provided by participants and the specification and results of model test calculations designed to investigate the significance of the different model assumptions.
This report has been prepared within the BIOPROTA work programme. The supporting organisations have agreed that BIOPROTA reports will be printed by those organisations in their normal report series. In this case SKB is supporting the printing of this Task report, to make it available for a wide audience. SKB supports the work of BIOPROTA, but does not necessarily endorse the output. Any question concerning this report should be directed towards the contributors.The report can be obtained directly from SKB; it is also available in pdf form at www.bioprota.com along with the other BIOPROTA reports. Recommended Citation BIOPROTA (2005). Model Review and Comparison for Spray Irrigation Pathway. A report prepared within the international collaborative project BIOPROTA: Key Issues in Biosphere Aspects of Assessment of the Long-term Impact of Contaminant Releases Associated with Radioactive Waste Management. Main Contributors: U Bergstrom (Task Leader), A Albrecht, B Kanyar, G Smith, M C Thorne, H Yoshida and M Wasiolek. Published on behalf of the BIOPROTA Steering Committee by SKB (Swedish Nuclear Fuel and Waste Management Co., Svensk Kärnbränslehantering AB), Stockholm, Sweden.
BIOPROTA
BIOPROTA Theme 2, Task 1, April 2005, Model Review and Comparison for Spray Irrigation Pathway
6
1 Introduction, Scope and Objectives
1.1 Background Irrigation practises vary due to climate conditions. For example, Mediterranean countries and dryer parts of USA use irrigation frequently and extensively, whereas it is not so common in Northern Europe. For example, in Sweden around 3-4 % of the cultivated land may be subject to irrigation during dry years with potatoes and vegetables being the crops that are most often irrigated. Cereals are seldom irrigated, and if so only once, at germination. Pasturage is not irrigated.
The two most common types of irrigation are aerial irrigation and infiltration tubing on the ground. The former is the dominant technique for outdoor irrigation. The normal interval for this is 7 – 10 days. Fruit trees and berries are mostly irrigated from infiltration tubing on the ground and, in dry periods, the water is constantly on. The volumes needed depend on the evaporation, measured or calculated from meteorological data such as temperature, wind and precipitation. The properties of real world practices are considered when determining the appropriate conceptual model and choosing parameter values.
1.2 Objectives of the Spray Irrigation Task Theme 2 Task 1 has investigated the modelling of the concentrations of radionuclides on vegetation arising from interception by growing crops using contaminated irrigation water and the consequent contamination of the food consumed by humans.
The intention was to compare assessment models for this important exposure pathway and hence:
• improve confidence in the treatment of the relevant processes and data assumptions;
• identify the circumstances in which different processes are important, hence requiring different modelling treatment; and,
• identify where important data may be lacking.
The scope of this task includes only the contamination of foodstuffs arising by direct interception and uptake onto or into the crop; and any relevant transfer to the edible parts. It does not include contamination which falls to soil, which is subsequently taken up by the crop. That is, the basic processes of interest include interception, weathering, transfer to the inside of the crop, transfer to edible parts and losses during food preparation. These processes were identified in the BIOMASS Example Reference Biosphere 2A [IAEA, 2003]. In describing processes, participants were asked to take account of the definitions given in ICRU 65 [ICRU, 2001].
BIOPROTA
BIOPROTA Theme 2, Task 1, April 2005, Model Review and Comparison for Spray Irrigation Pathway
7
1.3 Participants The participants that have provided conceptual and mathematic descriptions of their models and have run test calculations in this Task are: ANDRA, France; EPRI, USA; JGC/ NUMO, Japan; Nirex/ MTA, UK; Studsvik, Sweden; University of Vezprem, Hungary; and YMP, USA. Other participants within BIOPROTA have participated in Workshop discussions regarding the Task and helped direct the Task.
BIOPROTA
BIOPROTA Theme 2, Task 1, April 2005, Model Review and Comparison for Spray Irrigation Pathway
8
2 Current Model Descriptions
Site specific conditions influence the choice of conceptual model and its input parameters. The specific conditions or assumptions each organisation makes about the site are described below.
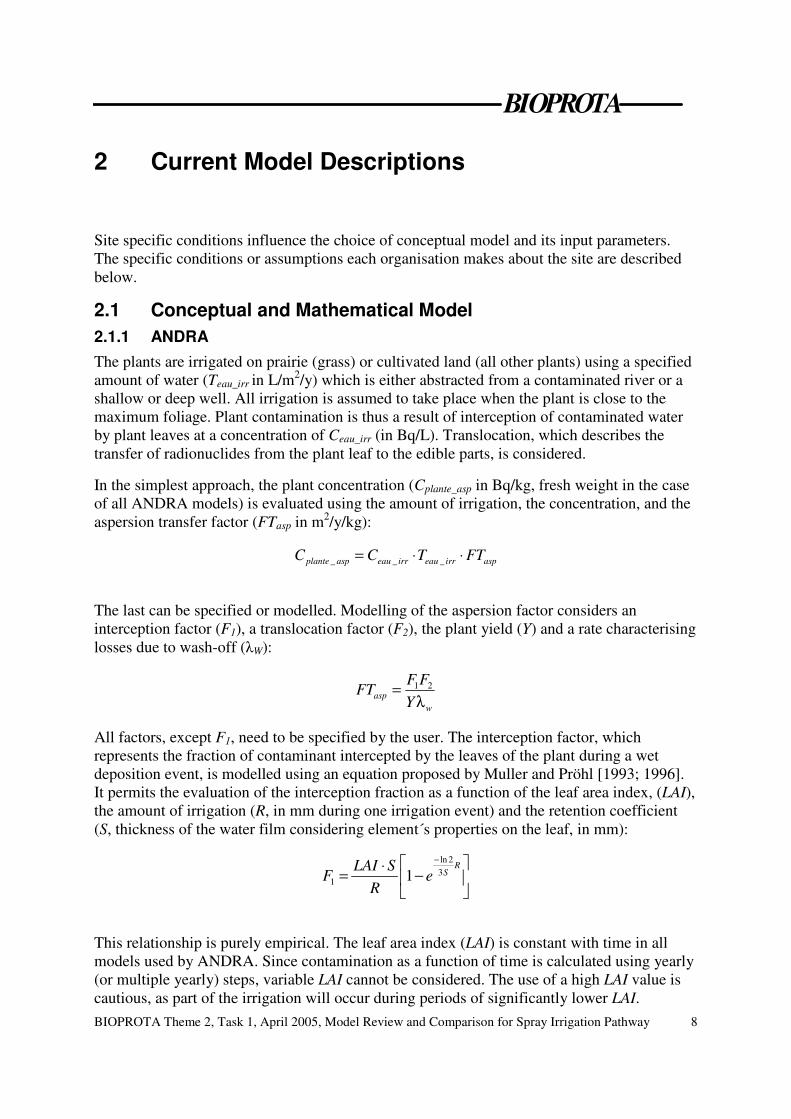
2.1 Conceptual and Mathematical Model 2.1.1 ANDRA The plants are irrigated on prairie (grass) or cultivated land (all other plants) using a specified amount of water (Teau_irr in L/m2/y) which is either abstracted from a contaminated river or a shallow or deep well. All irrigation is assumed to take place when the plant is close to the maximum foliage. Plant contamination is thus a result of interception of contaminated water by plant leaves at a concentration of Ceau_irr (in Bq/L). Translocation, which describes the transfer of radionuclides from the plant leaf to the edible parts, is considered.
In the simplest approach, the plant concentration (Cplante_asp in Bq/kg, fresh weight in the case of all ANDRA models) is evaluated using the amount of irrigation, the concentration, and the aspersion transfer factor (FTasp in m2/y/kg):
_ _ _plante asp eau irr eau irr aspC C T FT= ⋅ ⋅
The last can be specified or modelled. Modelling of the aspersion factor considers an interception factor (F1), a translocation factor (F2), the plant yield (Y) and a rate characterising losses due to wash-off (�W):
1 2asp
w
F FFT
Y=
λ
All factors, except F1, need to be specified by the user. The interception factor, which represents the fraction of contaminant intercepted by the leaves of the plant during a wet deposition event, is modelled using an equation proposed by Muller and Pröhl [1993; 1996]. It permits the evaluation of the interception fraction as a function of the leaf area index, (LAI), the amount of irrigation (R, in mm during one irrigation event) and the retention coefficient (S, thickness of the water film considering element´s properties on the leaf, in mm):
ln 23
1 1R
SLAI SF e
R
−� �⋅= −� �� �
This relationship is purely empirical. The leaf area index (LAI) is constant with time in all models used by ANDRA. Since contamination as a function of time is calculated using yearly (or multiple yearly) steps, variable LAI cannot be considered. The use of a high LAI value is cautious, as part of the irrigation will occur during periods of significantly lower LAI.
BIOPROTA
BIOPROTA Theme 2, Task 1, April 2005, Model Review and Comparison for Spray Irrigation Pathway
9
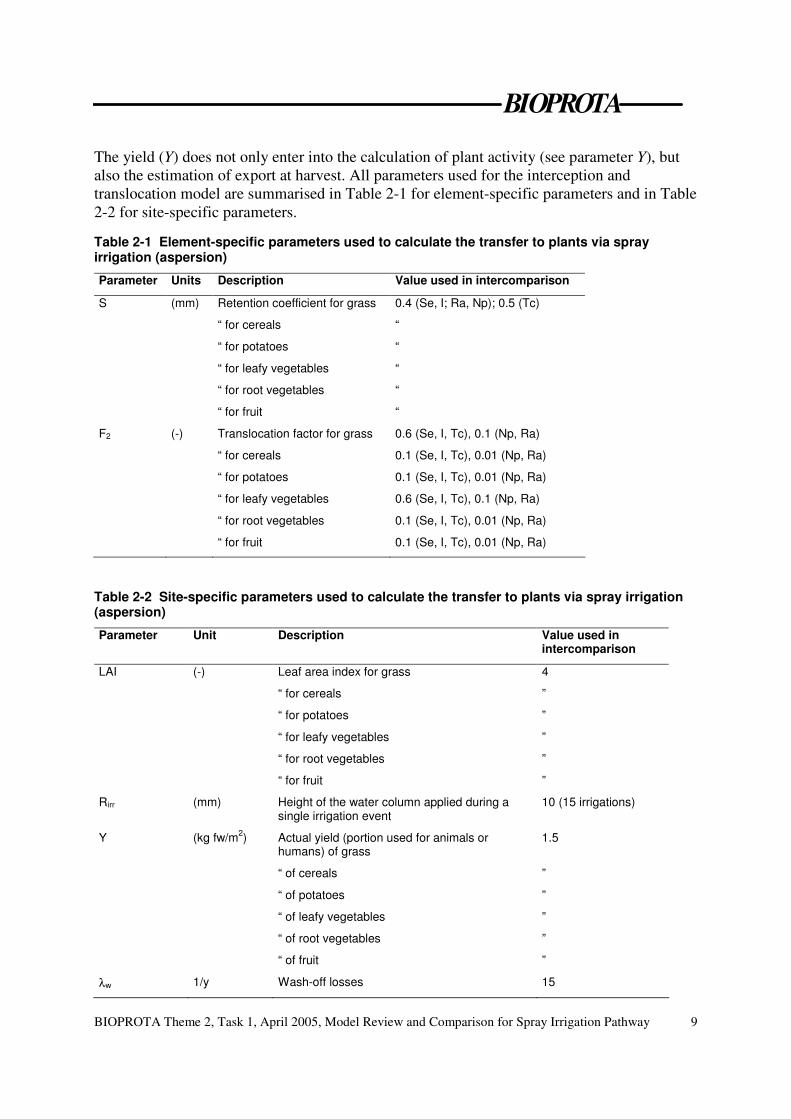
The yield (Y) does not only enter into the calculation of plant activity (see parameter Y), but also the estimation of export at harvest. All parameters used for the interception and translocation model are summarised in Table 2-1 for element-specific parameters and in Table 2-2 for site-specific parameters.
Table 2-1 Element-specific parameters used to calculate the transfer to plants via spray irrigation (aspersion)
Parameter Units Description Value used in intercomparison
S (mm) Retention coefficient for grass
“ for cereals
“ for potatoes
“ for leafy vegetables
“ for root vegetables
“ for fruit
0.4 (Se, I; Ra, Np); 0.5 (Tc)
“
“
“
“
“
F2 (-) Translocation factor for grass
“ for cereals
“ for potatoes
“ for leafy vegetables
“ for root vegetables
“ for fruit
0.6 (Se, I, Tc), 0.1 (Np, Ra)
0.1 (Se, I, Tc), 0.01 (Np, Ra)
0.1 (Se, I, Tc), 0.01 (Np, Ra)
0.6 (Se, I, Tc), 0.1 (Np, Ra)
0.1 (Se, I, Tc), 0.01 (Np, Ra)
0.1 (Se, I, Tc), 0.01 (Np, Ra)
Table 2-2 Site-specific parameters used to calculate the transfer to plants via spray irrigation (aspersion)
Parameter Unit Description Value used in intercomparison
LAI (-) Leaf area index for grass
“ for cereals
“ for potatoes
“ for leafy vegetables
“ for root vegetables
“ for fruit
4
”
”
”
”
”
Rirr (mm) Height of the water column applied during a single irrigation event
10 (15 irrigations)
Y (kg fw/m2) Actual yield (portion used for animals or humans) of grass
“ of cereals
“ of potatoes
“ of leafy vegetables
“ of root vegetables
“ of fruit
1.5
”
”
”
”
”
λw 1/y Wash-off losses 15
BIOPROTA
BIOPROTA Theme 2, Task 1, April 2005, Model Review and Comparison for Spray Irrigation Pathway
10
The retention coefficient and the translocation factor can vary as a function of plant type and radionuclide. For the parameterization of translocation used for the BIOPROTA exercise, two groups of radionuclides, a mobile (Se, I, Tc) and immobile (Np, Ra) group are distinguished. Plants are separated into a group characterized by complete (grass, leafy vegetables) or incomplete consumption (all others) The leaf area index and the annual yield can vary as a function of plant type, but the same values have been used for all types in the exercise.
The model has been described in Albrecht [2002].
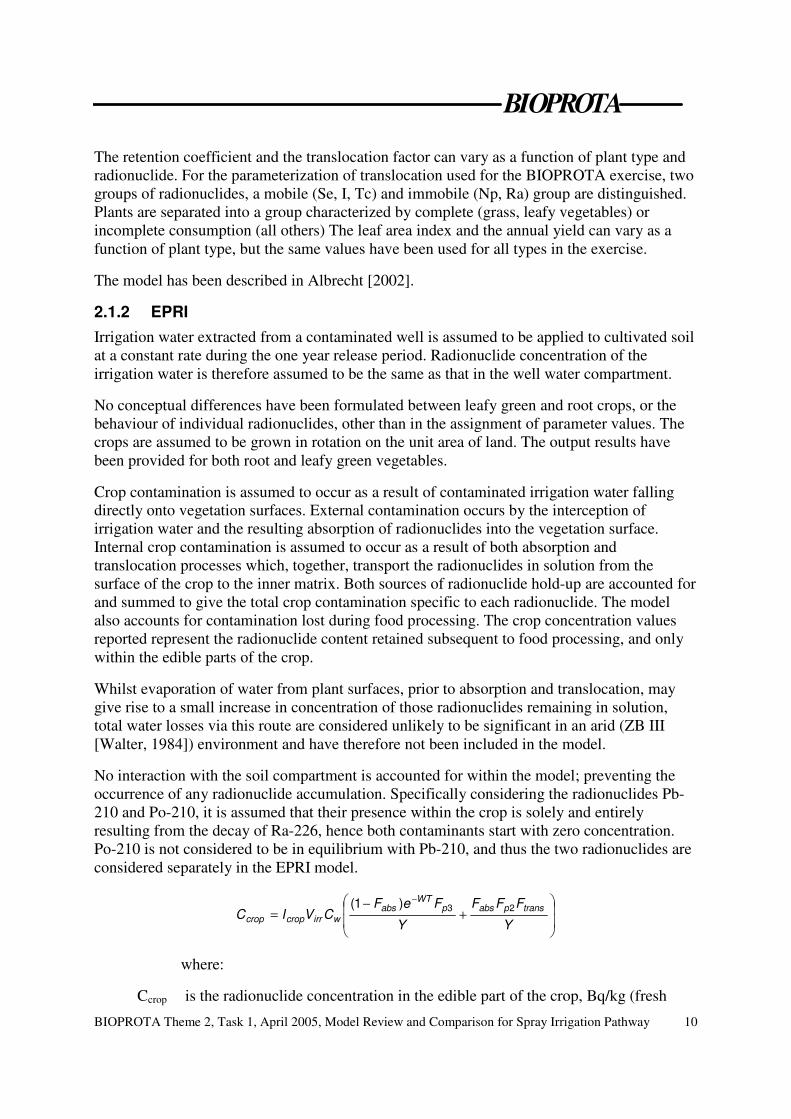
2.1.2 EPRI Irrigation water extracted from a contaminated well is assumed to be applied to cultivated soil at a constant rate during the one year release period. Radionuclide concentration of the irrigation water is therefore assumed to be the same as that in the well water compartment.
No conceptual differences have been formulated between leafy green and root crops, or the behaviour of individual radionuclides, other than in the assignment of parameter values. The crops are assumed to be grown in rotation on the unit area of land. The output results have been provided for both root and leafy green vegetables.
Crop contamination is assumed to occur as a result of contaminated irrigation water falling directly onto vegetation surfaces. External contamination occurs by the interception of irrigation water and the resulting absorption of radionuclides into the vegetation surface. Internal crop contamination is assumed to occur as a result of both absorption and translocation processes which, together, transport the radionuclides in solution from the surface of the crop to the inner matrix. Both sources of radionuclide hold-up are accounted for and summed to give the total crop contamination specific to each radionuclide. The model also accounts for contamination lost during food processing. The crop concentration values reported represent the radionuclide content retained subsequent to food processing, and only within the edible parts of the crop.
Whilst evaporation of water from plant surfaces, prior to absorption and translocation, may give rise to a small increase in concentration of those radionuclides remaining in solution, total water losses via this route are considered unlikely to be significant in an arid (ZB III [Walter, 1984]) environment and have therefore not been included in the model.
No interaction with the soil compartment is accounted for within the model; preventing the occurrence of any radionuclide accumulation. Specifically considering the radionuclides Pb-210 and Po-210, it is assumed that their presence within the crop is solely and entirely resulting from the decay of Ra-226, hence both contaminants start with zero concentration. Po-210 is not considered to be in equilibrium with Pb-210, and thus the two radionuclides are considered separately in the EPRI model.
��
�
�
�+
−=
−
Y
FFF
Y
FeFCVIC transpabsp
WTabs
wirrcropcrop23)1(
where:
Ccrop is the radionuclide concentration in the edible part of the crop, Bq/kg (fresh
BIOPROTA
BIOPROTA Theme 2, Task 1, April 2005, Model Review and Comparison for Spray Irrigation Pathway
11
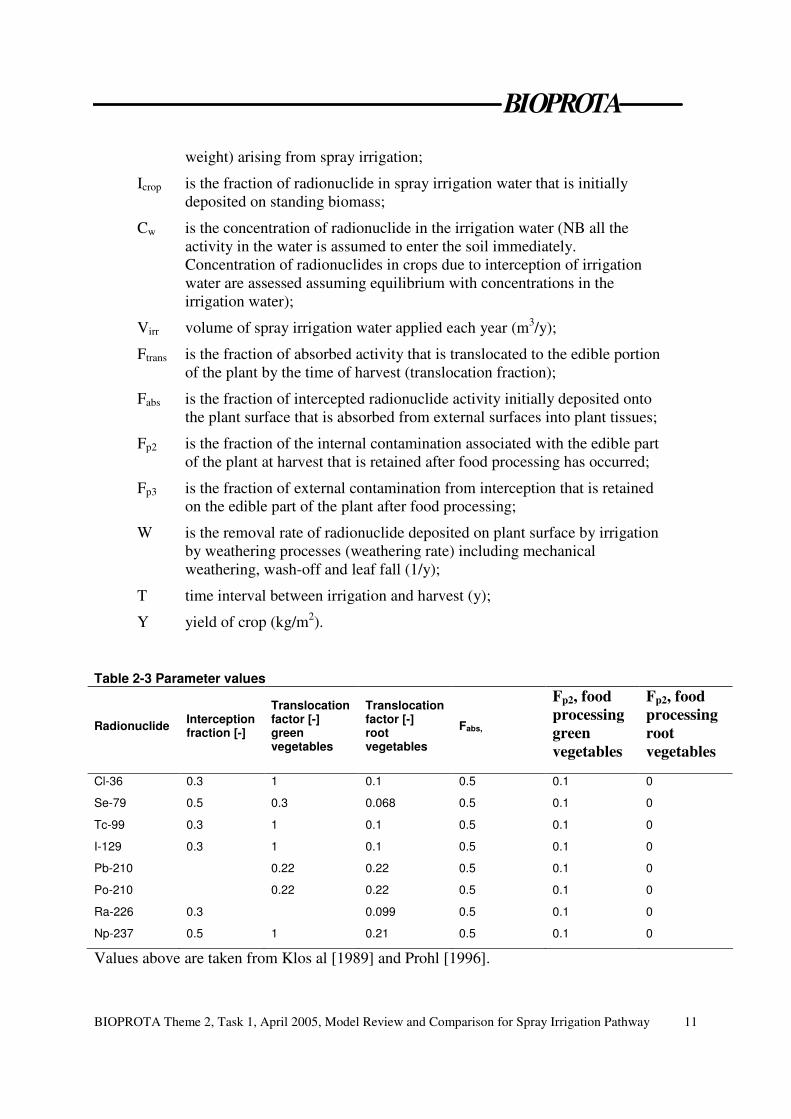
weight) arising from spray irrigation;
Icrop is the fraction of radionuclide in spray irrigation water that is initially deposited on standing biomass;
Cw is the concentration of radionuclide in the irrigation water (NB all the activity in the water is assumed to enter the soil immediately. Concentration of radionuclides in crops due to interception of irrigation water are assessed assuming equilibrium with concentrations in the irrigation water);
Virr volume of spray irrigation water applied each year (m3/y);
Ftrans is the fraction of absorbed activity that is translocated to the edible portion of the plant by the time of harvest (translocation fraction);
Fabs is the fraction of intercepted radionuclide activity initially deposited onto the plant surface that is absorbed from external surfaces into plant tissues;
Fp2 is the fraction of the internal contamination associated with the edible part of the plant at harvest that is retained after food processing has occurred;
Fp3 is the fraction of external contamination from interception that is retained on the edible part of the plant after food processing;
W is the removal rate of radionuclide deposited on plant surface by irrigation by weathering processes (weathering rate) including mechanical weathering, wash-off and leaf fall (1/y);
T time interval between irrigation and harvest (y);
Y yield of crop (kg/m2).
Table 2-3 Parameter values
Radionuclide Interception fraction [-]
Translocation factor [-] green vegetables
Translocation factor [-] root vegetables
Fabs,
Fp2, food processing green vegetables
Fp2, food processing root vegetables
Cl-36 0.3 1 0.1 0.5 0.1 0
Se-79 0.5 0.3 0.068 0.5 0.1 0
Tc-99 0.3 1 0.1 0.5 0.1 0
I-129 0.3 1 0.1 0.5 0.1 0
Pb-210 0.22 0.22 0.5 0.1 0
Po-210 0.22 0.22 0.5 0.1 0
Ra-226 0.3 0.099 0.5 0.1 0
Np-237 0.5 1 0.21 0.5 0.1 0
Values above are taken from Klos al [1989] and Prohl [1996].
BIOPROTA
BIOPROTA Theme 2, Task 1, April 2005, Model Review and Comparison for Spray Irrigation Pathway
12
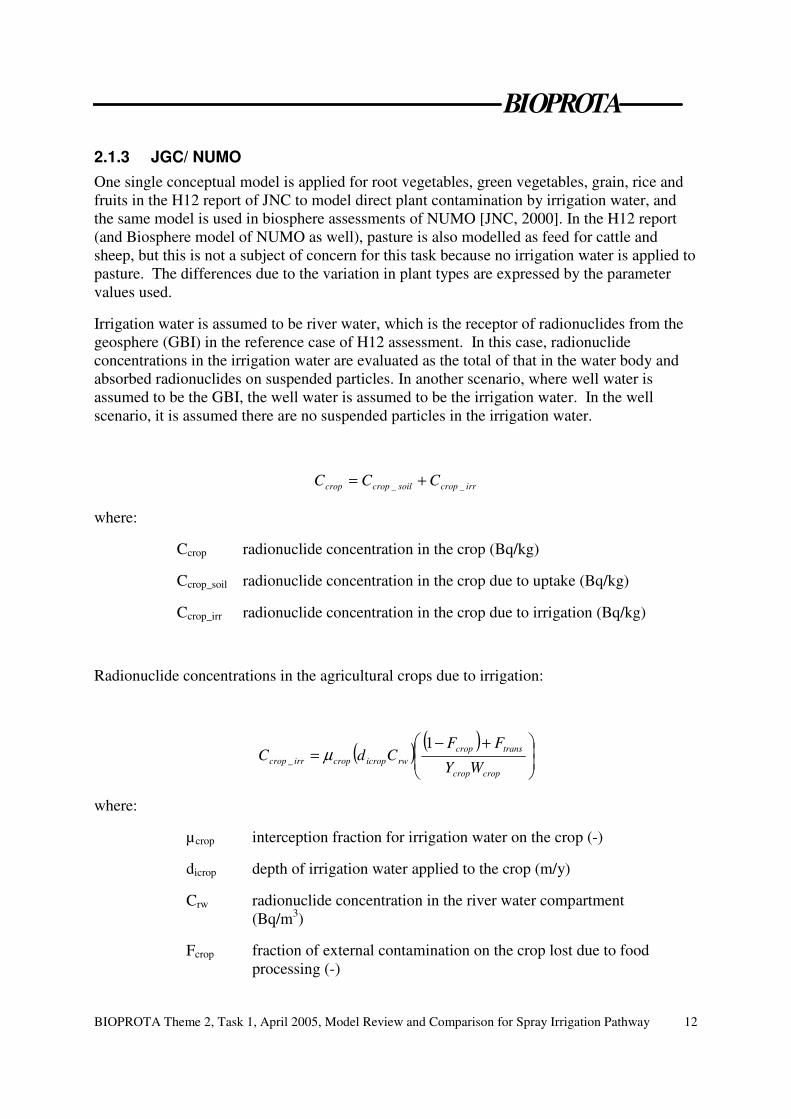
2.1.3 JGC/ NUMO One single conceptual model is applied for root vegetables, green vegetables, grain, rice and fruits in the H12 report of JNC to model direct plant contamination by irrigation water, and the same model is used in biosphere assessments of NUMO [JNC, 2000]. In the H12 report (and Biosphere model of NUMO as well), pasture is also modelled as feed for cattle and sheep, but this is not a subject of concern for this task because no irrigation water is applied to pasture. The differences due to the variation in plant types are expressed by the parameter values used.
Irrigation water is assumed to be river water, which is the receptor of radionuclides from the geosphere (GBI) in the reference case of H12 assessment. In this case, radionuclide concentrations in the irrigation water are evaluated as the total of that in the water body and absorbed radionuclides on suspended particles. In another scenario, where well water is assumed to be the GBI, the well water is assumed to be the irrigation water. In the well scenario, it is assumed there are no suspended particles in the irrigation water.
irrcropsoilcropcrop CCC __ +=
where:
Ccrop radionuclide concentration in the crop (Bq/kg)
Ccrop_soil radionuclide concentration in the crop due to uptake (Bq/kg)
Ccrop_irr radionuclide concentration in the crop due to irrigation (Bq/kg)
Radionuclide concentrations in the agricultural crops due to irrigation:
( ) ( )��
�
�
� +−=
cropcrop
transcroprwicropcropirrcrop WY
FFCdC
1_ µ
where:
µcrop interception fraction for irrigation water on the crop (-)
dicrop depth of irrigation water applied to the crop (m/y)
Crw radionuclide concentration in the river water compartment (Bq/m3)
Fcrop fraction of external contamination on the crop lost due to food processing (-)
BIOPROTA
BIOPROTA Theme 2, Task 1, April 2005, Model Review and Comparison for Spray Irrigation Pathway
13
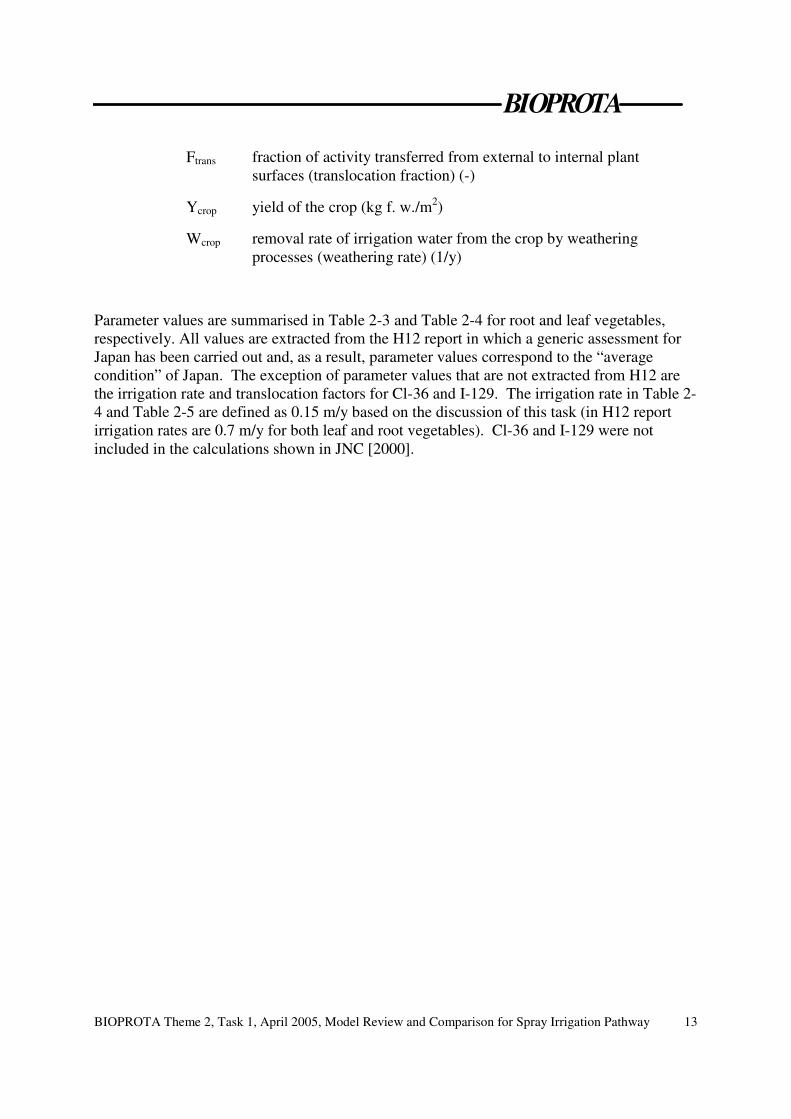
Ftrans fraction of activity transferred from external to internal plant surfaces (translocation fraction) (-)
Ycrop yield of the crop (kg f. w./m2)
Wcrop removal rate of irrigation water from the crop by weathering processes (weathering rate) (1/y)
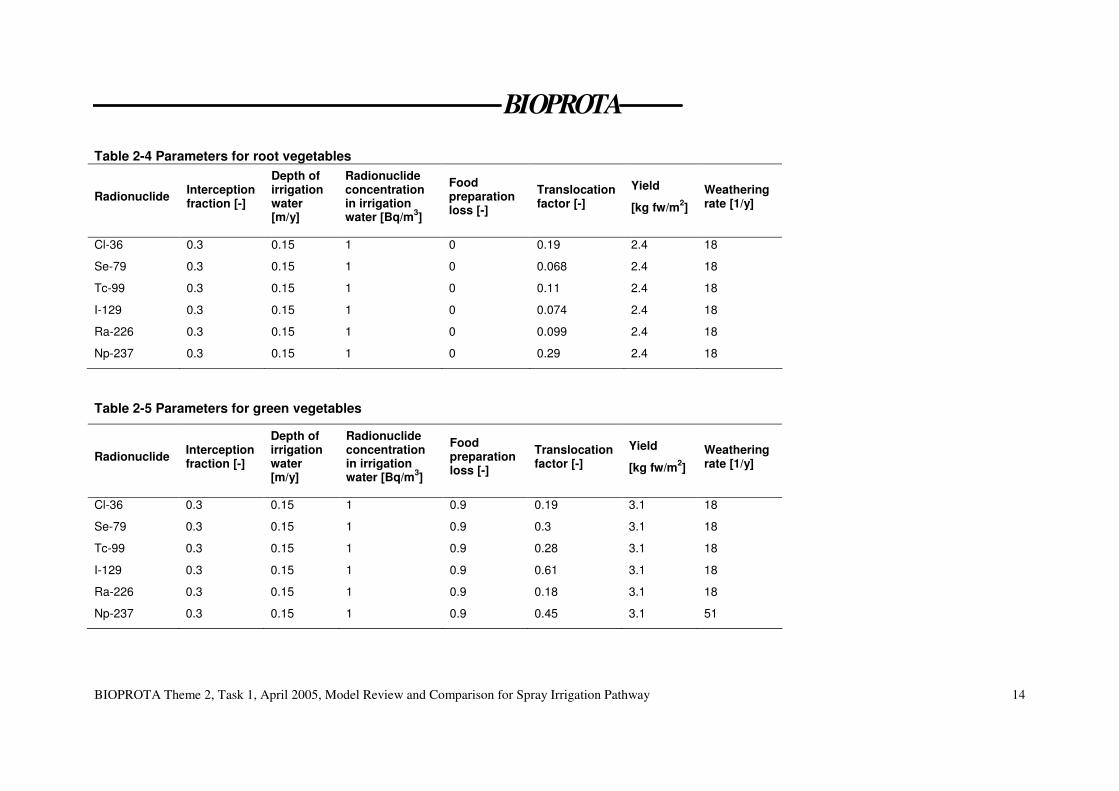
Parameter values are summarised in Table 2-3 and Table 2-4 for root and leaf vegetables, respectively. All values are extracted from the H12 report in which a generic assessment for Japan has been carried out and, as a result, parameter values correspond to the “average condition” of Japan. The exception of parameter values that are not extracted from H12 are the irrigation rate and translocation factors for Cl-36 and I-129. The irrigation rate in Table 2-4 and Table 2-5 are defined as 0.15 m/y based on the discussion of this task (in H12 report irrigation rates are 0.7 m/y for both leaf and root vegetables). Cl-36 and I-129 were not included in the calculations shown in JNC [2000].
BIOPROTA
BIOPROTA Theme 2, Task 1, April 2005, Model Review and Comparison for Spray Irrigation Pathway
14
Table 2-4 Parameters for root vegetables
Radionuclide Interception fraction [-]
Depth of irrigation water [m/y]
Radionuclide concentration in irrigation water [Bq/m3]
Food preparation loss [-]
Translocation factor [-]
Yield
[kg fw/m2] Weathering rate [1/y]
Cl-36 0.3 0.15 1 0 0.19 2.4 18
Se-79 0.3 0.15 1 0 0.068 2.4 18
Tc-99 0.3 0.15 1 0 0.11 2.4 18
I-129 0.3 0.15 1 0 0.074 2.4 18
Ra-226 0.3 0.15 1 0 0.099 2.4 18
Np-237 0.3 0.15 1 0 0.29 2.4 18
Table 2-5 Parameters for green vegetables
Radionuclide Interception fraction [-]
Depth of irrigation water [m/y]
Radionuclide concentration in irrigation water [Bq/m3]
Food preparation loss [-]
Translocation factor [-]
Yield
[kg fw/m2] Weathering rate [1/y]
Cl-36 0.3 0.15 1 0.9 0.19 3.1 18
Se-79 0.3 0.15 1 0.9 0.3 3.1 18
Tc-99 0.3 0.15 1 0.9 0.28 3.1 18
I-129 0.3 0.15 1 0.9 0.61 3.1 18
Ra-226 0.3 0.15 1 0.9 0.18 3.1 18
Np-237 0.3 0.15 1 0.9 0.45 3.1 51
BIOPROTA
BIOPROTA Theme 2, Task 1, April 2005, Model Review and Comparison for Spray Irrigation Pathway
15
2.1.4 Nirex/ MTA The Nirex model is not optimally configured to address this case. It is oriented to a system in which long-term irrigation has been practised, giving rise to a build-up of soil contamination, which then contaminates crops through root uptake. Results therefore include the contributions from root uptake at the equilibrium level of concentration achieved after accumulation in soil. Nevertheless, it is of interest to present the results of the application of the Nirex model for comparison with other approaches that consider uptake following surface contamination.
The model used by Nirex has recently been described in Thorne [2003] and details of equations are provided in Appendix C. To calculate the radionuclide concentration in the edible parts of plants as specified for this exercise, but due to uptake from soil following irrigation, the model uses:
• Contaminated well water with a radionuclide concentration of 1 Bq/m3 (for all radionuclides) used to spray irrigate arable land at a rate of 150 mm/y;
• The radionuclides Cl-36, Se-79, Tc-99 I-129, Ra-226, and Np-237. For Ra-226, it is assumed that none of its progeny are present in the well water, but that they can grow-in after irrigation. In addition, Pu-239 has been added to the model for comparison with the inhalation study (Theme 2: Task 2).
2.1.5 Studsvik Water from freshwater bodies is usually assumed to be used for irrigation of small garden plots and agricultural fields when making safety assessments for waste disposal. Irrigation is not very common in Sweden, due to the fact that rainfall usually provides enough water. About 100,000 ha (3-4 % of the arable land) in Sweden are sometimes subject to irrigation.
The sites that are studied as possible locations for a repository for spent fuel in Sweden do not exhibit suitable conditions for large-scale agriculture. Therefore, when estimating doses due to radionuclides reaching freshwater bodies via groundwater from the repository, only vegetables and potatoes, grown for domestic purposes, are assumed to be irrigated.
The process of interception is considered. The amount of water remaining on vegetation surfaces can be modelled as a function of the leaf area index (LAI) and a specific storage capacity. In this context, the LAI is defined as half the total green leaf area (one-sided area for broad leaves) in the plant canopy per unit ground area [Chen and Black, 1992]. The LAI is an important parameter when describing plant interaction with the atmosphere, especially concerning radiation, energy, momentum and gas exchange [Monteith and Unsworth, 1990].
The concentration of radionuclides remaining in water on plant surfaces depends, among other things, on their chemical properties. It was assumed that cations will adhere more effectively to the negatively charged surface vegetation areas than anions.
No consideration of reduction of radionuclide concentrations due to weathering processes is included in the model. This process is usually described by exponential decline determined by a weathering half-life. In practise, this rate often includes the effect of growing biomass
BIOPROTA
BIOPROTA Theme 2, Task 1, April 2005, Model Review and Comparison for Spray Irrigation Pathway
16
during the period. As yield values are used when estimating the concentration in vegetation, the weathering was neglected in order to ensure it was not account for twice.
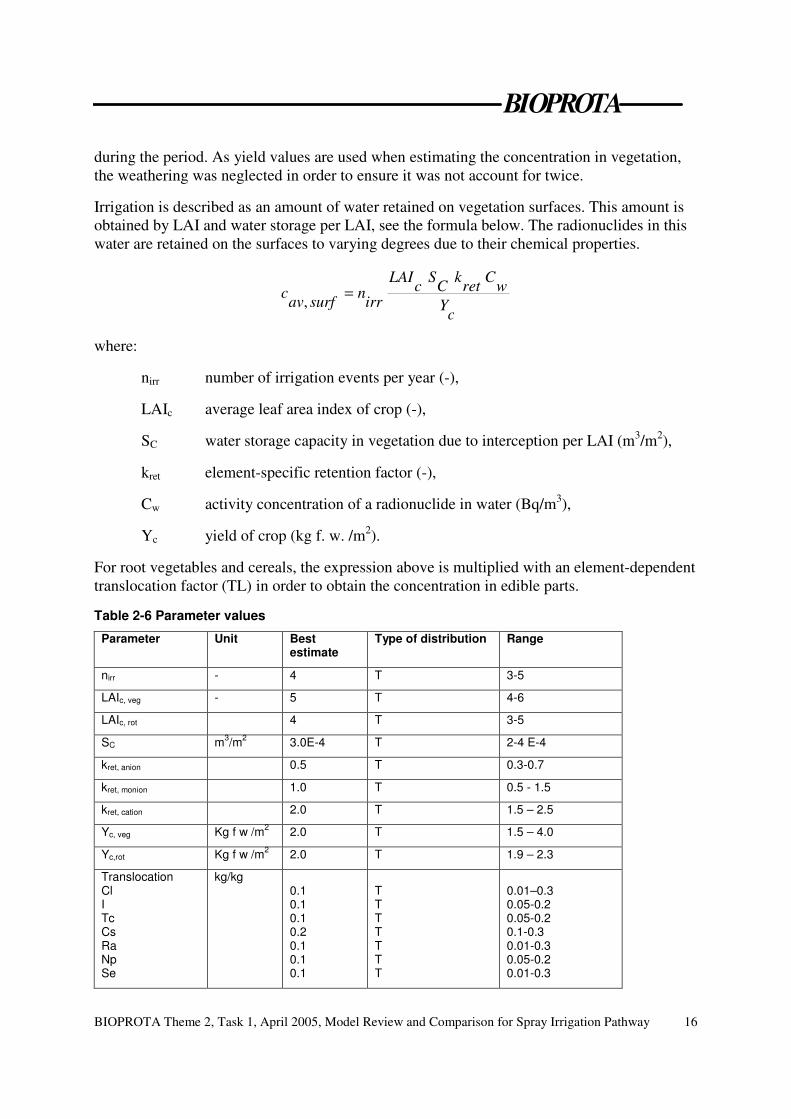
Irrigation is described as an amount of water retained on vegetation surfaces. This amount is obtained by LAI and water storage per LAI, see the formula below. The radionuclides in this water are retained on the surfaces to varying degrees due to their chemical properties.
cYwCretkCScLAI
irrnsurfavc =,
where:
nirr number of irrigation events per year (-),
LAIc average leaf area index of crop (-),
SC water storage capacity in vegetation due to interception per LAI (m3/m2),
kret element-specific retention factor (-),
Cw activity concentration of a radionuclide in water (Bq/m3),
Yc yield of crop (kg f. w. /m2).
For root vegetables and cereals, the expression above is multiplied with an element-dependent translocation factor (TL) in order to obtain the concentration in edible parts.
Table 2-6 Parameter values
Parameter Unit Best estimate
Type of distribution Range
nirr - 4 T 3-5
LAIc, veg - 5 T 4-6
LAIc, rot 4 T 3-5
SC m3/m2 3.0E-4 T 2-4 E-4
kret, anion 0.5 T 0.3-0.7
kret, monion 1.0 T 0.5 - 1.5
kret, cation 2.0 T 1.5 – 2.5
Yc, veg Kg f w /m2 2.0 T 1.5 – 4.0
Yc,rot Kg f w /m2 2.0 T 1.9 – 2.3
Translocation Cl I Tc Cs Ra Np Se
kg/kg 0.1 0.1 0.1 0.2 0.1 0.1 0.1
T T T T T T T
0.01–0.3 0.05-0.2 0.05-0.2 0.1-0.3 0.01-0.3 0.05-0.2 0.01-0.3
BIOPROTA
BIOPROTA Theme 2, Task 1, April 2005, Model Review and Comparison for Spray Irrigation Pathway
17
All calculations were performed with triangular (T) ranges of uncertainty in parameter values. The model is described in Bergström and Barkefors [2004].
2.1.6 University of Veszprem, Hungary Within the model, three types of soils are characterised: garden soil for green vegetables; agricultural soil for root vegetables; and pasture soil for the grazing of dairy cows. Parameters such as density, thickness of upper layer, water content etc, are different in the three types of soils. Irrigation water contaminates the vegetation and soils directly.
Due to the steady state transport processes among the environmental components, the radionuclide concentrations can be expressed by concentration factors. According to the scenario, the concentration of the irrigation water is constant in time, 1 Bq/m3.
The contamination of the edible part of vegetation at harvesting is assessed by the sum of two sources, namely due to the root uptake and the direct deposition from the irrigation water. Therefore:
vegweattrloinceirrwirrwsoilvegveg YTCICBC /)2ln(/⋅⋅⋅⋅+⋅= ηη
where:
Bveg is the concentration (bioaccumulation) factor of vegetable (Bq/kg, dry per Bq/kg, dry for pasture, per wet for green and root vegetables);
Csoil is the concentration in soil (Bq/kg);
Tweat the weathering half life time activity on the part above the surface (d);
Iirrw the intensity of irrigation (m/d) during the irrigation period;
Cirrw the radionuclide concentration in the irrigation water (Bq/m3);
ηince the interception factor (-);
ηtrlo the translocation factor (-); and,
Yveg the yield of vegetation (kg/m2).
It is assumed that the weathering loss can be described by a one-exponential expression.
As with other models, the irrigation is assumed to be a continuous process. Consequently, steady state conditions will prevail in the surface component of the vegetation.
2.1.7 YMP In the arid to semi-arid region at Yucca Mountain, crops must be irrigated frequently. Therefore, deposition of radionuclides on plant surfaces by irrigation water is a quasi-continuous process throughout the plant growing season.
The daily irrigation rates for crops varied during the growing season; therefore, a daily average rate over the entire growing season was used in the submodel. The daily average
BIOPROTA
BIOPROTA Theme 2, Task 1, April 2005, Model Review and Comparison for Spray Irrigation Pathway
18
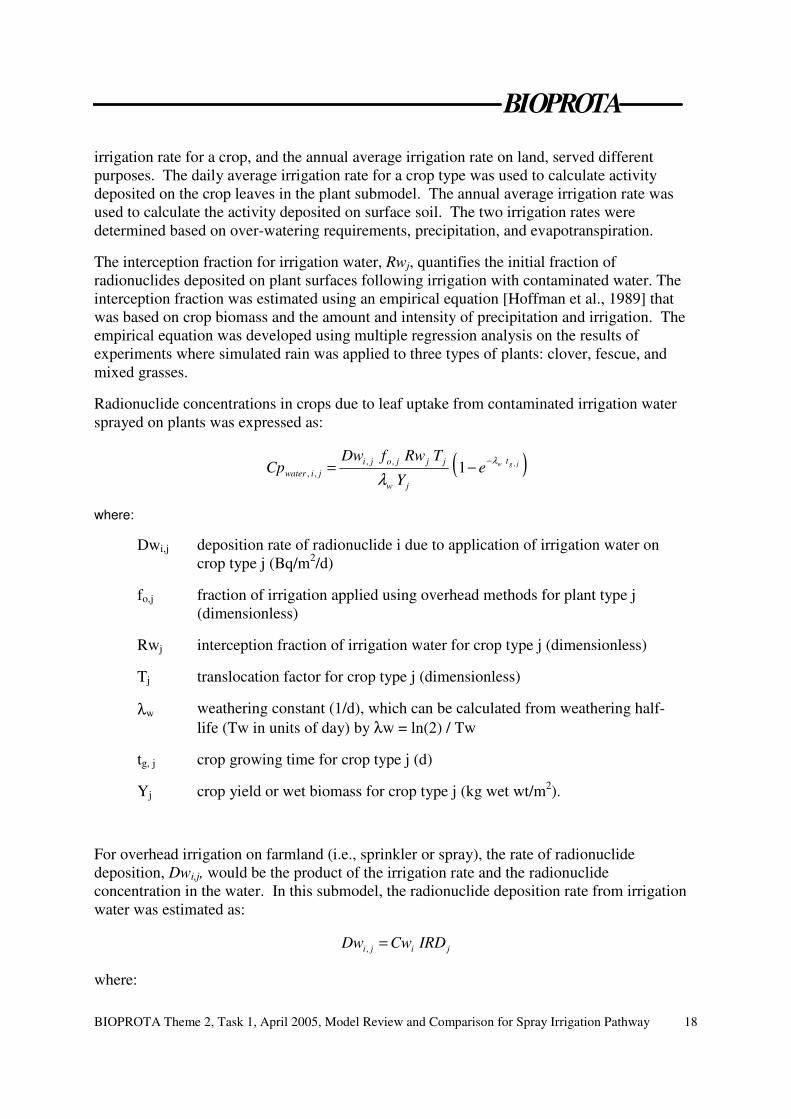
irrigation rate for a crop, and the annual average irrigation rate on land, served different purposes. The daily average irrigation rate for a crop type was used to calculate activity deposited on the crop leaves in the plant submodel. The annual average irrigation rate was used to calculate the activity deposited on surface soil. The two irrigation rates were determined based on over-watering requirements, precipitation, and evapotranspiration.
The interception fraction for irrigation water, Rwj, quantifies the initial fraction of radionuclides deposited on plant surfaces following irrigation with contaminated water. The interception fraction was estimated using an empirical equation [Hoffman et al., 1989] that was based on crop biomass and the amount and intensity of precipitation and irrigation. The empirical equation was developed using multiple regression analysis on the results of experiments where simulated rain was applied to three types of plants: clover, fescue, and mixed grasses.
Radionuclide concentrations in crops due to leaf uptake from contaminated irrigation water sprayed on plants was expressed as:
( )jgw t
jw
jjjojijiwater e
Y
TRwfDwCp , ,,
, , 1
λ
λ−−=
where:
Dwi,j deposition rate of radionuclide i due to application of irrigation water on crop type j (Bq/m2/d)
fo,j fraction of irrigation applied using overhead methods for plant type j (dimensionless)
Rwj interception fraction of irrigation water for crop type j (dimensionless)
Tj translocation factor for crop type j (dimensionless)
λw weathering constant (1/d), which can be calculated from weathering half-life (Tw in units of day) by λw = ln(2) / Tw
tg, j crop growing time for crop type j (d)
Yj crop yield or wet biomass for crop type j (kg wet wt/m2).
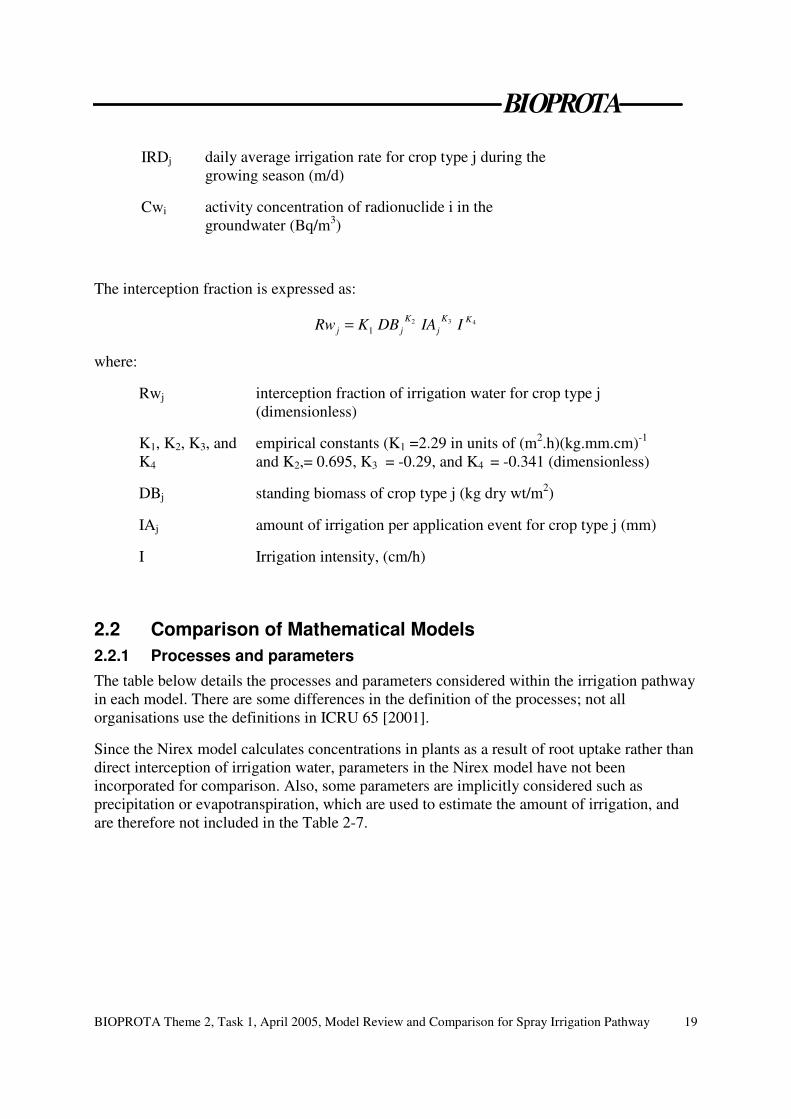
For overhead irrigation on farmland (i.e., sprinkler or spray), the rate of radionuclide deposition, Dwi,j, would be the product of the irrigation rate and the radionuclide concentration in the water. In this submodel, the radionuclide deposition rate from irrigation water was estimated as:
jiji IRDCwDw , =
where:
BIOPROTA
BIOPROTA Theme 2, Task 1, April 2005, Model Review and Comparison for Spray Irrigation Pathway
19
IRDj daily average irrigation rate for crop type j during the growing season (m/d)
Cwi activity concentration of radionuclide i in the groundwater (Bq/m3)
The interception fraction is expressed as:
432 1KK
jK
jj IIADBKRw =
where:
Rwj interception fraction of irrigation water for crop type j (dimensionless)
K1, K2, K3, and K4
empirical constants (K1 =2.29 in units of (m2.h)(kg.mm.cm)-1 and K2,= 0.695, K3 = -0.29, and K4 = -0.341 (dimensionless)
DBj standing biomass of crop type j (kg dry wt/m2)
IAj amount of irrigation per application event for crop type j (mm)
I Irrigation intensity, (cm/h)
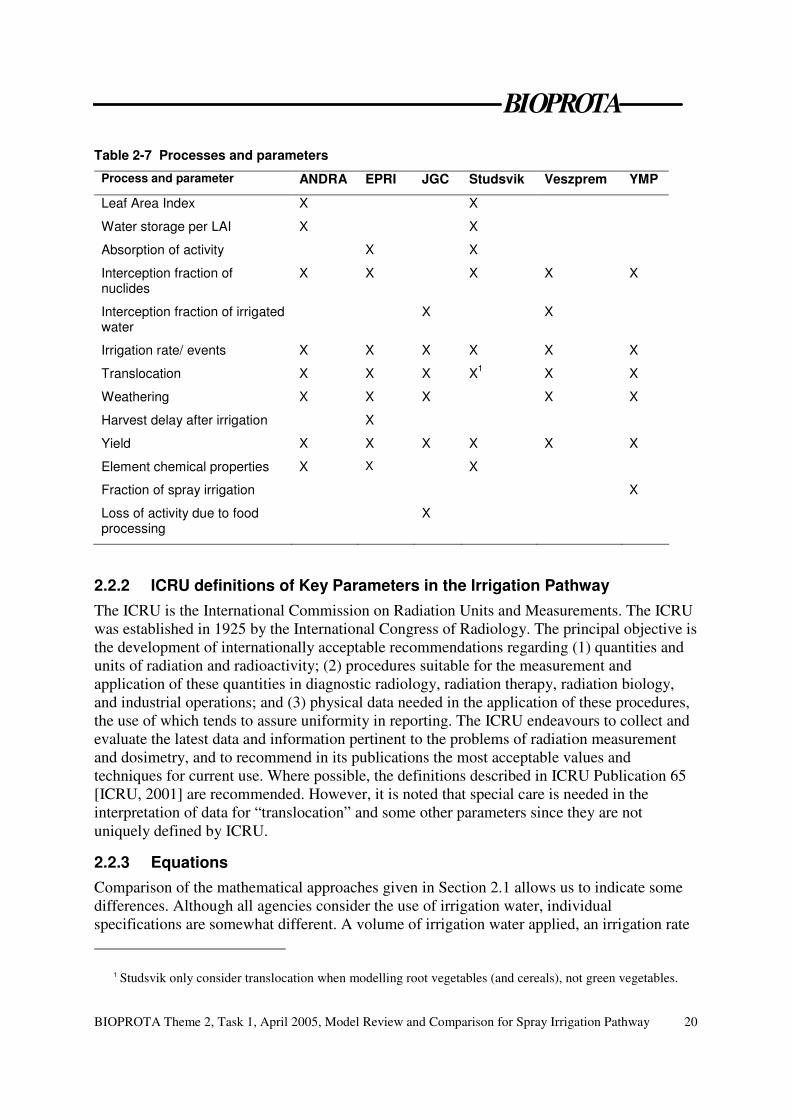
2.2 Comparison of Mathematical Models 2.2.1 Processes and parameters The table below details the processes and parameters considered within the irrigation pathway in each model. There are some differences in the definition of the processes; not all organisations use the definitions in ICRU 65 [2001].
Since the Nirex model calculates concentrations in plants as a result of root uptake rather than direct interception of irrigation water, parameters in the Nirex model have not been incorporated for comparison. Also, some parameters are implicitly considered such as precipitation or evapotranspiration, which are used to estimate the amount of irrigation, and are therefore not included in the Table 2-7.
BIOPROTA
BIOPROTA Theme 2, Task 1, April 2005, Model Review and Comparison for Spray Irrigation Pathway
20
Table 2-7 Processes and parameters
Process and parameter ANDRA EPRI JGC Studsvik Veszprem YMP
Leaf Area Index X X
Water storage per LAI X X
Absorption of activity X X
Interception fraction of nuclides
X X X X X
Interception fraction of irrigated water
X X
Irrigation rate/ events X X X X X X
Translocation X X X X1 X X
Weathering X X X X X
Harvest delay after irrigation X
Yield X X X X X X
Element chemical properties X X X
Fraction of spray irrigation X
Loss of activity due to food processing
X
2.2.2 ICRU definitions of Key Parameters in the Irrigation Pathway The ICRU is the International Commission on Radiation Units and Measurements. The ICRU was established in 1925 by the International Congress of Radiology. The principal objective is the development of internationally acceptable recommendations regarding (1) quantities and units of radiation and radioactivity; (2) procedures suitable for the measurement and application of these quantities in diagnostic radiology, radiation therapy, radiation biology, and industrial operations; and (3) physical data needed in the application of these procedures, the use of which tends to assure uniformity in reporting. The ICRU endeavours to collect and evaluate the latest data and information pertinent to the problems of radiation measurement and dosimetry, and to recommend in its publications the most acceptable values and techniques for current use. Where possible, the definitions described in ICRU Publication 65 [ICRU, 2001] are recommended. However, it is noted that special care is needed in the interpretation of data for “translocation” and some other parameters since they are not uniquely defined by ICRU.
2.2.3 Equations Comparison of the mathematical approaches given in Section 2.1 allows us to indicate some differences. Although all agencies consider the use of irrigation water, individual specifications are somewhat different. A volume of irrigation water applied, an irrigation rate
1 Studsvik only consider translocation when modelling root vegetables (and cereals), not green vegetables.
BIOPROTA
BIOPROTA Theme 2, Task 1, April 2005, Model Review and Comparison for Spray Irrigation Pathway
21
or the number of irrigation events may be given. The yield of the crop in terms of kg/m2/y is considered by all; however some equations use fresh weight, others use dry weight. The concentration of radionuclides in irrigation water is obviously included by all participants, however some specify the source as being river (JGC), or well (Nirex).
Losses from the system are represented differently, for example, ANDRA uses a single loss term, called wash-off, without explicitly specifying the removal process. Other organisations consider mechanical weathering and include them within one weathering rate. The University of Veszprem use a different parameter; weathering half life time (in days) of the above ground plant. Losses from food processing are only considered by EPRI and JGC. In general, all rely on experimental data for which a distinction between wash-off and mechanical weathering was not possible (cf. Hinton et al. [1996]).
Translocation factors are considered by all organisations, however Studsvik only use this for root vegetables and cereals. An interception fraction is considered, by EPRI, JGC and the University of Veszprem. ANDRA models the interception fraction as a function of irrigation intensity leaf water retention.
Despite the differences highlighted, most models are very similar. A number of additional parameters are used by Studsvik or ANDRA, for example irrigation intensity, Leaf Area Index, retention factor, water storage capacity are implicitly included in transfer factors in the other models. Their explicit representation allows direct assessment of the importance of these parameters.
The majority of organisations use the same equations for all radionuclides they wish to consider, and simply adapt the radionuclide specific data. The above-mentioned approach by ANDRA was used for five of the radionuclides chosen for the intercomparison (Se-79, Tc-99, I-129, Np-237 and U-238). For Cl-36 ANDRA uses an isotope ratio approach developed in the Canadian Programme for I-129 and C-14 [Davis et al., 1993]. Plant contamination becomes in this case dominated by root uptake. The spray irrigation pathway is not considered.
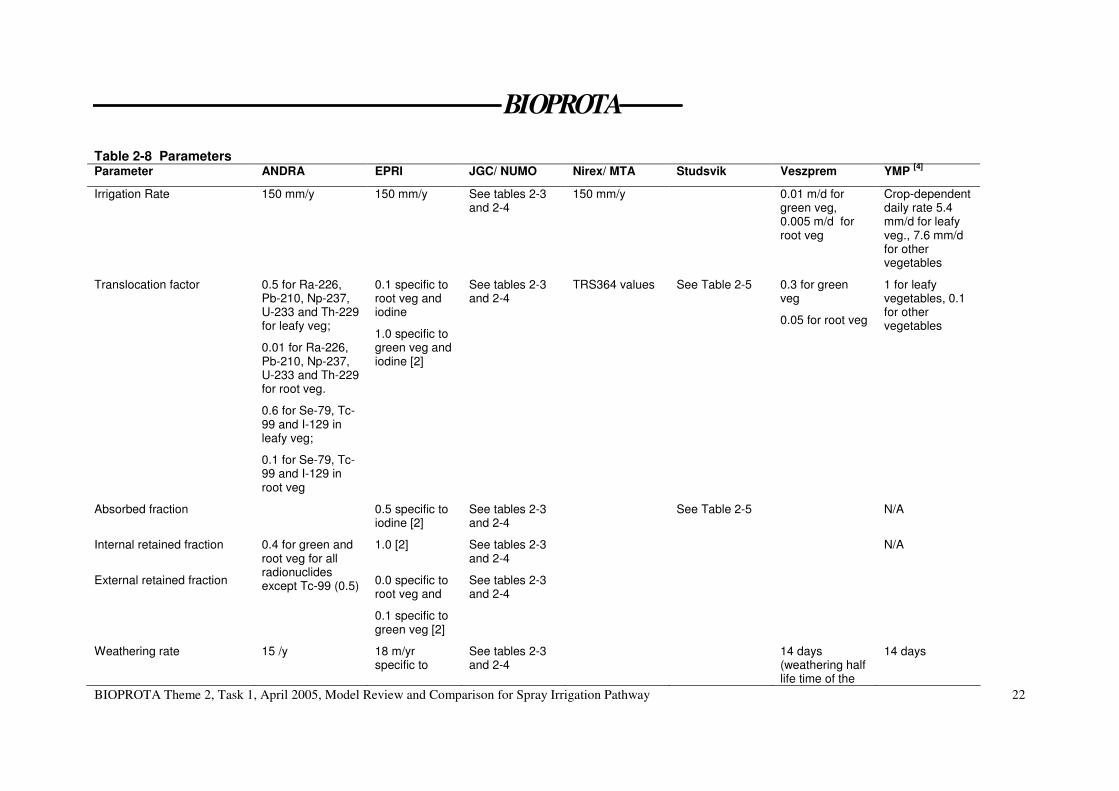
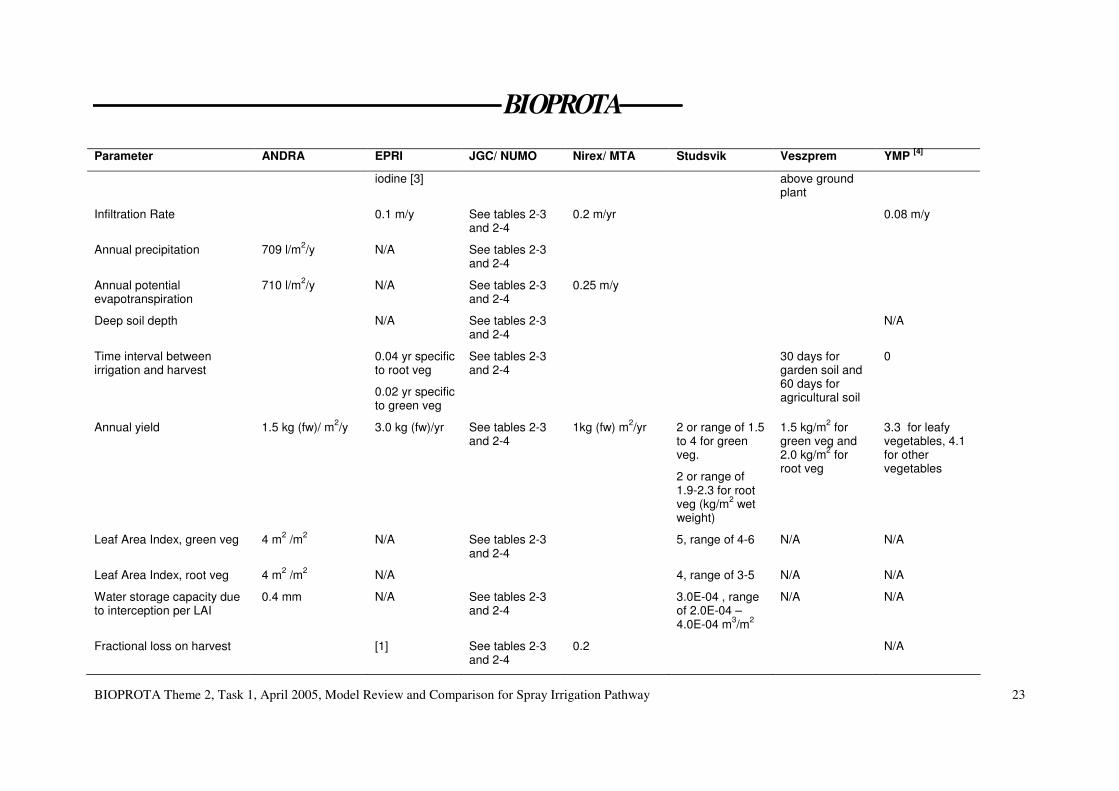
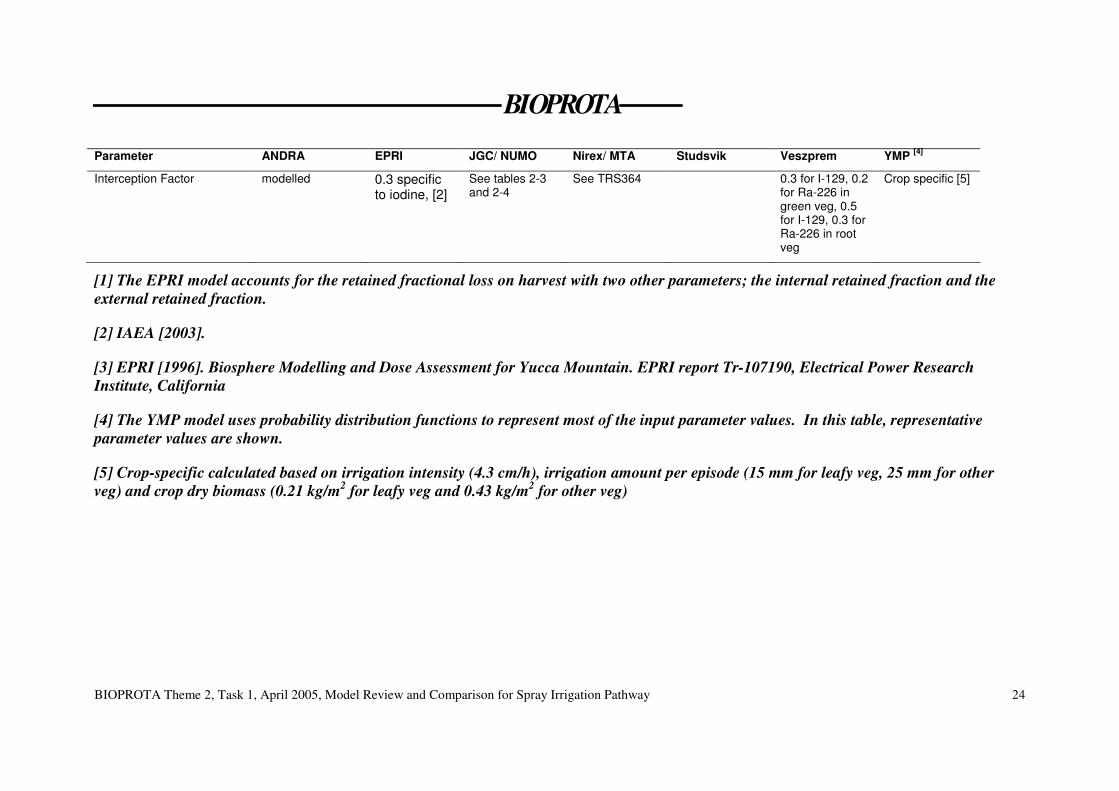
2.2.4 Parameters The parameter values used in the equations are detailed below in Table 2-8. The radionuclides considered by most organisations are Ra-226 (including ingrowth of Pb-210), Se-79, Cl-36, Np-237 (including ingrowth of U-233 and Th-228), I-129 and Tc-99. Some organisations also include Pu-239.
BIOPROTA
BIOPROTA Theme 2, Task 1, April 2005, Model Review and Comparison for Spray Irrigation Pathway
22
Table 2-8 Parameters Parameter ANDRA EPRI JGC/ NUMO Nirex/ MTA Studsvik Veszprem YMP [4]
Irrigation Rate 150 mm/y 150 mm/y See tables 2-3 and 2-4
150 mm/y 0.01 m/d for green veg, 0.005 m/d for root veg
Crop-dependent daily rate 5.4 mm/d for leafy veg., 7.6 mm/d for other vegetables
Translocation factor 0.5 for Ra-226, Pb-210, Np-237, U-233 and Th-229 for leafy veg;
0.01 for Ra-226, Pb-210, Np-237, U-233 and Th-229 for root veg.
0.6 for Se-79, Tc-99 and I-129 in leafy veg;
0.1 for Se-79, Tc-99 and I-129 in root veg
0.1 specific to root veg and iodine
1.0 specific to green veg and iodine [2]
See tables 2-3 and 2-4
TRS364 values See Table 2-5 0.3 for green veg
0.05 for root veg
1 for leafy vegetables, 0.1 for other vegetables
Absorbed fraction 0.5 specific to iodine [2]
See tables 2-3 and 2-4
See Table 2-5 N/A
Internal retained fraction 1.0 [2] See tables 2-3 and 2-4
N/A
External retained fraction
0.4 for green and root veg for all radionuclides except Tc-99 (0.5) 0.0 specific to
root veg and
0.1 specific to green veg [2]
See tables 2-3 and 2-4
Weathering rate 15 /y 18 m/yr specific to
See tables 2-3 and 2-4
14 days (weathering half life time of the
14 days
BIOPROTA
BIOPROTA Theme 2, Task 1, April 2005, Model Review and Comparison for Spray Irrigation Pathway
23
Parameter ANDRA EPRI JGC/ NUMO Nirex/ MTA Studsvik Veszprem YMP [4]
iodine [3] above ground plant
Infiltration Rate 0.1 m/y See tables 2-3 and 2-4
0.2 m/yr 0.08 m/y
Annual precipitation 709 l/m2/y N/A See tables 2-3 and 2-4
Annual potential evapotranspiration
710 l/m2/y N/A See tables 2-3 and 2-4
0.25 m/y
Deep soil depth N/A See tables 2-3 and 2-4
N/A
Time interval between irrigation and harvest
0.04 yr specific to root veg
0.02 yr specific to green veg
See tables 2-3 and 2-4
30 days for garden soil and 60 days for agricultural soil
0
Annual yield 1.5 kg (fw)/ m2/y 3.0 kg (fw)/yr See tables 2-3 and 2-4
1kg (fw) m2/yr 2 or range of 1.5 to 4 for green veg.
2 or range of 1.9-2.3 for root veg (kg/m2 wet weight)
1.5 kg/m2 for green veg and 2.0 kg/m2 for root veg
3.3 for leafy vegetables, 4.1 for other vegetables
Leaf Area Index, green veg 4 m2 /m2 N/A See tables 2-3
and 2-4 5, range of 4-6 N/A N/A
Leaf Area Index, root veg 4 m2 /m2 N/A 4, range of 3-5 N/A N/A
Water storage capacity due to interception per LAI
0.4 mm N/A See tables 2-3 and 2-4
3.0E-04 , range of 2.0E-04 – 4.0E-04 m3/m2
N/A N/A
Fractional loss on harvest [1] See tables 2-3 and 2-4
0.2 N/A
BIOPROTA
BIOPROTA Theme 2, Task 1, April 2005, Model Review and Comparison for Spray Irrigation Pathway
24
Parameter ANDRA EPRI JGC/ NUMO Nirex/ MTA Studsvik Veszprem YMP [4]
Interception Factor modelled 0.3 specific to iodine, [2]
See tables 2-3 and 2-4
See TRS364 0.3 for I-129, 0.2 for Ra-226 in green veg, 0.5 for I-129, 0.3 for Ra-226 in root veg
Crop specific [5]
[1] The EPRI model accounts for the retained fractional loss on harvest with two other parameters; the internal retained fraction and the external retained fraction.
[2] IAEA [2003].
[3] EPRI [1996]. Biosphere Modelling and Dose Assessment for Yucca Mountain. EPRI report Tr-107190, Electrical Power Research Institute, California
[4] The YMP model uses probability distribution functions to represent most of the input parameter values. In this table, representative parameter values are shown.
[5] Crop-specific calculated based on irrigation intensity (4.3 cm/h), irrigation amount per episode (15 mm for leafy veg, 25 mm for other veg) and crop dry biomass (0.21 kg/m2 for leafy veg and 0.43 kg/m2 for other veg)
BIOPROTA
BIOPROTA Theme 2, Task 1, April 2005, Model Review and Comparison for Spray Irrigation Pathway
25
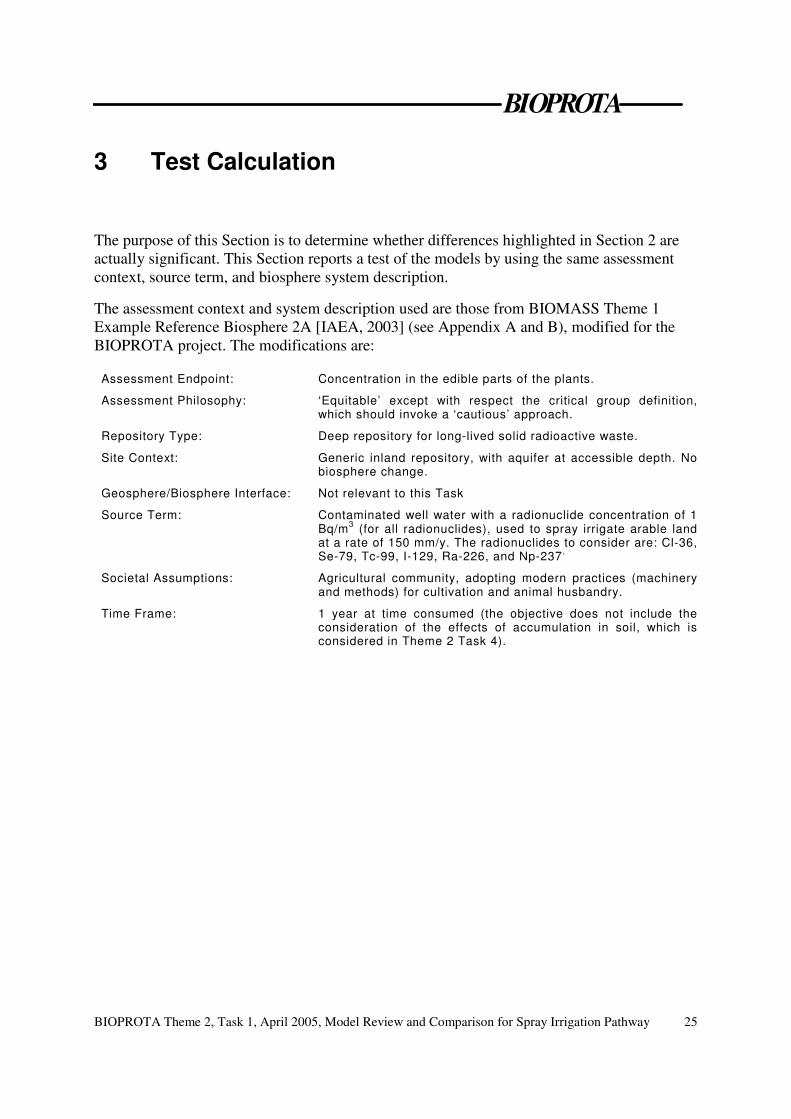
3 Test Calculation
The purpose of this Section is to determine whether differences highlighted in Section 2 are actually significant. This Section reports a test of the models by using the same assessment context, source term, and biosphere system description.
The assessment context and system description used are those from BIOMASS Theme 1 Example Reference Biosphere 2A [IAEA, 2003] (see Appendix A and B), modified for the BIOPROTA project. The modifications are:
Assessment Endpoint: Concentration in the edible parts of the plants.
Assessment Philosophy: ‘Equitable’ except with respect the critical group definition, which should invoke a ‘cautious’ approach.
Repository Type: Deep repository for long-lived solid radioactive waste.
Site Context: Generic inland repository, with aquifer at accessible depth. No biosphere change.
Geosphere/Biosphere Interface: Not relevant to this Task
Source Term: Contaminated well water with a radionuclide concentration of 1 Bq/m3 (for all radionuclides), used to spray irrigate arable land at a rate of 150 mm/y. The radionuclides to consider are: Cl-36, Se-79, Tc-99, I-129, Ra-226, and Np-237 .
Societal Assumptions: Agricultural community, adopting modern practices (machinery and methods) for cultivation and animal husbandry.
Time Frame: 1 year at time consumed (the objective does not include the consideration of the effects of accumulation in soil, which is considered in Theme 2 Task 4).
BIOPROTA
BIOPROTA Theme 2, Task 1, April 2005, Model Review and Comparison for Spray Irrigation Pathway
26
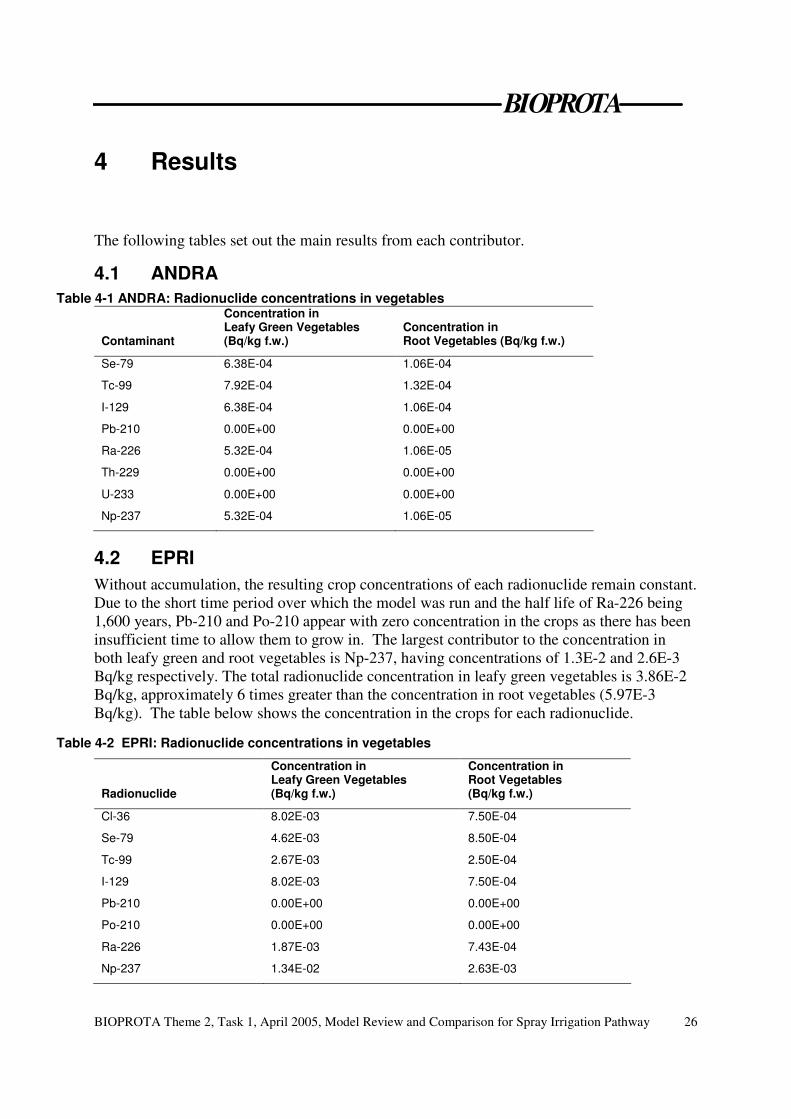
4 Results
The following tables set out the main results from each contributor.
4.1 ANDRA Table 4-1 ANDRA: Radionuclide concentrations in vegetables
Contaminant
Concentration in Leafy Green Vegetables (Bq/kg f.w.)
Concentration in Root Vegetables (Bq/kg f.w.)
Se-79 6.38E-04 1.06E-04
Tc-99 7.92E-04 1.32E-04
I-129 6.38E-04 1.06E-04
Pb-210 0.00E+00 0.00E+00
Ra-226 5.32E-04 1.06E-05
Th-229 0.00E+00 0.00E+00
U-233 0.00E+00 0.00E+00
Np-237 5.32E-04 1.06E-05
4.2 EPRI Without accumulation, the resulting crop concentrations of each radionuclide remain constant. Due to the short time period over which the model was run and the half life of Ra-226 being 1,600 years, Pb-210 and Po-210 appear with zero concentration in the crops as there has been insufficient time to allow them to grow in. The largest contributor to the concentration in both leafy green and root vegetables is Np-237, having concentrations of 1.3E-2 and 2.6E-3 Bq/kg respectively. The total radionuclide concentration in leafy green vegetables is 3.86E-2 Bq/kg, approximately 6 times greater than the concentration in root vegetables (5.97E-3 Bq/kg). The table below shows the concentration in the crops for each radionuclide.
Table 4-2 EPRI: Radionuclide concentrations in vegetables
Radionuclide
Concentration in Leafy Green Vegetables (Bq/kg f.w.)
Concentration in Root Vegetables (Bq/kg f.w.)
Cl-36 8.02E-03 7.50E-04
Se-79 4.62E-03 8.50E-04
Tc-99 2.67E-03 2.50E-04
I-129 8.02E-03 7.50E-04
Pb-210 0.00E+00 0.00E+00
Po-210 0.00E+00 0.00E+00
Ra-226 1.87E-03 7.43E-04
Np-237 1.34E-02 2.63E-03
BIOPROTA
BIOPROTA Theme 2, Task 1, April 2005, Model Review and Comparison for Spray Irrigation Pathway
27
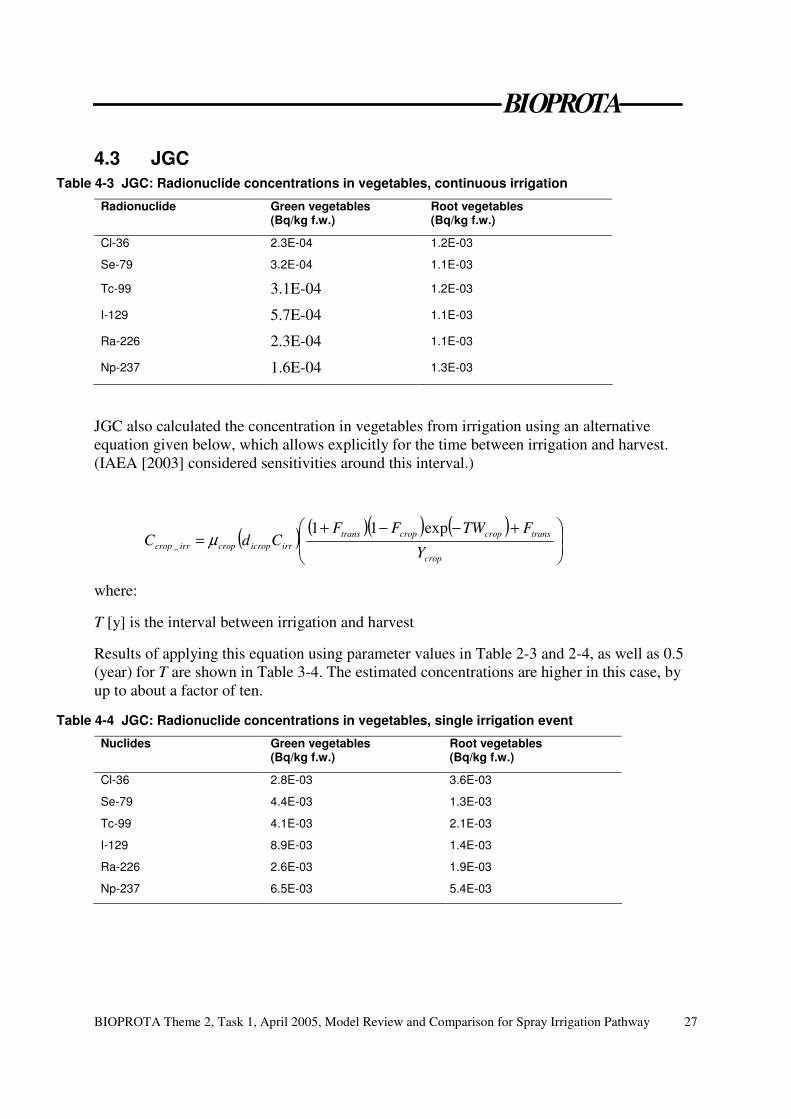
4.3 JGC Table 4-3 JGC: Radionuclide concentrations in vegetables, continuous irrigation
Radionuclide Green vegetables (Bq/kg f.w.)
Root vegetables (Bq/kg f.w.)
Cl-36 2.3E-04 1.2E-03
Se-79 3.2E-04 1.1E-03
Tc-99 3.1E-04 1.2E-03
I-129 5.7E-04 1.1E-03
Ra-226 2.3E-04 1.1E-03
Np-237 1.6E-04 1.3E-03
JGC also calculated the concentration in vegetables from irrigation using an alternative equation given below, which allows explicitly for the time between irrigation and harvest. (IAEA [2003] considered sensitivities around this interval.)
( ) ( )( ) ( )��
�
�
� +−−+=
crop
transcropcroptransirricropcropirrcrop Y
FTWFFCdC
exp11_ µ
where:
T [y] is the interval between irrigation and harvest
Results of applying this equation using parameter values in Table 2-3 and 2-4, as well as 0.5 (year) for T are shown in Table 3-4. The estimated concentrations are higher in this case, by up to about a factor of ten.
Table 4-4 JGC: Radionuclide concentrations in vegetables, single irrigation event
Nuclides Green vegetables (Bq/kg f.w.)
Root vegetables (Bq/kg f.w.)
Cl-36 2.8E-03 3.6E-03
Se-79 4.4E-03 1.3E-03
Tc-99 4.1E-03 2.1E-03
I-129 8.9E-03 1.4E-03
Ra-226 2.6E-03 1.9E-03
Np-237 6.5E-03 5.4E-03
BIOPROTA
BIOPROTA Theme 2, Task 1, April 2005, Model Review and Comparison for Spray Irrigation Pathway
28
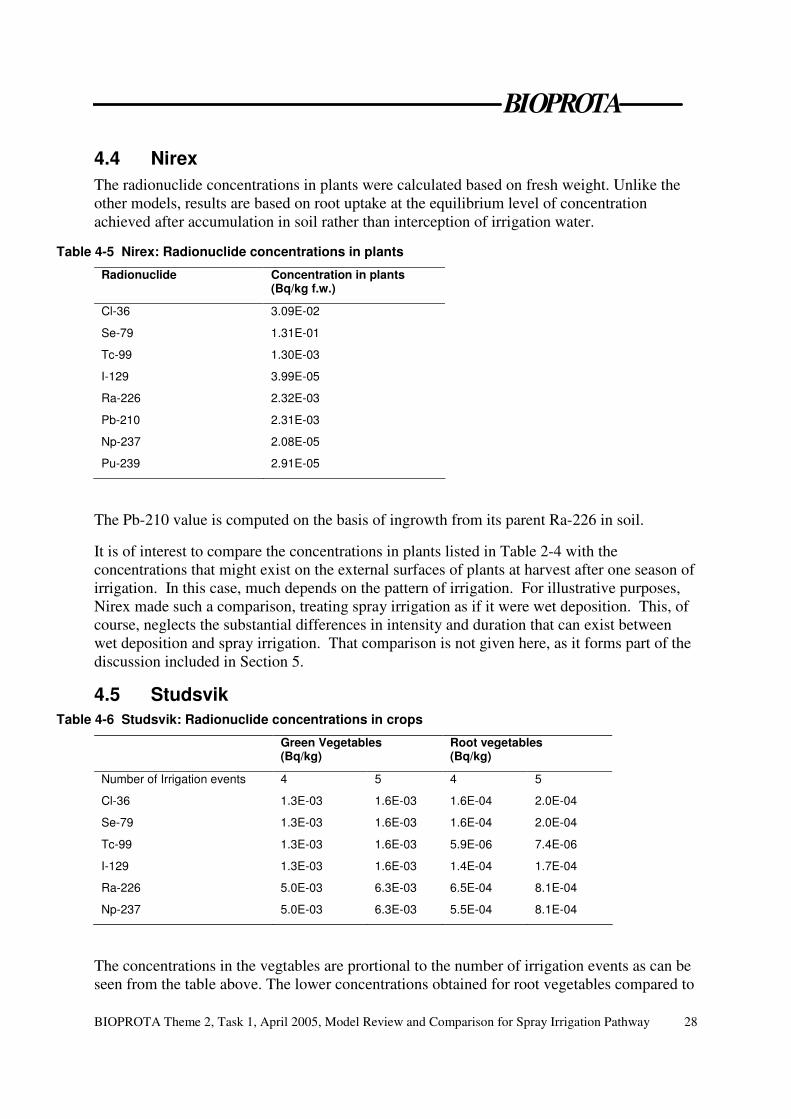
4.4 Nirex The radionuclide concentrations in plants were calculated based on fresh weight. Unlike the other models, results are based on root uptake at the equilibrium level of concentration achieved after accumulation in soil rather than interception of irrigation water.
Table 4-5 Nirex: Radionuclide concentrations in plants
Radionuclide Concentration in plants (Bq/kg f.w.)
Cl-36 3.09E-02
Se-79 1.31E-01
Tc-99 1.30E-03
I-129 3.99E-05
Ra-226 2.32E-03
Pb-210 2.31E-03
Np-237 2.08E-05
Pu-239 2.91E-05
The Pb-210 value is computed on the basis of ingrowth from its parent Ra-226 in soil.
It is of interest to compare the concentrations in plants listed in Table 2-4 with the concentrations that might exist on the external surfaces of plants at harvest after one season of irrigation. In this case, much depends on the pattern of irrigation. For illustrative purposes, Nirex made such a comparison, treating spray irrigation as if it were wet deposition. This, of course, neglects the substantial differences in intensity and duration that can exist between wet deposition and spray irrigation. That comparison is not given here, as it forms part of the discussion included in Section 5.
4.5 Studsvik Table 4-6 Studsvik: Radionuclide concentrations in crops
Green Vegetables (Bq/kg)
Root vegetables (Bq/kg)
Number of Irrigation events 4 5 4 5
Cl-36 1.3E-03 1.6E-03 1.6E-04 2.0E-04
Se-79 1.3E-03 1.6E-03 1.6E-04 2.0E-04
Tc-99 1.3E-03 1.6E-03 5.9E-06 7.4E-06
I-129 1.3E-03 1.6E-03 1.4E-04 1.7E-04
Ra-226 5.0E-03 6.3E-03 6.5E-04 8.1E-04
Np-237 5.0E-03 6.3E-03 5.5E-04 8.1E-04
The concentrations in the vegtables are prortional to the number of irrigation events as can be seen from the table above. The lower concentrations obtained for root vegetables compared to
BIOPROTA
BIOPROTA Theme 2, Task 1, April 2005, Model Review and Comparison for Spray Irrigation Pathway
29
green vegetables is a result of translocation being considered for root vegetables, but not for green vegetables.
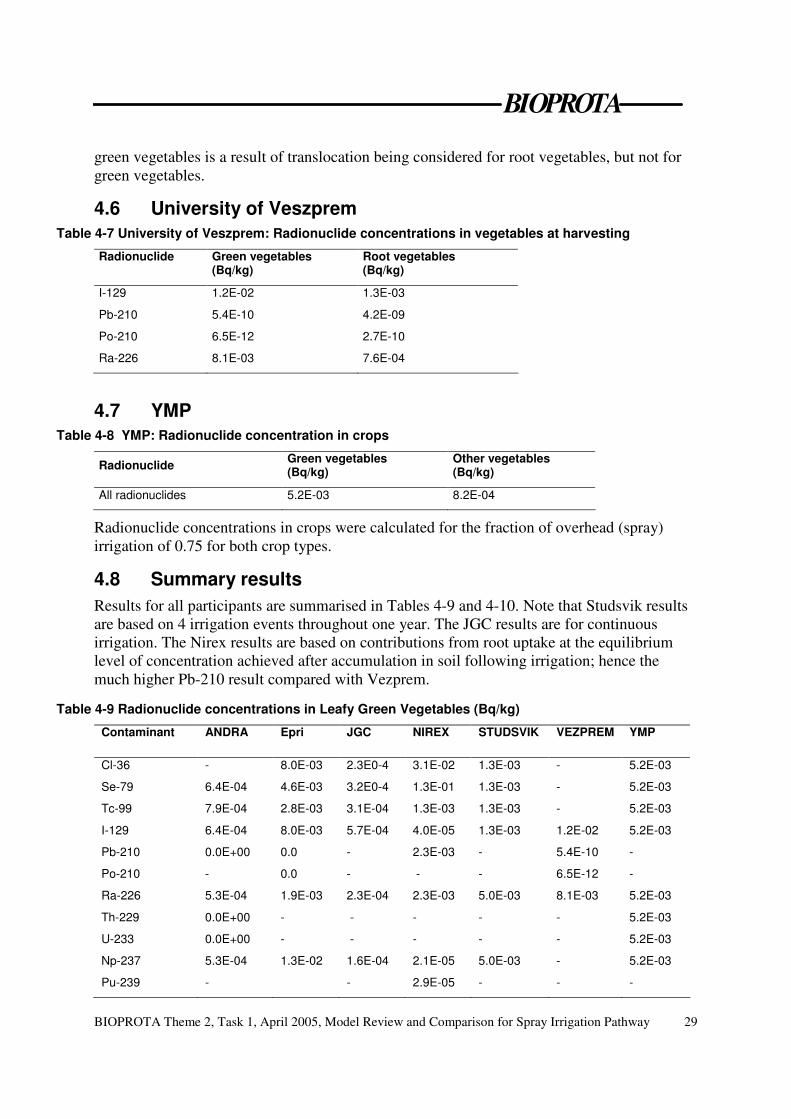
4.6 University of Veszprem Table 4-7 University of Veszprem: Radionuclide concentrations in vegetables at harvesting
Radionuclide Green vegetables (Bq/kg)
Root vegetables (Bq/kg)
I-129 1.2E-02 1.3E-03
Pb-210 5.4E-10 4.2E-09
Po-210 6.5E-12 2.7E-10
Ra-226 8.1E-03 7.6E-04
4.7 YMP Table 4-8 YMP: Radionuclide concentration in crops
Radionuclide Green vegetables (Bq/kg)
Other vegetables (Bq/kg)
All radionuclides 5.2E-03 8.2E-04
Radionuclide concentrations in crops were calculated for the fraction of overhead (spray) irrigation of 0.75 for both crop types.
4.8 Summary results Results for all participants are summarised in Tables 4-9 and 4-10. Note that Studsvik results are based on 4 irrigation events throughout one year. The JGC results are for continuous irrigation. The Nirex results are based on contributions from root uptake at the equilibrium level of concentration achieved after accumulation in soil following irrigation; hence the much higher Pb-210 result compared with Vezprem.
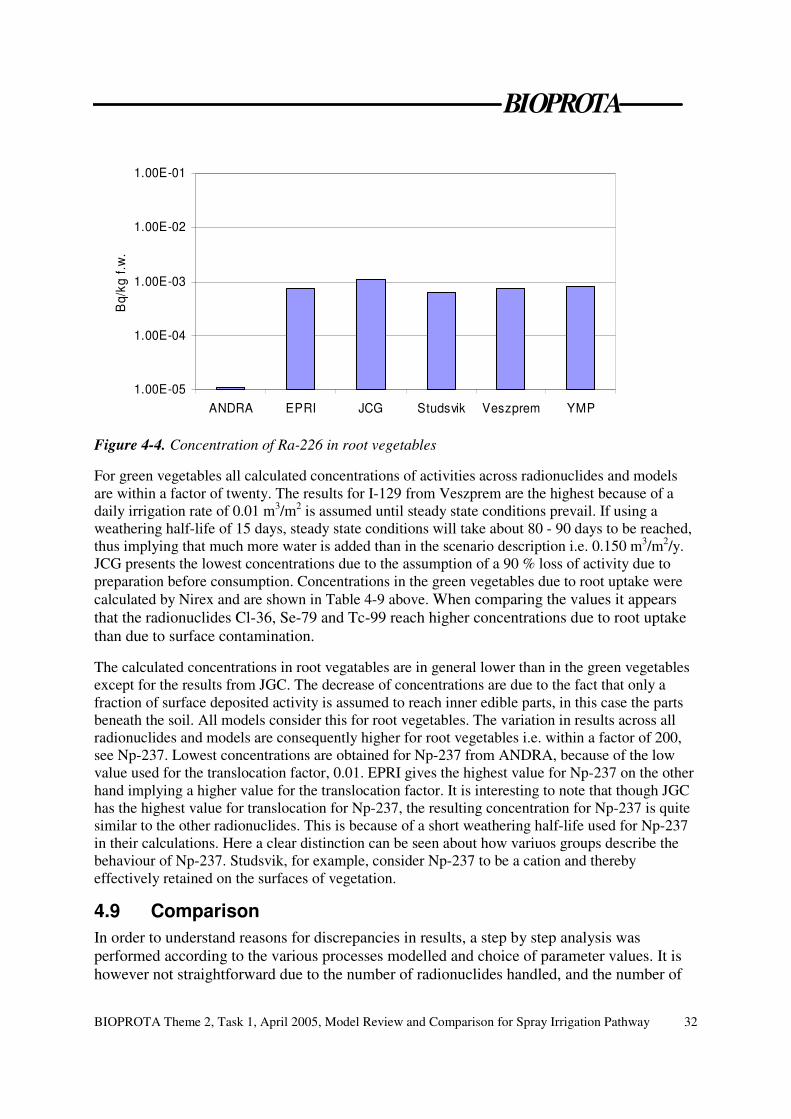
Table 4-9 Radionuclide concentrations in Leafy Green Vegetables (Bq/kg)
Contaminant ANDRA Epri JGC NIREX STUDSVIK VEZPREM YMP
Cl-36 - 8.0E-03 2.3E0-4 3.1E-02 1.3E-03 - 5.2E-03
Se-79 6.4E-04 4.6E-03 3.2E0-4 1.3E-01 1.3E-03 - 5.2E-03
Tc-99 7.9E-04 2.8E-03 3.1E-04 1.3E-03 1.3E-03 - 5.2E-03
I-129 6.4E-04 8.0E-03 5.7E-04 4.0E-05 1.3E-03 1.2E-02 5.2E-03
Pb-210 0.0E+00 0.0 - 2.3E-03 - 5.4E-10 -
Po-210 - 0.0 - - - 6.5E-12 -
Ra-226 5.3E-04 1.9E-03 2.3E-04 2.3E-03 5.0E-03 8.1E-03 5.2E-03
Th-229 0.0E+00 - - - - - 5.2E-03
U-233 0.0E+00 - - - - - 5.2E-03
Np-237 5.3E-04 1.3E-02 1.6E-04 2.1E-05 5.0E-03 - 5.2E-03
Pu-239 - - 2.9E-05 - - -
BIOPROTA
BIOPROTA Theme 2, Task 1, April 2005, Model Review and Comparison for Spray Irrigation Pathway
30
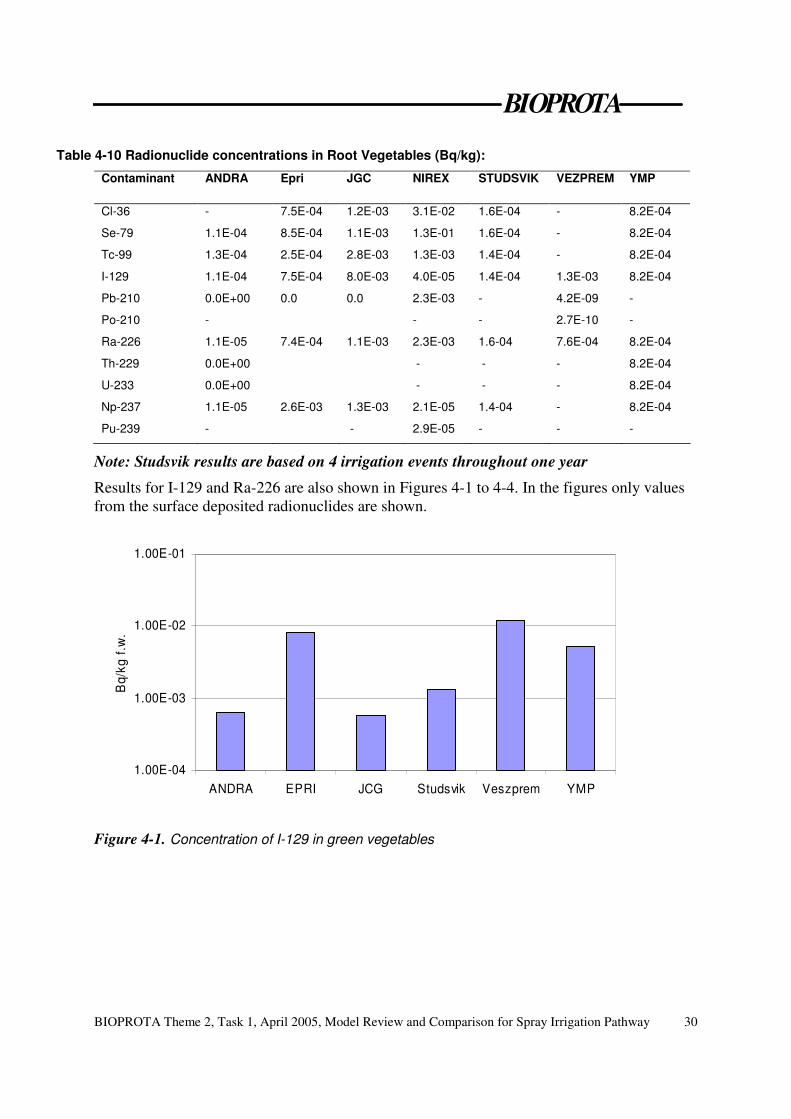
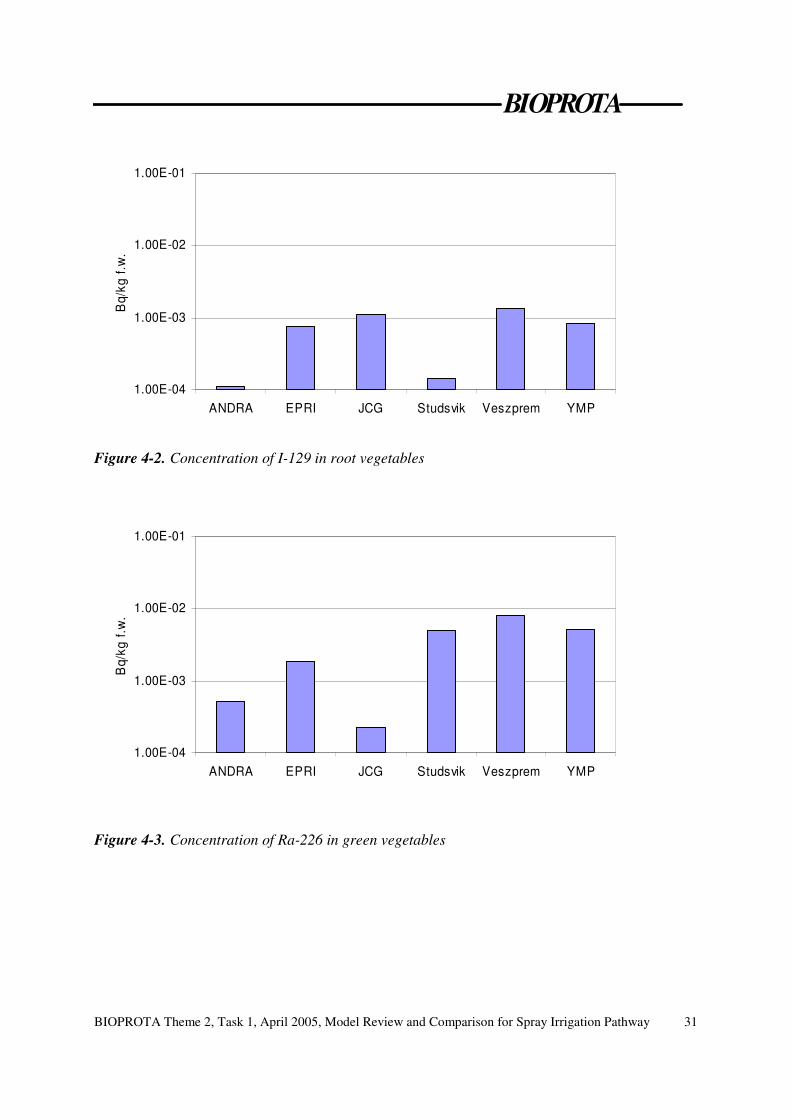
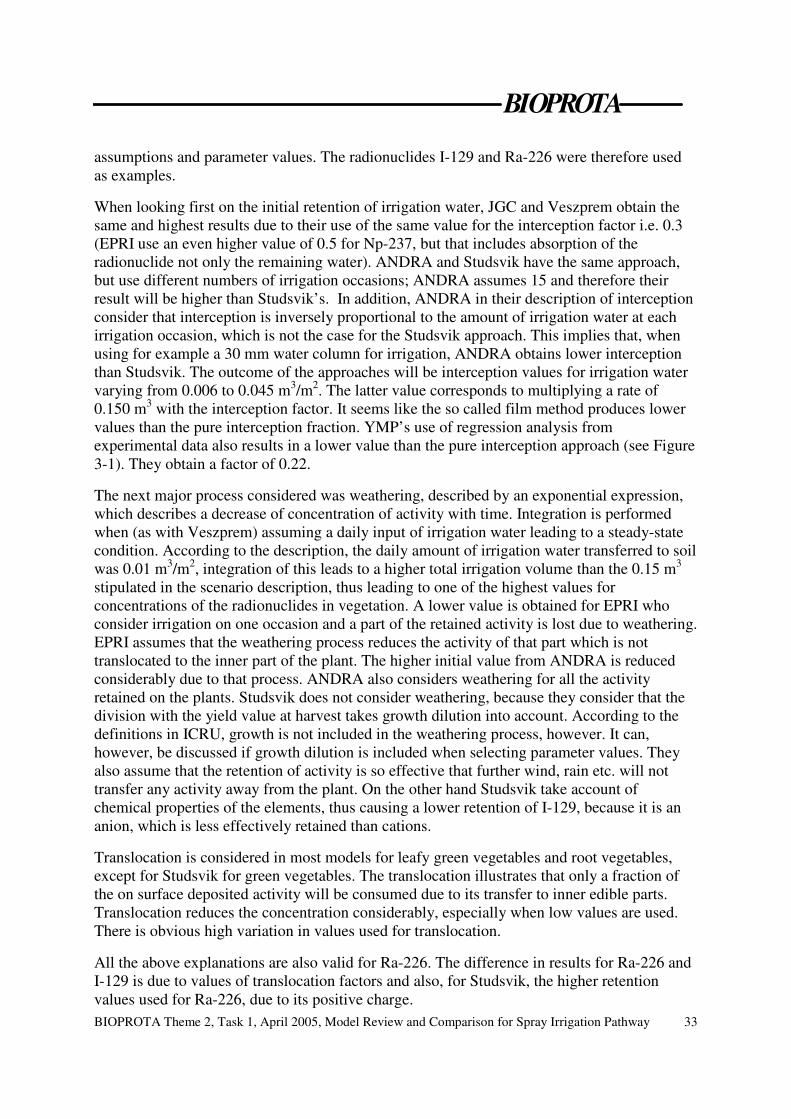
Table 4-10 Radionuclide concentrations in Root Vegetables (Bq/kg):
Contaminant ANDRA Epri JGC NIREX STUDSVIK VEZPREM YMP
Cl-36 - 7.5E-04 1.2E-03 3.1E-02 1.6E-04 - 8.2E-04
Se-79 1.1E-04 8.5E-04 1.1E-03 1.3E-01 1.6E-04 - 8.2E-04
Tc-99 1.3E-04 2.5E-04 2.8E-03 1.3E-03 1.4E-04 - 8.2E-04
I-129 1.1E-04 7.5E-04 8.0E-03 4.0E-05 1.4E-04 1.3E-03 8.2E-04
Pb-210 0.0E+00 0.0 0.0 2.3E-03 - 4.2E-09 -
Po-210 - - - 2.7E-10 -
Ra-226 1.1E-05 7.4E-04 1.1E-03 2.3E-03 1.6-04 7.6E-04 8.2E-04
Th-229 0.0E+00 - - - 8.2E-04
U-233 0.0E+00 - - - 8.2E-04
Np-237 1.1E-05 2.6E-03 1.3E-03 2.1E-05 1.4-04 - 8.2E-04
Pu-239 - - 2.9E-05 - - -
Note: Studsvik results are based on 4 irrigation events throughout one year
Results for I-129 and Ra-226 are also shown in Figures 4-1 to 4-4. In the figures only values from the surface deposited radionuclides are shown.
1.00E-04
1.00E-03
1.00E-02
1.00E-01
ANDRA EPRI JCG Studsvik Veszprem YMP
Bq/
kg f.
w.
Figure 4-1. Concentration of I-129 in green vegetables
BIOPROTA
BIOPROTA Theme 2, Task 1, April 2005, Model Review and Comparison for Spray Irrigation Pathway
31
1.00E-04
1.00E-03
1.00E-02
1.00E-01
ANDRA EPRI JCG Studsvik Veszprem YMP
Bq/
kg f.
w.
Figure 4-2. Concentration of I-129 in root vegetables
1.00E-04
1.00E-03
1.00E-02
1.00E-01
ANDRA EPRI JCG Studsvik Veszprem YMP
Bq/
kg f.
w.
Figure 4-3. Concentration of Ra-226 in green vegetables
BIOPROTA
BIOPROTA Theme 2, Task 1, April 2005, Model Review and Comparison for Spray Irrigation Pathway
32
1.00E-05
1.00E-04
1.00E-03
1.00E-02
1.00E-01
ANDRA EPRI JCG Studsvik Veszprem YMP
Bq/
kg f.
w.
Figure 4-4. Concentration of Ra-226 in root vegetables
For green vegetables all calculated concentrations of activities across radionuclides and models are within a factor of twenty. The results for I-129 from Veszprem are the highest because of a daily irrigation rate of 0.01 m3/m2 is assumed until steady state conditions prevail. If using a weathering half-life of 15 days, steady state conditions will take about 80 - 90 days to be reached, thus implying that much more water is added than in the scenario description i.e. 0.150 m3/m2/y. JCG presents the lowest concentrations due to the assumption of a 90 % loss of activity due to preparation before consumption. Concentrations in the green vegetables due to root uptake were calculated by Nirex and are shown in Table 4-9 above. When comparing the values it appears that the radionuclides Cl-36, Se-79 and Tc-99 reach higher concentrations due to root uptake than due to surface contamination.
The calculated concentrations in root vegatables are in general lower than in the green vegetables except for the results from JGC. The decrease of concentrations are due to the fact that only a fraction of surface deposited activity is assumed to reach inner edible parts, in this case the parts beneath the soil. All models consider this for root vegetables. The variation in results across all radionuclides and models are consequently higher for root vegetables i.e. within a factor of 200, see Np-237. Lowest concentrations are obtained for Np-237 from ANDRA, because of the low value used for the translocation factor, 0.01. EPRI gives the highest value for Np-237 on the other hand implying a higher value for the translocation factor. It is interesting to note that though JGC has the highest value for translocation for Np-237, the resulting concentration for Np-237 is quite similar to the other radionuclides. This is because of a short weathering half-life used for Np-237 in their calculations. Here a clear distinction can be seen about how variuos groups describe the behaviour of Np-237. Studsvik, for example, consider Np-237 to be a cation and thereby effectively retained on the surfaces of vegetation.
4.9 Comparison In order to understand reasons for discrepancies in results, a step by step analysis was performed according to the various processes modelled and choice of parameter values. It is however not straightforward due to the number of radionuclides handled, and the number of
BIOPROTA
BIOPROTA Theme 2, Task 1, April 2005, Model Review and Comparison for Spray Irrigation Pathway
33
assumptions and parameter values. The radionuclides I-129 and Ra-226 were therefore used as examples.
When looking first on the initial retention of irrigation water, JGC and Veszprem obtain the same and highest results due to their use of the same value for the interception factor i.e. 0.3 (EPRI use an even higher value of 0.5 for Np-237, but that includes absorption of the radionuclide not only the remaining water). ANDRA and Studsvik have the same approach, but use different numbers of irrigation occasions; ANDRA assumes 15 and therefore their result will be higher than Studsvik’s. In addition, ANDRA in their description of interception consider that interception is inversely proportional to the amount of irrigation water at each irrigation occasion, which is not the case for the Studsvik approach. This implies that, when using for example a 30 mm water column for irrigation, ANDRA obtains lower interception than Studsvik. The outcome of the approaches will be interception values for irrigation water varying from 0.006 to 0.045 m3/m2. The latter value corresponds to multiplying a rate of 0.150 m3 with the interception factor. It seems like the so called film method produces lower values than the pure interception fraction. YMP’s use of regression analysis from experimental data also results in a lower value than the pure interception approach (see Figure 3-1). They obtain a factor of 0.22.
The next major process considered was weathering, described by an exponential expression, which describes a decrease of concentration of activity with time. Integration is performed when (as with Veszprem) assuming a daily input of irrigation water leading to a steady-state condition. According to the description, the daily amount of irrigation water transferred to soil was 0.01 m3/m2, integration of this leads to a higher total irrigation volume than the 0.15 m3 stipulated in the scenario description, thus leading to one of the highest values for concentrations of the radionuclides in vegetation. A lower value is obtained for EPRI who consider irrigation on one occasion and a part of the retained activity is lost due to weathering. EPRI assumes that the weathering process reduces the activity of that part which is not translocated to the inner part of the plant. The higher initial value from ANDRA is reduced considerably due to that process. ANDRA also considers weathering for all the activity retained on the plants. Studsvik does not consider weathering, because they consider that the division with the yield value at harvest takes growth dilution into account. According to the definitions in ICRU, growth is not included in the weathering process, however. It can, however, be discussed if growth dilution is included when selecting parameter values. They also assume that the retention of activity is so effective that further wind, rain etc. will not transfer any activity away from the plant. On the other hand Studsvik take account of chemical properties of the elements, thus causing a lower retention of I-129, because it is an anion, which is less effectively retained than cations.
Translocation is considered in most models for leafy green vegetables and root vegetables, except for Studsvik for green vegetables. The translocation illustrates that only a fraction of the on surface deposited activity will be consumed due to its transfer to inner edible parts. Translocation reduces the concentration considerably, especially when low values are used. There is obvious high variation in values used for translocation.
All the above explanations are also valid for Ra-226. The difference in results for Ra-226 and I-129 is due to values of translocation factors and also, for Studsvik, the higher retention values used for Ra-226, due to its positive charge.
BIOPROTA
BIOPROTA Theme 2, Task 1, April 2005, Model Review and Comparison for Spray Irrigation Pathway
34
How translocation is handled in the models differs also as some, such as EPRI, consider that a fraction of the surface deposited activity is transferred to inner edible parts, whereas others like Veszprem, ANDRA, and Studsvik consider the whole of the activity retained to be translocated.
BIOPROTA
BIOPROTA Theme 2, Task 1, April 2005, Model Review and Comparison for Spray Irrigation Pathway
35
5 Discussion
Following IAEA Technical Reports Series No. 364 (TRS364) [IAEA, 1994], wet deposition can be distinguished into two components: initial interception and translocation. Interception is typically characterized by values of the interaction fraction per unit biomass (f/B). Values of f/B are significantly higher for cations than anions. Depending on the maturity of the crop, the LAI can also be affected by the intensity and amount of irrigation.
Values for translocation are given in Table IV of IAEA Technical Reports Series No. 364. These values are defined as the ratio of the activity concentration in edible parts at harvest (Bq/kg) to the activity deposited on the plants (Bq/m2). Thus, the units are m2/kg. The basis appears to be dry weight of plants, but this does not seem to be stated explicitly. Values for cereals and a few other crops are typically ~ 0.05 over the last 40 days before harvest, but drop off rapidly for radionuclide applications at earlier times in the season. Here, it is assumed that late-season irrigation is used, so a value of 0.05 m2/kg is adopted.
Thus, with an application of 0.15 Bq/m2 per year, as assumed for the calculations here, an interception fraction of 1.0 and a translocation factor of 0.05 m2/kg, a typical radionuclide concentration in the edible parts of plants at harvest after a single season of irrigation is 0.0075 Bq/kg on a dry weight basis. If the crops are green vegetables, they will typically exhibit a wet weight to dry weight ratio of approximately 10 [IAEA Technical Reports Series No. 364, Table V]. Thus, the typical radionuclide concentration becomes 0.00075 Bq/kg on a wet weight basis. As the plants are then harvested, the same calculation can be performed for any subsequent season.
The results in Tables 4-9 and 4-10 are all broadly consistent with the very generic picture indicated above. This is despite the varied way in which processes have been represented.
There are three main ways to model interception of irrigation water:
• using estimates from wet deposition, described by an interception factor;
• a process-oriented method, assuming a water layer retained on the surfaces of vegetation; or,
• regression of data obtained from an experimental study.
Furthermore, some assessment groups assume continuous irrigation whereas others take account of separate irrigation events. Some take account of element dependent differences in interception and translocation. There are different interpretations of translocation data.
Each method has its advantages:
BIOPROTA
BIOPROTA Theme 2, Task 1, April 2005, Model Review and Comparison for Spray Irrigation Pathway
36
• The so called wet deposition model demands few parameter values. It may however lead to either under- or over-estimates of surface contamination if consensus is not achieved concerning annual and daily irrigation rates.
• The film method is more process-oriented and flexible. It can be used by simple choice of parameter values to simulate plants at various stages of growth. It can also produce more plant-type specific results. It is also easy to keep control over irrigation volumes. However, time dependency was not taken into account in the example calculations given above.
BIOPROTA
BIOPROTA Theme 2, Task 1, April 2005, Model Review and Comparison for Spray Irrigation Pathway
37
6 Conclusions
A significant array of modelling methods has been presented and explained. The equations used and the data adopted have also been presented. This compilation may be useful for future reference.
Although the methods vary, most assessment results are within a factor of ten of each other. This is not a large range given the generic nature of the assessment question asked. This is generally due to compensating effects. For example, a high initial assumed retention factor is compensated for when weathering and translocation are then taken into account. That is to say, while different modelling approaches are taken, each conceptual model is internally consistent.
Overall, the results lend considerable confidence to the assessment community’s ability to assess doses as a result of food contamination due to the direct effects of irrigation.
The biggest reasons for discrepancies in results are associated with the treatment of weathering and translocation, post deposition. Values for translocation vary considerably between the participants and there are different interpretations of weathering and translocation data.
Another significant reason for differences in models and in results concerns the different irrigation practices used in different areas. These are largely climate driven.
Overall it appears that relatively simple models provide very similar results to the more process orientated and data demanding models.
Further consideration of the adequacy of the data for assessment purposes will depend on the relative significance of the pathway for contamination considered here with results for the effects of long term accumulation in soil, and exposures due to:
• root uptake;
• inhalation of suspended activity; and,
• external irradiation.
The first two of these three have been considered in Tasks 2 and 4 of Theme 2 of BIOPROTA, within which correspondingly similar model descriptions and data compilations have been prepared, as well as assessment results based on similar system descriptions. External irradiation is a relatively simple exposure pathway to address, once the activity level in the soil has been evaluated, e.g. see IAEA [2003].
BIOPROTA
BIOPROTA Theme 2, Task 1, April 2005, Model Review and Comparison for Spray Irrigation Pathway
38
7 References
Albrecht A (2002) Mise à jour du calcul de la contamination de la plante par voie foliaire dans le modèle " tempéré " intégré dans le code AQUABIOS; Rapport Andra n° Z.NT.ASTR.02.079.
Bergström, U and Barkefors, C (2004). Irrigation in dose assessments models. Swedish Nuclear Fuel and Waste Management Co, SKB R-04-26
Chen J M and Black T A (1992). Defining leaf area index for non-flat leaves, Plant, Cell and Environment, 15: 421-429.
Davis, P A, Zach, R, Stephens, M E, Amiro, B D, Bird, G A, Reid, J A K, Sheppard, M I, Sheppard, S C, Stephenson, M (1993). The disposal of Canada's nuclear fuel waste: The biosphere model, BIOTRAC, for postclosure assessment; Rapport Whiteshell Laboratories n° AECL-10720, COG-93-10.
EPRI (1996). Biosphere Modelling and Dose Assessment for Yucca Mountain. EPRI report Tr-107190, Electrical Power Research Institute, California
Hinton T, Mc Donald M, Ivanov Y A, Arkhipov N, and Arkhipov A, (1996). Foliar Absorption of Resuspended 137Cs Relative to Other Pathways of Plant Contamination. J. Environ. Radioactivity, 30(1): 15-30.
Hoffman et al. (1989). Pasture grass interception and retention of I-131, Be-7 and insoluble microspheres deposited in rain. Oak Ridge TN. Office of Scientific and Technical Information, Report No. ORNL 6542, Cseinetia.
IAEA (2003). “Reference Biospheres” for solid radioactive waste disposal. Report of BIOMASS Theme 1 of the BIOsphere Modelling and ASSessment BIOMASS Programme, IAEA-BIOMASS-6. International Atomic Energy Agency, Vienna.
IAEA (1994). Technical Reports Series No. 364, Handbook of Parameter Values for the Prediction of Radionuclide Transfer in Temperate Environments, IAEA, Vienna.
ICRU (2001). Quantities, Units and Terms in Radioecology. Journal of the International Commission on Radiation Units and Measurements. Vol.1 No.2, 2001.
JNC (2000). H12: Project to establish the Scientific and Technical Basis for HLW Disposal in Japan. Supporting Report 3 Safety Assessment of the Geological Disposal System. Japan Nuclear Cycle Development Institute, Tokai-Mura, Japan.
Klos R A, Smith K R and Smith G M (1989). Calculations of the Radiological Impact of Unit Releases of Radionuclides to the Biosphere from Solid Waste Disposal Facilities. National Radiological Protection Board (UK
BIOPROTA
BIOPROTA Theme 2, Task 1, April 2005, Model Review and Comparison for Spray Irrigation Pathway
39
Monteith J L and Unsworth M H (1990). Principles of Environmental Physics. Edward Arnold, London, UK.
Müller H and Pröhl G (1993). ECOSYS-87: A dynamic model for assessing radiological consequences of nuclear accidents. Health Phys., 64(3): 232-252.
Pröhl G and Müller H (1996). Radiation exposure from radionuclides in ground water: an uncertainty analysis for selected exposure scenarios. Radiat. Environ. Biophys., 35: 205-218.
Thorne M C (2003). A Guide to the Spreadsheet Calculations for the Generic Performance Assessment, Mike Thorne and Associates Limited Report MTA/P0011D/2002-2; Issue 2, June 2003.
Walter H (1984). Vegetation of the Earth and Ecological Systems of the Geo-Biosphere, Eugene Ulmer, Stuttgart.

BIOPROTA
BIOPROTA Theme 2, Task 1, April 2005, Model Review and Comparison for Spray Irrigation Pathway
A1
Appendix A: Assessment Context
The BIOMASS Theme 1 Example Reference Biosphere 2A Assessment Context is set out as the basis for the calculations made here. The differences are set out in the main text at Section 3.
In practice, for a ‘real’ assessment, the principal consideration in justifying a particular choice of assessment approach and/or model is fitness for purpose. Hence, the overall assessment purpose is necessarily the main point of reference for developing a biosphere system description and assessment model. Other aspects of the Assessment Context (whether imposed or assumed) subsequently come into play by serving to circumscribe the assessment and model development process, consistent with the overall purpose.
However, the requirements of BIOMASS Theme 1 demanded that the different Examples should be designed to focus attention on different assessment issues that are of particular practical interest. Consequently, the secondary, ‘constraining’ components of the Assessment Context must necessarily take precedence in determining the Example Reference Biospheres. For Example 2A, these aspects of the assumed Assessment Context are summarised as:
Assessment Endpoint: Annual individual effective dose.
Assessment Philosophy: ‘Equitable’ except with respect the critical group definition, which should invoke a ‘cautious’ approach.
Repository Type: Deep repository for long-lived solid radioactive waste.
Site Context: Generic inland repository, with aquifer at accessible depth. No biosphere change.
Geosphere/Biosphere Interface: Well intruding into aquifer plume with abstraction at a rate consistent with domestic and agricultural use. Concentrations of radionuclides in the abstracted water (including relevant short-lived daughters) are provided by geosphere transport models.
Source Term: Constant unit concentration maintained indefinitely for each radionuclide. Nb-94, Tc-99, I-129 and Np-237. Chosen for consideration because they are representative of a range of physical and chemical behaviours and because of their importance in previous assessments.
Societal Assumptions: Agricultural community, adopting modern practices (machinery and methods) for cultivation and animal husbandry. The resources available to the community are such that it is capable of producing locally a high proportion of the total diet of most foodstuffs.
Time Frame: Up to 1 million years.
BIOPROTA
BIOPROTA Theme 2, Task 1, April 2005, Model Review and Comparison for Spray Irrigation Pathway
B1
Appendix B: Biosphere System Description
SCREENING OF SYSTEM CHARACTERISTICS The first step of the biosphere description procedure is to identify those characteristics and properties of each component of the biosphere system identified above that are relevant to providing an assessment-oriented description of the system. This is achieved by working through a checklist of common general characteristics, descriptive of potentially relevant features for each system component, and selecting specific items for their relevance to the overall assessment objective according to the assessment context and any additional assumptions invoked in the preceding system identification.
The following discussion summarises the screening arguments considered in respect of the different components of the biosphere system, taking account of the context set in Appendix A.
Climate Characteristics Consideration of climate characteristics contributes to providing a coherent overall description of the biosphere system, especially in so far as precipitation is an important contribution to the availability and quality of local surface resources (and hence demands on aquifer use). Other components of climate are important in determining the growth regime of plants, animal husbandry practices, water demand, etc. Table B1 summarises the screening arguments that have been deployed in respect of the climate characteristics of the biosphere system.
The assessment context for ERB2A specifies no biosphere change. Nevertheless, relatively short-term variability may be relevant to the radiological assessment, in so far as the use of water will be influenced by climate fluctuations over diurnal and seasonal timescales. Interannual and decadal variability have limited relevance to the determination of lifetime average exposures and it is assumed that they will be addressed through the selection of appropriate annual-average parameter values based on measurements over decades.
The geographical extent of the biosphere system is restricted to the region within which agricultural practices involving the use of well water are carried out by the local community. There is unlikely to be any significant spatial variability in climate over the domain of the biosphere system, particularly as it is assumed that the site is situated on a plain. This factor can therefore be considered irrelevant to the system description.
BIOPROTA
BIOPROTA Theme 2, Task 1, April 2005, Model Review and Comparison for Spray Irrigation Pathway
B2
Table B1: CLIMATE CHARACTERISTICS
Biosphere System Component
Characteristic Relevant? Comments
CII Climate characteristics
Temperature
Precipitation
Pressure
Wind speed/direction
Solar radiation
Y
Y
N
N
N
Temperature and precipitation determine basic productivity and need for irrigation
Pressure not relevant (no gas release)
Wind speed ruled out on basis of low importance (can determine evapotranspiration without it)
Effects covered in temperature
CII Temporal variability of climate
Diurnal
Seasonal
Interannual
Decadal
Y
Y
N
N
Probably not represented explicitly in models
Seasonal because it determines the growing season and need for irrigation
Longer term variations ruled out on basis of low relevance to lifetime average exposure
CII Spatial variability of climate
Latitude
Longitude
Altitude
Aspect
N
N
N
N
Spatial extent too small for climatic variation
No significant variation in a plains area
Aspect not relevant for a plains area
Geology, Soil and Topography Characteristics As the geosphere/biosphere interface is restricted to abstraction of water via a well, the only function of the saturated zone is to act as a sink for percolating water. Detailed characteristics of the underlying geology are therefore largely irrelevant, except in so far as they influence the properties of the soil and variably saturated zone. Soil characteristics are relevant to providing a description of the structure and composition of the substrate within which crops are grown. Table B2 summarises the screening arguments deployed in respect of these aspects of the biosphere system.
The topography does not have a major influence on the overall system description, although its characteristics may be relevant to considerations such as the description of field drainage. Table B2 summarises the screening arguments deployed in respect of this component of the biosphere system description.
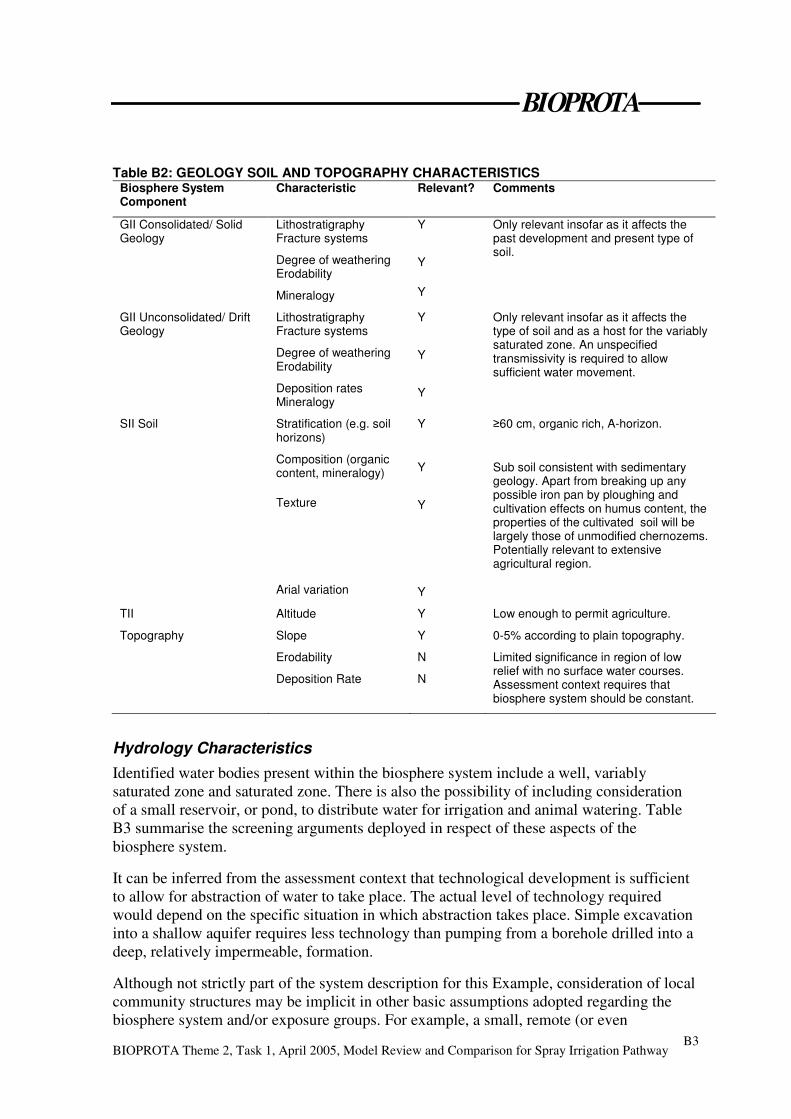
BIOPROTA
BIOPROTA Theme 2, Task 1, April 2005, Model Review and Comparison for Spray Irrigation Pathway
B3
Table B2: GEOLOGY SOIL AND TOPOGRAPHY CHARACTERISTICS Biosphere System Component
Characteristic Relevant? Comments
GII Consolidated/ Solid Geology
Lithostratigraphy Fracture systems
Degree of weathering Erodability
Mineralogy
Y
Y
Y
Only relevant insofar as it affects the past development and present type of soil.
GII Unconsolidated/ Drift Geology
Lithostratigraphy Fracture systems
Degree of weathering Erodability
Deposition rates Mineralogy
Y
Y
Y
Only relevant insofar as it affects the type of soil and as a host for the variably saturated zone. An unspecified transmissivity is required to allow sufficient water movement.
SII Soil Stratification (e.g. soil horizons)
Composition (organic content, mineralogy)
Texture
Arial variation
Y
Y
Y
Y
�60 cm, organic rich, A-horizon.
Sub soil consistent with sedimentary geology. Apart from breaking up any possible iron pan by ploughing and cultivation effects on humus content, the properties of the cultivated soil will be largely those of unmodified chernozems. Potentially relevant to extensive agricultural region.
TII
Topography
Altitude
Slope
Erodability
Deposition Rate
Y
Y
N
N
Low enough to permit agriculture.
0-5% according to plain topography.
Limited significance in region of low relief with no surface water courses. Assessment context requires that biosphere system should be constant.
Hydrology Characteristics Identified water bodies present within the biosphere system include a well, variably saturated zone and saturated zone. There is also the possibility of including consideration of a small reservoir, or pond, to distribute water for irrigation and animal watering. Table B3 summarise the screening arguments deployed in respect of these aspects of the biosphere system.
It can be inferred from the assessment context that technological development is sufficient to allow for abstraction of water to take place. The actual level of technology required would depend on the specific situation in which abstraction takes place. Simple excavation into a shallow aquifer requires less technology than pumping from a borehole drilled into a deep, relatively impermeable, formation.
Although not strictly part of the system description for this Example, consideration of local community structures may be implicit in other basic assumptions adopted regarding the biosphere system and/or exposure groups. For example, a small, remote (or even
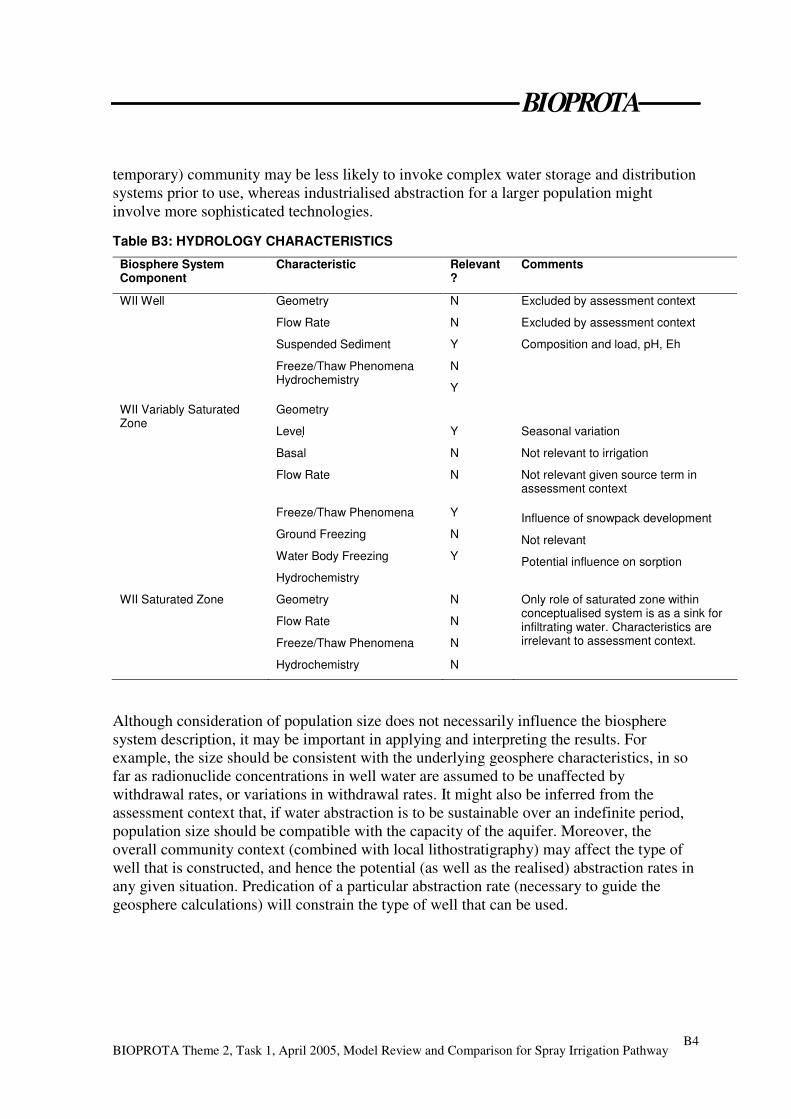
BIOPROTA
BIOPROTA Theme 2, Task 1, April 2005, Model Review and Comparison for Spray Irrigation Pathway
B4
temporary) community may be less likely to invoke complex water storage and distribution systems prior to use, whereas industrialised abstraction for a larger population might involve more sophisticated technologies.
Table B3: HYDROLOGY CHARACTERISTICS
Biosphere System Component
Characteristic Relevant?
Comments
WII Well Geometry
Flow Rate
Suspended Sediment
Freeze/Thaw Phenomena Hydrochemistry
N
N
Y
N
Y
Excluded by assessment context
Excluded by assessment context
Composition and load, pH, Eh
WII Variably Saturated Zone
Geometry
Level �
Basal
Flow Rate
Freeze/Thaw Phenomena
Ground Freezing
Water Body Freezing
Hydrochemistry
Y
N
N
Y
N
Y
Seasonal variation
Not relevant to irrigation
Not relevant given source term in assessment context
Influence of snowpack development
Not relevant
Potential influence on sorption
WII Saturated Zone Geometry
Flow Rate
Freeze/Thaw Phenomena
Hydrochemistry
N
N
N
N
Only role of saturated zone within conceptualised system is as a sink for infiltrating water. Characteristics are irrelevant to assessment context.
Although consideration of population size does not necessarily influence the biosphere system description, it may be important in applying and interpreting the results. For example, the size should be consistent with the underlying geosphere characteristics, in so far as radionuclide concentrations in well water are assumed to be unaffected by withdrawal rates, or variations in withdrawal rates. It might also be inferred from the assessment context that, if water abstraction is to be sustainable over an indefinite period, population size should be compatible with the capacity of the aquifer. Moreover, the overall community context (combined with local lithostratigraphy) may affect the type of well that is constructed, and hence the potential (as well as the realised) abstraction rates in any given situation. Predication of a particular abstraction rate (necessary to guide the geosphere calculations) will constrain the type of well that can be used.
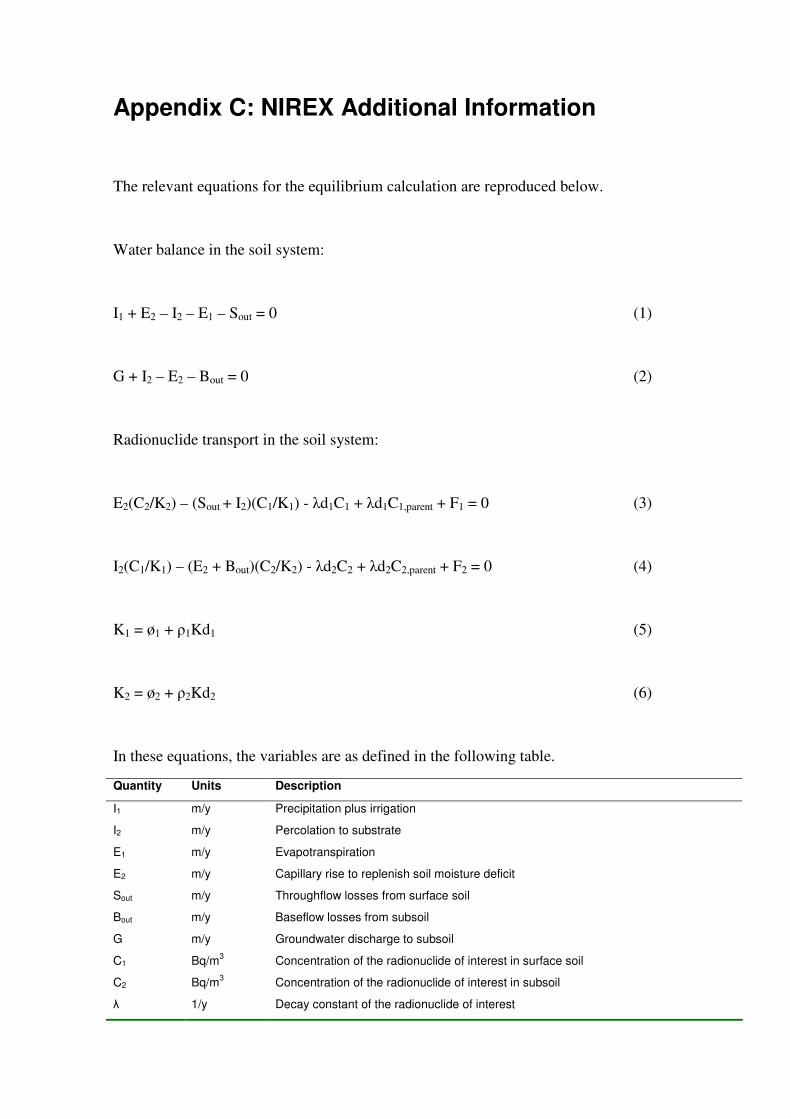
Appendix C: NIREX Additional Information
The relevant equations for the equilibrium calculation are reproduced below.
Water balance in the soil system:
I1 + E2 – I2 – E1 – Sout = 0 (1)
G + I2 – E2 – Bout = 0 (2)
Radionuclide transport in the soil system:
E2(C2/K2) – (Sout + I2)(C1/K1) - �d1C1 + �d1C1,parent + F1 = 0 (3)
I2(C1/K1) – (E2 + Bout)(C2/K2) - �d2C2 + �d2C2,parent + F2 = 0 (4)
K1 = ø1 + �1Kd1 (5)
K2 = ø2 + �2Kd2 (6)
In these equations, the variables are as defined in the following table.
Quantity Units Description
I1 m/y Precipitation plus irrigation
I2 m/y Percolation to substrate
E1 m/y Evapotranspiration
E2 m/y Capillary rise to replenish soil moisture deficit
Sout m/y Throughflow losses from surface soil
Bout m/y Baseflow losses from subsoil
G m/y Groundwater discharge to subsoil
C1 Bq/m3 Concentration of the radionuclide of interest in surface soil
C2 Bq/m3 Concentration of the radionuclide of interest in subsoil
� 1/y Decay constant of the radionuclide of interest
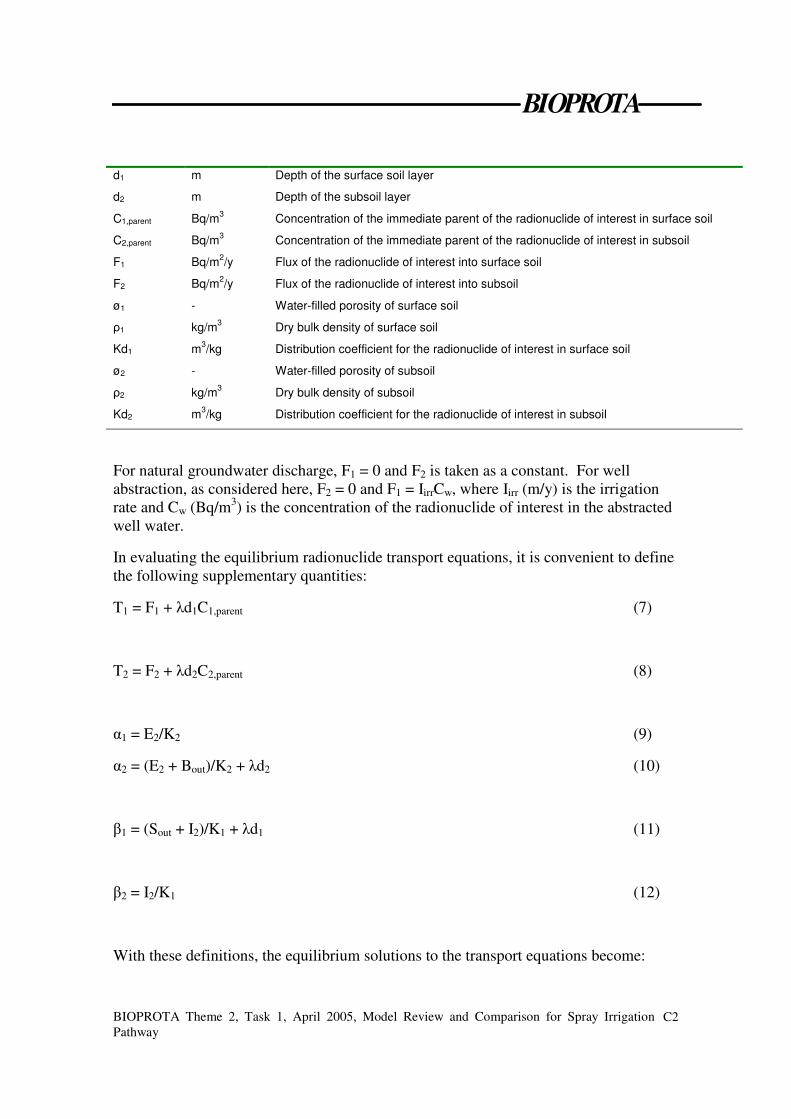
BIOPROTA
BIOPROTA Theme 2, Task 1, April 2005, Model Review and Comparison for Spray Irrigation Pathway
C2
d1 m Depth of the surface soil layer
d2 m Depth of the subsoil layer
C1,parent Bq/m3 Concentration of the immediate parent of the radionuclide of interest in surface soil
C2,parent Bq/m3 Concentration of the immediate parent of the radionuclide of interest in subsoil
F1 Bq/m2/y Flux of the radionuclide of interest into surface soil
F2 Bq/m2/y Flux of the radionuclide of interest into subsoil
ø1 - Water-filled porosity of surface soil
�1 kg/m3 Dry bulk density of surface soil
Kd1 m3/kg Distribution coefficient for the radionuclide of interest in surface soil
ø2 - Water-filled porosity of subsoil
�2 kg/m3 Dry bulk density of subsoil
Kd2 m3/kg Distribution coefficient for the radionuclide of interest in subsoil
For natural groundwater discharge, F1 = 0 and F2 is taken as a constant. For well abstraction, as considered here, F2 = 0 and F1 = IirrCw, where Iirr (m/y) is the irrigation rate and Cw (Bq/m3) is the concentration of the radionuclide of interest in the abstracted well water.
In evaluating the equilibrium radionuclide transport equations, it is convenient to define the following supplementary quantities:
T1 = F1 + �d1C1,parent (7)
T2 = F2 + �d2C2,parent (8)
�1 = E2/K2 (9)
�2 = (E2 + Bout)/K2 + �d2 (10)
�1 = (Sout + I2)/K1 + �d1 (11)
�2 = I2/K1 (12)
With these definitions, the equilibrium solutions to the transport equations become:
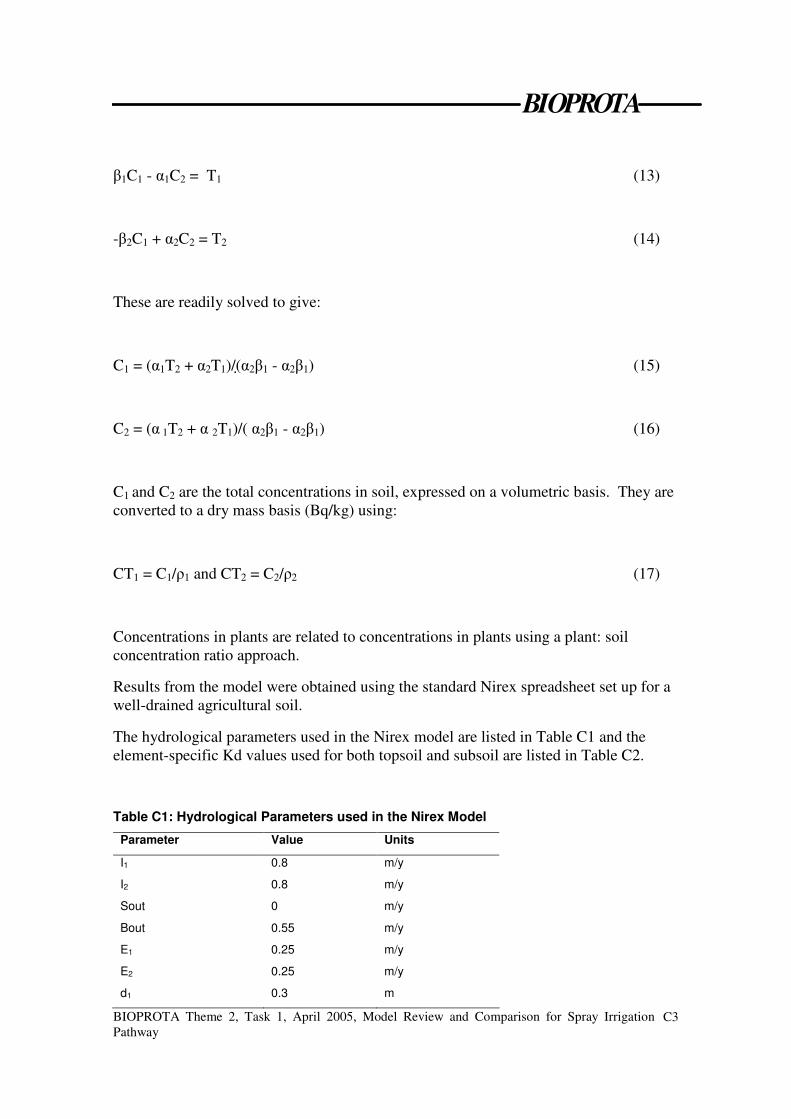
BIOPROTA
BIOPROTA Theme 2, Task 1, April 2005, Model Review and Comparison for Spray Irrigation Pathway
C3
�1C1 - �1C2 = T1 (13)
-�2C1 + �2C2 = T2 (14)
These are readily solved to give:
C1 = (�1T2 + �2T1)/(��2�1 - �2�1) (15)
C2 = (� 1T2 + � 2T1)/( �2�1 - �2�1) (16)
C1 and C2 are the total concentrations in soil, expressed on a volumetric basis. They are converted to a dry mass basis (Bq/kg) using:
CT1 = C1/�1 and CT2 = C2/�2 (17)
Concentrations in plants are related to concentrations in plants using a plant: soil concentration ratio approach.
Results from the model were obtained using the standard Nirex spreadsheet set up for a well-drained agricultural soil.
The hydrological parameters used in the Nirex model are listed in Table C1 and the element-specific Kd values used for both topsoil and subsoil are listed in Table C2.
Table C1: Hydrological Parameters used in the Nirex Model
Parameter Value Units
I1 0.8 m/y
I2 0.8 m/y
Sout 0 m/y
Bout 0.55 m/y
E1 0.25 m/y
E2 0.25 m/y
d1 0.3 m
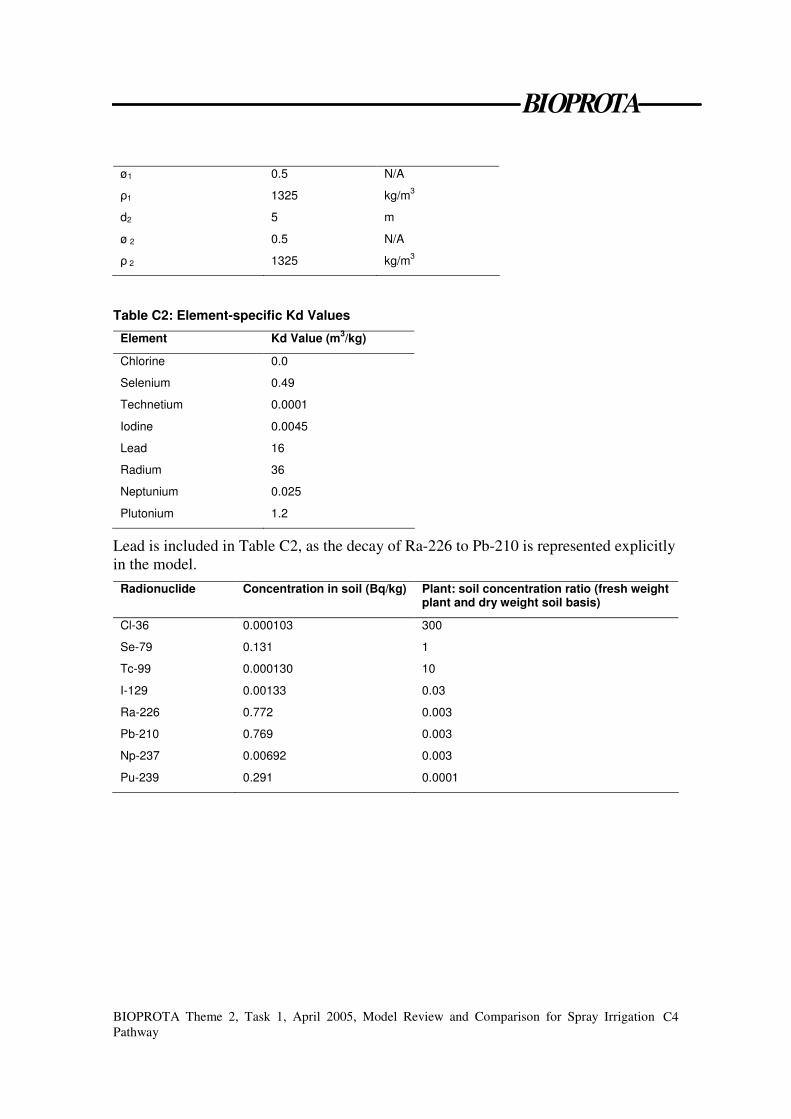
BIOPROTA
BIOPROTA Theme 2, Task 1, April 2005, Model Review and Comparison for Spray Irrigation Pathway
C4
ø1 0.5 N/A
�1 1325 kg/m3
d2 5 m
ø 2 0.5 N/A
� 2 1325 kg/m3
Table C2: Element-specific Kd Values
Element Kd Value (m3/kg)
Chlorine 0.0
Selenium 0.49
Technetium 0.0001
Iodine 0.0045
Lead 16
Radium 36
Neptunium 0.025
Plutonium 1.2
Lead is included in Table C2, as the decay of Ra-226 to Pb-210 is represented explicitly in the model.
Radionuclide Concentration in soil (Bq/kg) Plant: soil concentration ratio (fresh weight plant and dry weight soil basis)
Cl-36 0.000103 300
Se-79 0.131 1
Tc-99 0.000130 10
I-129 0.00133 0.03
Ra-226 0.772 0.003
Pb-210 0.769 0.003
Np-237 0.00692 0.003
Pu-239 0.291 0.0001