Embed Size (px)
Citation preview
Bioprocessing of Microbial Biomass: Enabling
Sustainable Zero-Discharge Seafood Production David Brune – University of Missouri at Columbia
D. E. Brune Professor of Bioprocess and Bioenergy Engineering University of Missouri, Columbia, Mo.
Zero-discharge Aquaculture; Cost and Energy Analysis
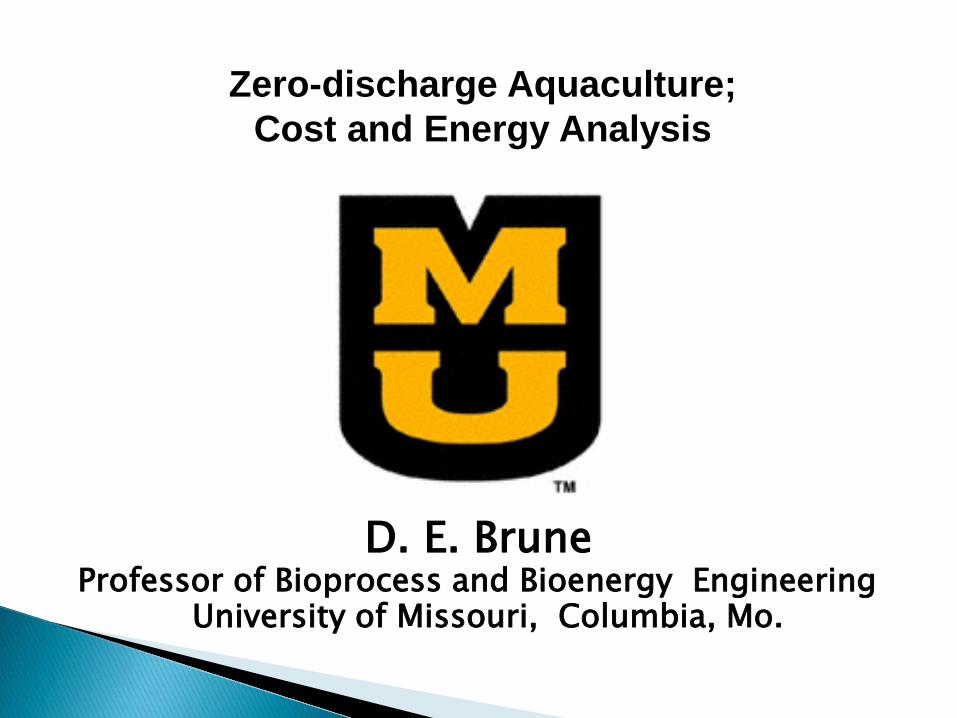
Marine Shrimp as a Cash Crop in the United States (R&D over 25 yrs)
A) Development of Zero-Discharge Aquaculture
Catfish Culture at Clemson University; 1989-2008 Shrimp Culture at Clemson University; 2001–2008 Shrimp Culture at University of Missouri; 2011–Present
B) Marine Shrimp Production Issues; Why/How Zero Discharge? Importance of Aquaculture Importance of Zero-Discharge Importance of Bioprocessing of Microbial Biomass
C) MU Shrimp Production Trials in 2013 D) Production Economics and Energy Footprint Comparisons E) Challenges to Systems Deployment F) What Next? G) Observations
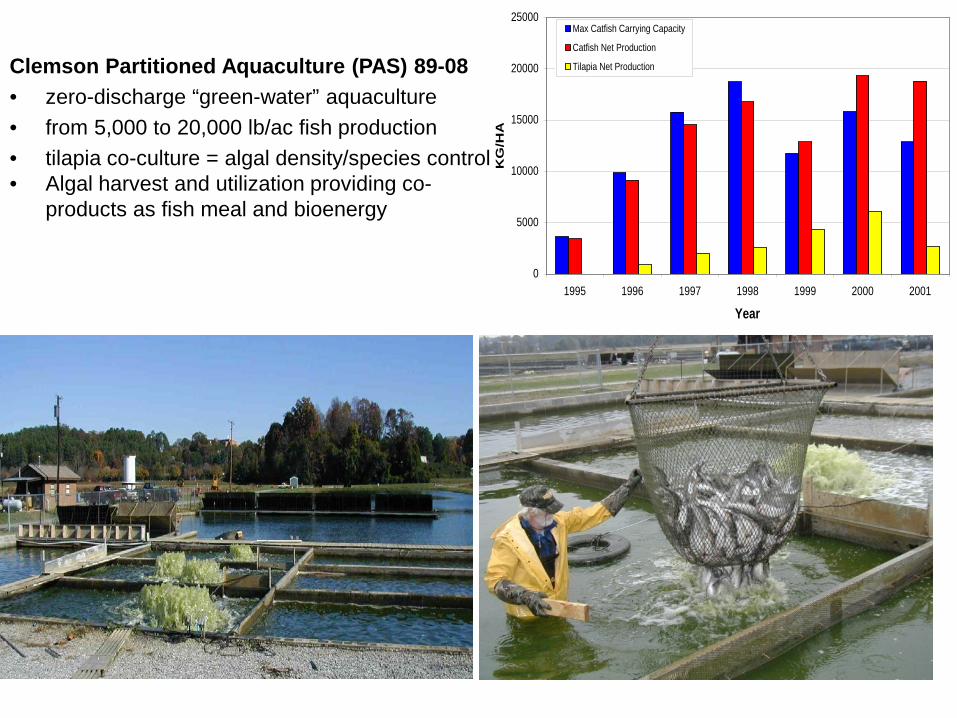
Clemson Partitioned Aquaculture (PAS) 89-08 • zero-discharge “green-water” aquaculture • from 5,000 to 20,000 lb/ac fish production • tilapia co-culture = algal density/species control • Algal harvest and utilization providing co-
products as fish meal and bioenergy
0
5000
10000
15000
20000
25000
1995 1996 1997 1998 1999 2000 2001
Year
KG
/HA
Max Catfish Carrying Capacity
Catfish Net Production
Tilapia Net Production
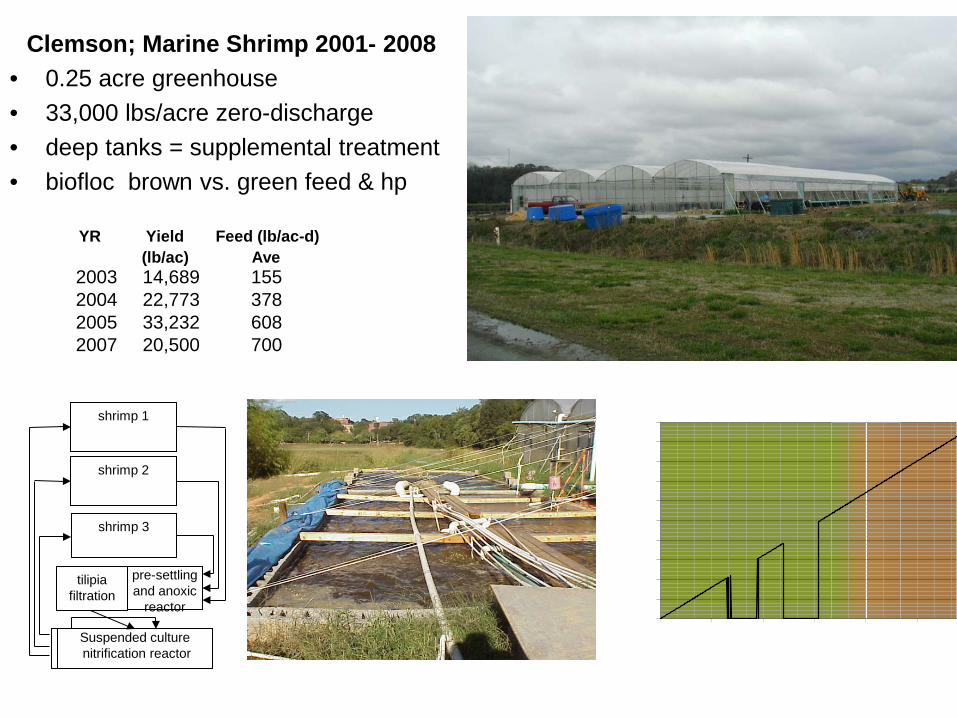
shrimp 1
shrimp 2
Suspended culture nitrification reactor
pre-settling and anoxic
reactor
shrimp 3
tilipia filtration
YR Yield Feed (lb/ac-d) (lb/ac) Ave 2003 14,689 155 2004 22,773 378 2005 33,232 608 2007 20,500 700
Clemson; Marine Shrimp 2001- 2008 • 0.25 acre greenhouse • 33,000 lbs/acre zero-discharge • deep tanks = supplemental treatment • biofloc brown vs. green feed & hp
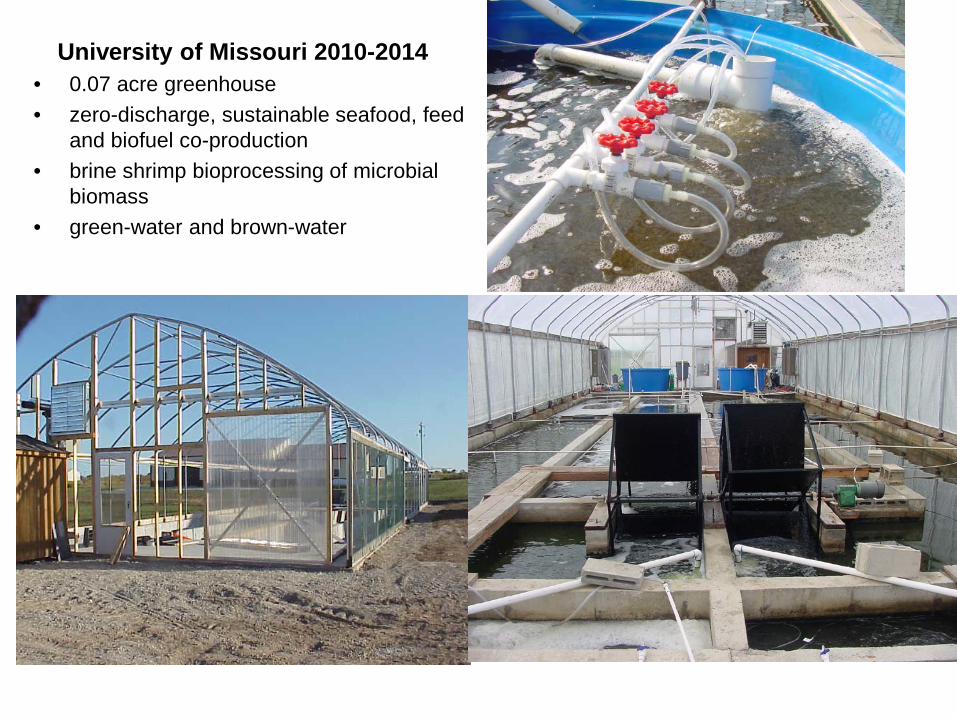
University of Missouri 2010-2014 • 0.07 acre greenhouse • zero-discharge, sustainable seafood, feed
and biofuel co-production • brine shrimp bioprocessing of microbial
biomass • green-water and brown-water
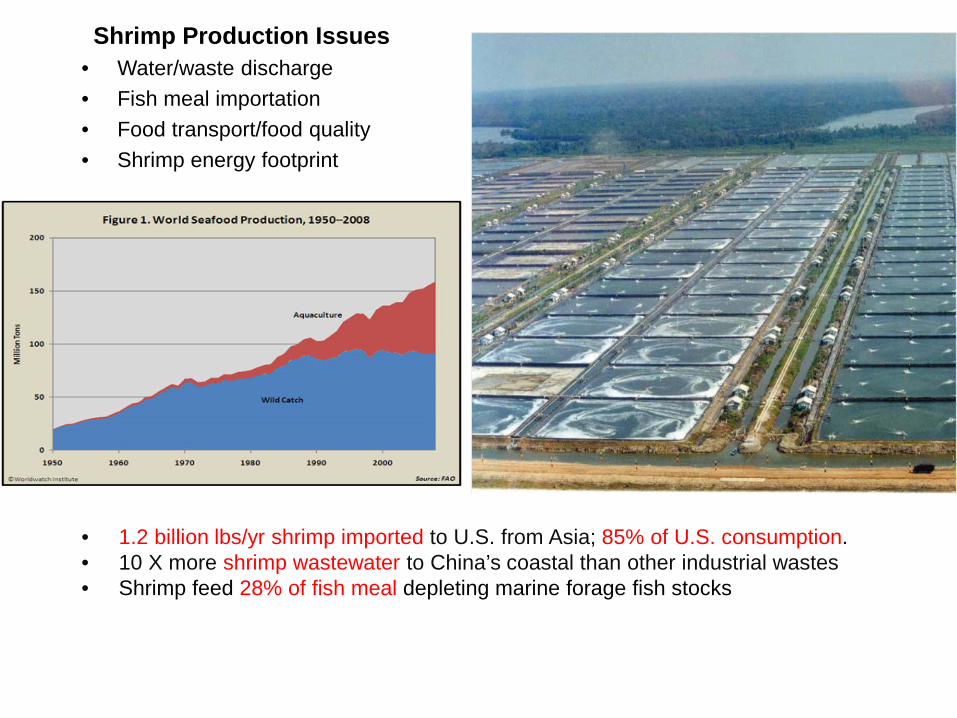
• 1.2 billion lbs/yr shrimp imported to U.S. from Asia; 85% of U.S. consumption. • 10 X more shrimp wastewater to China’s coastal than other industrial wastes • Shrimp feed 28% of fish meal depleting marine forage fish stocks
Shrimp Production Issues • Water/waste discharge • Fish meal importation • Food transport/food quality • Shrimp energy footprint

79 - 88% nitrogen
discharged as pollutant
Soy, corn & fish-meal nitrogen inputs
12 - 21% protein nitrogen converted to
fish or shrimp
Why is zero-discharge aquaculture needed? Animal agriculture recovers only a small fraction of feed-N
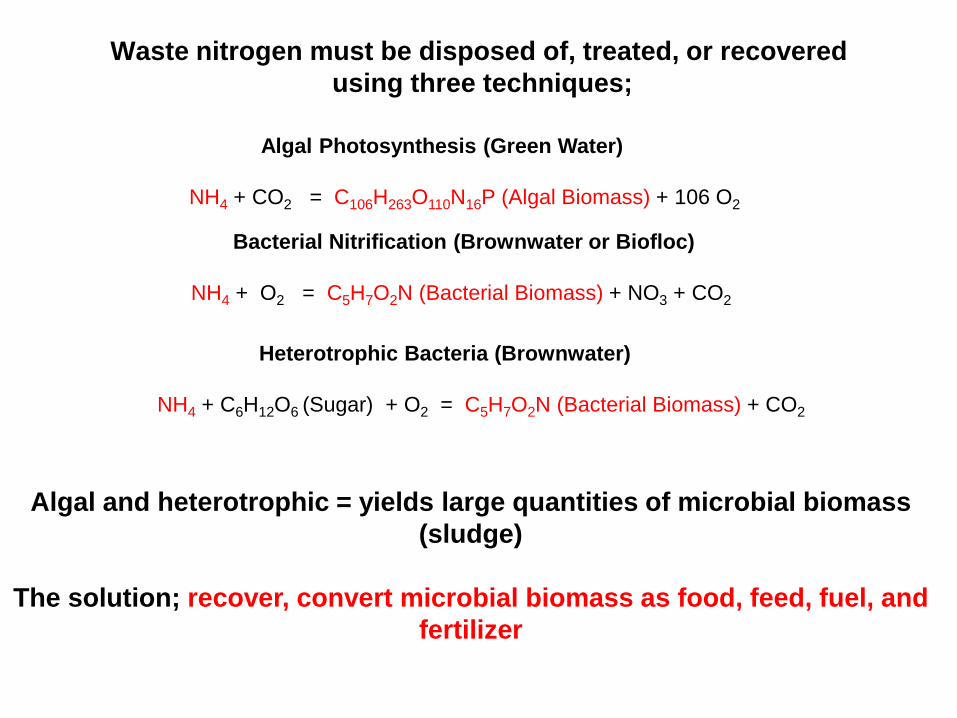
Waste nitrogen must be disposed of, treated, or recovered using three techniques;
Algal Photosynthesis (Green Water) NH4 + CO2 = C106H263O110N16P (Algal Biomass) + 106 O2
Bacterial Nitrification (Brownwater or Biofloc) NH4 + O2 = C5H7O2N (Bacterial Biomass) + NO3 + CO2
Heterotrophic Bacteria (Brownwater) NH4 + C6H12O6 (Sugar) + O2 = C5H7O2N (Bacterial Biomass) + CO2
Algal and heterotrophic = yields large quantities of microbial biomass
(sludge)
The solution; recover, convert microbial biomass as food, feed, fuel, and fertilizer
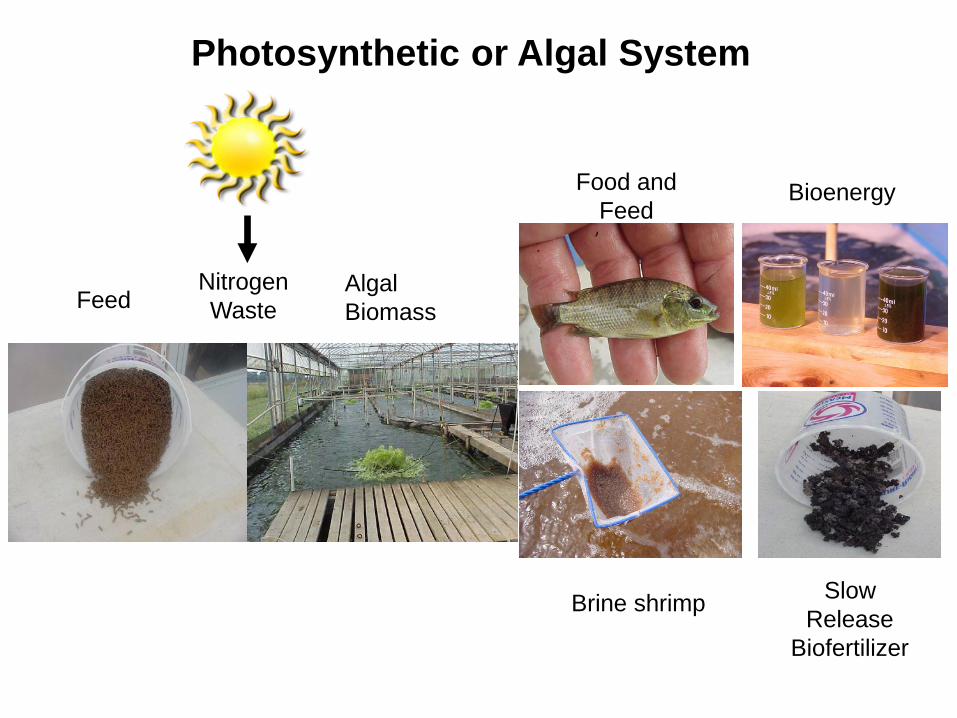
Feed Nitrogen Waste
Slow Release
Biofertilizer
Brine shrimp
Food and Feed
Bioenergy
Algal Biomass
Photosynthetic or Algal System
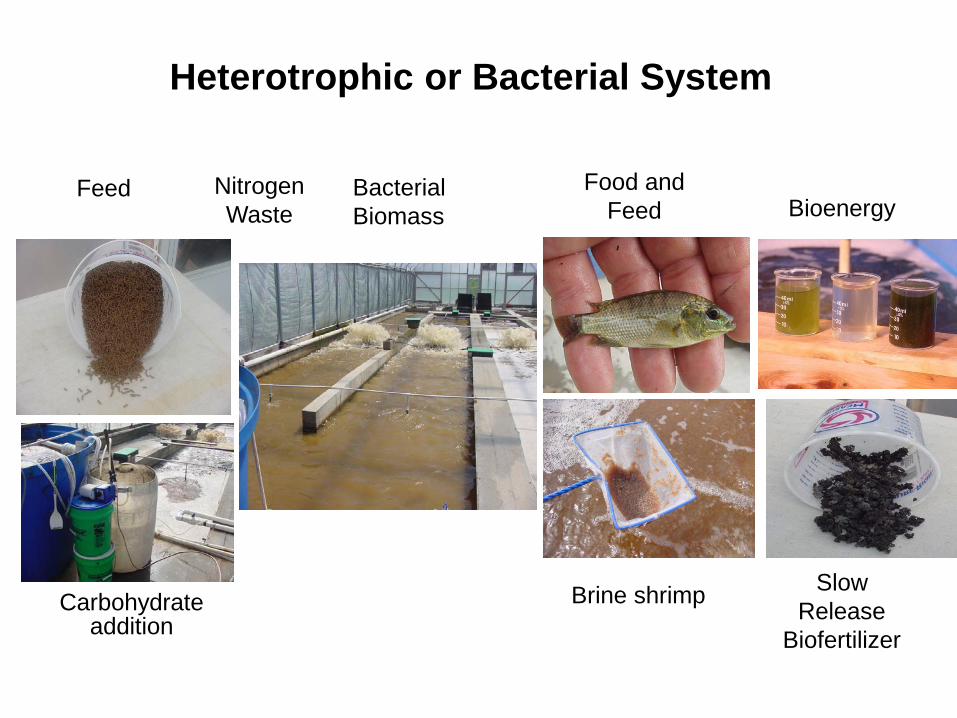
Feed Nitrogen Waste
Slow Release
Biofertilizer
Brine shrimp
Food and Feed Bioenergy
Heterotrophic or Bacterial System
Bacterial Biomass
Carbohydrate addition
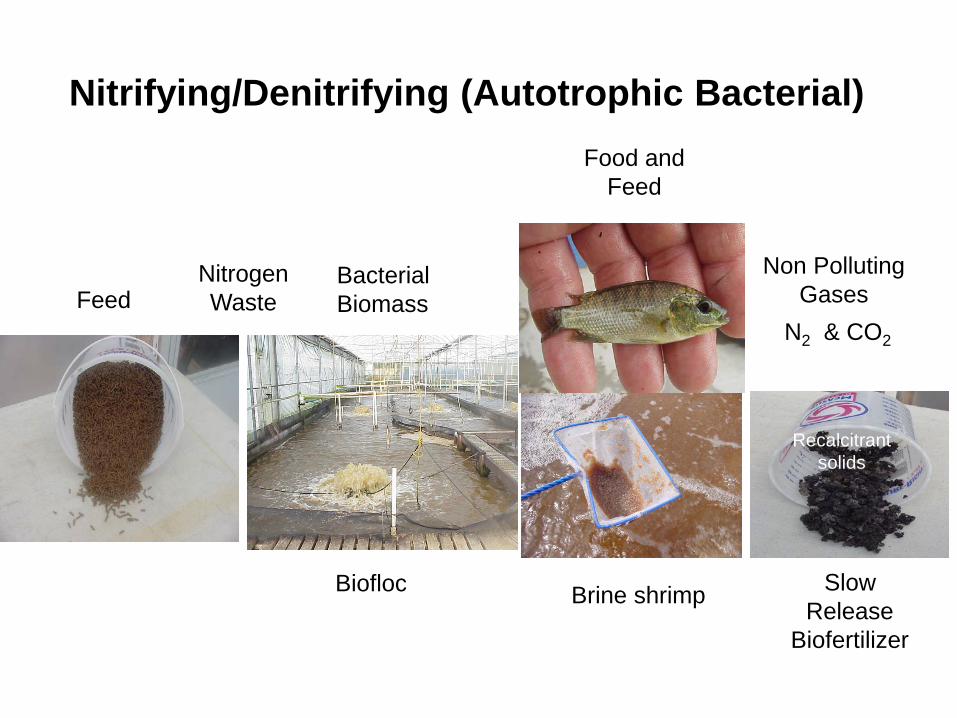
Feed Nitrogen Waste
Slow Release
Biofertilizer
Brine shrimp
Food and Feed
Nitrifying/Denitrifying (Autotrophic Bacterial)
Bacterial Biomass
Biofloc
Recalcitrant solids
N2 & CO2
Non Polluting Gases
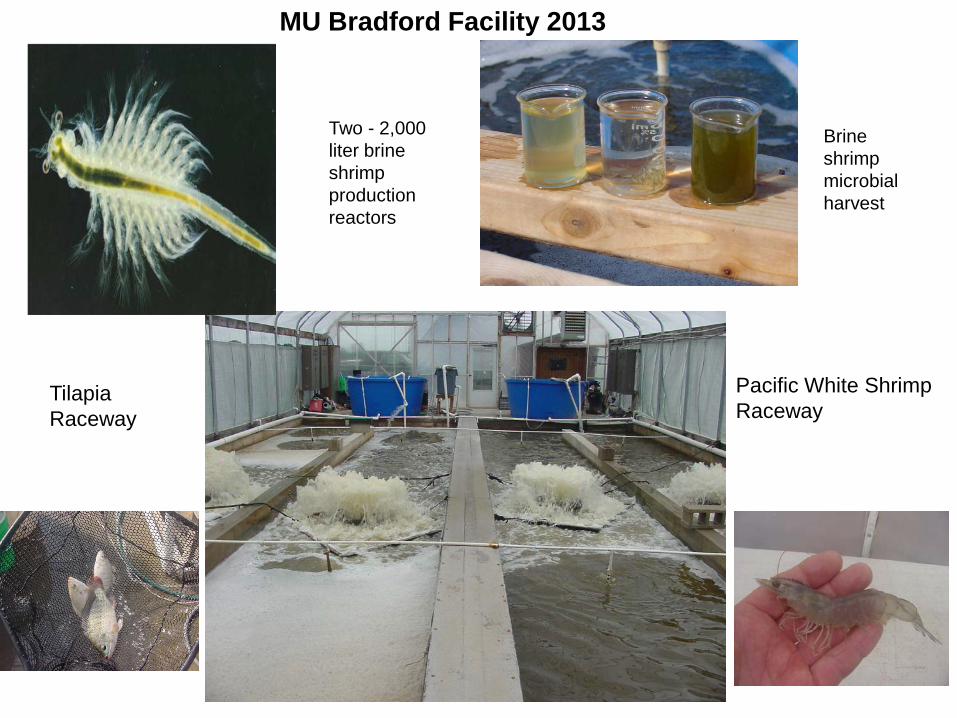
Tilapia Raceway
Pacific White Shrimp Raceway
MU Bradford Facility 2013
Two - 2,000 liter brine shrimp production reactors
Brine shrimp microbial harvest

UC-Davis (1983), Clemson University (2009)
Brune, D. E. et al., 2012, Aquacultural Processes for Harvest and Concentration of Algal Lipid for Biodiesel Production, U.S. Patent 2009-0181436.
• algal-harvest using aquatic animals; cost effective and energy efficient
• 50% conversion efficiency possible • higher-value product
Brune, D. E., Flowing Bed Method and Apparatus for Culturing Aquatic Organisms, U.S. Patent 4,369,691, Jan 1983
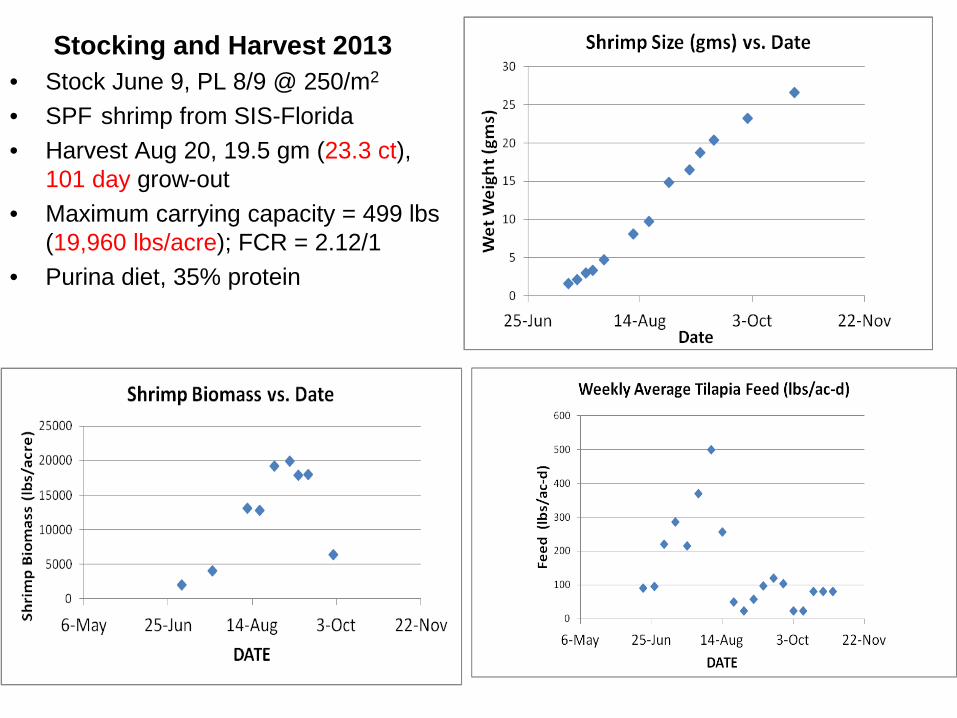
Stocking and Harvest 2013 • Stock June 9, PL 8/9 @ 250/m2
• SPF shrimp from SIS-Florida • Harvest Aug 20, 19.5 gm (23.3 ct),
101 day grow-out • Maximum carrying capacity = 499 lbs
(19,960 lbs/acre); FCR = 2.12/1 • Purina diet, 35% protein
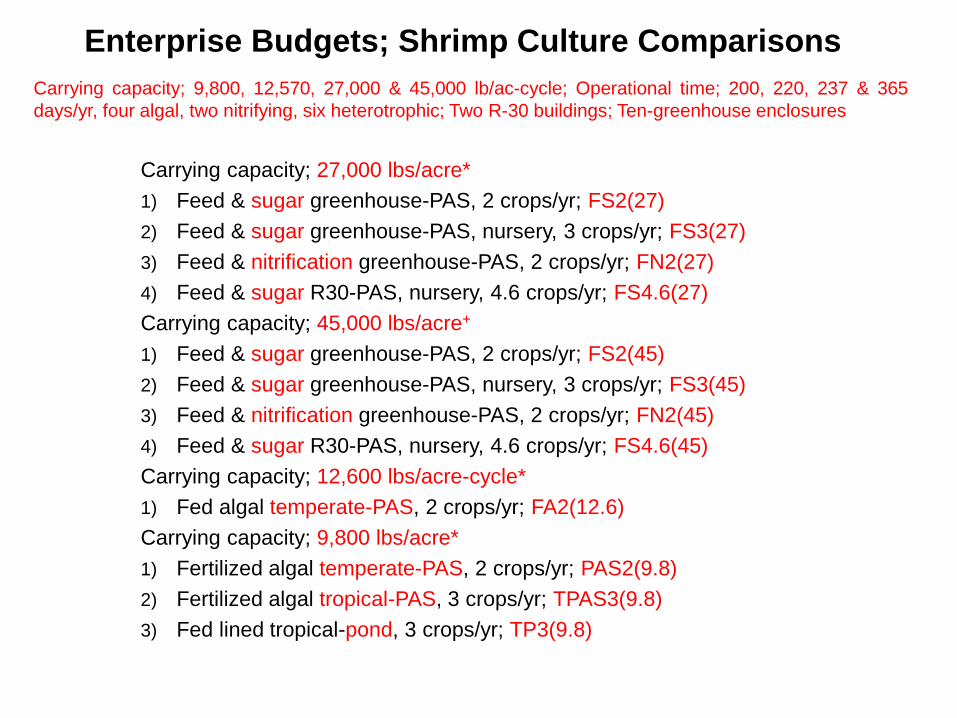
Enterprise Budgets; Shrimp Culture Comparisons
Carrying capacity; 27,000 lbs/acre* 1) Feed & sugar greenhouse-PAS, 2 crops/yr; FS2(27) 2) Feed & sugar greenhouse-PAS, nursery, 3 crops/yr; FS3(27) 3) Feed & nitrification greenhouse-PAS, 2 crops/yr; FN2(27) 4) Feed & sugar R30-PAS, nursery, 4.6 crops/yr; FS4.6(27) Carrying capacity; 45,000 lbs/acre+
1) Feed & sugar greenhouse-PAS, 2 crops/yr; FS2(45) 2) Feed & sugar greenhouse-PAS, nursery, 3 crops/yr; FS3(45) 3) Feed & nitrification greenhouse-PAS, 2 crops/yr; FN2(45) 4) Feed & sugar R30-PAS, nursery, 4.6 crops/yr; FS4.6(45) Carrying capacity; 12,600 lbs/acre-cycle* 1) Fed algal temperate-PAS, 2 crops/yr; FA2(12.6) Carrying capacity; 9,800 lbs/acre* 1) Fertilized algal temperate-PAS, 2 crops/yr; PAS2(9.8) 2) Fertilized algal tropical-PAS, 3 crops/yr; TPAS3(9.8) 3) Fed lined tropical-pond, 3 crops/yr; TP3(9.8)
Carrying capacity; 9,800, 12,570, 27,000 & 45,000 lb/ac-cycle; Operational time; 200, 220, 237 & 365 days/yr, four algal, two nitrifying, six heterotrophic; Two R-30 buildings; Ten-greenhouse enclosures
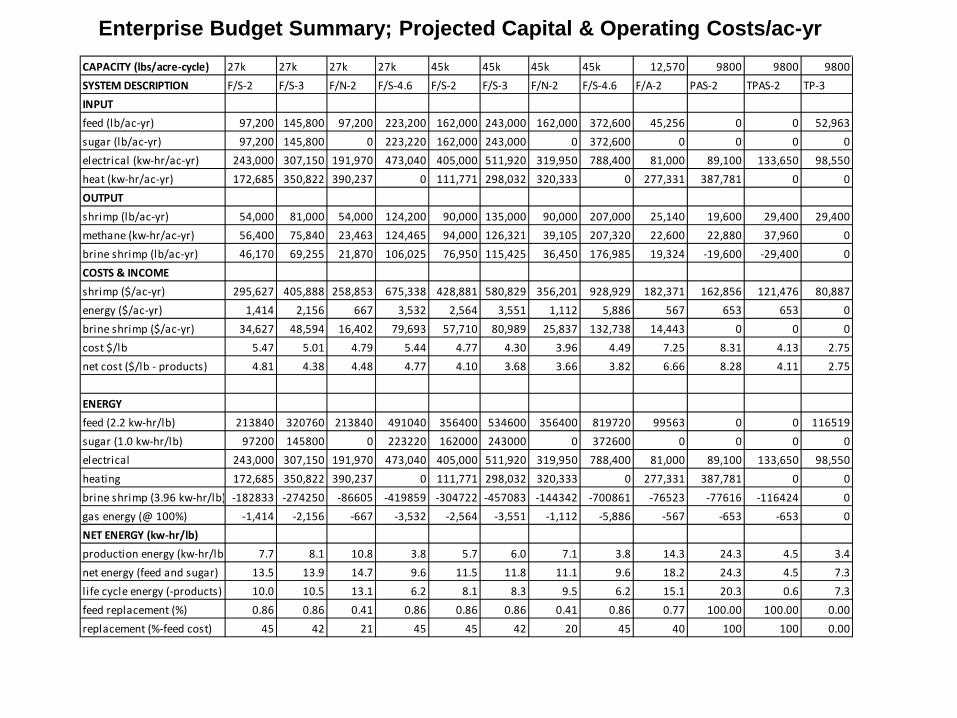
Enterprise Budget Summary; Projected Capital & Operating Costs/ac-yr
CAPACITY (lbs/acre-cycle) 27k 27k 27k 27k 45k 45k 45k 45k 12,570 9800 9800 9800SYSTEM DESCRIPTION F/S-2 F/S-3 F/N-2 F/S-4.6 F/S-2 F/S-3 F/N-2 F/S-4.6 F/A-2 PAS-2 TPAS-2 TP-3INPUTfeed (lb/ac-yr) 97,200 145,800 97,200 223,200 162,000 243,000 162,000 372,600 45,256 0 0 52,963sugar (lb/ac-yr) 97,200 145,800 0 223,220 162,000 243,000 0 372,600 0 0 0 0electrical (kw-hr/ac-yr) 243,000 307,150 191,970 473,040 405,000 511,920 319,950 788,400 81,000 89,100 133,650 98,550heat (kw-hr/ac-yr) 172,685 350,822 390,237 0 111,771 298,032 320,333 0 277,331 387,781 0 0OUTPUTshrimp (lb/ac-yr) 54,000 81,000 54,000 124,200 90,000 135,000 90,000 207,000 25,140 19,600 29,400 29,400methane (kw-hr/ac-yr) 56,400 75,840 23,463 124,465 94,000 126,321 39,105 207,320 22,600 22,880 37,960 0brine shrimp (lb/ac-yr) 46,170 69,255 21,870 106,025 76,950 115,425 36,450 176,985 19,324 -19,600 -29,400 0COSTS & INCOMEshrimp ($/ac-yr) 295,627 405,888 258,853 675,338 428,881 580,829 356,201 928,929 182,371 162,856 121,476 80,887energy ($/ac-yr) 1,414 2,156 667 3,532 2,564 3,551 1,112 5,886 567 653 653 0brine shrimp ($/ac-yr) 34,627 48,594 16,402 79,693 57,710 80,989 25,837 132,738 14,443 0 0 0cost $/lb 5.47 5.01 4.79 5.44 4.77 4.30 3.96 4.49 7.25 8.31 4.13 2.75net cost ($/lb - products) 4.81 4.38 4.48 4.77 4.10 3.68 3.66 3.82 6.66 8.28 4.11 2.75
ENERGYfeed (2.2 kw-hr/lb) 213840 320760 213840 491040 356400 534600 356400 819720 99563 0 0 116519sugar (1.0 kw-hr/lb) 97200 145800 0 223220 162000 243000 0 372600 0 0 0 0electrical 243,000 307,150 191,970 473,040 405,000 511,920 319,950 788,400 81,000 89,100 133,650 98,550heating 172,685 350,822 390,237 0 111,771 298,032 320,333 0 277,331 387,781 0 0brine shrimp (3.96 kw-hr/lb) -182833 -274250 -86605 -419859 -304722 -457083 -144342 -700861 -76523 -77616 -116424 0gas energy (@ 100%) -1,414 -2,156 -667 -3,532 -2,564 -3,551 -1,112 -5,886 -567 -653 -653 0NET ENERGY (kw-hr/lb)production energy (kw-hr/lb) 7.7 8.1 10.8 3.8 5.7 6.0 7.1 3.8 14.3 24.3 4.5 3.4net energy (feed and sugar) 13.5 13.9 14.7 9.6 11.5 11.8 11.1 9.6 18.2 24.3 4.5 7.3life cycle energy (-products) 10.0 10.5 13.1 6.2 8.1 8.3 9.5 6.2 15.1 20.3 0.6 7.3feed replacement (%) 0.86 0.86 0.41 0.86 0.86 0.86 0.41 0.86 0.77 100.00 100.00 0.00replacement (%-feed cost) 45 42 21 45 45 42 20 45 40 100 100 0.00
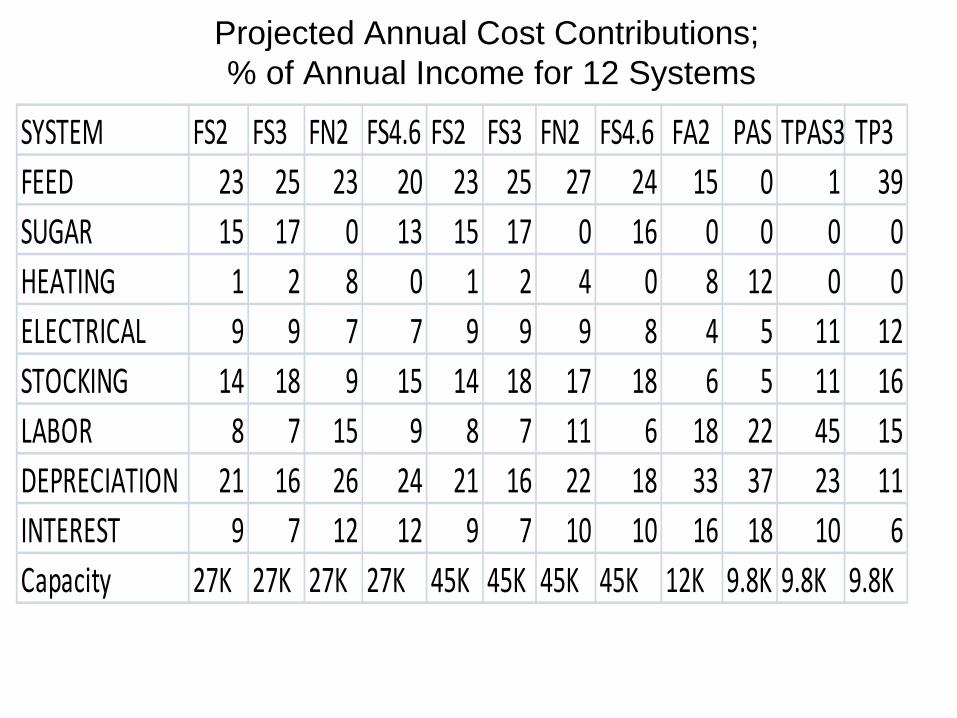
Projected Annual Cost Contributions; % of Annual Income for 12 Systems
SYSTEM FS2 FS3 FN2 FS4.6 FS2 FS3 FN2 FS4.6 FA2 PAS TPAS3 TP3FEED 23 25 23 20 23 25 27 24 15 0 1 39SUGAR 15 17 0 13 15 17 0 16 0 0 0 0HEATING 1 2 8 0 1 2 4 0 8 12 0 0ELECTRICAL 9 9 7 7 9 9 9 8 4 5 11 12STOCKING 14 18 9 15 14 18 17 18 6 5 11 16LABOR 8 7 15 9 8 7 11 6 18 22 45 15DEPRECIATION 21 16 26 24 21 16 22 18 33 37 23 11INTEREST 9 7 12 12 9 7 10 10 16 18 10 6Capacity 27K 27K 27K 27K 45K 45K 45K 45K 12K 9.8K 9.8K 9.8K
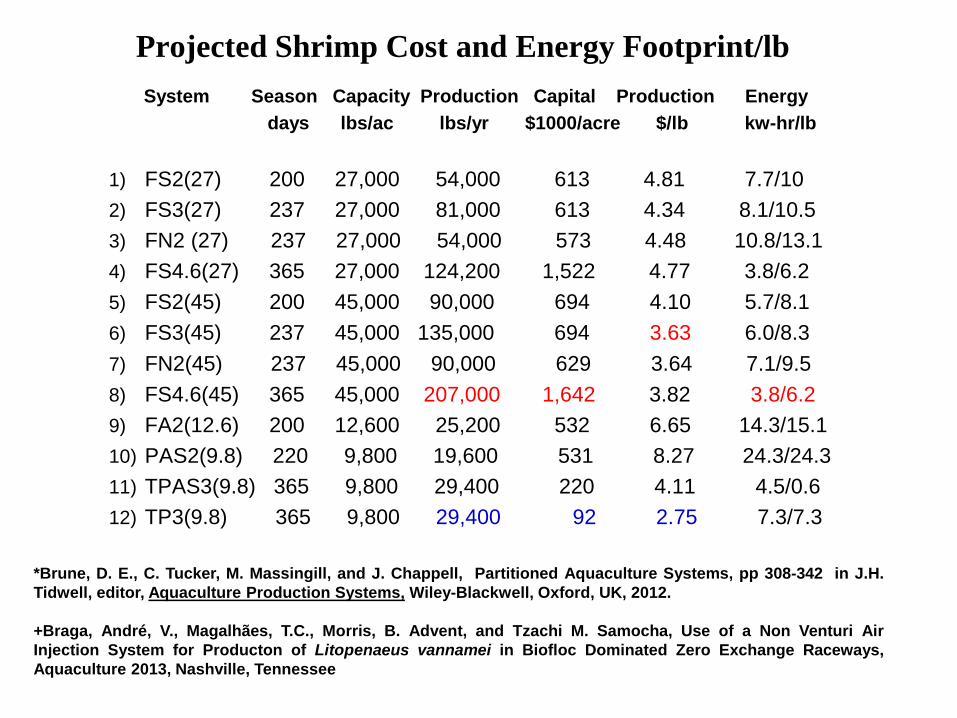
Projected Shrimp Cost and Energy Footprint/lb System Season Capacity Production Capital Production Energy days lbs/ac lbs/yr $1000/acre $/lb kw-hr/lb
1) FS2(27) 200 27,000 54,000 613 4.81 7.7/10 2) FS3(27) 237 27,000 81,000 613 4.34 8.1/10.5 3) FN2 (27) 237 27,000 54,000 573 4.48 10.8/13.1 4) FS4.6(27) 365 27,000 124,200 1,522 4.77 3.8/6.2 5) FS2(45) 200 45,000 90,000 694 4.10 5.7/8.1 6) FS3(45) 237 45,000 135,000 694 3.63 6.0/8.3 7) FN2(45) 237 45,000 90,000 629 3.64 7.1/9.5 8) FS4.6(45) 365 45,000 207,000 1,642 3.82 3.8/6.2 9) FA2(12.6) 200 12,600 25,200 532 6.65 14.3/15.1 10) PAS2(9.8) 220 9,800 19,600 531 8.27 24.3/24.3 11) TPAS3(9.8) 365 9,800 29,400 220 4.11 4.5/0.6 12) TP3(9.8) 365 9,800 29,400 92 2.75 7.3/7.3
*Brune, D. E., C. Tucker, M. Massingill, and J. Chappell, Partitioned Aquaculture Systems, pp 308-342 in J.H. Tidwell, editor, Aquaculture Production Systems, Wiley-Blackwell, Oxford, UK, 2012. +Braga, André, V., Magalhães, T.C., Morris, B. Advent, and Tzachi M. Samocha, Use of a Non Venturi Air Injection System for Producton of Litopenaeus vannamei in Biofloc Dominated Zero Exchange Raceways, Aquaculture 2013, Nashville, Tennessee
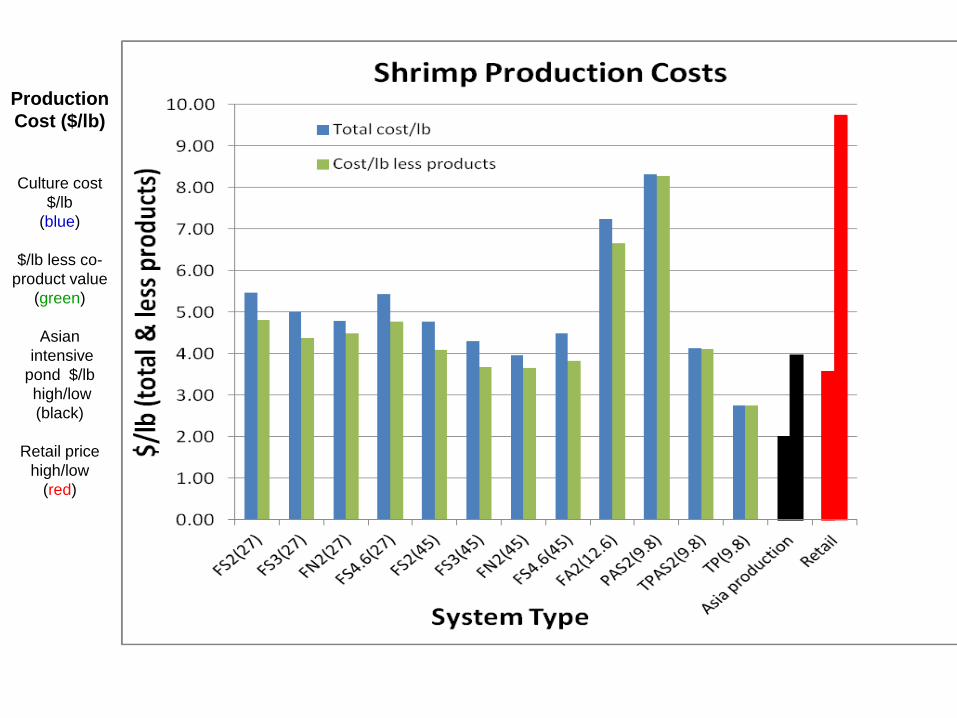
Production Cost ($/lb)
Culture cost $/lb
(blue)
$/lb less co-product value
(green)
Asian intensive pond $/lb high/low (black)
Retail price
high/low (red)

Energy (kw-hr/lb)
Culture energy/lb
(dark-blue)
Culture energy + feed and sugar energy (green)
Combined energy
less brine shrimp and methane products
(light-blue)
Asian intensive shrimp
high/low (red)
Cultured salmon (purple)
Poultry (black)
Pork (orange)
Beef (brown)

Significant capital investment required; Banks not likely to support unproven technology; Who?
Will U.S. consumers pay more for sustainably produced, locally reared, higher quality fresh seafood? How much more?
Producers will need network for rapid distribution of unfrozen product; Local stores, farmers markets, restaurants?
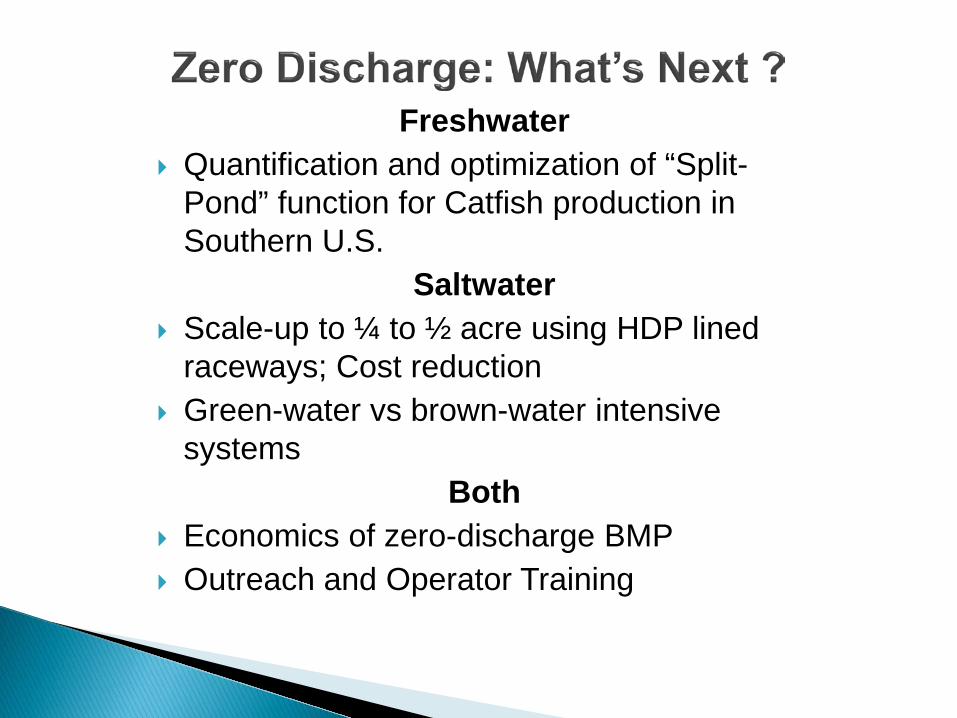
Freshwater Quantification and optimization of “Split-
Pond” function for Catfish production in Southern U.S.
Saltwater Scale-up to ¼ to ½ acre using HDP lined
raceways; Cost reduction Green-water vs brown-water intensive
systems Both
Economics of zero-discharge BMP Outreach and Operator Training
U.S. Energy Footprint Metabolic needs ~ 1- 100 watt bulb Usage ~ 100 – 100 watt bulbs Agriculture ~ 12x input energy/food energy yield
Agro-Ecosystems Designed to Mimic Nature
Solar-driven, recycle nutrients as opposed to fossil-fuel driven with nutrients released as pollutants
Sustainable aquaculture as template for sustainable agriculture?
Sustainable agriculture as template for sustainable society?