Embed Size (px)
Citation preview

BioProbes 74
thermofisher.com/bioprobes • November 2016
Mohadeseh Mehrabian 1
Gerold Schmitt-Ulms 1
Alexander Tsankov 2
Xinzhu Wang 1
Declan Williams 1
1 University of Toronto 2 Harvard University
IN MEMORIAMAt press time, we learned that Richard P. Haugland—who founded Molecular Probes, Inc., with Rosaria P. Haugland in 1975—had passed away at his home in Chiangmai,
Thailand. He was the original author of the definitive reference on fluorescent dyes, The Molecular Probes Handbook, now in its 11th edition, and the BioProbes Journal.
He was also an inventor on ~80 US patents and an author of ~150 scientific papers in chemistry, biochemistry, and biophysics—from the classic 1967 and 1969
Proc Natl Acad Sci U S A papers on fluorescence resonance energy transfer (FRET) to the 1999 and 2003 J Histochem Cytochem papers on the Alexa Fluor™ dyes.
Dick Haugland had dedicated the last decade-plus of his life to philanthropic activities, supporting schools, hospitals, and orphanages in Asia, as well as the per-
forming arts in Eugene, Oregon. Most recently, he was working on curriculum development for teaching mathematics and the English and Thai languages to preschool
and primary school children. He was a passionate scientist, an influential mentor, and a generous friend, and he will be greatly missed.
EditorsMichelle SpenceGrace Richter
DesignersKim McGovernLynn Soderberg
Production ManagerBeth Browne
ContributorsLaura AllredBrian AlmondJoanna AsprerKris BarnetteDan BeachamRachael BerryJolene BradfordBeth BrowneSuzanne BuckWayne ConsidineWilliam DietrichNick DilianiNick DolmanHelen FleisigEmily HalbraderPeggy JustVictoria LoveKara MachleidtKaren MuellerMonica O’HaraStephen OldfieldCarol OxfordSheetal PatelPriya RangarajAleksey RukavishnikovKari SeversonLaura ShapiroMatt SlaterDeborah TiebergMonica TomaszewskiMarcy Wickett
PROTEIN AND CELL ANALYSIS UPDATES
2 | Online and on the move: Learning centers, coloring books, posters, and more
4 | Just released: Our newest protein and cellular analysis products and technologies
CRISPR-CAS9–BASED RESEARCH
6 | Toward mechanism-based diagnostics and disease interventionsCombining CRISPR-Cas9 with functional proteomics
11 | Apply CRISPR-Cas9 gene editing to high-throughput screeningLentiArray CRISPR libraries
12 | The CRISPR-Cas9 system for genome editingA complete suite of reagents, from Cas9 delivery tools to cell function assays
STEM CELL RESEARCH
15 | Assess the differentiation potential of human pluripotent stem cellsAn improved qPCR-based ScoreCard assay
18 | Light up neural differentiation pathwaysAntibodies for pluripotent stem cells and neural lineage cells
20 | Transcription factor expression during differentiation of hPSC-derived cardiomyocytesA multiparametric approach using the Attune NxT Flow Cytometer
TOOLS FOR IMAGING AND FLOW CYTOMETRY
22 | Seeing red during apoptosisCellEvent Caspase-3/7 Red assays for imaging and flow cytometry
24 | Next-generation detection of potassium ion fluxFluxOR II Green Potassium Ion Channel Assay
26 | Jump-start your experimental design with published antibody and reagent panelsOptimized multicolor immunofluorescence panels (OMIPs)
28 | Quantitative imaging of histological samplesNow possible using the CellInsight CX7 High-Content Analysis (HCA) Platform
30 | Protein misfolding in neurodegenerative diseasesAntibodies specific for misfolded proteins associated with neurodegeneration
JOURNAL CLUB
31 | Current methods and challenges in the characterization of human pluripotent stem cells
Published by Thermo Fisher Scientific Inc. © 2016BioProbes Journal, available in print and online at thermofisher.com/bioprobes, is dedicated to providing researchers with the very latest information about cell biology products and their applications. For a complete list of our products, along with extensive descriptions and literature references, please see our website.

2 | thermofisher.com/bioprobes © 2016 Thermo Fisher Scientific Inc. All rights reserved. For Research Use Only. Not for use in diagnostic procedures.
ONLINE AND ON THE MOVE BIOPrOBEs 74
We recently launched a virtual educational environment that houses expansive content on protein
and cell analysis, all at one easy-to-access site. The Protein and Cell Analysis Education website—
provided by the scientists that developed The Molecular Probes Handbook, Molecular Probes
School of Fluorescence, and Pierce Protein Methods—is available on-demand and offers both
educational materials and application-specific information in a variety of user-friendly formats:
Learning centers: An online source for educational information
Thermo Fisher Scientific has amassed a huge library of educational assets for many different
fields of study. These educational resources include application notes, handbooks and source-
books, webinars, how-to videos, white papers, case studies, tutorials, scientific posters, product
selection guides, and much more.
To help you browse, locate, and review information that may be useful for your own
experiments, we have divided our educational offerings into a range of learning centers, orga-
nized by research and industrial application areas. Here’s a sampling of the learning centers
available online:
■ Cell analysis
■ Cell culture and transfection
■ Flow cytometry
■ Genome editing
■ Protein biology
■ Stem cell research
■ Synthetic biology
The purpose of these learning centers is to connect both new and experienced scientists
to our many resources by providing a few centralized points of entry into the vast content.
And we are continually updating these centers with new information. Start exploring today at
thermofisher.com/learningcenters.
Application-specific information
■ Antibodies and immunoassays
■ Cell imaging technologies
■ Flow cytometry strategies
■ Mass spectrometry techniques
■ Western blot workflows
This venue was designed with both new and experienced researchers in mind and efficiently
provides access to a variety of interactive content that fosters learning about traditional and
innovative protein and cell analysis techniques. It also provides convenient links to our learning
centers, as well as to previous issues of BioProbes Journal of Cell Biology Applications. All
content is available 24 hours a day, 7 days a week, and is viewable from the convenience of
your desk, tablet, or mobile device. See what it’s all about at thermofisher.com/pcaeducation.
Virtual education platform for protein and cell analysis
Educational materials
■ New on-demand webinars
■ How-to videos
■ Downloadable white papers, handbooks,
and posters
■ Virtual laboratories

thermofisher.com/bioprobes | 3 © 2016 Thermo Fisher Scientific Inc. All rights reserved. For Research Use Only. Not for use in diagnostic procedures.
BIOPrOBEs 74 ONLINE AND ON THE MOVE
Beautiful science: Cell imaging coloring book and marker set
Color your way through organically beautiful cell structures. From plasma membranes, through
cytoskeletons, down deep into the nucleus and everything in between, this coloring book will
calm and inspire scientific minds with patterns specifically designed to help you relax. The 30
unique designs are inspired by actual cell images submitted by customers around the world.
True to the broad spectrum of cells and their complex structures, the pages include fantastic
designs of tissues, neurons, villi, nerves, osteosarcomas, hepatocytes, astrocytes, endothelial
cells, mesenchymal stem cells, dendritic cells, and more—sure to captivate colorists of all ages.
Each page of the coloring book has a perforated edge, making it easy for you to remove
a beautiful pattern and showcase it in a frame or give it to a friend. For hours of mindful calm
and creative expression, join millions of people around the world who are rediscovering the
simple relaxation and bliss of coloring. Request your copy today (see terms and conditions) at
thermofisher.com/color.
Now available upon request, the 24 x 32.5 inch Thermo Scientific™ Pierce™ Protein and
Peptide Assay Selection Guide poster features our complete line of Pierce protein and peptide
assays—BCA Protein Assay Kits, Detergent-Compatible and Coomassie Plus Bradford Assay
Kits, the 660 nm Protein Assay Reagent, and the Quantitative Colorimetric Peptide Assay.
This reference guide provides technical specifications for each assay along with detection
range, optimal applications, protocol overviews, reaction schemes, typical standard curves,
and extensive information on interfering substances. Request your copy today (see terms and
conditions) at thermofisher.com/proteinassayposter.
Training on pluripotent stem cell (PSC) culture is now available in an easy-to-access virtual
format. Visit the Gibco™ Pluripotent Stem Cell Culture virtual training lab to strengthen your
knowledge of stem cell culture techniques and become familiar with culture requirements for
maintaining and expanding PSCs while balancing differentiation and self-renewal pathways.
The Pluripotent Stem Cell Culture virtual training lab focuses on these important topics:
■ Preparation of new cultures of PSCs
■ Coating of wells to promote PSC culture
■ Follow-up culture techniques
■ Characterization of pluripotency
This free 3D interactive learning laboratory offers cell culture training modules, best practices
for working with your cells, and quizzes to test your understanding. Register today at
thermofisher.com/gibcoeducation, where you will find several other virtual training labs,
including those on cell culture basics, transfection, and protein expression.
Pierce protein and peptide assay guide poster
Virtual training labs: Pluripotent stem cell culture
4 | thermofisher.com/bioprobes © 2016 Thermo Fisher Scientific Inc. All rights reserved. For Research Use Only. Not for use in diagnostic procedures.
JUsT rELEAsED BIOPrOBEs 74
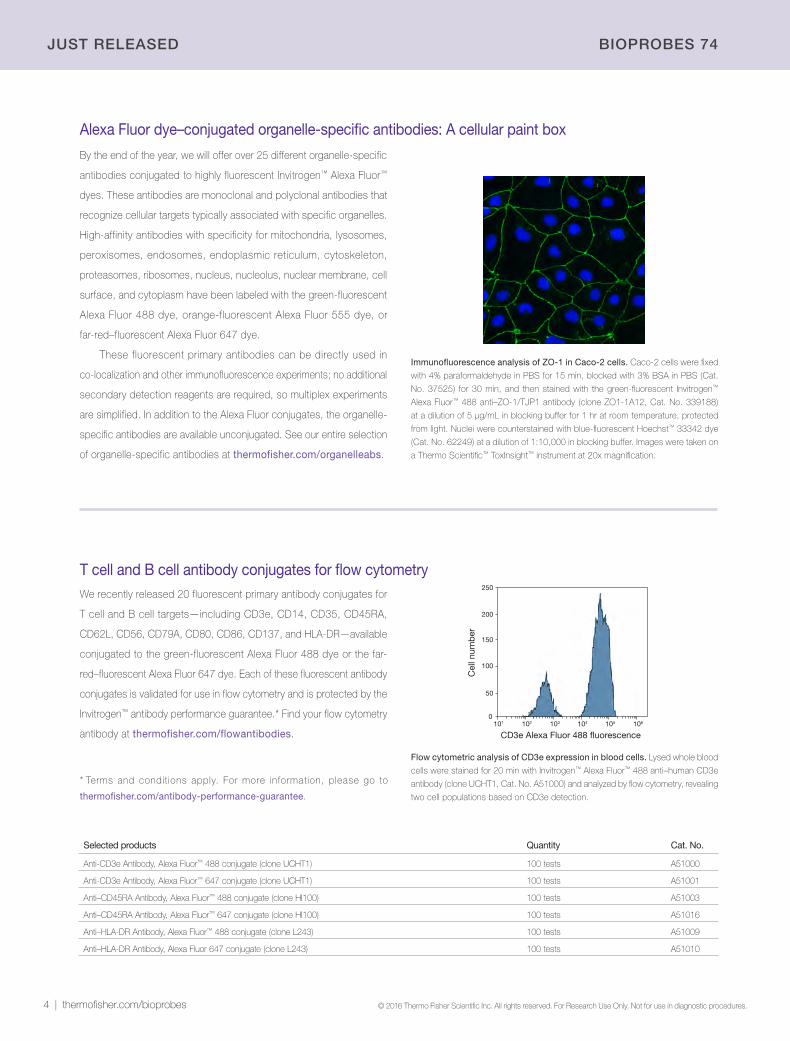
By the end of the year, we will offer over 25 different organelle-specific
antibodies conjugated to highly fluorescent Invitrogen™ Alexa Fluor™
dyes. These antibodies are monoclonal and polyclonal antibodies that
recognize cellular targets typically associated with specific organelles.
High-affinity antibodies with specificity for mitochondria, lysosomes,
peroxisomes, endosomes, endoplasmic reticulum, cytoskeleton,
proteasomes, ribosomes, nucleus, nucleolus, nuclear membrane, cell
surface, and cytoplasm have been labeled with the green-fluorescent
Alexa Fluor 488 dye, orange-fluorescent Alexa Fluor 555 dye, or
far-red–fluorescent Alexa Fluor 647 dye.
These fluorescent primary antibodies can be directly used in
co-localization and other immunofluorescence experiments; no additional
secondary detection reagents are required, so multiplex experiments
are simplified. In addition to the Alexa Fluor conjugates, the organelle-
specific antibodies are available unconjugated. See our entire selection
of organelle-specific antibodies at thermofisher.com/organelleabs.
Selected products Quantity Cat. No.
Anti-CD3e Antibody, Alexa Fluor™ 488 conjugate (clone UCHT1) 100 tests A51000
Anti-CD3e Antibody, Alexa Fluor™ 647 conjugate (clone UCHT1) 100 tests A51001
Anti–CD45RA Antibody, Alexa Fluor™ 488 conjugate (clone HI100) 100 tests A51003
Anti–CD45RA Antibody, Alexa Fluor™ 647 conjugate (clone HI100) 100 tests A51016
Anti–HLA-DR Antibody, Alexa Fluor™ 488 conjugate (clone L243) 100 tests A51009
Anti–HLA-DR Antibody, Alexa Fluor 647 conjugate (clone L243) 100 tests A51010
Immunofluorescence analysis of ZO-1 in Caco-2 cells. Caco-2 cells were fixed
with 4% paraformaldehyde in PBS for 15 min, blocked with 3% BSA in PBS (Cat.
No. 37525) for 30 min, and then stained with the green-fluorescent Invitrogen™
Alexa Fluor™ 488 anti–ZO-1/TJP1 antibody (clone ZO1-1A12, Cat. No. 339188)
at a dilution of 5 µg/mL in blocking buffer for 1 hr at room temperature, protected
from light. Nuclei were counterstained with blue-fluorescent Hoechst™ 33342 dye
(Cat. No. 62249) at a dilution of 1:10,000 in blocking buffer. Images were taken on
a Thermo Scientific™ ToxInsight™ instrument at 20x magnification.
Alexa Fluor dye–conjugated organelle-specific antibodies: A cellular paint box
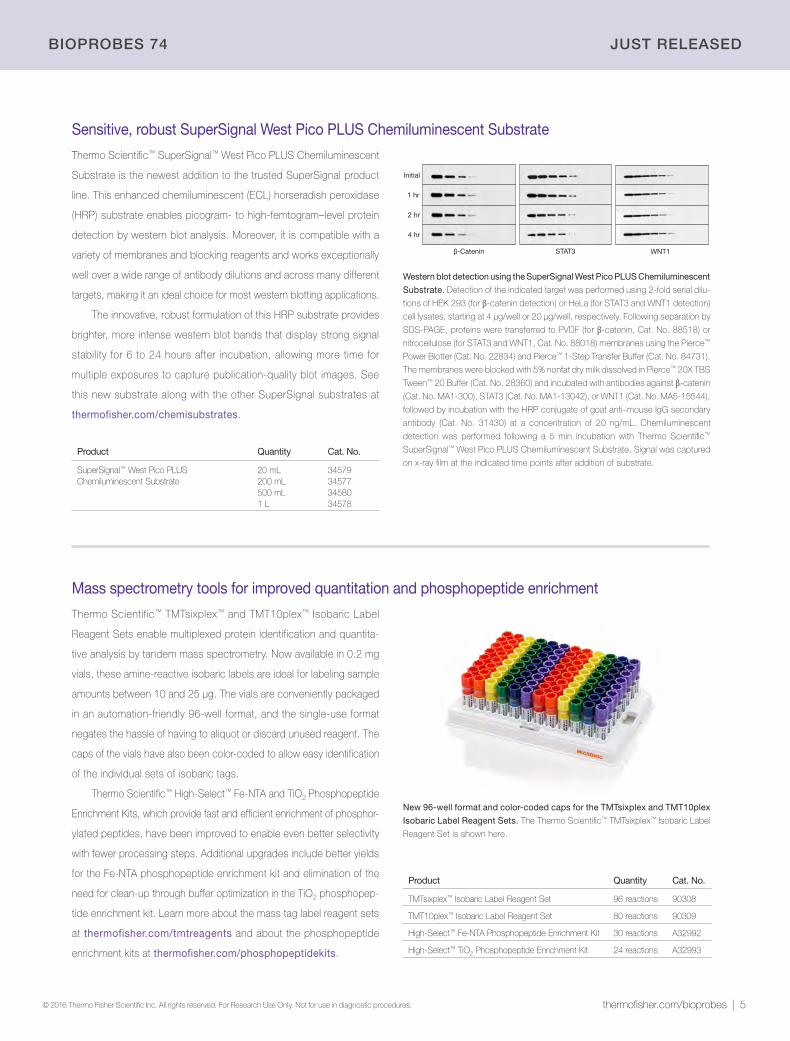
We recently released 20 fluorescent primary antibody conjugates for
T cell and B cell targets—including CD3e, CD14, CD35, CD45RA,
CD62L, CD56, CD79A, CD80, CD86, CD137, and HLA-DR—available
conjugated to the green-fluorescent Alexa Fluor 488 dye or the far-
red–fluorescent Alexa Fluor 647 dye. Each of these fluores cent antibody
conjugates is validated for use in flow cytometry and is protected by the
Invitrogen™ antibody performance guarantee.* Find your flow cytometry
antibody at thermofisher.com/flowantibodies.
T cell and B cell antibody conjugates for flow cytometry
Flow cytometric analysis of CD3e expression in blood cells. Lysed whole blood
cells were stained for 20 min with Invitrogen™ Alexa Fluor™ 488 anti–human CD3e
antibody (clone UCHT1, Cat. No. A51000) and analyzed by flow cytometry, revealing
two cell populations based on CD3e detection.
1010
50
100
150
250
102 103 104 106105
CD3e Alexa Fluor 488 �uorescence
Cel
l num
ber
200
* Terms and condit ions apply. For more information, please go to
thermofisher.com/antibody-performance-guarantee.
thermofisher.com/bioprobes | 5 © 2016 Thermo Fisher Scientific Inc. All rights reserved. For Research Use Only. Not for use in diagnostic procedures.
BIOPrOBEs 74 JUsT rELEAsED
Product Quantity Cat. No.
SuperSignal™ West Pico PLUS Chemiluminescent Substrate
20 mL200 mL500 mL1 L
34579345773458034578
Thermo Scientific™ SuperSignal™ West Pico PLUS Chemiluminescent
Substrate is the newest addition to the trusted SuperSignal product
line. This enhanced chemiluminescent (ECL) horseradish peroxidase
(HRP) substrate enables picogram- to high-femtogram–level protein
detection by western blot analysis. Moreover, it is compatible with a
variety of membranes and blocking reagents and works exceptionally
well over a wide range of antibody dilutions and across many different
targets, making it an ideal choice for most western blotting applications.
The innovative, robust formulation of this HRP substrate provides
brighter, more intense western blot bands that display strong signal
stability for 6 to 24 hours after incubation, allowing more time for
multiple exposures to capture publication-quality blot images. See
this new substrate along with the other SuperSignal substrates at
thermofisher.com/chemisubstrates.
Sensitive, robust SuperSignal West Pico PLUS Chemiluminescent Substrate
Western blot detection using the SuperSignal West Pico PLUS Chemiluminescent
Substrate. Detection of the indicated target was performed using 2-fold serial dilu-
tions of HEK 293 (for β-catenin detection) or HeLa (for STAT3 and WNT1 detection)
cell lysates, starting at 4 μg/well or 20 μg/well, respectively. Following separation by
SDS-PAGE, proteins were transferred to PVDF (for β-catenin, Cat. No. 88518) or
nitrocellulose (for STAT3 and WNT1, Cat. No. 88018) membranes using the Pierce™
Power Blotter (Cat. No. 22834) and Pierce™ 1-Step Transfer Buffer (Cat. No. 84731).
The membranes were blocked with 5% nonfat dry milk dissolved in Pierce™ 20X TBS
Tween™ 20 Buffer (Cat. No. 28360) and incubated with antibodies against β-catenin
(Cat. No. MA1-300), STAT3 (Cat. No. MA1-13042), or WNT1 (Cat. No. MA5-15544),
followed by incubation with the HRP conjugate of goat anti–mouse IgG secondary
antibody (Cat. No. 31430) at a concentration of 20 ng/mL. Chemiluminescent
detection was performed following a 5 min incubation with Thermo Scientific™
SuperSignal™ West Pico PLUS Chemiluminescent Substrate. Signal was captured
on x-ray film at the indicated time points after addition of substrate.
Thermo Scientific™ TMTsixplex™ and TMT10plex™ Isobaric Label
Reagent Sets enable multiplexed protein identification and quantita-
tive analysis by tandem mass spectrometry. Now available in 0.2 mg
vials, these amine-reactive isobaric labels are ideal for labeling sample
amounts between 10 and 25 µg. The vials are conveniently packaged
in an automation-friendly 96-well format, and the single-use format
negates the hassle of having to aliquot or discard unused reagent. The
caps of the vials have also been color-coded to allow easy identification
of the individual sets of isobaric tags.
Thermo Scientific™ High-Select™ Fe-NTA and TiO2 Phosphopeptide
Enrichment Kits, which provide fast and efficient enrichment of phosphor-
ylated peptides, have been improved to enable even better selectivity
with fewer processing steps. Additional upgrades include better yields
for the Fe-NTA phosphopeptide enrichment kit and elimination of the
need for clean-up through buffer optimization in the TiO2 phosphopep-
tide enrichment kit. Learn more about the mass tag label reagent sets
at thermofisher.com/tmtreagents and about the phospho peptide
enrichment kits at thermofisher.com/phosphopeptidekits.
Mass spectrometry tools for improved quantitation and phosphopeptide enrichment
Product Quantity Cat. No.
TMTsixplex™ Isobaric Label Reagent Set 96 reactions 90308
TMT10plex™ Isobaric Label Reagent Set 80 reactions 90309
High-Select™ Fe-NTA Phosphopeptide Enrichment Kit 30 reactions A32992
High-Select™ TiO2 Phosphopeptide Enrichment Kit 24 reactions A32993
β-Catenin
4 hr
2 hr
1 hr
Initial
WNT1STAT3
New 96-well format and color-coded caps for the TMTsixplex and TMT10plex
Isobaric Label Reagent Sets. The Thermo Scientific™ TMTsixplex™ Isobaric Label
Reagent Set is shown here.
6 | thermofisher.com/bioprobes © 2016 Thermo Fisher Scientific Inc. All rights reserved. For Research Use Only. Not for use in diagnostic procedures.
CrIsPr-CAs9–BAsED rEsEArCH BIOPrOBEs 74
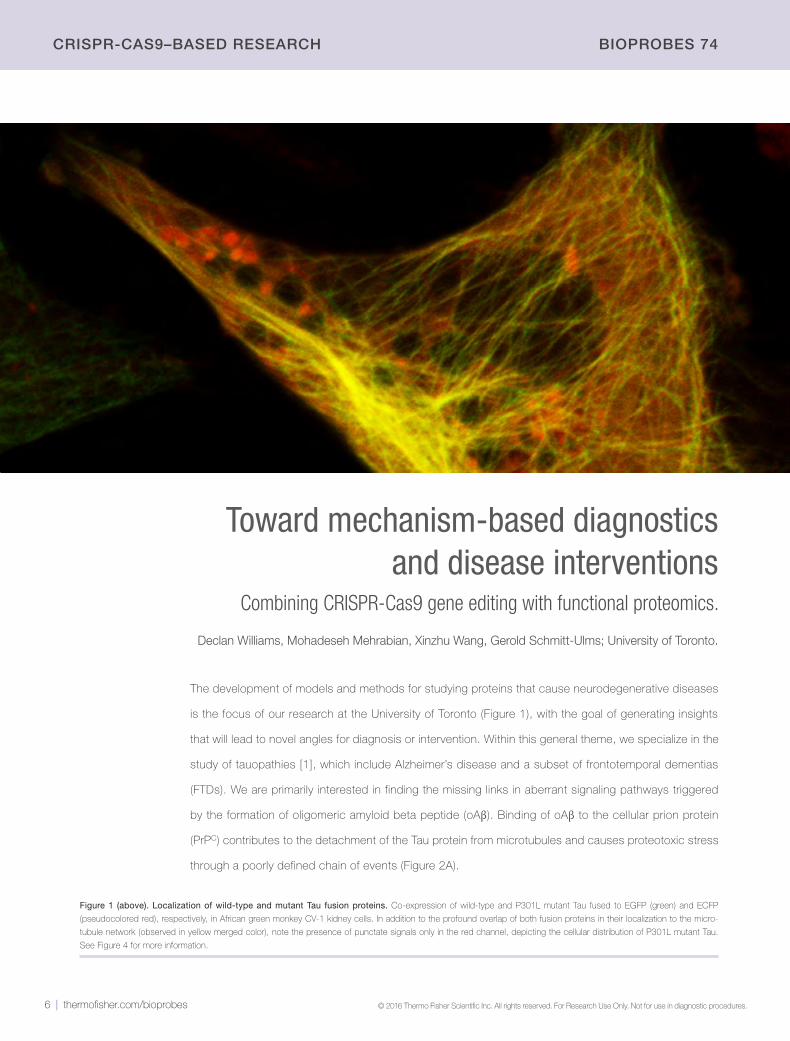
Toward mechanism-based diagnostics and disease interventions
Combining CRISPR-Cas9 gene editing with functional proteomics.
Declan Williams, Mohadeseh Mehrabian, Xinzhu Wang, Gerold Schmitt-Ulms; University of Toronto.
The development of models and methods for studying proteins that cause neurodegenerative diseases
is the focus of our research at the University of Toronto (Figure 1), with the goal of generating insights
that will lead to novel angles for diagnosis or intervention. Within this general theme, we specialize in the
study of tauopathies [1], which include Alzheimer’s disease and a subset of frontotemporal dementias
(FTDs). We are primarily interested in finding the missing links in aberrant signaling pathways triggered
by the formation of oligomeric amyloid beta peptide (oAβ). Binding of oAβ to the cellular prion protein
(PrPC) contributes to the detachment of the Tau protein from microtubules and causes proteotoxic stress
through a poorly defined chain of events (Figure 2A).
Figure 1 (above). Localization of wild-type and mutant Tau fusion proteins. Co-expression of wild-type and P301L mutant Tau fused to EGFP (green) and ECFP
(pseudocolored red), respectively, in African green monkey CV-1 kidney cells. In addition to the profound overlap of both fusion proteins in their localization to the micro-
tubule network (observed in yellow merged color), note the presence of punctate signals only in the red channel, depicting the cellular distribution of P301L mutant Tau.
See Figure 4 for more information.
thermofisher.com/bioprobes | 7 © 2016 Thermo Fisher Scientific Inc. All rights reserved. For Research Use Only. Not for use in diagnostic procedures.
BIOPrOBEs 74 CrIsPr-CAs9–BAsED rEsEArCH
Combining CRISPR-Cas9 model building with mass spectrometryThe use of the CRISPR-Cas9 system [2] has been nothing short of
transformative for our work because it allows us to generate relevant
models with reasonable effort. There are two CRISPR-Cas9 applications
we find particularly useful, namely the generation of knockout models of
specific genes of interest, and the introduction of mutations known to
underlie human diseases. Once a suitable model has been generated,
we interrogate the consequences of these genetic changes on cellular
biology through side-by-side comparative analyses with wild-type
control models, using quantitative mass spectrometry (Figure 2B).
For such investigations to be meaningful, sample handling and anal-
ysis should not introduce inadvertent heterogeneity. One approach we
have found useful for minimizing run-to-run variances in protein-directed
research projects involving mass spectrometry is to label peptides with
isobaric tags in order to facilitate sample multiplexing [3,4]. Following
their reversed-phase separation, the mixtures of these isobarically
tagged peptides are directed to the orifice of the Thermo Scientific™
Orbitrap Fusion™ Tribrid™ mass spectrometer by electrospray ionization.
Next, the mass-to-charge ratios of incoming ions are recorded by an
Orbitrap analyzer–based parent scan of exquisite mass resolution
and accuracy. The machine then selects, in an automated
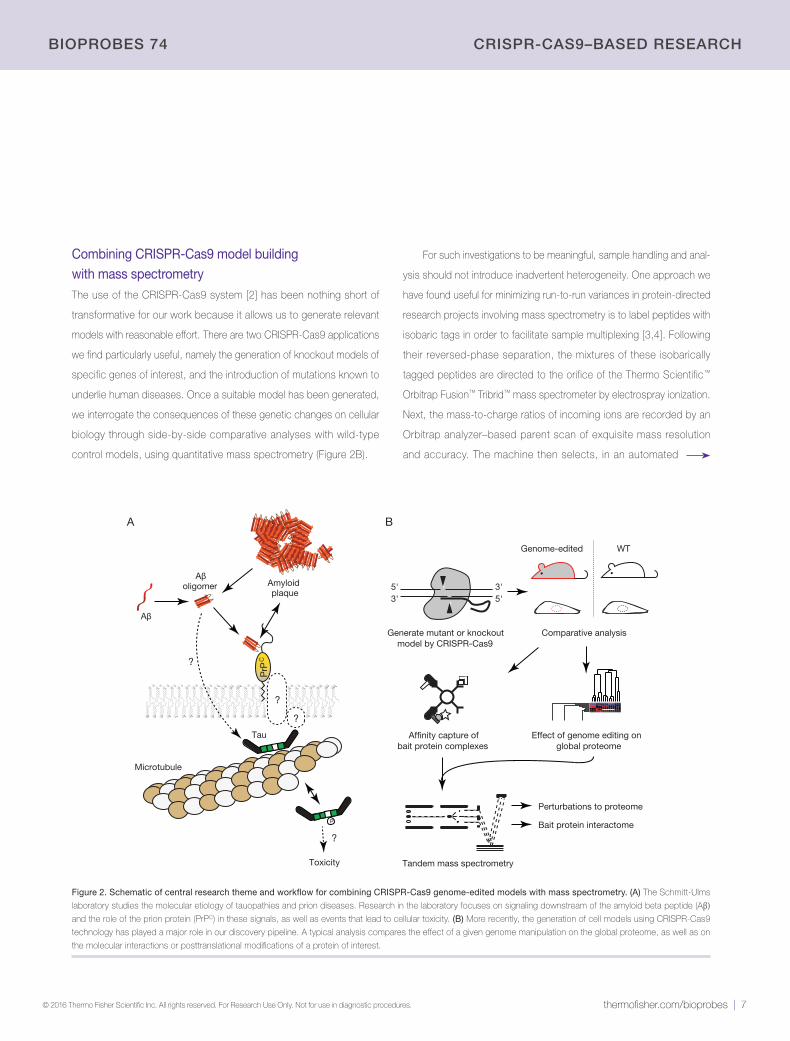
Figure 2. Schematic of central research theme and workflow for combining CRISPR-Cas9 genome-edited models with mass spectrometry. (A) The Schmitt-Ulms
laboratory studies the molecular etiology of tauopathies and prion diseases. Research in the laboratory focuses on signaling downstream of the amyloid beta peptide (Aβ) and the role of the prion protein (PrPC) in these signals, as well as events that lead to cellular toxicity. (B) More recently, the generation of cell models using CRISPR-Cas9
technology has played a major role in our discovery pipeline. A typical analysis compares the effect of a given genome manipulation on the global proteome, as well as on
the molecular interactions or posttranslational modifications of a protein of interest.
BA
Aβ
oligomer Amyloid plaque
Tau
PrP
C
P
Aβ
Microtubule
?
?
?
Tandem mass spectrometry
Af�nity capture of bait protein complexes
5'5'3'3'
WT
Generate mutant or knockout model by CRISPR-Cas9
Comparative analysis
Genome-edited
Effect of genome editing onglobal proteome
Perturbations to proteome
Bait protein interactome
Toxicity
?
P
8 | thermofisher.com/bioprobes © 2016 Thermo Fisher Scientific Inc. All rights reserved. For Research Use Only. Not for use in diagnostic procedures.
CrIsPr-CAs9–BAsED rEsEArCH BIOPrOBEs 74
manner, the most intense ions for mild collisions with an inert gas in
order to obtain fragment ions, which later serve as a fingerprint for
protein identification. Finally, the 10 most intense of these fragment
ions are concomitantly smashed into even smaller pieces to release
their isobaric labels. The relative signal intensities of these mass tags,
which are specific for each sample, allow us to deduce the relative
abundance of a given peptide in each of the multiplexed samples. Here
we describe two projects that illustrate the usefulness of combining
CRISPR-Cas9 model building with downstream mass spectrometry to
address fundamental biomedical research questions.
CRISPR-Cas9–generated knockouts of the gene encoding the cellular prion proteinThe first project combined specific gene knockouts with global
proteome analyses (Figure 3) and was pursued as part of a broader
program aimed at devising mechanism-based strategies to overcome
prion diseases, including Creutzfeldt-Jakob disease (CJD) and bovine
spongiform encephalopathy (BSE). Despite its discovery more than
30 years ago, the normal function of the cellular prion protein (PrPC),
which is known to cause these diseases when it acquires a different
A
wt + TGFB1wt – TGFB1
PrPC –/– + TGFB1
Dataset II
B
DC
126/131 127/131 128/131 129/13 130/131
log 2
Fold
cha
nge
PrPC –/– wt/wt
-2
-1
0
1
5th–25th–50th–75th–95th percentiles
Peptides used for quanti�cationPeptides not used for quanti�cation (duplicates or ambiguous)
xx
x
GGTGGAACACCGGTGGAAGC
gRNA vector
Exon 1 Exon 2 Exon 3
Mouse prion gene (Chr2)
TACCGCCACCTACCCCGGTT
5'3'5'
3'
Cas9 expression vector SpCas9
CMV
U6
Western blot Genomic PCR
CCGGGATACCTGGC
DNA sequencing
Dataset I
TGFB1
250
98
wt (
2)Pr
PCko
PrP
C stab
le s
hRNA
wt (
1)
+ + + +MW
1 3
anti-PrPC
39
28
19
14
180S-S S-S S-S S-S S-S
140
120
SSSSSSSSSSSS SSSSSSSSSSSSSSSSSSSSSSSSSSSS-------------SSSSS---
S-S S-S S-S S-S S-S
SSSSSSSSSSSSSSSS SSSSSSSSSSSSS SSSSSSSSSSSSSSSSSSSSSSSSSSSSSSSSSSSSSSSSSSSS
SSSSSSSSSSSSSSSSSSSSSSSSSS--------S--S-S-SSSS
S-S S-S S-S S-S S-S
SSSSSSSSSSSSSSSSSSSSSSSSS----SSSS SSSSSSSSSSSSSSSS
FN 3 FN 3
FN 3 FN 3
FN 3 FN 3
Luminal/extracellular
wt/wt
NCAM1 peptide quantitations based on isobaric TMT labels
NC
AM
1 isoforms
2
/wt PrPC –/–/wt PrPC –/–/wt
4
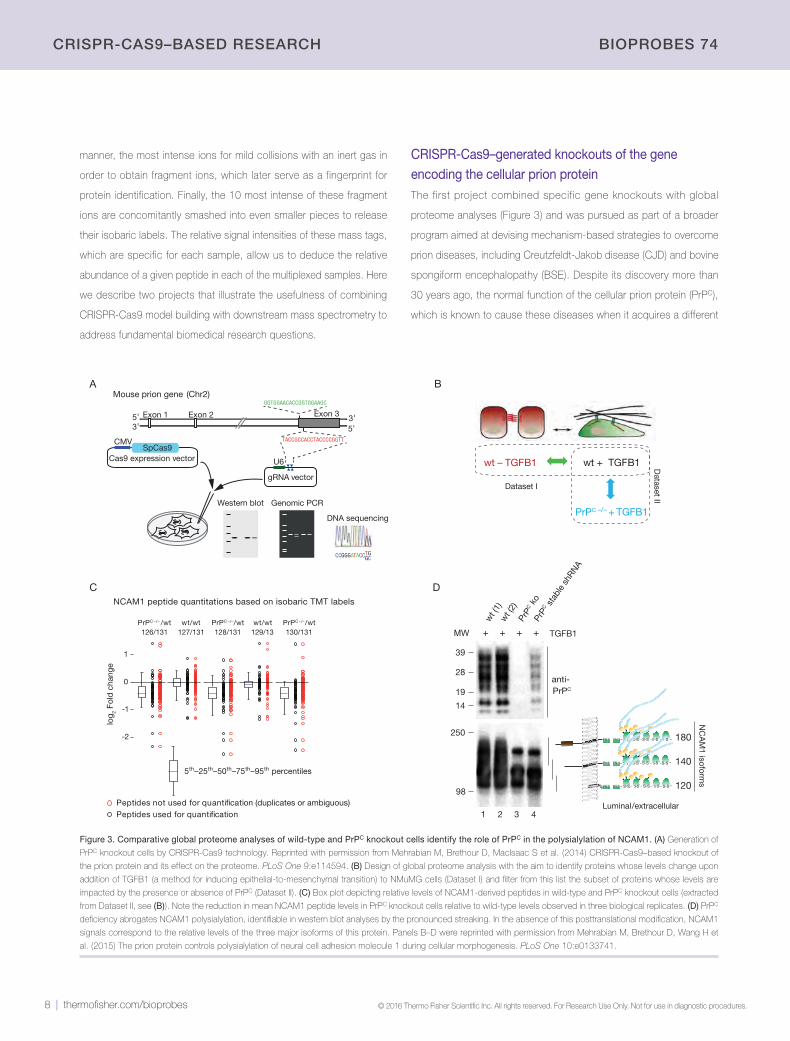
Figure 3. Comparative global proteome analyses of wild-type and PrPC knockout cells identify the role of PrPC in the polysialylation of NCAM1. (A) Generation of
PrPC knockout cells by CRISPR-Cas9 technology. Reprinted with permission from Mehrabian M, Brethour D, MacIsaac S et al. (2014) CRISPR-Cas9–based knockout of
the prion protein and its effect on the proteome. PLoS One 9:e114594. (B) Design of global proteome analysis with the aim to identify proteins whose levels change upon
addition of TGFB1 (a method for inducing epithelial-to-mesenchymal transition) to NMuMG cells (Dataset I) and filter from this list the subset of proteins whose levels are
impacted by the presence or absence of PrPC (Dataset II). (C) Box plot depicting relative levels of NCAM1-derived peptides in wild-type and PrPC knockout cells (extracted
from Dataset II, see (B)). Note the reduction in mean NCAM1 peptide levels in PrPC knockout cells relative to wild-type levels observed in three biological replicates. (D) PrPC
deficiency abrogates NCAM1 polysialylation, identifiable in western blot analyses by the pronounced streaking. In the absence of this posttranslational modification, NCAM1
signals correspond to the relative levels of the three major isoforms of this protein. Panels B–D were reprinted with permission from Mehrabian M, Brethour D, Wang H et
al. (2015) The prion protein controls polysialylation of neural cell adhesion molecule 1 during cellular morphogenesis. PLoS One 10:e0133741.
thermofisher.com/bioprobes | 9 © 2016 Thermo Fisher Scientific Inc. All rights reserved. For Research Use Only. Not for use in diagnostic procedures.
BIOPrOBEs 74 CrIsPr-CAs9–BAsED rEsEArCH
shape, remains unknown, leaving uncertain to what extent a perturba-
tion of its normal function contributes to cellular death in the disease.
Using CRISPR-Cas9 technology, we generated knockout cells that
no longer can express PrPC [5] (Figure 3A) and compared them with
wild-type parental cells using global proteome analyses (Figure 3B).
These analyses revealed that the absence of PrPC strongly decreased
cellular levels of the neural cell adhesion molecule 1 (NCAM1) [6]
(Figure 3C). Western blot–based analyses then led to the surprising
discovery that, in addition to profoundly affecting NCAM1 protein levels,
the lack of PrPC had abrogated NCAM1 polysialylation (Figure 3D). The
polysialylation of NCAM1 is a critical posttranslational modification in the
brain that controls specific protein interactions, influences chemotactic
guidance, and modulates ion channels, and NCAM1 is the predominant
acceptor of this modification in vertebrates. We then became aware
of a body of literature documenting that impaired polysialylation of
NCAM1 perturbs (i) sleep-wake cycles, (ii) neurogenesis, (iii) neurite
outgrowth of specific mossy fiber axon bundles in the hippocampus,
and (iv) myelination [7]. These phenotypes are highly reminiscent of
independently reported phenotypes observed in mice deficient for the
prion protein [8,9], consistent with the interpretation that the contribution
of PrPC to NCAM1 polysialylation might be its predominant role [10].
CRISPR-Cas9–generated neuroblastoma cells with inducible Tau expressionThe second project highlights a useful application of CRISPR-Cas9
technology for the generation of human cell models that inducibly
express a protein of interest fused to a fluorescent affinity-capture tag
(Figure 4), allowing the production of in-depth interactome datasets
in less than a month. In this project, we were interested in dissecting
molecular events that may cause cellular death in a small subset of
FTDs caused by specific inherited mutations in the gene encoding the
microtubule-associated protein Tau (MAPT). Neural Tau transcripts are
subject to alternative splicing events that generate up to six prominent
Tau isoforms, which can be further classified as having either three
or four repeats (3R or 4R) in the microtubule-binding domains. In the
brain, a balanced amount of 3R and 4R Tau is critical for cellular
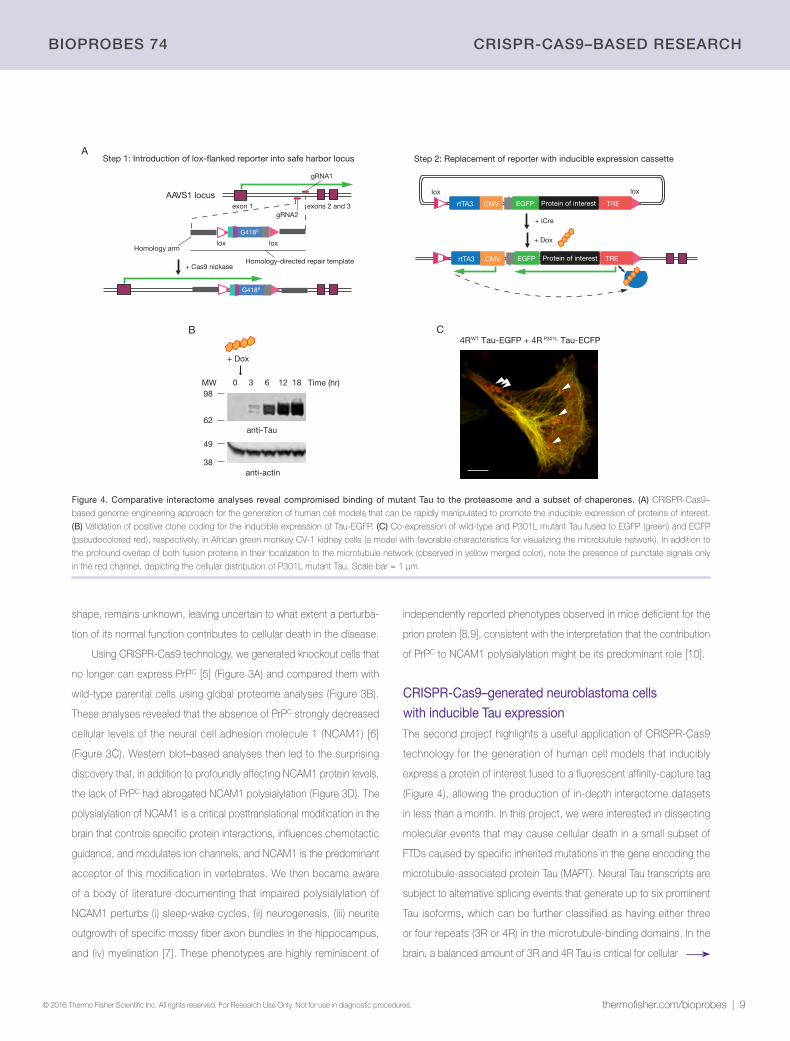
Figure 4. Comparative interactome analyses reveal compromised binding of mutant Tau to the proteasome and a subset of chaperones. (A) CRISPR-Cas9–
based genome engineering approach for the generation of human cell models that can be rapidly manipulated to promote the inducible expression of proteins of interest.
(B) Validation of positive clone coding for the inducible expression of Tau-EGFP. (C) Co-expression of wild-type and P301L mutant Tau fused to EGFP (green) and ECFP
(pseudocolored red), respectively, in African green monkey CV-1 kidney cells (a model with favorable characteristics for visualizing the microbutule network). In addition to
the profound overlap of both fusion proteins in their localization to the microtubule network (observed in yellow merged color), note the presence of punctate signals only
in the red channel, depicting the cellular distribution of P301L mutant Tau. Scale bar = 1 µm.
lox
+ iCre
G418R
A
lox
rtTA3 CMV TREProtein of interestEGFP
+ Dox
REtightrtTA3 CMV Protein of interest TREEGFPHomology-directed repair template
AAVS1 locusexon 1
lox lox
exons 2 and 3
Homology arm
+ Cas9 nickase
gRNA2
gRNA1
Step 2: Replacement of reporter with inducible expression cassetteStep 1: Introduction of lox-�anked reporter into safe harbor locus
G418R
C4RWT Tau-EGFP + 4R P301L Tau-ECFP
B
0 3 6 12 18
anti-Tau
+ Dox
Time (hr)
anti-actin
49
38
98
62
MW
10 | thermofisher.com/bioprobes © 2016 Thermo Fisher Scientific Inc. All rights reserved. For Research Use Only. Not for use in diagnostic procedures.
CrIsPr-CAs9–BAsED rEsEArCH BIOPrOBEs 74
References1. Spillantini MG, Goedert M (2013) Lancet Neurol 12:609–622.
2. Mali P, Esvelt KM, Church GM (2013) Nat Methods 10:957–963.
3. Dayon L, Sanchez JC (2012) Methods Mol Biol 893:115–127.
4. Zieske LR (2006) J Exp Bot 57:1501–1508.
5. Mehrabian M, Brethour D, MacIsaac S et al. (2014) PLoS One 9:e114594.
6. Mehrabian M, Brethour D, Wang H et al. (2015) PLoS One 10:e0133741.
7. Rutishauser U (2008) Nat Rev Neurosci 9:26–35.
8. Aguzzi A, Baumann F, Bremer J (2008) Annu Rev Neurosci 31:439–477.
9. Steele AD, Lindquist S, Aguzzi A (2007) Prion 1:83–93.
10. Mehrabian M, Hildebrandt H, Schmitt-Ulms G (2016) ASN Neuro. In press.
11. Myeku N, Clelland CL, Emrani S et al. (2016) Nat Med 22:46–53.
12. Wang X, Williams D, Wang H et al. (2016) Manuscript in preparation.
13. Gunawardana CG, Mehrabian M, Wang X et al. (2015) Mol Cell Proteomics 14:3000–3014.
Product Quantity Cat. No.
GeneArt™ CRISPR Nuclease mRNA 15 µg A29378
GeneArt™ CRISPR Nuclease Vector with OFP Reporter Kit
10 reactions A21174
GeneArt™ CRISPR Nuclease Vector with OFP Reporter Kit, with competent cells
10 reactions A21178
GeneArt™ CRISPR Nuclease Vector with CD4 Enrichment Kit
10 reactions A21175
GeneArt™ CRISPR Nuclease Vector with CD4 Enrichment Kit, with competent cells
10 reactions A21177
GeneArt™ Platinum™ Cas9 Nuclease, 1 µg/µLGeneArt™ Platinum™ Cas9 Nuclease, 1 µg/µLGeneArt™ Platinum™ Cas9 Nuclease, 3 µg/µL
10 µg25 µg75 µg
B25642B25640B25641
GeneArt™ Genomic Cleavage Detection KitGeneArt™ Genomic Cleavage Selection Kit
20 reactions10 reactions
A24372A27663
TMTsixplex™ Isobaric Label Reagent Set 6 reactions12 reactions30 reactions
900619006290066
Acknowledgments: This art ic le was contr ibuted by Declan Wi l l iams,
Mohadeseh Mehrabian, Xinzhu Wang, and Gerold Schmitt-Ulms; Tanz
Centre for Research in Neurodegenerative Diseases, University of Toronto.
The lat ter three authors are a lso associated with the Department of
Laboratory Medicine & Pathobiology, University of Toronto. Gerold Schmitt-
Ulms is the corresponding author; please address correspondence to:
health. Available human cell models exhibit unbalanced isoform ratios,
and it has repeatedly been shown that the plasmid-encoded expression
of 4R Tau can cause cellular toxicity by itself [11].
To overcome this confounder to cell-based Tau studies, we
employed a two-step genome engineering approach to generate
human neuroblastoma cell models that express equal levels of 3R and
4R wild-type or mutant Tau [12]. In the first step, we used the double
CRISPR-Cas9 nickase technology to introduce a G418 resistance
marker flanked by lox sites into the AAVS1 genomic safe harbor, a
site known to tolerate insertions without adverse effects on the cell
(Figure 4A).The coding sequences for 3R and 4R Tau, packaged in
an expression cassette flanked by compatible lox sites, were then
switched into the genome via cotransfection of Cre recombinase. To
allow the inducible expression of Tau and facilitate its cellular tracking
and capture, the Tau coding sequence was placed between a tetra-
cycline response element (TRE) promoter and a C-terminal Enhanced
Green Fluorescent Protein (EGFP). Finally, we included in the plasmid
expression cassettes a reverse tetracycline transactivator (rtTa) and a
puromycin selection marker.
As intended, the cells expressed equal levels of 3R and 4R wild-type
or mutant Tau upon induction with doxycycline (Figure 4B). Consistent
with expectations, the presence of the mutation caused Tau not only
to bind microtubules but also to appear in punctate aggresome-like
structures (Figure 4C). The presence of the C-terminal EGFP tag has
been shown to have no adverse effect on Tau biology and facilitated
the capture of Tau-EGFP fusion proteins on GFP-binding protein (GBP)
matrices. Our analyses of these cells are ongoing but have already
revealed several interesting insights, including differential binding of
wild-type and mutant Tau to certain chaperones and the proteasome
[13], consistent with the notion that FTD may be caused by impaired
recycling of the Tau protein. The ability to induce Tau and follow it over
time will allow us to dissect the chronology of events underlying Tau’s
impaired recycling, identify the cellular pathways that are poisoned in
cells when Tau aggregates are forming, and uncover abnormal changes
to molecular interactions and posttranslational modifications of Tau that
facilitate the formation of aggregates.
Future directionsAlthough genome editing is not new, the relative ease with which animal
and cell models can be generated with the CRISPR-Cas9 technology
has already had a profound impact on biomedical research. The system
still suffers from efficacy limitations in regards to achieving a specific
genome edit and in its delivery to cells in complex tissues. On the
proteome analysis side, we are still limited in the proteome coverage
that can be achieved even with the most high-end equipment. The
rapid pace of innovation we have witnessed in CRISPR-Cas9 technol-
ogy and mass spectrometry is not expected to abate any time soon.
The rewards that the combination of both approaches promises are
only beginning to be realized. Good times for biomedical research
are waiting ahead. ■
thermofisher.com/bioprobes | 11 © 2016 Thermo Fisher Scientific Inc. All rights reserved. For Research Use Only. Not for use in diagnostic procedures.
BIOPrOBEs 74 CrIsPr-CAs9–BAsED rEsEArCH
Apply CRISPR-Cas9 gene editing to high-throughput screeningLentiArray CRISPR libraries.
The CRISPR-Cas9 gene editing system
provides an efficient approach for specific,
complete, and permanent knockout of gene
expression, making it a potent research
tool for determining key players in specific
biological pathways. The new Invitrogen™
LentiArray™ CRISPR libraries extend CRISPR-
Cas9 technology into high-throughput appli-
cations for functional genomic screening.
LentiArray libraries enable the interrogation
of hundreds or thousands of genes in a single
experiment with:
■ Advanced guide RNA (gRNA) designs for
maximum knockout efficiency without
sacrificing specificity
■ Up to 4 high-quality gRNAs per gene
target, for efficient knockout in a wide
variety of cell types
■ Two choices for delivery—high-titer, ready-
to-use lentivirus, or glycerol stocks of
E. coli containing lentiviral plasmids
■ A complete set of controls and lentiviruses
against single-gene targets to support
pre-screen assay development and rapid
post-screen hit validation
■ 19 defined libraries and custom options
available, enabling screens of defined
gene sets or unbiased surveys of the
whole genome (Table 1)
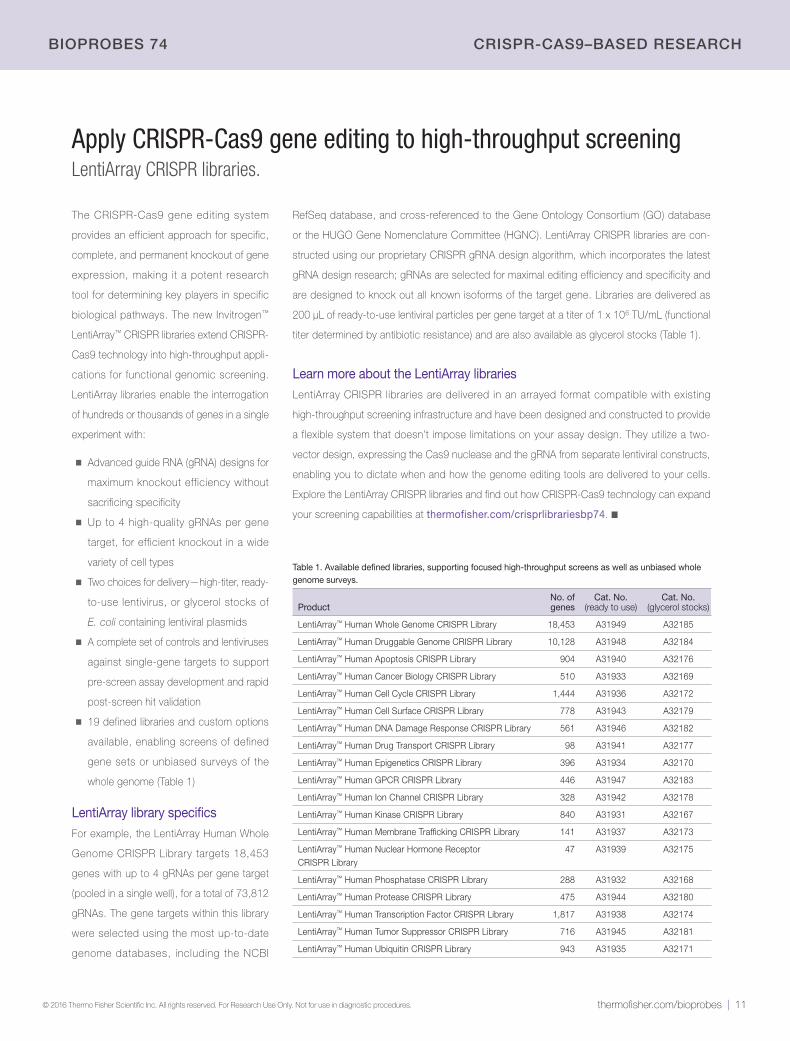
LentiArray library specificsFor example, the LentiArray Human Whole
Genome CRISPR Library targets 18,453
genes with up to 4 gRNAs per gene target
(pooled in a single well), for a total of 73,812
gRNAs. The gene targets within this library
were selected using the most up-to-date
genome databases, including the NCBI
RefSeq database, and cross-referenced to the Gene Ontology Consortium (GO) database
or the HUGO Gene Nomenclature Committee (HGNC). LentiArray CRISPR libraries are con-
structed using our proprietary CRISPR gRNA design algorithm, which incorporates the latest
gRNA design research; gRNAs are selected for maximal editing efficiency and specificity and
are designed to knock out all known isoforms of the target gene. Libraries are delivered as
200 μL of ready-to-use lentiviral particles per gene target at a titer of 1 x 10⁶ TU/mL (functional
titer determined by antibiotic resistance) and are also available as glycerol stocks (Table 1).
Learn more about the LentiArray librariesLentiArray CRISPR libraries are delivered in an arrayed format compatible with existing
high-throughput screening infrastructure and have been designed and constructed to provide
a flexible system that doesn’t impose limitations on your assay design. They utilize a two-
vector design, expressing the Cas9 nuclease and the gRNA from separate lentiviral constructs,
enabling you to dictate when and how the genome editing tools are delivered to your cells.
Explore the LentiArray CRISPR libraries and find out how CRISPR-Cas9 technology can expand
your screening capabilities at thermofisher.com/crisprlibrariesbp74. ■
Table 1. Available defined libraries, supporting focused high-throughput screens as well as unbiased whole genome surveys.
Product No. of genes
Cat. No. (ready to use)
Cat. No. (glycerol stocks)
LentiArray™ Human Whole Genome CRISPR Library 18,453 A31949 A32185
LentiArray™ Human Druggable Genome CRISPR Library 10,128 A31948 A32184
LentiArray™ Human Apoptosis CRISPR Library 904 A31940 A32176
LentiArray™ Human Cancer Biology CRISPR Library 510 A31933 A32169
LentiArray™ Human Cell Cycle CRISPR Library 1,444 A31936 A32172
LentiArray™ Human Cell Surface CRISPR Library 778 A31943 A32179
LentiArray™ Human DNA Damage Response CRISPR Library 561 A31946 A32182
LentiArray™ Human Drug Transport CRISPR Library 98 A31941 A32177
LentiArray™ Human Epigenetics CRISPR Library 396 A31934 A32170
LentiArray™ Human GPCR CRISPR Library 446 A31947 A32183
LentiArray™ Human Ion Channel CRISPR Library 328 A31942 A32178
LentiArray™ Human Kinase CRISPR Library 840 A31931 A32167
LentiArray™ Human Membrane Trafficking CRISPR Library 141 A31937 A32173
LentiArray™ Human Nuclear Hormone Receptor CRISPR Library
47 A31939 A32175
LentiArray™ Human Phosphatase CRISPR Library 288 A31932 A32168
LentiArray™ Human Protease CRISPR Library 475 A31944 A32180
LentiArray™ Human Transcription Factor CRISPR Library 1,817 A31938 A32174
LentiArray™ Human Tumor Suppressor CRISPR Library 716 A31945 A32181
LentiArray™ Human Ubiquitin CRISPR Library 943 A31935 A32171
12 | thermofisher.com/bioprobes © 2016 Thermo Fisher Scientific Inc. All rights reserved. For Research Use Only. Not for use in diagnostic procedures.
CrIsPr-CAs9–BAsED rEsEArCH BIOPrOBEs 74
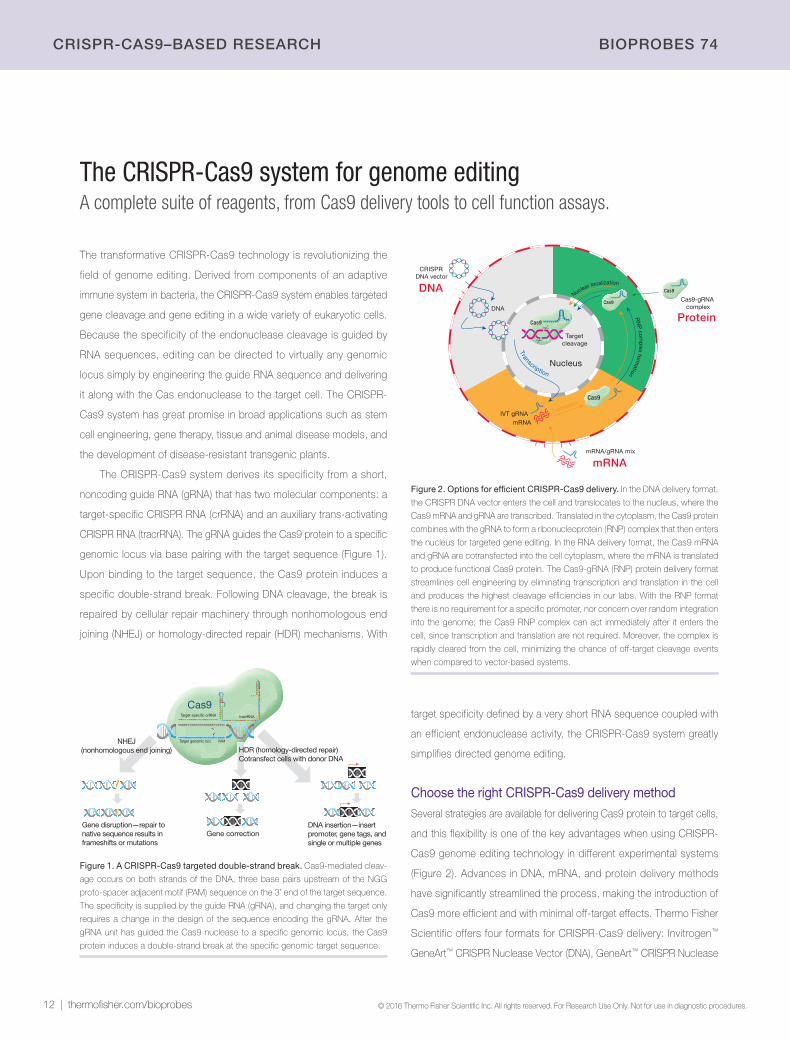
The CRISPR-Cas9 system for genome editingA complete suite of reagents, from Cas9 delivery tools to cell function assays.
The transformative CRISPR-Cas9 technology is revolutionizing the
field of genome editing. Derived from components of an adaptive
immune system in bacteria, the CRISPR-Cas9 system enables targeted
gene cleavage and gene editing in a wide variety of eukaryotic cells.
Because the specificity of the endonuclease cleavage is guided by
RNA sequences, editing can be directed to virtually any genomic
locus simply by engineering the guide RNA sequence and delivering
it along with the Cas endonuclease to the target cell. The CRISPR-
Cas9 system has great promise in broad applications such as stem
cell engineering, gene therapy, tissue and animal disease models, and
the development of disease-resistant transgenic plants.
The CRISPR-Cas9 system derives its specificity from a short,
noncoding guide RNA (gRNA) that has two molecular components: a
target-specific CRISPR RNA (crRNA) and an auxiliary trans-activating
CRISPR RNA (tracrRNA). The gRNA guides the Cas9 protein to a specific
genomic locus via base pairing with the target sequence (Figure 1).
Upon binding to the target sequence, the Cas9 protein induces a
specific double-strand break. Following DNA cleavage, the break is
repaired by cellular repair machinery through nonhomologous end
joining (NHEJ) or homology-directed repair (HDR) mechanisms. With
target specificity defined by a very short RNA sequence coupled with
an efficient endonuclease activity, the CRISPR-Cas9 system greatly
simplifies directed genome editing.
Choose the right CRISPR-Cas9 delivery methodSeveral strategies are available for delivering Cas9 protein to target cells,
and this flexibility is one of the key advantages when using CRISPR-
Cas9 genome editing technology in different experimental systems
(Figure 2). Advances in DNA, mRNA, and protein delivery methods
have significantly streamlined the process, making the introduction of
Cas9 more efficient and with minimal off-target effects. Thermo Fisher
Scientific offers four formats for CRISPR-Cas9 delivery: Invitrogen™
GeneArt™ CRISPR Nuclease Vector (DNA), GeneArt™ CRISPR Nuclease
Figure 1. A CRISPR-Cas9 targeted double-strand break. Cas9-mediated cleav-
age occurs on both strands of the DNA, three base pairs upstream of the NGG
proto-spacer adjacent motif (PAM) sequence on the 3’ end of the target sequence.
The specificity is supplied by the guide RNA (gRNA), and changing the target only
requires a change in the design of the sequence encoding the gRNA. After the
gRNA unit has guided the Cas9 nuclease to a specific genomic locus, the Cas9
protein induces a double-strand break at the specific genomic target sequence.
mrNA
Protein
DNA
mRNA/gRNA mix
DNA
mRNAIVT gRNA
CRISPR DNA vector
Translation
Nucleus
Nuclear localization
Cas9
Cas9
Cas9
Cas9
Targetcleavage
Cas9-gRNA complex
RN
P com
plex form
ation
Transcription
Figure 2. Options for efficient CRISPR-Cas9 delivery. In the DNA delivery format,
the CRISPR DNA vector enters the cell and translocates to the nucleus, where the
Cas9 mRNA and gRNA are transcribed. Translated in the cytoplasm, the Cas9 protein
combines with the gRNA to form a ribonucleoprotein (RNP) complex that then enters
the nucleus for targeted gene editing. In the RNA delivery format, the Cas9 mRNA
and gRNA are cotransfected into the cell cytoplasm, where the mRNA is translated
to produce functional Cas9 protein. The Cas9-gRNA (RNP) protein delivery format
streamlines cell engineering by eliminating transcription and translation in the cell
and produces the highest cleavage efficiencies in our labs. With the RNP format
there is no requirement for a specific promoter, nor concern over random integration
into the genome; the Cas9 RNP complex can act immediately after it enters the
cell, since transcription and translation are not required. Moreover, the complex is
rapidly cleared from the cell, minimizing the chance of off-target cleavage events
when compared to vector-based systems.
Cas9
Gene disruption—repair to native sequence results in frameshifts or mutations
Gene correctionDNA insertion—insert promoter, gene tags, and single or multiple genes
NHEJ(nonhomologous end joining) HDR (homology-directed repair)
Cotransfect cells with donor DNA
Target-speci�c crRNA
Target genomic loci PAM
tracrRNA
thermofisher.com/bioprobes | 13 © 2016 Thermo Fisher Scientific Inc. All rights reserved. For Research Use Only. Not for use in diagnostic procedures.
BIOPrOBEs 74 CrIsPr-CAs9–BAsED rEsEArCH
directly, and when antibiotic selection is used to identify transfected
cells, viability assays can be used to monitor the selection process.
Monitoring the efficiency of genome editing. When using
genome editing tools—such as CRISPR-Cas9, TAL effectors, or zinc
finger nucleases—to obtain targeted mutations, you need to determine
the efficiency with which these nucleases cleave the target sequence,
prior to continuing with labor-intensive and expensive experiments. The
Invitrogen™ GeneArt™ Genomic Cleavage Detection Kit provides a simple
and reliable assay for the cleavage efficiency of genome editing tools
at a given locus. In this assay, a sample of the edited cell population is
used as a direct PCR template for amplification with primers specific to
the targeted region. The PCR product is then denatured and reannealed
to produce heteroduplex mismatches where double-strand breaks
have occurred, resulting in insertion/deletion (indel) introduction. These
mismatches are recognized and cleaved by the detection enzyme,
and the cleavage is easily detectable and quantifiable by gel analysis.
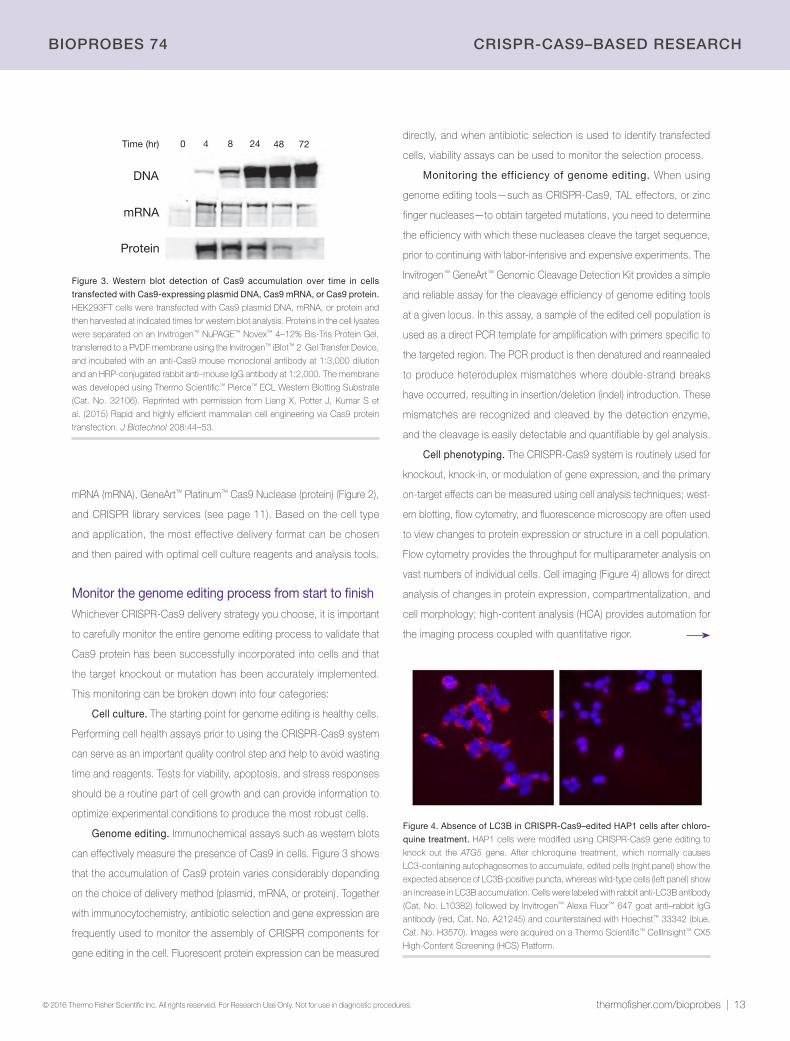
Cell phenotyping. The CRISPR-Cas9 system is routinely used for
knockout, knock-in, or modulation of gene expression, and the primary
on-target effects can be measured using cell analysis techniques; west-
ern blotting, flow cytometry, and fluorescence microscopy are often used
to view changes to protein expression or structure in a cell population.
Flow cytometry provides the throughput for multiparameter analysis on
vast numbers of individual cells. Cell imaging (Figure 4) allows for direct
analysis of changes in protein expression, compartmentalization, and
cell morphology; high-content analysis (HCA) provides automation for
the imaging process coupled with quantitative rigor.
mRNA (mRNA), GeneArt™ Platinum™ Cas9 Nuclease (protein) (Figure 2),
and CRISPR library services (see page 11). Based on the cell type
and application, the most effective delivery format can be chosen
and then paired with optimal cell culture reagents and analysis tools.
Monitor the genome editing process from start to finishWhichever CRISPR-Cas9 delivery strategy you choose, it is important
to carefully monitor the entire genome editing process to validate that
Cas9 protein has been successfully incorporated into cells and that
the target knockout or mutation has been accurately implemented.
This monitoring can be broken down into four categories:
Cell culture. The starting point for genome editing is healthy cells.
Performing cell health assays prior to using the CRISPR-Cas9 system
can serve as an important quality control step and help to avoid wasting
time and reagents. Tests for viability, apoptosis, and stress responses
should be a routine part of cell growth and can provide information to
optimize experimental conditions to produce the most robust cells.
Genome editing. Immunochemical assays such as western blots
can effectively measure the presence of Cas9 in cells. Figure 3 shows
that the accumulation of Cas9 protein varies considerably depending
on the choice of delivery method (plasmid, mRNA, or protein). Together
with immunocytochemistry, antibiotic selection and gene expression are
frequently used to monitor the assembly of CRISPR components for
gene editing in the cell. Fluorescent protein expression can be measured
Figure 3. Western blot detection of Cas9 accumulation over time in cells
transfected with Cas9-expressing plasmid DNA, Cas9 mRNA, or Cas9 protein.
HEK293FT cells were transfected with Cas9 plasmid DNA, mRNA, or protein and
then harvested at indicated times for western blot analysis. Proteins in the cell lysates
were separated on an Invitrogen™ NuPAGE™ Novex™ 4–12% Bis-Tris Protein Gel,
transferred to a PVDF membrane using the Invitrogen™ iBlot™ 2 Gel Transfer Device,
and incubated with an anti-Cas9 mouse monoclonal antibody at 1:3,000 dilution
and an HRP-conjugated rabbit anti–mouse IgG antibody at 1:2,000. The membrane
was developed using Thermo Scientific™ Pierce™ ECL Western Blotting Substrate
(Cat. No. 32106). Reprinted with permission from Liang X, Potter J, Kumar S et
al. (2015) Rapid and highly efficient mammalian cell engineering via Cas9 protein
transfection. J Biotechnol 208:44–53.
DNA
72
Protein
mRNA
4824840(hr)Time
Figure 4. Absence of LC3B in CRISPR-Cas9–edited HAP1 cells after chloro-
quine treatment. HAP1 cells were modified using CRISPR-Cas9 gene editing to
knock out the ATG5 gene. After chloroquine treatment, which normally causes
LC3-containing autophagosomes to accumulate, edited cells (right panel) show the
expected absence of LC3B-positive puncta, whereas wild-type cells (left panel) show
an increase in LC3B accumulation. Cells were labeled with rabbit anti-LC3B antibody
(Cat. No. L10382) followed by Invitrogen™ Alexa Fluor™ 647 goat anti–rabbit IgG
antibody (red, Cat. No. A21245) and counterstained with Hoechst™ 33342 (blue,
Cat. No. H3570). Images were acquired on a Thermo Scientific™ CellInsight™ CX5
High-Content Screening (HCS) Platform.
14 | thermofisher.com/bioprobes © 2016 Thermo Fisher Scientific Inc. All rights reserved. For Research Use Only. Not for use in diagnostic procedures.
CrIsPr-CAs9–BAsED rEsEArCH BIOPrOBEs 74
Product Quantity Cat. No.
CRISPR protein
GeneArt™ Platinum Cas9 Nuclease (1 µg/µL)GeneArt™ Platinum Cas9 Nuclease (1 µg/µL)GeneArt™ Platinum Cas9 Nuclease (3 µg/µL)
10 µg25 µg75 µg
B25642B25640B25641
CRISPR mRNA
GeneArt™ CRISPR Nuclease mRNA 15 µg A29378
GeneArt™ Strings U6 DNA >200 ng Contact [email protected]
GeneArt™ Strings T7 DNA >200 ng Contact [email protected]
Custom in vitro–transcribed gRNA 250 nmol Contact [email protected]
CRISPR plasmid
GeneArt™ CRISPR Nuclease Vector with OFP Reporter Kit 10 reactions A21174
GeneArt™ CRISPR Nuclease Vector with OFP Reporter, with competent cells 10 reactions A21178
GeneArt™ CRISPR Nuclease Vector with CD4 Enrichment Kit 10 reactions A21175
GeneArt™ CRISPR Nuclease Vector with CD4 Enrichment Kit, with competent cells 10 reactions A21177
CRISPR-Cas9 gRNA
GeneArt™ Precision gRNA Synthesis Kit A29377
CRISPR libraries: see page 11 and go to thermofisher.com/crisprlibraries. For custom (arrayed or pooled) CRISPR libraries, contact [email protected].
CRISPR engineered cell lines: go to thermofisher.com/engineeredcells. For custom stable cell line generation services, contact [email protected].
Detection and analysis reagents
GeneArt™ Genomic Cleavage Detection KitGeneArt™ Genomic Cleavage Selection Kit
20 reactions10 reactions
A24372A27663
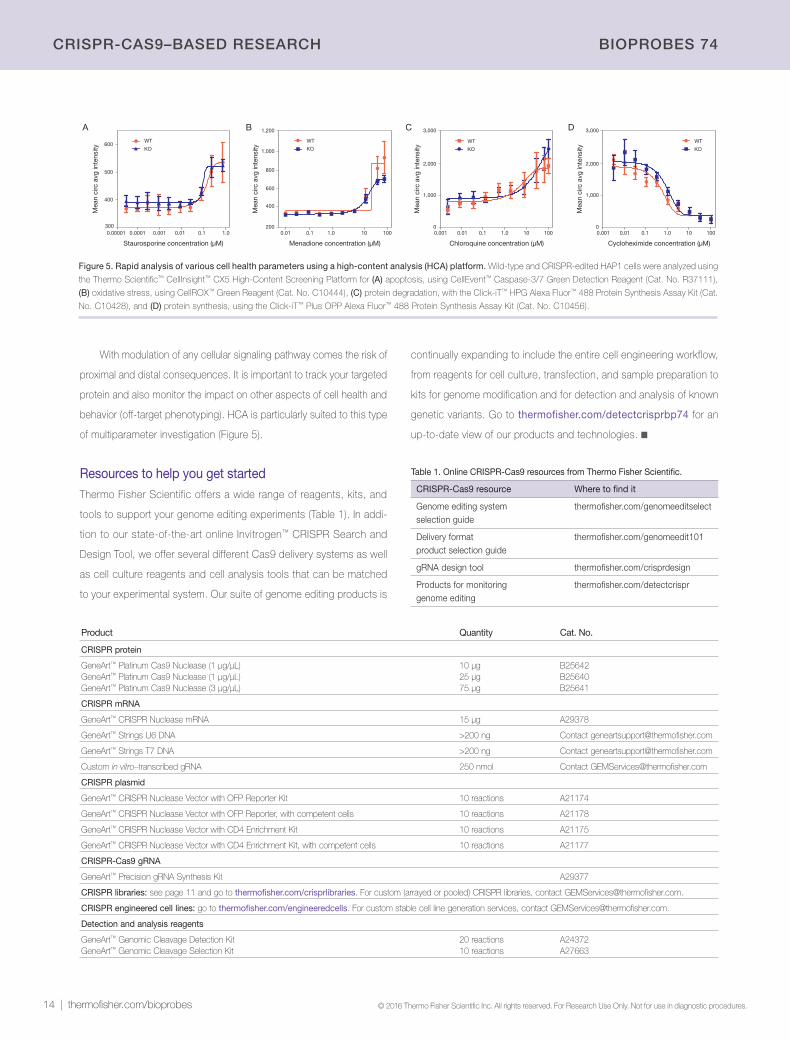
Figure 5. Rapid analysis of various cell health parameters using a high-content analysis (HCA) platform. Wild-type and CRISPR-edited HAP1 cells were analyzed using
the Thermo Scientific™ CellInsight™ CX5 High-Content Screening Platform for (A) apoptosis, using CellEvent™ Caspase-3/7 Green Detection Reagent (Cat. No. R37111),
(B) oxidative stress, using CellROX™ Green Reagent (Cat. No. C10444), (C) protein degradation, with the Click-iT™ HPG Alexa Fluor™ 488 Protein Synthesis Assay Kit (Cat.
No. C10428), and (D) protein synthesis, using the Click-iT™ Plus OPP Alexa Fluor™ 488 Protein Synthesis Assay Kit (Cat. No. C10456).
A B C
Chloroquine concentration (μM)
Mea
n ci
rc a
vg in
tens
ity
1,000
2,000
3,000
01.00.10.01 100100.001
Menadione concentration (μM)
1.00.10.01 100
Mea
n ci
rc a
vg in
tens
ity
400
600
800
1,000
1,200
20010
Staurosporine concentration (μM)
0.00001 0.010.0010.0001 1.0
Mea
n ci
rc a
vg in
tens
ity
400
300
500
600
0.1
WT
KO
WT
KO
WT
KO
D
Cycloheximide concentration (μM)
1.00.10.01 100
Mea
n ci
rc a
vg in
tens
ity
1,000
2,000
3,000
010
WT
KO
0.001
With modulation of any cellular signaling pathway comes the risk of
proximal and distal consequences. It is important to track your targeted
protein and also monitor the impact on other aspects of cell health and
behavior (off-target phenotyping). HCA is particularly suited to this type
of multiparameter investigation (Figure 5).
Resources to help you get startedThermo Fisher Scientific offers a wide range of reagents, kits, and
tools to support your genome editing experiments (Table 1). In addi-
tion to our state-of-the-art online Invitrogen™ CRISPR Search and
Design Tool, we offer several different Cas9 delivery systems as well
as cell culture reagents and cell analysis tools that can be matched
to your experimental system. Our suite of genome editing products is
Table 1. Online CRISPR-Cas9 resources from Thermo Fisher Scientific.
CRISPR-Cas9 resource Where to find it
Genome editing system selection guide
thermofisher.com/genomeeditselect
Delivery format product selection guide
thermofisher.com/genomeedit101
gRNA design tool thermofisher.com/crisprdesign
Products for monitoring genome editing
thermofisher.com/detectcrispr
continually expanding to include the entire cell engineering workflow,
from reagents for cell culture, transfection, and sample preparation to
kits for genome modification and for detection and analysis of known
genetic variants. Go to thermofisher.com/detectcrisprbp74 for an
up-to-date view of our products and technologies. ■
thermofisher.com/bioprobes | 15 © 2016 Thermo Fisher Scientific Inc. All rights reserved. For Research Use Only. Not for use in diagnostic procedures.
BIOPrOBEs 74 sTEM CELL rEsEArCH
Assess the differentiation potential of human pluripotent stem cellsAn improved qPCR-based ScoreCard assay.Alexander M. Tsankov; Broad Institute, Harvard University.
Human pluripotent stem cells (hPSCs) hold great promise for tissue
engineering, regenerative medicine, and disease modeling [1]. The
number of hPSC lines has dramatically increased in the past decade,
which has created a need for hPSC quality standards that can ensure
comparable results across laboratories [2]. We recently introduced a
qPCR-based ScoreCard assay that uses gene expression signatures
to quantify the differentiation potential of hPSC lines [3]. The improved
ScoreCard method enables a rapid, more reproducible assessment of
functional pluripotency than the teratoma assay and allows for a wider
range of applications than previous genomic approaches, including
screening of small molecules, quantifying perturbations of lineage
regulators, and assessing different culture conditions.
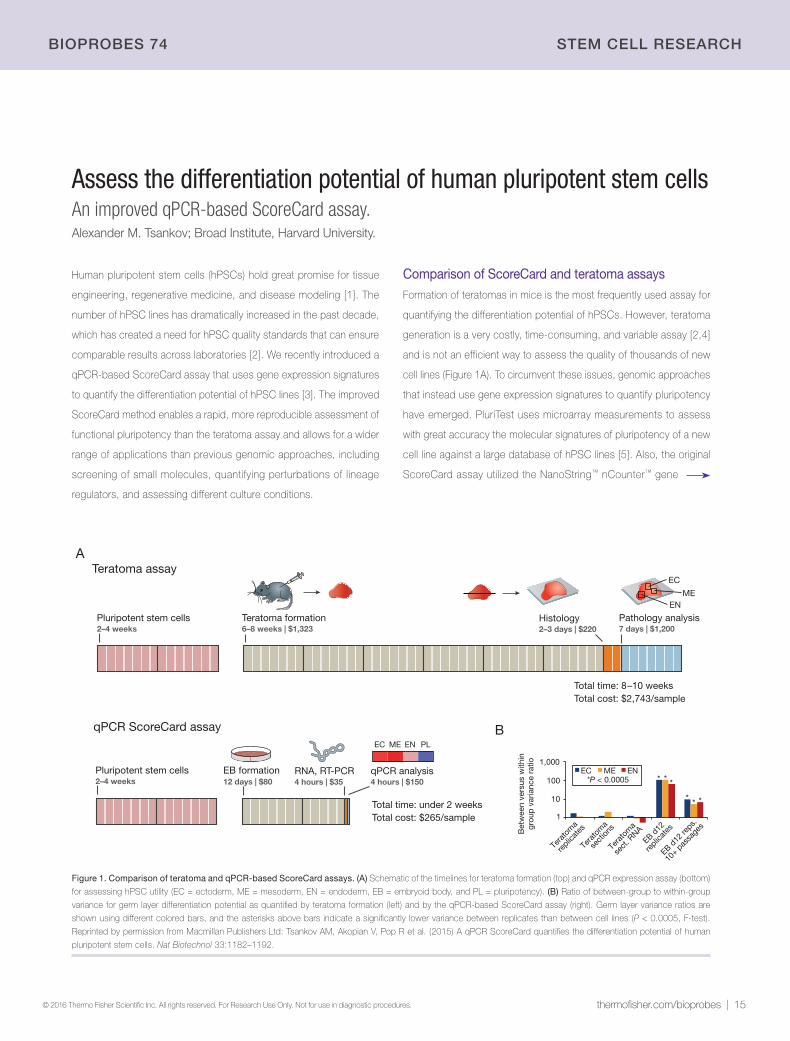
Comparison of ScoreCard and teratoma assaysFormation of teratomas in mice is the most frequently used assay for
quantifying the differentiation potential of hPSCs. However, teratoma
generation is a very costly, time-consuming, and variable assay [2,4]
and is not an efficient way to assess the quality of thousands of new
cell lines (Figure 1A). To circumvent these issues, genomic approaches
that instead use gene expression signatures to quantify pluripotency
have emerged. PluriTest uses microarray measurements to assess
with great accuracy the molecular signatures of pluripotency of a new
cell line against a large database of hPSC lines [5]. Also, the original
ScoreCard assay utilized the NanoString™ nCounter™ gene
* **
* **
Teratoma assay
Total time: 8–10 weeksTotal cost: $2,743/sample
Total time: under 2 weeksTotal cost: $265/sample
Teratoma formation Histology Pathology analysis6–8 weeks | $1,323 2–3 days | $220 7 days | $1,200
qPCR ScoreCard assay
EB formation RNA, RT-PCR qPCR analysis12 days | $80 4 hours | $35 4 hours | $150
Pluripotent stem cells2–4 weeks
Pluripotent stem cells2–4 weeks
EC
MEEN
EC PLME EN
1
10
100
1,000
Tera
tom
a
replic
ates
Tera
tom
a
sect
ions
Tera
tom
a
sect
. RNA
EB d12
replic
ates
EB d12
reps.
10+ p
assa
ges
Bet
wee
n ve
rsus
with
in
grou
p v
aria
nce
ratio
EC ME EN *P < 0.0005
A
B
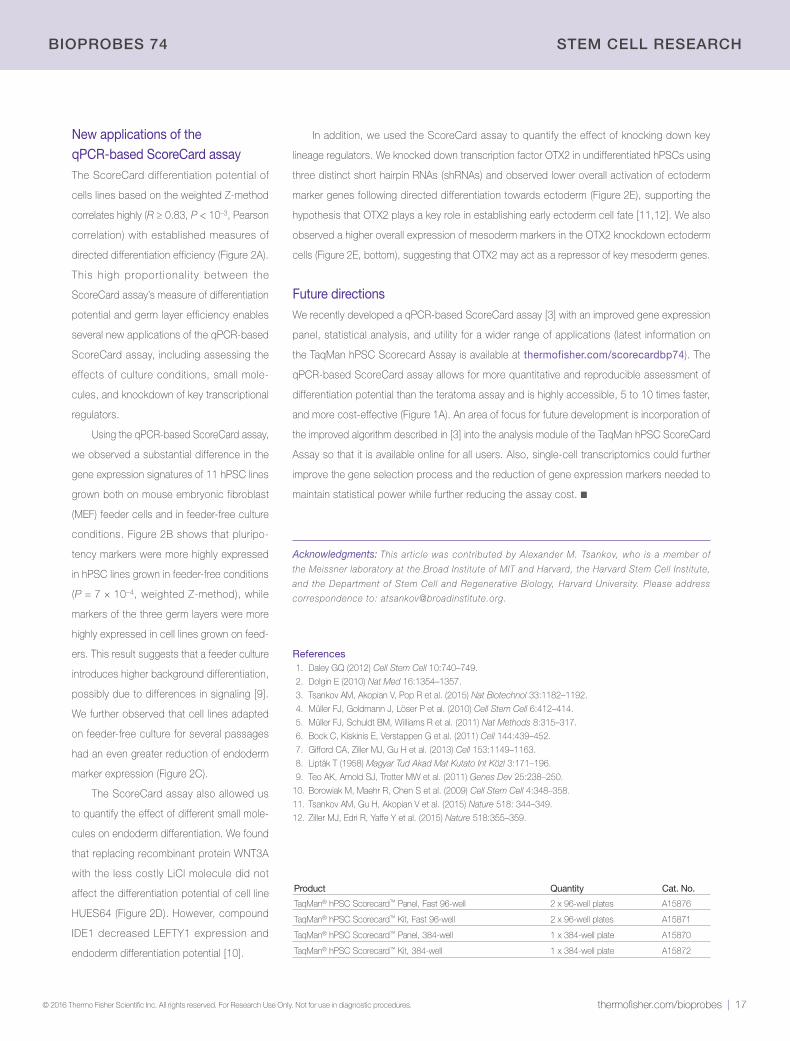
Figure 1. Comparison of teratoma and qPCR-based ScoreCard assays. (A) Schematic of the timelines for teratoma formation (top) and qPCR expression assay (bottom)
for assessing hPSC utility (EC = ectoderm, ME = mesoderm, EN = endoderm, EB = embryoid body, and PL = pluripotency). (B) Ratio of between-group to within-group
variance for germ layer differentiation potential as quantified by teratoma formation (left) and by the qPCR-based ScoreCard assay (right). Germ layer variance ratios are
shown using different colored bars, and the asterisks above bars indicate a significantly lower variance between replicates than between cell lines (P < 0.0005, F-test).
Reprinted by permission from Macmillan Publishers Ltd: Tsankov AM, Akopian V, Pop R et al. (2015) A qPCR ScoreCard quantifies the differentiation potential of human
pluripotent stem cells. Nat Biotechnol 33:1182–1192.
16 | thermofisher.com/bioprobes © 2016 Thermo Fisher Scientific Inc. All rights reserved. For Research Use Only. Not for use in diagnostic procedures.
sTEM CELL rEsEArCH BIOPrOBEs 74
expression technology to evaluate both molecular and functional
pluripotency [6], defined as differentiation into the three germ layers.
We have developed a qPCR-based ScoreCard assay (available
commercially as the Applied Biosystems™ TaqMan® hPSC Scorecard™
Panel), which presents several advantages over previous approaches
[3]. The assay is highly accessible to all labs with qPCR machines and
more cost-effective than the previous ScoreCard assay. The gene
panel leverages recent data on genome-wide expression of early germ
layer differentiation [7] to improve the uniqueness of marker genes. We
also improved the statistical analysis using the weighted Z-method,
which combines information across multiple genes in a weighted,
assay-dependent manner while also taking into account dependencies
between genes [8]. The weighted Z-method thus enables a wider array
of applications than the previous ScoreCard assay and provides a
statistical measure of functional pluripotency.
We compared the predictive power of cell line differentiation
potential as quantified by the teratoma assay and by the qPCR-based
ScoreCard assay following embryoid body (EB) differentiation. We
calculated the variance in assay scores between different cell lines
and within replicates from the same cell lines. The between-group and
within-group variances for the teratoma-predicted differentiation potential
were very similar when quantified by an independent pathologist and
when using gene expression signatures of our panel (Figure 1B, left).
In contrast, we found that the EB differentiation potential scores had
a significantly lower within-replicate variance than between–cell line
variance (P < 0.0005, F-tests), even after culturing the replicates for
more than 10 passages (Figure 1B, right). These results show that EB
differentiation potential as quantified by the qPCR-based ScoreCard
assay is a more quantitative and reproducible measure of a cell line’s
germ layer propensity than the teratoma assay.
OTX2PA
X6W
NT1
POU4F1
CDH9
PAPLN
TRPM
8
LMX1A
NOS2
EN1SOX1
EC diff.
poten
tial
control_1control_2
shOTX2_1shOTX2_2shOTX2_3
GATA4
HAND1
BMP10
KLF5FO
XF1
PLVAP
RGS4
COLEC10
CDH5
HAND2
CDX2
ME d
iff.
poten
tial
control_1control_2
shOTX2_1shOTX2_2shOTX2_3
diff. potential, Zw
8 0 -3 10 5 0
A
dE
N H
UE
S64
EOMES
HNF4A
HHEXSOX17
PRDM1
LEFT
Y2
HNF1B
RXRGLE
FTY1
FOXA2
GATA6
WNT,AAR&DWNT,AATFSLiCl,AATFS
LiCl,AAR&D
IDE1LiCl,IDE1
6 0 -5 10 5 0
dEC-PSC
diff. potential, Zw -∆∆C dEN-PSC
EN diff.
poten
tial
y = 9.3x + 24 R = 0.83 P < 0.001
40
60
80
100
2 4 6 8
% C
D56
+ (d
EC
)
EC differentiation potential
PSC line
y = 19x – 80 R = 0.85 P < 0.001
20
40
60
80
6 7 8
% C
D56
+ (d
ME
)
ME differentiation potential
PSC line
y = 31x – 218 R = 0.97 P < 0.001
0
20
40
60
7 8 9
% C
D18
4+ (d
EN
)
EN differentiation potential
PSC line
dEC ef�ciency dME ef�ciency dEN ef�ciency
88665
32646
888823
EC markers:
ME markers:
EN markers:
B
EC ME EN PL
hPSC gene class
−4
–2
0
2
4
EC ME EN PL
hPSC gene class
Mea
n –∆
ΔC
t (w
/o −
w/
feed
ers)
−4
−2
0
2
4
EC ME EN PL
hPSC gene class
Mea
n –Δ
∆C
t(a
dap
ted
− u
nad
apte
d)
Adapted 1+ passages Adapted 6+ passages
* *
*
*
*
*
*P < 0.05 *P < 0.05
D
EC
dE
C H
UE
S64
dE
C H
UE
S64
t,
-∆∆Ct,
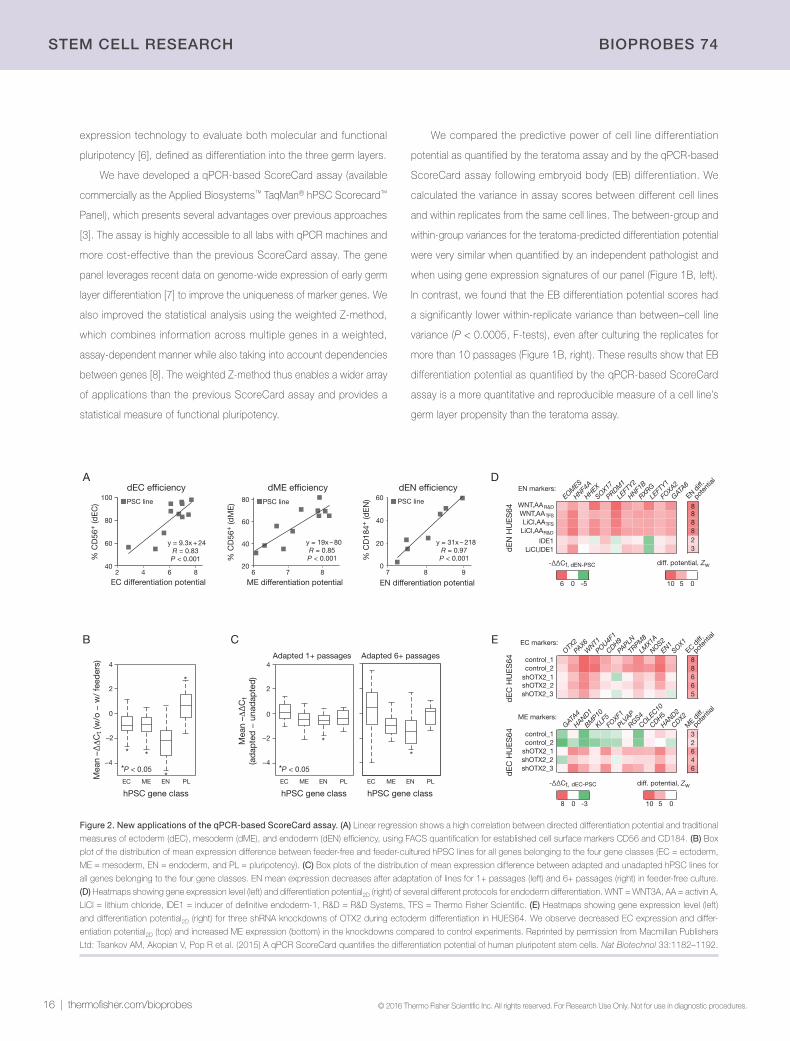
Figure 2. New applications of the qPCR-based ScoreCard assay. (A) Linear regression shows a high correlation between directed differentiation potential and traditional
measures of ectoderm (dEC), mesoderm (dME), and endoderm (dEN) efficiency, using FACS quantification for established cell surface markers CD56 and CD184. (B) Box
plot of the distribution of mean expression difference between feeder-free and feeder-cultured hPSC lines for all genes belonging to the four gene classes (EC = ectoderm,
ME = mesoderm, EN = endoderm, and PL = pluripotency). (C) Box plots of the distribution of mean expression difference between adapted and unadapted hPSC lines for
all genes belonging to the four gene classes. EN mean expression decreases after adaptation of lines for 1+ passages (left) and 6+ passages (right) in feeder-free culture.
(D) Heatmaps showing gene expression level (left) and differentiation potential2D (right) of several different protocols for endoderm differentiation. WNT = WNT3A, AA = activin A,
LiCl = lithium chloride, IDE1 = inducer of definitive endoderm-1, R&D = R&D Systems, TFS = Thermo Fisher Scientific. (E) Heatmaps showing gene expression level (left)
and differentiation potential2D (right) for three shRNA knockdowns of OTX2 during ectoderm differentiation in HUES64. We observe decreased EC expression and differ-
entiation potential2D (top) and increased ME expression (bottom) in the knockdowns compared to control experiments. Reprinted by permission from Macmillan Publishers
Ltd: Tsankov AM, Akopian V, Pop R et al. (2015) A qPCR ScoreCard quantifies the differentiation potential of human pluripotent stem cells. Nat Biotechnol 33:1182–1192.
thermofisher.com/bioprobes | 17 © 2016 Thermo Fisher Scientific Inc. All rights reserved. For Research Use Only. Not for use in diagnostic procedures.
BIOPrOBEs 74 sTEM CELL rEsEArCH
References1. Daley GQ (2012) Cell Stem Cell 10:740–749.
2. Dolgin E (2010) Nat Med 16:1354–1357.
3. Tsankov AM, Akopian V, Pop R et al. (2015) Nat Biotechnol 33:1182–1192.
4. Müller FJ, Goldmann J, Löser P et al. (2010) Cell Stem Cell 6:412–414.
5. Müller FJ, Schuldt BM, Williams R et al. (2011) Nat Methods 8:315–317.
6. Bock C, Kiskinis E, Verstappen G et al. (2011) Cell 144:439–452.
7. Gifford CA, Ziller MJ, Gu H et al. (2013) Cell 153:1149–1163.
8. Lipták T (1958) Magyar Tud Akad Mat Kutato Int Közl 3:171–196.
9. Teo AK, Arnold SJ, Trotter MW et al. (2011) Genes Dev 25:238–250.
10. Borowiak M, Maehr R, Chen S et al. (2009) Cell Stem Cell 4:348–358.
11. Tsankov AM, Gu H, Akopian V et al. (2015) Nature 518: 344–349.
12. Ziller MJ, Edri R, Yaffe Y et al. (2015) Nature 518:355–359.
New applications of the qPCR-based ScoreCard assayThe ScoreCard differentiation potential of
cells lines based on the weighted Z-method
correlates highly (R ≥ 0.83, P < 10–3, Pearson
correlation) with established measures of
directed differentiation efficiency (Figure 2A).
This h igh proport ional i ty between the
ScoreCard assay’s measure of differentiation
potential and germ layer efficiency enables
several new applications of the qPCR-based
ScoreCard assay, including assessing the
effects of culture conditions, small mole-
cules, and knockdown of key transcriptional
regulators.
Using the qPCR-based ScoreCard assay,
we observed a substantial difference in the
gene expression signatures of 11 hPSC lines
grown both on mouse embryonic fibroblast
(MEF) feeder cells and in feeder-free culture
conditions. Figure 2B shows that pluripo-
tency markers were more highly expressed
in hPSC lines grown in feeder-free conditions
(P = 7 × 10⁻⁴, weighted Z-method), while
markers of the three germ layers were more
highly expressed in cell lines grown on feed-
ers. This result suggests that a feeder culture
introduces higher background differentiation,
possibly due to differences in signaling [9].
We further observed that cell lines adapted
on feeder-free culture for several passages
had an even greater reduction of endoderm
marker expression (Figure 2C).
The ScoreCard assay also allowed us
to quantify the effect of different small mole-
cules on endoderm differentiation. We found
that replacing recombinant protein WNT3A
with the less costly LiCl molecule did not
affect the differentiation potential of cell line
HUES64 (Figure 2D). However, compound
IDE1 decreased LEFTY1 expression and
endoderm differentiation potential [10].
In addition, we used the ScoreCard assay to quantify the effect of knocking down key
lineage regulators. We knocked down transcription factor OTX2 in undifferentiated hPSCs using
three distinct short hairpin RNAs (shRNAs) and observed lower overall activation of ectoderm
marker genes following directed differentiation towards ectoderm (Figure 2E), supporting the
hypothesis that OTX2 plays a key role in establishing early ectoderm cell fate [11,12]. We also
observed a higher overall expression of mesoderm markers in the OTX2 knockdown ectoderm
cells (Figure 2E, bottom), suggesting that OTX2 may act as a repressor of key mesoderm genes.
Future directionsWe recently developed a qPCR-based ScoreCard assay [3] with an improved gene expression
panel, statistical analysis, and utility for a wider range of applications (latest information on
the TaqMan hPSC Scorecard Assay is available at thermofisher.com/scorecardbp74). The
qPCR-based ScoreCard assay allows for more quantitative and reproducible assessment of
differentiation potential than the teratoma assay and is highly accessible, 5 to 10 times faster,
and more cost-effective (Figure 1A). An area of focus for future development is incorporation of
the improved algorithm described in [3] into the analysis module of the TaqMan hPSC ScoreCard
Assay so that it is available online for all users. Also, single-cell transcriptomics could further
improve the gene selection process and the reduction of gene expression markers needed to
maintain statistical power while further reducing the assay cost. ■
Product Quantity Cat. No.
TaqMan® hPSC Scorecard™ Panel, Fast 96-well 2 x 96-well plates A15876
TaqMan® hPSC Scorecard™ Kit, Fast 96-well 2 x 96-well plates A15871
TaqMan® hPSC Scorecard™ Panel, 384-well 1 x 384-well plate A15870
TaqMan® hPSC Scorecard™ Kit, 384-well 1 x 384-well plate A15872
Acknowledgments: This art icle was contr ibuted by Alexander M. Tsankov, who is a member of
the Meissner laboratory at the Broad Institute of MIT and Harvard, the Harvard Stem Cell Institute,
and the Department of Stem Cell and Regenerative Biology, Harvard University. Please address
correspondence to: [email protected].
18 | thermofisher.com/bioprobes © 2016 Thermo Fisher Scientific Inc. All rights reserved. For Research Use Only. Not for use in diagnostic procedures.
sTEM CELL rEsEArCH BIOPrOBEs 74
Light up neural differentiation pathwaysAntibodies for pluripotent stem cells and neural lineage cells.
Stem cells have tremendous potential for use in developmental biology
research, disease modeling, drug screening, and cell therapy for
neurodegenerative disorders, including Alzheimer’s and Parkinson’s
diseases. Stem cells are undifferentiated cells that have the capacity
both to self-renew through mitosis and to differentiate into specialized
cell types such as neuronal, liver, or muscle cells. Embryonic stem cells
(ESCs) and induced pluripotent stem cells (iPSCs) are pluripotent stem
cells (PSCs) that are commonly characterized by their expression of
the transcription factors Nanog, OCT4, and SOX2, and the cell-surface
proteins SSEA3, SSEA4, TRA-1-60, and TRA-1-81 (Figure 1). To verify
the functional pluripotency of PSCs, they must undergo further testing
to confirm their ability to differentiate into the three embryonic germ
layers: ectoderm, mesoderm, and endoderm (also see page 31).
Mammalian neurogenesis begins with the induction of neuro-
ectoderm, which forms the neural plate and then folds to give rise to the
neural tube. These structures are composed of a layer of neuroepithelial
progenitors (NEPs) that can be rapidly turned into primitive neural stem
cells (NSCs). NSCs are self-renewing, multipotent progenitors present
in the developing and adult mammalian central nervous system. During
neural differentiation, NSCs undergo progressive lineage restrictions
leading to glial progenitors (CD44+ A2B5+), which can become astro-
cytes (GFAP+) and oligodendrocytes (Galc+ O4+). The other branch
of lineage restriction is the neuronal path leading to various types of
neurons such as dopaminergic (DA) neurons (Figure 2). Table 1 provides
a list of common markers and the corresponding antibodies used to
characterize PSCs and NSCs (Figure 1) as well as downstream glial
and neuronal cells (Figure 2).
Find your stem cell antibodyThe characterization of stem cells is a critical step in stem cell research.
No matter which detection platform you use—flow cytometry, immuno-
cytochemistry, western blot, ELISA, or another—our collection of over
51,000 Invitrogen™ antibodies provides you with tools compatible with
your experimental design. Select the right antibodies for your stem cell
targets at thermofisher.com/antibodiesbp74. ■
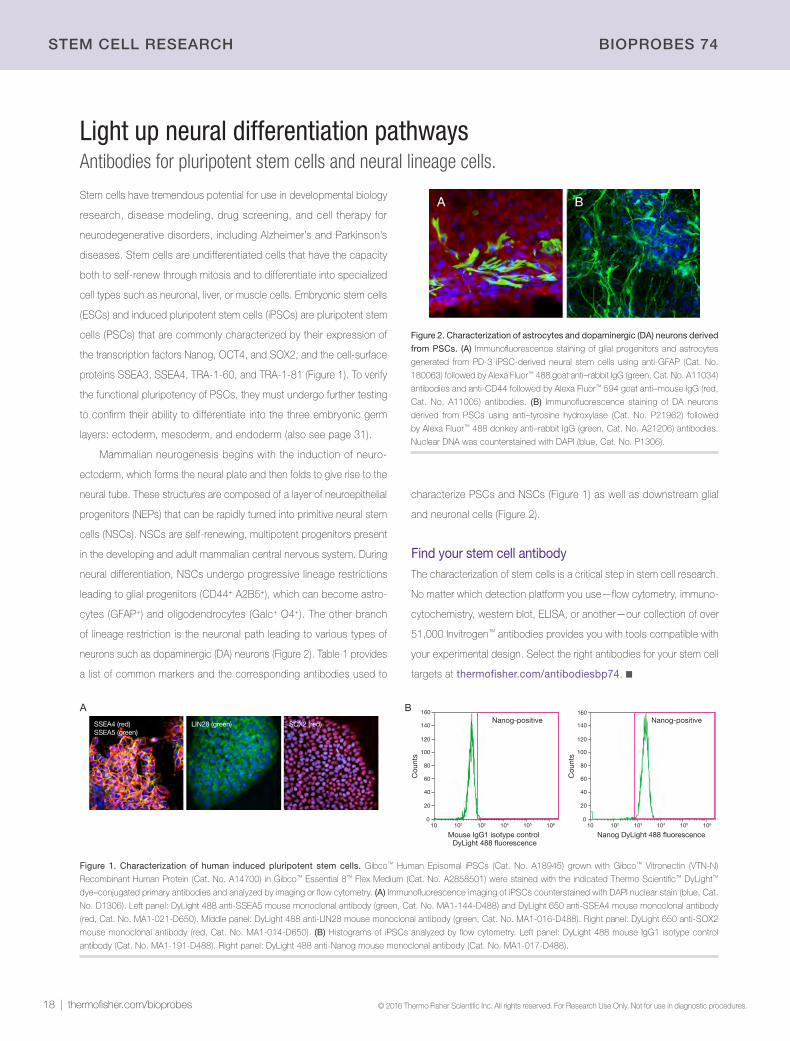
Figure 2. Characterization of astrocytes and dopaminergic (DA) neurons derived
from PSCs. (A) Immunofluorescence staining of glial progenitors and astrocytes
generated from PD-3 iPSC-derived neural stem cells using anti-GFAP (Cat. No.
180063) followed by Alexa Fluor™ 488 goat anti–rabbit IgG (green, Cat. No. A11034)
antibodies and anti-CD44 followed by Alexa Fluor™ 594 goat anti–mouse IgG (red,
Cat. No. A11005) antibodies. (B) Immunofluorescence staining of DA neurons
derived from PSCs using anti–tyrosine hydroxylase (Cat. No. P21962) followed
by Alexa Fluor™ 488 donkey anti–rabbit IgG (green, Cat. No. A21206) antibodies.
Nuclear DNA was counterstained with DAPI (blue, Cat. No. P1306).
Figure 1. Characterization of human induced pluripotent stem cells. Gibco™ Human Episomal iPSCs (Cat. No. A18945) grown with Gibco™ Vitronectin (VTN-N)
Recombinant Human Protein (Cat. No. A14700) in Gibco™ Essential 8™ Flex Medium (Cat. No. A2858501) were stained with the indicated Thermo Scientific™ DyLight™
dye–conjugated primary antibodies and analyzed by imaging or flow cytometry. (A) Immunofluorescence imaging of iPSCs counterstained with DAPI nuclear stain (blue, Cat.
No. D1306). Left panel: DyLight 488 anti-SSEA5 mouse monoclonal antibody (green, Cat. No. MA1-144-D488) and DyLight 650 anti-SSEA4 mouse monoclonal antibody
(red, Cat. No. MA1-021-D650). Middle panel: DyLight 488 anti-LIN28 mouse monoclonal antibody (green, Cat. No. MA1-016-D488). Right panel: DyLight 650 anti-SOX2
mouse monoclonal antibody (red, Cat. No. MA1-014-D650). (B) Histograms of iPSCs analyzed by flow cytometry. Left panel: DyLight 488 mouse IgG1 isotype control
antibody (Cat. No. MA1-191-D488). Right panel: DyLight 488 anti-Nanog mouse monoclonal antibody (Cat. No. MA1-017-D488).
100
20
40
100
160
102 103 104 106105
Mouse IgG1 isotype control DyLight 488 �uorescence
Cou
nts
140
60
80
120
100
20
40
100
160
102 103 104 106105
Nanog DyLight 488 �uorescence
Cou
nts
140
60
80
120
BNanog-positive Nanog-positiveSSEA4 (red)
SSEA5 (green)LIN28 (green) SOX2 (red)
A
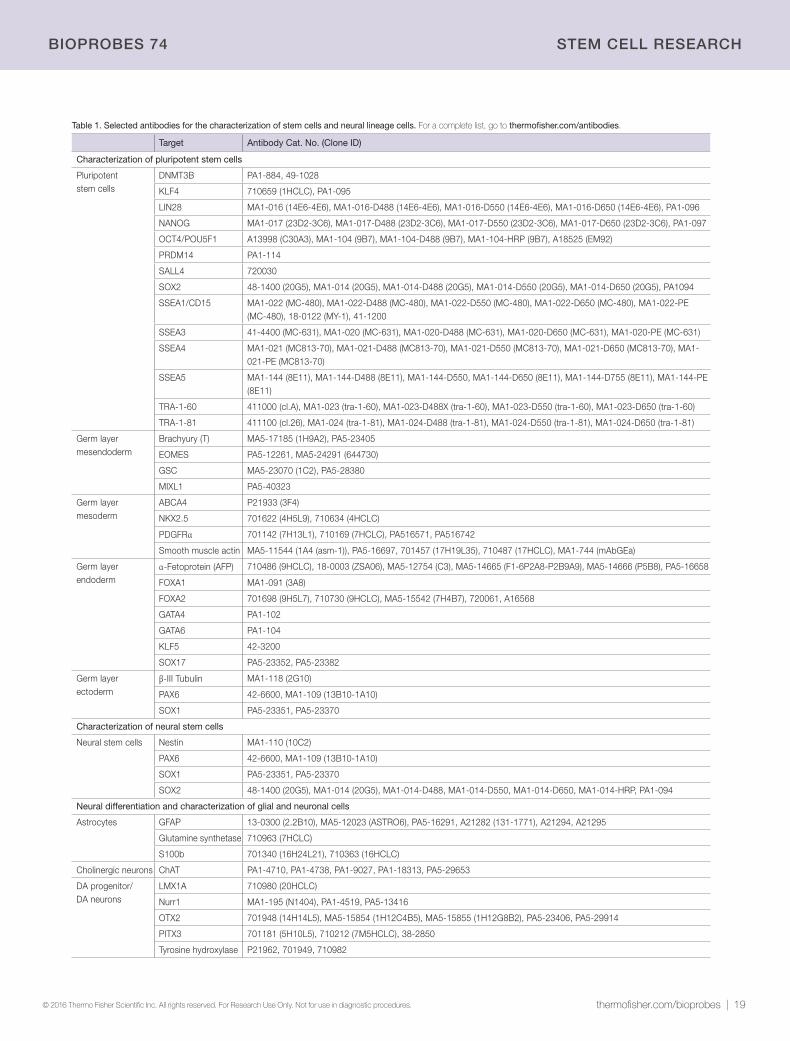
thermofisher.com/bioprobes | 19 © 2016 Thermo Fisher Scientific Inc. All rights reserved. For Research Use Only. Not for use in diagnostic procedures.
BIOPrOBEs 74 sTEM CELL rEsEArCH
Table 1. Selected antibodies for the characterization of stem cells and neural lineage cells. For a complete list, go to thermofisher.com/antibodies.
Target Antibody Cat. No. (Clone ID)
Characterization of pluripotent stem cells
Pluripotent stem cells
DNMT3B PA1-884, 49-1028
KLF4 710659 (1HCLC), PA1-095
LIN28 MA1-016 (14E6-4E6), MA1-016-D488 (14E6-4E6), MA1-016-D550 (14E6-4E6), MA1-016-D650 (14E6-4E6), PA1-096
NANOG MA1-017 (23D2-3C6), MA1-017-D488 (23D2-3C6), MA1-017-D550 (23D2-3C6), MA1-017-D650 (23D2-3C6), PA1-097
OCT4/POU5F1 A13998 (C30A3), MA1-104 (9B7), MA1-104-D488 (9B7), MA1-104-HRP (9B7), A18525 (EM92)
PRDM14 PA1-114
SALL4 720030
SOX2 48-1400 (20G5), MA1-014 (20G5), MA1-014-D488 (20G5), MA1-014-D550 (20G5), MA1-014-D650 (20G5), PA1094
SSEA1/CD15 MA1-022 (MC-480), MA1-022-D488 (MC-480), MA1-022-D550 (MC-480), MA1-022-D650 (MC-480), MA1-022-PE (MC-480), 18-0122 (MY-1), 41-1200
SSEA3 41-4400 (MC-631), MA1-020 (MC-631), MA1-020-D488 (MC-631), MA1-020-D650 (MC-631), MA1-020-PE (MC-631)
SSEA4 MA1-021 (MC813-70), MA1-021-D488 (MC813-70), MA1-021-D550 (MC813-70), MA1-021-D650 (MC813-70), MA1-021-PE (MC813-70)
SSEA5 MA1-144 (8E11), MA1-144-D488 (8E11), MA1-144-D550, MA1-144-D650 (8E11), MA1-144-D755 (8E11), MA1-144-PE (8E11)
TRA-1-60 411000 (cl.A), MA1-023 (tra-1-60), MA1-023-D488X (tra-1-60), MA1-023-D550 (tra-1-60), MA1-023-D650 (tra-1-60)
TRA-1-81 411100 (cl.26), MA1-024 (tra-1-81), MA1-024-D488 (tra-1-81), MA1-024-D550 (tra-1-81), MA1-024-D650 (tra-1-81)
Germ layer mesendoderm
Brachyury (T) MA5-17185 (1H9A2), PA5-23405
EOMES PA5-12261, MA5-24291 (644730)
GSC MA5-23070 (1C2), PA5-28380
MIXL1 PA5-40323
Germ layer mesoderm
ABCA4 P21933 (3F4)
NKX2.5 701622 (4H5L9), 710634 (4HCLC)
PDGFRα 701142 (7H13L1), 710169 (7HCLC), PA516571, PA516742
Smooth muscle actin MA5-11544 (1A4 (asm-1)), PA5-16697, 701457 (17H19L35), 710487 (17HCLC), MA1-744 (mAbGEa)
Germ layer endoderm
α-Fetoprotein (AFP) 710486 (9HCLC), 18-0003 (ZSA06), MA5-12754 (C3), MA5-14665 (F1-6P2A8-P2B9A9), MA5-14666 (P5B8), PA5-16658
FOXA1 MA1-091 (3A8)
FOXA2 701698 (9H5L7), 710730 (9HCLC), MA5-15542 (7H4B7), 720061, A16568
GATA4 PA1-102
GATA6 PA1-104
KLF5 42-3200
SOX17 PA5-23352, PA5-23382
Germ layer ectoderm
β-III Tubulin MA1-118 (2G10)
PAX6 42-6600, MA1-109 (13B10-1A10)
SOX1 PA5-23351, PA5-23370
Characterization of neural stem cells
Neural stem cells Nestin MA1-110 (10C2)
PAX6 42-6600, MA1-109 (13B10-1A10)
SOX1 PA5-23351, PA5-23370
SOX2 48-1400 (20G5), MA1-014 (20G5), MA1-014-D488, MA1-014-D550, MA1-014-D650, MA1-014-HRP, PA1-094
Neural differentiation and characterization of glial and neuronal cells
Astrocytes GFAP 13-0300 (2.2B10), MA5-12023 (ASTRO6), PA5-16291, A21282 (131-1771), A21294, A21295
Glutamine synthetase 710963 (7HCLC)
S100b 701340 (16H24L21), 710363 (16HCLC)
Cholinergic neurons ChAT PA1-4710, PA1-4738, PA1-9027, PA1-18313, PA5-29653
DA progenitor/ DA neurons
LMX1A 710980 (20HCLC)
Nurr1 MA1-195 (N1404), PA1-4519, PA5-13416
OTX2 701948 (14H14L5), MA5-15854 (1H12C4B5), MA5-15855 (1H12G8B2), PA5-23406, PA5-29914
PITX3 701181 (5H10L5), 710212 (7M5HCLC), 38-2850
Tyrosine hydroxylase P21962, 701949, 710982
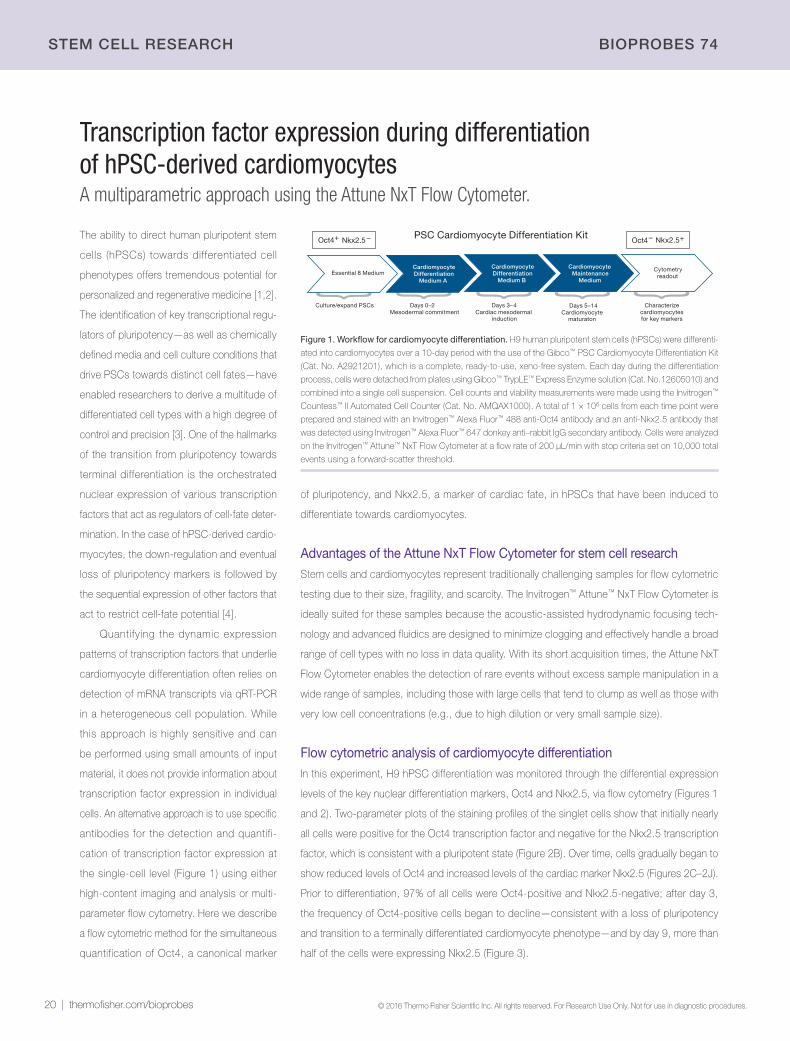
20 | thermofisher.com/bioprobes © 2016 Thermo Fisher Scientific Inc. All rights reserved. For Research Use Only. Not for use in diagnostic procedures.
sTEM CELL rEsEArCH BIOPrOBEs 74
Transcription factor expression during differentiation of hPSC-derived cardiomyocytesA multiparametric approach using the Attune NxT Flow Cytometer.
The ability to direct human pluripotent stem
cells (hPSCs) towards differentiated cell
phenotypes offers tremendous potential for
personalized and regenerative medicine [1,2].
The identification of key transcriptional regu-
lators of pluripotency—as well as chemically
defined media and cell culture conditions that
drive PSCs towards distinct cell fates—have
enabled researchers to derive a multitude of
differentiated cell types with a high degree of
control and precision [3]. One of the hallmarks
of the transition from pluripotency towards
terminal differentiation is the orchestrated
nuclear expression of various transcription
factors that act as regulators of cell-fate deter-
mination. In the case of hPSC-derived cardio-
myocytes, the down-regulation and eventual
loss of pluripotency markers is followed by
the sequential expression of other factors that
act to restrict cell-fate potential [4].
Quantifying the dynamic expression
patterns of transcription factors that underlie
cardiomyocyte differentiation often relies on
detection of mRNA transcripts via qRT-PCR
in a heterogeneous cell population. While
this approach is highly sensitive and can
be performed using small amounts of input
material, it does not provide information about
transcription factor expression in individual
cells. An alternative approach is to use specific
antibodies for the detection and quantifi-
cation of transcription factor expression at
the single-cell level (Figure 1) using either
high-content imaging and analysis or multi-
parameter flow cytometry. Here we describe
a flow cytometric method for the simultaneous
quantification of Oct4, a canonical marker
of pluripotency, and Nkx2.5, a marker of cardiac fate, in hPSCs that have been induced to
differentiate towards cardiomyocytes.
Advantages of the Attune NxT Flow Cytometer for stem cell researchStem cells and cardiomyocytes represent traditionally challenging samples for flow cytometric
testing due to their size, fragility, and scarcity. The Invitrogen™ Attune™ NxT Flow Cytometer is
ideally suited for these samples because the acoustic-assisted hydrodynamic focusing tech-
nology and advanced fluidics are designed to minimize clogging and effectively handle a broad
range of cell types with no loss in data quality. With its short acquisition times, the Attune NxT
Flow Cytometer enables the detection of rare events without excess sample manipulation in a
wide range of samples, including those with large cells that tend to clump as well as those with
very low cell concentrations (e.g., due to high dilution or very small sample size).
Flow cytometric analysis of cardiomyocyte differentiationIn this experiment, H9 hPSC differentiation was monitored through the differential expression
levels of the key nuclear differentiation markers, Oct4 and Nkx2.5, via flow cytometry (Figures 1
and 2). Two-parameter plots of the staining profiles of the singlet cells show that initially nearly
all cells were positive for the Oct4 transcription factor and negative for the Nkx2.5 transcription
factor, which is consistent with a pluripotent state (Figure 2B). Over time, cells gradually began to
show reduced levels of Oct4 and increased levels of the cardiac marker Nkx2.5 (Figures 2C–2J).
Prior to differentiation, 97% of all cells were Oct4-positive and Nkx2.5-negative; after day 3,
the frequency of Oct4-positive cells began to decline—consistent with a loss of pluripotency
and transition to a terminally differentiated cardiomyocyte phenotype—and by day 9, more than
half of the cells were expressing Nkx2.5 (Figure 3).
Figure 1. Workflow for cardiomyocyte differentiation. H9 human pluripotent stem cells (hPSCs) were differenti-
ated into cardiomyocytes over a 10-day period with the use of the Gibco™ PSC Cardiomyocyte Differentiation Kit
(Cat. No. A2921201), which is a complete, ready-to-use, xeno-free system. Each day during the differentiation
process, cells were detached from plates using Gibco™ TrypLE™ Express Enzyme solution (Cat. No.12605010) and
combined into a single cell suspension. Cell counts and viability measurements were made using the Invitrogen™
Countess™ II Automated Cell Counter (Cat. No. AMQAX1000). A total of 1 × 10⁶ cells from each time point were
prepared and stained with an Invitrogen™ Alexa Fluor™ 488 anti-Oct4 antibody and an anti-Nkx2.5 antibody that
was detected using Invitrogen™ Alexa Fluor™ 647 donkey anti–rabbit IgG secondary antibody. Cells were analyzed
on the Invitrogen™ Attune™ NxT Flow Cytometer at a flow rate of 200 µL/min with stop criteria set on 10,000 total
events using a forward-scatter threshold.
Culture/expand PSCs Days 0–2Mesodermal commitment
Days 3–4Cardiac mesodermal
induction
Characterize cardiomyocytesfor key markers
PSC Cardiomyocyte Differentiation KitOct4+ Nkx2.5
Essential 8 MediumCytometry
readout
Cardiomyocyte Differentiation
Medium A
Cardiomyocyte Differentiation
Medium B
Cardiomyocyte Maintenance
Medium
+
Days 5–14Cardiomyocyte
maturaton
Nkx2.5 Oct4––
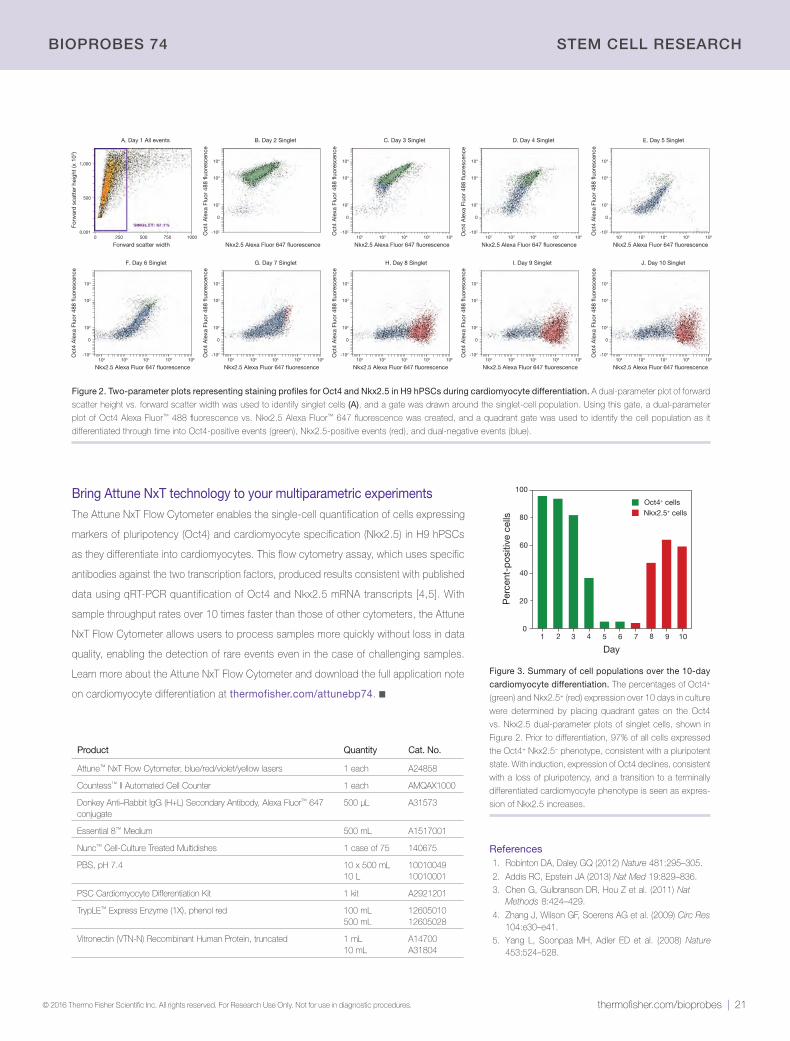
thermofisher.com/bioprobes | 21 © 2016 Thermo Fisher Scientific Inc. All rights reserved. For Research Use Only. Not for use in diagnostic procedures.
BIOPrOBEs 74 sTEM CELL rEsEArCH
References1. Robinton DA, Daley GQ (2012) Nature 481:295–305.
2. Addis RC, Epstein JA (2013) Nat Med 19:829–836.3. Chen G, Gulbranson DR, Hou Z et al. (2011) Nat
Methods 8:424–429.
4. Zhang J, Wilson GF, Soerens AG et al. (2009) Circ Res 104:e30–e41.
5. Yang L, Soonpaa MH, Adler ED et al. (2008) Nature 453:524–528.
Product Quantity Cat. No.
Attune™ NxT Flow Cytometer, blue/red/violet/yellow lasers 1 each A24858
Countess™ II Automated Cell Counter 1 each AMQAX1000
Donkey Anti–Rabbit IgG (H+L) Secondary Antibody, Alexa Fluor™ 647 conjugate
500 µL A31573
Essential 8™ Medium 500 mL A1517001
Nunc™ Cell-Culture Treated Multidishes 1 case of 75 140675
PBS, pH 7.4 10 x 500 mL10 L
1001004910010001
PSC Cardiomyocyte Differentiation Kit 1 kit A2921201
TrypLE™ Express Enzyme (1X), phenol red 100 mL500 mL
1260501012605028
Vitronectin (VTN-N) Recombinant Human Protein, truncated 1 mL10 mL
A14700A31804
Figure 2. Two-parameter plots representing staining profiles for Oct4 and Nkx2.5 in H9 hPSCs during cardiomyocyte differentiation. A dual-parameter plot of forward
scatter height vs. forward scatter width was used to identify singlet cells (A), and a gate was drawn around the singlet-cell population. Using this gate, a dual-parameter
plot of Oct4 Alexa Fluor™ 488 fluorescence vs. Nkx2.5 Alexa Fluor™ 647 fluorescence was created, and a quadrant gate was used to identify the cell population as it
differentiated through time into Oct4-positive events (green), Nkx2.5-positive events (red), and dual-negative events (blue).
Figure 3. Summary of cell populations over the 10-day
cardiomyocyte differentiation. The percentages of Oct4+
(green) and Nkx2.5+ (red) expression over 10 days in culture
were determined by placing quadrant gates on the Oct4
vs. Nkx2.5 dual-parameter plots of singlet cells, shown in
Figure 2. Prior to differentiation, 97% of all cells expressed
the Oct4+ Nkx2.5– phenotype, consistent with a pluripotent
state. With induction, expression of Oct4 declines, consistent
with a loss of pluripotency, and a transition to a terminally
differentiated cardiomyocyte phenotype is seen as expres-
sion of Nkx2.5 increases.
Bring Attune NxT technology to your multiparametric experimentsThe Attune NxT Flow Cytometer enables the single-cell quantification of cells expressing
markers of pluripotency (Oct4) and cardiomyocyte specification (Nkx2.5) in H9 hPSCs
as they differentiate into cardiomyocytes. This flow cytometry assay, which uses specific
antibodies against the two transcription factors, produced results consistent with published
data using qRT-PCR quantification of Oct4 and Nkx2.5 mRNA transcripts [4,5]. With
sample throughput rates over 10 times faster than those of other cytometers, the Attune
NxT Flow Cytometer allows users to process samples more quickly without loss in data
quality, enabling the detection of rare events even in the case of challenging samples.
Learn more about the Attune NxT Flow Cytometer and download the full application note
on cardiomyocyte differentiation at thermofisher.com/attunebp74. ■
Forw
ard
sca
tter
hei
ght
(x 1
03 )
250 500 750 10000
Forward scatter width
A. Day 1 All events B. Day 2 Singlet
Oct
4 A
lexa
Flu
or 4
88 �
uore
scen
ce
103 104102
1,000
0.001
500
Nkx2.5 Alexa Fluor 647 �uorescence Nkx2.5 Alexa Fluor 647 �uorescence
C. Day 3 Singlet
104
103
102
0
-102
104
103
102
0
-102
Oct
4 A
lexa
Flu
or 4
88 �
uore
scen
ce
105 106 103 104102
Nkx2.5 Alexa Fluor 647 �uorescence
E. Day 5 Singlet
104
103
102
0
-102
Oct
4 A
lexa
Flu
or 4
88 �
uore
scen
ce
105 106
103 104102
Nkx2.5 Alexa Fluor 647 �uorescence
J. Day 10 Singlet
104
103
102
0
-102Oct
4 A
lexa
Flu
or 4
88 �
uore
scen
ce
105 106103 104102
Nkx2.5 Alexa Fluor 647 �uorescence
H. Day 8 Singlet
104
103
102
0
-102Oct
4 A
lexa
Flu
or 4
88 �
uore
scen
ce
105 106103 104102
Nkx2.5 Alexa Fluor 647 �uorescence
G. Day 7 Singlet
104
103
102
0
-102Oct
4 A
lexa
Flu
or 4
88 �
uore
scen
ce
105 106103 104102
Nkx2.5 Alexa Fluor 647 �uorescence
F. Day 6 Singlet
104
103
102
0
-102Oct
4 A
lexa
Flu
or 4
88 �
uore
scen
ce
105 106
103 104102
Nkx2.5 Alexa Fluor 647 �uorescence
D. Day 4 Singlet
104
103
102
0
-102
Oct
4 A
lexa
Flu
or 4
88 �
uore
scen
ce
105 106
103 104102
Nkx2.5 Alexa Fluor 647 �uorescence
I. Day 9 Singlet
104
103
102
0
-102Oct
4 A
lexa
Flu
or 4
88 �
uore
scen
ce
105 106
Oct4+ cellsP
erce
nt-p
ositi
ve c
ells Nkx2.5+ cells
20
0
40
60
80
100
1 2 3 4 5 6 7 8 9 10
Day
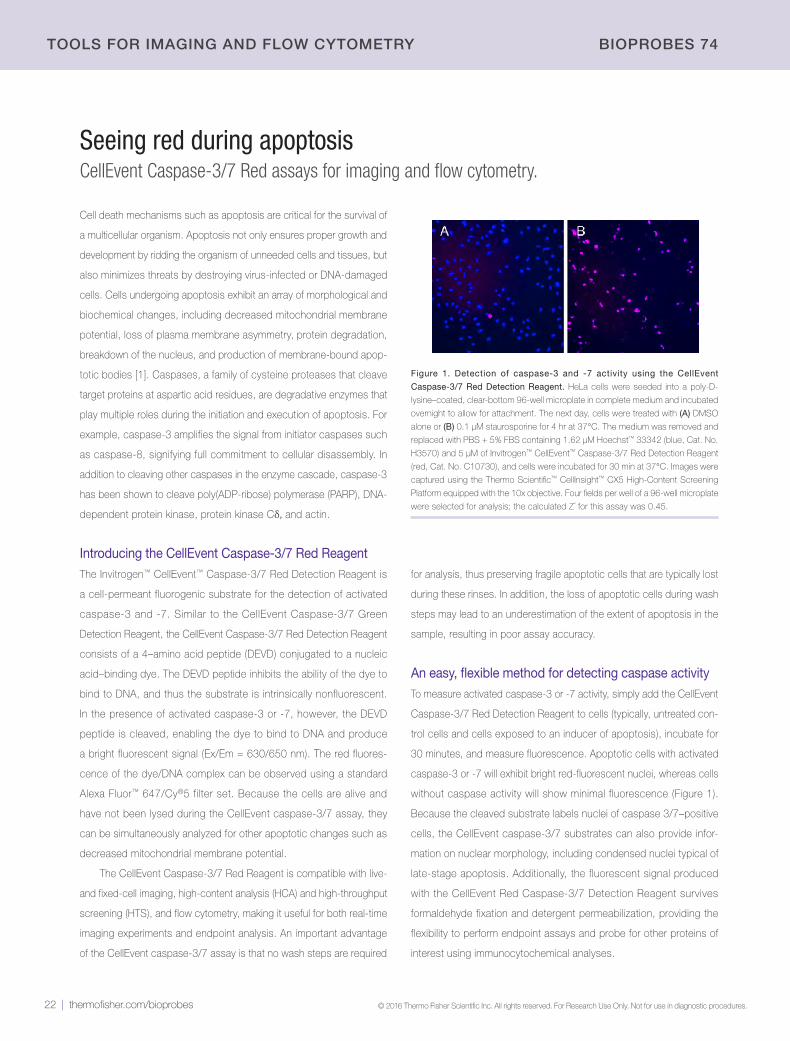
22 | thermofisher.com/bioprobes © 2016 Thermo Fisher Scientific Inc. All rights reserved. For Research Use Only. Not for use in diagnostic procedures.
TOOLs FOr IMAGING AND FLOW CYTOMETrY BIOPrOBEs 74
Seeing red during apoptosisCellEvent Caspase-3/7 Red assays for imaging and flow cytometry.
Cell death mechanisms such as apoptosis are critical for the survival of
a multicellular organism. Apoptosis not only ensures proper growth and
development by ridding the organism of unneeded cells and tissues, but
also minimizes threats by destroying virus-infected or DNA-damaged
cells. Cells undergoing apoptosis exhibit an array of morphological and
biochemical changes, including decreased mitochondrial membrane
potential, loss of plasma membrane asymmetry, protein degradation,
breakdown of the nucleus, and production of membrane-bound apop-
totic bodies [1]. Caspases, a family of cysteine proteases that cleave
target proteins at aspartic acid residues, are degradative enzymes that
play multiple roles during the initiation and execution of apoptosis. For
example, caspase-3 amplifies the signal from initiator caspases such
as caspase-8, signifying full commitment to cellular disassembly. In
addition to cleaving other caspases in the enzyme cascade, caspase-3
has been shown to cleave poly(ADP-ribose) polymerase (PARP), DNA-
dependent protein kinase, protein kinase Cδ, and actin.
Introducing the CellEvent Caspase-3/7 Red ReagentThe Invitrogen™ CellEvent™ Caspase-3/7 Red Detection Reagent is
a cell-permeant fluorogenic substrate for the detection of activated
caspase-3 and -7. Similar to the CellEvent Caspase-3/7 Green
Detection Reagent, the CellEvent Caspase-3/7 Red Detection Reagent
consists of a 4–amino acid peptide (DEVD) conjugated to a nucleic
acid–binding dye. The DEVD peptide inhibits the ability of the dye to
bind to DNA, and thus the substrate is intrinsically nonfluorescent.
In the presence of activated caspase-3 or -7, however, the DEVD
peptide is cleaved, enabling the dye to bind to DNA and produce
a bright fluorescent signal (Ex/Em = 630/650 nm). The red fluores-
cence of the dye/DNA complex can be observed using a standard
Alexa Fluor™ 647/Cy®5 filter set. Because the cells are alive and
have not been lysed during the CellEvent caspase-3/7 assay, they
can be simultaneously analyzed for other apoptotic changes such as
decreased mitochondrial membrane potential.
The CellEvent Caspase-3/7 Red Reagent is compatible with live-
and fixed-cell imaging, high-content analysis (HCA) and high-throughput
screening (HTS), and flow cytometry, making it useful for both real-time
imaging experiments and endpoint analysis. An important advantage
of the CellEvent caspase-3/7 assay is that no wash steps are required
for analysis, thus preserving fragile apoptotic cells that are typically lost
during these rinses. In addition, the loss of apoptotic cells during wash
steps may lead to an underestimation of the extent of apoptosis in the
sample, resulting in poor assay accuracy.
An easy, flexible method for detecting caspase activityTo measure activated caspase-3 or -7 activity, simply add the CellEvent
Caspase-3/7 Red Detection Reagent to cells (typically, untreated con-
trol cells and cells exposed to an inducer of apoptosis), incubate for
30 minutes, and measure fluorescence. Apoptotic cells with activated
caspase-3 or -7 will exhibit bright red-fluorescent nuclei, whereas cells
without caspase activity will show minimal fluorescence (Figure 1).
Because the cleaved substrate labels nuclei of caspase 3/7–positive
cells, the CellEvent caspase-3/7 substrates can also provide infor-
mation on nuclear morphology, including condensed nuclei typical of
late-stage apoptosis. Additionally, the fluorescent signal produced
with the CellEvent Red Caspase-3/7 Detection Reagent survives
formaldehyde fixation and detergent permeabilization, providing the
flexibility to perform endpoint assays and probe for other proteins of
interest using immunocytochemical analyses.
Figure 1. Detection of caspase-3 and -7 activity using the CellEvent
Caspase-3/7 Red Detection Reagent. HeLa cells were seeded into a poly-D-
lysine–coated, clear-bottom 96-well microplate in complete medium and incubated
overnight to allow for attachment. The next day, cells were treated with (A) DMSO
alone or (B) 0.1 µM staurosporine for 4 hr at 37°C. The medium was removed and
replaced with PBS + 5% FBS containing 1.62 µM Hoechst™ 33342 (blue, Cat. No.
H3570) and 5 µM of Invitrogen™ CellEvent™ Caspase-3/7 Red Detection Reagent
(red, Cat. No. C10730), and cells were incubated for 30 min at 37°C. Images were
captured using the Thermo Scientific™ CellInsight™ CX5 High-Content Screening
Platform equipped with the 10x objective. Four fields per well of a 96-well microplate
were selected for analysis; the calculated Z´ for this assay was 0.45.
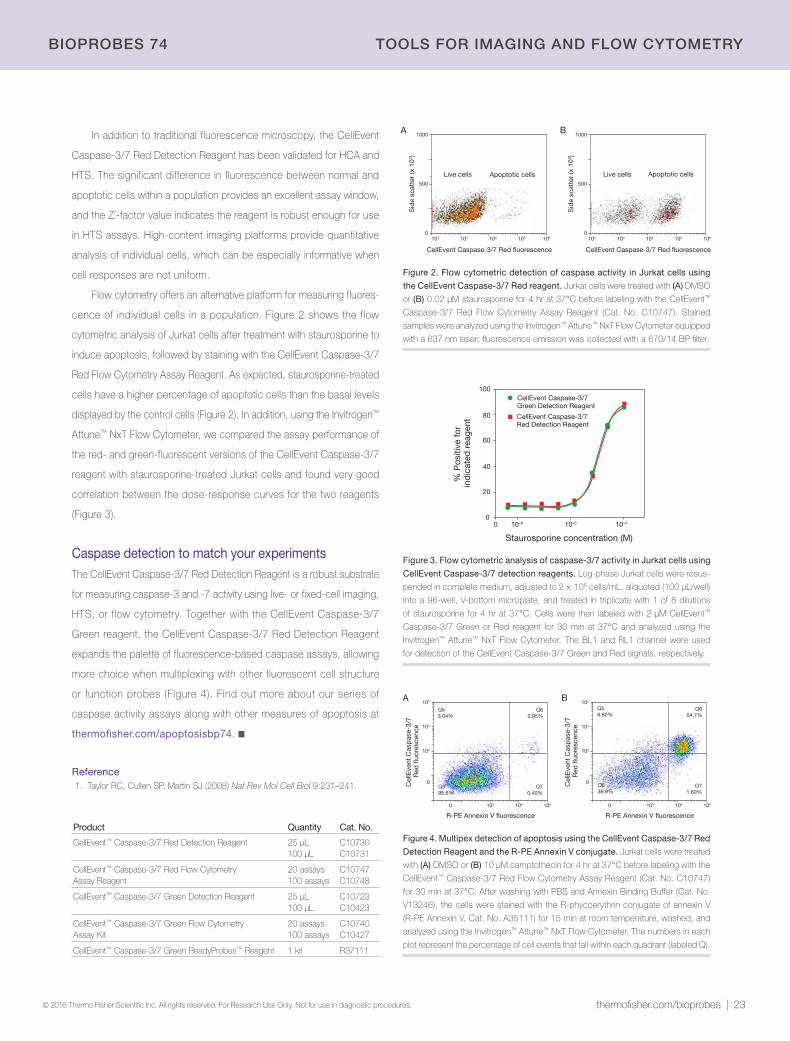
thermofisher.com/bioprobes | 23 © 2016 Thermo Fisher Scientific Inc. All rights reserved. For Research Use Only. Not for use in diagnostic procedures.
BIOPrOBEs 74 TOOLs FOr IMAGING AND FLOW CYTOMETrY
Reference1. Taylor RC, Cullen SP, Martin SJ (2008) Nat Rev Mol Cell Biol 9:231–241.
In addition to traditional fluorescence microscopy, the CellEvent
Caspase-3/7 Red Detection Reagent has been validated for HCA and
HTS. The significant difference in fluorescence between normal and
apoptotic cells within a population provides an excellent assay window,
and the Z´-factor value indicates the reagent is robust enough for use
in HTS assays. High-content imaging platforms provide quantitative
analysis of individual cells, which can be especially informative when
cell responses are not uniform.
Flow cytometry offers an alternative platform for measuring fluores -
cence of individual cells in a population. Figure 2 shows the flow
cytometric analysis of Jurkat cells after treatment with staurosporine to
induce apoptosis, followed by staining with the CellEvent Caspase-3/7
Red Flow Cytometry Assay Reagent. As expected, staurosporine-treated
cells have a higher percentage of apoptotic cells than the basal levels
displayed by the control cells (Figure 2). In addition, using the Invitrogen™
Attune™ NxT Flow Cytometer, we compared the assay performance of
the red- and green-fluorescent versions of the CellEvent Caspase-3/7
reagent with staurosporine-treated Jurkat cells and found very good
correlation between the dose-response curves for the two reagents
(Figure 3).
Caspase detection to match your experimentsThe CellEvent Caspase-3/7 Red Detection Reagent is a robust substrate
for measuring caspase-3 and -7 activity using live- or fixed-cell imaging,
HTS, or flow cytometry. Together with the CellEvent Caspase-3/7
Green reagent, the CellEvent Caspase-3/7 Red Detection Reagent
expands the palette of fluorescence-based caspase assays, allowing
more choice when multiplexing with other fluorescent cell structure
or function probes (Figure 4). Find out more about our series of
caspase activity assays along with other measures of apoptosis at
thermofisher.com/apoptosisbp74. ■
Product Quantity Cat. No.
CellEvent™ Caspase-3/7 Red Detection Reagent 25 µL100 µL
C10730C10731
CellEvent™ Caspase-3/7 Red Flow Cytometry Assay Reagent
20 assays100 assays
C10747C10748
CellEvent™ Caspase-3/7 Green Detection Reagent 25 µL100 µL
C10723C10423
CellEvent™ Caspase-3/7 Green Flow Cytometry Assay Kit
20 assays100 assays
C10740C10427
CellEvent™ Caspase-3/7 Green ReadyProbes™ Reagent 1 kit R37111
Figure 2. Flow cytometric detection of caspase activity in Jurkat cells using
the CellEvent Caspase-3/7 Red reagent. Jurkat cells were treated with (A) DMSO
or (B) 0.02 µM staurosporine for 4 hr at 37°C before labeling with the CellEvent™
Caspase-3/7 Red Flow Cytometry Assay Reagent (Cat. No. C10747). Stained
samples were analyzed using the Invitrogen™ Attune™ NxT Flow Cytometer equipped
with a 637 nm laser; fluorescence emission was collected with a 670/14 BP filter.
Figure 3. Flow cytometric analysis of caspase-3/7 activity in Jurkat cells using
CellEvent Caspase-3/7 detection reagents. Log-phase Jurkat cells were resus-
pended in complete medium, adjusted to 2 × 10⁶ cells/mL, aliquoted (100 µL/well)
into a 96-well, V-bottom microplate, and treated in triplicate with 1 of 8 dilutions
of staurosporine for 4 hr at 37°C. Cells were then labeled with 2 µM CellEvent™
Caspase-3/7 Green or Red reagent for 30 min at 37°C and analyzed using the
Invitrogen™ Attune™ NxT Flow Cytometer. The BL1 and RL1 channel were used
for detection of the CellEvent Caspase-3/7 Green and Red signals, respectively.
Figure 4. Multipex detection of apoptosis using the CellEvent Caspase-3/7 Red
Detection Reagent and the R-PE Annexin V conjugate. Jurkat cells were treated
with (A) DMSO or (B) 10 µM camptothecin for 4 hr at 37°C before labeling with the
CellEvent™ Caspase-3/7 Red Flow Cytometry Assay Reagent (Cat. No. C10747)
for 30 min at 37°C. After washing with PBS and Annexin Binding Buffer (Cat. No.
V13246), the cells were stained with the R-phycoerythrin conjugate of annexin V
(R-PE Annexin V, Cat. No. A35111) for 15 min at room temperature, washed, and
analyzed using the Invitrogen™ Attune™ NxT Flow Cytometer. The numbers in each
plot represent the percentage of cell events that fall within each quadrant (labeled Q).
BA
Apoptotic cellsApoptotic cells Live cellsLive cells
CellEvent Caspase-3/7 Red �uorescence
Sid
e sc
atte
r (x
103 )
102 103 104 105 1060
500
1000
CellEvent Caspase-3/7 Red �uorescence
Sid
e sc
atte
r (x
103 )
102 103 104 105 1060
500
1000
Staurosporine concentration (M)
0 10–410–510–6
% P
ositi
ve fo
r in
dic
ated
rea
gent
20
40
60
80
100
0
CellEvent Caspase-3/7 Red Detection Reagent
CellEvent Caspase-3/7 Green Detection Reagent
BA
R-PE Annexin V �uorescence
Cel
lEve
nt C
asp
ase-
3/7
Red
�uo
resc
ence
0 103 104 105
0
103
104
105
R-PE Annexin V �uorescence
Cel
lEve
nt C
asp
ase-
3/7
Red
�uo
resc
ence
0 103 104 105
0
103
104
105
Q53.04%
Q60.95%
Q70.40%
Q895.6%
Q56.80%
Q836.9%
Q654.7%
Q71.60%
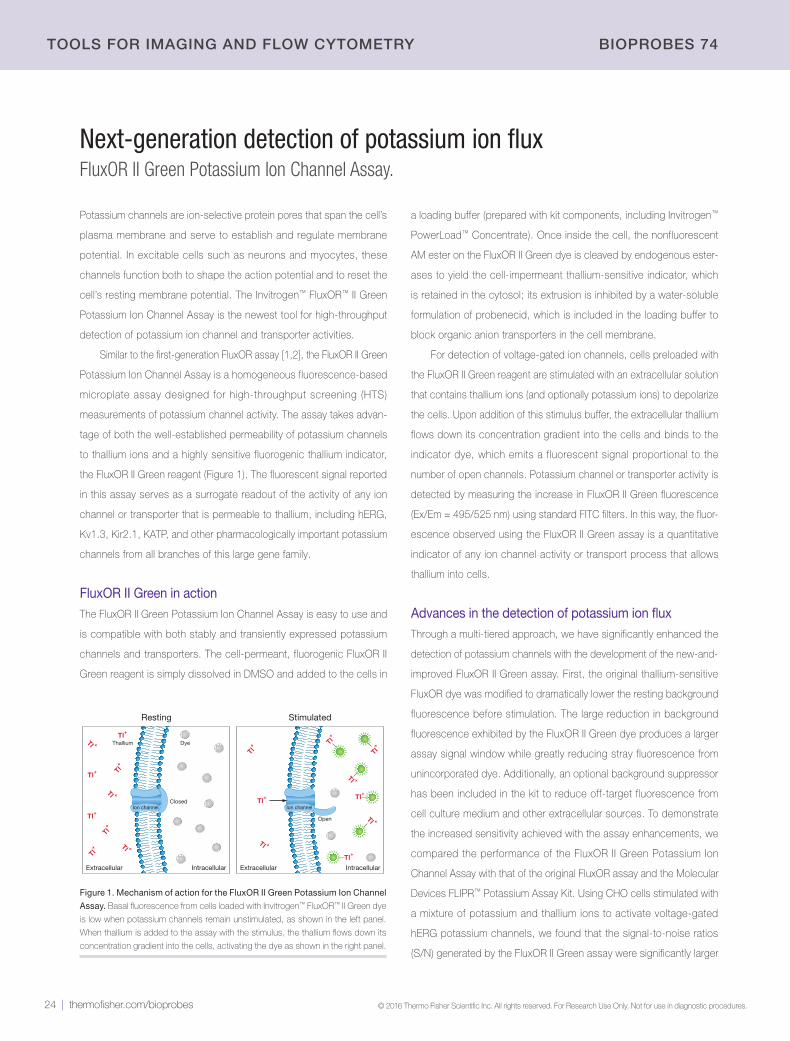
24 | thermofisher.com/bioprobes © 2016 Thermo Fisher Scientific Inc. All rights reserved. For Research Use Only. Not for use in diagnostic procedures.
TOOLs FOr IMAGING AND FLOW CYTOMETrY BIOPrOBEs 74
Next-generation detection of potassium ion fluxFluxOR II Green Potassium Ion Channel Assay.
Potassium channels are ion-selective protein pores that span the cell’s
plasma membrane and serve to establish and regulate membrane
potential. In excitable cells such as neurons and myocytes, these
channels function both to shape the action potential and to reset the
cell’s resting membrane potential. The Invitrogen™ FluxOR™ II Green
Potassium Ion Channel Assay is the newest tool for high-throughput
detection of potassium ion channel and transporter activities.
Similar to the first-generation FluxOR assay [1,2], the FluxOR II Green
Potassium Ion Channel Assay is a homogeneous fluorescence-based
microplate assay designed for high-throughput screening (HTS)
measurements of potassium channel activity. The assay takes advan-
tage of both the well-established permeability of potassium channels
to thallium ions and a highly sensitive fluorogenic thallium indicator,
the FluxOR II Green reagent (Figure 1). The fluorescent signal reported
in this assay serves as a surrogate readout of the activity of any ion
channel or transporter that is permeable to thallium, including hERG,
Kv1.3, Kir2.1, KATP, and other pharmacologically important potassium
channels from all branches of this large gene family.
FluxOR II Green in actionThe FluxOR II Green Potassium Ion Channel Assay is easy to use and
is compatible with both stably and transiently expressed potassium
channels and transporters. The cell-permeant, fluorogenic FluxOR II
Green reagent is simply dissolved in DMSO and added to the cells in
a loading buffer (prepared with kit components, including Invitrogen™
PowerLoad™ Concentrate). Once inside the cell, the nonfluorescent
AM ester on the FluxOR II Green dye is cleaved by endogenous ester-
ases to yield the cell-impermeant thallium-sensitive indicator, which
is retained in the cytosol; its extrusion is inhibited by a water-soluble
formulation of probenecid, which is included in the loading buffer to
block organic anion transporters in the cell membrane.
For detection of voltage-gated ion channels, cells preloaded with
the FluxOR II Green reagent are stimulated with an extracellular solution
that contains thallium ions (and optionally potassium ions) to depolarize
the cells. Upon addition of this stimulus buffer, the extracellular thallium
flows down its concentration gradient into the cells and binds to the
indicator dye, which emits a fluorescent signal proportional to the
number of open channels. Potassium channel or transporter activity is
detected by measuring the increase in FluxOR II Green fluorescence
(Ex/Em = 495/525 nm) using standard FITC filters. In this way, the fluor-
escence observed using the FluxOR II Green assay is a quantitative
indicator of any ion channel activity or transport process that allows
thallium into cells.
Advances in the detection of potassium ion flux Through a multi-tiered approach, we have significantly enhanced the
detection of potassium channels with the development of the new-and-
improved FluxOR II Green assay. First, the original thallium-sensitive
FluxOR dye was modified to dramatically lower the resting background
fluorescence before stimulation. The large reduction in background
fluorescence exhibited by the FluxOR II Green dye produces a larger
assay signal window while greatly reducing stray fluorescence from
unincorporated dye. Additionally, an optional background suppressor
has been included in the kit to reduce off-target fluorescence from
cell culture medium and other extracellular sources. To demonstrate
the increased sensitivity achieved with the assay enhancements, we
compared the performance of the FluxOR II Green Potassium Ion
Channel Assay with that of the original FluxOR assay and the Molecular
Devices FLIPR™ Potassium Assay Kit. Using CHO cells stimulated with
a mixture of potassium and thallium ions to activate voltage-gated
hERG potassium channels, we found that the signal-to-noise ratios
(S/N) generated by the FluxOR II Green assay were significantly larger
Ion channel Ion channel
Tl +
Tl+ Tl +
Tl+
Tl+
Tl+
Tl+
Tl+
Tl +
Closed
Open Tl +
Tl+
Tl+
Tl +
Tl+
StimulatedResting
Thallium Dye
Extracellular Intracellular Extracellular Intracellular
Tl +
Tl+
Tl+
Tl+
Figure 1. Mechanism of action for the FluxOR II Green Potassium Ion Channel
Assay. Basal fluorescence from cells loaded with Invitrogen™ FluxOR™ II Green dye
is low when potassium channels remain unstimulated, as shown in the left panel.
When thallium is added to the assay with the stimulus, the thallium flows down its
concentration gradient into the cells, activating the dye as shown in the right panel.
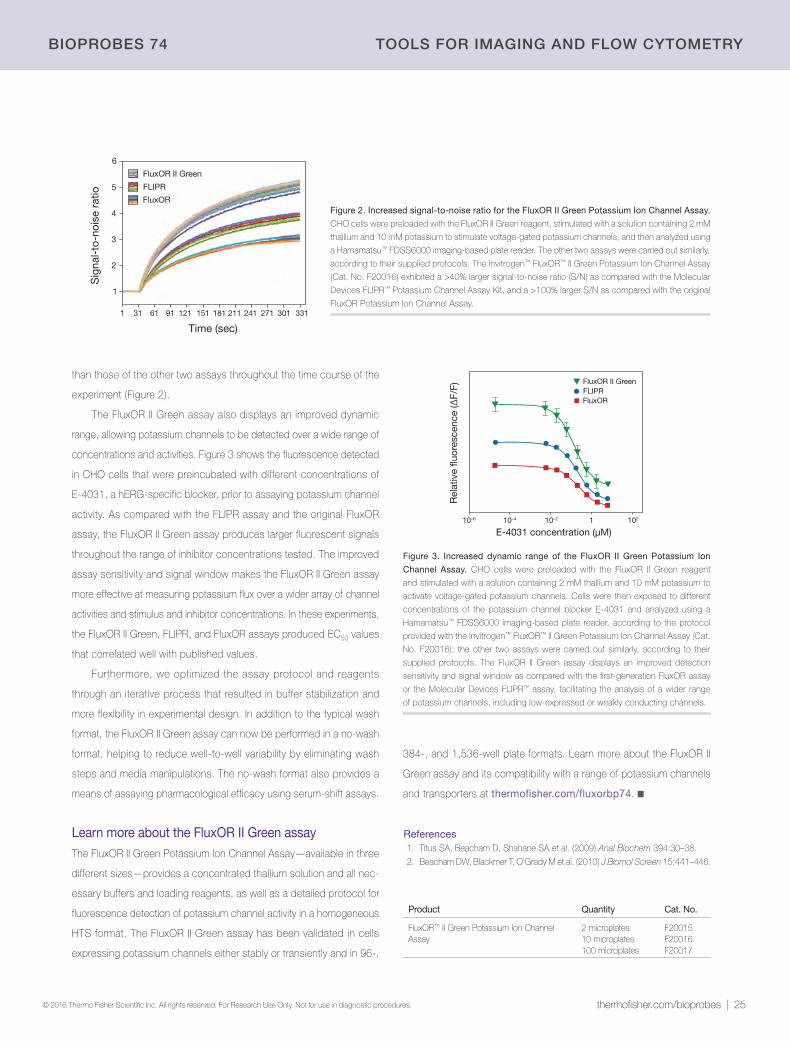
thermofisher.com/bioprobes | 25 © 2016 Thermo Fisher Scientific Inc. All rights reserved. For Research Use Only. Not for use in diagnostic procedures.
BIOPrOBEs 74 TOOLs FOr IMAGING AND FLOW CYTOMETrY
than those of the other two assays throughout the time course of the
experiment (Figure 2).
The FluxOR II Green assay also displays an improved dynamic
range, allowing potassium channels to be detected over a wide range of
concentrations and activities. Figure 3 shows the fluorescence detected
in CHO cells that were preincubated with different concentrations of
E-4031, a hERG-specific blocker, prior to assaying potassium channel
activity. As compared with the FLIPR assay and the original FluxOR
assay, the FluxOR II Green assay produces larger fluorescent signals
throughout the range of inhibitor concentrations tested. The improved
assay sensitivity and signal window makes the FluxOR II Green assay
more effective at measuring potassium flux over a wider array of channel
activities and stimulus and inhibitor concentrations. In these experiments,
the FluxOR II Green, FLIPR, and FluxOR assays produced EC50 values
that correlated well with published values.
Furthermore, we optimized the assay protocol and reagents
through an iterative process that resulted in buffer stabilization and
more flexibility in experimental design. In addition to the typical wash
format, the FluxOR II Green assay can now be performed in a no-wash
format, helping to reduce well-to-well variability by eliminating wash
steps and media manipulations. The no-wash format also provides a
means of assaying pharmacological efficacy using serum-shift assays.
Learn more about the FluxOR II Green assayThe FluxOR II Green Potassium Ion Channel Assay—available in three
different sizes—provides a concentrated thallium solution and all nec-
essary buffers and loading reagents, as well as a detailed protocol for
fluorescence detection of potassium channel activity in a homogeneous
HTS format. The FluxOR II Green assay has been validated in cells
expressing potassium channels either stably or transiently and in 96-,
References1. Titus SA, Beacham D, Shahane SA et al. (2009) Anal Biochem 394:30–38.
2. Beacham DW, Blackmer T, O’Grady M et al. (2010) J Biomol Screen 15:441–446.
Product Quantity Cat. No.
FluxOR™ II Green Potassium Ion Channel Assay
2 microplates10 microplates100 microplates
F20015F20016F20017
384-, and 1,536-well plate formats. Learn more about the FluxOR II
Green assay and its compatibility with a range of potassium channels
and transporters at thermofisher.com/fluxorbp74. ■
Figure 2. Increased signal-to-noise ratio for the FluxOR II Green Potassium Ion Channel Assay.
CHO cells were preloaded with the FluxOR II Green reagent, stimulated with a solution containing 2 mM
thallium and 10 mM potassium to stimulate voltage-gated potassium channels, and then analyzed using
a Hamamatsu™ FDSS6000 imaging-based plate reader. The other two assays were carried out similarly,
according to their supplied protocols. The Invitrogen™ FluxOR™ II Green Potassium Ion Channel Assay
(Cat. No. F20016) exhibited a >40% larger signal-to-noise ratio (S/N) as compared with the Molecular
Devices FLIPR™ Potassium Channel Assay Kit, and a >100% larger S/N as compared with the original
FluxOR Potassium Ion Channel Assay.
Time (sec)
1 151 1811219131 61 211
5
4
3
2
1
241 271 301 331
6
Sig
nal-
to-n
oise
rat
io FLIPR
FluxOR II Green
FluxOR
Figure 3. Increased dynamic range of the FluxOR II Green Potassium Ion
Channel Assay. CHO cells were preloaded with the FluxOR II Green reagent
and stimulated with a solution containing 2 mM thallium and 10 mM potassium to
activate voltage-gated potassium channels. Cells were then exposed to different
concentrations of the potassium channel blocker E-4031 and analyzed using a
Hamamatsu™ FDSS6000 imaging-based plate reader, according to the protocol
provided with the Invitrogen™ FluxOR™ II Green Potassium Ion Channel Assay (Cat.
No. F20016); the other two assays were carried out similarly, according to their
supplied protocols. The FluxOR II Green assay displays an improved detection
sensitivity and signal window as compared with the first-generation FluxOR assay
or the Molecular Devices FLIPR™ assay, facilitating the analysis of a wider range
of potassium channels, including low-expressed or weakly conducting channels.
E-4031 concentration (µM) 10–6 10210–210–4
Rel
ativ
e �u
ores
cenc
e (∆
F/F)
1
FLIPRFluxOR II Green
FluxOR
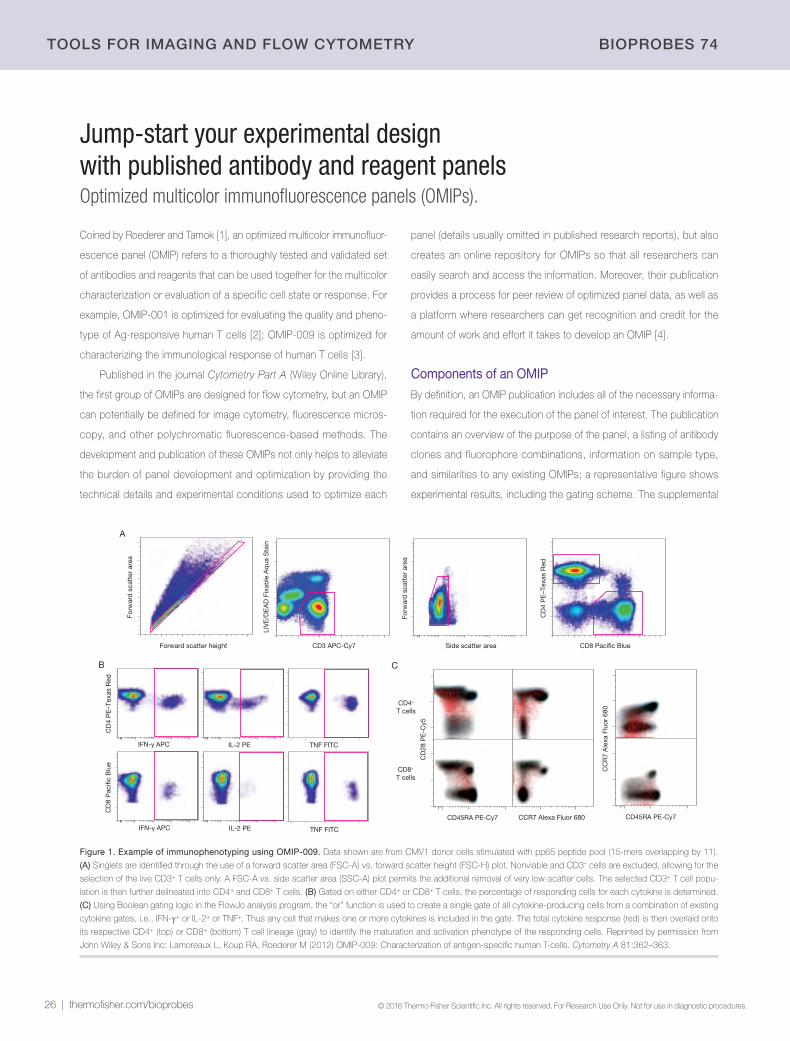
26 | thermofisher.com/bioprobes © 2016 Thermo Fisher Scientific Inc. All rights reserved. For Research Use Only. Not for use in diagnostic procedures.
TOOLs FOr IMAGING AND FLOW CYTOMETrY BIOPrOBEs 74
Jump-start your experimental design with published antibody and reagent panelsOptimized multicolor immunofluorescence panels (OMIPs).
Coined by Roederer and Tarnok [1], an optimized multicolor immunofluor-
escence panel (OMIP) refers to a thoroughly tested and validated set
of antibodies and reagents that can be used together for the multicolor
characterization or evaluation of a specific cell state or response. For
example, OMIP-001 is optimized for evaluating the quality and pheno -
type of Ag-responsive human T cells [2]; OMIP-009 is optimized for
characterizing the immunological response of human T cells [3].
Published in the journal Cytometry Part A (Wiley Online Library),
the first group of OMIPs are designed for flow cytometry, but an OMIP
can potentially be defined for image cytometry, fluorescence micros-
copy, and other polychromatic fluorescence-based methods. The
development and publication of these OMIPs not only helps to alleviate
the burden of panel development and optimization by providing the
technical details and experimental conditions used to optimize each
panel (details usually omitted in published research reports), but also
creates an online repository for OMIPs so that all researchers can
easily search and access the information. Moreover, their publication
provides a process for peer review of optimized panel data, as well as
a platform where researchers can get recognition and credit for the
amount of work and effort it takes to develop an OMIP [4].
Components of an OMIPBy definition, an OMIP publication includes all of the necessary informa-
tion required for the execution of the panel of interest. The publication
contains an overview of the purpose of the panel, a listing of antibody
clones and fluorophore combinations, information on sample type,
and similarities to any existing OMIPs; a representative figure shows
experimental results, including the gating scheme. The supplemental
Figure 1. Example of immunophenotyping using OMIP-009. Data shown are from CMV1 donor cells stimulated with pp65 peptide pool (15-mers overlapping by 11).
(A) Singlets are identified through the use of a forward scatter area (FSC-A) vs. forward scatter height (FSC-H) plot. Nonviable and CD3– cells are excluded, allowing for the
selection of the live CD3+ T cells only. A FSC-A vs. side scatter area (SSC-A) plot permits the additional removal of very low-scatter cells. The selected CD3+ T cell popu-
lation is then further delineated into CD4+ and CD8+ T cells. (B) Gated on either CD4+ or CD8+ T cells, the percentage of responding cells for each cytokine is determined.
(C) Using Boolean gating logic in the FlowJo analysis program, the ‘‘or’’ function is used to create a single gate of all cytokine-producing cells from a combination of existing
cytokine gates, i.e., IFN-γ+ or IL-2+ or TNF+. Thus any cell that makes one or more cytokines is included in the gate. The total cytokine response (red) is then overlaid onto
its respective CD4+ (top) or CD8+ (bottom) T cell lineage (gray) to identify the maturation and activation phenotype of the responding cells. Reprinted by permission from
John Wiley & Sons Inc: Lamoreaux L, Koup RA, Roederer M (2012) OMIP-009: Characterization of antigen-specific human T-cells. Cytometry A 81:362–363.
CD45RA PE-Cy7
CD
28 P
E-C
y5
CC
R7
Ale
xa F
luor
680
A
CB
CD4+
T cells
CD8+
T cells
CD
8 P
aci�
c B
lue
CD45RA PE-Cy7
CD3 APC-Cy7Forward scatter height
Forw
ard
sca
tter
are
a
Forw
ard
sca
tter
are
a
Side scatter area
LIV
E/D
EA
D F
ixab
le A
qua
Sta
in
CD8 Paci�c Blue
CD
4 P
E–T
exas
Red
CCR7 Alexa Fluor 680
CD
4 P
E–T
exas
Red
IFN-γ APC
IFN-γ APC
IL-2 PE
IL-2 PE TNF FITC
TNF FITC
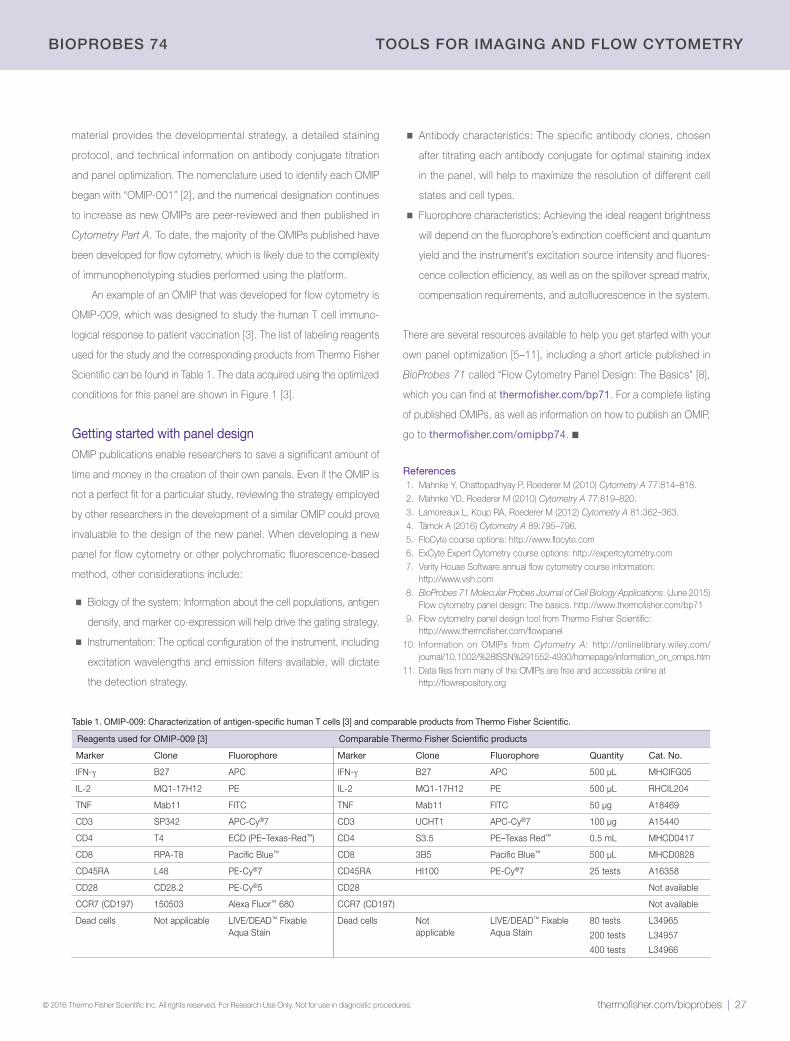
thermofisher.com/bioprobes | 27 © 2016 Thermo Fisher Scientific Inc. All rights reserved. For Research Use Only. Not for use in diagnostic procedures.
BIOPrOBEs 74 TOOLs FOr IMAGING AND FLOW CYTOMETrY
Table 1. OMIP-009: Characterization of antigen-specific human T cells [3] and comparable products from Thermo Fisher Scientific.
Reagents used for OMIP-009 [3] Comparable Thermo Fisher Scientific products
Marker Clone Fluorophore Marker Clone Fluorophore Quantity Cat. No.
IFN-γ B27 APC IFN-γ B27 APC 500 µL MHCIFG05
IL-2 MQ1-17H12 PE IL-2 MQ1-17H12 PE 500 µL RHCIL204
TNF Mab11 FITC TNF Mab11 FITC 50 µg A18469
CD3 SP342 APC-Cy®7 CD3 UCHT1 APC-Cy®7 100 µg A15440
CD4 T4 ECD (PE–Texas-Red™) CD4 S3.5 PE–Texas Red™ 0.5 mL MHCD0417
CD8 RPA-T8 Pacific Blue™ CD8 3B5 Pacific Blue™ 500 µL MHCD0828
CD45RA L48 PE-Cy®7 CD45RA HI100 PE-Cy®7 25 tests A16358
CD28 CD28.2 PE-Cy®5 CD28 Not available
CCR7 (CD197) 150503 Alexa Fluor™ 680 CCR7 (CD197) Not available
Dead cells Not applicable LIVE/DEAD™ Fixable Aqua Stain
Dead cells Not applicable
LIVE/DEAD™ Fixable Aqua Stain
80 tests
200 tests
400 tests
L34965
L34957
L34966
material provides the developmental strategy, a detailed staining
protocol, and technical information on antibody conjugate titration
and panel optimization. The nomenclature used to identify each OMIP
began with “OMIP-001” [2], and the numerical designation continues
to increase as new OMIPs are peer-reviewed and then published in
Cytometry Part A. To date, the majority of the OMIPs published have
been developed for flow cytometry, which is likely due to the complexity
of immunophenotyping studies performed using the platform.
An example of an OMIP that was developed for flow cytometry is
OMIP-009, which was designed to study the human T cell immuno-
logical response to patient vaccination [3]. The list of labeling reagents
used for the study and the corresponding products from Thermo Fisher
Scientific can be found in Table 1. The data acquired using the optimized
conditions for this panel are shown in Figure 1 [3].
Getting started with panel designOMIP publications enable researchers to save a significant amount of
time and money in the creation of their own panels. Even if the OMIP is
not a perfect fit for a particular study, reviewing the strategy employed
by other researchers in the development of a similar OMIP could prove
invaluable to the design of the new panel. When developing a new
panel for flow cytometry or other polychromatic fluorescence-based
method, other considerations include:
■ Biology of the system: Information about the cell populations, antigen
density, and marker co-expression will help drive the gating strategy.
■ Instrumentation: The optical configuration of the instrument, including
excitation wavelengths and emission filters available, will dictate
the detection strategy.
■ Antibody characteristics: The specific antibody clones, chosen
after titrating each antibody conjugate for optimal staining index
in the panel, will help to maximize the resolution of different cell
states and cell types.
■ Fluorophore characteristics: Achieving the ideal reagent brightness
will depend on the fluorophore’s extinction coefficient and quantum
yield and the instrument’s excitation source intensity and fluores-
cence collection efficiency, as well as on the spillover spread matrix,
compensation requirements, and autofluorescence in the system.
There are several resources available to help you get started with your
own panel optimization [5–11], including a short article published in
BioProbes 71 called “Flow Cytometry Panel Design: The Basics” [8],
which you can find at thermofisher.com/bp71. For a complete listing
of published OMIPs, as well as information on how to publish an OMIP,
go to thermofisher.com/omipbp74. ■
References1. Mahnke Y, Chattopadhyay P, Roederer M (2010) Cytometry A 77:814–818.
2. Mahnke YD, Roederer M (2010) Cytometry A 77:819–820.
3. Lamoreaux L, Koup RA, Roederer M (2012) Cytometry A 81:362–363.
4. Tárnok A (2016) Cytometry A 89:795–796.
5. FloCyte course options: http://www.flocyte.com
6. ExCyte Expert Cytometry course options: http://expertcytometry.com
7. Verity House Software annual flow cytometry course information: http://www.vsh.com
8. BioProbes 71 Molecular Probes Journal of Cell Biology Applications. (June 2015) Flow cytometry panel design: The basics. http://www.thermofisher.com/bp71
9. Flow cytometry panel design tool from Thermo Fisher Scientific: http://www.thermofisher.com/flowpanel
10. Information on OMIPs from Cytometry A: http://onlinelibrary.wiley.com/ journal/10.1002/%28ISSN%291552-4930/homepage/information_on_omips.htm
11. Data files from many of the OMIPs are free and accessible online at http://flowrepository.org
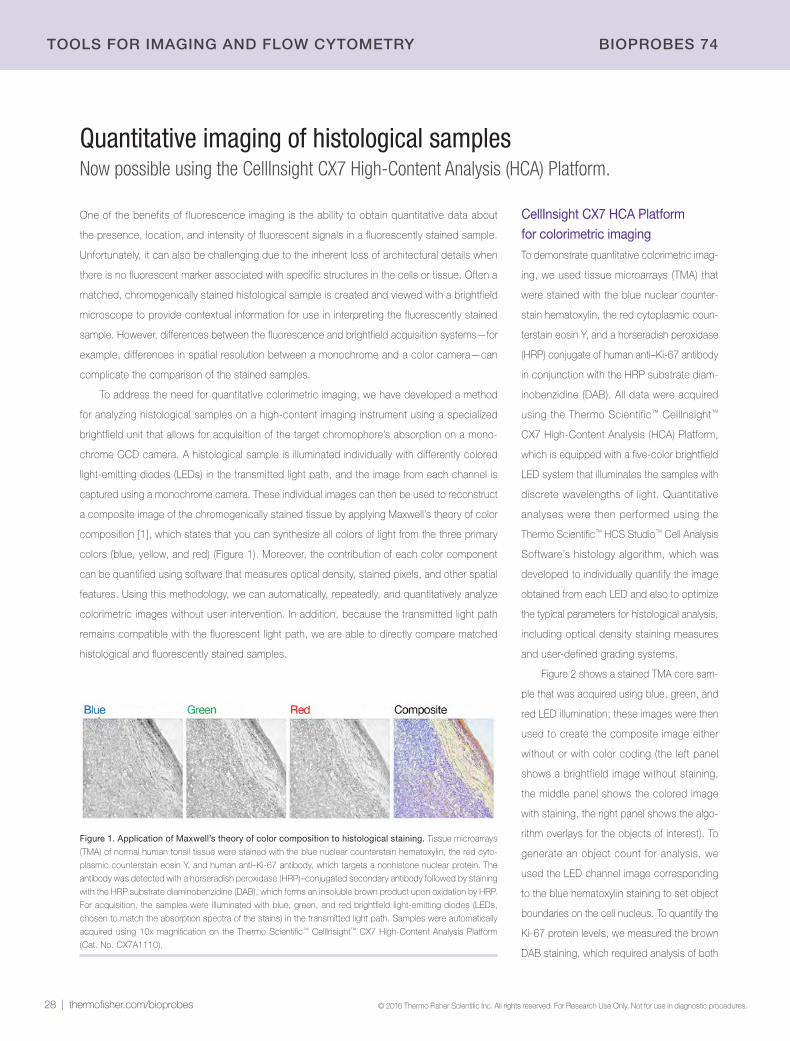
28 | thermofisher.com/bioprobes © 2016 Thermo Fisher Scientific Inc. All rights reserved. For Research Use Only. Not for use in diagnostic procedures.
TOOLs FOr IMAGING AND FLOW CYTOMETrY BIOPrOBEs 74
Quantitative imaging of histological samplesNow possible using the CellInsight CX7 High-Content Analysis (HCA) Platform.
One of the benefits of fluorescence imaging is the ability to obtain quantitative data about
the presence, location, and intensity of fluorescent signals in a fluorescently stained sample.
Unfortunately, it can also be challenging due to the inherent loss of architectural details when
there is no fluorescent marker associated with specific structures in the cells or tissue. Often a
matched, chromogenically stained histological sample is created and viewed with a brightfield
microscope to provide contextual information for use in interpreting the fluorescently stained
sample. However, differences between the fluorescence and brightfield acquisition systems—for
example, differences in spatial resolution between a monochrome and a color camera—can
complicate the comparison of the stained samples.
To address the need for quantitative colorimetric imaging, we have developed a method
for analyzing histological samples on a high-content imaging instrument using a specialized
brightfield unit that allows for acquisition of the target chromophore’s absorption on a mono-
chrome CCD camera. A histological sample is illuminated individually with differently colored
light-emitting diodes (LEDs) in the transmitted light path, and the image from each channel is
captured using a monochrome camera. These individual images can then be used to reconstruct
a composite image of the chromogenically stained tissue by applying Maxwell’s theory of color
composition [1], which states that you can synthesize all colors of light from the three primary
colors (blue, yellow, and red) (Figure 1). Moreover, the contribution of each color component
can be quantified using software that measures optical density, stained pixels, and other spatial
features. Using this methodology, we can automatically, repeatedly, and quantitatively analyze
colorimetric images without user intervention. In addition, because the transmitted light path
remains compatible with the fluorescent light path, we are able to directly compare matched
histological and fluorescently stained samples.
CellInsight CX7 HCA Platform for colorimetric imagingTo demonstrate quantitative colorimetric imag-
ing, we used tissue microarrays (TMA) that
were stained with the blue nuclear counter-
stain hematoxylin, the red cytoplasmic coun-
terstain eosin Y, and a horseradish peroxidase
(HRP) conjugate of human anti–Ki-67 antibody
in conjunction with the HRP substrate diam-
inobenzidine (DAB). All data were acquired
using the Thermo Scientific™ CellInsight™
CX7 High-Content Analysis (HCA) Platform,
which is equipped with a five-color brightfield
LED system that illuminates the samples with
discrete wavelengths of light. Quantitative
analyses were then performed using the
Thermo Scientific™ HCS Studio™ Cell Analysis
Software’s histology algorithm, which was
developed to individually quantify the image
obtained from each LED and also to optimize
the typical parameters for histological analysis,
including optical density staining measures
and user-defined grading systems.
Figure 2 shows a stained TMA core sam-
ple that was acquired using blue, green, and
red LED illumination; these images were then
used to create the composite image either
without or with color coding (the left panel
shows a brightfield image without staining,
the middle panel shows the colored image
with staining, the right panel shows the algo-
rithm overlays for the objects of interest). To
generate an object count for analysis, we
used the LED channel image corresponding
to the blue hematoxylin staining to set object
boundaries on the cell nucleus. To quantify the
Ki-67 protein levels, we measured the brown
DAB staining, which required analysis of both
Figure 1. Application of Maxwell’s theory of color composition to histological staining. Tissue microarrays
(TMA) of normal human tonsil tissue were stained with the blue nuclear counterstain hematoxylin, the red cyto-
plasmic counterstain eosin Y, and human anti–Ki-67 antibody, which targets a nonhistone nuclear protein. The
antibody was detected with a horseradish peroxidase (HRP)–conjugated secondary antibody followed by staining
with the HRP substrate diaminobenzidine (DAB), which forms an insoluble brown product upon oxidation by HRP.
For acquisition, the samples were illuminated with blue, green, and red brightfield light-emitting diodes (LEDs,
chosen to match the absorption spectra of the stains) in the transmitted light path. Samples were automatically
acquired using 10x magnification on the Thermo Scientific™ CellInsight™ CX7 High-Content Analysis Platform
(Cat. No. CX7A1110).
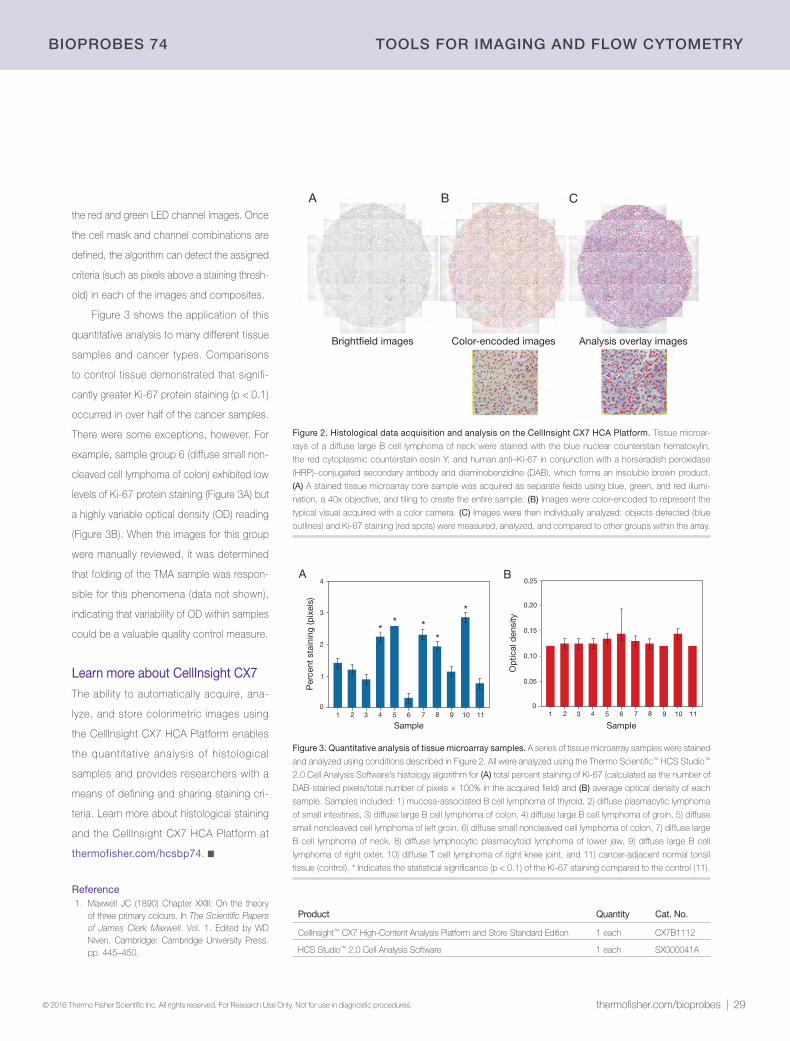
thermofisher.com/bioprobes | 29 © 2016 Thermo Fisher Scientific Inc. All rights reserved. For Research Use Only. Not for use in diagnostic procedures.
BIOPrOBEs 74 TOOLs FOr IMAGING AND FLOW CYTOMETrY
the red and green LED channel images. Once
the cell mask and channel combinations are
defined, the algorithm can detect the assigned
criteria (such as pixels above a staining thresh-
old) in each of the images and composites.
Figure 3 shows the application of this
quantitative analysis to many different tissue
samples and cancer types. Comparisons
to control tissue demonstrated that signifi-
cantly greater Ki-67 protein staining (p < 0.1)
occurred in over half of the cancer samples.
There were some exceptions, however. For
example, sample group 6 (diffuse small non-
cleaved cell lymphoma of colon) exhibited low
levels of Ki-67 protein staining (Figure 3A) but
a highly variable optical density (OD) reading
(Figure 3B). When the images for this group
were manually reviewed, it was determined
that folding of the TMA sample was respon-
sible for this phenomena (data not shown),
indicating that variability of OD within samples
could be a valuable quality control measure.
Learn more about CellInsight CX7The ability to automatically acquire, ana-
lyze, and store colorimetric images using
the CellInsight CX7 HCA Platform enables
the quantitative analysis of histological
samples and provides researchers with a
means of defining and sharing staining cri-
teria. Learn more about histological staining
and the CellInsight CX7 HCA Platform at
thermofisher.com/hcsbp74. ■
Reference1. Maxwell JC (1890) Chapter XXIII: On the theory
of three primary colours. In The Scientific Papers of James Clerk Maxwell. Vol. 1. Edited by WD Niven. Cambridge: Cambridge University Press. pp. 445–450.
Product Quantity Cat. No.
CellInsight™ CX7 High-Content Analysis Platform and Store Standard Edition 1 each CX7B1112
HCS Studio™ 2.0 Cell Analysis Software 1 each SX000041A
Figure 2. Histological data acquisition and analysis on the CellInsight CX7 HCA Platform. Tissue microar-
rays of a diffuse large B cell lymphoma of neck were stained with the blue nuclear counterstain hematoxylin,
the red cytoplasmic counterstain eosin Y, and human anti–Ki-67 in conjunction with a horseradish peroxidase
(HRP)–conjugated secondary antibody and diaminobenzidine (DAB), which forms an insoluble brown product.
(A) A stained tissue microarray core sample was acquired as separate fields using blue, green, and red illumi-
nation, a 40x objective, and tiling to create the entire sample. (B) Images were color-encoded to represent the
typical visual acquired with a color camera. (C) Images were then individually analyzed: objects detected (blue
outlines) and Ki-67 staining (red spots) were measured, analyzed, and compared to other groups within the array.
A B C
Bright�eld images Color-encoded images Analysis overlay images
Figure 3. Quantitative analysis of tissue microarray samples. A series of tissue microarray samples were stained
and analyzed using conditions described in Figure 2. All were analyzed using the Thermo Scientific™ HCS Studio™
2.0 Cell Analysis Software’s histology algorithm for (A) total percent staining of Ki-67 (calculated as the number of
DAB-stained pixels/total number of pixels × 100% in the acquired field) and (B) average optical density of each
sample. Samples included: 1) mucosa-associated B cell lymphoma of thyroid, 2) diffuse plasmacytic lymphoma
of small intestines, 3) diffuse large B cell lymphoma of colon, 4) diffuse large B cell lymphoma of groin, 5) diffuse
small noncleaved cell lymphoma of left groin, 6) diffuse small noncleaved cell lymphoma of colon, 7) diffuse large
B cell lymphoma of neck, 8) diffuse lymphocytic plasmacytoid lymphoma of lower jaw, 9) diffuse large B cell
lymphoma of right oxter, 10) diffuse T cell lymphoma of right knee joint, and 11) cancer-adjacent normal tonsil
tissue (control). * Indicates the statistical significance (p < 0.1) of the Ki-67 staining compared to the control (11).
Per
cent
sta
inin
g (p
ixel
s)
11
1
0
2
3
4
1 2 3 4 5 6 7 8 9 10
** *
*
*
Sample
Op
tical
den
sity
11
0.05
0
0.10
0.15
0.20
0.25
1 2 3 4 5 6 7 8 9 10
BA
Sample
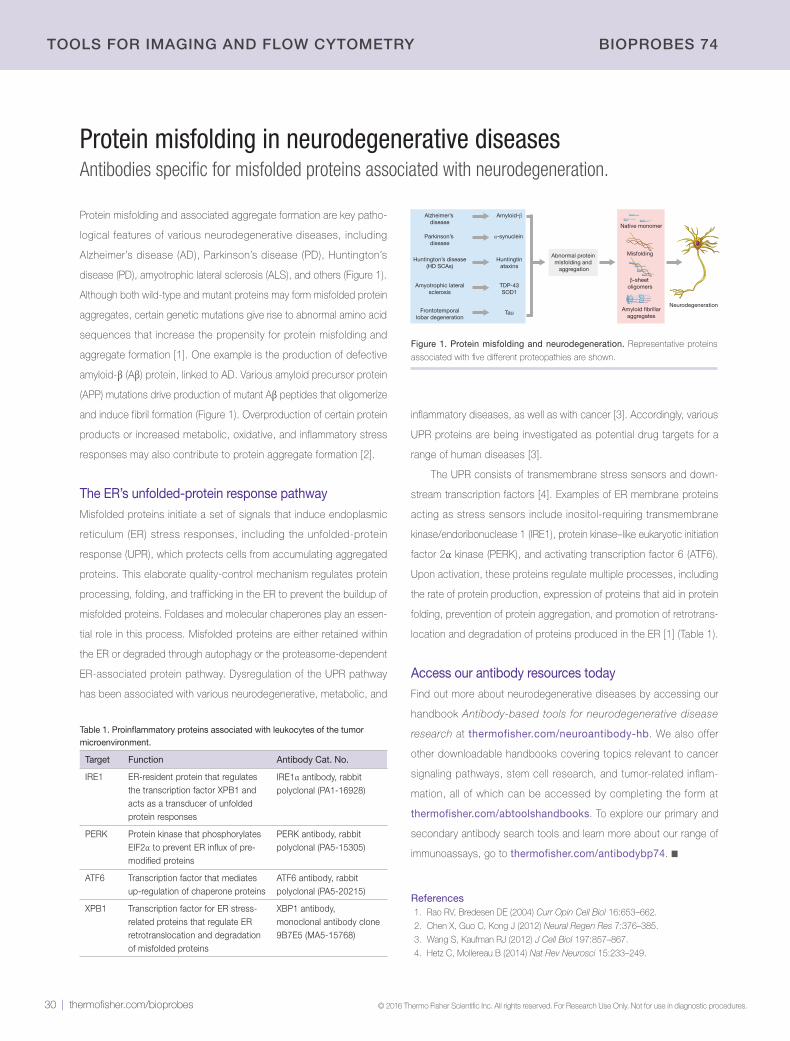
30 | thermofisher.com/bioprobes © 2016 Thermo Fisher Scientific Inc. All rights reserved. For Research Use Only. Not for use in diagnostic procedures.
TOOLs FOr IMAGING AND FLOW CYTOMETrY BIOPrOBEs 74
Protein misfolding in neurodegenerative diseasesAntibodies specific for misfolded proteins associated with neurodegeneration.
Protein misfolding and associated aggregate formation are key patho-
logical features of various neurodegenerative diseases, including
Alzheimer’s disease (AD), Parkinson’s disease (PD), Huntington’s
disease (PD), amyotrophic lateral sclerosis (ALS), and others (Figure 1).
Although both wild-type and mutant proteins may form misfolded protein
aggregates, certain genetic mutations give rise to abnormal amino acid
sequences that increase the propensity for protein misfolding and
aggregate formation [1]. One example is the production of defective
amyloid-β (Aβ) protein, linked to AD. Various amyloid precursor protein
(APP) mutations drive production of mutant Aβ peptides that oligomerize
and induce fibril formation (Figure 1). Overproduction of certain protein
products or increased metabolic, oxidative, and inflammatory stress
responses may also contribute to protein aggregate formation [2].
The ER’s unfolded-protein response pathwayMisfolded proteins initiate a set of signals that induce endoplasmic
reticulum (ER) stress responses, including the unfolded-protein
response (UPR), which protects cells from accumulating aggregated
proteins. This elaborate quality-control mechanism regulates protein
processing, folding, and trafficking in the ER to prevent the buildup of
misfolded proteins. Foldases and molecular chaperones play an essen-
tial role in this process. Misfolded proteins are either retained within
the ER or degraded through autophagy or the proteasome-dependent
ER-associated protein pathway. Dysregulation of the UPR pathway
has been associated with various neurodegenerative, metabolic, and
inflammatory diseases, as well as with cancer [3]. Accordingly, various
UPR proteins are being investigated as potential drug targets for a
range of human diseases [3].
The UPR consists of transmembrane stress sensors and down-
stream transcription factors [4]. Examples of ER membrane proteins
acting as stress sensors include inositol-requiring transmembrane
kinase/endoribonuclease 1 (IRE1), protein kinase–like eukaryotic initiation
factor 2α kinase (PERK), and activating transcription factor 6 (ATF6).
Upon activation, these proteins regulate multiple processes, including
the rate of protein production, expression of proteins that aid in protein
folding, prevention of protein aggregation, and promotion of retrotrans-
location and degradation of proteins produced in the ER [1] (Table 1).
Access our antibody resources todayFind out more about neurodegenerative diseases by accessing our
handbook Antibody-based tools for neurodegenerative disease
research at thermofisher.com/neuroantibody-hb. We also offer
other downloadable handbooks covering topics relevant to cancer
signaling pathways, stem cell research, and tumor-related inflam-
mation, all of which can be accessed by completing the form at
thermofisher.com/abtoolshandbooks. To explore our primary and
secondary antibody search tools and learn more about our range of
immunoassays, go to thermofisher.com/antibodybp74. ■
References1. Rao RV, Bredesen DE (2004) Curr Opin Cell Biol 16:653–662.
2. Chen X, Guo C, Kong J (2012) Neural Regen Res 7:376–385.
3. Wang S, Kaufman RJ (2012) J Cell Biol 197:857–867.
4. Hetz C, Mollereau B (2014) Nat Rev Neurosci 15:233–249.
Figure 1. Protein misfolding and neurodegeneration. Representative proteins
associated with five different proteopathies are shown.
Table 1. Proinflammatory proteins associated with leukocytes of the tumor microenvironment.
Target Function Antibody Cat. No.
IRE1 ER-resident protein that regulates the transcription factor XPB1 and acts as a transducer of unfolded protein responses
IRE1α antibody, rabbit polyclonal (PA1-16928)
PERK Protein kinase that phosphorylates EIF2α to prevent ER influx of pre-modified proteins
PERK antibody, rabbit polyclonal (PA5-15305)
ATF6 Transcription factor that mediates up-regulation of chaperone proteins
ATF6 antibody, rabbit polyclonal (PA5-20215)
XPB1 Transcription factor for ER stress-related proteins that regulate ER retrotranslocation and degradation of misfolded proteins
XBP1 antibody, monoclonal antibody clone 9B7E5 (MA5-15768)
Alzheimer’s disease
Abnormal protein misfolding and
aggregation
Parkinson’s disease
Huntington’s disease(HD SCAs)
Amyotrophic lateralsclerosis
Frontotemporallobar degeneration
Amyloid-β
α-synuclein
Huntingtinataxins
TDP-43SOD1
Tau
Native monomer
Misfolding
β-sheet oligomers
Amyloid �brillaraggregates
Neurodegeneration
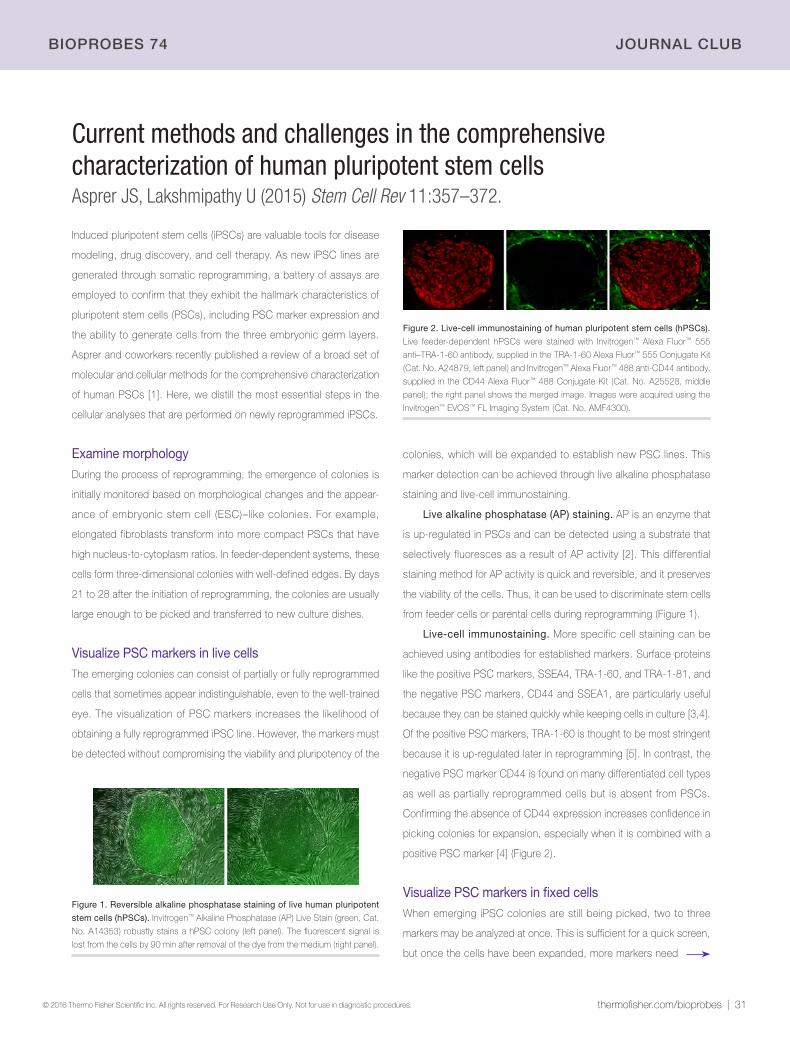
thermofisher.com/bioprobes | 31 © 2016 Thermo Fisher Scientific Inc. All rights reserved. For Research Use Only. Not for use in diagnostic procedures.
BIOPrOBEs 74 JOUrNAL CLUB
Current methods and challenges in the comprehensive characterization of human pluripotent stem cellsAsprer JS, Lakshmipathy U (2015) Stem Cell Rev 11:357–372.
Induced pluripotent stem cells (iPSCs) are valuable tools for disease
modeling, drug discovery, and cell therapy. As new iPSC lines are
generated through somatic reprogramming, a battery of assays are
employed to confirm that they exhibit the hallmark characteristics of
pluripotent stem cells (PSCs), including PSC marker expression and
the ability to generate cells from the three embryonic germ layers.
Asprer and coworkers recently published a review of a broad set of
molecular and cellular methods for the comprehensive characterization
of human PSCs [1]. Here, we distill the most essential steps in the
cellular analyses that are performed on newly reprogrammed iPSCs.
Examine morphologyDuring the process of reprogramming, the emergence of colonies is
initially monitored based on morphological changes and the appear-
ance of embryonic stem cell (ESC)–like colonies. For example,
elongated fibroblasts transform into more compact PSCs that have
high nucleus-to-cytoplasm ratios. In feeder-dependent systems, these
cells form three-dimensional colonies with well-defined edges. By days
21 to 28 after the initiation of reprogramming, the colonies are usually
large enough to be picked and transferred to new culture dishes.
Visualize PSC markers in live cellsThe emerging colonies can consist of partially or fully reprogrammed
cells that sometimes appear indistinguishable, even to the well-trained
eye. The visualization of PSC markers increases the likelihood of
obtaining a fully reprogrammed iPSC line. However, the markers must
be detected without compromising the viability and pluripotency of the
colonies, which will be expanded to establish new PSC lines. This
marker detection can be achieved through live alkaline phosphatase
staining and live-cell immunostaining.
Live alkaline phosphatase (AP) staining. AP is an enzyme that
is up-regulated in PSCs and can be detected using a substrate that
selectively fluoresces as a result of AP activity [2]. This differential
staining method for AP activity is quick and reversible, and it preserves
the viability of the cells. Thus, it can be used to discriminate stem cells
from feeder cells or parental cells during reprogramming (Figure 1).
Live-cell immunostaining. More specific cell staining can be
achieved using antibodies for established markers. Surface proteins
like the positive PSC markers, SSEA4, TRA-1-60, and TRA-1-81, and
the negative PSC markers, CD44 and SSEA1, are particularly useful
because they can be stained quickly while keeping cells in culture [3,4].
Of the positive PSC markers, TRA-1-60 is thought to be most stringent
because it is up-regulated later in reprogramming [5]. In contrast, the
negative PSC marker CD44 is found on many differentiated cell types
as well as partially reprogrammed cells but is absent from PSCs.
Confirming the absence of CD44 expression increases confidence in
picking colonies for expansion, especially when it is combined with a
positive PSC marker [4] (Figure 2).
Visualize PSC markers in fixed cellsWhen emerging iPSC colonies are still being picked, two to three
markers may be analyzed at once. This is sufficient for a quick screen,
but once the cells have been expanded, more markers need
Figure 2. Live-cell immunostaining of human pluripotent stem cells (hPSCs).
Live feeder-dependent hPSCs were stained with Invitrogen™ Alexa Fluor™ 555
anti–TRA-1-60 antibody, supplied in the TRA-1-60 Alexa Fluor™ 555 Conjugate Kit
(Cat. No. A24879, left panel) and Invitrogen™ Alexa Fluor™ 488 anti-CD44 antibody,
supplied in the CD44 Alexa Fluor™ 488 Conjugate Kit (Cat. No. A25528, middle
panel); the right panel shows the merged image. Images were acquired using the
Invitrogen™ EVOS™ FL Imaging System (Cat. No. AMF4300).
Figure 1. Reversible alkaline phosphatase staining of live human pluripotent
stem cells (hPSCs). Invitrogen™ Alkaline Phosphatase (AP) Live Stain (green, Cat.
No. A14353) robustly stains a hPSC colony (left panel). The fluorescent signal is
lost from the cells by 90 min after removal of the dye from the medium (right panel).
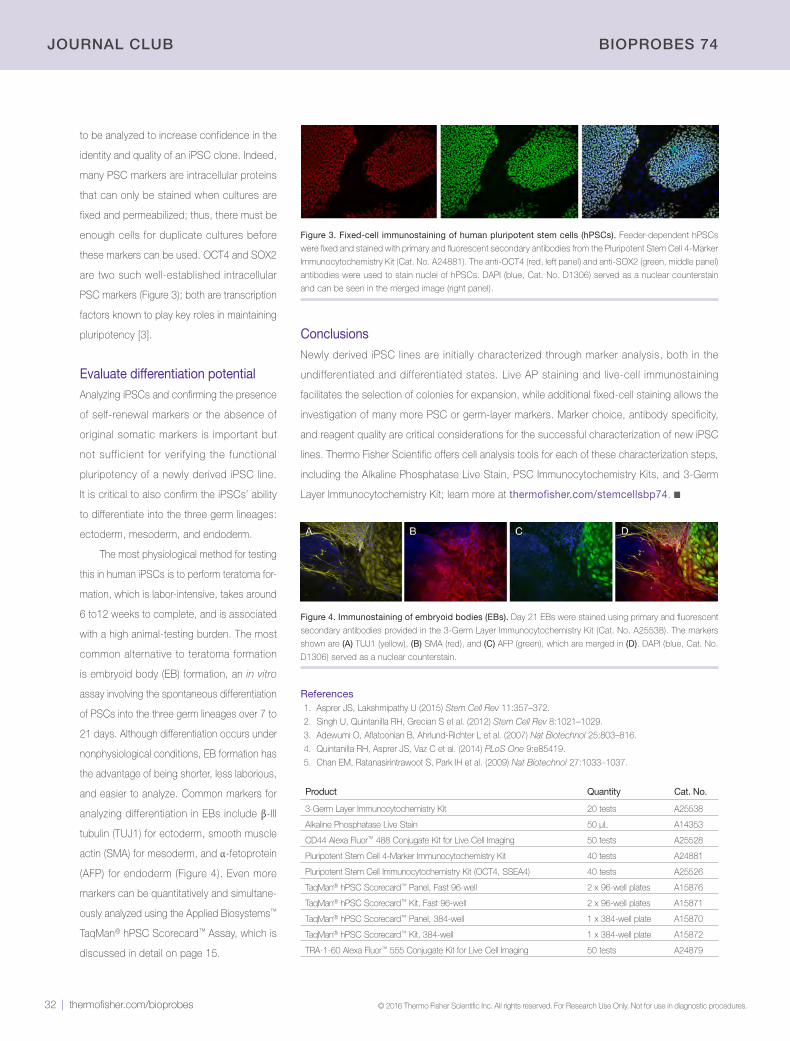
32 | thermofisher.com/bioprobes © 2016 Thermo Fisher Scientific Inc. All rights reserved. For Research Use Only. Not for use in diagnostic procedures.
JOUrNAL CLUB BIOPrOBEs 74
to be analyzed to increase confidence in the
identity and quality of an iPSC clone. Indeed,
many PSC markers are intracellular proteins
that can only be stained when cultures are
fixed and permeabilized; thus, there must be
enough cells for duplicate cultures before
these markers can be used. OCT4 and SOX2
are two such well-established intracellular
PSC markers (Figure 3); both are transcription
factors known to play key roles in maintaining
pluripotency [3].
Evaluate differentiation potentialAnalyzing iPSCs and confirming the presence
of self-renewal markers or the absence of
original somatic markers is important but
not sufficient for verifying the functional
pluripotency of a newly derived iPSC line.
It is critical to also confirm the iPSCs’ ability
to differentiate into the three germ lineages:
ectoderm, mesoderm, and endoderm.
The most physiological method for testing
this in human iPSCs is to perform teratoma for-
mation, which is labor-intensive, takes around
6 to12 weeks to complete, and is associated
with a high animal-testing burden. The most
common alternative to teratoma formation
is embryoid body (EB) formation, an in vitro
assay involving the spontaneous differentiation
of PSCs into the three germ lineages over 7 to
21 days. Although differentiation occurs under
nonphysiological conditions, EB formation has
the advantage of being shorter, less laborious,
and easier to analyze. Common markers for
analyzing differentiation in EBs include β-III
tubulin (TUJ1) for ectoderm, smooth muscle
actin (SMA) for mesoderm, and α-fetoprotein
(AFP) for endoderm (Figure 4). Even more
markers can be quantitatively and simultane-
ously analyzed using the Applied Biosystems™
TaqMan® hPSC Scorecard™ Assay, which is
discussed in detail on page 15.
Product Quantity Cat. No.
3-Germ Layer Immunocytochemistry Kit 20 tests A25538
Alkaline Phosphatase Live Stain 50 µL A14353
CD44 Alexa Fluor™ 488 Conjugate Kit for Live Cell Imaging 50 tests A25528
Pluripotent Stem Cell 4-Marker Immunocytochemistry Kit 40 tests A24881
Pluripotent Stem Cell Immunocytochemistry Kit (OCT4, SSEA4) 40 tests A25526
TaqMan® hPSC Scorecard™ Panel, Fast 96-well 2 x 96-well plates A15876
TaqMan® hPSC Scorecard™ Kit, Fast 96-well 2 x 96-well plates A15871
TaqMan® hPSC Scorecard™ Panel, 384-well 1 x 384-well plate A15870
TaqMan® hPSC Scorecard™ Kit, 384-well 1 x 384-well plate A15872
TRA-1-60 Alexa Fluor™ 555 Conjugate Kit for Live Cell Imaging 50 tests A24879
References1. Asprer JS, Lakshmipathy U (2015) Stem Cell Rev 11:357–372.
2. Singh U, Quintanilla RH, Grecian S et al. (2012) Stem Cell Rev 8:1021–1029.
3. Adewumi O, Aflatoonian B, Ahrlund-Richter L et al. (2007) Nat Biotechnol 25:803–816.
4. Quintanilla RH, Asprer JS, Vaz C et al. (2014) PLoS One 9:e85419.
5. Chan EM, Ratanasirintrawoot S, Park IH et al. (2009) Nat Biotechnol 27:1033–1037.
ConclusionsNewly derived iPSC lines are initially characterized through marker analysis, both in the
undifferentiated and differentiated states. Live AP staining and live-cell immunostaining
facilitates the selection of colonies for expansion, while additional fixed-cell staining allows the
investigation of many more PSC or germ-layer markers. Marker choice, antibody specificity,
and reagent quality are critical considerations for the successful characterization of new iPSC
lines. Thermo Fisher Scientific offers cell analysis tools for each of these characterization steps,
including the Alkaline Phosphatase Live Stain, PSC Immunocytochemistry Kits, and 3-Germ
Layer Immunocytochemistry Kit; learn more at thermofisher.com/stemcellsbp74. ■
Figure 3. Fixed-cell immunostaining of human pluripotent stem cells (hPSCs). Feeder-dependent hPSCs
were fixed and stained with primary and fluorescent secondary antibodies from the Pluripotent Stem Cell 4-Marker
Immunocytochemistry Kit (Cat. No. A24881). The anti-OCT4 (red, left panel) and anti-SOX2 (green, middle panel)
antibodies were used to stain nuclei of hPSCs. DAPI (blue, Cat. No. D1306) served as a nuclear counterstain
and can be seen in the merged image (right panel).
Figure 4. Immunostaining of embryoid bodies (EBs). Day 21 EBs were stained using primary and fluorescent
secondary antibodies provided in the 3-Germ Layer Immunocytochemistry Kit (Cat. No. A25538). The markers
shown are (A) TUJ1 (yellow), (B) SMA (red), and (C) AFP (green), which are merged in (D). DAPI (blue, Cat. No.
D1306) served as a nuclear counterstain.