Embed Size (px)
Citation preview

Biophysical Methods for Drug Research
I Structure

Summary of screening methods and associated fragment libraries
etartiHtimilytivitisneSdohteM a )noitazinagro(ezisyrarbiLtnemeriuqeryrarbiLsnoCsorP
NMR protein detected(SAR by NMR)
1 mM KD Up to 1% Low false positive rate3D structure information
Large quantity ofi sotopelabelled protein, Mr of target< 40 kDa, low hit rate
Soluble in large mixes (> 10) 17,000 (Abbott)b20,000 (Combinature)
NMR ligand detected(STD/WATERLOGSY)
2 mM KD Up to 5% Simple to setup, moderateto low target requirement,good throughput
Higher false positive, best withtargets at least 20 kDa, cannotdetect tight binders
No limitations 1200–1500 (Vernalis [19])
NMR competition binding 2–5 mM KD Up to 1% Very low false positive Focus on one binding site,must have ligand a priori
19F labelled for findingcompetitor ligand
Up to 100,000 but onlyfor enzymes (NervianoMed. Sci. [31])
Mm01SNITRMN KD Up to 10% Efficient use of protein,screen protein in all states,low false positives, membraneproteins, uses reference protein
Must immobilize protein Soluble at 500mM eachin mixes
2000 (ZoBio [29]/PyxisDiscovery)
Mm1–5.0nietorpRPS KD 0.5–1% Highly efficient use of protein,kinetic data
Must immobilize compounds,protein must be soluble
Immobilized chemical array,fragment like
10,000 (Graffinity)
SPR compound 5 mM (Ki) 3–5%c Highly efficient use of protein,kinetic data and KD, usesreference protein
Must immobilize protein onAu surface
Fragment like, minimal Mr
of compound 160 Da2000 (Roche)
High concentration screening NF Up to 2% Upfront knowledge ofbiochemical activity
Requires biochemical function(usually enzyme), false negatives,and false positives
125–350 Da 20,000 (Plexxikon [25])
Fluorescence (Thermofluor) nM–mM KD (possiblyto 1 mM) [41]
NF Enables search for novelprotein modulators suchas stabilizers
Sensitivity to weak binding.Requires up to 10 mg of pure,soluble protein
&nosnhoJ(000,003ekildaeLJohnson [42])
Frontal affinity chromatography–mass spectroscopy (FAC–MS)
10mM KD – directmode; 500mM KD –indicator mode [36]
NF High-throughput, competitionmode
Immobilize protein sensitivity,DMSO concentration/compoundsolubility, required known ligandas ‘indicator’
Lead like, compound mustbe visible in MS
Potentially large
Affinity capillaryelectrophoresis (ACE)
nM–mM KD 0.3% High throughput Target must be fluorescentlylabelled
&nosnhoJ(000,44ekildaeLJohnson [38])
Crystallography Up to 1 mM KD 0.5–10% 3D structure info Must have relatively high-resolution crystals, falsenegatives (occludedbinding site), false positives,extremely resource intensive
Fragment like, up to 1000compounds, SGX librarycontains 50% compoundswith an aromatic bromineatom for crystallography andfor the follow-up chemistry
850 (Astex [43])1000 (SGX [44])
desopxeecafrusetarenegtsuMytivitisneS%01.0Mm5–1gnirehteTcysteine mutants of target
Compound must have SH group 7000 (Sunesis[45])
Note: NF – not found.
Siegal, Drug Discov. Today, 12 (2007), 1032

X-Ray Crystallography
3

Purified protein Crystal
X-ray Diffraction Electron density
3D structure
Crystallization Phase problem

source: Wikipedia

Liq.N2 gas stream
Experimental set-up
X-ray source
detectorgoniometer
beam stop
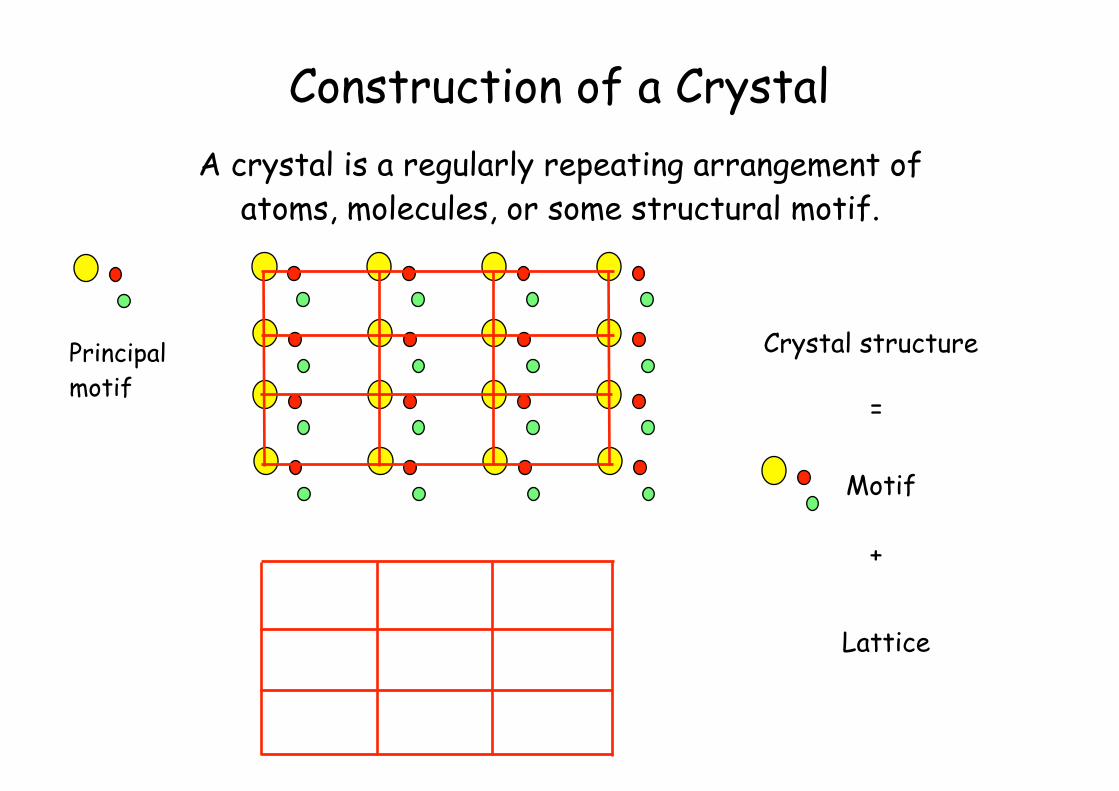
Construction of a Crystal
Crystal structure
=
Motif
+
Lattice
A crystal is a regularly repeating arrangement of atoms, molecules, or some structural motif.
Principalmotif

8
The fundamental portion of a crystal structure that is repeated infinitely by translation in three dimensions.
Unit Cell

9
Part of the symmetric object from which the whole is built up by repeats. Thus, it is the smallest unit from which the object can be generated by the symmetry operations
The asymmetric unit

10
Scattering by atoms
•e- diffract x-rays •can be described by an approximation of the scattering by the electron shell •an atom diffracts x- rays in all directions

Diffraction image
• During X-ray exposure the crystal is rotated over 1º; monochromatic X-rays (λ = 0.8469 Å)

12n = 2d sin
d
2d sin
d
Braggs Law
•Scattering occurs from all atoms in the crystal and result in constructive and destructive interference. •The positions of constructive interference depend on the atom separations in space

Constructive Interference
Destructive Interference

Scattering by many atoms
figures by Tony Linden


Disorder in crystals

The Observable: The Structure Factor• The diffraction pattern of the 3D crystalline lattice is another lattice with
lattice dimensions related to the inverse of the unit cell edge lengths of the crystal (a reciprocal space representation of the crystal lattice).
• The position of each diffraction 'spot' is governed by the size and shape of the unit cell, and the inherent symmetry within the crystal. The intensity of each diffraction 'spot' is recorded, and is proportional to the square of the structure factor amplitude. The structure factor F(hkl) is the (vector) sum of the scattering f of each atom in the unit cell.
• Each reflection has information about all atoms
• The structure factors F(hkl) and electron density ρ(xyz) are related by Fourier Transformation
(xyz) = 1V h k
|F(hkl) | exp[( 2 i(hk + ky + lz) + i hkl]l
Can measure|F(hkl)|=I1/2
Can’t measure
hkl

Intensities and Phases
A duck and a cat and their Fourier transforms(diffraction pattern)
Brightness = intensityColour = phase
If we know intensity & phase, we can do back transformation
Kevin Cowtan: http://www.ysbl.york.ac.uk/~cowtan/fourier/fourier.html

Phases from cat,intensities from duck:
Phases from duck, intensities from cat:
The phases have much more information than the intensities.
Kevin Cowtan: http://www.ysbl.york.ac.uk/~cowtan/fourier/fourier.html

Intensities only; cannot generate an unknown object:
Kevin Cowtan: http://www.ysbl.york.ac.uk/~cowtan/fourier/fourier.html
?
Take a similar known object (Manx cat) from which phases can be calculated:
Manx phases + real intensities. When phases nearly correct, the missing (wrong) parts of the model appear:

How can we solve the Phase Problem ?
• Direct Methods • small molecules and small proteins • needs atomic resolution data (d < 1.2 Å) !
• Difference method using heavy atoms • multiple isomorphous replacement (MIR) • anomalous scattering (AS)
• Difference method using variable wavelength • multiple-wavelength anomalous diffraction (MAD)
• Using a homologous structure • molecular replacement

Protein crystals
• Protein crystals are regular arrays of protein molecules
• 20-80% solvent • Few crystal contents
• Protein crystals contain active protein • Enzyme turnover • Ligand binding
Example of crystal packing

Building a protein model
• Find structural elements: α-helices, β-strands • Fit amino-acid sequence

Resolution

Ian Campbell: Biophysical Techniques

Effects of resolution on electron density
d = 4 Åd = 4 Åd = 4 Å d = 3 Å
d = 2 Å d = 1 Å

Problematic proteins
• Multiple domains
Typ• Similarly, floppy ends may hamper crystallization:
change construct
• Membrane proteins
• Glycoproteins
Lipid
hydrophilic
hydrophilic
hydrophobic
Flexible and heterogeneous!!

Isomorphous replacement
• The scattering by a derivative crystal PH , containing a extra heavy atom, is the sum of the scattering by the parent crystal P plus the scattering by the added heavy atom H
• Attach heavy atoms to unique sites in protein
• Collect diffraction data on the heavy atom derivative. The diffraction pattern is the sum of the heavy atom diffraction pattern and the protein diffraction pattern
• Measure F for each hkl
• Determine location of heavy atoms using a Patterson synthesis
29

Nuclear Magnetic Resonance
30

From NMR spectra to structures
• find conditions under which the protein does not aggregate is reasonably stable
• measure NMR spectra
• sequence-specific sequential resonance assignment • identify spin systems • link spin systems (sequential assignment) • (stereospecific assignment of diastereotopic protons) • fully- interpret NOESY spectrum
• convert NOESY peak amplitudes into distances
• calculate 3D structure and refine the output

NOE information is used to introduce distance restraints into the structure calculations
H
HNOE
γIγS(3cos2φ-1)
r3Bloc ~NOE ~ Bloc
2
“NOEs”

1
36
35
3635
34
34
The sequential assignment

TN
CO
Cα
H
1 H Frequencies
15N
Fre
quen
cies
15N,1H HSQC spectra are fingerprints of proteins

Backbone resonance assignment in uniformly 13C,15N labelled proteins
» 3D tripleresonance spectroscopy
--> amide-1H/15N and Cα frequencies within one residue
--> Cβ/Cα frequencies are sequentially correlated with amide 1H/15N frequen- cies of adjacent residues.
CBCA(CO)NH
C
O
OH
H H
H
C C C
C
N
HHNCACB
C N C
O
OH H H
C
H HC
C

τc 5ns 10ns 15ns 25ns
MW 10kDa 20kDa 30kDa 50kDa
Broad Lines: The effect of increased correlation times
36
✔ NOESYs ✖ long mixing-time TOCSYs, COSYs ✔ triple resonance experiments (2H?) ✔ HSQCs ✔ TROSY-type experiments
789 ppm 789 ppm 789 ppm 789 ppm
c [ns] ~ 1/2 MWt [kDa] @ 20°C

Biophysical Methods for Drug Research
II Interactions

Binding assays using
NMR spectroscopy

Methods for NMR-based screening
• Monitoring changes in chemical shift upon binding (usually receptor resonances)-> Chemical Shift Mapping
• Monitoring changes in relaxation properties of the ligand upon binding
– T2 effects
– Addition of spin-labels to the receptor and monitoring T2 effects in the ligand
– Second-Site Screening using a spin-labeled first ligand
• Monitoring changes in diffusion rates of the ligand
• NOE-based experiments:
– Transferred NOE
– Saturation Transfer Difference
– NOE pumping
– Water LOGSY

NMR Screening primarily uses Chemical Shift Mapping
• First a 15N-1H correlation spectrum of 15N-labelled receptor is recorded (1)
• The same spectrum is recorded after a potential ligand has been added (2)
• A second ligand binding to a different site is screened for (4)

Chemical Shift Mapping

13C (methyl) screening is much more sensitive than 15N

Monitoring changes in linewidths (T2 relaxation changes)

Primary Site Screening: Paramagnetic labels on the receptor:
SLAPSTICK
• The protein is labelled with an paramagnetic tag (e.g. doxyl)
• A 1D spectrum of potential ligands is recorded in the absence of the tagged protein
• The tagged protein is added to a compound mixture. In case it contains a binder those resonances will be broadened.

Second Site Screening Using a Spin-labeled Ligand
1
2

Saturation Transfer Difference
•a receptor resonance (that does not overlap with a ligand resonance) is saturated. Rapid spin-diffusion saturates all receptor resonances
•binding of ligand leads to NOE transfer
•subtraction of 1D spectrum with and without irradiation reveals ligand resonances that receive NOEs (are in proximity to the binding interface)

I
IS
S
I
IS
S I
IS
S
Inversion Saturation(NOESY) (1D-NOE)
Inversion Saturation
0.0
0.5
1.0
NOE
-1.0
-0.5
0.01 0.1 1.0 10 100
τc (ns)
ηmax
3
1 2
spin-diffusion

Transferred NOE Effects
•ligand and receptor are mixed such that there is high access of ligand (20-100:1)
•the ligand itself only displays weak intramolecular NOEs
•upon complex formation rapid and strong NOE buildup occurs in the ligand
•the NOE is detected on the free ligand
•requires good off-rate (mM-µM dissociation constants)
•works the better the larger the receptor is
•yields structural information on the conformation of the bound ligand
compound library used for the screen
NOESY spectra top: NOESY of the library. NOEs are negative. bottom: trNOESY for library in the presence of the receptor. Shown are positive NOEs
Meyer & Peters, Angew. Chem. 42(2002), 864

without receptor
with receptor

INPHARMA: Detecting overlapping sites of competing ligands
Carlomagno, Angew. Chem. 44 (2005), 4172-75

Diffusion-edited Experiments
• Binding of the ligand to the protein dramatically changes the diffusion rate
Diffusion-edited 1H-NMR spectrum of nine compounds in the absence of stromyelysin
Diffusion-edited 1H-NMR spectrum of nine compounds in the presence of stromyelysin
Difference a-b
reference spectrum of ligand
Difference c-d

Fluorine NMR
• (usually) no 19F in natural samples
• substrate is labelled with a CF3 group
• enzymatic reaction is preformed in the presence and absence of an inhibitor, and the change in product accumulation is computed from the 19F spectrum
• can be applied to enzymes only

NMR-based screening
KD > ~10µM; Ki<µM
Ki~mM-nM

Surface Plasmon Resonance (SPR)

The SPR Phenomenon
• the SPR technique is based on the absorption of energy from an incident beam of electromagnetic radiation by surface plasmons
• the resonance condition for absorption is fulfilled at a certain angle of the beam
• the angle depends on the refractive angle of of the medium in contact with the opposing side of the metal film.
• binding to molecules immobilized on the gold chip leads to such a change in the refractive index, which can be followed in real time
• thus association and dissociation kinetics can be measured


Equilibrium constant: Thermodynamic = equilibrium

Rate constant: kinetic = non-equilibrium condition

Equilibrium analysis KD
• low affinities KD=µM
• steady state levels • C = 20 -80% saturation
• kd > 10-2 s-1

Information from sensogram for equilibrium analysis
injection of increasing analyte concentration

0
100
200
300
0 40 80 120
RU Req
Rmax
0
20
40
60
80
100
Conc. (M)
Req (RU)
KD concentrationReq = 0.5*Rmax
0.1*KD KD 10*KD
Affinity determination
Use concentrations in the range: 0.1*KD to 10*KD

Kinetic rate analysis
• relatively high affinities
• monitor association rate and dissociation rates over time
• KD is calculated by kd/ka
ka > 103 - 106 M-1s-1
kd > 10-5-10-1 s-1
65
MS Spectroscopy

CompoundQuality control
SolubilityFormulation
SAR by MS
KdSpecificity
Stoichiometry
Hits
Refined panelScreening panelcandidate(s) + target(s)
Candidate compoundsCombinatorial librariesNatural productsDiversity collections
Target(s)RNA/DNAProtein
stih denfieRsdaeL
MASS
StructuralcharacterizationMS/MS, IRMPD-MS, IMS
Medicinal chemistry
Medicinal chemistry
Medicinal chemistry
DOLCETarget qualitycontrol
The Use of MS for Drug Development

Detection of complex formation
• compute Kd from the amount of free ligand
• compute the Kd from the amount of complex (difficult for large proteins, for which there is an extensive envelope due to the different isotopomers)
• x-axis: mass of complex; y-axis: amount of complex formation
• does not require labeling of the target or ligand, uses microgram quantities
• allows simultaneous detection of more than one binder and hence is compatible with complex ligand mixtures (e.g. from combinatorial libraries
• useful to identify off-target proteins, e.g. human serum albumin

Determination of the Kd of receptor-ligand complexesSH
2–X/
tota
l SH
2
Total [X] (μM)
1.0
0.2
0.4
0.6
0.8
0806040200
N-1480 GIXXX259X GIXXX334X GIXXX563A
•titration of an inhibitor to the Src-SH2 protein. Increasing quantities of the inhibitor X were added to the protein, and the percentage of complex formation computed from the intensities of the complex mass peak
SAR by MS•two fragments binding to different binding sites of the protein can be recognized from the mass of the ternary complex.

Ligand Screening by MS
m/z
m/z
m/z
300 320 340 360 380 400 420280
350 400
399 400
327.0 327.5
3,000 3,500 4,000300
3,250 3,270 3,2903,230
a
b
c
M9– + Zn(II)
M9– + Zn(II) + LeuM9– + Zn(II) + Phe
M9– + Zn(II)
M8– + Zn(II)
9×Gly– Ser–
Phe–
Leu–
Gln–
Lys–Glu–
1×
Gln––89 Gln––72Lys––72
Glu––18
Precursors
O
AA-NH-CH 2-CH 2-COOHH2NS
O
O
Amino acid: Gly, Ser, Leu, Gln, Lys, Glu or Phe
•mixture of carbonic anhydrase (CAH) with Zn and a mixture of potential ligands
•Collision-activated dissociation (CAD; collision of molecules in the gas phase with ions) is used to dissociate the complex into the individual components
•subsequent fragmentation allows to identify the individual components by tandem MS

70
Analytical Ultracentrifugation

• Sedimentation in a gravitational field separates molecules in a non-destructive manner.
• In a AUC experiment movement of molecules in a gravitational field are monitored by measuring some optical property across the sample volume.
• sedimentation velocity simply separates molecules in a time-dependent manner based on their molecular weight, shape and size.
• sedimentation equilibrium delivers information on thermodynamics of (self/hetero) association, stoichiometries of complexes and solution non-ideality.
71

buoyant force
Fd=friction force in equilibrium: Fc + Fb + Fd = 0
(msolv mass of displaced solvent)
centrifugal force Fc =ω2rm
Fb = −ω 2rmsolv
(ν partial volume, ρ = sol. density (Archimedes))msolv = mvρ
ω 2rm(1− vρ)− Fd = 0
Sedimentation

the frictional force is proportional to the velocity at which the particle is dragged through solution
Fd = fov
ω 2rm(1− vρ)− fv = 0so that
m(1− vρ)f
= vω 2r
rearranging to separate experimental and molecular quantities yields
Sedimentation

• For a given particle, sedimentation is proportional to the particle’s size.
• It is also proportional to the difference between the density of the particle and the density of the liquid medium.
• It is zero when the density of the particle is equal to the density of the liquid medium.
• It decreases as the viscosity of the liquid medium increases.
• It increases as the force field increases.
the sedimentation coefficient describes the velocity in the gravitational field normalized by the strength of the gravitational field
s = 1ω 2r
∂r∂t
s = vω 2r
The sedimentation coefficient
Sedimentation coefficients are usually expressed in Svedbergs [S], or 10-13 s. A particle whose sedimentation coefficient is measured as 10-12 s (10 S) is therefore often described as a 10S particle.

75
Radius (cm)
rmid
Center ofRotation
Miniscus Boundary
Conc
entr
atio
n
76
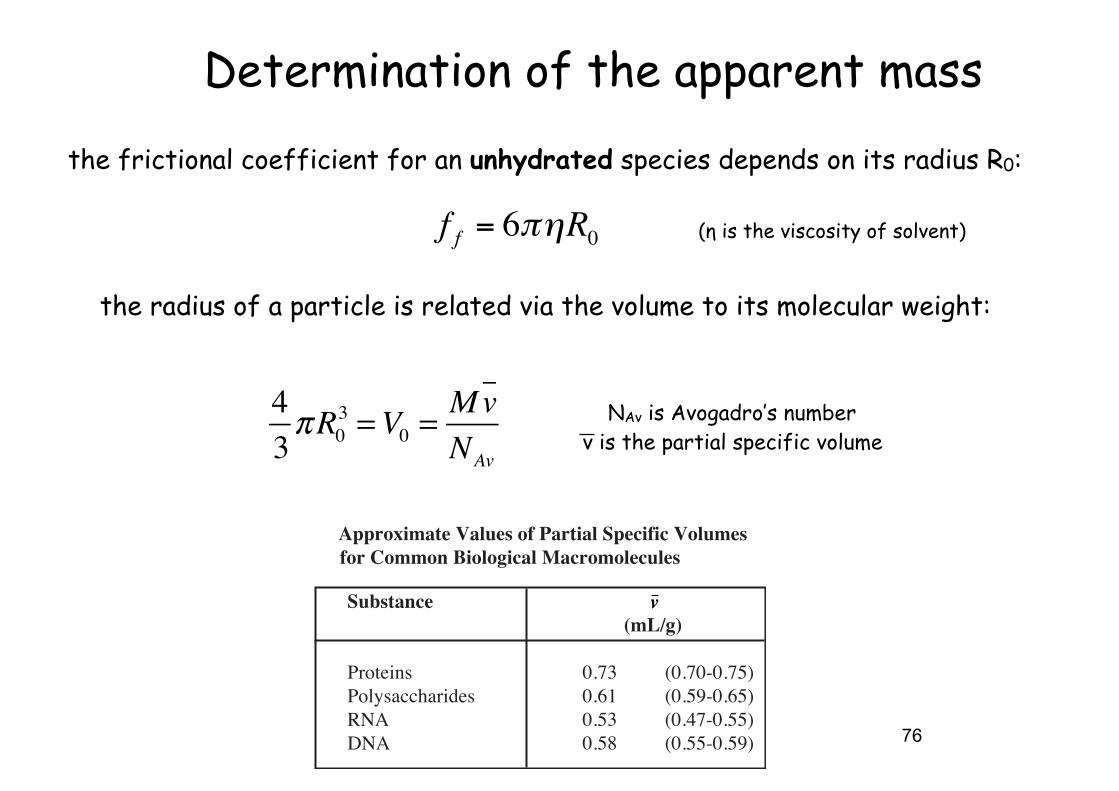
Determination of the apparent mass
the radius of a particle is related via the volume to its molecular weight:
Approximate Values of Partial Specific Volumesfor Common Biological Macromolecules
Substance v(mL/g)
Proteins 0.73 (0.70-0.75)Polysaccharides 0.61 (0.59-0.65)RNA 0.53 (0.47-0.55)DNA 0.58 (0.55-0.59)
NAν is Avogadro’s numberv is the partial specific volume
the frictional coefficient for an unhydrated species depends on its radius R0:
€
f f = 6πηR0 (η is the viscosity of solvent)
43πR0
3 =V0 =MvNAv

77
this allows to deduce the mass from the sedimentation coefficient:
€
s =M 2 / 3(1−ν ρ)
6πηNAv2 / 3(3/4π )1/ 3ν 1/ 3
(ρ and η are the density and viscosity of solvent)
sedimentation coefficients are concentration, temperature and solvent dependent !
v = 2rs2 (ρs − ρsolv )9η
F = 2rs2 (ρs − ρsolv )9η
ω 2r
sedimentation velocity
rs = radius of particler = position of particle

• verifying whether a sample is entirely homogeneous in mass and conformation
• detecting aggregates in protein samples and quantifying the amount of aggregate
• comparing the conformations for samples from different lots, manufacturing processes, or expression systems (comparability studies), or comparing different mutants of the same protein
• establishing whether the native state of a protein is a monomer, dimer, trimer, etc
• determining the overall shape of non-glycosylated protein molecules in solution (are they approximately spherical or highly extended and rod-like?)
• measuring the distribution of sizes in samples which contain a very broad range of sizes
• detecting changes in protein conformation, for example partial unfolding or transitions to "molten globule" states
• studying the formation and stoichiometry of tight complexes between proteins (for example receptor-ligand or antigen-antibody complexes)
78
Sedimentation velocity is particularly valuable for:

79
one species
two species
time 0 time 1 time 2 time 0+1+2
Sedimentation velocity

•These drugs all induce tubulin oligomers that sediment more rapidly than tubulin alone. •The effects of the various drugs are distinct. •Mathematical analyses indicate the presence of two predominant, oligomeric species in the presence of hemiasterlin and vinblastine.
• establishing whether the native state of a protein is a monomer, dimer, trimer, etc.
• measuring the equilibrium constant (Kd) for association of proteins which reversibly self-associate to form oligomers
• measuring the stoichiometry of complexes between two or more different proteins (e.g. a soluble receptor and its ligand or an antigen-antibody pair), or between a protein and a non-protein ligand
• measuring the equilibrium constants for reversible protein-protein and protein-ligand interactions (approximate Kd range 1 nanomolar to 1 millimolar)
81
Sedimentation equilibrium is particularly valuable for:
82
Isothermal Titration Calorimetry
J.B. Chaires, Calorimetry and Thermodynamics in Drug Design, Annu. Rev. Biophys. 37 (20008), 1335-151.
E. Freire, Do enthalpy and entropy distinguish first in class from best in class?, Drug Discov. Today 13 (2008), 869-874.

Principle of ITC
• ITC measures directly the energy associated with a reaction triggered by mixing of two components.
• The reaction created by each injection of ligand releases or absorbs a certain amount of energy proportional to the binding enthalpy and the binding stoichiometry
• Modern instruments operate on a heat compensation principle, and the instrumental response is the amount of power (microcalories/sec) necessary to maintain constant temperature.
• Because the amount of non-complexed target decreased with time the magnitude of the peaks become smaller with time.
qi=v ✕ ΔH ✕ ΔL (v is the volume of the reaction cell, ΔH the binding enthalpy, and ΔL the increase in concentration of bound ligand)

0 20 40 60 80 100 120 140 160 180 200 220
Time (min)
μca
l/se
c
–2.5
–2.0
–1.5
–1.0
–0.5
0.0
0.5
Current Opinion in Structural Biology
Leavitt & Freire, Curr. Opin. Struct. Biol. 2001, 11:560–566

85
from integration of the data the total binding enthalpy (ΔH) and the association constant Ka can be derived

0 20 40 60 80 100 120
Ka = 1E6 M–1
c = 50
Ka = 1E8 M–1
c = 5000
Ka = 1E12 M–1
c = 5E7
0 20 40 60 80 100 120
Time (min)
0 20 40 60 80 100 120
μcal/sec
–1.8
–1.6
–1.4
–1.2
–1.0
–0.8
–0.6
–0.4
–0.2
0.0
Current Opinion in Structural Biology
direct measurement is limited to association constants Ka of 108 to 109.
Leavitt & Freire, Curr. Opin. Struct. Biol. 2001, 11:560–566

87
0 20 40 60 80 100
0.0
0.5
1.0
0 20 40 60 80 100
0 20 40 60 80 100
Kapp
Ka,w
Ka
KNI-764
–1.0
–0.5
0.0
–1.0
–0.5
0.0
KNI-764Ac-pepstatin
Current Opinion in Structural Biology
this limitation can be overcome by using a competition experiment (titration of the receptor in the presence of a weak ligand with the stronger ligand of interest)
Leavitt & Freire, Curr. Opin. Struct. Biol. 2001, 11:560–566

kcal mol-1
∆G
∆H
-T∆S
-8 -6 -4 -2 0 2
niciburonuaDniciburoxoD
Doxorubicin
Daunorubicin
C14 hydroxyl group
C14 hydroxyl group
Similar Structure and similar binding does not mean identical thermodynamics
J.B. Chaires. Annu. Rev. Biophys. 37 (2008), 1335-151.

Groove binding Intercalation
Hoechst 33258 Daunorubicin
Groove binders Intercalators
-20 -15 -10 -5 0 5 10 15
-30
-25
-20
-15
-10
-5
0
5
10
∆,
H k
cal
om
l-1
-T∆S, kcal mol-1
DNA binders: Groove binding versus intercalation
groove binding is entropically driven, intercalation by large, favorable enthalpy: For intercalation, the DNA must reorganize structurally, this is entropically unfavorable- This is compensated by favorable van der Waals stacking interactions to the base pairs.
J.B. Chaires. Annu. Rev. Biophys. 37 (2008), 1335-151.

Optimizing hydrogen bonds
the position of the hydroxy group on the terminal ring places a potential hydrogen bond donor in different directions in space, change the binding enthalpy
Freire, Drug Discovery Today 13 (2008), 869

Optimizing hydrogen bonds II
In these HIV protease inhibitors replacement of the thioether group by an sulfonyl group results in a strong hydrogen bond with the amide of Asp30B in the HIV protease, improving binding by -3.9 Kcal/mol
ΔG ΔH -TΔS
Freire, Drug Discovery Today 13 (2008), 869

Statins
HIV-protease inhibitors
Ladbury et al., Nature Rev Drug Discov 9 (2010), 23

kJ p
er m
ol
b
∆G∆H–T∆S
Enthalpic Entropic
0
10
20
30
40
a
O2NN O
NOH
O
OO2NN N
O SOH
O
21
Compound 1 Compound 2
Ladbury et al., Nature Rev Drug Discov 9 (2010), 23

5
6
7
8
9
10
-0.25 0.00 0.25 0.50 0.75 1.00
∆H/∆G
log
Ka
Figure 6The enthalpy funnel. Thermodynamic data for the binding of 71plasmepsin inhibitors are shown. The ratio of the binding enthalpy to freeenergy is shown as a function of the logarithm of the association constant.
Entropy-Enthalpy Compensation
a change in enthalpy is compensated by a change in entropy. The main cause originates from structuring region of the protein adjacent to the bonds. Therefore, H-bonds should be aimed at already structured regions.
this figure suggests a rather narrow distribution into enthalpy and entropy for high affinity (approx. one-third enthalpy and two-thirds entropy)
J.B. Chaires. Annu. Rev. Biophys. 37 (2008), 1335-151.
Lessons from ITC
• easy to optimize entropic term
• real improvements come from improved enthalpy
• a measure is the enthalpic efficiency (EE):EE=ΔH/Q (with Q being the number of non-H atoms)
• usually affinity of fragments is not good enough for ITC, no determination of KD is possible. But when using a large excess of receptor, so that all added ligand is bound, enthalpy can still be measured!
• important artifacts: i) participation of water in ligand binding and ii) changes in the protonation states
95

Differential Scanning Calorimetry DSC
96

Principle of DSC
• DSC provides information on the difference in the amount of heat required to increase the temperature of a sample and reference are measured as a function of temperature.
• The basic principle underlying this technique is that, when the sample undergoes a physical transformation such as phase transitions, more (or less) heat will need to flow to it than the reference to maintain both at the same temperature.
• The difference in temperature between the sample and a reference is plotted against the temperature. 40 50 60 70 80 90
0
20
40
60
80
Ee
h ssecxca
pac tayti
Temperature (°C)
∆Cp
Tm

Information from DSC
• purity of compounds • quantification of crystallinity • polymorphism (crystallization into different molecular
arrangements) • degradation, decomposition and stability determinants • glass transitions (when compounds are stored below the
glass transition the rate of crystallization is significantly reduced)
98
40 50 60 70 80 90 100 110
250
500
750
1000
1250
1500
∆H2
E ssecxh
eat
m lack( yticapac
ol-1
)
Temperature (°C)
∆Tm
∆H1
BisanthracyclineWP762 saturated
BisanthracyclineWP762 unsaturated
G1
G3
T4
A5
C6
G7
C8
C10
G9
G15
C14
A13
T12
i11
C2
C16
G1
G3
T4
A5
C6
G7
C8
C10
G9
G15
C14
A13
T12
i11
C2
C16
Daunorubicin
WP631
WP762
-30 -20 -10 0 10 20
kcal mol-1
Freeenergy
Enthalpy
-T∆S
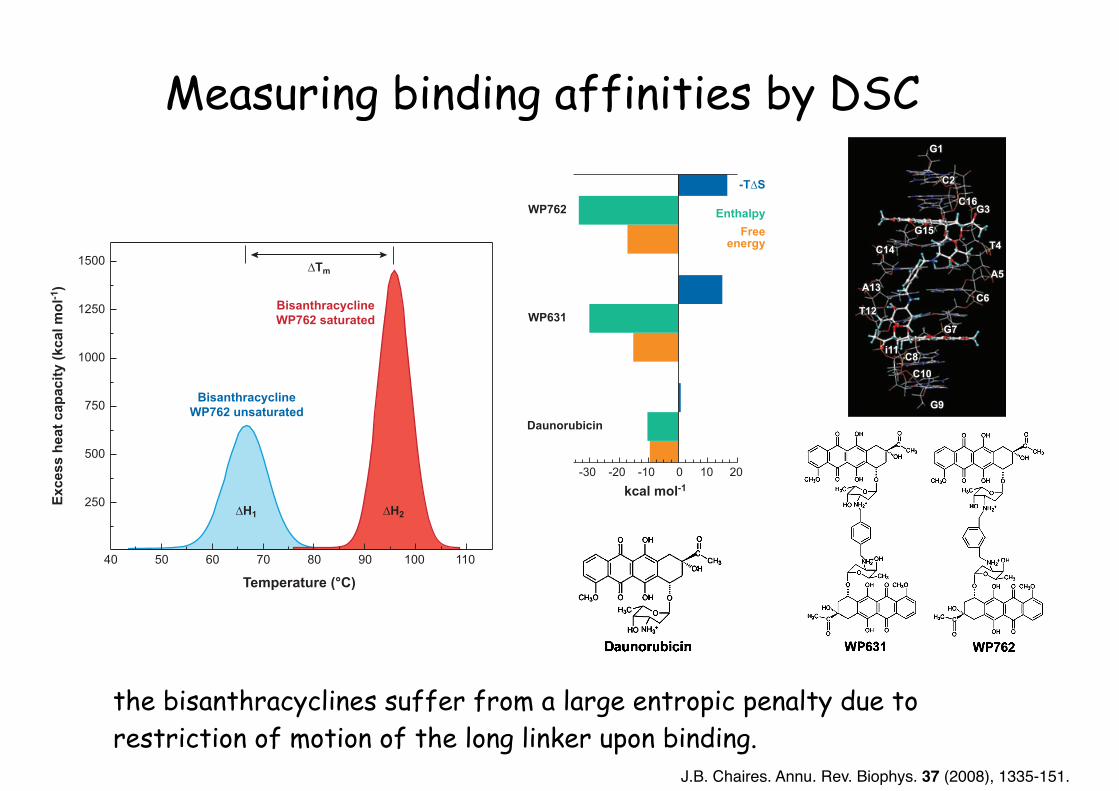
Measuring binding affinities by DSC
the bisanthracyclines suffer from a large entropic penalty due to restriction of motion of the long linker upon binding.
J.B. Chaires. Annu. Rev. Biophys. 37 (2008), 1335-151.

Differential Scanning Fluorimetry: Thermofluor
• Thermofluor gives an optical readout of protein melting as e.g. observed with DSC.
• Optical readout is much more sensitive than direct thermal measurement.
• TF consequently allows parallel measurements in 384 well-plates using fluorescent imaging plate readers.
100

101
Ligand-Induced Thermal Stabilization measured using Fluorescence Readout

102
Ligand-binding may stabilize the protein structure

103
Measurements of energetics of ligand binding

Applications
104
ATP analog library on a kinase
buffer optimization
ligand screening

344 ASSAY and Drug Development Technologies AUGUST 2011
Thermophoresis

• Fluorescently labeled molecules or particles are initially distributed evenly and diffuse freely in solution.
• By switching on the IR-Laser, the molecules experience a thermophoretic force in the temperature gradient and typically move out of the heated spot.
• In the steady state, this molecule flow is counterbalanced by ordinary mass diffusion.
• After turning off the laser, the particles diffuse back to obtain a homogeneous distribution again.
The following stages are recorded for each sample: fluorescence signal before turning the IR laser on, fast temperature-dependent changes in fluorescence intensity, thermophoresis and back diffusion after switching the laser off.
∂χ∂t
= ∇(D∇χ + DTχ(1− χ )∇T
χ conc fraction ∇T temp gradient
D conc. diffusion constantD thermal diffusion constant

Allows to determine Kd and thermodynamic parameters (ΔG,ΔH,ΔS) low quantities are required

Johnson et al, J. Med. Chem. 2017


![Biophysical methods to guide protein crystallization · Biophysical methods to guide protein crystallization ... • DSF • NMR . ... ligand in uM ] ee uM 0.001 0.01 0.1 1 10 100](https://img.pdfslide.us/doc/110x75/5b50989e7f8b9a2f6e8ed9ba/biophysical-methods-to-guide-protein-crystallization-biophysical-methods-to.jpg)