Embed Size (px)
Citation preview

Biophysical Determinants of Photodynamic Therapy and Approaches to
Improve Outcome
Theresa M. Busch, Ph.D.Department of Radiation Oncology
University of Pennsylvania, Philadelphia, PA

What is Photodynamic Therapy?
PDT is a directed, light-based method of damaging malignant or otherwise abnormal tissues.
Image from Wikipedia
How Does it Work?
Energy transfer
3O2
Type 2 Reaction
1O2
Photosensitizer
hv
Photosensitizer3
Oxidation ofOrganic Substrates

How Does it Work?
Mechanisms of PDT action• Direct Cell Effects
• Direct 1O2-mediated toxicity to tumor cells• Indirect Effects
• Vascular damage• During light treatment• Delayed development within several hours after light
treatment• Stimulation of host immune responses.
Cell death may occur by apoptosis, necrosis, and/or autophagy
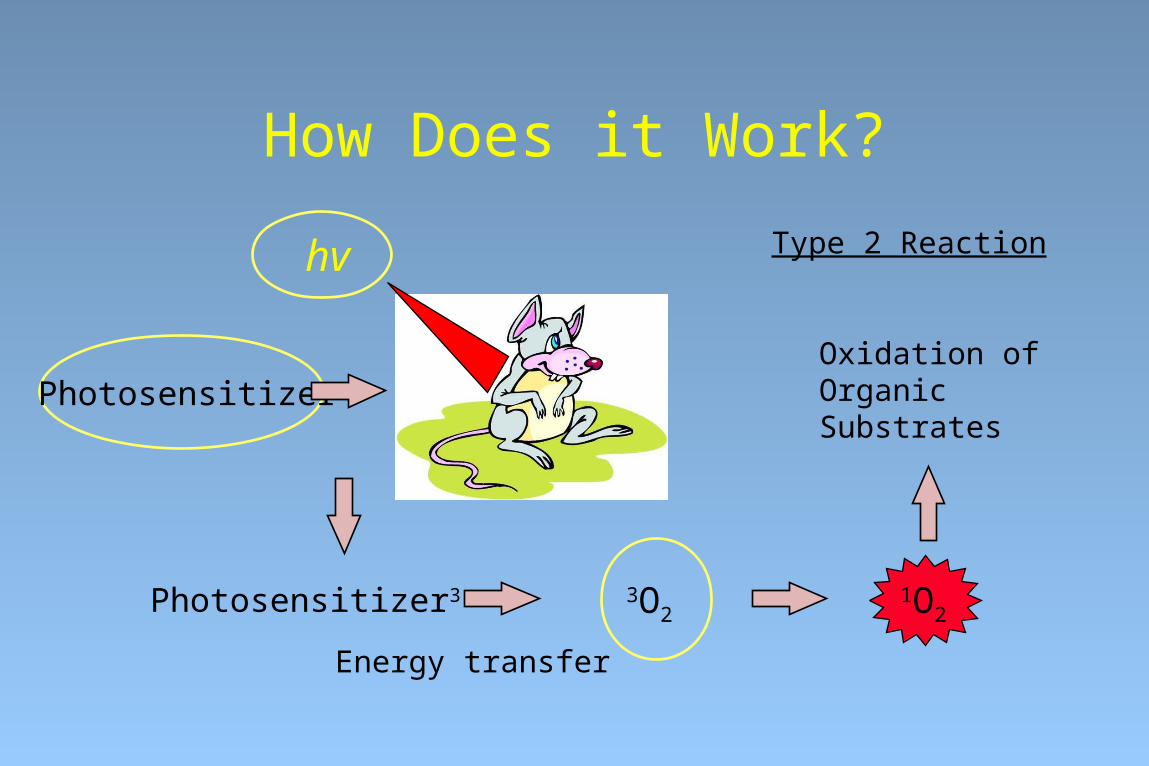
PDT Variables Photosensitizer
• Drug type• Dose• Drug-light interval
Light Delivery• Wavelength• Fluence• Fluence rate
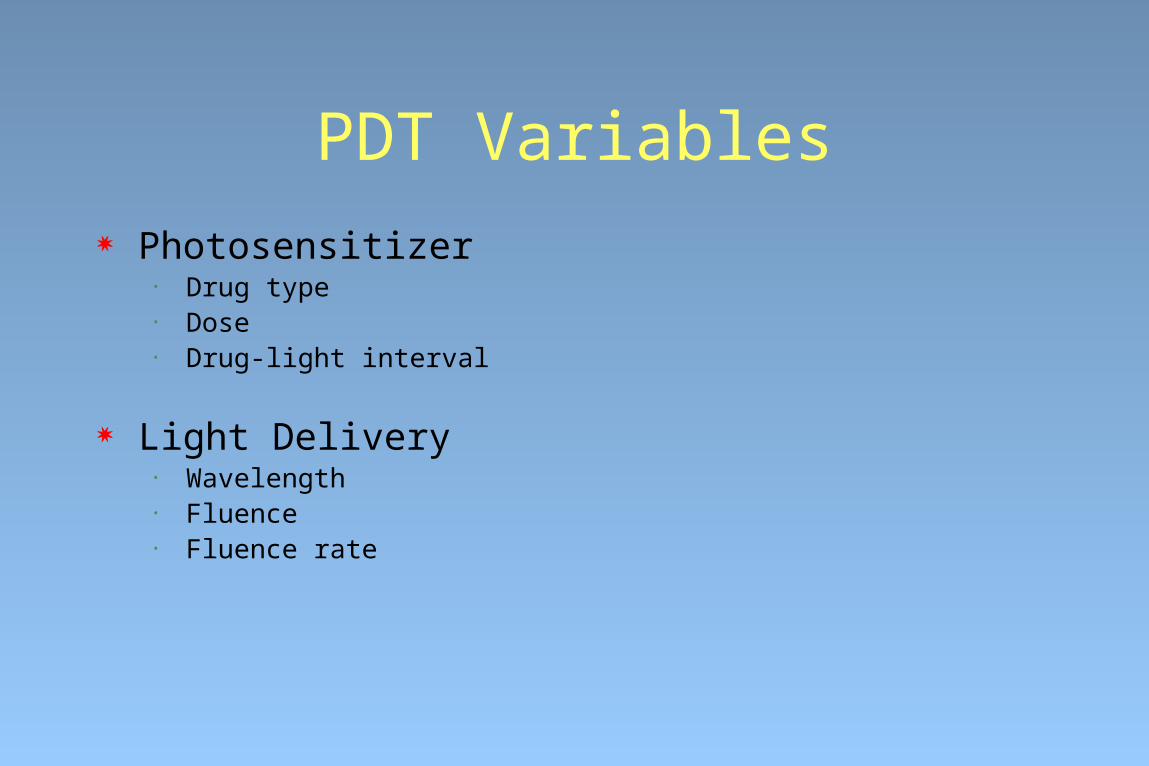
What is it used for?FDA-Approved Indications (Oncology)
Obstructive esophageal cancer* Obstructive endobronchial lung
cancer* Microinvasive endobronchial lung
cancer Actinic keratosis Barrett’s esophagus/ high grade
dysplasia
*for palliative intent
Clinical Trials
Pleural spread of nonsmall cell lung cancer
Mesothelioma Intraperitoneal malignant tumors Head and Neck- pre-malignant through
advanced disease Brain tumors Skin cancer Prostate cancer

Heterogeneity in PDT
• Photosensitizer distribution• Tissue optical properties (light
distribution)• Microenvironment
• Tumor oxygenation• Vascular network

Heterogeneity in Photosensitizer Uptake:
A Lesson From the Intraperitoneal PDT Clinical Trial
Tissue Site Photofrin® Concentration (ng/mg) Normal
Median (Range, N) Tumor
Median (Range, N) Appendix 3.95(NA, N=1) NA
Fat 1.21(0.5-1.8, N=11) 4.25(4.0-4.5, N=2)
Gall Bladder 3.51(3.2-3.8, N=2) NA
Mucosa (Large Intestine) 5.75(4.8-6.7, N=2) NA
Large Intestine with mucosa 2.62(1.2-4.4, N=12) NA
Large Intestine without
mucosa
1.77(0.9-2.7, N=4) NA
Left Upper Quadrant NA 3.07(NA, N=1)
Liver 36.9(34.9-38.9, N=2) 1.71(NA, N=1)
Mesentery 2.68(NA, N=1) 2.87(2.0-4.9, N=5)
Muscle 0.82(NA, N=1) NA
Omental Bursa 0.96(0.3-3.0, N=15) 3.91(1.5-4.2, N=4)
Other 1.70(1.4-2.0, N=6) 2.06(0.4-6.0, N=37)
Pancreas 1.70(1.4-2.0, N=2) NA
Pelvis NA 3.54(NA, N=1)
Peritoneum 3.60(NA, N=1) 2.93(0.6-5.3, N=2)
Mucosa (Small Intestine) 3.61(2.6-4.3, N=4) NA
Small Intestine with mucosa 2.99(0.3-11.9, N=23) NA
Small Intestine without
mucosa
1.94(0.8-2.8, N=5) 0.66(NA, N=1)
Skin 0.91(0.3-2.3, N=4) NA
Spleen 21.5(15.7-23.2, N=3) 4.71(3.8-5.6, N=2)
Stomach 2.4(1.0-2.5, N=3) 2.95(1.9-4.0, N=2)
Hahn SM, et al. Clin Cancer Res 12:5464-70, 2006

How about light distribution?

Light absorption and scattering affects the fluence rate seen by the tissue.
Nor
mal
ized
flue
nce
rate
Distance (mm)
Tumor surface
3 mm depth
75 mW/cm2
630 nm

The tumor microenvironment is highly heterogeneous….
Busch TM, et al. Clin. Cancer Res. 10: 4630–4638, 2004

…. and PDT exacerbates heterogeneity in hypoxia
distribution
Control RIF Tumor During PDT5 mg/kg Photofrin
135 J/cm2, 75 mW/cm2
Busch TM, et al. Cancer Res. 62:, 7273-7279, 2002

Heterogeneity AboundsSo what to do?
ModifyModify
MonitorMonitor

Approach 1: Modify Light Delivery
Rationale: Lowering PDT fluence rate reduces the rate of
photochemical oxygen consumption. Better maintenance of tumor oxygenation during
illumination. Improves long-term tumor responses
Enhanced direct cell kill Enhanced vascular shutdown in the treatment field
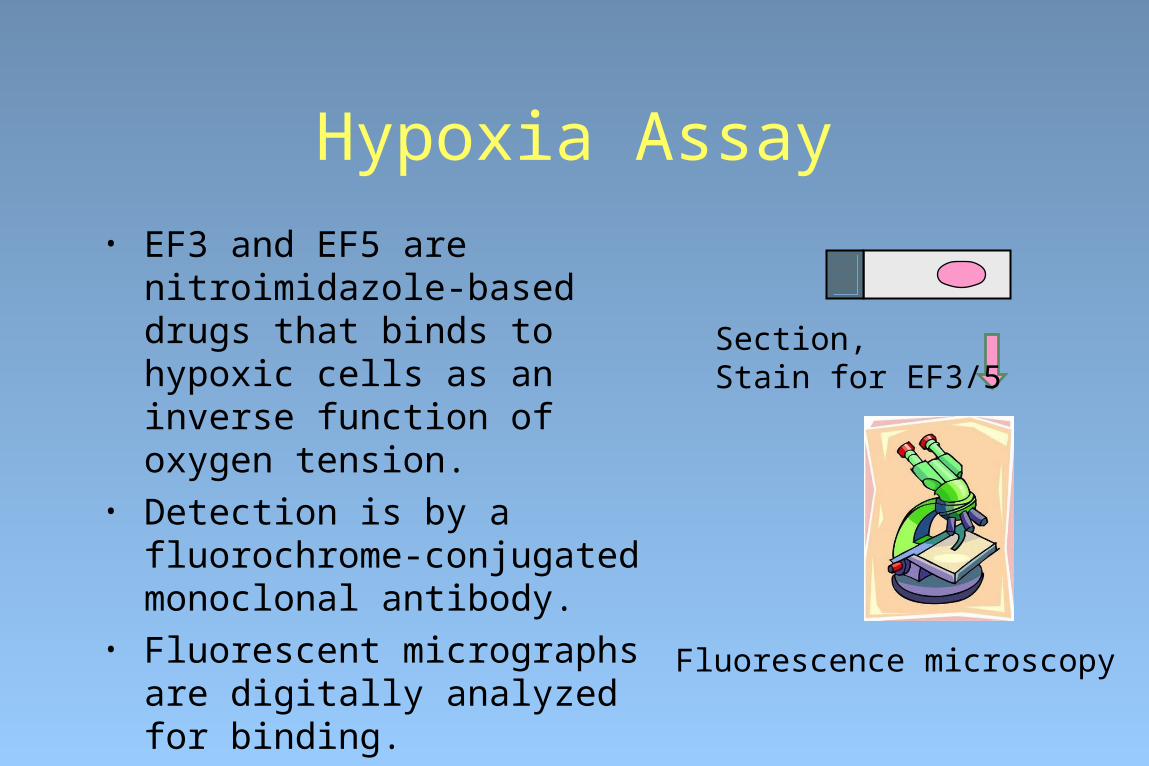
Hypoxia Assay• EF3 and EF5 are nitroimidazole-
based drugs that binds to hypoxic cells as an inverse function of oxygen tension.
• Detection is by a fluorochrome-conjugated monoclonal antibody.
• Fluorescent micrographs are digitally analyzed for binding.
Section,Stain for EF3/5
Fluorescence microscopy

Labeling of Hypoxia during PDT• RIF murine tumor • EF3 at 52 mg/kg• Treated animals receive
Photofrin-PDT at 75 or 38 mW/cm2, 135 J/cm2
• Hoechst 33342 at 1.5 min before tumor excision
• Cryosectioning, immunohistochemistry, fluorescence microscopy
EF3
Hoechst
Hoechst (perfusion)Anti-EF3Anti-CD31Hoechst (tissue label)
PDT

Fluence rate effects on PDT-created hypoxia
0
50
100
150
Controls PDT
Surf Deep Surf Deep
38 mW/cm2
0
50
100
150
Controls PDT
Surf Deep Surf Deep
75 mW/cm2
EF
3 B
ind
ing
EF
3 B
ind
ing

Low fluence rate reduces intratumor heterogeneity in PDT-created hypoxia
0
0.5
1
1.5
2
2.5
3
Regional heterogeneity in EF3 bindingTumor Light PDT-75 PDT-38
*
*p<0.05 for a depth-dependent increase in hypoxia (one sided signed rank test)

Causes of depth-dependent hypoxia during PDT
Light distribution?
Nor
mal
ized
flue
nce
rate
Distance (mm)
Tumor surface
3 mm depth

Causes of depth-dependent hypoxia during PDT
Photosensitizer distribution?
0
2.5
5
7.5
10
12.5
Pho
tofr
in U
ptak
e (n
g/m
g)S D
Causes of depth-dependent hypoxia during PDT
Does not appear to be a result of photochemical oxygen consumption.
How about PDT-induced vascular effects?

Getting at heterogeneity in vascular response during PDT
• Diffuse Correlation Spectroscopy • Measures the temporal correlation of
fluctuations in the intensity of transmitted light (785 nm) to provide information on the motion of tissue scatters, e.g. red blood cells
• Data used to calculate relative blood flow, i.e. flow normalized to a pre-treatment baseline
• Monitoring throughout PDT is facilitated by a non-contact camera probe equipped with optical filters to block the 630 nm treatment light
• Separation distance between unique source-detector pairs determines the depth of tissue probed.
-0.4 -0.2 0 0.2 0.4-0.4
-0.2
0
0.2
0.4
cm
cm
1 2
3 4
5
6 7
8
9
10 11
12
13 I III
IV
II
Distance (mm)
sourcesdetectors

Substantial intratumor heterogeneity exists in PDT-created
vascular effects
0
0.5
1
1.5
2
2.5
-1000 0 1000 2000 3000
Normalized blood flow
Time (s)
PDT • PDT induces an initial increase in blood flow.
• PDT leads to significant depth-dependent intratumor heterogeneity in blood flow response during illumination.

Intratumor heterogeneity in vascular effects (controls)
0
0.5
1
1.5
2
2.5
-1000 0 1000 2000 3000Time (s)
Light
0
0.5
1
1.5
2
2.5
-1000 0 1000 2000 3000Time (s)
Light

Lower fluence rate reduces intratumor heterogeneity in relative blood flow during
PDT
Max rbf Max time (s) Min rbf Min time (s) CV (%) % of values
0.75-1.00
75 mW/cm2 1.72 ± 0.13 325 ± 57 0.47 ± 0.7 1195 ± 172 15 ± 3 13 ± 2
38 mW/cm2 1.76 ± 0.19 752 ± 175* 0.31 ± 0.03* 1647 ± 249 9 ± 1* 26 ± 5*
0
0.5
1
1.5
2
2.5
0 2000 4000Time (s)
PDT
0
0.5
1
1.5
2
2.5
-1000 0 1000 2000 3000
Normalized blood flow
Time (s)
PDT

Low fluence rate reduces intratumor heterogeneity in cytotoxic response.
0
10
20
30
40
50
60
****
Tumor Photofrin Light PDT- 0 h PDT- 2.5 h
38 mW/cm2
01 02 03 04 05 06 0***L ig h t P D T - 0 h P D T - 2 .5 h P D T - 8 h7 5 m W /c m2
0
10
20
30
40
50
60
* **
Light PDT- 0 h PDT- 2.5 h PDT- 8 h
75 mW/cm2

Low fluence rate improves long-term tumor response
% o
f an
imal
s w
ith t
umor
s <
400
mm
3
Lowering PDT fluence rate improves therapeutic outcome (summary)
Delivering a light dose more slowly provides Less intra-tumor heterogeneity in PDT-created
hypoxia during illumination Less intra-tumor heterogeneity in vascular
responses during illumination Greater direct cell kill of tumor cells Better long-term treatment response

Heterogeneity AboundsSo what to do?
ModifyModify
MonitorMonitor

Monitoring: Rationale
• PDT can create significant hypoxia in even vascular-adjacent tumor cells.
• Vascular monitoring, including oxygenation and/or blood flow, may be indicative of tumor response.

Monitoring: MethodsDiffuse optical spectroscopy
• Broadband reflectance spectroscopy with a noninvasive probe• Measures tissue optical properties in the range of 600-800 nm• Data used to calculate concentrations of oxyhemoglobin (HbO2) and deoxyhemoglobin
(Hb)• Tissue hemoglobin oxygen saturation (SO2 or StO2) = [HbO2]/[HbO2 + Hb]• In mouse tissues SO2 of 50% at pO2 of 40 mmHg
• Diffuse correlation spectroscopy with a non-contact probe• Measures temporal fluctuations in transmitted light (785 nm) to provide information on the
motion of tissue scatters, e.g. red blood cells • Data used to calculate relative blood flow, i.e. flow normalized to a pre-treatment baseline• Monitoring throughout PDT is facilitated by a non-contact camera probe equipped with
optical filters to block the 630 nm treatment light

PDT induces variable changes in tumor hemoglobin oxygen saturation
0
10
20
30
40
50
SO
2 (%
)
Before PDT After PDT
0 h 3 h

Pre- or post-PDT SO2 is not associated with tumor response
0
5
10
15
20
25
0 5 10 15 20 25 30 35 40
SO2 before PDT(%)
Tim
e-to
-400
mm
3 (d
ays)
0
5
10
15
20
25
0 5 10 15 20 25 30 35 40
SO2 after PDT (%)
Tim
e-to
-400
mm
3 (d
ays)

The PDT-induced change in SO2 in individual tumors is highly predictive of
response
0
5
10
15
20
25
0 0.5 1 1.5 2 2.5
y = 4.6034 + 9.4039x R 2= 0.72999
Relative-SO2
Tim
e-to
-400
mm
3 (d
ays)
Relative SO2=
SO2 after PDT
SO2 before PDT
Wang H-W, et al. Cancer Res. 64(20):7553-7561, 2004

The PDT-induced change in blood flow is highly predictive of response
0
0.5
1
1.5
2
2.5
-1000 0 1000 2000 3000
relative blood flow
Time (s)
PDT
Slope of decrease in blood flow
Tim
e to
a t
umor
vol
ume
of
400
mm
3 (d
ays)
Yu G, et al. Clin Cancer Res. 11:3543-52, 2005
Monitoring (Summary)
• Pre-existing tumor SO2 of similarly-sized tumors of the same line can be highly heterogeneous.
• PDT-induced changes in SO2 and blood flow can vary from tumor-to-tumor, even for the same PDT treatment conditions.
• Individualized measurement of PDT effect on blood flow or blood oxygenation in a given tumor is predictive of long term response in that animal.• Changes associated with better maintenance of tumor oxygen (smaller PDT-
induced decreases in SO2 or blood flow) lead to better tumor response.
• Diffuse optical spectroscopy, can be readily applied in the clinic and thereby may provide a means for the rapid, individualized assessment of PDT outcome.
Conclusions• Both and clinical and preclinical studies indicate that
tumors can be characterized by substantial heterogeneity in the essential components of PDT.
• MODIFICATION (e.g. light delivery or tumor microenvironment) can be used reduce physiologic, hemodynamic, and cytotoxic heterogeneity.
• MONITORING offers potential to optimize treatment through individualized, real-time dosimetry based on hemodynamic responses.

PDT at PennLaser Specialist/ManagerCarmen Rodriguez
BiostatisticsRosie MickMary Putt
Radiation OncologyEli GlatsteinStephen HahnRobert LustigJames MetzHarry QuonNeha VapiwalaKeith Cengel
Veterinary MedicineLilly DudaJolaine Wilson
SurgeryDouglas FrakerJoseph FriedbergScott CowanBert O’MalleyS. Bruce MalkowiczAra Chalian
Nursing CoordinatorsDebbie SmithSusan PrendergastMelissa Culligan
MedicineDan StermanColin GilespieAndrew HaasGregory Ginsberg
PhysicistsTimothy ZhuJarod FinlayAndreea DiMofte
Pre-clinical ResearchersTheresa BuschSydney EvansCameron KochStephen TuttleKeith CengelArjun YodhXioaman Xing
DermatologySteve Fakharzadeh

AcknowledgementsRadiation OncologySteve Hahn Eli GlatsteinKeith CengelCameron KochSydney Evans
Statistics/Image AnalysisE. Paul WileytoMary PuttKevin Jenkins
Physics and AstronomyArjun Yodh Xiaoman XingGuoqiang YuHsing-Wen Wang
Medical PhysicsTimothy ZhuJarod FinlayKen WangCarmen RodriguezAndreea Dimofte
Busch labElizabeth RickterShirron CarterMin YuanAmanda Maas
Grant Support (NIH)R01 CA 85831P01 CA 87971