Embed Size (px)
Citation preview
5 Fractal Mechanisms inCoagulation/Flocculation Processesin Environmental Systems
Jean Yves Bottero, Armand Masion and Jérôme RoseCEREGE UMR 6635 CNRS-UPCAM, Europole de l’Arbois, BP 80, 13545 Aix-en-Provence,Cedex 04, France
5.1 INTRODUCTION
In aquatic media, coagulation–flocculation is a very general process that consistsin the formation of aggregates under various constraints. The forces of aggregateformation are generally due to the modification of surface chemistry by the addi-tion of chemical species that favor either ‘bridge’ formation among the particles or‘chemical patches’ on the surface that decrease the repulsive energy or increase theattractive energy between particles. Most often, the term ‘coagulation’ is used to referto surface processes occurring at the beginning of aggregate formation. Coagulantsare chemicals that are able to modify the surface properties of the initial particlesby adsorption/complexation. Surface properties are modified by changes in the sur-face charge, the diffuse-layer charge or thickness and the hydrophilic–hydrophobicbalance. The consequences of such molecular-scale changes can be the formation ofaggregates and flocs, which are defined here as very large aggregates.
The formation of fractal micro- or macro-aggregates starts at the molecular level.For example, the hydrolysis and growth of Al(III) or Fe(III) species far from thermo-dynamic equilibrium leads to the formation of aggregates when water molecules inthe hydration sphere are deprotonated or displaced by hydroxyl ions. Furthermore,H2O and OH can be exchanged by other ligands whose nature has a direct influenceon aggregate structure.
The aggregation of small, micrometer-sized, subunits to form large aggregates isgenerally determined by properties such as surface charge and coverage. In caseswhere charge heterogeneity is important, e.g. aggregation of clays, the aggregatestructure is dominated by shape anisotropy. The basic theory describing the interactionof charged surfaces is known as the Derjarguin, Landau, Verwey, Overbeck (DLVO)theory [1–3]. It is based upon the determination of two main forces: electrostatic
Biophysical Chemistry of Fractal Structures and Processes in Environmental SystemsEdited by Nicola Senesi and Kevin J. Wilkinson© 2008 IUPAC. ISBN: 978-0-470-01474-5
150 FRACTAL MECHANISMS IN COAGULATION/FLOCCULATION
repulsion between the surfaces with a maximum repulsion at a definite gap width andattraction due to van der Waals forces at small distances.
Two parameters are particularly interesting for describing flocs, i.e. size distributionand structure. Floc structure can be described on various size scales: from molecular tomacroscopic. One universal concept used to describe structure is the fractal dimension.The theoretical basis and the experimental evidence for fractals evolved a great deal inthe 1980s [4–7].An important example is related to the formation of fractal aggregatesin aquatic media (natural or industrial), with some consequences (not developed inthis chapter) on the settling velocity [8], bacterial activity and water treatment [9–14].In waters and wastewaters, aggregate structure influences sludge dehydration, flocsettling velocities and head loss across packed beds [15, 16]. Aggregation kineticsdepend on the fractal structure of aggregates, not only for geometrical reasons, but alsodue to the impact on hydrodynamic interactions between permeable aggregates [17].This latter aspect is certainly the most complex and is not yet totally resolved.
The parameter used to describe the structure of fractal aggregates is the fractaldimension Df [4–8]. This parameter is directly associated with the dimension of theobject, and is different from the space dimension in which the object is contained [18].The relationship between Df and the aggregate geometry as described by the volumeV and radius R is given by
V ∼ RDf (5.1)
The most common techniques that are used to measure fractal dimensions ofaggregates in solution are scattering techniques (visible light, neutrons and X-rays);see Chapter 2. These techniques allow the calculation of the so-called distributionfunction P (r), which scales as a power law of the distance r within a fractal object:
P (r) ∼ rDf −d (5.2)
where d is the space dimension containing the fractal object and P (r) = 0 whenr > 2R, i.e. the diameter of the aggregate.
This chapter is aimed at illustrating the mechanisms of fractal aggregate formationin environmental systems, including rivers, lakes, soils and industrial systems (e.g.water and wastewater treatment plants). In these systems, the formation of fractalaggregates is controlled by different mechanisms that must be analyzed at differentlength scales that range from nano- to meso- and macro-scales. In addition, when thesubunits are in the submicrometer size range, structure analysis must also take intoaccount additional aspects such as multiple scattering. Two examples have been selec-ted to illustrate these systems. The first examines aggregate formation by hydrolysis ofFe(III) ions and the role of ‘strong’and ‘weak’ ligands in orienting aggregate structureat microscales.Aspecial investigation of the nanoscale–mesoscale relationship is alsodeveloped. The second example addresses the formation of very large aggregates thatoriginate from micrometer-sized subunits. These aggregates are commonly formedin soils and natural water bodies, and in industrial water and wastewater facilities.
JEAN YVES BOTTERO, ARMAND MASION AND JÉRÔME ROSE 151
5.2 TECHNIQUES
5.2.1 Small-Angle X-Ray Scattering
Small-angle X-ray scattering (SAXS) has been shown to be the best tool to investigateaggregate size and structure parameters for suspensions of very small colloids. At thelargest values of the scattering vector q, information on the shape, size and polydis-persity of the subunits/nuclei can be obtained. In the case of fractal aggregates, Df
can be easily derived from the scattering intensity I (q), according to
I (q) = F (q)S(q) (5.3)
where F(q), called the form factor, is the scattering by the subunits/nuclei, and S(q)
is the interference function describing the arrangement of subunits within the aggreg-ate. For a fractal aggregate, S(q) scales as q−Df . Thus, a rigorous determination ofDf implies that the subunits are well characterized. Another parameter of structuralinterest that can be derived from the SAXS curve is the pair distribution function,P (r). It can be obtained from the correlation function γ (r), which is calculated fromthe Fourier transform of IN(q) of the normalized intensity:
γ (r) = �2
2
∫q2IN(q)
sin(qr)
qrdq (5.4)
In this case, P (r) = r2γ (r). The form of P (r) provides information on the size andshape of the aggregate and the coordination number of the particles in the aggregates.
5.2.2 Light Scattering
5.2.2.1 Homogeneous particles
Dynamic light scattering allows measurement of the translational diffusion coefficientDT of particles. For noninteracting particles, the first-order autocorrelation functiong(r) is directly proportional to DT. Polydisperse systems are analyzed using themethod of cumulants, in which a distribution of exponential terms C(r) is assumed:
C(r) = F (�) exp(−�r) d� (5.5)
where � = DTq2, q = 4πn sin(θ/2)/λ, θ is the scattering angle, n is the optical indexand λ is the wavelength of the incident beam.
The function F(�) is expanded in a power series of r . The first moment (cumulant)in the expansion is the average decay constant �avg, which defines an effective diffu-sion coefficient DT for the particle size distribution. DT is converted to the effectivehydrodynamic radius rH using the Stokes–Einstein relationship.
5.2.2.2 Fractal aggregates
If the size of the subunits is less than λ/20, then the fractal dimension Df can becalculated using the same law as for SAXS. In this case, Df is defined in an angular
152 FRACTAL MECHANISMS IN COAGULATION/FLOCCULATION
domain which varies from the size of the subunit to the size of the aggregate. However,if the size of the subunits is not very different from λ, then multiple scattering cannotbe neglected. With respect to this point, Botet et al. [19] recently developed a newscattering model, called the mean-field approximation, which accounts for multiplescattering where the size of the scatterer is close to the scattering wavelength. Theseauthors analyzed the multiple scattering results of Xu [20] by mean-field theory usingMie theory for fractal aggregates. Mean-field scattering provides solutions that areable to describe multiple scattering far from the optical resonance where the Rayleighapproximation is not consistent.
An extension of this approach takes multiple scattering into account by introducinga new parameter, the mean optical index n [21]. This term characterizes the meanoptical environment of scatterers belonging to a fractal object. In fractal aggregates,the optical contrast is defined as the optical contrast between scatterers ns and theirmean environment n, with the scatterers’ mean optical contrast denoted as ns/n.The form factor F(q) is thus defined by this new optical contrast. On the basis ofEquation (5.3), the scattered intensity I (q) depends on the mean optical contrast ofthe scatterer. Therefore, I (q) contains structural information not only through S(q),but also through the mean optical contrast that depends on the aggregate structure. Inthis case, the form factor F (q) can be calculated using the approximation
Iscatt(q) ∝ I rs,ns/n(q)S(q) (5.6)
where I rs,ns/n(q) is the Mie angular scattered intensity of a primary particle belongingto a fractal geometry characterized by a mean optical index n which follows themean-field approximation. The initial optical contrast m = ns/nm is replaced by thescatterers’ mean optical contrast ns/n, defined with respect to the mean environmentof the scatterers inside the aggregate.
The electromagnetic mean-field has been expressed by the coefficients d(1)
1,nand
d(2)
1,n, used as the renormalized Mie coefficients an and bn [19–21]. These new coef-
ficients express the mean field scattered by a particle within an aggregate. They areindependent of the position of the particle inside the aggregate and take into accountthe mean environment of the scatterers in a fractal aggregate. Far from the aggregate,each particle of a given cluster is assumed to radiate the same electromagnetic field,
except for its phase. The coefficients d(1)
1,nand d
(2)
1,nare expressed in terms of fractal
and optical characteristics (an, bn) using the notations of Botet et al. [19]:
d(1)
1,n= an
1 + 2L∞∑
ν=1
(2ν + 1)an
(5.7)
d(2)
1,n= bn
1 + 2L∞∑
ν=1
(2ν + 1)bn
(5.8)
JEAN YVES BOTTERO, ARMAND MASION AND JÉRÔME ROSE 153
where
L = c2/Df �[1 − (2/Df )]4
N
(kRg)2
k is the wave number, ν is a positive integer, Rg, is the radius of gyration, N is thenumber of subunits inside the aggregate, and the fractal dimension of the aggregateis greater than two. The parameters Df , Rg, and N are directly related to the opticalparameters.
5.3 NUCLEATION–PRECIPITATION OF FRESH IRONOXYHYDROXIDES
Over the years, the precipitation of iron oxides and hydroxides from acidic solu-tions has received considerable attention in various fields, such as catalyst synthesis,environmental sciences and industrial processes [e.g. 22–29]. Freshly formed ironhydroxide particles help to control pollution in aquatic systems, e.g. by fixation andtransport of phosphates, heavy metals and other reactive inorganic and/or organicspecies [30–33]. The high reactivity of these iron phases is mainly due to their smallsize. The formation and aggregation of iron colloids, which occurs in continentaland marine aquatic systems [22, 34–38], is also employed in water and wastewatertreatments [35, 39, 40].
In aquatic systems, Fe(III)-aquo ions may polymerize by deprotonation to formsparingly soluble colloidal iron oxyhydroxides.Although the crystalline end-productsof this reaction, such as goethite (�-FeOOH) and hematite (�-Fe2O3), are well char-acterized, the structure and shape of the intermediate phases are far from being fullyelucidated. The shape and ‘porosity’ of freshly formed iron colloids and aggregatescontrol their capacity to bind and transport a high number of elements. In some cases,e.g. where the size of the particles is not too small, a fractal approach can be useful todetermine the reactivity of the iron colloids and aggregates and to explain their highspecific surface and roughness. This approach, however, must be combined with amolecular-scale characterization, since these objects are very small and are not alwaysgeometrically self-similar.
General models of nucleation have been proposed [41, 42] based on the conceptof similarity between the structure of polymers and the structure of the resultingcrystalline phases. Nonetheless, these models have failed to predict the precipitationprocesses correctly. A generalized approach based on the electrostatic field theory[25, 43] was able to provide hints for understanding the formation of small clustersbut could not be applied to larger ones.
5.3.1 Nucleation
Several pioneering studies [41, 42, 44, 45] have developed the general conceptsof polymerization, growth and precipitation of Fe(III) ions, but the intermediate
154 FRACTAL MECHANISMS IN COAGULATION/FLOCCULATION
polymers and clusters have not been identified experimentally. Structural inform-ation was based on the modeling of potentiometric data, not on the observation ofthe objects, which became possible later by the use of X-ray absorption spectroscopy(XAS) and SAXS [39, 40, 46–51].
The structure and size of iron polymers depends on the hydrolysis ratio n = OH/Fe,time t , and nature of the anions. At low hydrolysis ratios, two Fe monomers react toform a dimer in which both octahedra share an edge. Mössbauer spectroscopy hasshown that, at n < 0.5, hydrolysis of Fe(NO3)3 at 92 ◦C leads to the formation ofFe2(OH)4+
2 [52].Extended edge X-ray absorption fine structure (EXAFS) spectroscopy has revealed
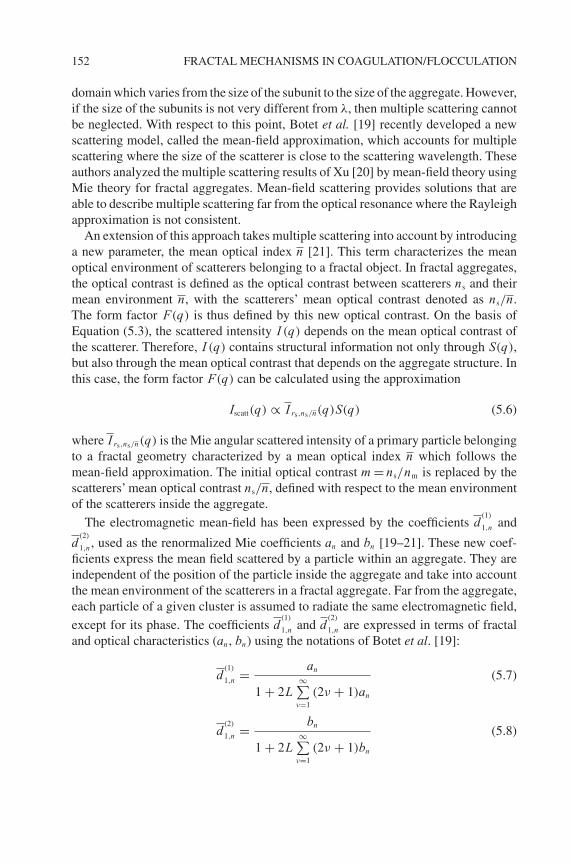
the presence of a dimer formed from FeCl3 at n = 1.5 and t = 10 min [50], with thetwo Fe at a distance of 3.01 Å, corresponding to Fe octahedral edge sharing [53]. Thedimer could be stabilized by organic ligands such as carboxylates and proteins [45],whereas the growth of Fe species in the absence of ‘stabilizers’ continues with theformation of a trimer (Figure 5.1) [50].
A) B)
Figure 5.1 Structure of a planar trimer (A) and a double corner trimer (B) of Fe3(OH)5+4 .
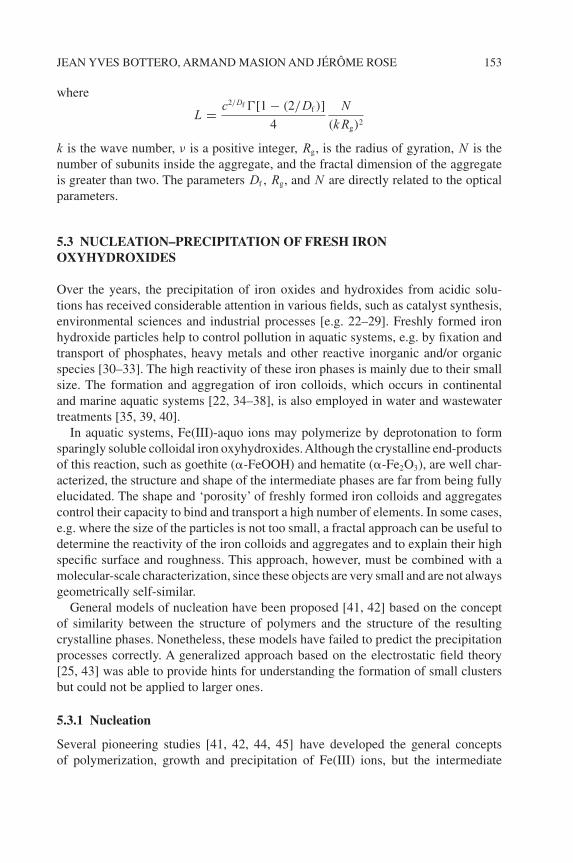
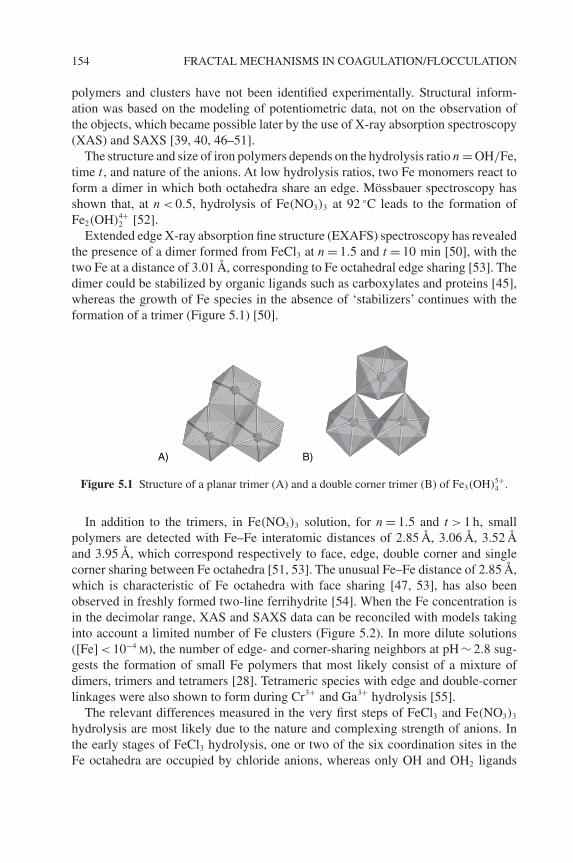
In addition to the trimers, in Fe(NO3)3 solution, for n = 1.5 and t > 1 h, smallpolymers are detected with Fe–Fe interatomic distances of 2.85 Å, 3.06 Å, 3.52 Åand 3.95 Å, which correspond respectively to face, edge, double corner and singlecorner sharing between Fe octahedra [51, 53]. The unusual Fe–Fe distance of 2.85 Å,which is characteristic of Fe octahedra with face sharing [47, 53], has also beenobserved in freshly formed two-line ferrihydrite [54]. When the Fe concentration isin the decimolar range, XAS and SAXS data can be reconciled with models takinginto account a limited number of Fe clusters (Figure 5.2). In more dilute solutions([Fe] < 10−4
m), the number of edge- and corner-sharing neighbors at pH ∼ 2.8 sug-gests the formation of small Fe polymers that most likely consist of a mixture ofdimers, trimers and tetramers [28]. Tetrameric species with edge and double-cornerlinkages were also shown to form during Cr3+ and Ga3+ hydrolysis [55].
The relevant differences measured in the very first steps of FeCl3 and Fe(NO3)3
hydrolysis are most likely due to the nature and complexing strength of anions. Inthe early stages of FeCl3 hydrolysis, one or two of the six coordination sites in theFe octahedra are occupied by chloride anions, whereas only OH and OH2 ligands
JEAN YVES BOTTERO, ARMAND MASION AND JÉRÔME ROSE 155
DimF + PentaE
Dim E + Tetra SC Trim E + Trim DC
DimF + PentaE–DC TrimF + Trim DC
Fe23 Ferrihydrite 2L
Single cornerlinkage
14% 24% 15%
12% 26% 12%
Figure 5.2 Six possible clusters present in Fe(NO3)3 solution at n = 1.5. Dim = dimer,trim = trimer, tetra = tetramer, penta = pentamer, F = Face, E = edge; DC = double corner;SC = single corner. All clusters correspond to substructures of larger minerals. The Fe23ferrihydrite 2L substructure is described in [54].
are detected in Fe(NO3)3 solutions. Consequently, Fe(NO3)3 exhibits more bindingpossibilities than FeCl3, which likely includes single-corner bonds whose free energyof formation of 105 kJ mol−1 is lower than that of a double-corner bond [43].
Marked differences between the polymerization mechanisms of Fe(NO3)3 andFeCl3 have also been shown to occur at higher hydrolysis ratios (or times). In thecase of Fe(NO3)3, the cluster radii increase with hydrolysis ratio [48]. In particular,some authors have suggested that the dodecamer Fe12(OH)2+
34 may form in solutionsof Fe(NO3)3 at n > 2.3 [56], whereas others have postulated the formation of thepolycation [FeO4Fe12(OH)24(H2O)12]7+ with a structure similar to that of the Al13
polymer [57]. In contrast, the size of aggregate subunits formed from FeCl3 does notappear to vary with the hydrolysis ratio [58]. On the basis of SAXS, EXAFS and Aradsorption data, it has been suggested that the polymer Fe24O12(OH)16+
32 , which showsa local structure similar to akaganeite (�-FeOOH), can form [50] (Figure 5.3).
5.3.2 Diffusion, Aggregation, Fractal and Nonfractal Growth
In contrast to FeCl3 hydrolysis, the hydrolysis of Fe(NO3)3 leads to a more chaoticevolution of Fe polymers and Fe nuclei. Two possible mechanisms have been sug-gested to explain this observation. The first consists of crystal growth or precipitationbased on ion diffusion and includes the following steps [59]: (i) diffusion of Fe(III)ions to the surface of the nucleus; (ii) dehydration of Fe at the surface; (iii) adsorptionof dehydrated Fe; (iv) diffusion of Fe on the surface to a more energetically favor-able position. In contrast to the ion diffusion mechanism, the growth of Fe speciesappears to be explained better by the aggregation of primary polymers. This second
156 FRACTAL MECHANISMS IN COAGULATION/FLOCCULATION
Fe-O/CI
polymerization
1 2 3
R (Å)
4 5
Fe24
16 ÅFe-O-Fe
n = 2.5
n = 2
n = 1
n = 0
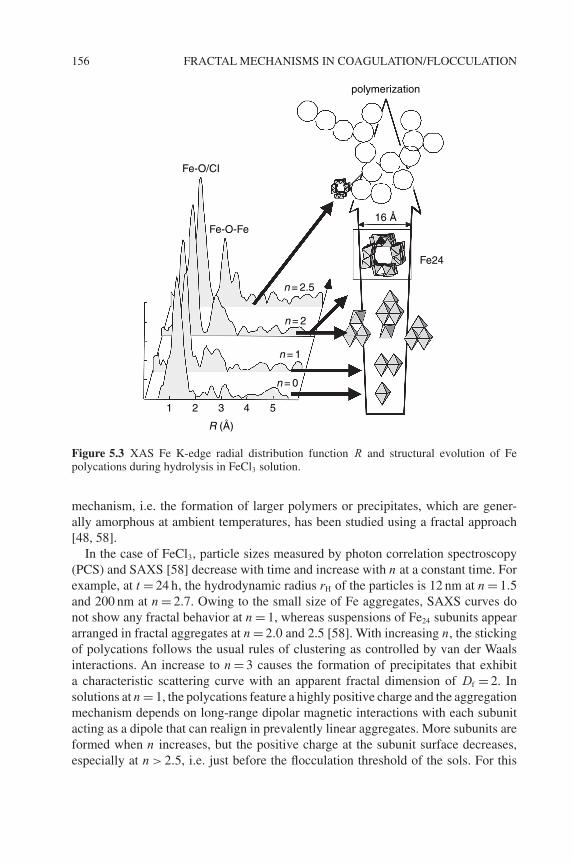
Figure 5.3 XAS Fe K-edge radial distribution function R and structural evolution of Fepolycations during hydrolysis in FeCl3 solution.
mechanism, i.e. the formation of larger polymers or precipitates, which are gener-ally amorphous at ambient temperatures, has been studied using a fractal approach[48, 58].
In the case of FeCl3, particle sizes measured by photon correlation spectroscopy(PCS) and SAXS [58] decrease with time and increase with n at a constant time. Forexample, at t = 24 h, the hydrodynamic radius rH of the particles is 12 nm at n = 1.5and 200 nm at n = 2.7. Owing to the small size of Fe aggregates, SAXS curves donot show any fractal behavior at n = 1, whereas suspensions of Fe24 subunits appeararranged in fractal aggregates at n = 2.0 and 2.5 [58]. With increasing n, the stickingof polycations follows the usual rules of clustering as controlled by van der Waalsinteractions. An increase to n = 3 causes the formation of precipitates that exhibita characteristic scattering curve with an apparent fractal dimension of Df = 2. Insolutions at n = 1, the polycations feature a highly positive charge and the aggregationmechanism depends on long-range dipolar magnetic interactions with each subunitacting as a dipole that can realign in prevalently linear aggregates. More subunits areformed when n increases, but the positive charge at the subunit surface decreases,especially at n > 2.5, i.e. just before the flocculation threshold of the sols. For this
JEAN YVES BOTTERO, ARMAND MASION AND JÉRÔME ROSE 157
condition, electrostatic repulsion decreases and electrostatic attractive interactionsbecome responsible for the fractal arrangement of colloids. The various steps ofFeCl3 polymerization are summarized in Figure 5.3.
In the case of Fe(NO3)3, aggregates are thought to take up a linear or semi-linearshape at the local range-order that consists of 4–5, 3–4, 7 and 9 subunits for n = 1.5,2.0, 2.2 and 2.5 respectively [49].At t < 10 min, greater branching and polydispersityis observed for n = 2.2 and 2.5, whereas aggregates have a fractal geometry withan apparent fractal dimension of Df = 1.75 for n = 2.8, typical of a cluster–clusteraggregation mechanism. Although this value is lower than that measured for FeCl3
solutions at n = 2.7(Df = 2), some authors have suggested that less aggregated andless dense, small particles can form in Fe(NO3)3 solutions compared with FeCl3
solutions [59].
5.3.3 The Effect of Strong Competing Ligands: The Case of Phosphate
When in competition with O and OH ligands, the presence of species such as phos-phate, silicate, and organic matter is thought to affect the composition, structure,morphology and reactivity of Fe hydrolysis products [60–67]. PO3−
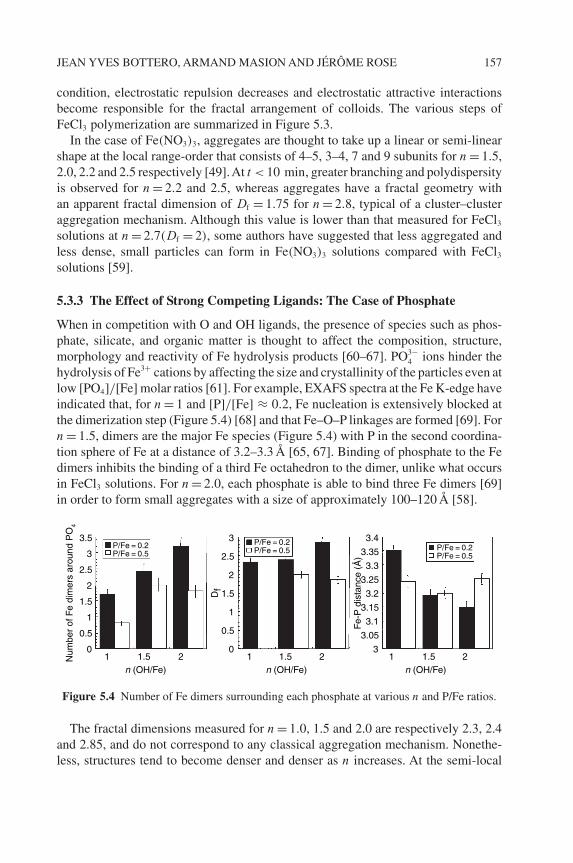
4 ions hinder thehydrolysis of Fe3+ cations by affecting the size and crystallinity of the particles even atlow [PO4]/[Fe] molar ratios [61]. For example, EXAFS spectra at the Fe K-edge haveindicated that, for n = 1 and [P]/[Fe] ≈ 0.2, Fe nucleation is extensively blocked atthe dimerization step (Figure 5.4) [68] and that Fe–O–P linkages are formed [69]. Forn = 1.5, dimers are the major Fe species (Figure 5.4) with P in the second coordina-tion sphere of Fe at a distance of 3.2–3.3 Å [65, 67]. Binding of phosphate to the Fedimers inhibits the binding of a third Fe octahedron to the dimer, unlike what occursin FeCl3 solutions. For n = 2.0, each phosphate is able to bind three Fe dimers [69]in order to form small aggregates with a size of approximately 100–120 Å [58].
Num
ber
of F
e di
mer
s ar
ound
PO
4
Fe-
P d
ista
nce
(Å)
Df
0
0.5
1
1.5
2
2.5
3
3.5P/Fe = 0.2P/Fe = 0.5
P/Fe = 0.2P/Fe = 0.5 P/Fe = 0.2
P/Fe = 0.5
0
0.5
1
1.5
2
2.5
3
3
3.05
3.1
3.15
3.2
3.3
3.25
3.35
3.4
1 1.5n (OH/Fe)
2n (OH/Fe)
1 1.5 2n (OH/Fe)
1 1.5 2
Figure 5.4 Number of Fe dimers surrounding each phosphate at various n and P/Fe ratios.
The fractal dimensions measured for n = 1.0, 1.5 and 2.0 are respectively 2.3, 2.4and 2.85, and do not correspond to any classical aggregation mechanism. Nonethe-less, structures tend to become denser and denser as n increases. At the semi-local
158 FRACTAL MECHANISMS IN COAGULATION/FLOCCULATION
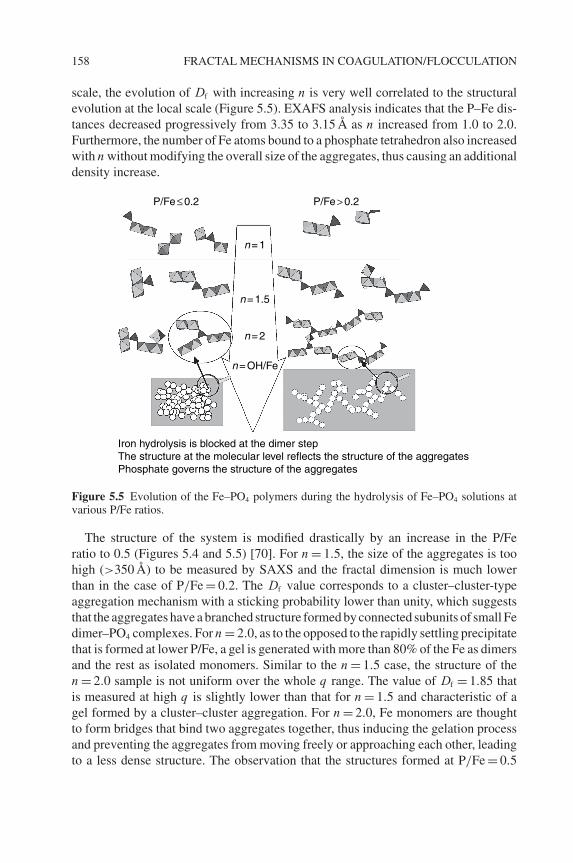
scale, the evolution of Df with increasing n is very well correlated to the structuralevolution at the local scale (Figure 5.5). EXAFS analysis indicates that the P–Fe dis-tances decreased progressively from 3.35 to 3.15 Å as n increased from 1.0 to 2.0.Furthermore, the number of Fe atoms bound to a phosphate tetrahedron also increasedwith n without modifying the overall size of the aggregates, thus causing an additionaldensity increase.
n = 1
n = 1.5
n = 2
n = OH/Fe
P/Fe ≤ 0.2
Iron hydrolysis is blocked at the dimer stepThe structure at the molecular level reflects the structure of the aggregatesPhosphate governs the structure of the aggregates
P/Fe > 0.2
Figure 5.5 Evolution of the Fe–PO4 polymers during the hydrolysis of Fe–PO4 solutions atvarious P/Fe ratios.
The structure of the system is modified drastically by an increase in the P/Feratio to 0.5 (Figures 5.4 and 5.5) [70]. For n = 1.5, the size of the aggregates is toohigh (>350 Å) to be measured by SAXS and the fractal dimension is much lowerthan in the case of P/Fe = 0.2. The Df value corresponds to a cluster–cluster-typeaggregation mechanism with a sticking probability lower than unity, which suggeststhat the aggregates have a branched structure formed by connected subunits of small Fedimer–PO4 complexes. For n = 2.0, as to the opposed to the rapidly settling precipitatethat is formed at lower P/Fe, a gel is generated with more than 80% of the Fe as dimersand the rest as isolated monomers. Similar to the n = 1.5 case, the structure of then = 2.0 sample is not uniform over the whole q range. The value of Df = 1.85 thatis measured at high q is slightly lower than that for n = 1.5 and characteristic of agel formed by a cluster–cluster aggregation. For n = 2.0, Fe monomers are thoughtto form bridges that bind two aggregates together, thus inducing the gelation processand preventing the aggregates from moving freely or approaching each other, leadingto a less dense structure. The observation that the structures formed at P/Fe = 0.5
JEAN YVES BOTTERO, ARMAND MASION AND JÉRÔME ROSE 159
are much more open than those obtained at the same hydrolysis ratio at P/Fe = 0.2(Figure 5.5) may be due to the difference in stoichiometry of the two sample series.The first reactions that occur, i.e. the condensation of a first and a second Fe dimeronto a phosphate tetrahedron, are the most energetically favorable. Owing to the lowerpartial charge on the phosphate and to the steric hindrance created by the presenceof two dimers, which reduces considerably the accessibility of the unoccupied siteson phosphate tetrahedra, a higher energy barrier must be overcome at P/Fe = 0.2. Atthis P/Fe ratio, the condensation of a third Fe dimer would result in dense structures.At P/Fe = 0.5, i.e. at a 2.5 times higher amount of phosphate, the probability offorming three dimer–phosphate units becomes even lower, since they are energeticallydisadvantaged with respect to two dimer–phosphate clusters. Thus, more linear andless dense structures that are characterized by a lower fractal dimension are formed(Figure 5.5).
5.3.4 Aggregation/Precipitation in Fe–SiO4 Systems
5.3.4.1 Effect of Si on Fe crystallization
As Si and Fe are two of the most abundant elements in the Earth’s crust, there is a longhistory of studies describing the interactions between these elements. For example, thefirst quantitative report of the formation of an FeSiO(OH)
2+3 complex in dilute solution
dates to the 1960s [71]. Structural studies of the Fe–Si systems have received muchattention and focused mainly on the role of Si on the crystallization of the Fe oxidesand oxyhydroxides. In this context, many authors have found that even low levels ofSi are likely to affect the size and shape of the Fe–Si precipitates significantly. Forexample, the presence of Si is shown to hinder the formation of goethite, and lead tothe preferential formation of metastable ferrihydrite [61, 72]. Under acidic conditions,SiO4 is assumed to participate in the aggregation of nanosized (10–20 nm) goethitecrystals [73]. Si contents as low as 0.1 mol% are found to delay considerably thedissolution–reprecipitation processes that transform ferrihydrite into goethite [24].The zero point charge (ZPC) of the surface is displaced towards higher pH in thepresence of Si.This effect is consistent with the formation of an Fe–O–SiO3 complex atthe ferrihydrite surface, thus impeding its dissolution and transformation into goethite[74–77]. More recent data obtained over extended pH and Fe/Si ranges suggest thatpolymeric Si species can form at the surface of ferrihydrite [78]. These Fe–O–Sicomplexes are also shown to prevent the formation of hematite from ferrihydrite,which typically is favored by heating [79].
Although the above investigations are fundamental in determining to what extentthe presence of Si modifies the chemistry of Fe, they generally do not attempt todescribe the structure of ‘X-ray diffraction (XRD)-invisible’or amorphous Fe species.In addition, the samples generally undergo heating and/or aging processes that favorthe formation of crystalline structures. As a consequence, the speciation and structureof fresh Fe–Si phases, for which no organized structure is expected, have long beenneglected. Although synchrotron-based SAXS and especially XAS techniques have
160 FRACTAL MECHANISMS IN COAGULATION/FLOCCULATION
gained popularity since the mid 1980s, the structure of freshly prepared Fe–Si systemshas been studied only recently [28, 80–82]. These studies cover Fe hydrolysis over alarge range of pH, Fe concentrations and Si/Fe molar ratios.
5.3.4.2 Nucleation and growth of Fe–Si species in the first step of hydrolysis
Analyses by Fe K-edge EXAFS show that, at low pH and in large excess of Si(Si/Fe = 5), Fe essentially forms edge-sharing Fe dimers for which each Fe bindsone SiO4 tetrahedron [28]. In these studies, samples are filtered to eliminate solidsthat may have formed, and no visible aggregation occurs within the first few hoursof aging. The formation of solid phases is observed in more concentrated Fe solu-tions (e.g. [Fe] = 0.2 mol l−1) and at lower Si/Fe ratios. For Si/Fe = 1 and Si/Fe = 2,the analysis of the n = 0.5 sample reveals the presence of monomeric Fe [83]. Theformation of edge-sharing dimers is detected at n = 1.0, but significant amounts ofmonomeric Fe are still present within the precipitate. These results indicate that Fespeciation in the aggregates is very similar to that observed in solution [28]. However,contrary to the dissolved species, and similar to other systems [84], Si was not foundin the local environment of Fe in the precipitates. A significant Fe polymerizationis observed by increasing the hydrolysis ratio from n = 1 to n = 1.5. The total num-ber of neighbors Ntot detected by EXAFS is higher at Si/Fe = 1 (Ntot = 3.11) thanat Si/Fe = 2(Ntot = 2.47). This result is mainly due to the higher number of doublecorner linkages at Si/Fe = 1(NDC = 1.63) compared with Si/Fe = 2(NDC = 1.18).
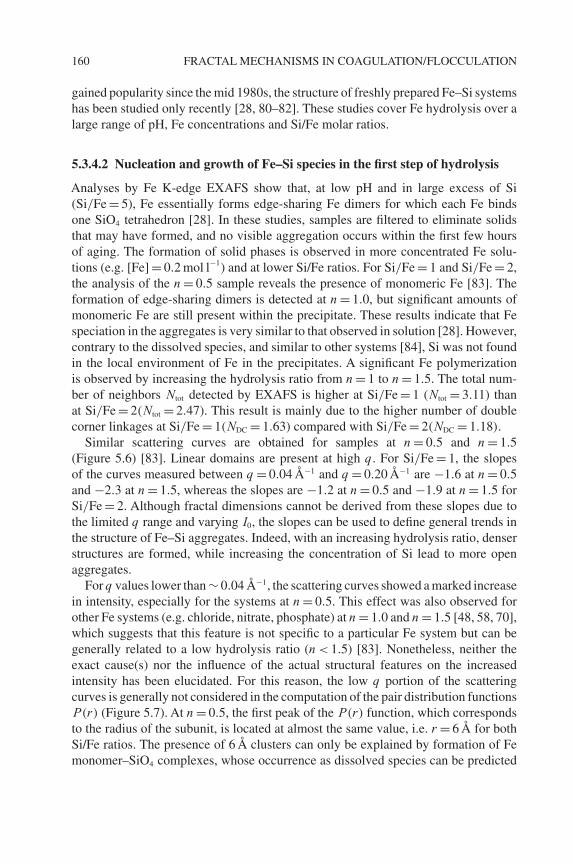
Similar scattering curves are obtained for samples at n = 0.5 and n = 1.5(Figure 5.6) [83]. Linear domains are present at high q. For Si/Fe = 1, the slopesof the curves measured between q = 0.04 Å−1 and q = 0.20 Å−1 are −1.6 at n = 0.5and −2.3 at n = 1.5, whereas the slopes are −1.2 at n = 0.5 and −1.9 at n = 1.5 forSi/Fe = 2. Although fractal dimensions cannot be derived from these slopes due tothe limited q range and varying I0, the slopes can be used to define general trends inthe structure of Fe–Si aggregates. Indeed, with an increasing hydrolysis ratio, denserstructures are formed, while increasing the concentration of Si lead to more openaggregates.
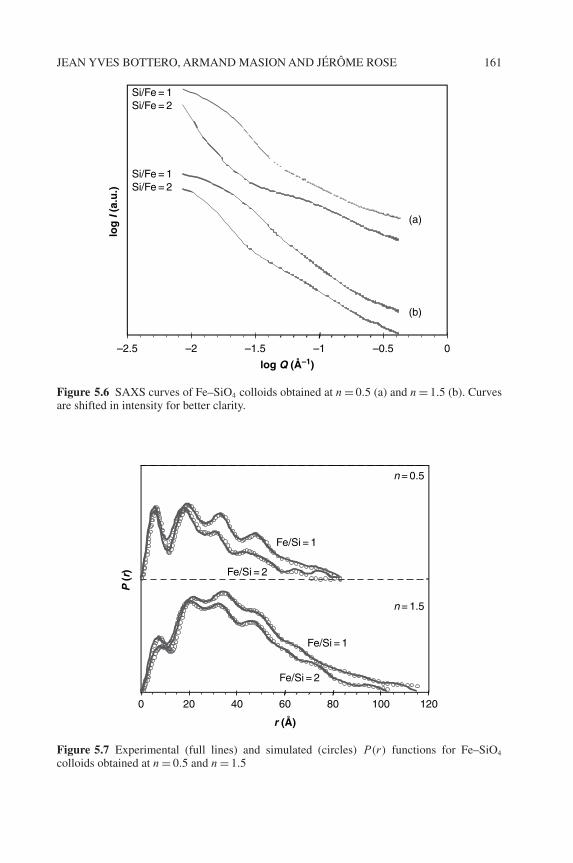
For q values lower than ∼ 0.04 Å−1, the scattering curves showed a marked increasein intensity, especially for the systems at n = 0.5. This effect was also observed forother Fe systems (e.g. chloride, nitrate, phosphate) at n = 1.0 and n = 1.5 [48, 58, 70],which suggests that this feature is not specific to a particular Fe system but can begenerally related to a low hydrolysis ratio (n < 1.5) [83]. Nonetheless, neither theexact cause(s) nor the influence of the actual structural features on the increasedintensity has been elucidated. For this reason, the low q portion of the scatteringcurves is generally not considered in the computation of the pair distribution functionsP (r) (Figure 5.7). At n = 0.5, the first peak of the P (r) function, which correspondsto the radius of the subunit, is located at almost the same value, i.e. r = 6 Å for bothSi/Fe ratios. The presence of 6 Å clusters can only be explained by formation of Femonomer–SiO4 complexes, whose occurrence as dissolved species can be predicted
JEAN YVES BOTTERO, ARMAND MASION AND JÉRÔME ROSE 161
log
I (a
.u.)
log Q (Å–1)
–2.5 –1.5 –0.5
(b)
(a)
Si/Fe = 1Si/Fe = 2
Si/Fe = 1Si/Fe = 2
0–1–2
Figure 5.6 SAXS curves of Fe–SiO4 colloids obtained at n = 0.5 (a) and n = 1.5 (b). Curvesare shifted in intensity for better clarity.
r (Å)
P (
r)
0 20 40 60
n = 0.5
n = 1.5
Fe/Si = 1
Fe/Si = 1
Fe/Si = 2
Fe/Si = 2
80 100 120
Figure 5.7 Experimental (full lines) and simulated (circles) P (r) functions for Fe–SiO4
colloids obtained at n = 0.5 and n = 1.5
162 FRACTAL MECHANISMS IN COAGULATION/FLOCCULATION
by equilibrium calculations at acidic pH [28]. The presence of Fe–O–Si bonds at sucha low n value (i.e. even before Fe nucleation) is indicative of a high affinity betweenFe and SiO4 ligands. At n = 1.5, the shift of the first peak of P (r) towards largerr values, i.e. r = 7.2 Å (Si/Fe = 1) and r = 6.5 Å (Si/Fe = 2), is consistent with theincreased Fe polymerization. The higher Ntot value for Si/Fe = 1 is correlated withthe larger subunit size.
The P (r) functions are fitted with linear combinations of theoretical curves usingroughly spherical subunits [83], the number of which per unit volume increases withincreasing n. This result can be attributed to the presence of denser structures, assuggested from the slopes of the scattering curves. Furthermore, at a fixed n value,the number of spherical subunits decreases with increasing Si concentration, also assuggested from the slopes. Nonetheless, extreme care should be taken in interpretingthese results in terms of structure, because the models do not provide any indicationof the nature of bonds between the subunits. Considering the pH conditions, thepresence of polymerized Si species that are able to connect Fe subunits is very likely.However, unfortunately, the nature and structure of Si species cannot be determinedfrom SAXS due to the low electron contrast of Si compared with the heavier Fe,making Si ‘invisible’ on the scattering curves.
The influence of SiO4 and PO4 on the first steps of hydrolysis (n ≤ 2) differs greatly,although both ligands have a strong affinity for Fe. PO4 is shown to block Fe poly-merization from the lowest P/Fe ratios and predominantly form Fe dimers in all Fe–Psystems at n ≥ 1.5 [85, 86]. In contrast, in the presence of SiO4, Fe speciation andprobably Si speciation varies with n and with the Si/Fe ratio. Furthermore, larger Feclusters are formed. Therefore, the similarities in the evolution of aggregate structurethat are observed, i.e. a denser structure obtained with increasing n or a decreasingratio of ligand/Fe) appear to be purely coincidental.
5.3.4.3 Nature and structure of Fe–Si species at pH ≥3
The speciation and structure of Fe–Si systems have also been examined between pH 3and 10 at n > 3 and Si/Fe = 0 to 4 [80–82]. Based upon XRD results, the phases thatare formed are generally amorphous with only small amounts of poorly crystallizedakaganeite detected at pH 3.
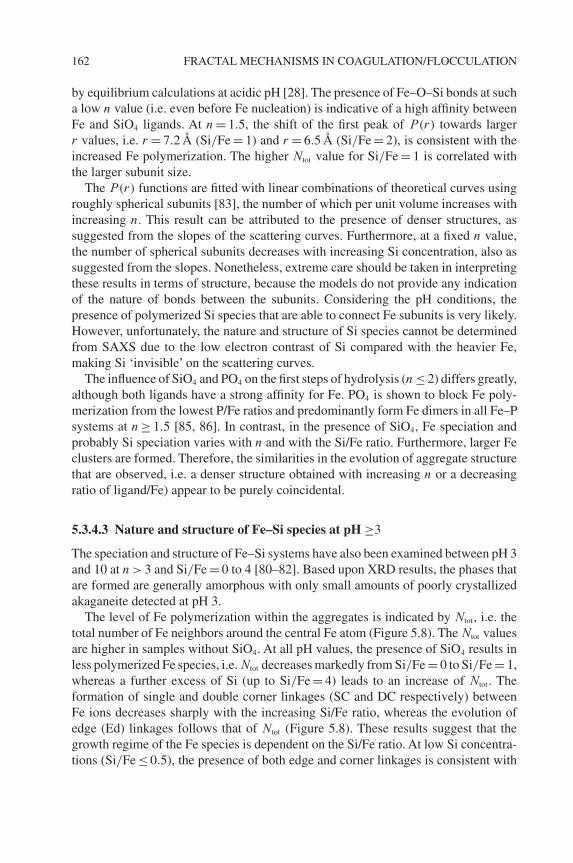
The level of Fe polymerization within the aggregates is indicated by Ntot , i.e. thetotal number of Fe neighbors around the central Fe atom (Figure 5.8). The Ntot valuesare higher in samples without SiO4. At all pH values, the presence of SiO4 results inless polymerized Fe species, i.e. Ntot decreases markedly from Si/Fe = 0 to Si/Fe = 1,whereas a further excess of Si (up to Si/Fe = 4) leads to an increase of Ntot . Theformation of single and double corner linkages (SC and DC respectively) betweenFe ions decreases sharply with the increasing Si/Fe ratio, whereas the evolution ofedge (Ed) linkages follows that of Ntot (Figure 5.8). These results suggest that thegrowth regime of the Fe species is dependent on the Si/Fe ratio. At low Si concentra-tions (Si/Fe ≤ 0.5), the presence of both edge and corner linkages is consistent with
JEAN YVES BOTTERO, ARMAND MASION AND JÉRÔME ROSE 163
[Si] / [Fe]
Nu
mb
er o
f n
eig
hb
ou
rs
0
6
5
4
3
2
1
00.25 0.5 1 2 4 SC
DCEd
Tot
Figure 5.8 Number of Fe neighbors around the central Fe ion as a function of the Si/Fe ratioat pH 3. SC: single corner; DC: double corner; Ed: edge; Tot: total.
the formation of three-dimensional structures, whereas the predominance of edgelinkages at Si/Fe > 1 suggests a two-dimensional growth.
Some information on Si speciation can be provided by Fourier transform infrared(FTIR) analysis in the spectral region between 800 and 1300 cm−1. A simultan-eous increase of the absorption bands at 930 cm−1 (Si–O–Fe) and at 800 cm−1 and1300 cm−1 (symmetric and asymmetric Si–O–Si stretching respectively) is observed.Si polymerization increases with increasing Si and decreases with increasing pH,due to the higher solubility of Si at pH ≥ 7 [81]. Despite the presence of Fe, forsamples with the highest Si polymerization level, i.e. Si/Fe = 4 at pH 3 and pH 5and Si/Fe = 2 at pH 3, detection of 29Si by NMR at about −100 ppm indicated thepresence of Fe-free domains within the samples [81].
Information on the spatial arrangement of Si within these silica pockets can beobtained by measuring the magnetization S as a function of time. Indeed, S(t) scalesas (Ct)β/6 or tα, where C is a constant and β is the dimensionality of the spin system.The slopes of the log S(t) versus log t plots yielded an average value of β = 2.2. SiK-edge EXAFS data can provide additional details on Si speciation in these systems,but they are often difficult to interpret.
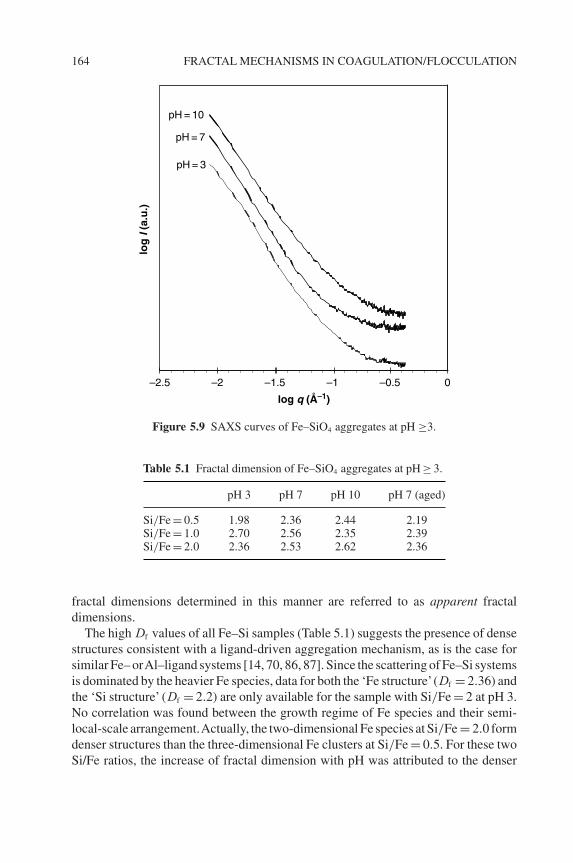
In agreement with XRD results, the absence of correlation peaks in SAXS curves(Figure 5.9) indicates the presence of amorphous and disordered Fe–SiO4 aggreg-ates. All curves display a linear portion for q < 0.075 Å−1 (Figure 5.9), but since I0
is not determined, only apparent fractal dimensions can be derived from the slopesmeasured in this q range (Table 5.1). Nonetheless, given that the subunits are small,the influence of I0 on the low q part of the SAXS curves is expected to be minimal;therefore, the apparent fractal dimensions derived from the log I (q) versus log q
plots are considered to be good estimates of the rigorous values of Df . Hereafter,
164 FRACTAL MECHANISMS IN COAGULATION/FLOCCULATION
log
I (a
.u.)
log q (Å–1)
–2.5 –1.5 –0.5
pH = 10
pH = 7
pH = 3
0–1–2
Figure 5.9 SAXS curves of Fe–SiO4 aggregates at pH ≥3.
Table 5.1 Fractal dimension of Fe–SiO4 aggregates at pH ≥ 3.
pH 3 pH 7 pH 10 pH 7 (aged)
Si/Fe = 0.5 1.98 2.36 2.44 2.19Si/Fe = 1.0 2.70 2.56 2.35 2.39Si/Fe = 2.0 2.36 2.53 2.62 2.36
fractal dimensions determined in this manner are referred to as apparent fractaldimensions.
The high Df values of all Fe–Si samples (Table 5.1) suggests the presence of densestructures consistent with a ligand-driven aggregation mechanism, as is the case forsimilar Fe– orAl–ligand systems [14, 70, 86, 87]. Since the scattering of Fe–Si systemsis dominated by the heavier Fe species, data for both the ‘Fe structure’(Df = 2.36) andthe ‘Si structure’ (Df = 2.2) are only available for the sample with Si/Fe = 2 at pH 3.No correlation was found between the growth regime of Fe species and their semi-local-scale arrangement.Actually, the two-dimensional Fe species at Si/Fe = 2.0 formdenser structures than the three-dimensional Fe clusters at Si/Fe = 0.5. For these twoSi/Fe ratios, the increase of fractal dimension with pH was attributed to the denser
JEAN YVES BOTTERO, ARMAND MASION AND JÉRÔME ROSE 165
packing of Fe species favored by the decrease of size measured for Si polymers. Onthe contrary, at Si/Fe = 1, the observed depolymerization of Si at high pH resulted inlower Df values.
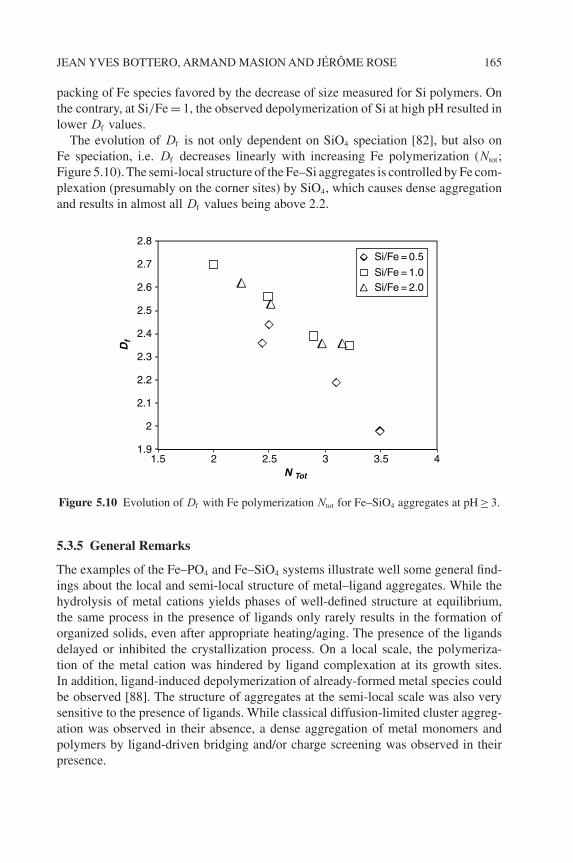
The evolution of Df is not only dependent on SiO4 speciation [82], but also onFe speciation, i.e. Df decreases linearly with increasing Fe polymerization (Ntot;Figure 5.10). The semi-local structure of the Fe–Si aggregates is controlled by Fe com-plexation (presumably on the corner sites) by SiO4, which causes dense aggregationand results in almost all Df values being above 2.2.
Df
N Tot
1.5
Si/Fe = 0.5
Si/Fe = 1.0Si/Fe = 2.0
1.9
2
2.1
2.2
2.3
2.4
2.5
2.6
2.7
2.8
2 2.5 3 3.5 4
Figure 5.10 Evolution of Df with Fe polymerization Ntot for Fe–SiO4 aggregates at pH ≥ 3.
5.3.5 General Remarks
The examples of the Fe–PO4 and Fe–SiO4 systems illustrate well some general find-ings about the local and semi-local structure of metal–ligand aggregates. While thehydrolysis of metal cations yields phases of well-defined structure at equilibrium,the same process in the presence of ligands only rarely results in the formation oforganized solids, even after appropriate heating/aging. The presence of the ligandsdelayed or inhibited the crystallization process. On a local scale, the polymeriza-tion of the metal cation was hindered by ligand complexation at its growth sites.In addition, ligand-induced depolymerization of already-formed metal species couldbe observed [88]. The structure of aggregates at the semi-local scale was also verysensitive to the presence of ligands. While classical diffusion-limited cluster aggreg-ation was observed in their absence, a dense aggregation of metal monomers andpolymers by ligand-driven bridging and/or charge screening was observed in theirpresence.
166 FRACTAL MECHANISMS IN COAGULATION/FLOCCULATION
Although the measurement of the fractal dimension of an aggregate can be per-formed with various imaging, scattering and settling techniques [89], the optionsavailable for the characterization of the semi-local-scale order (i.e. up to approxim-ately 1000 Å) are limited to a few microscopic and scattering methods. Althoughimaging techniques such as transmission electron microscopy (TEM), scanning elec-tron microscopy (SEM), and atomic force microscopy (AFM) are very versatile, theysuffer from poor statistics, sample opacity, and poor transfer of information obtainedin two dimensions to three-dimensional aggregates. Thus, X-ray scattering representsthe main analytical tool for determining Df in this size range. Although scattering inheterogeneous systems is dominated by the heavier elements and no direct informa-tion about the arrangement of the lighter elements can be derived from SAXS data,the structural information provided by SAXS in the case of metal–ligand aggregatesremains very valuable.
Aggregate fractal dimensions measured by SAXS are often significantly largerthan two. When interpreting the evolution of Df with pH and/or ligand concentration,two typical situations must be considered: (a) metal speciation remains relativelyunaffected by modifications of pH and/or ligand concentrations (and typically con-sists of monomers and oligomers, e.g. Fe–PO4); (b) metal speciation evolves withexperimental conditions (e.g. Fe–SiO4). In the first case, the scattering centers remainconstant and variations of the fractal dimension reflect changes in ligand chemistryand/or structure. In the second case, although the ligand chemistry and structure stillaffect the overall density of the aggregate and the corresponding fractal dimension,structural changes in the size and shape of metal species, to which scattering is verysensitive, will dominate the signal and control, to a large extent, the evolution ofDf . These trends are obvious only where an adequate difference in atomic numberexists between the metal cation and the ligand (e.g. Fe–P, Fe–Si, Al/Fe–C). Wherethe metal and ligand produce similar electron contrast (e.g. Al–Si) [13, 90], addi-tional data from independent techniques may be required to interpret structural datacorrectly.
5.4 FRACTAL DIMENSIONS OF VERY LARGE FLOCS BUILT WITHMICROSIZED UNITS
A rapid and accurate determination of aggregate structure is desirable for understand-ing particle aggregation processes that occur in freshwater and marine environments,in water and wastewater treatment plants and for modeling various environmentalphenomena [9, 91–94]. Among the techniques used for the optical determination ofstructural parameters [95–99], light scattering is certainly one of the most powerfulfor studying the evolution of the structure of large aggregates that are formed of unitsin the submicrometre size range. The relatively few studies that use light scatteringin this context have used both numerical simulation and an experimental validationof the optical properties of well-known colloids.
JEAN YVES BOTTERO, ARMAND MASION AND JÉRÔME ROSE 167
5.4.1 Numerical Simulations
Some authors [19, 100–102] have tentatively calculated the mean optical contrastof scatterers within different computer-generated aggregates. More recently [101],using the approach described in Section 5.2 [19], and the same definition for themean optical contrast generated by the presence of neighboring particles around acentral particle within a fractal aggregate, the influence of the physical parameters Rg
and Df has been tested on computer-generated fractal aggregates with Df > 2.0.
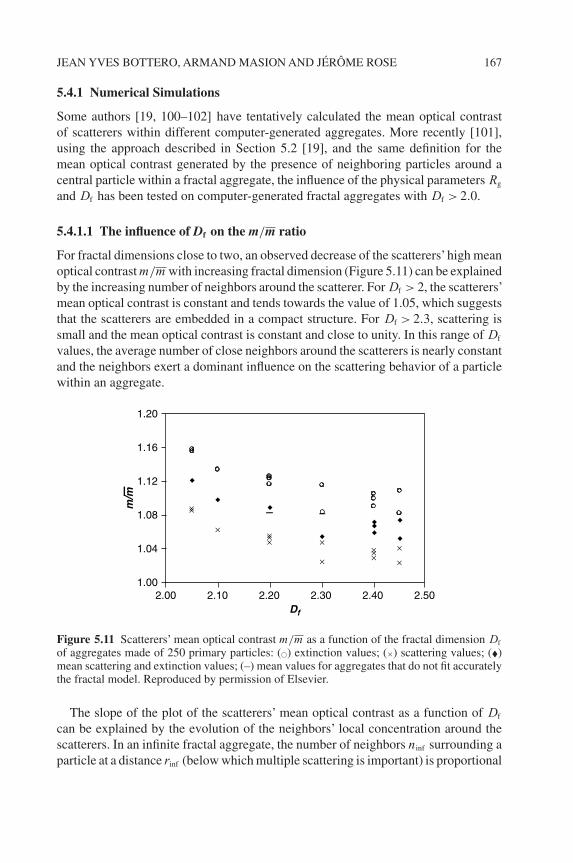
5.4.1.1 The influence of Df on the m/m ratio
For fractal dimensions close to two, an observed decrease of the scatterers’high meanoptical contrast m/m with increasing fractal dimension (Figure 5.11) can be explainedby the increasing number of neighbors around the scatterer. For Df > 2, the scatterers’mean optical contrast is constant and tends towards the value of 1.05, which suggeststhat the scatterers are embedded in a compact structure. For Df > 2.3, scattering issmall and the mean optical contrast is constant and close to unity. In this range of Df
values, the average number of close neighbors around the scatterers is nearly constantand the neighbors exert a dominant influence on the scattering behavior of a particlewithin an aggregate.
2.001.00
1.04
1.08
1.12
1.16
1.20
2.10 2.20 2.30 2.40 2.50Df
m/m
Figure 5.11 Scatterers’ mean optical contrast m/m as a function of the fractal dimension Df
of aggregates made of 250 primary particles: (©) extinction values; (×) scattering values; (�)mean scattering and extinction values; (–) mean values for aggregates that do not fit accuratelythe fractal model. Reproduced by permission of Elsevier.
The slope of the plot of the scatterers’ mean optical contrast as a function of Df
can be explained by the evolution of the neighbors’ local concentration around thescatterers. In an infinite fractal aggregate, the number of neighbors ninf surrounding aparticle at a distance rinf (below which multiple scattering is important) is proportional
168 FRACTAL MECHANISMS IN COAGULATION/FLOCCULATION
to (rinf /rs)Df . One can assume that m/m evolves with the possible multiple scatteringpaths pms:
pms = 1 + ninf + n2inf + n3
inf + · · · + nx
inf (5.9)
where x is the multiple scattering order. When pms increases, m/m decreases. Accord-ing to Equation (5.9), 1/pms decreases less quickly at high fractal dimensions than itdoes at low fractal dimensions. Thus, even if it is impossible to explain the decreaseof m/m with Df precisely, the trends are consistent with the theoretical expectations.
5.4.1.2 The influence of Rg on the m/m ratio
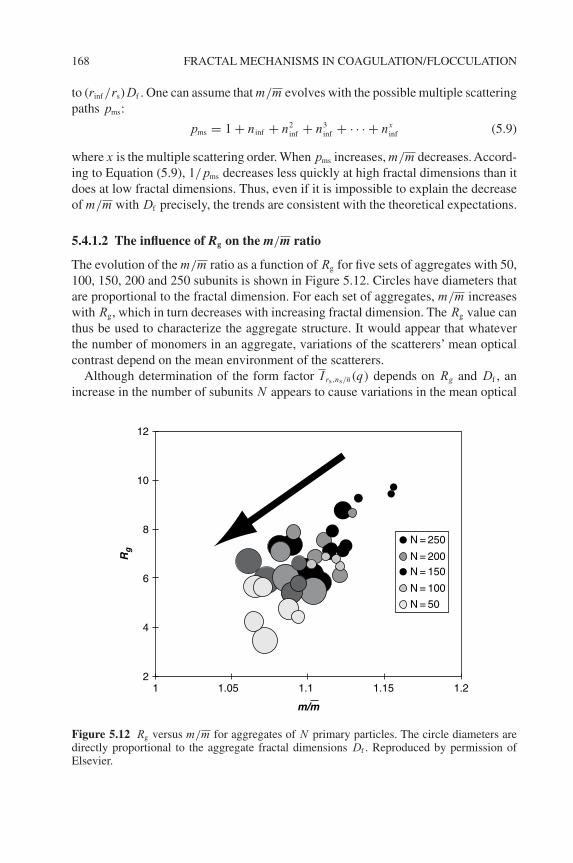
The evolution of the m/m ratio as a function of Rg for five sets of aggregates with 50,100, 150, 200 and 250 subunits is shown in Figure 5.12. Circles have diameters thatare proportional to the fractal dimension. For each set of aggregates, m/m increaseswith Rg, which in turn decreases with increasing fractal dimension. The Rg value canthus be used to characterize the aggregate structure. It would appear that whateverthe number of monomers in an aggregate, variations of the scatterers’ mean opticalcontrast depend on the mean environment of the scatterers.
Although determination of the form factor I rs,ns/n(q) depends on Rg and Df , anincrease in the number of subunits N appears to cause variations in the mean optical
2
4
6
8
10
12
1 1.05 1.1 1.15 1.2
m/m
Rg
N = 250
N = 200N = 150
N = 100
N = 50
Figure 5.12 Rg versus m/m for aggregates of N primary particles. The circle diameters aredirectly proportional to the aggregate fractal dimensions Df . Reproduced by permission ofElsevier.
JEAN YVES BOTTERO, ARMAND MASION AND JÉRÔME ROSE 169
contrast when the fractal geometry is not strictly consistent, in contrast to theoreticalpredictions. The scatterers’ mean optical contrast increases slowly with N , independ-ent of the fractal dimension [12, 103]. Structural changes and an evolution of theaggregate size do not influence the mean optical contrast in the same way, i.e. anincrease in size slightly increases the mean optical contrast, whereas an increase infractal dimension causes the optical contrast to decrease. The difference in the twobehaviors is more pronounced when the fractal dimension is low. In the case of aggreg-ation kinetics, both size and structure of the aggregates change during the reaction.In summary, the scatterers’ mean optical contrast can provide useful information onaggregate size and structure.
5.4.2 Experimental Validation
The concepts developed above have been tested experimentally with suspensionsof latex beads [103]. From light-scattering experiments, the experimental scatteredintensity Iexp(θ) has been normalized for the number of scatterers:
Inorm(θ) = Iexp(θ)Vs
φVcell
= Iexp(θ)
Ns
(5.10)
where Vs is the volume of the primary scatterer, φ is the volume fraction of scatterersin the suspension, Vcell is the scattering volume and Ns = φVcell/Vs is the number ofscatterers in the scattering volume. The magnitude of scattering vector q, is related tothe maximum interference distance d by
qd = π (5.11)
At large q values, S(q) tends towards unity (1/q rs) and variations of the scat-tering intensity Inorm(q) are essentially due to form factor changes. In order to followthese changes, the largest available q that is associated with an interference distanced that is smaller than the monomer diameter has been selected. The intensity at thisparticular angle is given by
Inorm(θs) = Iexp(θ)
Ns
(5.12)
A numerical model is used to compute the scattered intensity Inum(θ) accordingto Mie theory. At the lowest volume fraction, Inum(θs) fits Inorm(θs) and no multiplescattering arises, such that the evaluation of parameters for the numerical model isstraightforward. The mean optical contrast is adjusted to compute the normalized the-oretical values Inum(θs) so as to fit the variation of Inorm(θs) as a function of φ. It is thenpossible to calculate the value of the mean optical contrast by fitting the form factor.
From a kinetic point of view, the value of the mean optical contrast can be obtainedat each step of the aggregation process. In addition, from the correlation betweenthe mean optical contrast and the aggregate structure that is established by numer-ical simulation, it is possible to determine aggregate structure at each aggregationstage.
170 FRACTAL MECHANISMS IN COAGULATION/FLOCCULATION
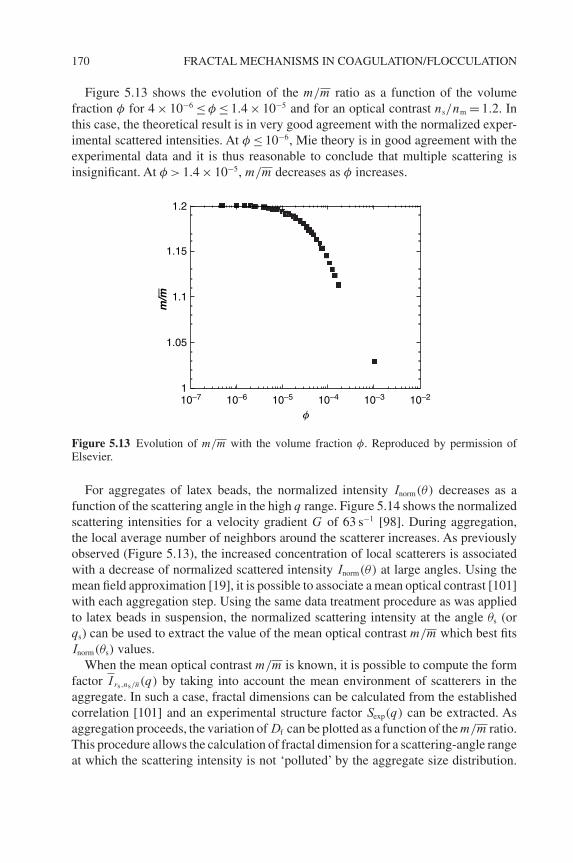
Figure 5.13 shows the evolution of the m/m ratio as a function of the volumefraction φ for 4 × 10⁻⁶ ≤ φ ≤ 1.4 × 10⁻⁵ and for an optical contrast ns/nm = 1.2. Inthis case, the theoretical result is in very good agreement with the normalized exper-imental scattered intensities. At φ ≤ 10−6, Mie theory is in good agreement with theexperimental data and it is thus reasonable to conclude that multiple scattering isinsignificant. At φ > 1.4 × 10⁻⁵, m/m decreases as φ increases.
1.2
1.15
1.1
1.05
110–7 10–6 10–5 10–4
φ10–3 10–2
m/m
Figure 5.13 Evolution of m/m with the volume fraction φ. Reproduced by permission ofElsevier.
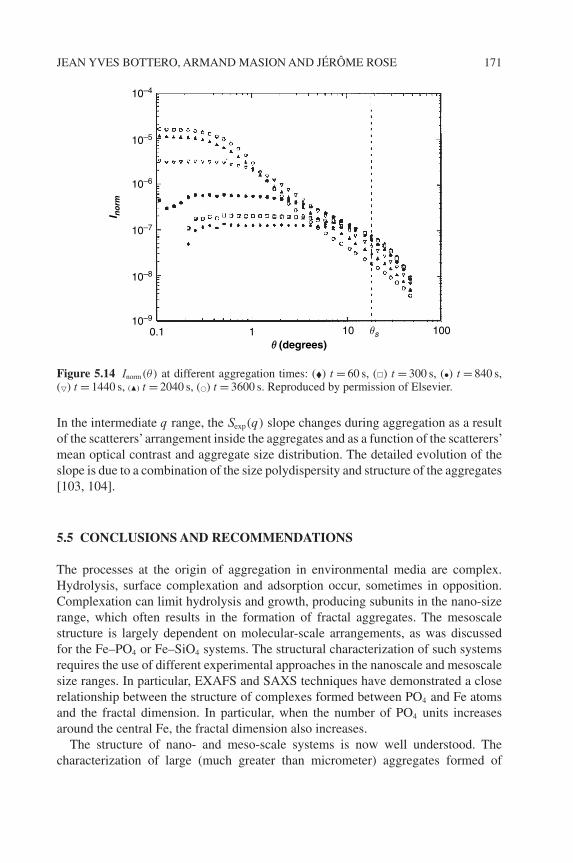
For aggregates of latex beads, the normalized intensity Inorm(θ) decreases as afunction of the scattering angle in the high q range. Figure 5.14 shows the normalizedscattering intensities for a velocity gradient G of 63 s−1 [98]. During aggregation,the local average number of neighbors around the scatterer increases. As previouslyobserved (Figure 5.13), the increased concentration of local scatterers is associatedwith a decrease of normalized scattered intensity Inorm(θ) at large angles. Using themean field approximation [19], it is possible to associate a mean optical contrast [101]with each aggregation step. Using the same data treatment procedure as was appliedto latex beads in suspension, the normalized scattering intensity at the angle θs (orqs) can be used to extract the value of the mean optical contrast m/m which best fitsInorm(θs) values.
When the mean optical contrast m/m is known, it is possible to compute the formfactor I rs,ns/n(q) by taking into account the mean environment of scatterers in theaggregate. In such a case, fractal dimensions can be calculated from the establishedcorrelation [101] and an experimental structure factor Sexp(q) can be extracted. Asaggregation proceeds, the variation of Df can be plotted as a function of the m/m ratio.This procedure allows the calculation of fractal dimension for a scattering-angle rangeat which the scattering intensity is not ‘polluted’ by the aggregate size distribution.
JEAN YVES BOTTERO, ARMAND MASION AND JÉRÔME ROSE 171
10–4
10–5
10–6
10–7
10–8
10–9
0.1 1 10 100θs
θ (degrees)
I no
rm
Figure 5.14 Inorm(θ) at different aggregation times: (�) t = 60 s, (�) t = 300 s, (•) t = 840 s,(�) t = 1440 s, (�) t = 2040 s, (©) t = 3600 s. Reproduced by permission of Elsevier.
In the intermediate q range, the Sexp(q) slope changes during aggregation as a resultof the scatterers’arrangement inside the aggregates and as a function of the scatterers’mean optical contrast and aggregate size distribution. The detailed evolution of theslope is due to a combination of the size polydispersity and structure of the aggregates[103, 104].
5.5 CONCLUSIONS AND RECOMMENDATIONS
The processes at the origin of aggregation in environmental media are complex.Hydrolysis, surface complexation and adsorption occur, sometimes in opposition.Complexation can limit hydrolysis and growth, producing subunits in the nano-sizerange, which often results in the formation of fractal aggregates. The mesoscalestructure is largely dependent on molecular-scale arrangements, as was discussedfor the Fe–PO4 or Fe–SiO4 systems. The structural characterization of such systemsrequires the use of different experimental approaches in the nanoscale and mesoscalesize ranges. In particular, EXAFS and SAXS techniques have demonstrated a closerelationship between the structure of complexes formed between PO4 and Fe atomsand the fractal dimension. In particular, when the number of PO4 units increasesaround the central Fe, the fractal dimension also increases.
The structure of nano- and meso-scale systems is now well understood. Thecharacterization of large (much greater than micrometer) aggregates formed of
172 FRACTAL MECHANISMS IN COAGULATION/FLOCCULATION
micrometer-sized subunits using spectroscopy (e.g. light scattering) is not trivial.The necessity to have fast and reliable measurements of the structure and/or sizedistribution is of high interest. Recent work has shown that data should be revisedin the light of this new approach. The good agreement between the structural val-ues calculated from surface quasi-elastic light scattering and classical light scatteringdemonstrates that the fractal dimension can be determined from large angle staticlight scattering measurements. Both techniques allow the non-destructive, rapid (lessthan 30 minutes per sample), in situ structural determination of fractal aggregates.Nevertheless, structural information can only be extracted in cases where the natureand shape of the subunits are well known.
LIST OF ABBREVIATIONS AND SYMBOLS
EXAFS extended X-ray absorption fine structureNMR nuclear magnetic resonancePCS photon correlation spectroscopySAXS small-angle X-ray scatteringXAS X-ray absorption spectroscopyXRD X-ray diffractionZPC zero point of charged interference distanceDf fractal dimensionDT translational diffusion coefficientF(q) form factorg(r) first order of the auto-correlation functionI (q) Scattering intensity versus the moment of the wave vector q
IN(q) normalized by N (number of dispersed particles) of I (q)
Inum(θ) numerical intensityIexp(θ) experimental intensity I
m = ns/nm initial optical contrastn mean optical indexnm optical index of the mediumns/n scatterers’ mean optical contrastNtot total number of Fe neighborsVs primary scatterer volumeVcell scattering volumeP (r) autocorrelation functionq moment of the wave vector q = 4π sin θ/λ
r distancerH hydrodynamic radiusrs radius of the subunitR radius
JEAN YVES BOTTERO, ARMAND MASION AND JÉRÔME ROSE 173
S(q) structure factor or interference functionV volumeφ volume fraction of scatterersγ (r) pair-correlation functionλ wavelength of the incident beam2θ scattering angle
REFERENCES
[1] Mandelbrot, B. (1982). The Fractal Geometry of Nature. W.H. Freeman, New York.[2] Meakin, P. (1984). Computer simulation of cluster–cluster aggregation using linear tra-
jectories: results from three-dimensional simulations and a comparison with aggregatesformed using Brownian trajectories. J. Colloid Interface Sci., 102, 505–512.
[3] Meakin, P. and Jullien, R. (1988).The effects of restructuring on the geometry of clustersformed by diffusion-limited, ballistic, and reaction-limited cluster cluster aggregation.J. Chem. Phys., 89, 246–250.
[4] Vicsek, T. (1989). Fractal Growth Phenomena. World Scientific, London.[5] Meakin, P. (1990). The effects of attractive and repulsive interactions on 3-dimensional
reaction-limited aggregation, J. Colloid Interface Sci., 134, 235–244.[6] Li, D. and Ganczarczyk, J.J. (1990). Structure of activated sludge flocs. Biotechnol.
Bioeng., 35, 57–65.[7] Li, D. and Ganczarczyk, J.J. (1991). Size distribution of activated sludge flocs. Res.
J. Water Pollut. Cont. Fed., 63, 806–814.[8] Zartarian, F., Mustin, C., Villemin, G., Ait-Ettager, T., Thill, A., Bottero, J.Y., Mallet, J.L.
and Snidaro, D. (1997). Three-dimensional modeling of an activated sludge floc.Langmuir, 13, 35–40.
[9] Lambert, S., Moustier, S., Dussouillez, P., Barakat, M., Bottero, J.Y., Petit, J.L. andGinestet, P. (2003). Analysis of the structure of very large bacterial aggregates by small-angle multiple light scattering and confocal image analysis, J. Colloid Interface Sci.,262, 384–390.
[10] Bottero, J.Y., Tchoubar, D., Axelos, M.A.V., Quienne, P. and Fiessinger, F. (1990). Floc-culation of silica colloids with hydroxy aluminum polycations. Relation between flocstructure and aggregation mechanisms. Langmuir, 6, 596–602.
[11] Masion, A., Vilgé-Ritter, A., Rose, J., Stone, W.E.E., Teppen, B.J., Rybacki, D. andBottero, J.Y. (2000). Coagulation–flocculation of natural organic matter with Al salts:speciation and structure of the aggregates. Environ. Sci. Technol., 34, 3242–3246.
[12] Johnson, C.P., Li, X. and Logan, B.E. (1996). Settling velocities of fractal aggregates.Environ. Sci. Technol., 30, 1911–1918.
[13] Adachi, Y. and Tanaka, Y. (1997). Settling velocity of an aluminium–kaolinite floc. WaterRes., 31, 449–454.
[14] Veerapaneni, S. and Wiesner, M.R. (1994). Particle deposition on an infinitely permeablesurface dependence of deposit morphology on particle size. J. Colloid Interface Sci., 162,110–122.
[15] Derjaguin, B.V. (1934). Friction and adhesion. IV. The theory of adhesion of smallparticles. Kolloid Z., 69, 155–164.
[16] Derjaguin, B.V. and Landau, L. (1941). Theory of the stability of strongly chargedlyophobic sols and the adhesion of strongly charged particles in solution of electrolytes.Acta Physicochim. URSS, 14, 1386–1399.
174 FRACTAL MECHANISMS IN COAGULATION/FLOCCULATION
[17] Verwey, E.J.W. and Overbeek, J.T.G. (1948). Theory of the Stability of LyophobicColloids. Elsevier, Amsterdam.
[18] Vicsek, T. (1983). Fractal models for diffusion controlled aggregation. J. Phys. A: Math.Gen., 16, L647–L652.
[19] Botet, R., Rannou, P. and Cabane, M. (1997). Mean-field approximation of Mie scatteringby fractal aggregates of identical spheres. Appl. Opt., 36, 8791–8797.
[20] Xu, Y.L. (1995). Electromagnetic scattering by an aggregate of spheres. Appl. Opt., 34,4573–4588.
[21] Botet, R., Rannou, P. and Cabane, M. (1995). Sensitivity of same optical-properties offractals to the cutoff functions. J. Phys. A: Math. Gen., 28, 297–316.
[22] Buffle, J. (1993). Sampling and characterization of environmental particles. In Envir-onmental Particles, Vol. 2, Buffle, J. and VanLeeuwen, H. P. (eds). Lewis, Chelsea,pp. 5–74.
[23] Brinker, C.J. and Sherer, G.W. (1990). Sol–Gel Science. The Physics and Chemistry ofSol–Gel Processing. Academic Press, San Diego, CA.
[24] Cornell, R.M. and Schwertmann, U. (1996). The Iron Oxides Structure, Properties,Reactions, Occurence and Uses. VCH, New-York.
[25] Jolivet, J.P., Livage, J. and Henry, M. (2000). Metal Oxide Chemistry and Synthesis:From Solution to Oxide. John Wiley & Sons, Ltd, Paris.
[26] VonGunten, U. and Schneider, W. (1991). Primary products of the oxygenation of iron(II)at an oxic–anoxic boundary: nucleation, aggregation and aging. J. Colloid Interface Sci.,145, 127–139.
[27] Schwertmann, U., Friedl, J. and Stanjek, H. (1999). From Fe(III) ions to ferrihydrite andthen to hematite. J. Colloid Interface Sci., 209, 215–223.
[28] Pokrovski, G.S., Schott, J., Farges, F. and Hazemann, J.L. (2003). Iron(III)–silica inter-actions in aqueous solution: insights from X-ray absorption fine structure spectroscopy.Geochim. Cosmochim. Acta, 67, 3559–3573.
[29] Sherman, D.M. and Randall, S.R. (2003). Surface complexation of arsenic(V) to iron(III)(hydr)oxides: structural mechanism from ab initio molecular geometries and EXAFSspectroscopy. Geochim. Cosmochim. Acta, 67, 4223–4230.
[30] Sigg, L. (1985). Metal transfer mechanisms in lakes; the role of settling particles. InChemical Processes in Lakes, Stumm, W. (ed.). John Wiley & Sons, Ltd, New York,pp. 283–310.
[31] Manceau, A. (1995). The mechanism of anion adsorption on iron oxides: evidence forthe bonding of arsenate tetrahedra on free Fe(O, OH)6 edges. Geochim. Cosmochim.Acta, 59, 3647–3653.
[32] Manceau,A., Schlegel, M.L., Musso, M., Sole, V.A., Gauthier, C., Petit, P.E. and Trolard,F. (2000). Crystal chemistry of trace elements in natural and synthetic goethite. Geochim.Cosmochim. Acta, 64, 3643–3662.
[33] Rose, J., Vilgé, A., Olivie-Lauquet, G., Masion, A., Frechou, C. and Bottero, J.Y. (1998).Iron speciation in natural organic matter colloids. Colloids Surf. A: Physicochem. Eng.Aspects, 136, 11–19.
[34] Buffle, J., Vitre, R.R.D., Perret, D. and Leppard, G.G. (1989). Physico-chemical charac-teristics of a colloidal iron phosphate species formed at the oxic–anoxic interface of aeutrophic lake. Geochim. Cosmochim. Acta, 53, 399–408.
[35] Waite, T.D. (2002). Challenges and opportunities in the use of iron in water andwastewater treatment. Rev. Environ. Sci. Biotechnol., 1, 9–15.
[36] Emmenegger, L., Schonenberger, R.R., Sigg, L. and Sulzberger, B. (2001). Light-induced redox cycling of iron in circumneutral lakes. Limnol. Oceanogr., 46, 49–61.
[37] Price, N.M. and Morel, F.M.M. (1998). Biological cycling of iron in the ocean. InMetal Ions in Biological Systems, Vol. 35, Sigel, A. and Sigel, H. (eds). Marcel Dekker,New York, pp. 1–36.
JEAN YVES BOTTERO, ARMAND MASION AND JÉRÔME ROSE 175
[38] Barbeau, K., Rue, E.L., Bruland, K.W. and Butler, A. (1991). Photochemical cycling ofiron in the surface ocean mediated by microbial iron(III)-binding ligands. Nature, 413,409–413.
[39] Leprince, A., Fiessinger, F. and Bottero, J.Y. (1984). Polymerized iron chloride: animproved inorganic coagulant. J. Am. Water Wks Assoc., 76, 93–97.
[40] Tchoubar, D. and Bottero, J.Y. (1996). Nucleation–growth in non-equilibrium conditionsof Al and Fe(III) oxide–hydroxide nanophases. C.R. Acad. Sci. Paris, 322, 523–534.
[41] Dousma, J. and DeBruyn, P.L. (1976). Hydrolysis–precipitation studies of iron solu-tions. I. Model for hydrolysis and precipitation from Fe(III) nitrate solutions. J. ColloidInterface Sci., 56, 527–539.
[42] Flynn, C.M. (1984). Hydrolysis of inorganic iron(III) salts. Chem. Rev., 84, 31–41.[43] Henry, M., Jolivet, J.P. and Livage, J. (1992). Aqueous chemistry of metal cations:
hydrolysis, condensation and complexation. In Structure and Bonding, Vol. 77, Reisfeld,R. and Jorgensen, C.K. (eds). Springer Verlag, Berlin, pp. 154–206.
[44] Schneider, W. (1984). Hydrolysis of iron(III) – chaotic olation versus nucleation.Comments Inorg. Chem., 3, 205–223.
[45] Schneider, W. (1988). Iron hydrolysis and the biochemistry of iron – the interplay ofhydroxide and biogenic ligand. Chimia, 42, 9–20.
[46] Combes, J.M., Manceau, A., Calas, G. and Bottero, J.Y. (1989). Formation of ferricoxides from aqueous solutions: a polyhedral approach by X-ray absorption spectroscopy.1. Hydrolysis and formation of ferric gels. Geochim. Cosmochim. Acta, 53, 583–594.
[47] Combes, J.M., Manceau, A. and Calas, G. (1990). Formation of ferric oxides fromaqueous solutions: a polyhedral approach by X-ray absorption spectroscopy: II. Hematiteformation from ferric gels. Geochim. Cosmochim. Acta, 54, 1083–1091.
[48] Bottero, J.Y., Tchoubar, D., Arnaud, M. and Quienne, P. (1991). Partial hydrolysis offerric nitrate salt. Structural investigation by dynamic light scattering and small angleX-ray scattering. Langmuir, 7, 1365–1369.
[49] Bottero, J.Y., Arnaud, M., Villiéras, F., Michot, L.J., DeDonato, P. and François, M.(1993). Surface and textural heterogeneity of fresh hydrous ferric oxides in water andin the dry state. J. Colloid Interface Sci., 159, 45–52.
[50] Bottero, J.Y., Manceau, A., Villiéras, F. and Tchoubar, D. (1994). Structure andmechanisms of formation of FeOOH(Cl) polymers. Langmuir, 10, 316–319.
[51] Rose, J., Manceau, A., Masion, A. and Bottero, J.Y. (1997). Structure and mechanismsof formation of FeOOH(NO3) oligomers at the early stages of hydrolysis. Langmuir, 13,3240–3246.
[52] Johnston, J.H. and Lewis, D.G. (1986). A study of the initially formed hydrolysis speciesand intermediate polymers and their role in determining the product iron oxides formedin the weathering of iron. In Industrial Applications of the Mössbauer Effect, Long, G.J.and Stevens, J.G. (eds). Plenum Press, New York, pp. 565–593.
[53] Manceau, A. and Combes, J.M. (1988). Structure of Mn and Fe oxides and oxyhydrox-ides – a topological approach by EXAFS. Phys. Chem. Miner., 15, 283–295.
[54] Janney, D.E., Cowley, J.M. and Buseck, P.R. (2001). Structure of synthetic 6-lineferrihydrite by electron nanodiffraction. Am. Mineral., 86, 327–335.
[55] Michot, L.J., Montarges-Pelletier, E., Lartiges, B.S., D’Espinose, J.B. and Briois, V.(2000). Formation mechanism of the Ga13 Keggin ion: a combined EXAFS and NMRstudy. J. Am. Chem. Soc., 122, 6048–6056.
[56] Ciavatta, L. and Grimaldi, M. (1975). On the hydrolysis of the iron(III) ion, Fe3+, inperchlorate media. J. Inorg. Nucl. Chem., 37, 163–169.
[57] Bradley, S.M. and Kydd, R.A. (1993). Comparison of the species formed upon basehydrolyses of gallium(III) and iron(III) aqueous solutions: the possibility of exist-ence of an [FeO4Fe12(OH)24(H2O)12]7+ polyoxocation, J. Chem. Soc. Dalton Trans.,2407–2413.
176 FRACTAL MECHANISMS IN COAGULATION/FLOCCULATION
[58] Tchoubar, D., Bottero, J.Y., Quienne, P. and Arnaud, M. (1991). Partial hydrolysis offerric chloride salt. Structural investigation by photon correlation spectroscopy and smallangle X-ray scattering. Langmuir, 7, 398–402.
[59] Kandori, K., Aoki, Y., Yasukawa, A. and Ishikawa, T. (1998). Effects of metal ions onthe morphology and structure of haematite particles produced from forced hydrolysisreaction. J. Mater. Chem., 8, 2287–2292.
[60] Schneider, W. and Schwyn, B. (1987). The hydrolysis of iron in synthetic, biologcal,and aquatic media. In Aquatic Surface Chemistry, Stumm, W. (ed.). Wiley-Interscience,New York, pp. 167–196.
[61] Kandori, K., Uchida, S., Kataoka, S. and Ishikawa, T. (1992). Effects of silicate andphosphate ions on the formation of ferric oxide hydroxide particles. J. Mater. Sci., 27,719–728.
[62] He, Q.H., Leppard, G.G., Paige, C.R. and Snodgrass, W.J. (1996). Transmission electronmicroscopy of a phosphate effect on the colloid structure of iron hydroxide. Water Res.,30, 1345–1352.
[63] Deng, Y. (1997). Formation of iron(III) hydroxides from homogeneous solutions. WaterRes., 31, 1347–1354.
[64] Masion, A., Rose, J., Bottero, J.Y., Tchoubar, D. and Garcia, F. (1997). Nucleation andgrowth mechanisms of Fe oxyhydroxides in the presence of PO4 ions. 4. Structure ofthe aggregates. Langmuir, 13, 3886–3889.
[65] Vilgé-Ritter, A., Rose, J., Masion, A., Bottero, J.Y. and Lainé, J.M. (1999). Chemistryand structure of aggregates formed with Fe salts and natural organic matter. ColloidsSurf. A: Physicochem. Eng. Aspects, 147, 297–308.
[66] Mayer, T.D. and Jarrell, W.M. (2000). Phosphorus sorption during iron(II) oxidation inthe presence of dissolved silica. Water Res., 34, 3949–3956.
[67] Pullin, M.J. and Cabaniss, S.E. (2003). The effects of pH, ionic strength, and iron–fulvicacid interactions on the kinetics of non-photochemical iron transformations. I. Iron(II)oxidation and iron(III) colloid formation. Geochim. Cosmochim. Acta, 67, 4067–4077.
[68] Rose, J., Manceau, A., Bottero, J.Y., Masion, A. and Garcia, F. (1996). Nucleation andgrowth mechanisms of Fe oxyhydroxide in the presence of PO4 ions. 1. Fe K-edgeEXAFS study. Langmuir, 12, 6701–6707.
[69] Rose, J., Flanck, A.M., Masion, A., Bottero, J.Y. and Elmerich, P. (1997). Nucleationand growth mechanisms of Fe oxyhydroxides in the presence of PO4 ions. 2. P K-edgeEXAFS study. Langmuir, 13, 1827–1834.
[70] Masion, A., Rose, J., Bottero, J.Y., Tchoubar, D. and Elmerich, P. (1997). Nucleationand growth mechanisms of Fe oxyhydroxides in the presence of PO4 ions. 3. Speciationof Fe by small angle X-ray scattering. Langmuir, 13, 3882–3885.
[71] Weber, W.J. and Stumm, W. (1965). Formation of a silicato-iron(III) complex in diluteaqueous solution. J. Inorg. Nucl. Chem., 27, 237–239.
[72] Cornell, R.M. and Giovanoli, R. (1987). The influence of silicate species on the mor-phology of goethite (�-FeOOH) grown from ferrihydrite (5Fe2O3 ·9H2O). J. Chem. SocChem. Commun., 413–414.
[73] Glasauer, S., Friedl, J. and Schwertmann, U. (1999). Properties of goethites preparedunder acidic and basic conditions in the presence of silicate. J. Colloid Interface Sci.,216, 106–115.
[74] Anderson, P.R. and Benjamin, M.M. (1985). Effects of silicon on the crystallization andadsorption properties of ferric oxides. Environ. Sci. Technol., 19, 1048–1053.
[75] Vempati, R.K. and Loeppert, R.H. (1989). Influence of structural and adsorbed Si on thetransformation of synthetic ferrihydrite. Clays Clay Miner., 37, 273–279.
[76] Hansen, H.C.B., Raben-Lange, B., Raulund-Rasmussen, K. and Borggaard, O.K. (1994).Monosilicate adsorption by ferrihydrite and goethite at pH 3–6. Soil Sci., 158, 40–46.
JEAN YVES BOTTERO, ARMAND MASION AND JÉRÔME ROSE 177
[77] Hansen, H.C.B., Wechte, T.P., Raulund-Rasmussen, K. and Borggaard, O.K. (1994).Stability constants for silicate adsorbed to ferrihydrite. Clay Miner., 29, 341–350.
[78] Swedlund, P.J. and Webster, J.G. (1999). Adsorption and polymerisation of silicic acidon ferrihydrite, and its effect on arsenic adsorption, Wat. Res., 33, 3413–3422.
[79] Glasauer, S., Hug, P., Weidler, P.G. and Gehring, A.U. (2000). Inhibition of sinteringby Si during the conversion of Si-rich ferrihydrite to hematite. Clays Clay Miner., 48,51–56.
[80] Doelsch, E., Rose, J., Masion, A., Bottero, J.Y., Nahon, D. and Bertsch, P.M. (2000).Speciation and crystal chemistry of iron(III) chloride hydrolyzed in the presence of SiO4
ligands. 1. An Fe K-edge EXAFS study. Langmuir, 16, 4726–4731.[81] Doelsch, E., Stone, W.E.E., Petit, S., Masion, A., Rose, J., Bottero, J.Y. and Nahon, D.
(2001). Speciation and crystal chemistry of Fe(III) chloride hydrolyzed in the presenceof SiO4 ligands. 2. Characterization of Si–Fe aggregates by FTIR and 29Si solid stateNMR. Langmuir, 17, 1399–1405.
[82] Masion, A., Doelsch, E., Rose, J., Moustier, S., Bottero, J.Y. and Bertsch, P.M. (2001).Speciation and crystal chemistry of iron(III) chloride hydrolyzed in the presence of SiO4
ligands. 3. Semi-local scale structure of the aggregates. Langmuir, 17, 4753–4757.[83] Doelsch, E. (2000) Le système Fe(II)–Fe(III)/Si en milieu aqueux. Caractérisation multi-
échelles. Thesis, Aix-Marseille 3, Aix en Provence.[84] Manceau, A., Ildefonse, P., Hazemann, J.L., Flank, A.M. and Gallup, D. (1995). Crystal-
chemistry of hydrous iron silicate scale deposits at the Salton-Sea geothermal-field.Clays Clay Miner., 43, 304–317.
[85] Masion, A., Tchoubar, D., Bottero, J.Y., Thomas, F. and Villiéras, F. (1994). Chem-istry and structure of Al(OH)/organic precipitates. A small angle X-ray scattering study.1. Numerical procedure for speciation from scattering curves. Langmuir, 10, 4344–4348.
[86] Masion, A., Bottero, J.Y., Thomas, F. and Tchoubar, D. (1994). Chemistry and structureof Al(OH)/organic precipitates. A small angle X-ray scattering study. 2. Speciation andstructure of the aggregates. Langmuir, 10, 4349–4352.
[87] Masion, A., Thomas. F., Tchoubar, D., Bottero, J.Y. and Tekely, P. (1994). Chem-istry and structure of Al(OH)/organic precipitates. A small angle X-ray scatteringstudy. 3. Depolymerization of the Al13 polycation by organic ligands. Langmuir, 10,4353–4356.
[88] Amirbahman, A., Gfeller, M. and Furrer, G. (2000). Kinetics and mechanisms of ligand-promoted decomposition of the Keggin Al13 polymer. Geochim. Cosmochim. Acta, 64,911–919.
[89] Bushell, G.C., Yan, Y.D., Woodfield, D., Raper, J. and Amal, R. (2002). On techniquesfor the measurement of the mass fractal dimension of aggregates. Adv. Colloid InterfaceSci., 95, 1–50.
[90] Axelos, M.A.V., Tchoubar, D. and Bottero, J.Y. (1989). Small angle X-ray scatteringinvestigation of the silica/water interface: evolution of the structure with pH. Langmuir,5, 1186–1190.
[91] Zhang, J., Huguenard, C., Scarnecchia, C., Menghetti, R. and Buffle, J. (1999). Stabiliz-ation and destabilization of hematite suspensions by neutral and anionic polyacrylamide.Colloids Surf. A: Physicochem. Eng. Aspects, 151, 49–63.
[92] Zartarian, F., Mustin, C., Bottero, J.Y., Villemin, G., Thomas, F., Allières, L.,Champenois, M., Grulois, P. and Manem, J. (1994). Spatial arrangement of thecomponents of activated sludge flocs. Water Sci. Technol., 30, 243–250.
[93] Zhang, J. and Buffle, J. (1996). Multi-method determination of the fractal dimension ofhematite aggregates. Colloids Surf. A: Physicochem. Eng. Aspects, 107, 175–187.
[94] Sorensen, C.M., Cai, J. and Lu, N. (1992). Light-scattering measurements of monomersize, monomers per aggregate, and fractal dimension for soot aggregates in flames. Appl.Opt., 31, 6547–6557.
178 FRACTAL MECHANISMS IN COAGULATION/FLOCCULATION
[95] Teixeira, J. (1986). Experimental methods for studying fractal aggregates. In On Growthand Form, Stanley, H.E. and Ostrowsky, N. (eds). Martinus Nijhoff, Boston, MA,pp. 145–162.
[96] Rarity, J.G. and Pusey, P.N. (1986). Light scattering from aggregating systems: static,dynamic (QELS) and number fluctuations. In On Growth and Form, Stanley, H.E. andOstrowsky, N. (eds). Martinus Nijhoff, Boston, MA, pp. 218–222.
[97] Waite, T.D. (1999). Measurement and implications of floc structure in water andwastewater treatment. Colloids Surf. A: Physicochem. Eng. Aspects, 151, 27–41.
[98] Thill, A., Veerapaneni, S., Simon, B., Wiesner, M., Bottero, J.Y. and Snidaro, D.(1998). Determination of structure of aggregates by confocal scanning laser microscopy.J. Colloid Interface Sci., 204, 357–362.
[99] Oles, V. (1992). Shear-induced aggregation and breakup of polystyrene latex particles.J. Colloid Interface Sci., 154, 351–358.
[100] Xu, Y.L. and Gustafson, B.A.S. (1997). Experimental and theoretical results of lightscattering by aggregates of spheres. Appl. Opt., 36, 8026–8030.
[101] Lambert, S., Thill, A., Ginestet, P., Audic, J.M. and Bottero, J.Y. (2000). Structuralinterpretations of static light scattering patterns of fractal aggregates: I. Introduction ofa mean optical index: numerical simulations. J. Colloid Interface Sci., 228, 379–385.
[102] Bohren, C.F. and Huffman, D.R. (1983). Absorption and Scattering of Light by SmallParticles. John Wiley & Sons, Ltd, New York.
[103] Thill, A., Lambert, S., Moustier, S., Ginestet, P., Audic, J.M. and Bottero, J.Y. (2000).Structural interpretations of static light scattering patterns of fractal aggregates: II.Experimental study. J. Colloid Interface Sci., 228, 386–392.
[104] Teixeira, J. (1988). Small-angle scattering by fractal systems. J. Appl. Crystallogr., 21,781–785.