Embed Size (px)
Citation preview
Szent István University, Gödöllő, Hungary Czech University of Life Sciences Prague, Czech Republic Institute of Agrophysics Polish Academy of Sciences, Lublin, Poland Polish Academy of Sciences, Branch in Lublin Poland Slovak University of Agriculture Nitra, Slovak Republic
BOOK OF ABSTRACTS
May 27-29, 2015 Gödöllő, Hungary
BioPhys Spring 2015
BPS 2015
14th International Workshop for Young Scientists
SZENT ISTVÁN UNIVERSITY GÖDÖLLŐ
Department of Physics and Process Control
14th International Workshop for Young Scientists
BBiiooPPhhyyss SSpprriinngg 22001155
BBPPSS 22001155
BOOK OF ABSTRACTS
May 27-29, 2015 Gödöllő, Hungary
Edited by: István Farkas and Piroska Víg
Copyright© 2015 by Szent István University, Gödöllő, Hungary
ISBN 978-83-89969-37-8
Edition: 100 copies Printed by Perfekta info www.perfekta.info.pl
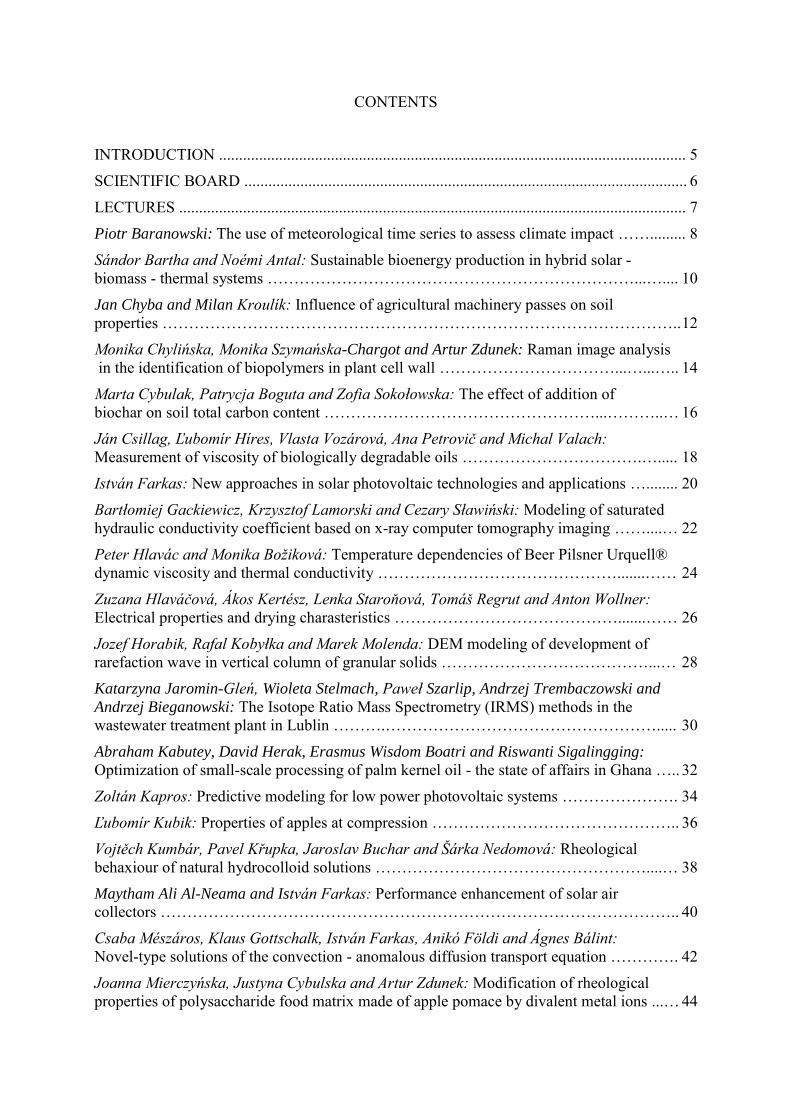
CONTENTS
INTRODUCTION ..................................................................................................................... 5
SCIENTIFIC BOARD ............................................................................................................... 6
LECTURES ............................................................................................................................... 7
Piotr Baranowski: The use of meteorological time series to assess climate impact ……......... 8
Sándor Bartha and Noémi Antal: Sustainable bioenergy production in hybrid solar - biomass - thermal systems ……………………………………………………………...….... 10
Jan Chyba and Milan Kroulík: Influence of agricultural machinery passes on soil properties …………………………………………………………………………………….. 12
Monika Chylińska, Monika Szymańska-Chargot and Artur Zdunek: Raman image analysis in the identification of biopolymers in plant cell wall ……………………………...…...….. 14
Marta Cybulak, Patrycja Boguta and Zofia Sokołowska: The effect of addition of biochar on soil total carbon content ……………………………………………...………..… 16
Ján Csillag, Ľubomír Híres, Vlasta Vozárová, Ana Petrovič and Michal Valach: Measurement of viscosity of biologically degradable oils …………………………….…..... 18
István Farkas: New approaches in solar photovoltaic technologies and applications …........ 20
Bartłomiej Gackiewicz, Krzysztof Lamorski and Cezary Sławiński: Modeling of saturated hydraulic conductivity coefficient based on x-ray computer tomography imaging ……....… 22
Peter Hlavác and Monika Božiková: Temperature dependencies of Beer Pilsner Urquell® dynamic viscosity and thermal conductivity ……………………………………….......…… 24
Zuzana Hlaváčová, Ákos Kertész, Lenka Staroňová, Tomáš Regrut and Anton Wollner: Electrical properties and drying charasteristics …………………………………….......…… 26
Jozef Horabik, Rafal Kobyłka and Marek Molenda: DEM modeling of development of rarefaction wave in vertical column of granular solids …………………………………...… 28
Katarzyna Jaromin-Gleń, Wioleta Stelmach, Paweł Szarlip, Andrzej Trembaczowski and
Andrzej Bieganowski: The Isotope Ratio Mass Spectrometry (IRMS) methods in the wastewater treatment plant in Lublin ……….……………………………………………..... 30
Abraham Kabutey, David Herak, Erasmus Wisdom Boatri and Riswanti Sigalingging: Optimization of small-scale processing of palm kernel oil - the state of affairs in Ghana ….. 32
Zoltán Kapros: Predictive modeling for low power photovoltaic systems …………………. 34
Ľubomír Kubik: Properties of apples at compression ……………………………………….. 36
Vojtěch Kumbár, Pavel Křupka, Jaroslav Buchar and Šárka Nedomová: Rheological behaxiour of natural hydrocolloid solutions ……………………………………………....… 38
Maytham Ali Al-Neama and István Farkas: Performance enhancement of solar air collectors …………………………………………………………………………………….. 40
Csaba Mészáros, Klaus Gottschalk, István Farkas, Anikó Földi and Ágnes Bálint: Novel-type solutions of the convection - anomalous diffusion transport equation …………. 42
Joanna Mierczyńska, Justyna Cybulska and Artur Zdunek: Modification of rheological properties of polysaccharide food matrix made of apple pomace by divalent metal ions ...… 44
Jacek Panek and Magdalena Frąc: Evaluation and optimization of DNA extraction procedures for Talaromyces flavus ………………………………………………………..… 46
Ana Petrović,Vlasta Vozárová, Jana Šmitalová, Ján Csillag and Lubomír Híreš: Freezing and defrosting of dough investigation by DSC method …………………………………….. 48
Adam Polcar, Vojtěch Kumbár and Jiří Votava: Evaulation of biophysical data by Multi-Dimensional Regression Analysis …………………………………………………………... 50
Dani Rusirawan, Nurul Imam Muhlis and István Farkas: Characterization of photovoltaic system ……………………………………………………………………………………….. 52
István Seres, Piroska Víg and István Róbert Nikolényi: Biophysical experiments with materials under extreme conditions ...............................................................……………….. 54
Joanna Siecińska and Artur Nosalewicz: Plant drought memory as potential tool for improving drought tolerance ……………………………………………………………….... 56
Anna Siedliska and Piotr Baranowski: Supervised classification of cultivars and pits in cherries based on hyperspectral imaging data …………………………………………….… 58
Natália Simon, Klára Pásztor-Huszár, Tímea Kaszab and József Felföldi: Texture analaysis of semi-hard cheese types by different non-destructive and destructive methods during ripening ……………………………………………………………………………..... 60
János Tóth and János Buzás: Development of a data logging, monitoring and control software in connection with a database server ………………….………………………….... 62
Michal Valach, Vlasta Vozarová, Monika Božiková and Ľubomír Híreš: Determination of biofuels impurities by particle size analyzer ……………………………………………........ 64
Nikola Žemličková and Petr Šařec: Soil compaction assessment using Cone Index ……….. 66
Henrik Zsiborács, Gábor Pintér, Béla Pályi and Botond Cseke: Economic questions of the vanadium redox flow battery and the lithium battery energy storage systems in household size …………………………………………………………………………………………... 68
LIST OF AUTHORS ............................................................................................................... 70
14th International Workshop for Young Scientists, BioPhys Spring 2015, May 27-29, 2015, Gödöllő, Hungary
5
INTRODUCTION
Dear Friends and Colleagues,
It is really my great pleasure to welcome you in attending the 14th International Workshop for Young Scientists "BioPhys Spring 2015" (BPS 2015) which, this time, going to be held in Gödöllő, Hungary during May 27-29, 2015. The meeting continues the tradition of previous workshops oriented on training of young researchers and exchange of professional experience in the field of physics applied to biological, agricultural and food systems as well.
It is cordially invited the young scientists to participate in the activity of BPS 2015 Workshop, and to present their results of research in application of physics to life sciences. The Workshop is to be organised as an opened English spoken event without registration fee.
Two-page abstracts of contributions are published in an ISBN numbered printed BPS Book of Abstracts. Additionally selected papers can be submitted for publication in the Mechanical Engineering Letters Journal to be published in autumn of 2015.
It is my pleasure to invite you to spend a few days of May 2015 in friendly atmosphere between young people in Gödöllő.
During your stay, you may visit the facilities of the Szent István University Campus, the laboratories and installations of the Department of Physics and Process Control and of course, the city of Gödöllő and its area.
Special thanks are devoted to the Mechanical Engineering PhD School, Szent István University, Gödöllő, Hungary for the support of organizing the event of BPS 2015.
Prof. I. Farkas
Chairman, BPS 2015
14th International Workshop for Young Scientists, BioPhys Spring 2015, May 27-29, 2015, Gödöllő, Hungary
6
SCIENCIFIC BOARD
Prof. RNDR. Ing. Jiry Blahovec, DrSc Czech University of Life Sciences Prague, Czech Republic
Prof. Dr. Istvan Farkas Szent István University, Gödöllő, Hungary
Prof. Dr. hab. Jan Glinski President of the Lublin Branch of Polish Academy of Sciences, Lublin, Poland
Doc. RNDr. Zuzana Hlavacova, CSc Slovak University of Agriculture, Nitra, Slovak Republic
Prof. Dr. hab. Józef Horabik Institute of Agrophysics Polish Academy of Sciences, Lublin, Poland
Prof. dr. Martin Libra Czech University of Life Sciences Prague, Czech Republic
Ass. Prof. dr István Seres Szent István University, Gödöllő, Hungary
RNDr. Vlasta Vozarova, PhD Slovak University of Agriculture, Nitra, Slovak Republic

14th International Workshop for Young Scientists, BioPhys Spring 2015, May 27-29, 2015, Gödöllő, Hungary
7
LECTURES
14th International Workshop for Young Scientists, BioPhys Spring 2015, May 27-29, 2015, Gödöllő, Hungary
8
THE USE OF METEOROLOGICAL TIME SERIES TO ASSESS CLIMATE IMPACT
Piotr Baranowski
Institute of Agrophysics Polish Academy of Sciences, Doświadczalna 4, 20-290 Lublin, Poland
Abstract: The aim of this study is to present chosen methods of the analysis of the long-term meteorological time series to access climate impact.
Keywords: time series, multifractal analysis, forecasting
Introduction Meteorological time series are an important source of information for agricultural planning, because every farm operation and the process of plant growth and development as well as the yield of a crop are strongly affected by weather conditions. The modelling and forecasting of meteorological time series let us understand the variation of climatic conditions in micro- and regional scales and better evaluate the effects of climate change on crop production. The historical and contemporary meteorological data are the main source of input to climate change models. The standard approach to detect climatic changes consists in measuring trends and oscillations of the relevant meteorological quantities. However, this classical approach gives satisfactory results only in climatic zones with extreme climate change dynamics. Therefore, more subtle methods are being developed and applied in order to project changes of meteorological parameters. These include fractal analysis and chaotic evolution analysis of the atmospheric system. The presence of long-range correlated structures in the time series is expressed by a power-law shape of the power spectrum, being linear if plotted on log-log scales. Such behaviour, called scaling, allows quantifying the strength of the temporal fluctuations in the process by estimating the scaling exponents. The multifractal analysis is a powerful method to characterize long-range correlations within the time series through calculation of different scaling exponents for different parts of the series.
Material and method The studied methods include: the decomposition of the time series, the multifractal detrended fluctuation analysis (MFDFA), the exponential smoothing methods of forecasting and Impact Response Surfaces (IRSs).
The analyses were performed with 31 years measured time series of daily air temperature, soil temperature, wind velocity, relative air humidity, global radiation and precipitation for stations located in Finland, Germany, Poland and Spain. The decomposition of the time series revealed very small increasing or no trend and specific seasonal features. Taking into account the decomposition results as well as autocorrelation function (ACF) and partial autocorrelation function (PACF) plots for all the studied series the appropriate forecasting models based on the exponential smoothing were selected.
Results
To determine the optimum parameters of the chosen models, two statistical measures: the mean absolute error (MSE) and the mean squared error (MSE) were used. Because of its
14th International Workshop for Young Scientists, BioPhys Spring 2015, May 27-29, 2015, Gödöllő, Hungary
9
simplicity and exactness, the exponential smoothing method showed to be very useful for mean temperature, precipitation and wind speed forecasting
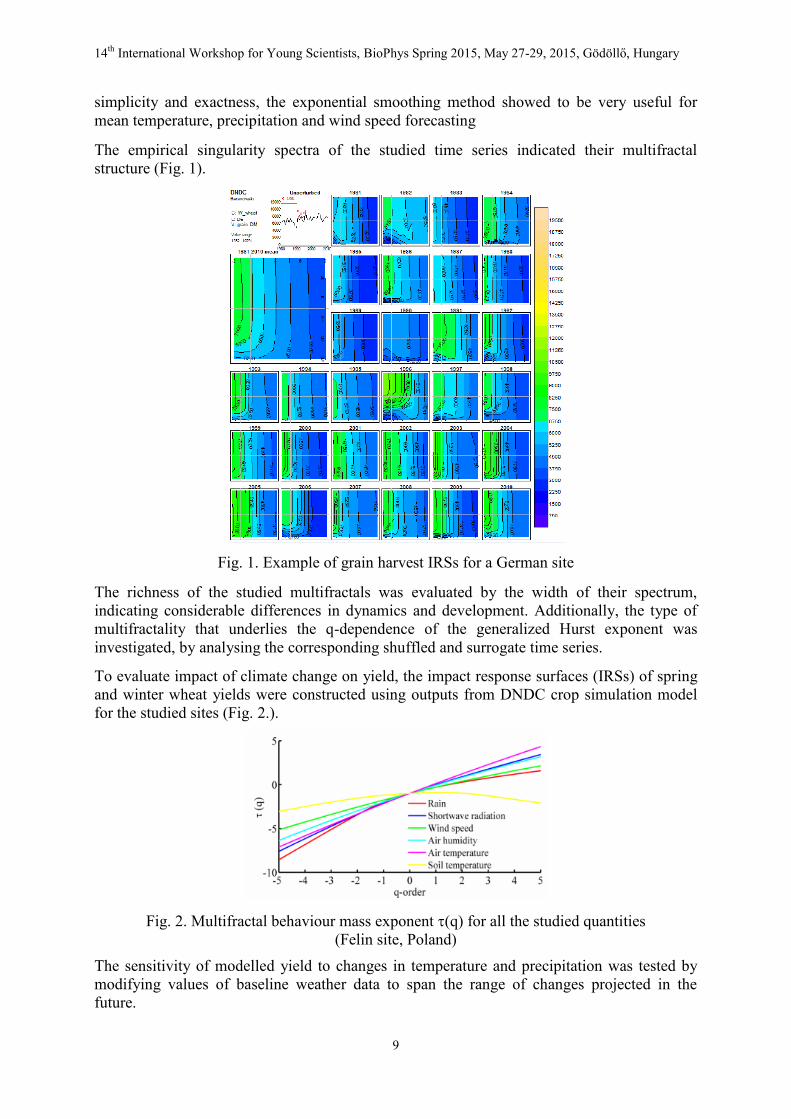
The empirical singularity spectra of the studied time series indicated their multifractal structure (Fig. 1).
Fig. 1. Example of grain harvest IRSs for a German site
The richness of the studied multifractals was evaluated by the width of their spectrum, indicating considerable differences in dynamics and development. Additionally, the type of multifractality that underlies the q-dependence of the generalized Hurst exponent was investigated, by analysing the corresponding shuffled and surrogate time series.
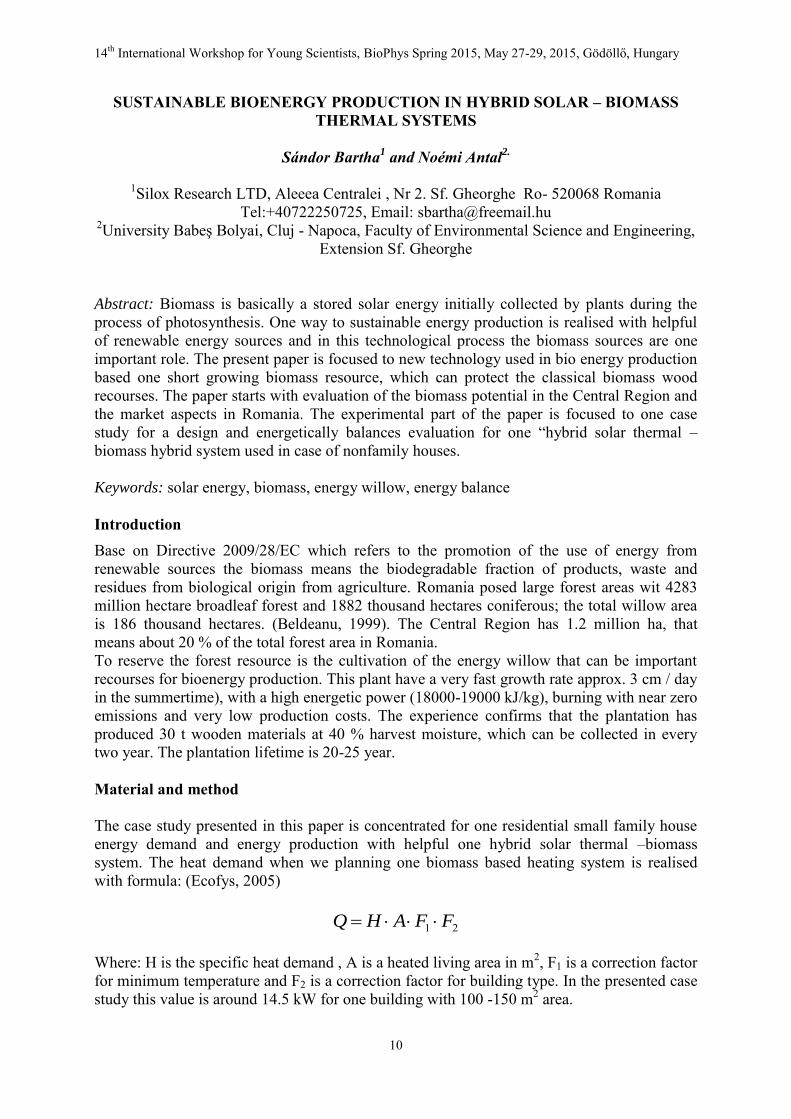
To evaluate impact of climate change on yield, the impact response surfaces (IRSs) of spring and winter wheat yields were constructed using outputs from DNDC crop simulation model for the studied sites (Fig. 2.).
Fig. 2. Multifractal behaviour mass exponent (q) for all the studied quantities
(Felin site, Poland)
The sensitivity of modelled yield to changes in temperature and precipitation was tested by modifying values of baseline weather data to span the range of changes projected in the future.
14th International Workshop for Young Scientists, BioPhys Spring 2015, May 27-29, 2015, Gödöllő, Hungary
10
SUSTAINABLE BIOENERGY PRODUCTION IN HYBRID SOLAR – BIOMASS THERMAL SYSTEMS
Sándor Bartha
1 and Noémi Antal
2.
1Silox Research LTD, Aleeea Centralei , Nr 2. Sf. Gheorghe Ro- 520068 Romania
Tel:+40722250725, Email: [email protected] 2University Babeş Bolyai, Cluj - Napoca, Faculty of Environmental Science and Engineering,
Extension Sf. Gheorghe Abstract: Biomass is basically a stored solar energy initially collected by plants during the process of photosynthesis. One way to sustainable energy production is realised with helpful of renewable energy sources and in this technological process the biomass sources are one important role. The present paper is focused to new technology used in bio energy production based one short growing biomass resource, which can protect the classical biomass wood recourses. The paper starts with evaluation of the biomass potential in the Central Region and the market aspects in Romania. The experimental part of the paper is focused to one case study for a design and energetically balances evaluation for one “hybrid solar thermal – biomass hybrid system used in case of nonfamily houses. Keywords: solar energy, biomass, energy willow, energy balance Introduction Base on Directive 2009/28/EC which refers to the promotion of the use of energy from renewable sources the biomass means the biodegradable fraction of products, waste and residues from biological origin from agriculture. Romania posed large forest areas wit 4283 million hectare broadleaf forest and 1882 thousand hectares coniferous; the total willow area is 186 thousand hectares. (Beldeanu, 1999). The Central Region has 1.2 million ha, that means about 20 % of the total forest area in Romania. To reserve the forest resource is the cultivation of the energy willow that can be important recourses for bioenergy production. This plant have a very fast growth rate approx. 3 cm / day in the summertime), with a high energetic power (18000-19000 kJ/kg), burning with near zero emissions and very low production costs. The experience confirms that the plantation has produced 30 t wooden materials at 40 % harvest moisture, which can be collected in every two year. The plantation lifetime is 20-25 year. Material and method The case study presented in this paper is concentrated for one residential small family house energy demand and energy production with helpful one hybrid solar thermal –biomass system. The heat demand when we planning one biomass based heating system is realised with formula: (Ecofys, 2005)
21 FFAHQ
Where: H is the specific heat demand , A is a heated living area in m2, F1 is a correction factor for minimum temperature and F2 is a correction factor for building type. In the presented case study this value is around 14.5 kW for one building with 100 -150 m2 area.
14th International Workshop for Young Scientists, BioPhys Spring 2015, May 27-29, 2015, Gödöllő, Hungary
11
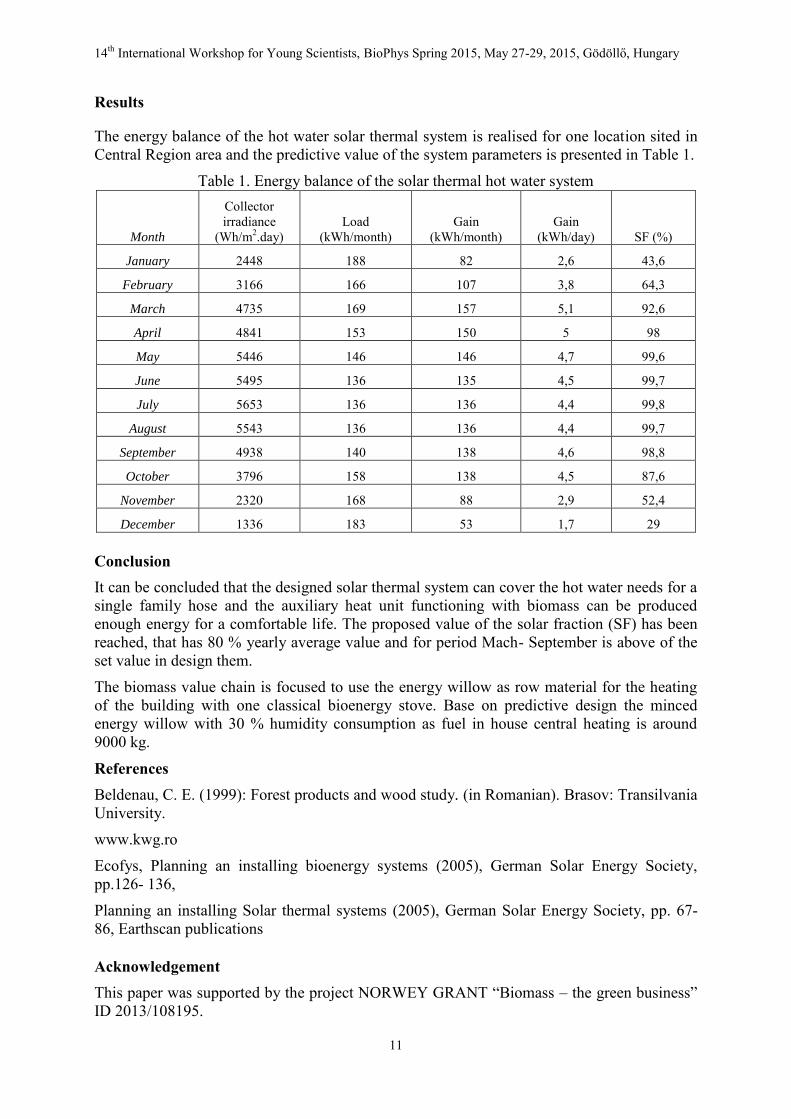
Results
The energy balance of the hot water solar thermal system is realised for one location sited in Central Region area and the predictive value of the system parameters is presented in Table 1.
Table 1. Energy balance of the solar thermal hot water system
Month
Collector irradiance
(Wh/m2.day) Load
(kWh/month) Gain
(kWh/month) Gain
(kWh/day) SF (%)
January 2448 188 82 2,6 43,6
February 3166 166 107 3,8 64,3
March 4735 169 157 5,1 92,6
April 4841 153 150 5 98
May 5446 146 146 4,7 99,6
June 5495 136 135 4,5 99,7
July 5653 136 136 4,4 99,8
August 5543 136 136 4,4 99,7
September 4938 140 138 4,6 98,8
October 3796 158 138 4,5 87,6
November 2320 168 88 2,9 52,4
December 1336 183 53 1,7 29
Conclusion It can be concluded that the designed solar thermal system can cover the hot water needs for a single family hose and the auxiliary heat unit functioning with biomass can be produced enough energy for a comfortable life. The proposed value of the solar fraction (SF) has been reached, that has 80 % yearly average value and for period Mach- September is above of the set value in design them.
The biomass value chain is focused to use the energy willow as row material for the heating of the building with one classical bioenergy stove. Base on predictive design the minced energy willow with 30 % humidity consumption as fuel in house central heating is around 9000 kg.
References Beldenau, C. E. (1999): Forest products and wood study. (in Romanian). Brasov: Transilvania University.
www.kwg.ro
Ecofys, Planning an installing bioenergy systems (2005), German Solar Energy Society, pp.126- 136,
Planning an installing Solar thermal systems (2005), German Solar Energy Society, pp. 67- 86, Earthscan publications
Acknowledgement This paper was supported by the project NORWEY GRANT “Biomass – the green business” ID 2013/108195.
14th International Workshop for Young Scientists, BioPhys Spring 2015, May 27-29, 2015, Gödöllő, Hungary
12
INFLUENCE OF AGRICULTURAL MACHINERY PASSES ON SOIL PROPERTIES
Jan Chyba and Milan Kroulík
Department of Agricultural Machines, Czech University of Life Sciences Prague Kamýcká 129., Prague, 165 21 Czech Republic Tel.: +420 22438 3160, Email: [email protected]
Abstract: Soil is an important material in human life, whether it is to walk on, build structures or to grow crops. Growing of plants is linked to technologies of soil tillage and crop seeding. One issue associated with new and larger working tools is an increase of weight and also increases in the demand for energy resources, as tractors need to be powerful to be able to provide enough power to move large agricultural equipment around fields. This paper shows how agricultural machinery influences soil properties, namely saturated hydraulic conductivity and cone index values. Keywords: cone index, saturated hydraulic conductivity, Soil compaction, soil infiltration rate Introduction Soil compaction is caused primarily by effects of the wheels on the soil surface by pressure and shear stress casters. Soil compaction affects mainly the physical properties of soil either in the short term or the long term. The negative effect of soil compaction is manifested for example by increasing bulk density, cone index, etc. while is reduced porosity, soil hydraulic properties, etc. All these parameters are interconnected and together affect crop yields.
Material and method Measurements were conducted on the plot with clayey soil type. Plot was divided into two parcels with and without deep loosening up to 0.45 m. Then the plot was loosened (0.15 m) and then ploughed (0.20 m). Measurements were conducted in- and outside of the traffic lines.
To describe soil properties the cone index and soil infiltration rate was used. For the cone index measurement was used penetrometer pn-10 with cone angle of 30° with area 1 cm2. Measurement procedures were performed according to ASAE (2004).
The soil infiltration rate was measured by Simplified Falling-head (SFH) method. Bagarello et al. (2004) used Eq.1 to determine Kfs (saturated hydraulic conductivity) for SFH method. In this method, an application of water of known volume (V) is used on the surface of the soil bordered by a single ring of known diameter (area - A). The time (ta) is measured from when the water application is started until all water is absorbed by soil. At time t=ta, are values I(ta)=Ho=D, where D=V/A is a depth of water is adequate to V.
(1)
In order to determine Kfs from Eq.4, it is necessary to measure two values ta and ΔƟ (the difference of saturated and initial soil moisture content) and determine α* or use parameter α* according to estimation by Elrick et al. (1989). The volume of water applied was 0.5 l and α*
was choosen according to soil 12 m-1.
14th International Workshop for Young Scientists, BioPhys Spring 2015, May 27-29, 2015, Gödöllő, Hungary
13
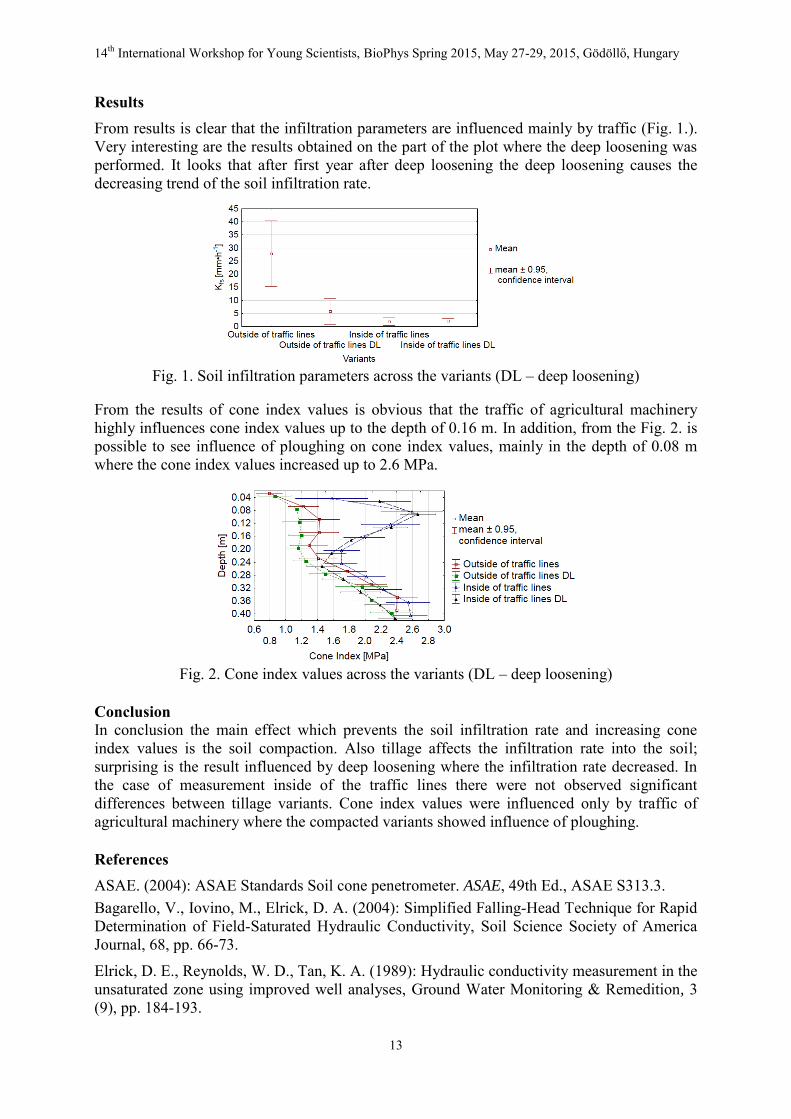
Results From results is clear that the infiltration parameters are influenced mainly by traffic (Fig. 1.). Very interesting are the results obtained on the part of the plot where the deep loosening was performed. It looks that after first year after deep loosening the deep loosening causes the decreasing trend of the soil infiltration rate.
Fig. 1. Soil infiltration parameters across the variants (DL – deep loosening)
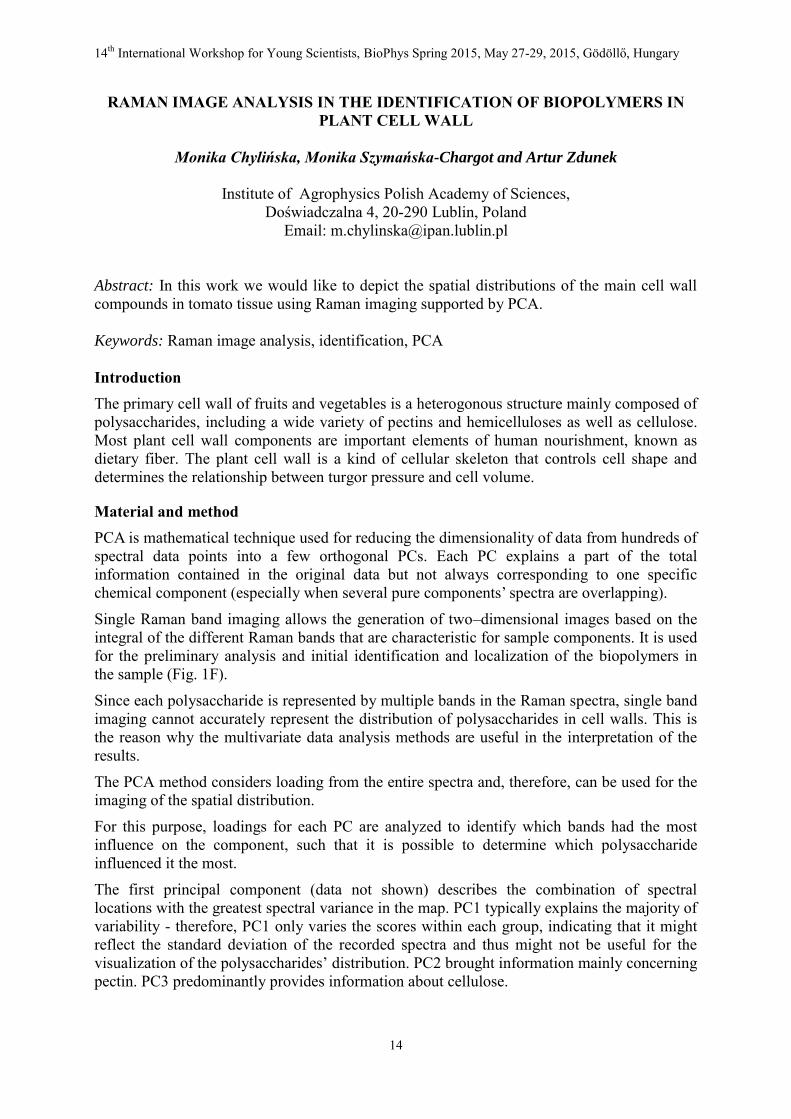
From the results of cone index values is obvious that the traffic of agricultural machinery highly influences cone index values up to the depth of 0.16 m. In addition, from the Fig. 2. is possible to see influence of ploughing on cone index values, mainly in the depth of 0.08 m where the cone index values increased up to 2.6 MPa.
Fig. 2. Cone index values across the variants (DL – deep loosening)
Conclusion In conclusion the main effect which prevents the soil infiltration rate and increasing cone index values is the soil compaction. Also tillage affects the infiltration rate into the soil; surprising is the result influenced by deep loosening where the infiltration rate decreased. In the case of measurement inside of the traffic lines there were not observed significant differences between tillage variants. Cone index values were influenced only by traffic of agricultural machinery where the compacted variants showed influence of ploughing.
References ASAE. (2004): ASAE Standards Soil cone penetrometer. ASAE, 49th Ed., ASAE S313.3. Bagarello, V., Iovino, M., Elrick, D. A. (2004): Simplified Falling-Head Technique for Rapid Determination of Field-Saturated Hydraulic Conductivity, Soil Science Society of America Journal, 68, pp. 66-73.
Elrick, D. E., Reynolds, W. D., Tan, K. A. (1989): Hydraulic conductivity measurement in the unsaturated zone using improved well analyses, Ground Water Monitoring & Remedition, 3 (9), pp. 184-193.
14th International Workshop for Young Scientists, BioPhys Spring 2015, May 27-29, 2015, Gödöllő, Hungary
14
RAMAN IMAGE ANALYSIS IN THE IDENTIFICATION OF BIOPOLYMERS IN PLANT CELL WALL
Monika Chylińska, Monika Szymańska-Chargot and Artur Zdunek
Institute of Agrophysics Polish Academy of Sciences, Doświadczalna 4, 20-290 Lublin, Poland
Email: [email protected] Abstract: In this work we would like to depict the spatial distributions of the main cell wall compounds in tomato tissue using Raman imaging supported by PCA. Keywords: Raman image analysis, identification, PCA
Introduction The primary cell wall of fruits and vegetables is a heterogonous structure mainly composed of polysaccharides, including a wide variety of pectins and hemicelluloses as well as cellulose. Most plant cell wall components are important elements of human nourishment, known as dietary fiber. The plant cell wall is a kind of cellular skeleton that controls cell shape and determines the relationship between turgor pressure and cell volume.
Material and method PCA is mathematical technique used for reducing the dimensionality of data from hundreds of spectral data points into a few orthogonal PCs. Each PC explains a part of the total information contained in the original data but not always corresponding to one specific chemical component (especially when several pure components’ spectra are overlapping).
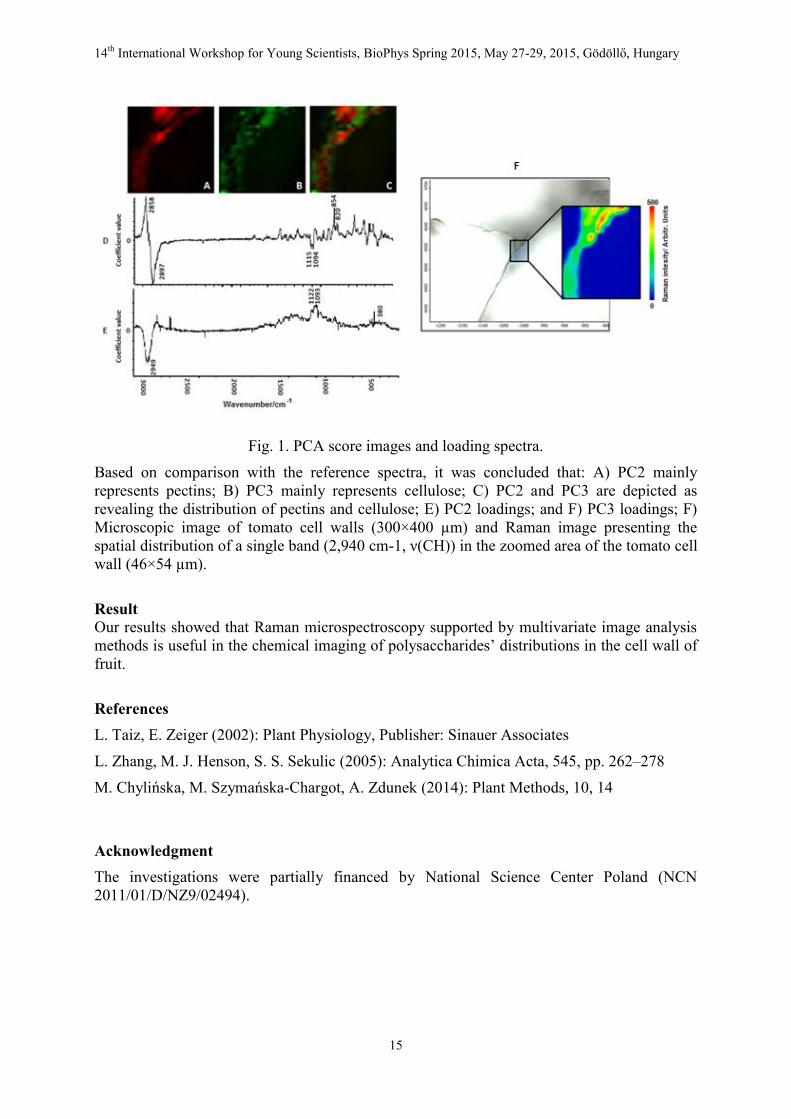
Single Raman band imaging allows the generation of two–dimensional images based on the integral of the different Raman bands that are characteristic for sample components. It is used for the preliminary analysis and initial identification and localization of the biopolymers in the sample (Fig. 1F).
Since each polysaccharide is represented by multiple bands in the Raman spectra, single band imaging cannot accurately represent the distribution of polysaccharides in cell walls. This is the reason why the multivariate data analysis methods are useful in the interpretation of the results.
The PCA method considers loading from the entire spectra and, therefore, can be used for the imaging of the spatial distribution.
For this purpose, loadings for each PC are analyzed to identify which bands had the most influence on the component, such that it is possible to determine which polysaccharide influenced it the most.
The first principal component (data not shown) describes the combination of spectral locations with the greatest spectral variance in the map. PC1 typically explains the majority of variability - therefore, PC1 only varies the scores within each group, indicating that it might reflect the standard deviation of the recorded spectra and thus might not be useful for the visualization of the polysaccharides’ distribution. PC2 brought information mainly concerning pectin. PC3 predominantly provides information about cellulose.
14th International Workshop for Young Scientists, BioPhys Spring 2015, May 27-29, 2015, Gödöllő, Hungary
15
Fig. 1. PCA score images and loading spectra.
Based on comparison with the reference spectra, it was concluded that: A) PC2 mainly represents pectins; B) PC3 mainly represents cellulose; C) PC2 and PC3 are depicted as revealing the distribution of pectins and cellulose; E) PC2 loadings; and F) PC3 loadings; F) Microscopic image of tomato cell walls (300×400 µm) and Raman image presenting the spatial distribution of a single band (2,940 cm-1, ν(CH)) in the zoomed area of the tomato cell wall (46×54 µm).
Result Our results showed that Raman microspectroscopy supported by multivariate image analysis methods is useful in the chemical imaging of polysaccharides’ distributions in the cell wall of fruit.
References L. Taiz, E. Zeiger (2002): Plant Physiology, Publisher: Sinauer Associates
L. Zhang, M. J. Henson, S. S. Sekulic (2005): Analytica Chimica Acta, 545, pp. 262–278
M. Chylińska, M. Szymańska-Chargot, A. Zdunek (2014): Plant Methods, 10, 14 Acknowledgment The investigations were partially financed by National Science Center Poland (NCN 2011/01/D/NZ9/02494).
14th International Workshop for Young Scientists, BioPhys Spring 2015, May 27-29, 2015, Gödöllő, Hungary
16
THE EFFECT OF ADDITION OF BIOCHAR ON SOIL TOTAL CARBON CONTENT
Marta Cybulak, Patrycja Boguta and Zofia Sokołowska
Institute of Agrophysics of Polish Academy of Sciences ul. Doświadczalna 4, 20-290 Lublin
Email: [email protected]
Abstract: The aim of the study was to analyze the impact of biochar added to the soil on the seasonal variation of carbon in fallowed and grassed plot.
Keywords: soil, carbon content, biochar, pyrolysis
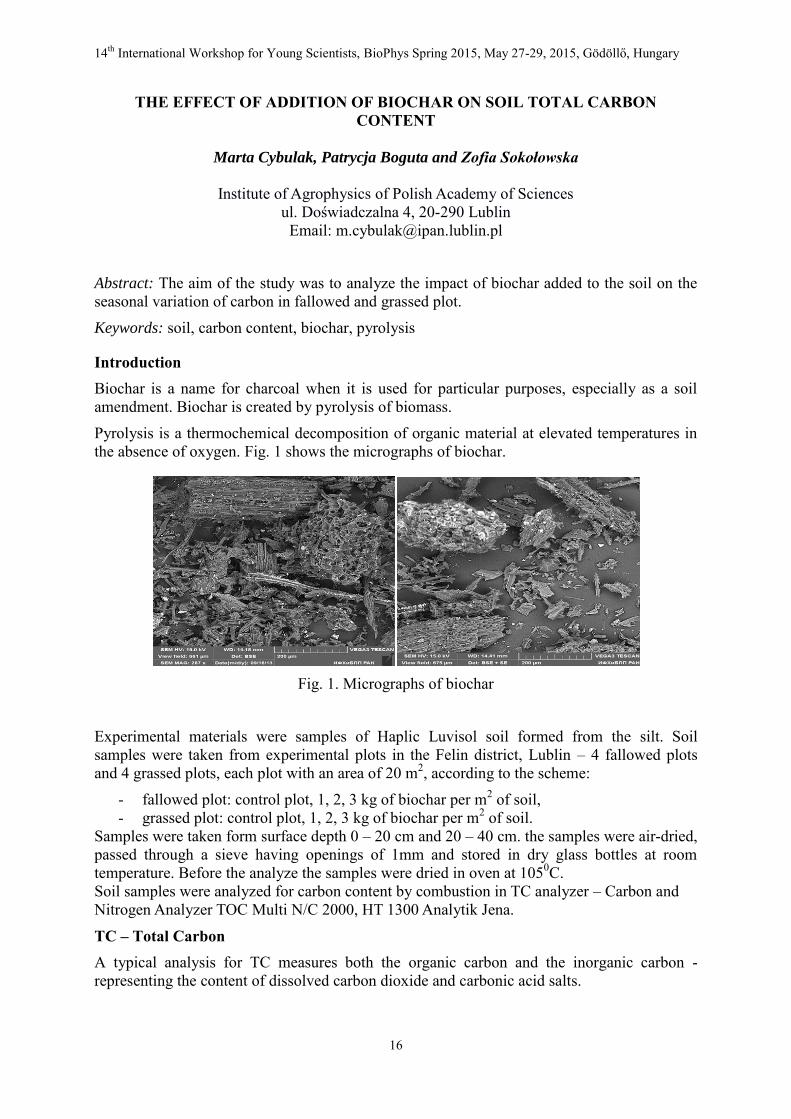
Introduction Biochar is a name for charcoal when it is used for particular purposes, especially as a soil amendment. Biochar is created by pyrolysis of biomass. Pyrolysis is a thermochemical decomposition of organic material at elevated temperatures in the absence of oxygen. Fig. 1 shows the micrographs of biochar.
Fig. 1. Micrographs of biochar
Experimental materials were samples of Haplic Luvisol soil formed from the silt. Soil samples were taken from experimental plots in the Felin district, Lublin – 4 fallowed plots and 4 grassed plots, each plot with an area of 20 m2, according to the scheme:
- fallowed plot: control plot, 1, 2, 3 kg of biochar per m2 of soil, - grassed plot: control plot, 1, 2, 3 kg of biochar per m2 of soil.
Samples were taken form surface depth 0 – 20 cm and 20 – 40 cm. the samples were air-dried, passed through a sieve having openings of 1mm and stored in dry glass bottles at room temperature. Before the analyze the samples were dried in oven at 1050C. Soil samples were analyzed for carbon content by combustion in TC analyzer – Carbon and Nitrogen Analyzer TOC Multi N/C 2000, HT 1300 Analytik Jena.
TC – Total Carbon A typical analysis for TC measures both the organic carbon and the inorganic carbon - representing the content of dissolved carbon dioxide and carbonic acid salts.
14th International Workshop for Young Scientists, BioPhys Spring 2015, May 27-29, 2015, Gödöllő, Hungary
17
Methodology Samples are combusted at 1250 ºC in an oxygen rich atmosphere. All carbon converts to carbon dioxide, flows throughscrubber tubes to remove interferences and the carbon dioxide is measured by non - dispersive infrared detector.
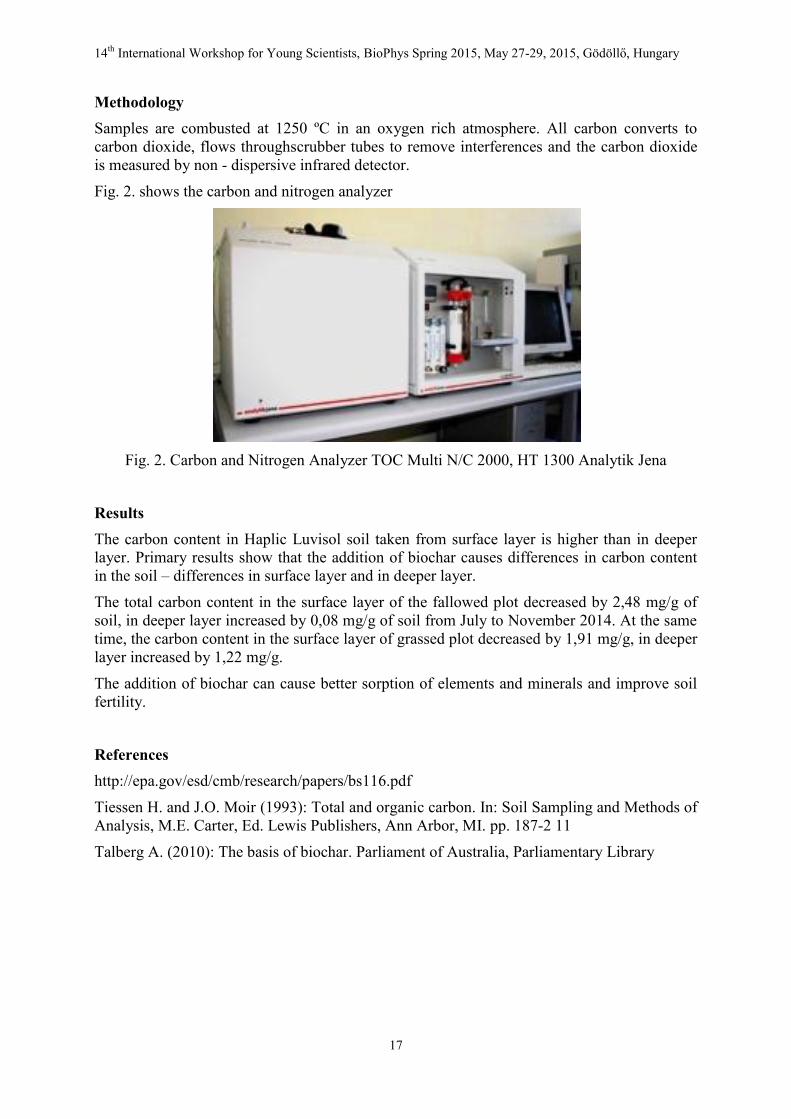
Fig. 2. shows the carbon and nitrogen analyzer
Fig. 2. Carbon and Nitrogen Analyzer TOC Multi N/C 2000, HT 1300 Analytik Jena
Results The carbon content in Haplic Luvisol soil taken from surface layer is higher than in deeper layer. Primary results show that the addition of biochar causes differences in carbon content in the soil – differences in surface layer and in deeper layer.
The total carbon content in the surface layer of the fallowed plot decreased by 2,48 mg/g of soil, in deeper layer increased by 0,08 mg/g of soil from July to November 2014. At the same time, the carbon content in the surface layer of grassed plot decreased by 1,91 mg/g, in deeper layer increased by 1,22 mg/g.
The addition of biochar can cause better sorption of elements and minerals and improve soil fertility.
References http://epa.gov/esd/cmb/research/papers/bs116.pdf
Tiessen H. and J.O. Moir (1993): Total and organic carbon. In: Soil Sampling and Methods of Analysis, M.E. Carter, Ed. Lewis Publishers, Ann Arbor, MI. pp. 187-2 11
Talberg A. (2010): The basis of biochar. Parliament of Australia, Parliamentary Library
14th International Workshop for Young Scientists, BioPhys Spring 2015, May 27-29, 2015, Gödöllő, Hungary
18
MEASUREMENT OF VISCOSITY OF BIOLOGICALLY DEGRADABLE OILS
Ján Csillag, Ľubomír Híreš, Vlasta Vozárová, Ana Petrovič and Michal Valach
Department of Physics, Slovak University of Agriculture in Nitra Tr. A. Hlinku 2, 949 76 Nitra, Slovakia
[email protected] Abstract: The present work deals with physical properties – dynamic viscosity and kinematic viscosity of biodegradable hydraulic fluids and lubricating oils based on vegetable oils or on synthetic esters – Plantohyd 40 N and Plantohyd 46S.
Keywords: dynamic viscosity, kinematic viscosity, Plantohyd Introduction Materials, in which internal friction is generated, can be characterized by viscosity. Dynamic viscosity (Pa.s) is defined as a constant between tangential tension τ and gradient of layer velocity (grad ν): ηgradυ=τ Kinematic viscosity is the ratio of the dynamic viscosity to the density of the fluid ρ in the
same temperature: ρ
η=υ
The unit of kinematic viscosity used in practice is m2.s-1.Kinematic viscosity is an extent of fluidity and internal friction of oil (Severa, Havlíček, Kumbár, 2004).
Materials and Methods Planto oils are high performance lubricants based on harvestable raw materials, such as rapeseed and sunflowers, with a combination of downstream esters and specially selected additives. Plantohyd products are fully compatible with all materials usually found in hydraulic systems. The first oil Plantohyd 46S is universally used in the temperature range from - 35 °C to 90 °C. The second oil Plantohyd 40N can be used in the temperature range from - 27 °C to 70 °C. Dynamic viscosity was performed by digital rotational viscosimeter Anton Paar (DV-3P). The principle of measuring by this viscosimeter is based on dependence of sample resistance against the probe rotation. When measuring with a rotational viscometer, the measured sample must meet certain conditions. The temperature of sample should be constant and uniform throughout the sample volume. The sample should not contain solid particles as they tend to settle to the bottom.
The sample should be without bubbles. Bubbles can be removed from the sample for example under the vacuum. The consistency of samples should also be homogeneous. The sample for measurement should not be subject to chemical or physical changes (Hlaváč, 2007).
We measured kinematic viscosity on Viscosimeter SpectroVisc Q3000. This viscometer operates as a Hele-Shaw cell, where Stokes flow is present between two parallel plates. The fluid passing between an LED and a photodiode causes a drop in the photodiode voltage. The average velocity of the fluid is calculated from the elapsed time between photodiodes and then it is used to generate a kinematic viscosity for the measured sample.
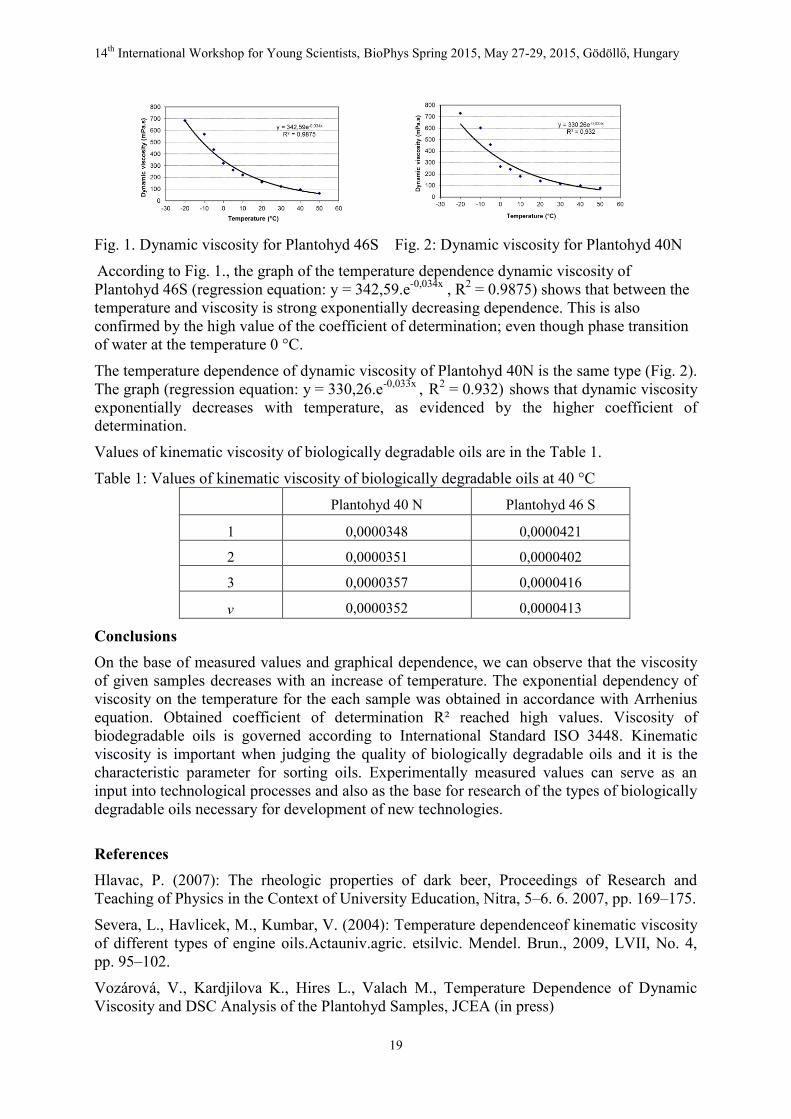
Results Fig. 1 and Fig. 2 show the dependence of dynamic viscosity on temperature.
14th International Workshop for Young Scientists, BioPhys Spring 2015, May 27-29, 2015, Gödöllő, Hungary
19
Fig. 1. Dynamic viscosity for Plantohyd 46S Fig. 2: Dynamic viscosity for Plantohyd 40N According to Fig. 1., the graph of the temperature dependence dynamic viscosity of Plantohyd 46S (regression equation: y = 342,59.e-0,034x , R2 = 0.9875) shows that between the temperature and viscosity is strong exponentially decreasing dependence. This is also confirmed by the high value of the coefficient of determination; even though phase transition of water at the temperature 0 °C.
The temperature dependence of dynamic viscosity of Plantohyd 40N is the same type (Fig. 2). The graph (regression equation: y = 330,26.e-0,033x , R2 = 0.932) shows that dynamic viscosity exponentially decreases with temperature, as evidenced by the higher coefficient of determination.
Values of kinematic viscosity of biologically degradable oils are in the Table 1.
Table 1: Values of kinematic viscosity of biologically degradable oils at 40 °C
Plantohyd 40 N Plantohyd 46 S
1 0,0000348 0,0000421 2 0,0000351 0,0000402 3 0,0000357 0,0000416
ν 0,0000352 0,0000413
Conclusions On the base of measured values and graphical dependence, we can observe that the viscosity of given samples decreases with an increase of temperature. The exponential dependency of viscosity on the temperature for the each sample was obtained in accordance with Arrhenius equation. Obtained coefficient of determination R² reached high values. Viscosity of biodegradable oils is governed according to International Standard ISO 3448. Kinematic viscosity is important when judging the quality of biologically degradable oils and it is the characteristic parameter for sorting oils. Experimentally measured values can serve as an input into technological processes and also as the base for research of the types of biologically degradable oils necessary for development of new technologies.
References
Hlavac, P. (2007): The rheologic properties of dark beer, Proceedings of Research and Teaching of Physics in the Context of University Education, Nitra, 5–6. 6. 2007, pp. 169–175.
Severa, L., Havlicek, M., Kumbar, V. (2004): Temperature dependenceof kinematic viscosity of different types of engine oils.Actauniv.agric. etsilvic. Mendel. Brun., 2009, LVII, No. 4, pp. 95–102.
Vozárová, V., Kardjilova K., Hires L., Valach M., Temperature Dependence of Dynamic Viscosity and DSC Analysis of the Plantohyd Samples, JCEA (in press)
14th International Workshop for Young Scientists, BioPhys Spring 2015, May 27-29, 2015, Gödöllő, Hungary
20
NEW APPROACHES IN SOLAR PHOTOVOLTAIC TECHNOLOGIES AND APPLICATIONS
István Farkas
Department of Physics and Process Control, Szent István University Páter K. u. 1., Gödöllő, H-2103 Hungary
Tel.: +36 28 522055, Email: [email protected] Abstract: This paper deals with the new application possibilities of the photovoltaic (PV) technology. It is clear that the PV technologies will show their significance for longer period. The most important standpoints characterising the PV industry are discussed. The new features of the PV technologies and the applications are also studied. It includes new type of modules along with their colouring, extra size and the fixation system. Keywords: thin film PV technology, colouring, transparency, extra size, new fixation system
Introduction In spite of the recent economic situation all over the world a significant yearly increase of photovoltaic module production and their installation were performed in last couple of year period. However it can be observed sensitivity of the market change on the photovoltaic industry, the PV technologies still show increasingly high priority.
The most important standpoints which are characterising and influencing the PV manufacturing and applications industry could be summarized as follows:
- 20-30% of the part of renewables in the energy mix,
- at around 30-40% yearly decrease of the PV cell and module prises,
- the cell efficiency in market products does not increase in a great extent as expected,
- strong competition between the crystalline and the thin film technologies,
- multi-Gigawatts applications are getting into the practice,
- widening the feed-in tariff system in several countries in worldwide,
- presence of the Chinese PV products in worldwide and especially in the European Union market.
Due to the growing market demand of the solar photovoltaic applications several new specific issues came to the light. These factors include new type of modules along with their colouring and extra size, wide range application of thin film technologies, colouring of the modules, transparency of the modules, extra size of modules and new type of fixation systems.
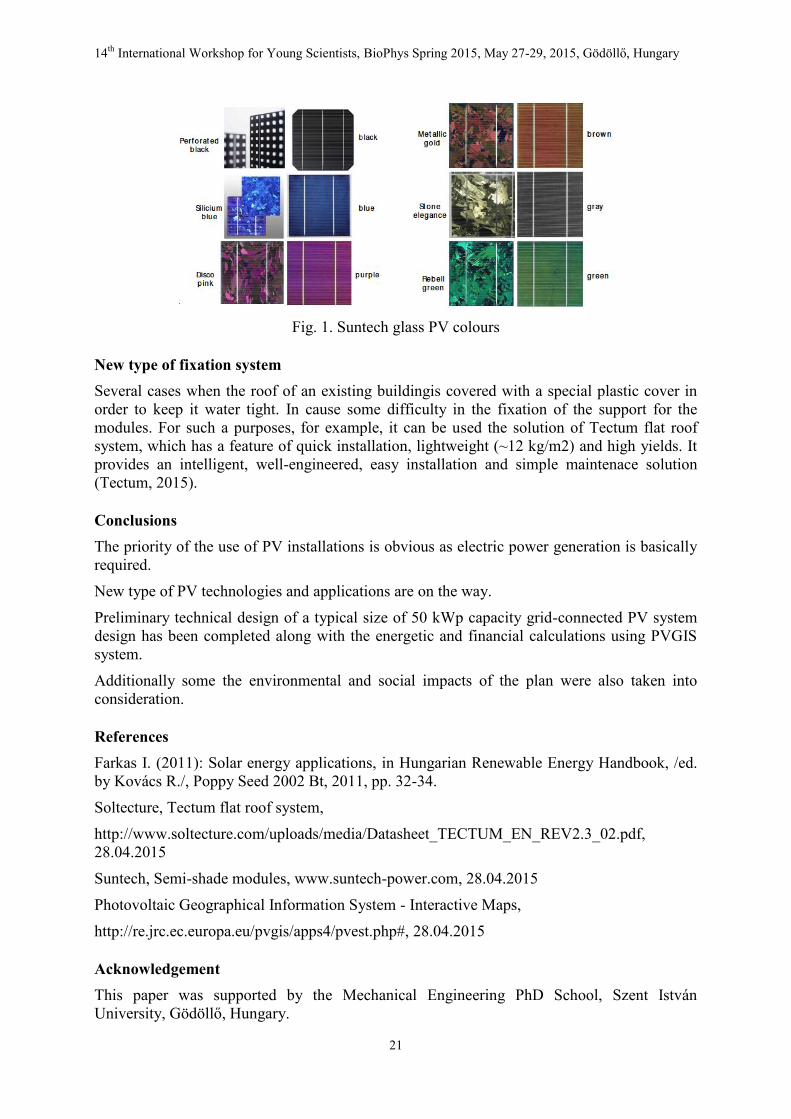
Transparent PV applications The attractiveness of the applications is increased with the use of the different colours of modules. A possible colour of the planned semi-shade cells (Suntech, 2015) can be seen in Fig. 1. The main features of the Suntech modules are the standard framed unit with a tempered front glass and the durable clear polymer substrate. The module has got 50% transparency, so it can be used to increase natural light behind the module along with providing energy production and surely some shading.
14th International Workshop for Young Scientists, BioPhys Spring 2015, May 27-29, 2015, Gödöllő, Hungary
21
Fig. 1. Suntech glass PV colours
New type of fixation system Several cases when the roof of an existing buildingis covered with a special plastic cover in order to keep it water tight. In cause some difficulty in the fixation of the support for the modules. For such a purposes, for example, it can be used the solution of Tectum flat roof system, which has a feature of quick installation, lightweight (~12 kg/m2) and high yields. It provides an intelligent, well-engineered, easy installation and simple maintenace solution (Tectum, 2015).
Conclusions The priority of the use of PV installations is obvious as electric power generation is basically required.
New type of PV technologies and applications are on the way.
Preliminary technical design of a typical size of 50 kWp capacity grid-connected PV system design has been completed along with the energetic and financial calculations using PVGIS system.
Additionally some the environmental and social impacts of the plan were also taken into consideration.
References Farkas I. (2011): Solar energy applications, in Hungarian Renewable Energy Handbook, /ed. by Kovács R./, Poppy Seed 2002 Bt, 2011, pp. 32-34.
Soltecture, Tectum flat roof system,
http://www.soltecture.com/uploads/media/Datasheet_TECTUM_EN_REV2.3_02.pdf, 28.04.2015
Suntech, Semi-shade modules, www.suntech-power.com, 28.04.2015
Photovoltaic Geographical Information System - Interactive Maps,
http://re.jrc.ec.europa.eu/pvgis/apps4/pvest.php#, 28.04.2015
Acknowledgement This paper was supported by the Mechanical Engineering PhD School, Szent István University, Gödöllő, Hungary.
14th International Workshop for Young Scientists, BioPhys Spring 2015, May 27-29, 2015, Gödöllő, Hungary
22
MODELING OF SATURATED HYDRAULIC CONDUCTIVITY COEFFICIENT BASED ON X-RAY COMPUTER TOMOGRAPHY IMAGING
Bartłomiej Gackiewicz, Krzysztof Lamorski and Cezary Sławiński
Institute of Agrophysics, Polish Academy of Sciences Doświadczalna 4, 20-290 Lublin, Poland
Abstract: The aim of the study is to develop a method for modeling saturated conductivity coefficient based on the 3D imaging and experimental validation of this method. For this purpose we compare the measured value of hydraulic conductivity coefficient with the result of modeling via the finite volume method.
Keywords: modeling, hydraulic conductivity, X-Ray, computer tomography, soil
Introduction The saturated hydraulic conductivity coefficient describes the ability to transmit water through soil. It can be determined with several methods. Three-dimensional modeling has been widely used for fluid flow analysis in porous media (Wildenschild and Sheppard, 2013). While there are publications on simulation of the hydraulic conductivity in soil (e.g. Johnson et al., 2003), there is still lack of comparisions with experimental results.
Material and method The samples of soil used in the experiment are 10mm long and have 5mm in diameter. The small size of samples is forced by requirements for a scan resolution. The image processing requires the higher resolution the smaller are particles in the soil.
The sample is scanned in the X-ray microtomograph GE/Phoenix Nanotom 180 (the basic scan parameters: voxel size – 2,5 µm, X-ray source voltage – 100 KV, X-ray source current – 90 µA). Images from the detector are processed to obtain 3D-reconstruction.
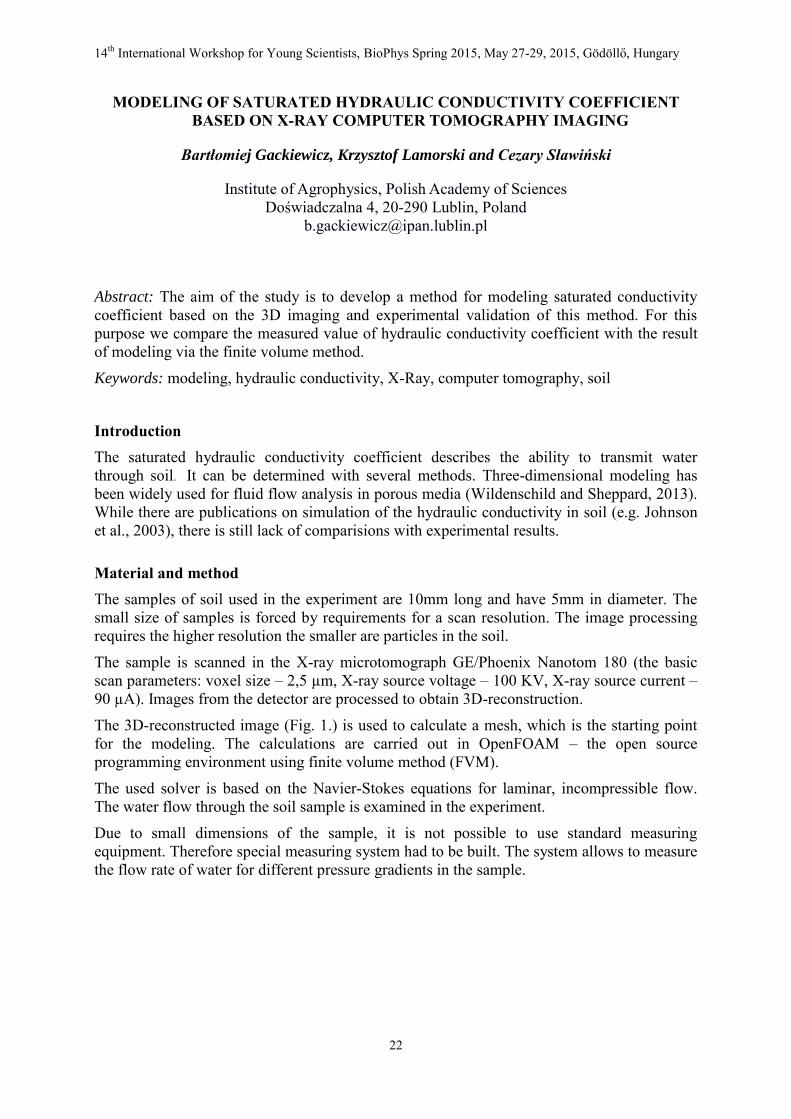
The 3D-reconstructed image (Fig. 1.) is used to calculate a mesh, which is the starting point for the modeling. The calculations are carried out in OpenFOAM – the open source programming environment using finite volume method (FVM).
The used solver is based on the Navier-Stokes equations for laminar, incompressible flow. The water flow through the soil sample is examined in the experiment.
Due to small dimensions of the sample, it is not possible to use standard measuring equipment. Therefore special measuring system had to be built. The system allows to measure the flow rate of water for different pressure gradients in the sample.
14th International Workshop for Young Scientists, BioPhys Spring 2015, May 27-29, 2015, Gödöllő, Hungary
23
Fig. 1: An example of 3D-reconstruction of the soil sample.
Result Measurements and simulations was carried out for five selected soils. For examined soils good agreement between measurements and numerical estimations was obtained. However, the issue have to be investigated for other soils.
References Wildenschild D., Sheppard A. P. (2013): X-ray imaging and analysis techniques for quantifying pore-scale structure and processes in subsurface porous medium systems. Advances in Water Resources, 51, p. 217–246
Johnson A., Roy I. M., Matthews G. P., Patel D. (2003): An improved simulation of void structure, water retention and hydraulic conductivity in soil with the Pore-Cor three-dimensional network. European Journal of Soil Science, 54, p. 477–489
14th International Workshop for Young Scientists, BioPhys Spring 2015, May 27-29, 2015, Gödöllő, Hungary
24
TEMPERATURE DEPENDENCIES OF BEER PILSNER URQUELL® DYNAMIC VISCOSITY AND THERMAL CONDUCTIVITY
Peter Hlavác and Monika Božiková
Faculty of Engineering, Department of Physics, Slovak University of Agriculture in Nitra,
Tr. A. Hlinku 2, SK - 949 76 Nitra, Slovak Republic Email: [email protected], [email protected]
Abstract: For quality evaluation of food material is necessary to identify their physical properties. This article is focused on temperature dependencies of dynamic viscosity and thermal conductivity of beer. We found out that dynamic viscosity of both types of beer is decreasing exponentially with temperature, which is in accordance with Arrhenius equation. On the other hand thermal conductivity had linear increasing character. Higher wort content had caused increase of both physical properties. Keywords: beer, dynamic viscosity, thermal conductivity, temperature, wort content Introduction Beer is an alcoholic drink which is made by alcoholic fermentation generally from barley malt, hop and water. It is a colloid system from several extract components in dispersive surroundings that is created by slightly alcoholic water solution. Temperature has disadvantageous influence on the colloid stability, because it accelerates all the accompanying reaction of the colloid ageing process. Ageing process of the beer colloid system is directly connected to physical – chemical or colloid durability of beer (Tóth and Opáth, 2006). Viscosity as one of the most important rheologic parameters is defined as the resistance of a fluid to flow. The unit of dynamic viscosity in SI units is Pa.s. Viscosity of most of the liquids decreases with increasing temperature according to Arrhenius equation (1)
RT
EA
e
0 (1) where 0 is reference value of dynamic viscosity, AE is activation energy, R is gas constant and T is absolute temperature (Figura and Teixeira, 2007). The thermal conductivity is derived from the resulting change in temperature over a known time interval. The ideal analytical model assumes an ideal – infinitely thin and infinitely long line heat source (hot wire), operating in an infinite, homogenous and isotropic material with uniform initial temperature T0. The temperature rise trT , in any distance r from the wire as a function of time is described by the simplified equation (2) (Carslaw and Jeager, 1959).
Cr
atqtr 2
4ln4
,
(2)
where: λ – the thermal conductivity, a – thermal diffusivity, expC where is the Euler´s constant. The thermal conductivity is calculated from equation (2). Material and method Measuring of dynamic viscosity was performed by digital viscosimeter Anton Paar (DV-3P). Principle of measuring by this viscosimeter is based on dependency of sample resistance against the probe rotation. Temperature dependencies of dynamic viscosity can be described by decreasing exponential functions (3)
ot
tB
eA (3)
14th International Workshop for Young Scientists, BioPhys Spring 2015, May 27-29, 2015, Gödöllő, Hungary
25
where t is temperature, to is 1 °C, A, B are constants dependent on kind of material, and on ways of processing and storing. Measurement of thermal conductivity is based on analysis of the temperature response of the analyzed material to heat flow impulses. If we use spike probe for measurements of thermophysical parameters, experimental arrangement is modelled by Hot wire method described in (Božiková – Hlaváč, 2010).Temperature dependencies of thermal conductivity can be described by linear increasing functions (4).
0t
tDC (4)
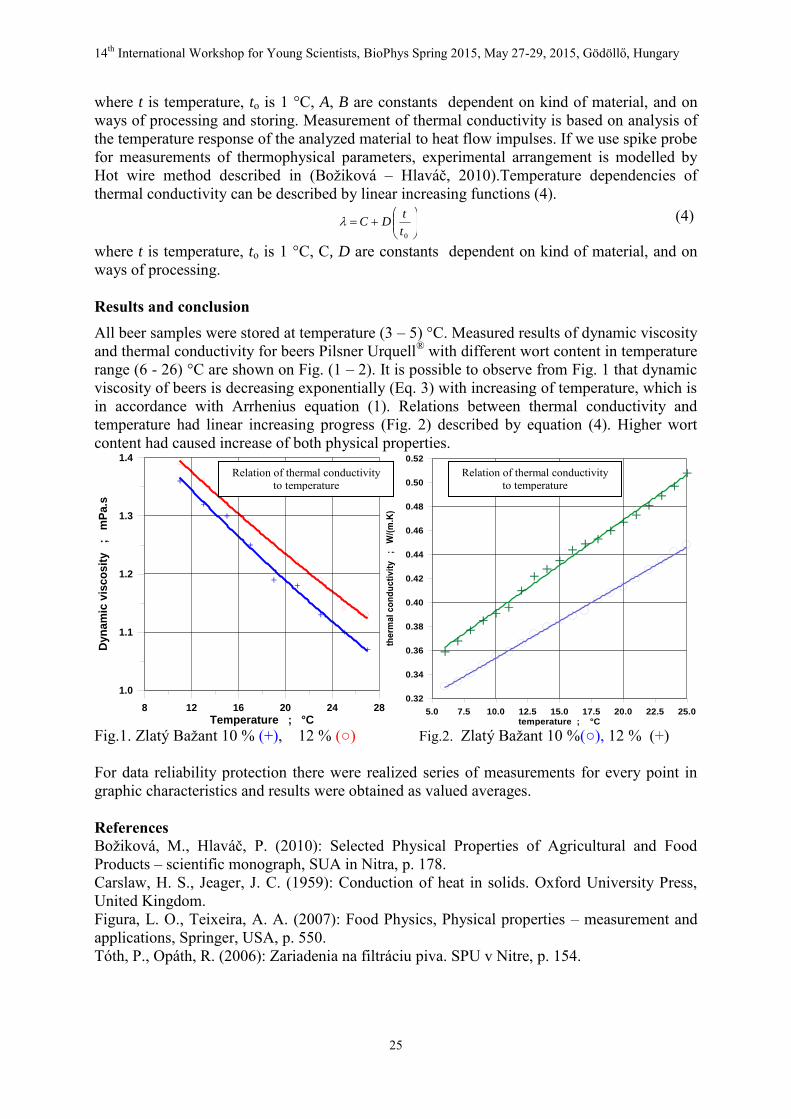
where t is temperature, to is 1 °C, C, D are constants dependent on kind of material, and on ways of processing. Results and conclusion All beer samples were stored at temperature (3 – 5) °C. Measured results of dynamic viscosity and thermal conductivity for beers Pilsner Urquell® with different wort content in temperature range (6 - 26) °C are shown on Fig. (1 – 2). It is possible to observe from Fig. 1 that dynamic viscosity of beers is decreasing exponentially (Eq. 3) with increasing of temperature, which is in accordance with Arrhenius equation (1). Relations between thermal conductivity and temperature had linear increasing progress (Fig. 2) described by equation (4). Higher wort content had caused increase of both physical properties.
Fig.1. Zlatý Bažant 10 % (+), 12 % (○) Fig.2. Zlatý Bažant 10 %(○), 12 % (+) For data reliability protection there were realized series of measurements for every point in graphic characteristics and results were obtained as valued averages. References Božiková, M., Hlaváč, P. (2010): Selected Physical Properties of Agricultural and Food Products – scientific monograph, SUA in Nitra, p. 178. Carslaw, H. S., Jeager, J. C. (1959): Conduction of heat in solids. Oxford University Press, United Kingdom. Figura, L. O., Teixeira, A. A. (2007): Food Physics, Physical properties – measurement and applications, Springer, USA, p. 550. Tóth, P., Opáth, R. (2006): Zariadenia na filtráciu piva. SPU v Nitre, p. 154.
8 12 16 20 24 28
Temperature ; °C
1.0
1.1
1.2
1.3
1.4
Dy
na
mic
vis
co
sit
y
;
mP
a.s
7.5 12.5 17.5 22.55.0 10.0 15.0 20.0 25.0temperature ; °C
0.34
0.38
0.42
0.46
0.50
0.32
0.36
0.40
0.44
0.48
0.52
the
rma
l c
on
du
cti
vit
y
;
W/(
m.K
)
Relation of thermal conductivity to temperature
Relation of thermal conductivity to temperature
14th International Workshop for Young Scientists, BioPhys Spring 2015, May 27-29, 2015, Gödöllő, Hungary
26
ELECTRICAL PROPERTIES AND DRYING CHARACTERISTICS Zuzana Hlaváčová
1, Ákos Kertész
1, Lenka Staroňová
2, Tomáš Regrut
1 and Anton Wollner
3
1Department of Physics, 2Department of Production Engineering, Faculty of Engineering, Slovak University of Agriculture in Nitra
Tr. A. Hlinku 2, SK-949 76 Nitra, Slovakia Tel.: +421 37 4767, Email: [email protected]
3Department of Agricultural, Transport and Manipulation Technologies, Faculty of Agriculture, University of South Bohemia in České Budějovice,
Studentská 13, 370 05 České Budějovice, Czech Republic
Abstract: The aim of this study was to determine the moisture content, moisture ratio, and mass of samples and to measure electrical properties as are the resistance, capacitance, relative permittivity, and impedance.
Keywords: electrical properties, moisture ratio, moisture content, mass, temperature
Introduction Water can be removed from food materials by various processes, it means by mechanical treatment, by drying, osmotic drying, lyophilization, and addition of water absorbing substances (e. g. silica gel). At drying moisture from inside the hygroscopic materials moves to the surface and then it evaporates to the surrounding atmosphere. This movement in moisture is caused by the gradient of water vapour pressure being high inside the materials while being low outside the materials. The movement of moisture could be by liquid diffusion, vapour diffusion, capillary flow, or a combination of these features (Jayas, Singh, 2011). The measurement of electrical properties of food can be used to get information about many other characteristics of this material.
This paper deals with the measurement of the some kind of food electrical properties in relation in the moisture content, moisture ratio, mass of samples, and temperature.
Material and method Measurement were done on samples of wheat and corn grains, amaranth, poppy, and rape oil seeds, on dried apricots and carrot slices. Samples were dried in cabinet dryer Venticell 111. Moisture analyzer MAC was also used for the drying of sample. The mass of samples was measured with a Sartorius Basic electronic analytical and precision balance. The moisture content of samples was determined according to standard by drying to constant mass. The moisture content wet basis was calculated from mass losses. Moisture ratio is defined as
e
eR
uu
uuM
0
where MR is moisture ratio, u, u0 and ue are local, initial and equilibrium moisture contents, respectively (Doymaz, 2004). The values of equilibrium moisture content, ue, are relatively low compared to u or u0.
The electrical properties of samples were measured with precision LCR meter GoodWill 821 in frequency range from 100 Hz till 200 kHz, and also with precision LRC meters HP 4284A and 4285A at frequencies from 30 Hz to 30 MHz, at voltage of 1 V.
14th International Workshop for Young Scientists, BioPhys Spring 2015, May 27-29, 2015, Gödöllő, Hungary
27
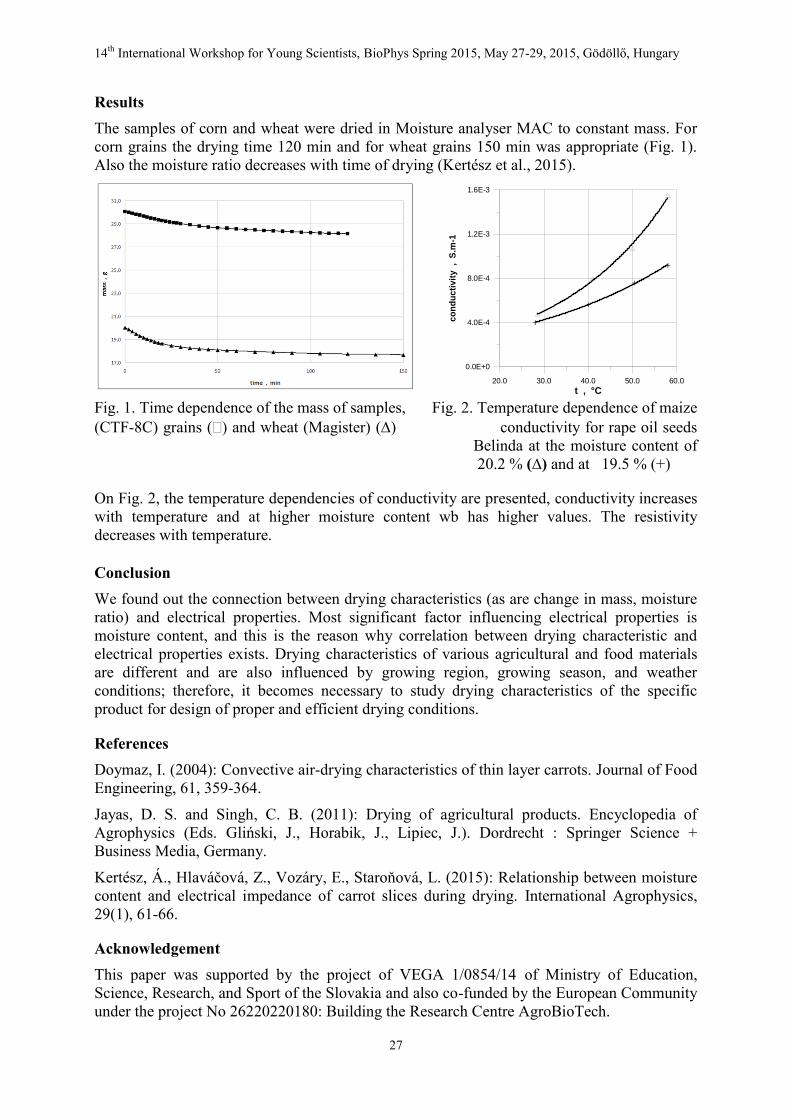
Results The samples of corn and wheat were dried in Moisture analyser MAC to constant mass. For corn grains the drying time 120 min and for wheat grains 150 min was appropriate (Fig. 1). Also the moisture ratio decreases with time of drying (Kertész et al., 2015).
Fig. 1. Time dependence of the mass of samples, Fig. 2. Temperature dependence of maize (CTF-8C) grains () and wheat (Magister) () conductivity for rape oil seeds Belinda at the moisture content of 20.2 % (∆) and at 19.5 % (+)
On Fig. 2, the temperature dependencies of conductivity are presented, conductivity increases with temperature and at higher moisture content wb has higher values. The resistivity decreases with temperature.
Conclusion We found out the connection between drying characteristics (as are change in mass, moisture ratio) and electrical properties. Most significant factor influencing electrical properties is moisture content, and this is the reason why correlation between drying characteristic and electrical properties exists. Drying characteristics of various agricultural and food materials are different and are also influenced by growing region, growing season, and weather conditions; therefore, it becomes necessary to study drying characteristics of the specific product for design of proper and efficient drying conditions.
References Doymaz, I. (2004): Convective air-drying characteristics of thin layer carrots. Journal of Food Engineering, 61, 359-364.
Jayas, D. S. and Singh, C. B. (2011): Drying of agricultural products. Encyclopedia of Agrophysics (Eds. Gliński, J., Horabik, J., Lipiec, J.). Dordrecht : Springer Science + Business Media, Germany.
Kertész, Á., Hlaváčová, Z., Vozáry, E., Staroňová, L. (2015): Relationship between moisture content and electrical impedance of carrot slices during drying. International Agrophysics, 29(1), 61-66.
Acknowledgement This paper was supported by the project of VEGA 1/0854/14 of Ministry of Education, Science, Research, and Sport of the Slovakia and also co-funded by the European Community under the project No 26220220180: Building the Research Centre AgroBioTech.
20.0 30.0 40.0 50.0 60.0
t , °C
0.0E+0
4.0E-4
8.0E-4
1.2E-3
1.6E-3
co
nd
uc
tiv
ity
,
S.m
-1
14th International Workshop for Young Scientists, BioPhys Spring 2015, May 27-29, 2015, Gödöllő, Hungary
28
DEM MODELING OF DEVELOPMENT OF RAREFACTION WAVE IN VERTICAL COLUMN OF GRANULAR SOLIDS
Jozef Horabik, Rafal Kobyłk and Marek Molenda
Institute of Agrophysics Polish Academy of Sciences
Doświadczalna 4, 20-290 Lublin, Poland Email: [email protected]
Abstract: The purpose of reported study was to model with the use of DEM the process of formation and transmission of rarefaction wave in a granular material contained in a model bin.
Keywords: granular system, modeling, stress waves, refraction Introduction Propagation of stress waves in granular solids is an inherent effect in dynamic operations of handling of that materials. One of phenomena of intense interest of science and practice is rise of rarefaction wave at initiation of discharge of storage silo. Sudden increase in lateral pressure takes place at the opening of discharge gate accompanied with ramp down of vertical pressure. This effect, sometimes termed “dynamic pressure switch” may create severe pulsations of bin structures. Due to nonlinearity and heterogeneity of granular systems mechanism of generation and propagation of stress waves is very complex and not yet completely understood. With an increase in availability of affordable machines of high computation power numerical methods became promising solution for examination of interactions in granular solids leading to emerging and propagation of stress waves. Rise of arches of particles followed by their collapsing after fall of particles below it is proposed to be the leading mechanism of generation of rarefaction waves. The amplitude of rarefaction wave was found, experimentally (Wensrich, 2002) and numerically (Wang et al., 2012), to increase exponentially as it travels up the material bed. Literature reports a broad range of measured values for the wave speed in granular beds: from 50 m/s to 500 m/s as a consequence of very high sensitivity of „force chains” carrying static stresses to very small perturbations in force-transmission networks (Hostler and Brennen, 2005; Neal et al., 2012).
Rong et al., (1995) observed in 2D DEM simulations of initial stage of a model silo discharge emerge of shear bands in the hopper with the start of flow. The shear bands move upward into the vertical part of the bin. The orientation of shear bands was consistently within a narrow range determined by the angle of interparticle friction. This finding of DEM modeling corresponds well with experimental observations of Bransby and Blair-Fish (1975) that in the case of plain bin hopper rarefaction takes form of discontinuity in velocity fields which moves upward the bin. DEM modeling DEM modeling was performed in a flat-bottomed cylindrical container with diameter D of 0.1 m or 0.12 m and height H of 0.5 m. Positions of particles, velocities and forces were recorded every 10-5 s and of these data location of front of rarefaction wave and pressure were inferred. Several factors influencing generation of pressure switch were examined including diameter of the discharge gate and velocity of discharge.
14th International Workshop for Young Scientists, BioPhys Spring 2015, May 27-29, 2015, Gödöllő, Hungary
29
The speed of rarefaction wave obtained from DEM simulations was found in a range from 70 to 85 m/s depending on bin diameter and discharge condition. Generally slope of velocity profile at rarefaction wave front decrease with traveled distance due to barotropy of the granular material (Ocone and Astarita, 1995). However, in the case of smaller discharge velocity an uniform increase in the slope of wave was observed. The probable reason for that inconsistency with earlier observation and well explained barotropy effect was a lack of space for expanding volume of material behind the wave front and a lack of possibility of proper developing of rarefaction wave which results from too low discharge rate.
A non-uniform distribution of particles velocity at the cross-section of rarefaction wave front and behind it was observed in the case of the smallest discharge rate through centrally located orifice. The pattern of the regions of highest velocity at cross-section of wave front was similar to shape of shear bands emerging at start of discharge observed by Rong et al. (1995).
It was found that the rarefaction wave may be followed or not by compaction wave depending on boundary and discharge conditions. Compaction wave is associated with slowing down velocity of particles behind rarefaction wave front caused by: 1) controlled outlet velocity, 2) converging flow in the hopper above the orifice, and, 3) wall friction.
Conclusions 1. Results of numerical simulations were found in good agreement with experimental data
regarding development of propagation of the disturbance wave and the pressure switch at the discharge initiation.
2. DEM was proven to be promising tool allowing insight into mechanisms of stress transmission in granular solids that enables investigations of an effect of properties of individual particles on behavior of bed of particles.
References Bransby P.L., Blair-Fish P.M. (1975): Deformations near rupture surfaces in flowing sand. Géotechnique, 25(2), 384-389.
Hostler S.R., Brennen Ch.E. (2005): Pressure wave propagation in a granular bed. Physica Review E, 72, 031303.
Neal W., Chapman D. J., Proud W. (2013): Shock-precursor waves in brittle granular materials. AIP Conf. Proc. 2012, 1426, 1503; doi: 10.1063/1.3686568.
Ocone R., Astarita G. (1995): Compression and rarefaction waves in granular flow. Powder Technology, 82, 231-237.
Rong G.H., Negi S.C., Jofriet J.C. (1995): Simulation of Flow Behaviour of Bulk Solids in Bins. Part 2: Shear Bands, Flow Corrective Inserts and Velocity Profiles. J. agric. Engng Res. 62, 257-269.
Wang Y., Wensrich C.M., Ooi J.Y. (2012): Rarefaction wave propagation in tapered granular columns. Chemical Engineering Science, 71, 32-38.
Wensrich C.M. (2002): Experimental behaviour of quaking in tall silos. Powder Technology, 127, 87– 94.
14th International Workshop for Young Scientists, BioPhys Spring 2015, May 27-29, 2015, Gödöllő, Hungary
30
THE ISOTOPE RATIO MASS SPECTROMETRY (IRMS) METHODS IN THE WASTEWATER TREATMENT PLANT IN LUBLIN
Katarzyna Jaromin-Gleń1, Wioleta Stelmach
1, Paweł Szarlip
1, Andrzej Trembaczowski
1,2
and Andrzej Bieganowski1
1Institute of Agrophysics Polish Academy of Sciences, Doświadczalna 4, 20-290 Lublin, Poland
[email protected] 2Mass Spectrometry Laboratory, Institute of Physics, Maria Curie-Skłodowska University,
Maria Curie-Skłodowska Square 1, Lublin, Poland Abstract: This paper is focused on determination of the ratio of carbon isotopes for the three selected strategic points of the municipal wastewater treatment plants (WWTPs).
Keywords: spectrometry, wastewater, carbon isotopes Introduction Currently, the increasing demand for controlling and optimizing processes taking place in WWTP) requires an advanced approach to system improvement. Further, it should be emphasised that most studies are based on determined sewage parameters treated in particular facilities of WWTP or properties of activated sludge. Hence, modern investigations of processes taking place during wastewater treatment have progressed beyond the stage of technology.
One of the methods widely used in environmental studies, which is different from wastewater treatment process analyses, is the IRMS (Isotope Ratio Mass Spectrometry) technique. It consists in separating different isotopes in a constant, strong electromagnetic field, which enables stable isotope ratios in a sample to be determined (e.g. 13C and 12C as well as 15N and 14N) [Muccio and Jackson, 2009].
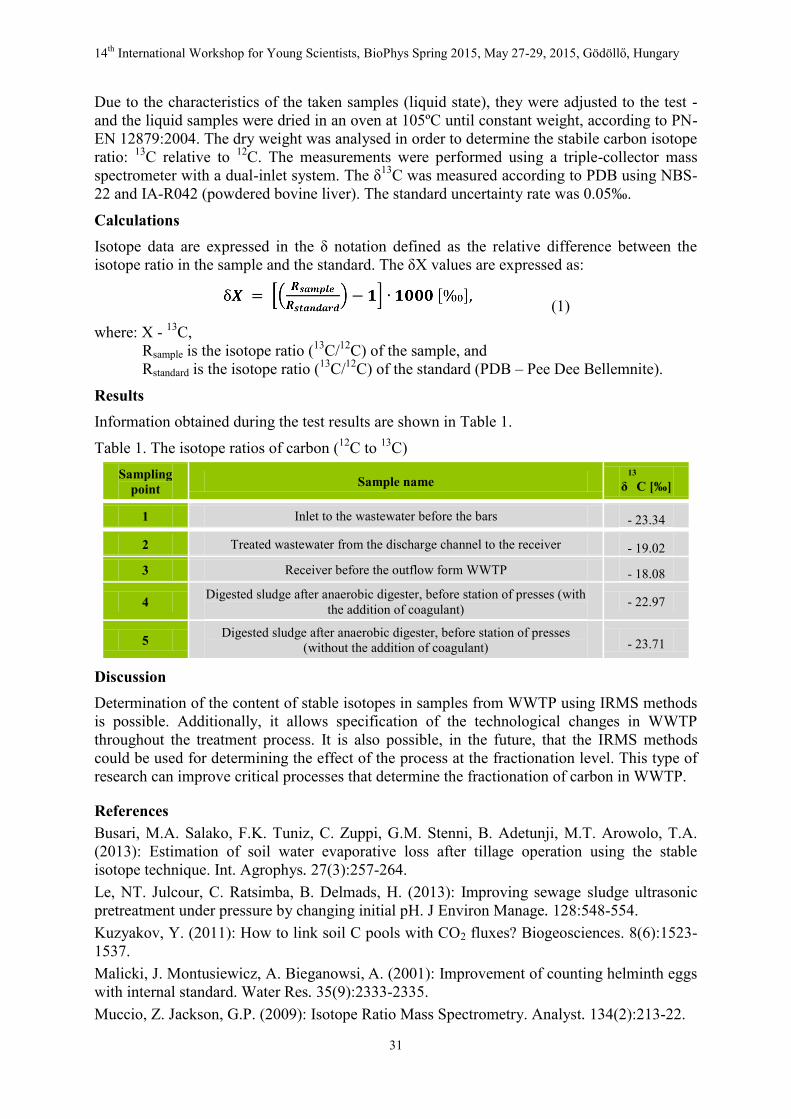
Material and methods In this preliminary study for determination the ratio of carbon isotopes 12C to 13C were used for the three selected but strategic points of the municipal WWTP, there were: 1.input - inlet to the wastewater before the bars, 2. output - treated wastewater from the discharge channel to the receiver, 3. water from the Bystrzyca River, before discharge of treated wastewater – (to compare the isotopic signature of treated wastewater and the receiver waters), 4. output - digested sludge after anaerobic digester, before station of presses (with the addition of coagulant), 5. output - digested sludge after anaerobic digester, before station of presses (without the addition of coagulant). The places of sampling are shown in Fig. 1.
Fig. 1. Schema of WWTP with marked sampling points
14th International Workshop for Young Scientists, BioPhys Spring 2015, May 27-29, 2015, Gödöllő, Hungary
31
Due to the characteristics of the taken samples (liquid state), they were adjusted to the test - and the liquid samples were dried in an oven at 105ºC until constant weight, according to PN-EN 12879:2004. The dry weight was analysed in order to determine the stabile carbon isotope ratio: 13C relative to 12C. The measurements were performed using a triple-collector mass spectrometer with a dual-inlet system. The δ13C was measured according to PDB using NBS-22 and IA-R042 (powdered bovine liver). The standard uncertainty rate was 0.05‰.
Calculations Isotope data are expressed in the δ notation defined as the relative difference between the isotope ratio in the sample and the standard. The δX values are expressed as:
(1)
where: X - 13C, Rsample is the isotope ratio (13C/12C) of the sample, and Rstandard is the isotope ratio (13C/12C) of the standard (PDB – Pee Dee Bellemnite).
Results Information obtained during the test results are shown in Table 1.
Table 1. The isotope ratios of carbon (12C to 13C) Sampling
point Sample name δ13
C [‰]
1 Inlet to the wastewater before the bars - 23.34
2 Treated wastewater from the discharge channel to the receiver - 19.02
3 Receiver before the outflow form WWTP - 18.08
4 Digested sludge after anaerobic digester, before station of presses (with the addition of coagulant) - 22.97
5 Digested sludge after anaerobic digester, before station of presses (without the addition of coagulant) - 23.71
Discussion Determination of the content of stable isotopes in samples from WWTP using IRMS methods is possible. Additionally, it allows specification of the technological changes in WWTP throughout the treatment process. It is also possible, in the future, that the IRMS methods could be used for determining the effect of the process at the fractionation level. This type of research can improve critical processes that determine the fractionation of carbon in WWTP.
References Busari, M.A. Salako, F.K. Tuniz, C. Zuppi, G.M. Stenni, B. Adetunji, M.T. Arowolo, T.A. (2013): Estimation of soil water evaporative loss after tillage operation using the stable isotope technique. Int. Agrophys. 27(3):257-264. Le, NT. Julcour, C. Ratsimba, B. Delmads, H. (2013): Improving sewage sludge ultrasonic pretreatment under pressure by changing initial pH. J Environ Manage. 128:548-554. Kuzyakov, Y. (2011): How to link soil C pools with CO2 fluxes? Biogeosciences. 8(6):1523-1537. Malicki, J. Montusiewicz, A. Bieganowsi, A. (2001): Improvement of counting helminth eggs with internal standard. Water Res. 35(9):2333-2335. Muccio, Z. Jackson, G.P. (2009): Isotope Ratio Mass Spectrometry. Analyst. 134(2):213-22.
14th International Workshop for Young Scientists, BioPhys Spring 2015, May 27-29, 2015, Gödöllő, Hungary
32
OPTIMIZATION OF SMALL-SCALE PROCESSING OF PALM KERNEL OIL – THE STATE OF AFFAIRS IN GHANA
Abraham Kabutey, David Herak, Erasmus Wisdom Boatri and Riswanti Sigalingging
Department of Mechanical Engineering, Czech University of Life Sciences Prague Kamycka 129 165 21 Prague 6 Czech Republic
Tel: +420 775 661 48, Email: [email protected] Abstract: The follow up discussion is focused on small-scale production of PKO in Ghana where the need for its improvement is a great concern in this 21st Century as far as technological advancement and environmental protection are concerned. Keywords: optimalization, palm kernel oil Introduction Oil palm (Elaeisguineensis) is a perennial crop which after four to five years of planting produces fresh fruit bunches weighing between 10 and 75 kilograms (Kabutey et al., 2013; Morrison and Heijndermans, 2013).
The fruits contain a hard kernel seed which is enclosed in an endocarp shell surrounded by a fleshy mesocarp and exocarp (African Centre for Economic Transformation). Red Palm Oil (RPO) and Palm Kernel Oil (PKO) are the two main oils obtained from the oil palm fruits after series of processing operations both in the industrial technology and small-scale industry. Material and method PKO is white to yellowish vegetable oil similar to coconut oil which solidifies at room temperatures (Ikechukwu et al., 2012). In Ghana, there is growing interest of the PKO for food due to its health benefits and also for industrial applications. However, the small scale production of PKO is mostly characterised by small groups of family members (including children drop out of school) who undertakes the extraction process right from the point of collection of the palm nuts to the final product which is the PKO.
In fact, the process is labour and energy demanding which does not in any way reciprocate the net income of the producers. Clearly, literature information shows that the oil extraction process takes about 30 hours and 46 hours or more of labour (Morrison and Heijndermans, 2013).In view of this human stress, a situation where a cost-effective technology is used (to minimize energy and time and also to achieve maximum quality of oil), would not only add market value to the oil but also improve the health conditions of the workers and create a friendly environment.
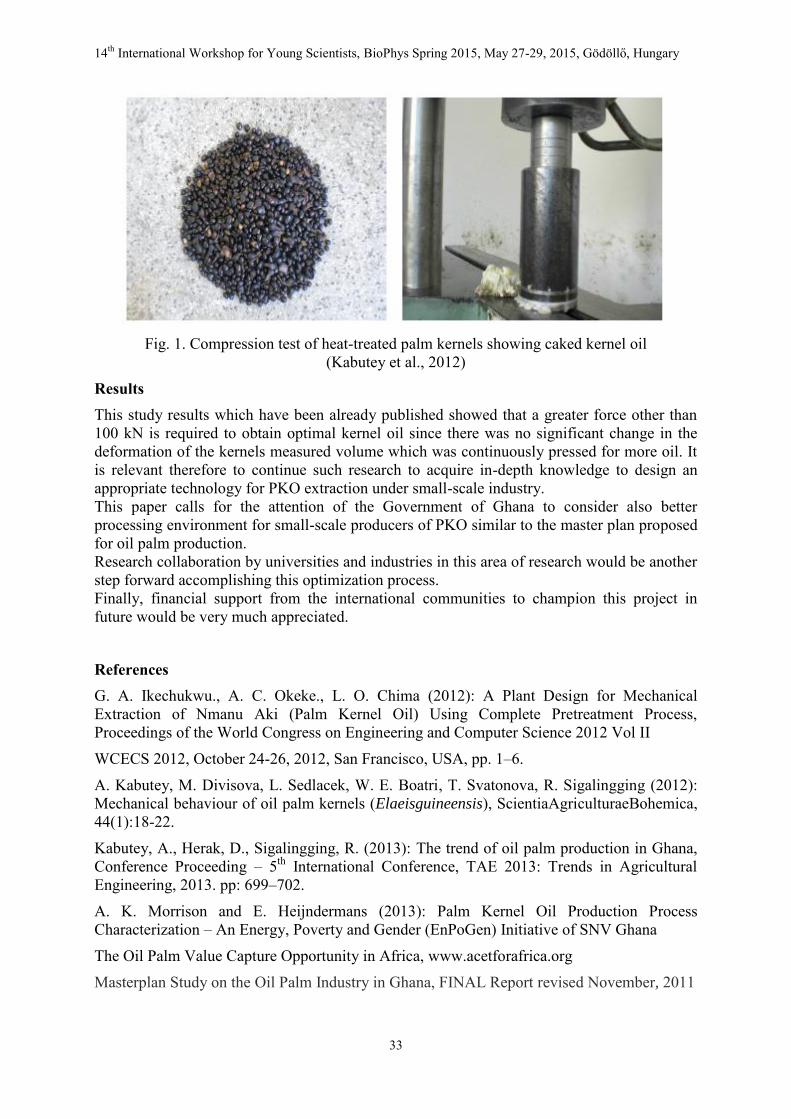
In both theoretical and practical senseto optimizing the PKO extraction process, it is important to understand the physical properties and mechanical behaviour of the palm fruits or fresh fruit bunches nuts and kernels. This optimization attempt was investigated in compression loading test where a compression equipment ZDM 50 (VEB, Dresden, Germany) was used to apply maximum force of 100 kN at a speed of 60 mm·min -1onto heat-treated palm kernels contained in a pressing vessel diameter 60 mm with holes beneath which allowed the oil leakage (Fig. 1).
14th International Workshop for Young Scientists, BioPhys Spring 2015, May 27-29, 2015, Gödöllő, Hungary
33
Fig. 1. Compression test of heat-treated palm kernels showing caked kernel oil
(Kabutey et al., 2012)
Results This study results which have been already published showed that a greater force other than 100 kN is required to obtain optimal kernel oil since there was no significant change in the deformation of the kernels measured volume which was continuously pressed for more oil. It is relevant therefore to continue such research to acquire in-depth knowledge to design an appropriate technology for PKO extraction under small-scale industry. This paper calls for the attention of the Government of Ghana to consider also better processing environment for small-scale producers of PKO similar to the master plan proposed for oil palm production. Research collaboration by universities and industries in this area of research would be another step forward accomplishing this optimization process. Finally, financial support from the international communities to champion this project in future would be very much appreciated.
References G. A. Ikechukwu., A. C. Okeke., L. O. Chima (2012): A Plant Design for Mechanical Extraction of Nmanu Aki (Palm Kernel Oil) Using Complete Pretreatment Process, Proceedings of the World Congress on Engineering and Computer Science 2012 Vol II
WCECS 2012, October 24-26, 2012, San Francisco, USA, pp. 1–6.
A. Kabutey, M. Divisova, L. Sedlacek, W. E. Boatri, T. Svatonova, R. Sigalingging (2012): Mechanical behaviour of oil palm kernels (Elaeisguineensis), ScientiaAgriculturaeBohemica, 44(1):18-22.
Kabutey, A., Herak, D., Sigalingging, R. (2013): The trend of oil palm production in Ghana, Conference Proceeding – 5th International Conference, TAE 2013: Trends in Agricultural Engineering, 2013. pp: 699–702.
A. K. Morrison and E. Heijndermans (2013): Palm Kernel Oil Production Process Characterization – An Energy, Poverty and Gender (EnPoGen) Initiative of SNV Ghana
The Oil Palm Value Capture Opportunity in Africa, www.acetforafrica.org
Masterplan Study on the Oil Palm Industry in Ghana, FINAL Report revised November, 2011
14th International Workshop for Young Scientists, BioPhys Spring 2015, May 27-29, 2015, Gödöllő, Hungary
34
PREDICTIVE MODELING FOR LOW POWER PHOTOVOLTAIC SYSTEMS
Zoltán Kapros
Department of Physics and Process Control, Szent István University Páter K. u. 1., Gödöllő, H-2103 Hungary
Tel.: +36 28 522055, Email: [email protected] Abstract: The research work aims the integration of grid connected PV systems could be more safely and more cheaply. The obstacles to the spread of PV systems, which need for accurate schedules, but the PV technology can not able to give these. During the research, analyze and appreciate the opportunity to how can be produced information on the total average PV performances in a micro-region based on measurement and evaluation of a chosen reference photovoltaic system.
Keywords: solar energy, predictive forecasting, photovoltaic integration
Introduction A study by the Hungarian Academy of Science shows the installation potential of PV systems in Hungary 4051.48 km2 area, which is means close to 484 974 GWh/a solar renewable electricity production potential (MTA, 2006). In the top of the houses by the residential sector and the institutional buildings could be installed around 2500 MWP photovoltaic small power plans and these could produce about 2 846 GWh/a electricity (the residential photovoltaic potential is about. 22.5% in Hungary). The technological potential at this level currently seems unattainable, but for example after 2021 by a European Union obligation as building renovations or new construction will have to reach the level of close to zero-energy buildings and the active solar energy equipment’s are essential part of these types of buildings.
Material and method The estimation for production of electricity from solar energy by a number of methods is known. The controllability and/or the possibility of the real-time forecasting of the energy production mean a growing importance by the technology evaluations. The EPIA (European Photovoltaic Industry Association) examines the errors of the forecasting methods how it depends on the locations or the size of the systems. The inaccuracies of the forecasting cause more difficulty by the stabile and cost-effective operation of the electric grid. (EPIA, 2012).
The problems could be treatable technologically, but usually only with substantial additional costs (for example through the batteries, or purchasing reserve electricity). The actually PhD research at the Szent István University in Gödöllő trying establish a real-time forecasting method with a new approach. The system can be suitable for the rapid and accurate prediction of the electricity production of some PV portfolios (which systems consist of many small PV power plants in top of the houses).
Some alternative solar irradiance smoothing model is based of some irradiance sensor and the effect of the moving clouds (Dyreson at al., 2014). These types of model seem a good choice by big PV power plants, where the high prices of the huge number sensors are acceptable. The new model is only based on detailed investigation of a reference PV power plant. This error is the difference between the analytically modeled and measured production. This error is based
14th International Workshop for Young Scientists, BioPhys Spring 2015, May 27-29, 2015, Gödöllő, Hungary
35
on more physical effects, so the measured errors are spreading, and these effects are could be similar by other PV systems. So this spreading of errors can be very useful if we will be able to modeling the directions and speeds. The equivalent peak load hour (Sharma, Tiwari, 2011) in a given time shows a value kind of performance. Thus, the actual performance of the system could be illustrated in relation to utilization, so the equivalent peak load hour is characterized by energy-generating operating capacity in a given moment (defined as follows):
hekv = real / IP (eq. 1)
Where hekv is the equivalent peak load hour, in h, real is total specific amount of solar electricity in kWh/m2, IP is current value of the global radiation intensity during in kW/m2. The model used for the relative error factor:
f = (hekv – h*ekv) / hekv (eq. 2)
Where hekv is the analytically expected equivalent peak load hour, and h*ekv is the measured
expected equivalent peak load hour.
Results The main thesis of the research is expected to: By the photovoltaic systems can be defined a normalized error between the analytically expected energy production and the real measured values, which is suitable for a real-time evaluation a solar field real-time energy production potential. The normalized average error during a period in the case of a reference system is suitable for acceptable real-time estimates by other nearby systems. This reference plant method with real-time error analysis is suitable for PV predictive forecasting and is also suitable cumulative forecasting by a residential PV field for balancing purpose in the distributed grid.
Conclusion The research work aims the integration of autonomous or grid connected PV systems could be more safely and more cheaply, as presently possible.
References Dyreson, A. R. et al, (2014): Modeling solar irradiance smoothing for large PV power plants using a 45-sensor network and Wavelet Variability Model. Solar Energy 110 (2014), pp. 482-495
Sharma, R. and Tiwari, G.N. (2011): Technical performance evaluation of stand-alone photovoltaic array for outdoor field conditions of New Delhi, Applied Energy, Article in press.
EPIA (2012): Connecting the sun, Solar photovoltaic on the road to large-scale grid integration, full report, pp. 25-29
Hungarian Academy of Science (2006): Hungary's renewable energy potential, full report, Budapest
Acknowledgement This paper was supported by the Mechanical Engineering PhD School, Szent István University, Gödöllő, Hungary
14th International Workshop for Young Scientists, BioPhys Spring 2015, May 27-29, 2015, Gödöllő, Hungary
36
PROPERTIES OF APPLES AT COMPRESSION
Ľubomír Kubik
Department of Physic, Slovak University of Agriculture in Nitra, Tr. A. Hlinku 2, 949 76 Nitra, Slovak Republic, tel.:+421376414879
Email: [email protected]
Abstract: Paper dealt with the determination of mechanical properties of apple cultivar Golden Delicious. Texture of fruit is commonly evaluated based on the macroscopic mechanical properties of the whole fruit. However, fruit are not a homogenous material, but consist of a complex conglomerate of cells.
Keywords: apple, compress test, modulus of elasticity, stress, strain apple Introduction The macroscopic mechanical properties of the tissue are thus determined by various microscopic cellular and histological features, such as cell size, amount of intercellular space, mechanical properties of the cell wall and middle lamella, and turgor pressure (Oey at
al,2007). The mechanical properties of the food depend largely on its structure and composition, and any variations in structure will influence its mechanical properties and hence the texture. Biological materials are commonly anisotropic. Hence their mechanical properties differ according to the orientation in which it is tested. Fleshy fruit tissue, such as apple parenchyma, shows mechanical anisotropy depending on the shape and arrangement of the cells and other morphological components. Large elongated intercellular spaces have been reported in apples and other fruit (Khan and Vicent, 1993).The stress-strain uniaxial compression test shows the response of biomaterials to an externally applied force that deforms the body of the material, causing changes in dimension, shape, or volume. This test provides important information about elastic and plastic behaviour (Babić et al, 2013).
Material and methods The mechanical properties of cultivar Golden Delicious were studied by means a compression test. The compression test was realized by test stand Andilog Stentor 1000. The compression load curves of the stress on the strain were evaluated of the longitudinal and lateral directions. The moduli of elasticity were determined by two different methods. The first method was determination of the apparent modulus of elasticity on the base of the Hertz equations for contact stresses used in solid mechanics; the second method was based on the calculation of the slope of the linear part of the stress – strain curve by regression method from Young’s law. The stress and the strain were determined in the bioyield point and the rupture point of the compression load curves, which represent the limits of the cells and the tissue destruction.
Results Compression stress – strain curve of apple fruit Golden Delicious in the lateral loading is presented on the Fig. 1. The modulus of elasticity in the lateral loading achieved the value 0.6955 MPa and the stresses in the bioyield points were from 0.0179 MPa to 0.0961 MPa. Several bioyield points were created as we can see at the compression curve. The tissue was compressed and the corruption of the cells of different structures of apple fruit were realized.
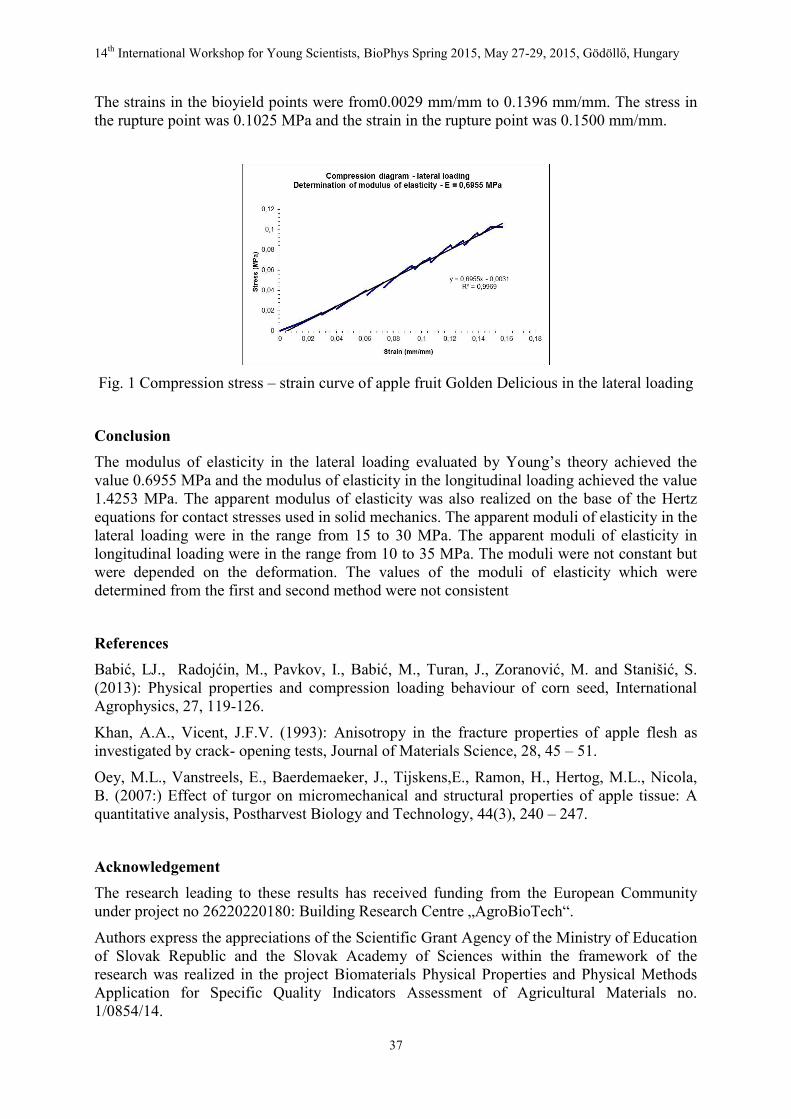
14th International Workshop for Young Scientists, BioPhys Spring 2015, May 27-29, 2015, Gödöllő, Hungary
37
The strains in the bioyield points were from0.0029 mm/mm to 0.1396 mm/mm. The stress in the rupture point was 0.1025 MPa and the strain in the rupture point was 0.1500 mm/mm.
Fig. 1 Compression stress – strain curve of apple fruit Golden Delicious in the lateral loading
Conclusion The modulus of elasticity in the lateral loading evaluated by Young’s theory achieved the value 0.6955 MPa and the modulus of elasticity in the longitudinal loading achieved the value 1.4253 MPa. The apparent modulus of elasticity was also realized on the base of the Hertz equations for contact stresses used in solid mechanics. The apparent moduli of elasticity in the lateral loading were in the range from 15 to 30 MPa. The apparent moduli of elasticity in longitudinal loading were in the range from 10 to 35 MPa. The moduli were not constant but were depended on the deformation. The values of the moduli of elasticity which were determined from the first and second method were not consistent
References Babić, LJ., Radojćin, M., Pavkov, I., Babić, M., Turan, J., Zoranović, M. and Stanišić, S. (2013): Physical properties and compression loading behaviour of corn seed, International Agrophysics, 27, 119-126.
Khan, A.A., Vicent, J.F.V. (1993): Anisotropy in the fracture properties of apple flesh as investigated by crack- opening tests, Journal of Materials Science, 28, 45 – 51.
Oey, M.L., Vanstreels, E., Baerdemaeker, J., Tijskens,E., Ramon, H., Hertog, M.L., Nicola, B. (2007:) Effect of turgor on micromechanical and structural properties of apple tissue: A quantitative analysis, Postharvest Biology and Technology, 44(3), 240 – 247.
Acknowledgement The research leading to these results has received funding from the European Community under project no 26220220180: Building Research Centre „AgroBioTech“.
Authors express the appreciations of the Scientific Grant Agency of the Ministry of Education of Slovak Republic and the Slovak Academy of Sciences within the framework of the research was realized in the project Biomaterials Physical Properties and Physical Methods Application for Specific Quality Indicators Assessment of Agricultural Materials no. 1/0854/14.
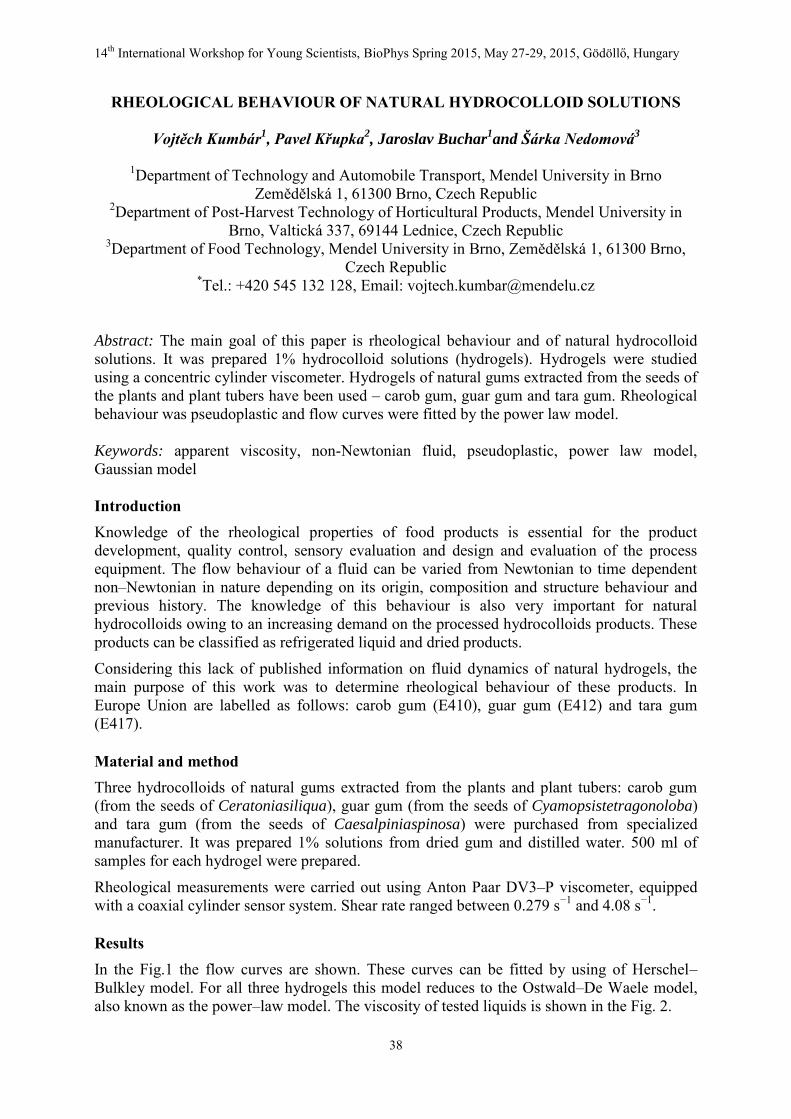
14th International Workshop for Young Scientists, BioPhys Spring 2015, May 27-29, 2015, Gödöllő, Hungary
38
RHEOLOGICAL BEHAVIOUR OF NATURAL HYDROCOLLOID SOLUTIONS
Vojtěch Kumbár1, Pavel Křupka
2, Jaroslav Buchar
1and Šárka Nedomová
3
1Department of Technology and Automobile Transport, Mendel University in Brno
Zemědělská 1, 61300 Brno, Czech Republic 2Department of Post-Harvest Technology of Horticultural Products, Mendel University in
Brno, Valtická 337, 69144 Lednice, Czech Republic 3Department of Food Technology, Mendel University in Brno, Zemědělská 1, 61300 Brno,
Czech Republic *Tel.: +420 545 132 128, Email: [email protected]
Abstract: The main goal of this paper is rheological behaviour and of natural hydrocolloid solutions. It was prepared 1% hydrocolloid solutions (hydrogels). Hydrogels were studied using a concentric cylinder viscometer. Hydrogels of natural gums extracted from the seeds of the plants and plant tubers have been used – carob gum, guar gum and tara gum. Rheological behaviour was pseudoplastic and flow curves were fitted by the power law model. Keywords: apparent viscosity, non-Newtonian fluid, pseudoplastic, power law model, Gaussian model Introduction Knowledge of the rheological properties of food products is essential for the product development, quality control, sensory evaluation and design and evaluation of the process equipment. The flow behaviour of a fluid can be varied from Newtonian to time dependent non–Newtonian in nature depending on its origin, composition and structure behaviour and previous history. The knowledge of this behaviour is also very important for natural hydrocolloids owing to an increasing demand on the processed hydrocolloids products. These products can be classified as refrigerated liquid and dried products.
Considering this lack of published information on fluid dynamics of natural hydrogels, the main purpose of this work was to determine rheological behaviour of these products. In Europe Union are labelled as follows: carob gum (E410), guar gum (E412) and tara gum (E417).
Material and method Three hydrocolloids of natural gums extracted from the plants and plant tubers: carob gum (from the seeds of Ceratoniasiliqua), guar gum (from the seeds of Cyamopsistetragonoloba) and tara gum (from the seeds of Caesalpiniaspinosa) were purchased from specialized manufacturer. It was prepared 1% solutions from dried gum and distilled water. 500 ml of samples for each hydrogel were prepared.
Rheological measurements were carried out using Anton Paar DV3–P viscometer, equipped with a coaxial cylinder sensor system. Shear rate ranged between 0.279 s−1 and 4.08 s−1.
Results In the Fig.1 the flow curves are shown. These curves can be fitted by using of Herschel–Bulkley model. For all three hydrogels this model reduces to the Ostwald–De Waele model, also known as the power–law model. The viscosity of tested liquids is shown in the Fig. 2.
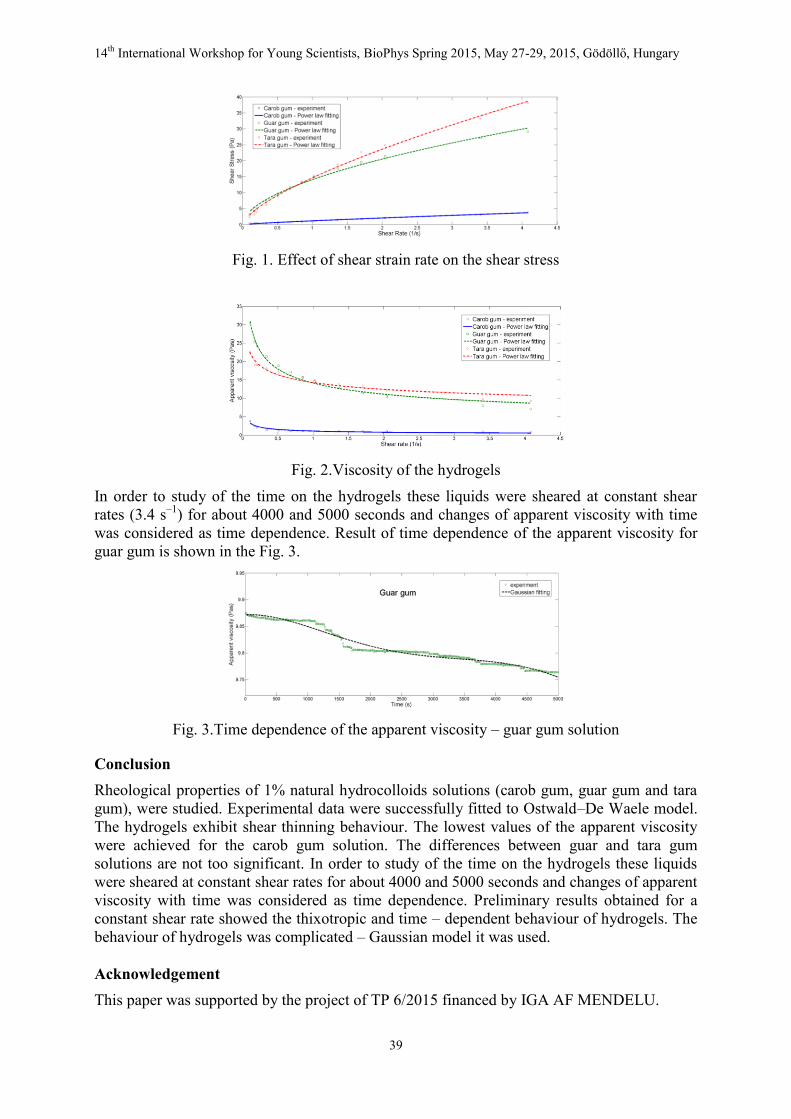
14th International Workshop for Young Scientists, BioPhys Spring 2015, May 27-29, 2015, Gödöllő, Hungary
39
Fig. 1. Effect of shear strain rate on the shear stress
Fig. 2.Viscosity of the hydrogels
In order to study of the time on the hydrogels these liquids were sheared at constant shear rates (3.4 s–1) for about 4000 and 5000 seconds and changes of apparent viscosity with time was considered as time dependence. Result of time dependence of the apparent viscosity for guar gum is shown in the Fig. 3.
Fig. 3.Time dependence of the apparent viscosity – guar gum solution
Conclusion Rheological properties of 1% natural hydrocolloids solutions (carob gum, guar gum and tara gum), were studied. Experimental data were successfully fitted to Ostwald–De Waele model. The hydrogels exhibit shear thinning behaviour. The lowest values of the apparent viscosity were achieved for the carob gum solution. The differences between guar and tara gum solutions are not too significant. In order to study of the time on the hydrogels these liquids were sheared at constant shear rates for about 4000 and 5000 seconds and changes of apparent viscosity with time was considered as time dependence. Preliminary results obtained for a constant shear rate showed the thixotropic and time – dependent behaviour of hydrogels. The behaviour of hydrogels was complicated – Gaussian model it was used. Acknowledgement This paper was supported by the project of TP 6/2015 financed by IGA AF MENDELU.
14th International Workshop for Young Scientists, BioPhys Spring 2015, May 27-29, 2015, Gödöllő, Hungary
40
PERFORMANCE ENHANCEMENT OF SOLAR AIR COLLECTORS
Maytham Ali Al-Neama and István Farkas
Department of Physics and Process Control, Szent István University
Páter K. u. 1., Gödöllő, H-2103 Hungary Tel.: +36 28 522055, Email: [email protected]
Abstract: This paper is deals with the solar air system especially with the application possibilities for drying. Keywords: performance, solar energy, solar dryer, air collector Introduction The sun is the only star of our solar system located at its centre. The earth and other planets orbit the sun. Energy from the sun in the form of solar radiation supports almost all life on earth via photosynthesis and drives the earth’s climate and weather. Basically all the forms of energy in the world as we know it are solar in origin.
Air heating is very important application of solar energy. Solar dryers use air collectors to collect solar energy. Solar dryers are used primarily by the agricultural industry. The purpose of drying an agricultural product is to reduce its moisture content to a level that prevents its deterioration. In drying, two processes take place, as follow:
Heat transfer to the product using energy from the heating source. Mass transfer of moisture from the interior of the product to its surface and from the
surface to the surrounding air.
The objective of this research is to study the performance of a solar air collector and a dryer. System description Flat plate solar collectors are special kind of heat exchangers that transfer heat energy from incident solar radiation to the working medium. They perform three functions, absorbing solar radiation, converting it to heat energy, and transferring the energy to a working medium passing through the collector duct. The main use of flat plate solar collectors includes space heating and crop drying. Flat plate solar collector can heat working medium to a temperature range of 10-50 °C above ambient temperature depending on the design. There are three principal parts of flat plate solar collector:
absorber plate which absorbs solar radiation and transfers it to the working medium, Transparent cover which allows short wave radiation to pass and prevents them from
exiting. Insulation which resists back and rear side heat losses.
Distributed, natural circulation, solar energy dryers are also called indirect passive dryers. A typical distributed natural circulation solar energy dryer comprises an air heating solar energy collector, appropriate insulated ducting, a drying chamber, and a chimney, as shown in Fig. 1.
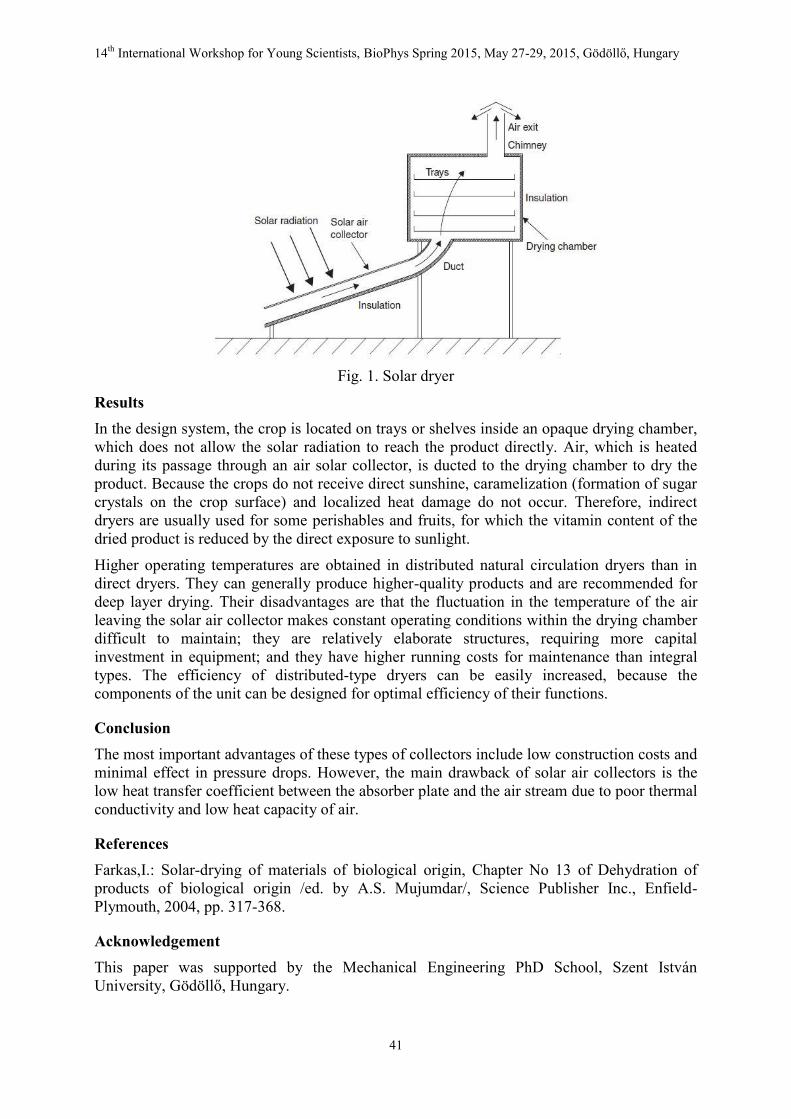
14th International Workshop for Young Scientists, BioPhys Spring 2015, May 27-29, 2015, Gödöllő, Hungary
41
Fig. 1. Solar dryer
Results In the design system, the crop is located on trays or shelves inside an opaque drying chamber, which does not allow the solar radiation to reach the product directly. Air, which is heated during its passage through an air solar collector, is ducted to the drying chamber to dry the product. Because the crops do not receive direct sunshine, caramelization (formation of sugar crystals on the crop surface) and localized heat damage do not occur. Therefore, indirect dryers are usually used for some perishables and fruits, for which the vitamin content of the dried product is reduced by the direct exposure to sunlight.
Higher operating temperatures are obtained in distributed natural circulation dryers than in direct dryers. They can generally produce higher-quality products and are recommended for deep layer drying. Their disadvantages are that the fluctuation in the temperature of the air leaving the solar air collector makes constant operating conditions within the drying chamber difficult to maintain; they are relatively elaborate structures, requiring more capital investment in equipment; and they have higher running costs for maintenance than integral types. The efficiency of distributed-type dryers can be easily increased, because the components of the unit can be designed for optimal efficiency of their functions.
Conclusion The most important advantages of these types of collectors include low construction costs and minimal effect in pressure drops. However, the main drawback of solar air collectors is the low heat transfer coefficient between the absorber plate and the air stream due to poor thermal conductivity and low heat capacity of air.
References Farkas,I.: Solar-drying of materials of biological origin, Chapter No 13 of Dehydration of products of biological origin /ed. by A.S. Mujumdar/, Science Publisher Inc., Enfield-Plymouth, 2004, pp. 317-368.
Acknowledgement This paper was supported by the Mechanical Engineering PhD School, Szent István University, Gödöllő, Hungary.
14th International Workshop for Young Scientists, BioPhys Spring 2015, May 27-29, 2015, Gödöllő, Hungary
42
NOVEL-TYPE SOLUTIONS OF THE CONVECTION-ANOMALOUS DIFFUSION TRANSPORT EQUATION
Csaba Mészáros
1, Klaus Gottschalk
2, István Farkas
1, Anikó Földi
3 and Ágnes Bálint
4
1Department of Physics and Process Control, Szent István University
Páter K. u. 1., Gödöllő, H-2103 Hungary Tel.: +36 28 522055, Email: [email protected]
2Department of Post-Harvest Technology Leibniz-Institut für Agrartechnik (ATB
Max-Eyth-Allee 100, Potsdam-Bornim, Germany 3Centre for Energy Research, Hungarian Academy of Sciences,
Environmental Protection Service, Budapest, Hungary 4Institute of Environmental Engineering
Óbuda University, Doberdó u. 6. H-1034 Budapest, Hungary
Abstract: After a brief overview of most important general features of the non-classical diffusion on the base of the contemporary non-equilibrium thermodynamics, the relevant generalized form of the free energy function is presented on the base of the general theory of non-classical type diffusion processes. Then, using the simplest variant of the convection-diffusion equation, novel-type analytic solutions are given for transport processes with both subdiffusive-, and superdiffusive character in Lagrangian representation. Keywords: non-equilibrium thermodynamics, anomalous diffusion, convection, symbolic computation Introduction Since the genuine microscopic structure of the porous matter is adequately described not simply as a percolative system, but rather than system of percolative-fractal character, this latter fact must also be taken into account at future accurate modelling procedures of all types of transport processes taking place in porous media. As a novel element, together with convection, the presence of anomalous diffusion, characteristic for percolative-fractal systems is also taken into account in our study. The recent modeling methods allow direct incorporation of the relevant most advanced mathematical techniques of the anomalous diffusion into existing transport models elaborated for simultaneous convection and diffusion taking place in porous media.
Material and method The spreading out of the basic solution curve (i.e. dispersion) in the form of travelling waves can be assigned to the convection-diffusion equation, which is applied here by change of the convection flow velocity direction. This procedure may also be directly generalized to the case of simultaneous convection and diffusion of several components, and the Lagrangian representation of continuum mechanics has proven to be particularly suitable from this point of view. Having discussed the essential basic general features of the simultaneous convection-diffusion processes taking place through porous media, we are in position to apply the methods of the non-classical diffusion theory, which represents an essentially new
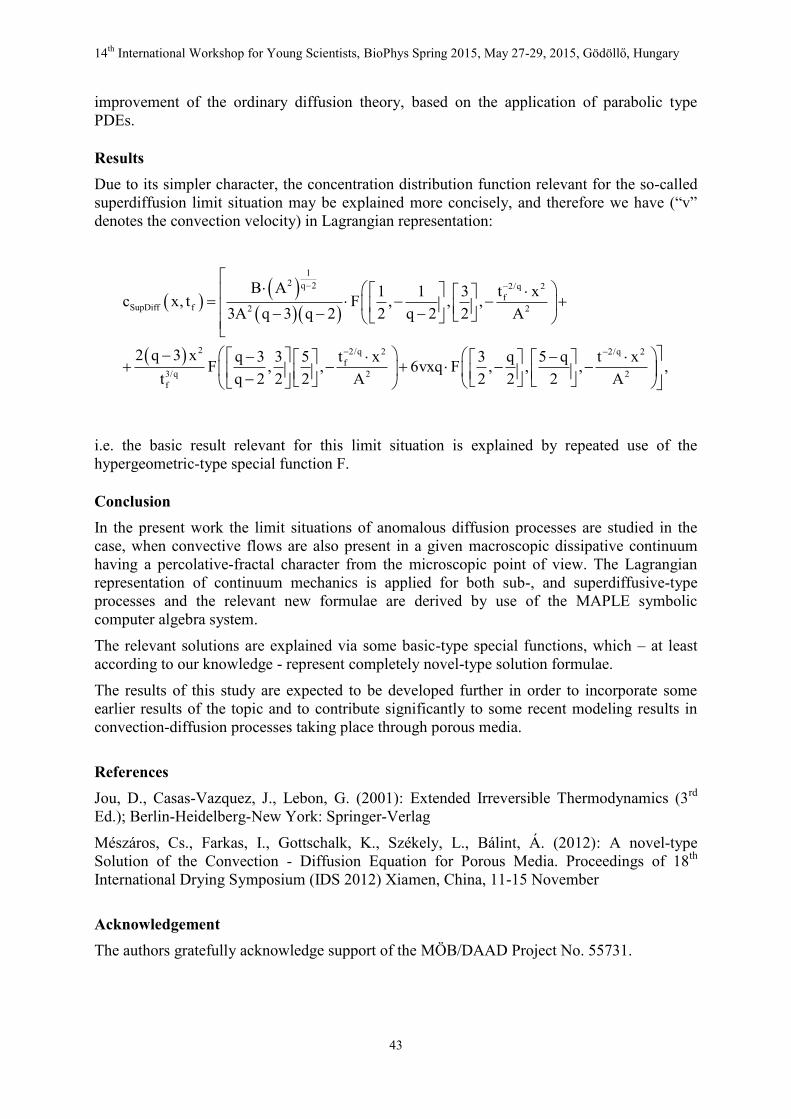
14th International Workshop for Young Scientists, BioPhys Spring 2015, May 27-29, 2015, Gödöllő, Hungary
43
improvement of the ordinary diffusion theory, based on the application of parabolic type PDEs.
Results Due to its simpler character, the concentration distribution function relevant for the so-called superdiffusion limit situation may be explained more concisely, and therefore we have (“v” denotes the convection velocity) in Lagrangian representation:
12 q 2 2/q 2
fSupDiff f 2 2
2 2/q 2 2/q 2f
3/q 2 2f
B A t x1 1 3c x, t F , , ,3A q 3 q 2 2 q 2 2 A
2 q 3 x t xq 3 3 5 3 q 5 q t xF , , 6vxq F , , , ,t q 2 2 2 A 2 2 2 A
i.e. the basic result relevant for this limit situation is explained by repeated use of the hypergeometric-type special function F.
Conclusion In the present work the limit situations of anomalous diffusion processes are studied in the case, when convective flows are also present in a given macroscopic dissipative continuum having a percolative-fractal character from the microscopic point of view. The Lagrangian representation of continuum mechanics is applied for both sub-, and superdiffusive-type processes and the relevant new formulae are derived by use of the MAPLE symbolic computer algebra system.
The relevant solutions are explained via some basic-type special functions, which – at least according to our knowledge - represent completely novel-type solution formulae.
The results of this study are expected to be developed further in order to incorporate some earlier results of the topic and to contribute significantly to some recent modeling results in convection-diffusion processes taking place through porous media.
References Jou, D., Casas-Vazquez, J., Lebon, G. (2001): Extended Irreversible Thermodynamics (3rd Ed.); Berlin-Heidelberg-New York: Springer-Verlag
Mészáros, Cs., Farkas, I., Gottschalk, K., Székely, L., Bálint, Á. (2012): A novel-type Solution of the Convection - Diffusion Equation for Porous Media. Proceedings of 18th International Drying Symposium (IDS 2012) Xiamen, China, 11-15 November
Acknowledgement The authors gratefully acknowledge support of the MÖB/DAAD Project No. 55731.
14th International Workshop for Young Scientists, BioPhys Spring 2015, May 27-29, 2015, Gödöllő, Hungary
44
MODIFICATION OF RHEOLOGICAL PROPERTIES OF POLYSACCHARIDE FOOD MATRIX MADE OF APPLE POMACE BY DIVALENT METAL IONS
Joanna Mierczyńska, Justyna Cybulska and Artur Zdunek
Institute of Agrophysics, Polish Academy of Sciences ul. Doświadczalna 4 20-290 Lublin
Abstract: The purpose of this study is to improve rheological properties of optimized mixture of modified cell wall polysaccharides made of apple pomace with addition of calcium, magnesium and iron ions.
Keywords: rheological properties, polysaccharide, apple, metal ions
Introduction Non-starch cell wall polysaccharides from fruit and vegetables such as pectin, hemicellulose and cellulose are the main components of dietary fiber. Dietary fiber has proved positive influence on human health therefore the object of many studies is application of cell wall components as functional additives to food products. Pectin have been already used as gelling agents in fruit juice, jams, jellies, drinks, sauces, syrups, sugar confectionery and yogurts. Hemicellulose and cellulose are used mainly as thickening agents.
Functionality of pectin is associated with their structure. Pectin substances are rich in galacturonic acid (GalA) and consist of three main pectin components: homogalacturonan (HG), rhamnogalacturonan I (RG-I) and rhamnogalacturonan II (RG-II). The interaction of negatively charged unmethylated GalA residues in HG with Ca2+ is one of the most important pectin properties due to the ability to form stable gels which can determine pectin’s functionality and application for the industry. This feature can be explained by capability to interaction of low-methylated pectin chains (with degree of methylation DM < 50%) with calcium cations and form an HG-calcium complex called “the egg-box model” (Cybulska et al. 2015; Mierczyńska et al. 2015).
Based on ability of pectin to modify texture of food products, other cell wall polysaccharides may be involved to create new polysaccharide food matrix made of apple pomace. Used in this case cell wall polysaccharides might be able to enrich food in health-promoting dietary fiber. According to the “egg-box model”, gel formation can be mediated by other divalent cations presented in solutions like iron and magnesium ions. Also the relation between rheological properties and food quality might play an important role for the design of food processing and functional food additives that affects food acceptability.
Material and method The mixture of cell wall polysaccharides is composed of apple pomace freeze dried and micronized to particle size 50-100 µm and apple pectin spray dried with low degree of methylation (Cybulska 2014). To determine rheological properties of polysaccharide matrix with addition of divalent ions, aqueous solutions with calcium hydroxide Ca(OH)2, magnesium hydroxide Mg(OH)2 or iron lactate C6H10FeO6 were prepared in concentrations 3, 6, 9, 12 and 15 mM. 5% solutions of MPS were prepared in aqueous solutions of these compounds. 5% aqueous MPS solution without ions addition was taken as a control (Fig 1.).
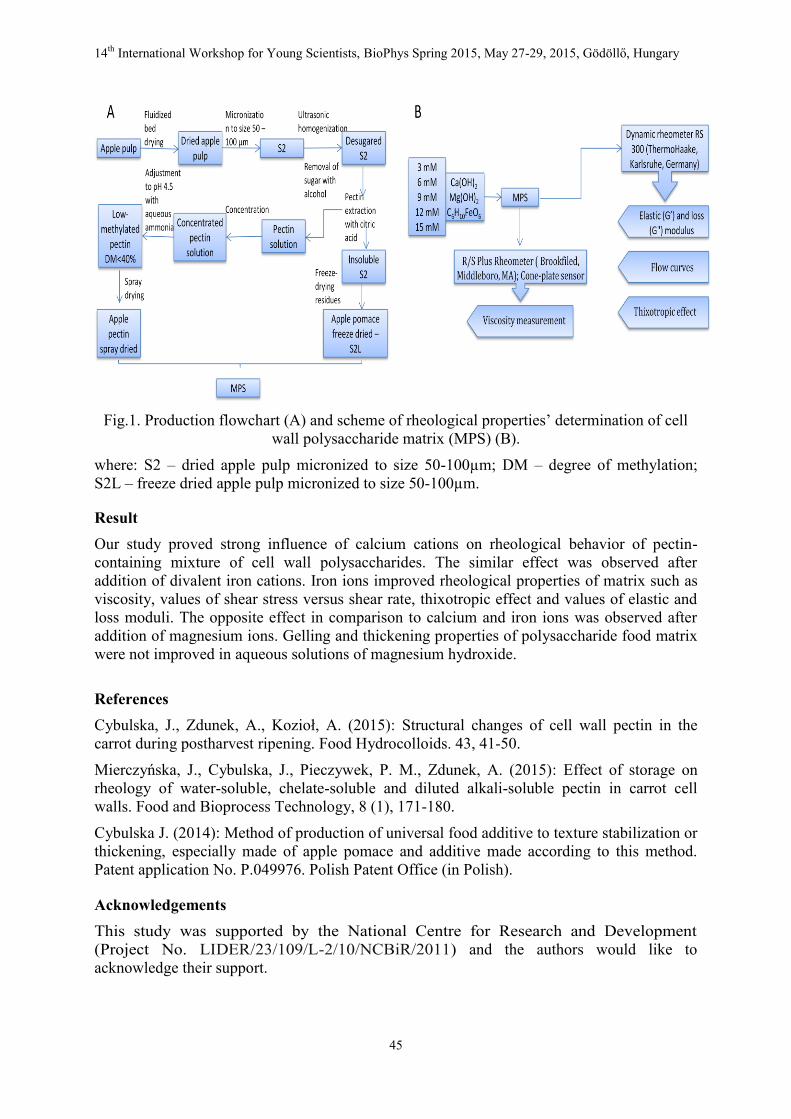
14th International Workshop for Young Scientists, BioPhys Spring 2015, May 27-29, 2015, Gödöllő, Hungary
45
Fig.1. Production flowchart (A) and scheme of rheological properties’ determination of cell wall polysaccharide matrix (MPS) (B).
where: S2 – dried apple pulp micronized to size 50-100µm; DM – degree of methylation; S2L – freeze dried apple pulp micronized to size 50-100µm.
Result Our study proved strong influence of calcium cations on rheological behavior of pectin-containing mixture of cell wall polysaccharides. The similar effect was observed after addition of divalent iron cations. Iron ions improved rheological properties of matrix such as viscosity, values of shear stress versus shear rate, thixotropic effect and values of elastic and loss moduli. The opposite effect in comparison to calcium and iron ions was observed after addition of magnesium ions. Gelling and thickening properties of polysaccharide food matrix were not improved in aqueous solutions of magnesium hydroxide.
References Cybulska, J., Zdunek, A., Kozioł, A. (2015): Structural changes of cell wall pectin in the carrot during postharvest ripening. Food Hydrocolloids. 43, 41-50.
Mierczyńska, J., Cybulska, J., Pieczywek, P. M., Zdunek, A. (2015): Effect of storage on rheology of water-soluble, chelate-soluble and diluted alkali-soluble pectin in carrot cell walls. Food and Bioprocess Technology, 8 (1), 171-180.
Cybulska J. (2014): Method of production of universal food additive to texture stabilization or thickening, especially made of apple pomace and additive made according to this method. Patent application No. P.049976. Polish Patent Office (in Polish). Acknowledgements This study was supported by the National Centre for Research and Development (Project No. LIDER/23/109/L-2/10/NCBiR/2011) and the authors would like to acknowledge their support.
14th International Workshop for Young Scientists, BioPhys Spring 2015, May 27-29, 2015, Gödöllő, Hungary
46
EVALUATION AND OPTIMIZATION OF DNA EXTRACTION PROCEDURES FOR TALAROMYCES FLAVUS
Jacek Panek and Magdalena Frąc
Institute of Agrophysics, Polish Academy of Sciences Doświadczalna 4, 20-290 Lublin, Poland
[email protected], [email protected]
Abstract: The aim of this study is the development of DNA extraction method providing the best quality, purity and good yield of DNA.
Keywords: optimization, Talaromyces flavus
Introduction
Talaromyces flavus is heat resistant fungus responsible for spoilage of heat-processed food. Primary source of this spoilage are heat-resistant fungi. T. flavus is able to survive heat-treatment during process of pasteurization (Jesenská et al., 1993, Samson et al., 2011, Sokołowska 2010). T. flavus apart is able to produce numerous mycotoxins, such as talaromycin or mitrorubrin (Proksa et al., 2010). Detection of T.flavus can be conducted by usage either of traditional plate and microscope based techniques or by usage of techniques based on molecular biology.
Obtaining good quality DNA is one of the most important steps in molecular biology studies. DNA extraction is critical stage of sample processing. Almost every molecular technique widely used in fungal research is strongly dependent on purity and quality of studied DNA (Cenis,1992, Fredricks et al., 2005).
Fungal cell walls may hinder the recovery of nucleic acids. Few studies have focused on the critical DNA extraction stage of sample processing (Fredricks et al., 2005, Miller et al., 1999). Highly sensitive and specific nucleic acid-based techniques for the detection of fungi require the use of reagents that are free of enzymatic reactions inhibitors. The detection of fungi by polymerase chain reaction (PCR) based techniques requires the use of extraction methods that efficiently lyse fungal cells and recover DNA suitable for latter amplification.
Matherial and method We compared the effectiveness of eleven DNA extraction procedures by using mycelium and ascospores of Talaromyces flavus reference strain DSM 63536. The yield and quality of extracted DNA was checked using spectrophotometry method (NanoDrop).
The 260 nm/230 nm and 260 nm/280 nm absorbance ratios were calculated to determine the quality of isolated DNA. The fragmentation and molecular size of extracted DNA was checked using agarose gel electrophoresis. Suitability for molecular techniques usage of extracted DNA was examined by performing PCR reaction with primers specific to Talaromyces flavus detection.
Studied methods of DNA extraction contained bead mill mechanical homogenization, manual grinding in liquid nitrogen, sonication, enzyme lysis and combinations of mentioned above. We used EURx GeneMATRIX, MPBio FastPrep, Ambion MagMAX and PrepMan Ultra DNA extraction kits and method with usage of Cetyl trimethylammonium bromide (CTAB) (Doohan et al., 1998).
14th International Workshop for Young Scientists, BioPhys Spring 2015, May 27-29, 2015, Gödöllő, Hungary
47
Result Comparisons of studied extraction procedures revealed that bead mill homogenization tends to provide the best yields of DNA. Sonication homogenization tends to provide better purity values.
Bead mill homogenization combined with sonication, using EURx GeneMATRIX kit was found to be the best extraction technique from both mycelia and ascospores of T. flavus, when DNA yield and purity were used as criteria.
References Cenis J. L. (1992): Rapid extraction of fungal DNA for PCR amplification. Nucleic Acids Research, 20(9), 2380.
Doohan F. M., Parry D.W., Jenkinson P. and Nicholson P. (1998): The use of species-specific PCR-based assays to analyse Fusarium ear blight of wheat. Plant Pathol., 47, 197–205.
Fredricks D. N., Smith C. and Meier A. (2005): Comparison of Six DNA Extraction Methods for Recovery of Fungal DNA as Assessed by Quantitative PCR. Journal of Clinical Microbiology, 43(10), 5122–5128.
Jesenská Z., Piecková E. and Bernát, D. (1993): Heat resistance of fungi from soil. International journal of food microbiology, 19, 187-192.
Miller D. N., Bryant J. E., Madsen E. L. and Ghirose W. C. (1999): Evaluation and Optimization of DNA Extraction and Purification Procedures for Soil and Sediment Samples. Appl. Environ. Microbiol., 65(11), 4715-4724.
Proksa B. (2010): Talaromyces flavus and its metabolites. Chemical Papers , 64, 696–714
Samson R.A., Yilmaz N., Houbraken J., Spierenburg H., Seifert K.A., Peterson S.W., Varga J. and Frisvad J.C. (2011): Phylogeny and nomenclature of the genus Talaromyces and taxa accommodated in Penicillium subgenus Biverticillium. Studies in mycology, 70, 159-183.
Sokołowska B. (2010): Pleśnie ciepłooporne w przetwórstwie owoców i warzyw. Przemysł fermentacyjny i owocowo-warzywny, 10, 36-37.
Acknowledgement The research is funded by the Polish Ministry of Science and Higher Education under the Diamond Grant program, project No.: 0204/DIA/2013/42.
14th International Workshop for Young Scientists, BioPhys Spring 2015, May 27-29, 2015, Gödöllő, Hungary
48
FREEZING AND DEFROSTING OF DOUGH INVESTIGATION BY DSC METHOD
Ana Petrović1, Vlasta Vozárová
1, Jana Šmitalová
2, Ján Csillag
1 and
Ľubomír Híreš
1
1Department of Physics, 2Department of Storage and Processing of Plant Products, Slovak University of Agriculture in Nitra, Tr. A. Hlinku 2, 949 76 Nitra, Slovakia
[email protected] Abstract: The paper deals with simulation offreezing and defrosting of dough (standard dough and dough with additives of Xanthan gum or Guar gum) by DSC method to monitoring temperature of exothermal and endothermal peaks and enthalpy of phase transition. Keywords: freezing, defrosting, differential scanning calorimetry, dough Introduction Cooling and freezing of foodstuffs are classified as physical and physical-chemical anabiotic conservation methods. The quality of frozen products depends on the raw materials and on the technology process; particularly important is the time required for freezing the dough. Crystal growth during the freezing process may results to increased protein concentration of the polymer matrix and the separation of gluten from the starches granules, therefore it is important rapid freezing, especially in the temperature range from 0 °C to -5 °C, where is the risk of large crystals forming, distorting of the texture of bakery products (Šmitalová – Bojňanská, 2013/14).Process of freezing and defrosting may be investigating by method of differential scanning calorimetry (DSC); it is a thermoanalytical technique which monitors heat effects associated with phase transitions and chemical reactions as a function of temperature, at pre-defined speed of heating (cooling), with assuming that both, Reference and material, are under the same conditions.
Materials and methods For monitoring of freezing and defrosting processes of dough(phase transition of dough components) by DSC method was used device DSC 1 (METTLER-TOLEDO). Samples with weight (8-13) mg, were hermetically sealed in aluminum crucibles and thermally treated at a speed of heating2 K/min in the temperature range from 20°C to the temperature of -28 °C, and then reverse, from -28°C to 20°C.The measurement was carried out in an inert, dynamic atmosphere of N2. As a result we got a DSC thermogram, which was evaluated in STARe software.
Samples that we measured were standard dough, than dough with Xanthan gum and as the third dough with Guar gum. Xanthan gum is exocellular polysaccharide produced by aerobic fermentation of sugar by the bacterium Xanthomonascanpestris. In recipes of bakery products significantly improves volume, slows aging of bread, has a positive effect on the viscosity and reinforcement of the structure of the dough and plays an important role in gluten-free products, in which replaces an absent gluten(Šmitalová –Bojňanská, 2014).
Guar gum (E412) is the product obtained by milling endosperm of guar bean (CyamposistetragonolobusL.). Positive effect of the addition of guar gum was found to be particular the volume, texture and sensory characteristics of bakery products (Šmitalová –Bojňanská, 2014).
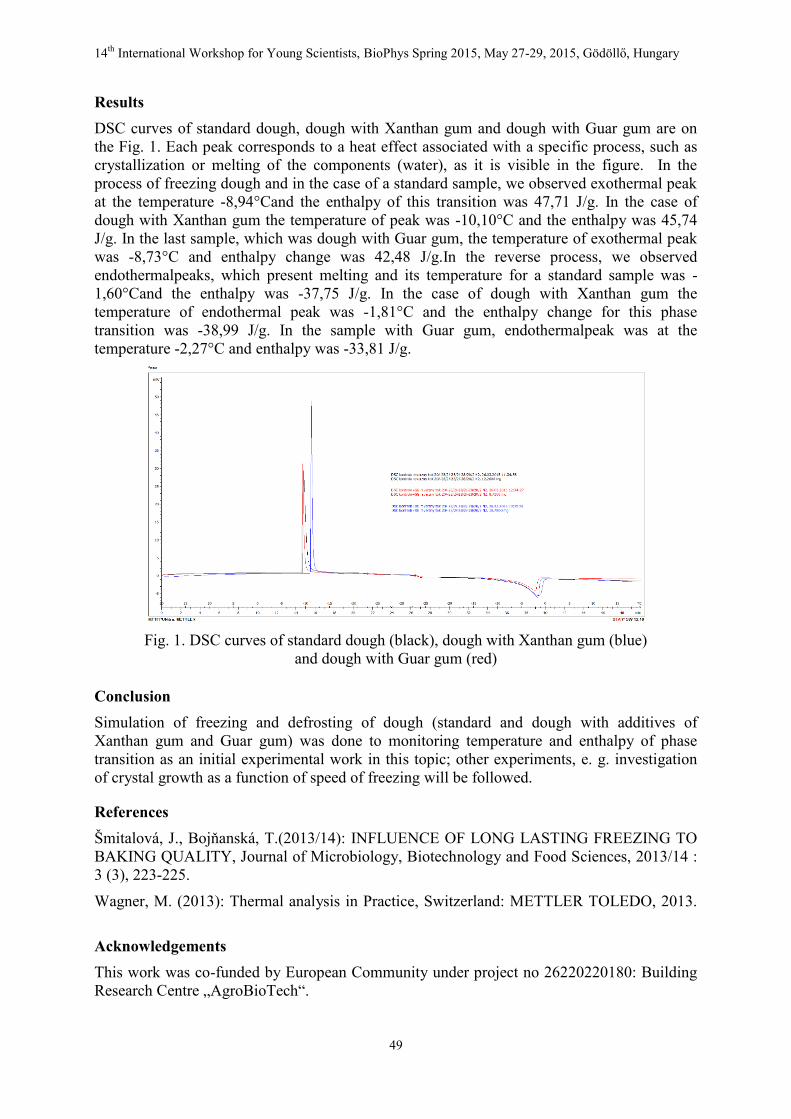
14th International Workshop for Young Scientists, BioPhys Spring 2015, May 27-29, 2015, Gödöllő, Hungary
49
Results DSC curves of standard dough, dough with Xanthan gum and dough with Guar gum are on the Fig. 1. Each peak corresponds to a heat effect associated with a specific process, such as crystallization or melting of the components (water), as it is visible in the figure. In the process of freezing dough and in the case of a standard sample, we observed exothermal peak at the temperature -8,94°Cand the enthalpy of this transition was 47,71 J/g. In the case of dough with Xanthan gum the temperature of peak was -10,10°C and the enthalpy was 45,74 J/g. In the last sample, which was dough with Guar gum, the temperature of exothermal peak was -8,73°C and enthalpy change was 42,48 J/g.In the reverse process, we observed endothermalpeaks, which present melting and its temperature for a standard sample was -1,60°Cand the enthalpy was -37,75 J/g. In the case of dough with Xanthan gum the temperature of endothermal peak was -1,81°C and the enthalpy change for this phase transition was -38,99 J/g. In the sample with Guar gum, endothermalpeak was at the temperature -2,27°C and enthalpy was -33,81 J/g.
Fig. 1. DSC curves of standard dough (black), dough with Xanthan gum (blue)
and dough with Guar gum (red)
Conclusion Simulation of freezing and defrosting of dough (standard and dough with additives of Xanthan gum and Guar gum) was done to monitoring temperature and enthalpy of phase transition as an initial experimental work in this topic; other experiments, e. g. investigation of crystal growth as a function of speed of freezing will be followed.
References Šmitalová, J., Bojňanská, T.(2013/14): INFLUENCE OF LONG LASTING FREEZING TO BAKING QUALITY, Journal of Microbiology, Biotechnology and Food Sciences, 2013/14 : 3 (3), 223-225.
Wagner, M. (2013): Thermal analysis in Practice, Switzerland: METTLER TOLEDO, 2013. Acknowledgements This work was co-funded by European Community under project no 26220220180: Building Research Centre „AgroBioTech“.
14th International Workshop for Young Scientists, BioPhys Spring 2015, May 27-29, 2015, Gödöllő, Hungary
50
EVAULATION OF BIOPHYSICAL DATA BY MULTI-DIMENSIONAL REGRESSION ANALYSIS
Adam Polcar, Vojtěch Kumbár and Jiří Votava
Department of Technology and Automobile Transport, Mendel University in Brno Zemědělská 1/1665, 613 00 Brno, Czech Republic
Tel.: +420 545 132 129, Email: [email protected] Abstract: The article describes multiple regression model creation. The individual steps of the regression model construction done using the so-called regression triplet are described in the article. The method is demonstrated on investigation of the relationship between the temperature, density and dynamic viscosity of the E85 – bioethanol and petrol mixture. Keywords: linear regression analysis, regression triplet, regression diagnostics, method of least squares, temperature, density, dynamic viscosity Introduction The regression analysis is a method to investigate the relationships between variables (Chatterjee and Hadi, 2006). At construction of the regression model, the least squares method is used very often. The least squares method provides satisfactory estimates of regression parameters, but only if all assumptions about the data and the regression model are met (Meloun et al., 2002). We can get deviated estimates and incorrect model at non-compliance assumptions. The article describes the individual steps of the multi-dimensional regression model construction done using the so-called regression triplet. The method is demonstrated on investigation of the relationship between the temperature, density and dynamic viscosity of the E85 – bioethanol and petrol mixture.
Material and method The statistical software QC.Expert 3.3 has been used for exploratory data analysis and construction of the regression model itself. Basic assumptions about the data have been verified prior to multi-dimensional regression analysis itself. It was found by the use of appropriate diagnostic tools (Shapiro-Wilk W-test, quantile-quantile plot, boxplot, etc.) that the initial data satisfy the basic assumptions and can be used to construct a regression model. The regression model construction procedure consists of model suggestion and subsequent regression diagnostics (Meloun and Militký, 2011). The suggested regression model had the following form:
22110 xxy (1)
where: y density of E85 [kg.m-3], ß0, ß1, ß2 regression parameters, x1 temperature of E85 [°C ], x2 dynamic viscosity [mPa.s]
In the first step, the best estimates of the regression parameters have been found using the least squares method. The Student's t-test has verified whether the individual regression coefficients are statistically significant. Test proved that the ß2 parameter is statistically insignificant. Also the calculation of the following basic static characteristics of regression has been conducted in this step: coefficient of correlation R and coefficient of determination R2, which represents the percentage of variability explained by the model.
14th International Workshop for Young Scientists, BioPhys Spring 2015, May 27-29, 2015, Gödöllő, Hungary
51
According to Meloun and Militký (2001), one of the most efficient test criterion for testing regression model quality is mean quadratic error of prediction (MEP) and Akaike information criterion (AIC) - these criteria are decisive for distinguish among several proposed models. The regression diagnostics followed. It includes means for interactive analysis of data, model, and method, i.e. the components of so-called regression triplet. Data criticism has been performed using the analysis of residues, Atkinson distance, using the plots indicating influential points (Pregibon plot, Williams plot). One outlier has been detected using the data criticism. The detection of influential points has been followed by the suggested model criticism. The suggested model criticism has been conducted using partial regression and especially partial residual plots. Residual plot showed a clear linear dependence of the independent variable "temperature" (x1). In contrast, the independent variable "dynamic viscosity" (x2) exhibits high dispersion. It is not a linear dependency and therefore its presence is insignificant in the suggested model. This is also confirmed by the results of Student's t-test for statistical significance of individual independent variables. Method criticism is the last step of the regression triplet. Method criticism is conducted using several statistical tests (Meloun and Militký, 2011): Fisher-Snedecor test of regression model significance, Scott criterion of multi-collinearity to verify of model correctness, Cook-Weisberg test of residues heteroscedasticity (constancy of variance), Jarque-Berra normality test of residues, Wald test and Durbin-Watson test of autocorrelation - test to determine whether the trend is not in residues. Based on results of these tests, our calculated model meets all requirements for used method of least squares. The final step after removal of the outliers and irrelevant variables is the refined model construction. After removal of independent variable x2 (dynamic viscosity), the multi-dimensional model has been simplified to a simple one-dimensional linear dependence. Repeated estimation of individual regression parameters ß0 and ß1 using the least squares method followed.
Results As the analyses show, the dynamic viscosity did not statistically significant affect the density of the E85, in other words, the density of E85 is not possible to reliably determine based on dynamic viscosity.
Conclusion Besides the obtained results of experimental measurements, this article has another objective to describe in detail the process of multi-dimensional regression model construction using the so-called regression triplet utilizing modern statistical software.
References Chatterjee, S. and Hadi, A. S. (2006): Regression Analysis by Example. 4th ed. John Wiley & Sons, Inc., Hoboken, New Jersey.
Meloun, M. and Militký J. (2001): Detection of single influential points in OLS regression model building. Analytica Chimica Acta, 439: 169‒191.
Meloun, M. and Militký, J. (2011): Statistical Data Analysis: A Practical Guide. 1st ed. Woodhead Publishing, India.
Meloun, M., Militký, J., Kupka, K. and Brereton, R. G. (2002): The effect of influential data, model and method on the precision of univariate calibration. Talanta, 57: 721‒740.
Acknowledgement This research was primarily supported by project TP 6/2015 "Impact loading of agricultural products and foodstuffs" financed by Internal Grand Agency AF MENDELU.
14th International Workshop for Young Scientists, BioPhys Spring 2015, May 27-29, 2015, Gödöllő, Hungary
52
CHARACTERIZATION OF PHOTOVOLTAIC SYSTEM
Dani Rusirawan1, Nurul Imam Muhlis
1 and István Farkas
2
1Department of Mechanical Engineering, Institut Teknologi Nasional (ITENAS) Bandung
Jl. PKHH. Mustapa No. 23 Bandung 40124, West java – Indonesia Tel.: +62227272215, Email: [email protected]
2Department of Physics and Process Control, Szent István University Páter K. u. 1., Gödöllő, H-2103 Hungary
Tel.: +36 28 522055, Email: [email protected] Abstract: Solar power plant is one of an alternative system to substitute the conventional power plant, such as coal/steam power plant. Nevertheless, we know that although the solar power is the simplest way to be implemented but it is not the cheapest to be invested, especially if we compare the cost of energy (in kWh) between solar power plant and other type of power plant (generation system). In view of this, the big challenge for all of us is overcoming of this situation. One of key point to realize of the reliable solar power plant is understand of characteristic of the photovoltaic system, as a main feature of the solar power plant. In this research, characterization of photovoltaic system will be elaborated and predicted. The existing method, i.e. single diode model will be applied in this work in order to characterize of two type of the PV modules, i.e. polycrystalline and thin film, by Matlab-Simulink algorithm. As the results of this work, characteristic of the PV system (currents - voltage - power) will be shown. Keywords: solar power plant, alternative system, single diode model, Matlab-Simulink, currents – voltage - power Introduction In a practice, the solar power plant systems consist of photovoltaic (PV) system (module/panel/array), electrical components and connection system, and mechanical system. Understanding of each characteristic is the most important thing, in order to get a reliable solar power systems system. In the PV system, relations between current, voltage and power generated by system can be illustrated by photovoltaic characteristics, and it can be developed through experimentally and theoretically by the simulation. In theoretical approach, we need to understand an equivalent circuit diagram of PV system, which compatible with the electrical behavior of the actual PV system. Presently, many equivalent circuit diagram have been developed and proposed to describe the PV system’s characteristic and the most commonly used are single and double diode models. In a single diode model, a complete characteristic of a PV systems’s can be described by five model parameters (called as five lumped parameters) i.e. light generated current (Il), leakage or reverse saturation current (Io), diode quality factor (n), series resistance (Rs) and shunt resistance (Rsh). Il and Io can be said as external influences meanwhile the others are an internal influences.
Material and method In this research, software based Matlab-Simulink in order to characterize of the photovoltaic modules at different of irradiation and temperature have been created, using single diode model. By using this software, beside need of the PV module specification at Standard Test
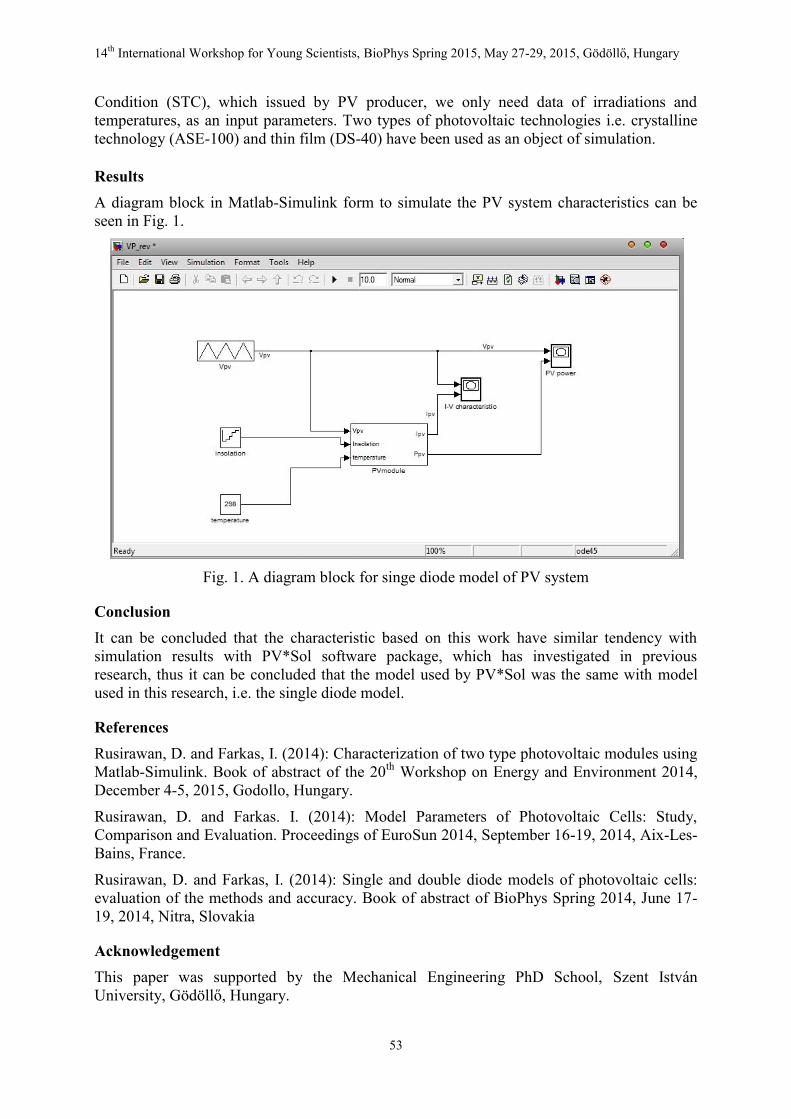
14th International Workshop for Young Scientists, BioPhys Spring 2015, May 27-29, 2015, Gödöllő, Hungary
53
Condition (STC), which issued by PV producer, we only need data of irradiations and temperatures, as an input parameters. Two types of photovoltaic technologies i.e. crystalline technology (ASE-100) and thin film (DS-40) have been used as an object of simulation.
Results A diagram block in Matlab-Simulink form to simulate the PV system characteristics can be seen in Fig. 1.
Fig. 1. A diagram block for singe diode model of PV system
Conclusion It can be concluded that the characteristic based on this work have similar tendency with simulation results with PV*Sol software package, which has investigated in previous research, thus it can be concluded that the model used by PV*Sol was the same with model used in this research, i.e. the single diode model.
References Rusirawan, D. and Farkas, I. (2014): Characterization of two type photovoltaic modules using Matlab-Simulink. Book of abstract of the 20th Workshop on Energy and Environment 2014, December 4-5, 2015, Godollo, Hungary.
Rusirawan, D. and Farkas. I. (2014): Model Parameters of Photovoltaic Cells: Study, Comparison and Evaluation. Proceedings of EuroSun 2014, September 16-19, 2014, Aix-Les-Bains, France.
Rusirawan, D. and Farkas, I. (2014): Single and double diode models of photovoltaic cells: evaluation of the methods and accuracy. Book of abstract of BioPhys Spring 2014, June 17-19, 2014, Nitra, Slovakia
Acknowledgement This paper was supported by the Mechanical Engineering PhD School, Szent István University, Gödöllő, Hungary.
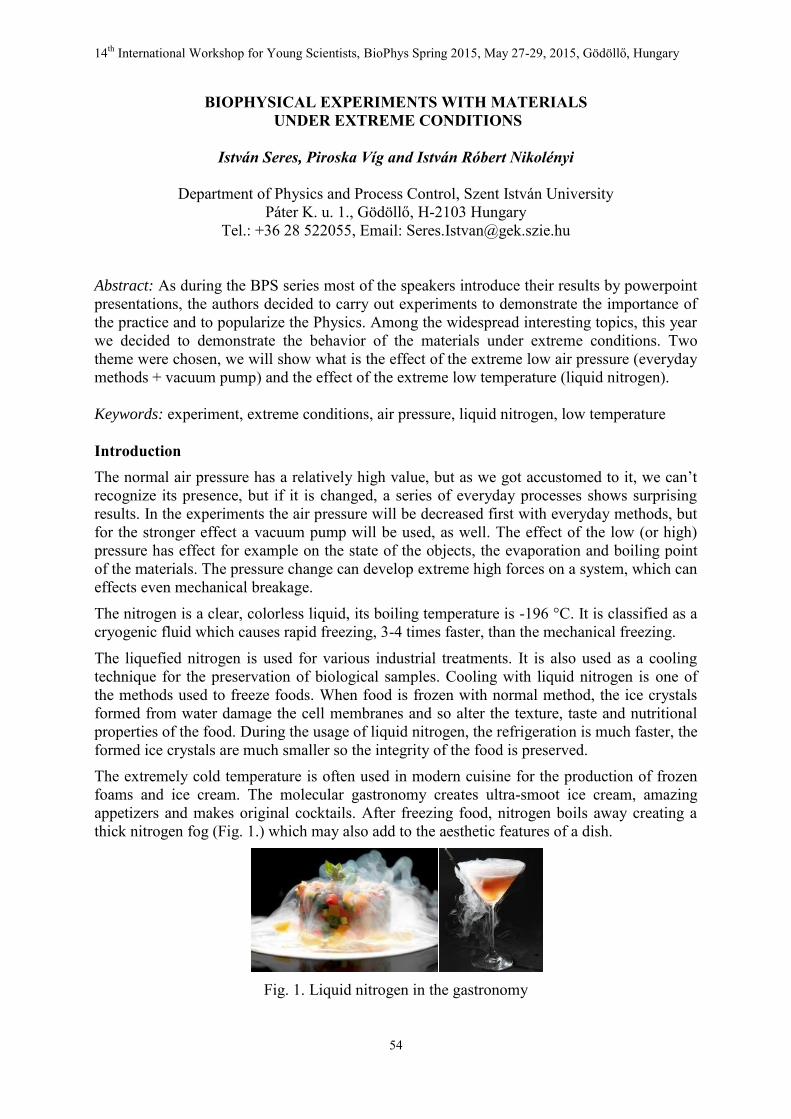
14th International Workshop for Young Scientists, BioPhys Spring 2015, May 27-29, 2015, Gödöllő, Hungary
54
BIOPHYSICAL EXPERIMENTS WITH MATERIALS UNDER EXTREME CONDITIONS
István Seres, Piroska Víg and István Róbert Nikolényi
Department of Physics and Process Control, Szent István University Páter K. u. 1., Gödöllő, H-2103 Hungary
Tel.: +36 28 522055, Email: [email protected]
Abstract: As during the BPS series most of the speakers introduce their results by powerpoint presentations, the authors decided to carry out experiments to demonstrate the importance of the practice and to popularize the Physics. Among the widespread interesting topics, this year we decided to demonstrate the behavior of the materials under extreme conditions. Two theme were chosen, we will show what is the effect of the extreme low air pressure (everyday methods + vacuum pump) and the effect of the extreme low temperature (liquid nitrogen). Keywords: experiment, extreme conditions, air pressure, liquid nitrogen, low temperature Introduction The normal air pressure has a relatively high value, but as we got accustomed to it, we can’t recognize its presence, but if it is changed, a series of everyday processes shows surprising results. In the experiments the air pressure will be decreased first with everyday methods, but for the stronger effect a vacuum pump will be used, as well. The effect of the low (or high) pressure has effect for example on the state of the objects, the evaporation and boiling point of the materials. The pressure change can develop extreme high forces on a system, which can effects even mechanical breakage.
The nitrogen is a clear, colorless liquid, its boiling temperature is -196 °C. It is classified as a cryogenic fluid which causes rapid freezing, 3-4 times faster, than the mechanical freezing.
The liquefied nitrogen is used for various industrial treatments. It is also used as a cooling technique for the preservation of biological samples. Cooling with liquid nitrogen is one of the methods used to freeze foods. When food is frozen with normal method, the ice crystals formed from water damage the cell membranes and so alter the texture, taste and nutritional properties of the food. During the usage of liquid nitrogen, the refrigeration is much faster, the formed ice crystals are much smaller so the integrity of the food is preserved. The extremely cold temperature is often used in modern cuisine for the production of frozen foams and ice cream. The molecular gastronomy creates ultra-smoot ice cream, amazing appetizers and makes original cocktails. After freezing food, nitrogen boils away creating a thick nitrogen fog (Fig. 1.) which may also add to the aesthetic features of a dish.
Fig. 1. Liquid nitrogen in the gastronomy
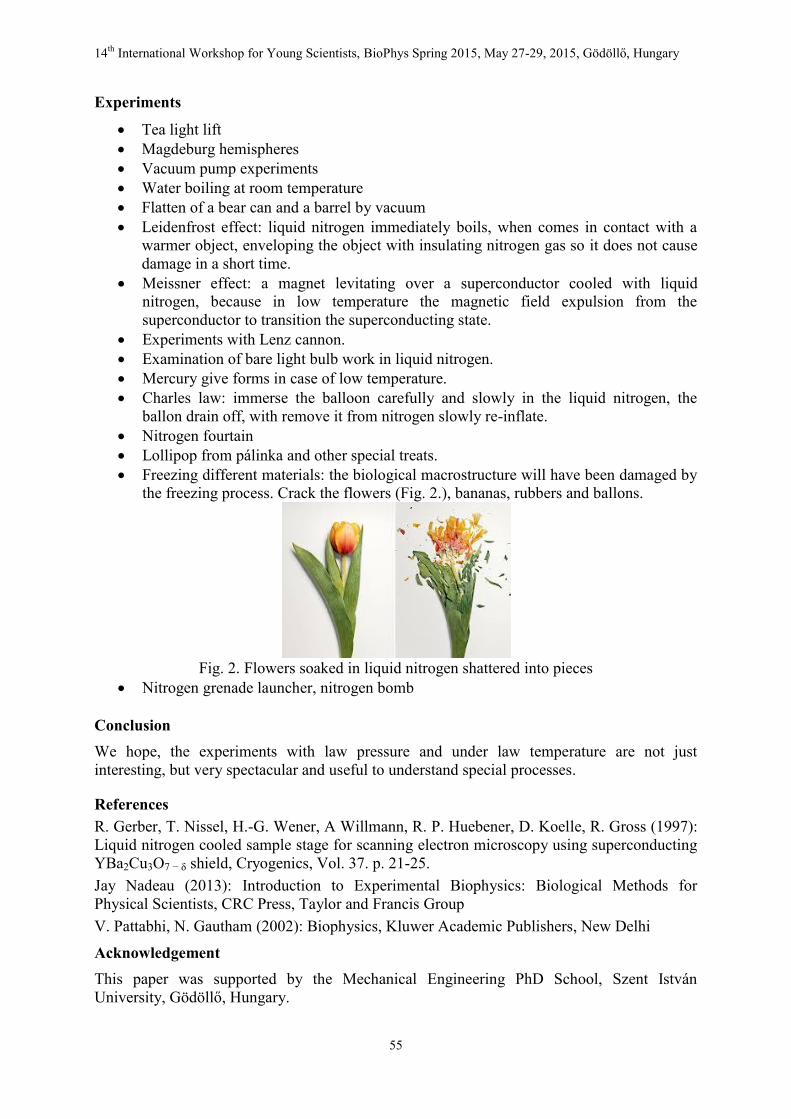
14th International Workshop for Young Scientists, BioPhys Spring 2015, May 27-29, 2015, Gödöllő, Hungary
55
Experiments
Tea light lift Magdeburg hemispheres Vacuum pump experiments Water boiling at room temperature Flatten of a bear can and a barrel by vacuum Leidenfrost effect: liquid nitrogen immediately boils, when comes in contact with a
warmer object, enveloping the object with insulating nitrogen gas so it does not cause damage in a short time.
Meissner effect: a magnet levitating over a superconductor cooled with liquid nitrogen, because in low temperature the magnetic field expulsion from the superconductor to transition the superconducting state.
Experiments with Lenz cannon. Examination of bare light bulb work in liquid nitrogen. Mercury give forms in case of low temperature. Charles law: immerse the balloon carefully and slowly in the liquid nitrogen, the
ballon drain off, with remove it from nitrogen slowly re-inflate. Nitrogen fourtain Lollipop from pálinka and other special treats. Freezing different materials: the biological macrostructure will have been damaged by
the freezing process. Crack the flowers (Fig. 2.), bananas, rubbers and ballons.
Fig. 2. Flowers soaked in liquid nitrogen shattered into pieces
Nitrogen grenade launcher, nitrogen bomb
Conclusion We hope, the experiments with law pressure and under law temperature are not just interesting, but very spectacular and useful to understand special processes.
References R. Gerber, T. Nissel, H.-G. Wener, A Willmann, R. P. Huebener, D. Koelle, R. Gross (1997): Liquid nitrogen cooled sample stage for scanning electron microscopy using superconducting YBa2Cu3O7 − δ shield, Cryogenics, Vol. 37. p. 21-25. Jay Nadeau (2013): Introduction to Experimental Biophysics: Biological Methods for Physical Scientists, CRC Press, Taylor and Francis Group V. Pattabhi, N. Gautham (2002): Biophysics, Kluwer Academic Publishers, New Delhi
Acknowledgement This paper was supported by the Mechanical Engineering PhD School, Szent István University, Gödöllő, Hungary.
14th International Workshop for Young Scientists, BioPhys Spring 2015, May 27-29, 2015, Gödöllő, Hungary
56
PLANT DROUGHT MEMORY AS POTENTIAL TOOL FOR IMPROVING DROUGHT TOLERANCE
Joanna Siecińska and Artur Nosalewicz
Institute of Agrophysics, Polish Academy of Sciences Doświadczalna 4, 20-290 Lublin, Poland
Abstract: The main scientific aim of conducted research was to answer how plants reaction to drought stress is affected by earlier exposure to drought stress.
Keywords: drought stress, drought tolerance, Lolium perenne, Festuca arundinacea
Introduction Drought is considered the single most devastating environmental stress, that decreases crop productivity more than any other stress. Predicted, future climate changes undoubtedly will affect agricultural productivity (Berger and Ludwig, 2014). Changes in climate and extreme weather events are likely to impact agricultural crops, but it is not clear to what degree yield losses resulting from droughts will increase in the future. Owing to the complex nonlinear interactions between a plant and its environment, the assessment of impacts is not trivial especially in a case of repeated stresses. Plants typically exposed to fluctuating environmental conditions response with plasticity that manifests itself in specific developmental, physiological and reproductive adjustments that are thought to optimize plant fitness. Soil water deficits are expected to be more frequent in many regions with climate changes exposing crops to drought stresses more than one time during growth period. Plants have evolved complex acclimation and adaptation mechanisms allowing to survive drought stresses. (Trnka et al., 2011, Berger and Ludwig, 2014, Walter et al., 2013). These observations have led to the concept of ‘stress memory’ implying that during subsequent exposures plants provide responses that are different from those during their first encounter with the stress. Materials and methods The study was conducted to examined physiological responses to water-deficit stress in two cultivars of grass with different drought tolerance, Festuca arundinacea (Fa)- drought resistant and Lolium perenne (Lp) - drought sensitive. The experiment included three treatments differing in water potential changes during growth of plants:
Control treatment “C” – where soil moisture was maintained on optimal water potential during all time of experiment
Drought treatment “D1D2” – drought stress was induced two times during the experiment, first drought between 25th-36th day after sowing (DAS) and after short period of watering the second drought at 45-46 DAS.
Drought treatment “D2” – drought stress was induced only once, at 46-48 DAS.
The measurements included detailed analyses of plant water use, shoot and root system distribution with depth and morphology responses, measurements of relative water content (RWC) and changes in lipid peroxidation (Uchiyama M. and Mihara M.) at time of water stress and re-watering (Fig. 1.).
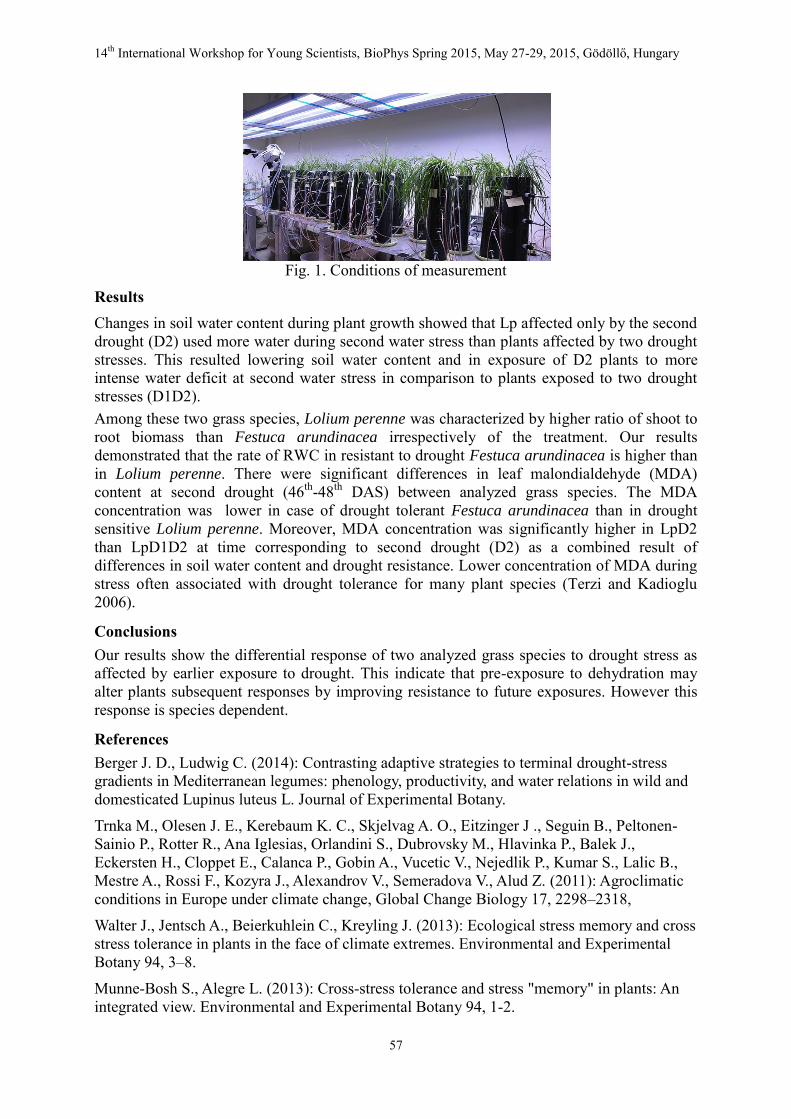
14th International Workshop for Young Scientists, BioPhys Spring 2015, May 27-29, 2015, Gödöllő, Hungary
57
Fig. 1. Conditions of measurement
Results Changes in soil water content during plant growth showed that Lp affected only by the second drought (D2) used more water during second water stress than plants affected by two drought stresses. This resulted lowering soil water content and in exposure of D2 plants to more intense water deficit at second water stress in comparison to plants exposed to two drought stresses (D1D2). Among these two grass species, Lolium perenne was characterized by higher ratio of shoot to root biomass than Festuca arundinacea irrespectively of the treatment. Our results demonstrated that the rate of RWC in resistant to drought Festuca arundinacea is higher than in Lolium perenne. There were significant differences in leaf malondialdehyde (MDA) content at second drought (46th-48th DAS) between analyzed grass species. The MDA concentration was lower in case of drought tolerant Festuca arundinacea than in drought sensitive Lolium perenne. Moreover, MDA concentration was significantly higher in LpD2 than LpD1D2 at time corresponding to second drought (D2) as a combined result of differences in soil water content and drought resistance. Lower concentration of MDA during stress often associated with drought tolerance for many plant species (Terzi and Kadioglu 2006).
Conclusions Our results show the differential response of two analyzed grass species to drought stress as affected by earlier exposure to drought. This indicate that pre-exposure to dehydration may alter plants subsequent responses by improving resistance to future exposures. However this response is species dependent.
References Berger J. D., Ludwig C. (2014): Contrasting adaptive strategies to terminal drought-stress gradients in Mediterranean legumes: phenology, productivity, and water relations in wild and domesticated Lupinus luteus L. Journal of Experimental Botany.
Trnka M., Olesen J. E., Kerebaum K. C., Skjelvag A. O., Eitzinger J ., Seguin B., Peltonen-Sainio P., Rotter R., Ana Iglesias, Orlandini S., Dubrovsky M., Hlavinka P., Balek J., Eckersten H., Cloppet E., Calanca P., Gobin A., Vucetic V., Nejedlik P., Kumar S., Lalic B., Mestre A., Rossi F., Kozyra J., Alexandrov V., Semeradova V., Alud Z. (2011): Agroclimatic conditions in Europe under climate change, Global Change Biology 17, 2298–2318,
Walter J., Jentsch A., Beierkuhlein C., Kreyling J. (2013): Ecological stress memory and cross stress tolerance in plants in the face of climate extremes. Environmental and Experimental Botany 94, 3–8.
Munne-Bosh S., Alegre L. (2013): Cross-stress tolerance and stress "memory" in plants: An integrated view. Environmental and Experimental Botany 94, 1-2.
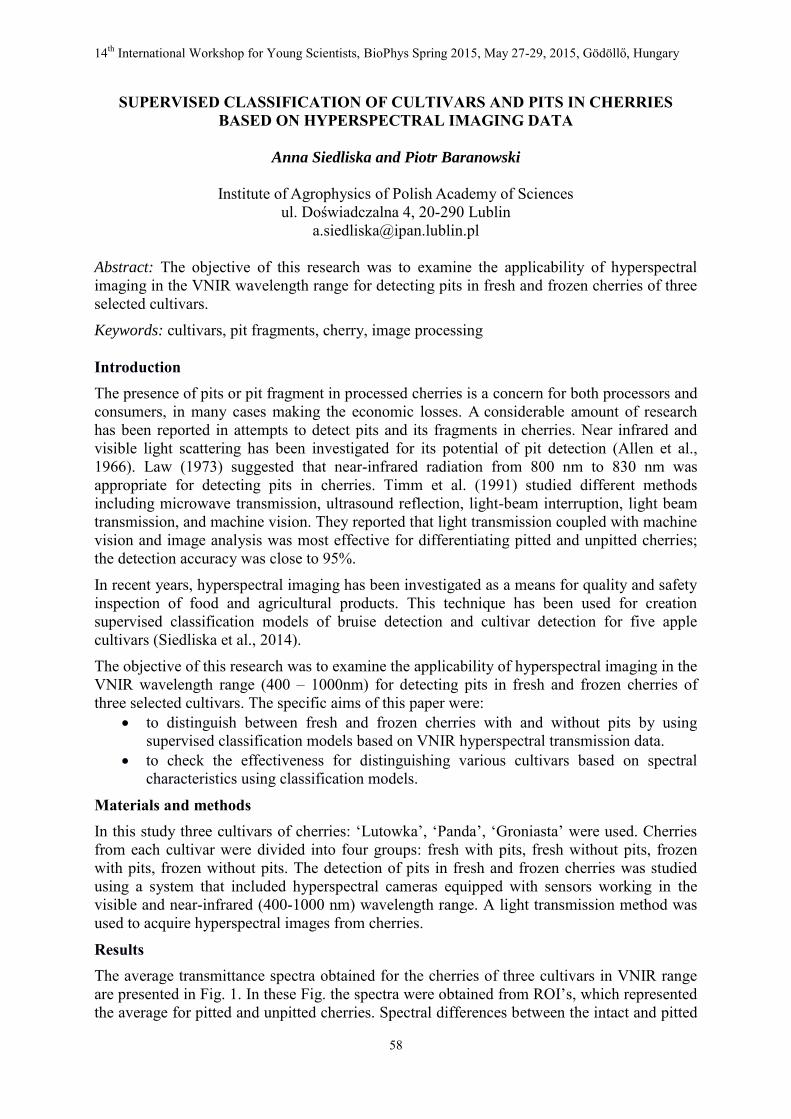
14th International Workshop for Young Scientists, BioPhys Spring 2015, May 27-29, 2015, Gödöllő, Hungary
58
SUPERVISED CLASSIFICATION OF CULTIVARS AND PITS IN CHERRIES BASED ON HYPERSPECTRAL IMAGING DATA
Anna Siedliska and Piotr Baranowski
Institute of Agrophysics of Polish Academy of Sciences ul. Doświadczalna 4, 20-290 Lublin
[email protected] Abstract: The objective of this research was to examine the applicability of hyperspectral imaging in the VNIR wavelength range for detecting pits in fresh and frozen cherries of three selected cultivars.
Keywords: cultivars, pit fragments, cherry, image processing
Introduction The presence of pits or pit fragment in processed cherries is a concern for both processors and consumers, in many cases making the economic losses. A considerable amount of research has been reported in attempts to detect pits and its fragments in cherries. Near infrared and visible light scattering has been investigated for its potential of pit detection (Allen et al., 1966). Law (1973) suggested that near-infrared radiation from 800 nm to 830 nm was appropriate for detecting pits in cherries. Timm et al. (1991) studied different methods including microwave transmission, ultrasound reflection, light-beam interruption, light beam transmission, and machine vision. They reported that light transmission coupled with machine vision and image analysis was most effective for differentiating pitted and unpitted cherries; the detection accuracy was close to 95%.
In recent years, hyperspectral imaging has been investigated as a means for quality and safety inspection of food and agricultural products. This technique has been used for creation supervised classification models of bruise detection and cultivar detection for five apple cultivars (Siedliska et al., 2014).
The objective of this research was to examine the applicability of hyperspectral imaging in the VNIR wavelength range (400 – 1000nm) for detecting pits in fresh and frozen cherries of three selected cultivars. The specific aims of this paper were:
to distinguish between fresh and frozen cherries with and without pits by using supervised classification models based on VNIR hyperspectral transmission data.
to check the effectiveness for distinguishing various cultivars based on spectral characteristics using classification models.
Materials and methods In this study three cultivars of cherries: ‘Lutowka’, ‘Panda’, ‘Groniasta’ were used. Cherries from each cultivar were divided into four groups: fresh with pits, fresh without pits, frozen with pits, frozen without pits. The detection of pits in fresh and frozen cherries was studied using a system that included hyperspectral cameras equipped with sensors working in the visible and near-infrared (400-1000 nm) wavelength range. A light transmission method was used to acquire hyperspectral images from cherries.
Results The average transmittance spectra obtained for the cherries of three cultivars in VNIR range are presented in Fig. 1. In these Fig. the spectra were obtained from ROI’s, which represented the average for pitted and unpitted cherries. Spectral differences between the intact and pitted
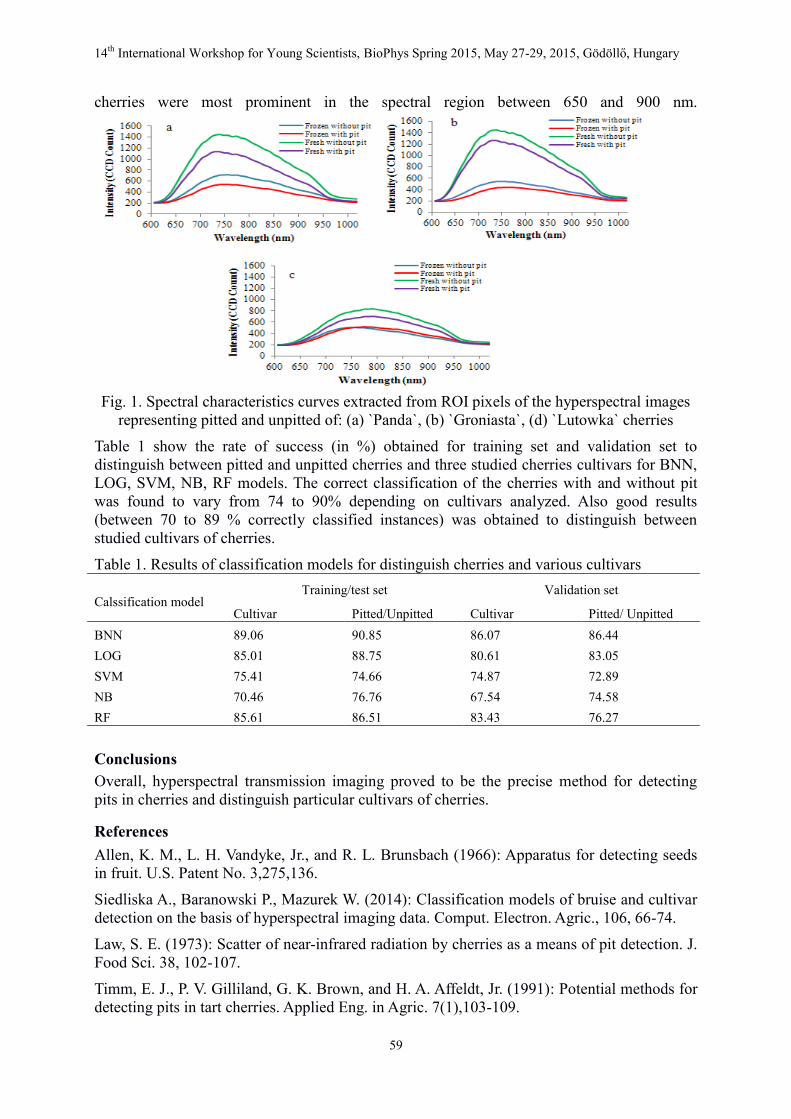
14th International Workshop for Young Scientists, BioPhys Spring 2015, May 27-29, 2015, Gödöllő, Hungary
59
cherries were most prominent in the spectral region between 650 and 900 nm.
Fig. 1. Spectral characteristics curves extracted from ROI pixels of the hyperspectral images
representing pitted and unpitted of: (a) `Panda`, (b) `Groniasta`, (d) `Lutowka` cherries
Table 1 show the rate of success (in %) obtained for training set and validation set to distinguish between pitted and unpitted cherries and three studied cherries cultivars for BNN, LOG, SVM, NB, RF models. The correct classification of the cherries with and without pit was found to vary from 74 to 90% depending on cultivars analyzed. Also good results (between 70 to 89 % correctly classified instances) was obtained to distinguish between studied cultivars of cherries.
Table 1. Results of classification models for distinguish cherries and various cultivars
Calssification model Training/test set Validation set
Cultivar Pitted/Unpitted Cultivar Pitted/ Unpitted BNN LOG SVM NB RF
89.06 85.01 75.41 70.46 85.61
90.85 88.75 74.66 76.76 86.51
86.07 80.61 74.87 67.54 83.43
86.44 83.05 72.89 74.58 76.27
Conclusions Overall, hyperspectral transmission imaging proved to be the precise method for detecting pits in cherries and distinguish particular cultivars of cherries.
References Allen, K. M., L. H. Vandyke, Jr., and R. L. Brunsbach (1966): Apparatus for detecting seeds in fruit. U.S. Patent No. 3,275,136.
Siedliska A., Baranowski P., Mazurek W. (2014): Classification models of bruise and cultivar detection on the basis of hyperspectral imaging data. Comput. Electron. Agric., 106, 66-74.
Law, S. E. (1973): Scatter of near-infrared radiation by cherries as a means of pit detection. J. Food Sci. 38, 102-107.
Timm, E. J., P. V. Gilliland, G. K. Brown, and H. A. Affeldt, Jr. (1991): Potential methods for detecting pits in tart cherries. Applied Eng. in Agric. 7(1),103-109.
14th International Workshop for Young Scientists, BioPhys Spring 2015, May 27-29, 2015, Gödöllő, Hungary
60
TEXTURE ANALYSIS OF SEMI-HARD CHEESE TYPES BY DIFFERENT NON-DESTRUCTIVE AND DESTRUCTIVE METHODS DURING RIPENING
Natália Simon
1, Klára Pásztor-Huszár
2, Tímea Kaszab
1 and József Felföldi
1
1Department of Physics and Control, Corvinus University of Budapest
Somlói út 14-16. Budapest, H-1118 Hungary 2Department of Refrigeration and Livestocks’ Products, Corvinus University of Budapest
Ménesi út 45. Budapest, H-1118 Hungary Tel.: +36 20 512-3290, E-mail: [email protected]
Abstract: Ripening of most cheeses continues after the manufacturing process, therefore, it is important to set and control the storage conditions. Two semi-hard cheese types with different fat contents were investigated: Gouda and Óvári Light (Óvártej Zrt). The objective of our study was to determine the changes in the texture of the cheeses with different fat content during storage and ripening by non-destructive and destructive methods. In conclusion, the parameters determined and investigated during the mechanical experiments showed that –similarly to the ultrasonic test – the measured points on the sides are suitable to monitor the changes during storage and ripening of the cheese. Keywords: cheese, ultrasound, mechanical test, sound velocity, maximum force
Introduction The tenability and storage of the cheese is an important problem. The market contains a lot of products which cannot suit the quality requirements such as ripening rate, taste, flavor or texture. Quality can be characterized with either objective or subjective methods. The objective side of the quality is the measurement of the chemical and physical properties, while the human factors mean the subjective side of the quality.
Cheese is one of the some dairy products that has been produced and consumed since the earliest of times. Food quality and its nutritional value have become more and more relevant for consumers besides the price. Ripening of most cheeses continues after the manufacturing process, therefore, it is important to set and control the storage conditions.
The aim of my study was to determine the changes in the texture of the cheeses with different fat content during storage and ripening by non-destructive and destructive methods.
Materials and methods Two semi-hard cheese types with different fat contents were investigated: Gouda and Óvári Light cheeses manufactured by Óvártej Zrt. After the removal of the samples from the original package and wrapping them into plastic foil, the cheeses were stored at 10±2°C temperature and 55±5% relative humidity for 4 weeks.
Nine measurement points were selected on the surface of each of the samples. Measurements, which were conducted once every week with 168±3h intervals between consecutive measurements, were carried out at these points afterwards. Every week one sample was used to measure elasticity with compression test as part of the destructive method.
The destructive compression tests were fitted with a 75 mm diameter aluminium plate. The measuring parameters were as follows: 0.1 mm/s compression speed and 10% deformation rate.
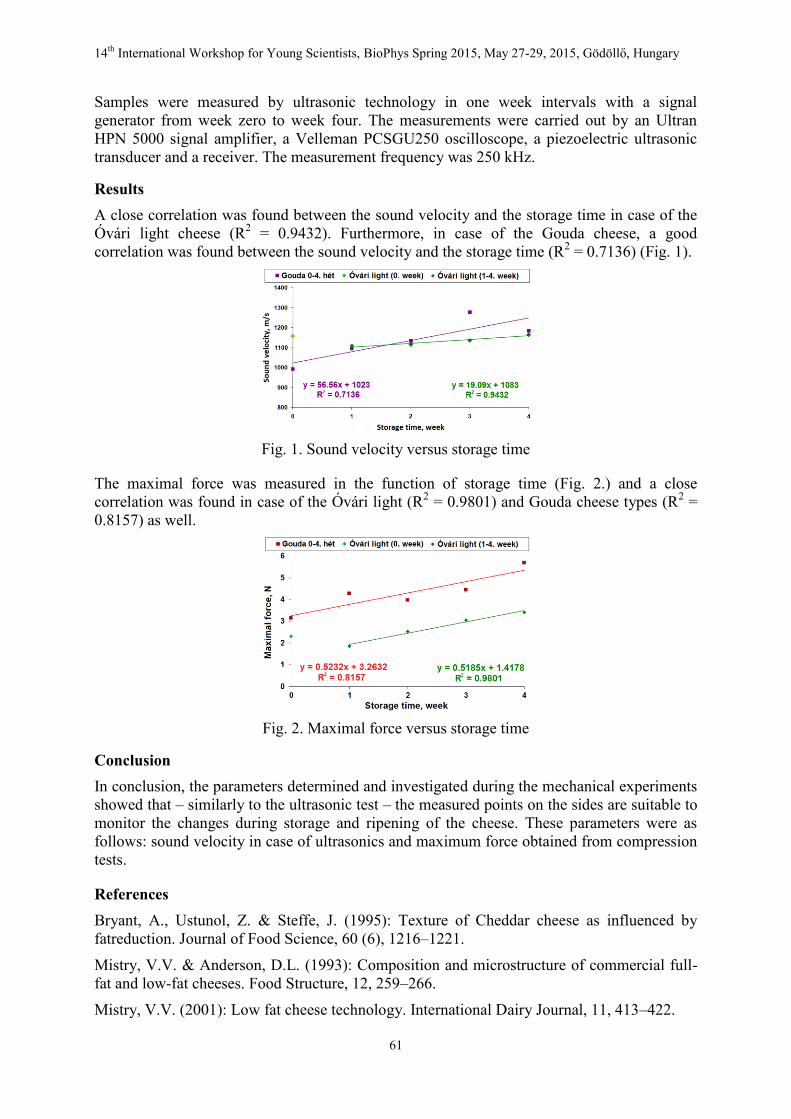
14th International Workshop for Young Scientists, BioPhys Spring 2015, May 27-29, 2015, Gödöllő, Hungary
61
Samples were measured by ultrasonic technology in one week intervals with a signal generator from week zero to week four. The measurements were carried out by an Ultran HPN 5000 signal amplifier, a Velleman PCSGU250 oscilloscope, a piezoelectric ultrasonic transducer and a receiver. The measurement frequency was 250 kHz.
Results A close correlation was found between the sound velocity and the storage time in case of the Óvári light cheese (R2 = 0.9432). Furthermore, in case of the Gouda cheese, a good correlation was found between the sound velocity and the storage time (R2 = 0.7136) (Fig. 1).
Fig. 1. Sound velocity versus storage time
The maximal force was measured in the function of storage time (Fig. 2.) and a close correlation was found in case of the Óvári light (R2 = 0.9801) and Gouda cheese types (R2 = 0.8157) as well.
Fig. 2. Maximal force versus storage time
Conclusion In conclusion, the parameters determined and investigated during the mechanical experiments showed that – similarly to the ultrasonic test – the measured points on the sides are suitable to monitor the changes during storage and ripening of the cheese. These parameters were as follows: sound velocity in case of ultrasonics and maximum force obtained from compression tests.
References Bryant, A., Ustunol, Z. & Steffe, J. (1995): Texture of Cheddar cheese as influenced by fatreduction. Journal of Food Science, 60 (6), 1216–1221.
Mistry, V.V. & Anderson, D.L. (1993): Composition and microstructure of commercial full-fat and low-fat cheeses. Food Structure, 12, 259–266.
Mistry, V.V. (2001): Low fat cheese technology. International Dairy Journal, 11, 413–422.
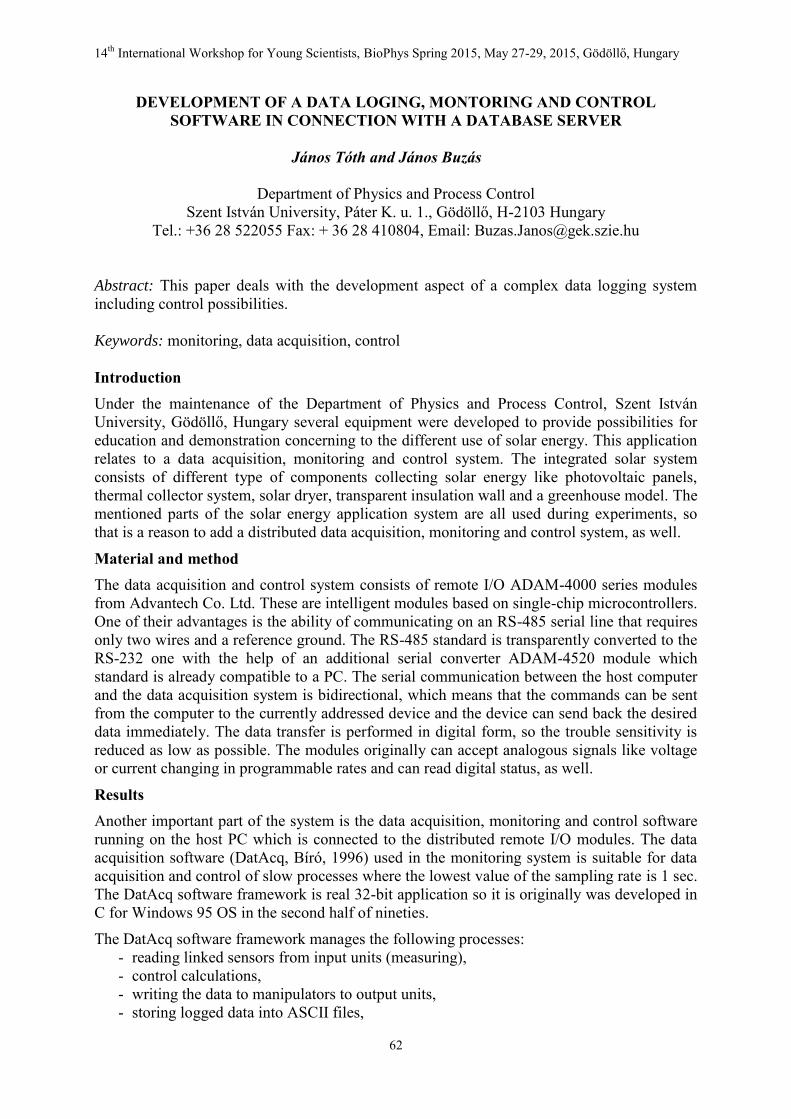
14th International Workshop for Young Scientists, BioPhys Spring 2015, May 27-29, 2015, Gödöllő, Hungary
62
DEVELOPMENT OF A DATA LOGING, MONTORING AND CONTROL SOFTWARE IN CONNECTION WITH A DATABASE SERVER
János Tóth and János Buzás
Department of Physics and Process Control
Szent István University, Páter K. u. 1., Gödöllő, H-2103 Hungary Tel.: +36 28 522055 Fax: + 36 28 410804, Email: [email protected]
Abstract: This paper deals with the development aspect of a complex data logging system including control possibilities. Keywords: monitoring, data acquisition, control Introduction Under the maintenance of the Department of Physics and Process Control, Szent István University, Gödöllő, Hungary several equipment were developed to provide possibilities for education and demonstration concerning to the different use of solar energy. This application relates to a data acquisition, monitoring and control system. The integrated solar system consists of different type of components collecting solar energy like photovoltaic panels, thermal collector system, solar dryer, transparent insulation wall and a greenhouse model. The mentioned parts of the solar energy application system are all used during experiments, so that is a reason to add a distributed data acquisition, monitoring and control system, as well.
Material and method The data acquisition and control system consists of remote I/O ADAM-4000 series modules from Advantech Co. Ltd. These are intelligent modules based on single-chip microcontrollers. One of their advantages is the ability of communicating on an RS-485 serial line that requires only two wires and a reference ground. The RS-485 standard is transparently converted to the RS-232 one with the help of an additional serial converter ADAM-4520 module which standard is already compatible to a PC. The serial communication between the host computer and the data acquisition system is bidirectional, which means that the commands can be sent from the computer to the currently addressed device and the device can send back the desired data immediately. The data transfer is performed in digital form, so the trouble sensitivity is reduced as low as possible. The modules originally can accept analogous signals like voltage or current changing in programmable rates and can read digital status, as well.
Results Another important part of the system is the data acquisition, monitoring and control software running on the host PC which is connected to the distributed remote I/O modules. The data acquisition software (DatAcq, Bíró, 1996) used in the monitoring system is suitable for data acquisition and control of slow processes where the lowest value of the sampling rate is 1 sec. The DatAcq software framework is real 32-bit application so it is originally was developed in C for Windows 95 OS in the second half of nineties.
The DatAcq software framework manages the following processes: - reading linked sensors from input units (measuring), - control calculations, - writing the data to manipulators to output units, - storing logged data into ASCII files,
14th International Workshop for Young Scientists, BioPhys Spring 2015, May 27-29, 2015, Gödöllő, Hungary
63
- drawing and updating preliminary charts based on the measurements, - drawing and updating WMF based dashboards.
The data acquisition software supports the local network operation. The actual input/output values can be followed within Local Area Network as it was on the logger computer. All the operations, done by the data acquisition software, can be created and modified through a configuration file.
Because of the compatibility problems with the higher versions of Windows operating systems there is a necessity to rewrite the data acquisition software. For renewal, the LabVIEW development environment was choosed. LabVIEW is a graphical programing platform and it is ideal development environment for modular, reconfigurable hardware to overcome the ever-increasing complexity involved in delivering measurements and control systems.
As mentioned the old software was made for, at least, 5-generation old operating system, so it uses out-of-date libraries which means it’s nearly impossible to recompile the source code, consequently it cannot be modified. In contrast the LabVIEW is widely supported, ergo the upcoming updates on the operating system won’t take an effect. The source code is easier to read, even for a not-programmer person, so, in the future the arising changes can be made with ease. The program is working, but it has not got all the features of the old one. It can:
- read the output of the sensors, - save the data to a database server, - draw chart from the measured data.
The old method of saving the data was to store it in local files that were shared over the network. The problem occurred when multiple users tried to read the same file from the measuring PC or from the network. To resolve this problem we use SQL server to complete this task. The benefits are:
- multiple users can read the data, simultaneously, - the data can be exported arbitrary file formats, - no need for local access, - adjustable data access for the users, - possibility to connect it to the internet.
The software of the server is cross-platform, which means it can be run in other operating systems (Linux, MacOS) without changes. We planning to add a computer to the system (driven by Linux), that runs only the server, this way the measuring PC can be disencumbered. The user side of the system is a PHP-driven webpage, it uses standard HTML elements for the basic operations, and some JavaScript code, that allows the dynamical ones. In this interface, users and devices can be added, and data can be exported.
Conclusion In the future we plan to add several functionalities to the system, which are:
- initialization step at the start of the measurement, - real-time chart drawing on the webpage, - system-state indicators in the webpage, - user friendly design.
Acknowledgement This paper was supported by the Mechanical Engineering PhD School, Szent István University, Gödöllő, Hungary.
14th International Workshop for Young Scientists, BioPhys Spring 2015, May 27-29, 2015, Gödöllő, Hungary
64
DETERMINATION OF BIOFUELS IMPURITIES BY PARTICLE SIZE ANALYZER
Michal Valach, Vlasta Vozarová, Monika Božiková and Ľubomír Híreš
Slovak University of Agriculture in Nitra, Faculty of Engineering, Department of Physics Tr. A. Hlinku 2, 94901 Nitra, Slovak Republic
Abstract: Description of tested fuels (various mixture of diesel and rapeseed methyl ester), the method of measuring of number and size of particles using particle size analyzer Laser-Net Fines-C (LNF-C) are introduced in the paper. The results of measurements in the form of tables and graphs are mutually compared and discussed. Keywords: biodiesel, purity, particle size analyzer Introduction Impurities in biofuels have the origin in several sources. At first it is mechanical impurities (dust, abrasion) or products of chemical degradation of biofuels. If biofuels have high content of impurities, combustion process in an engine has worse running. The change of hydrodynamic behaviour of fuels or the change of rheological properties can be consequence too. In case that this factors concatenate, failure or accident of an engine arise soon. The state of cleanliness in process can be monitored by detailed, accurate and periodic analysis of impurities in biofuels. For this purpose must be used simple device, which is not demanding in operation or maintenance. And samples need not complicated preparation.
Impurities in biofuels are all foreign substances such as gases, liquids or solid particles. Sources of impurities are separated to four basic groups. Various complex and exact methods can be used for demanding of impurities total content. These methods are gravimetric method (filtering and weighing on the membrane filter), curing method and subsequent weighing, method of counting particles, which are collected on the filter with using of an automated optical microscope or method with using automatic particle counter. The aim of this work is evaluation of purity and free water of selected liquid fuels sample with using of automatic laser particle counter and classifier Laser-Net Fines-C (LNF-C) and their comparing.
Material and method Experiments were carried out with sample of biofuels on the base of diesel(Tempo Diesel) containing 6,2 % bio-components with additive 10 % MERO –rapeseed methyl ester (Sample 1), 20 % MERO (Sample 2) and 30 % MERO (Sample 3).For the purpose of the paper particle size analyzer Laser-Net Fines-C (Spectro Inc., USA) was used. The analyser can be used for analysis of fuels, biofuels and oils from various equipments.
The results of analysis are amount of particles, particle size and analysis of abnormal wear particles. The measuring device analyses all particles to the size of 100 μm. The volume of samples was 5–15 ml. The volume of a researched sample depends on the viscosity and degree of accuracy.
The numbers of particles were counted according to technical standard USA: ISO 4406, NAS 1638, NAVAR 01-1A.17, SAE AS 4059. Presence of the free water was determined as well.
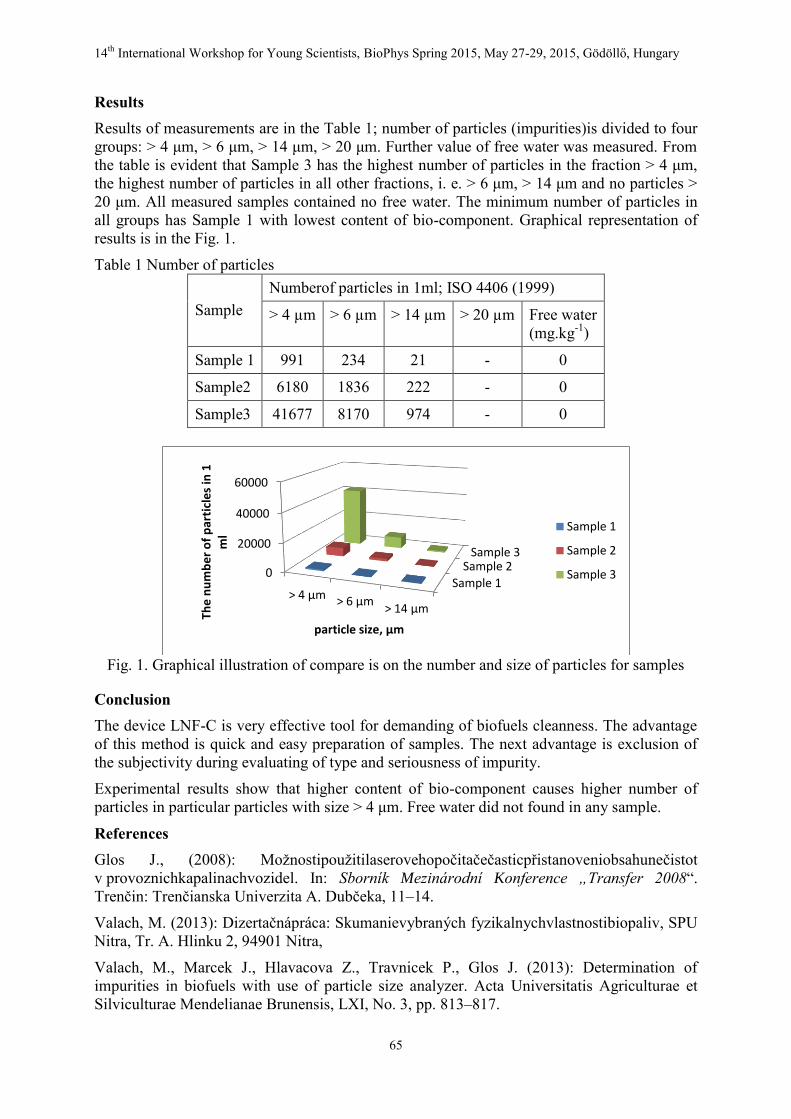
14th International Workshop for Young Scientists, BioPhys Spring 2015, May 27-29, 2015, Gödöllő, Hungary
65
Results Results of measurements are in the Table 1; number of particles (impurities)is divided to four groups: > 4 μm, > 6 μm, > 14 μm, > 20 μm. Further value of free water was measured. From the table is evident that Sample 3 has the highest number of particles in the fraction > 4 μm, the highest number of particles in all other fractions, i. e. > 6 μm, > 14 μm and no particles > 20 μm. All measured samples contained no free water. The minimum number of particles in all groups has Sample 1 with lowest content of bio-component. Graphical representation of results is in the Fig. 1.
Table 1 Number of particles Sample
Numberof particles in 1ml; ISO 4406 (1999)
> 4 µm > 6 µm > 14 µm > 20 µm Free water (mg.kg-1)
Sample 1 991 234 21 - 0
Sample2 6180 1836 222 - 0
Sample3 41677 8170 974 - 0
Fig. 1. Graphical illustration of compare is on the number and size of particles for samples
Conclusion The device LNF-C is very effective tool for demanding of biofuels cleanness. The advantage of this method is quick and easy preparation of samples. The next advantage is exclusion of the subjectivity during evaluating of type and seriousness of impurity.
Experimental results show that higher content of bio-component causes higher number of particles in particular particles with size > 4 μm. Free water did not found in any sample.
References Glos J., (2008): Možnostipoužitilaserovehopočitačečasticpřistanoveniobsahunečistot v provoznichkapalinachvozidel. In: Sborník Mezinárodní Konference „Transfer 2008“. Trenčin: Trenčianska Univerzita A. Dubčeka, 11–14.
Valach, M. (2013): Dizertačnápráca: Skumanievybraných fyzikalnychvlastnostibiopaliv, SPU Nitra, Tr. A. Hlinku 2, 94901 Nitra,
Valach, M., Marcek J., Hlavacova Z., Travnicek P., Glos J. (2013): Determination of impurities in biofuels with use of particle size analyzer. Acta Universitatis Agriculturae et Silviculturae Mendelianae Brunensis, LXI, No. 3, pp. 813–817.
Sample 1
Sample 2 Sample 3
0
20000
40000
60000
> 4 µm > 6 µm > 14 µm
The
nu
mb
er
of
par
ticl
es
in 1
m
l
particle size, μm
Sample 1
Sample 2
Sample 3
14th International Workshop for Young Scientists, BioPhys Spring 2015, May 27-29, 2015, Gödöllő, Hungary
66
SOIL COMPACTION ASSESSMENT USING CONE INDEX
Nikola Žemličková and Petr Šařec
Department of Machinery Utilization, Czech University of Life Science Prague Kamýcká 129, 165 21 Praha – Suchdol
Tel.: +420 22438 3152, Email: [email protected]
Abstract: The article discusses the results of measurement of soil physical properties that has been done within field trials verifying the influence of substances for soil amendment. Four trial sites were selected in different locations in 2014. Physical properties of soil were determined by taking undisturbed soil rollers and cone penetration resistance. There is an increase in cone index values with the depth of measurement regardless of the soil conditions and characteristics. Also the influence of soil composition on soil bulk density is evident.
Keywords: bulk density, cone resistance, soil properties.
Introduction Soil compaction leads to loss in crop yield, since the compaction prevents crop root system to penetrate through to obtain water / nutrients from deeper soil layers. Soil compaction has also negative impact on the environment (Ball et al., 1999) due to the reduced ability of the soil to absorb water. In the case of intense rainfall, surface water runoff thus occurs. For lighter soils, the risk of soil erosion due to surface runoff gets even higher (Liebig et al., 1993). Soil compaction primarily affects the physical properties of the soil, either in the short or long term. For example at higher soil moisture levels, passes of farm machinery can lead to excessive soil compaction. The negative effect of soil compaction is manifested through increased bulk density, soil cone index, and other variables. This all leads to reduction in porosity, hydraulic soil properties, stability and other variables (Alakukku, 1996). All these parameters are connected together and influence crop yields. Another factor that influences the variables mentioned is soil structure and soil aeration. If the soil is loosened, water capacity is higher compared to the untilled soil (Ekwueme et al., 2010). Each soil structure has its own typical values of bulk density, porosity, hydraulic characteristics and other variables. For example, sandy-loam soils have higher cumulative infiltration than clay-loam soils, the lowest values are observed in turn with clay soils (Ekwueme et al., 2010). For evaluation of soil compaction, values of soil density and penetration measurements are commonly used.
Material and method For trial purposes, four plots were selected at different farms in the Czech Republic. Selected soil physical properties have been measured in the trial fields. Two basic methods were used. Firstly, undisturbed soil samples have been taken using Kopecky rollers of a volume of 100 cm3. The samples have been processed in the laboratory of the Department of Machinery Utilization. Secondly, cone index measuring method was used. The registered penetrometer PEN 70 developed at the Faculty of Engineering of the CULS Prague was employed.
Results Table 1 shows the average values of the basic physical properties of soils. There is a clear dependence of soil bulk density and reduced bulk density measured in the subsurface depth on soil type and location.
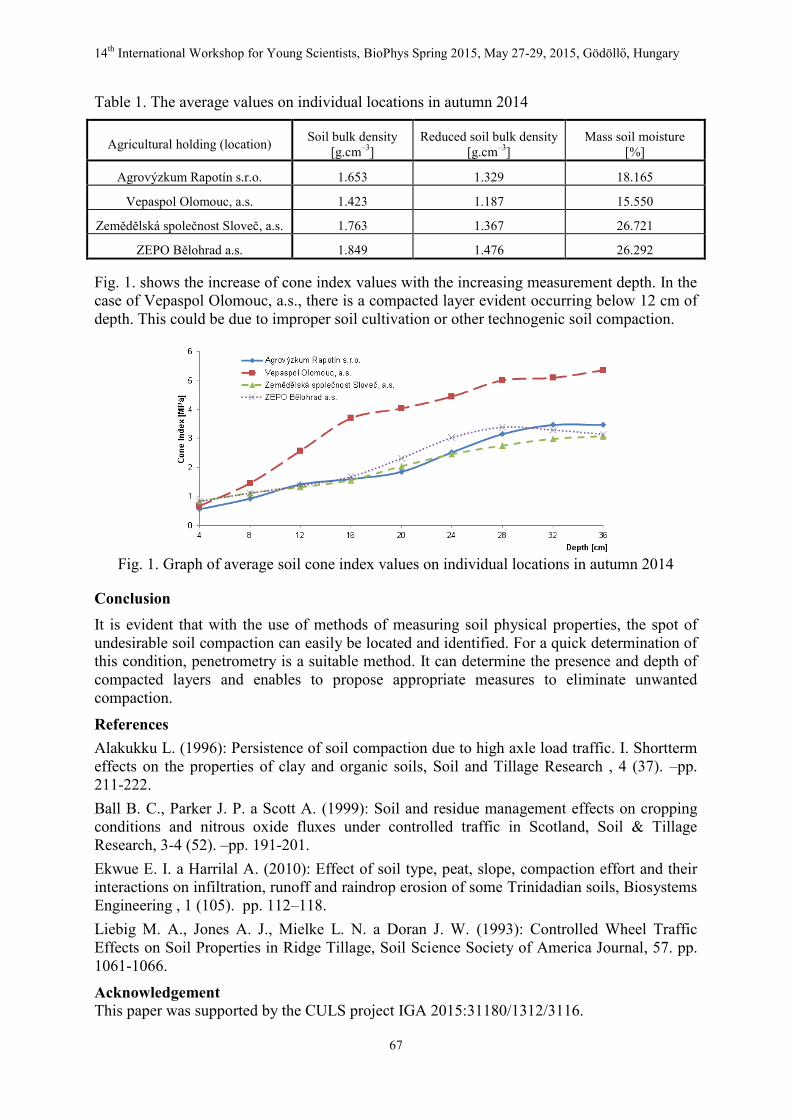
14th International Workshop for Young Scientists, BioPhys Spring 2015, May 27-29, 2015, Gödöllő, Hungary
67
Table 1. The average values on individual locations in autumn 2014
Agricultural holding (location) Soil bulk density [g.cm–3]
Reduced soil bulk density [g.cm–3]
Mass soil moisture [%]
Agrovýzkum Rapotín s.r.o. 1.653 1.329 18.165
Vepaspol Olomouc, a.s. 1.423 1.187 15.550
Zemědělská společnost Sloveč, a.s. 1.763 1.367 26.721
ZEPO Bělohrad a.s. 1.849 1.476 26.292
Fig. 1. shows the increase of cone index values with the increasing measurement depth. In the case of Vepaspol Olomouc, a.s., there is a compacted layer evident occurring below 12 cm of depth. This could be due to improper soil cultivation or other technogenic soil compaction.
Fig. 1. Graph of average soil cone index values on individual locations in autumn 2014
Conclusion It is evident that with the use of methods of measuring soil physical properties, the spot of undesirable soil compaction can easily be located and identified. For a quick determination of this condition, penetrometry is a suitable method. It can determine the presence and depth of compacted layers and enables to propose appropriate measures to eliminate unwanted compaction.
References Alakukku L. (1996): Persistence of soil compaction due to high axle load traffic. I. Shortterm effects on the properties of clay and organic soils, Soil and Tillage Research , 4 (37). –pp. 211-222. Ball B. C., Parker J. P. a Scott A. (1999): Soil and residue management effects on cropping conditions and nitrous oxide fluxes under controlled traffic in Scotland, Soil & Tillage Research, 3-4 (52). –pp. 191-201. Ekwue E. I. a Harrilal A. (2010): Effect of soil type, peat, slope, compaction effort and their interactions on infiltration, runoff and raindrop erosion of some Trinidadian soils, Biosystems Engineering , 1 (105). pp. 112–118. Liebig M. A., Jones A. J., Mielke L. N. a Doran J. W. (1993): Controlled Wheel Traffic Effects on Soil Properties in Ridge Tillage, Soil Science Society of America Journal, 57. pp. 1061-1066.
Acknowledgement This paper was supported by the CULS project IGA 2015:31180/1312/3116.
14th International Workshop for Young Scientists, BioPhys Spring 2015, May 27-29, 2015, Gödöllő, Hungary
68
ECONOMIC QUESTIONS OF THE VANADIUM REDOX FLOW BATTERY AND THE LITHIUM BATTERY ENERGY STORAGE SYSTEMS IN HOUSEHOLD SIZE
Henrik Zsiborács, Gábor Pintér, Béla Pály and Botond Cseke
Department of Agricultural Mechanization, University of Pannonia, Georgikon Faculty
Deák F. u. 16., Keszthely, H-8360 Hungary Tel.: +36 83 545020, Email: [email protected]
Abstract: Human life is based on energy consumption, and one of the biggest challenges is that the world's demand for energy continues to grow. The usage of renewable energy sources is becoming more widespread throughout the world. The energy storage plays a prominent role the success of this sector. Nowadays more and more money and effort are invested to this research and to this development, consequently these technologies are cheaper and accessible. The economic questions of the vanadium redox flow battery (VRB) and the lithium battery energy storage systems were examined in this study due to the importance of decentralized isolated energy production. Keywords: solar energy, energy storage, lithium battery, flow battery technology Introduction Photovoltaic systems are in the decentralized energy production increasingly more significant where the local storage of energy is an important aspect. Lithium batteries are favored energy storage solution, the produced energy is in cells, the average lifecycle is 2500 (Solar Stik, 2012). The average cost of a lithium battery storage system is $670 a kilowatt hour (www.alibaba.com). Vanadium redox flow batteries store the energy in tanks. This system consists of an assembly of power cells in which the two electrolytes are separated by a proton exchange membrane. The lifetime for pumps are 5-7 years, for membranes are 12-15 years and the electrolyte do not wear out (Balogh, 2010). The average cost of a vanadium redox flow battery storage system is $500 a kilowatt hour (www.greentechmedia.com).
This paper deals with the economic questions of the vanadium redox flow battery and the lithium battery energy storage systems in household size.
Material and method For the isolated decentralized photovoltaic household energy production need solar panels, an inverter, a MPPT charge controller and an energy storage system. In this study we calculated only the investment price of energy storage without any custom or import tax. We used for the electricity value the Hungarian retail energy price (0.126$ / kWh in 2015), with 280 HUF / 1$ exchange rate.
The first examined system was a Lithium iron phosphate (LiFePO4) battery, which is 48V DC 300Ah (14.4kWh), the Max. Charge Voltage is 58.4V DC, the Cut-off Voltage is 40V. We used for this battery 2% loss of capacity / year and 1 cycle / day. The second system was a vanadium redox flow battery with 15kWh energy capacity, the Output Voltage Range is 49.5 V DC ±1.5 V DC, the Charge Voltage Range is 54.5 V DC ±1.5 V DC, we calculated also 1 cycle / day (www.imergy.com, www.91forklift.com).
For the economic calculations we used a dynamic indicator as Net Present Value (NPV).
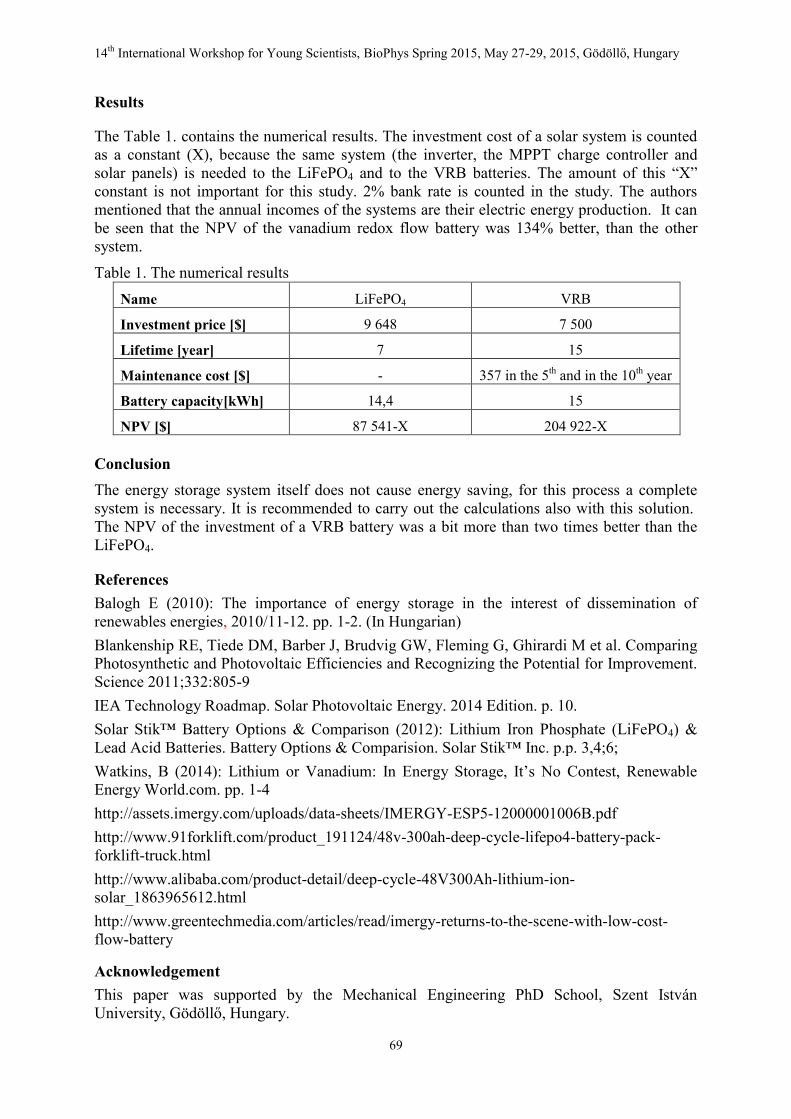
14th International Workshop for Young Scientists, BioPhys Spring 2015, May 27-29, 2015, Gödöllő, Hungary
69
Results
The Table 1. contains the numerical results. The investment cost of a solar system is counted as a constant (X), because the same system (the inverter, the MPPT charge controller and solar panels) is needed to the LiFePO4 and to the VRB batteries. The amount of this “X” constant is not important for this study. 2% bank rate is counted in the study. The authors mentioned that the annual incomes of the systems are their electric energy production. It can be seen that the NPV of the vanadium redox flow battery was 134% better, than the other system.
Table 1. The numerical results Name LiFePO4 VRB Investment price [$] 9 648 7 500 Lifetime [year] 7 15 Maintenance cost [$] - 357 in the 5th and in the 10th year Battery capacity[kWh] 14,4 15 NPV [$] 87 541-X 204 922-X
Conclusion The energy storage system itself does not cause energy saving, for this process a complete system is necessary. It is recommended to carry out the calculations also with this solution. The NPV of the investment of a VRB battery was a bit more than two times better than the LiFePO4.
References Balogh E (2010): The importance of energy storage in the interest of dissemination of renewables energies, 2010/11-12. pp. 1-2. (In Hungarian) Blankenship RE, Tiede DM, Barber J, Brudvig GW, Fleming G, Ghirardi M et al. Comparing Photosynthetic and Photovoltaic Efficiencies and Recognizing the Potential for Improvement. Science 2011;332:805-9 IEA Technology Roadmap. Solar Photovoltaic Energy. 2014 Edition. p. 10. Solar Stik™ Battery Options & Comparison (2012): Lithium Iron Phosphate (LiFePO4) & Lead Acid Batteries. Battery Options & Comparision. Solar Stik™ Inc. p.p. 3,4;6; Watkins, B (2014): Lithium or Vanadium: In Energy Storage, It’s No Contest, Renewable Energy World.com. pp. 1-4 http://assets.imergy.com/uploads/data-sheets/IMERGY-ESP5-12000001006B.pdf http://www.91forklift.com/product_191124/48v-300ah-deep-cycle-lifepo4-battery-pack-forklift-truck.html http://www.alibaba.com/product-detail/deep-cycle-48V300Ah-lithium-ion-solar_1863965612.html http://www.greentechmedia.com/articles/read/imergy-returns-to-the-scene-with-low-cost-flow-battery
Acknowledgement This paper was supported by the Mechanical Engineering PhD School, Szent István University, Gödöllő, Hungary.
14th International Workshop for Young Scientists, BioPhys Spring 2015, May 27-29, 2015, Gödöllő, Hungary
70
LIST OF AUTHORS
Mytham Ali Al-Neama
Department of Physics and Process Control, Szent Istvan University, Gödöllő, Hungary
Noémi Antal
University Babeş Bolyai, Faculty of Environmental Science and Engineering, Cluj–Napoca, Romania
Piotr Baranowski Institute of Agrophysics, Polish Academy of Sciences Lublin, Poland
Sándor Bartha
Silox Research LTD, Aleeea Centralei Sf. Gheorghe, Romania
Ágnes Bálint
Institute of Environmental Engineering, Óbuda University Budapest, Hungary
Andrzej Bieganowski
Institute of Agrophysics Polish Academy of Sciences Lublin, Poland
Jiry Blahovec
Department of Physics Czech University of Life Sciences Prague, Czech Republic
Patrycja Boguta
Institute of Agrophysics Polish Academy of Sciences Lublin, Poland
Monika Božiková
Department of Physics, Faculty of Engineering, Slovak University of Agriculture, Nitra, Slovak Republic
Jaroslav Buchar
Department of Technology and Automobile Transport, Mendel University in Brno, Czech Republic
János Buzás
Department of Physics and Process Control, Szent Istvan University, Gödöllő, Hungary
Jan Chyba
Department of Agricultural Machines, Czech University of Life Sciences Prague, Prague, Czech Republic
Monika Chylińska
Institute of Agrophysics Polish Academy of Sciences Lublin, Poland

14th International Workshop for Young Scientists, BioPhys Spring 2015, May 27-29, 2015, Gödöllő, Hungary
71
Marta Cybulak
Institute of Agrophysics Polish Academy of Sciences Lublin, Poland
Justyna Cybulska
Institute of Agrophysics Polish Academy of Sciences Lublin, Poland
Botond Cseke
Department of Agricultural Mechanization, University of Pannonia, Keszthely, Hungary
Ján Csillag
Department of Physics, Faculty of Engineering, Slovak University of Agriculture, Nitra, Slovak Republic
István Farkas Department of Physics and Process Control, Szent Istvan University , Gödöllő, Hungary
József Felföldi
Department of Physics and Control, Corvinus University of Budapest, Hungary
Anikó Földi Centre for Energy Research, Hungarian Academy of Sciences, Budapest, Hungary
Magdalena Frąc Institute of Agrophysics Polish Academy of Sciences Lublin, Poland
Bartłomiej Gackiewicz Institute of Agrophysics Polish Academy of Sciences Lublin, Poland
Jan Glinski
President of the Lublin Branch of Polish Academy of Sciences, Lublin, Poland
Klaus Gottschalk Department of Post-Harvest Technology, Leibniz-Institut Potsdam-Bornim, Germany
David Herak Department of Mechanical Eng., Czech University of Life Sciences, Prague, Czech Republic
Ľubomír Híreš Department of Physics, Faculty of Engineering, Slovak University of Agriculture, Nitra, Slovak Republic
Peter Hlavác Department of Physics, Faculty of Engineering, Slovak University of Agriculture, Nitra, Slovak Republic

14th International Workshop for Young Scientists, BioPhys Spring 2015, May 27-29, 2015, Gödöllő, Hungary
72
Zuzana Hlaváčová Department of Physics, Faculty of Engineering, Slovak University of Agriculture, Nitra, Slovak Republic
Józef Horabik Institute of Agrophysics Polish Academy of Sciences Lublin, Poland
Katarzyna Jaromin-Gleń Institute of Agrophysics Polish Academy of Sciences Lublin, Poland
Abraham Kabutey
Department of Mechanical Engineering, Czech University of Life Sciences, Prague, Czech Republic
Zoltán Kapros
Department of Physics and Process Control, Szent Istvan University, Gödöllő, Hungary
Tímea Kaszab
Department of Physics and Control, Corvinus University of Budapest Hungary
Ákos Kertész Department of Physics, Faculty of Engineering, Slovak University of Agriculture, Nitra, Slovak Republic
Rafal Kobyłka Institute of Agrophysics Polish Academy of Sciences Lublin, Poland
Milan Kroulík Department of Agricultural Machines, Czech University of Life Sciences Prague, Czech Republic
Pavel Křupka Department of Post-Harvest Techn. of Horticultural Products, Mendel University, Czech Republic
xkrupka@ node.mendelu.cz
Ľubomír Kubik Department of Physics, Slovak University of Agriculture in Nitra, Slovak Republic
Vojtěch Kumbár Department of Technology and Automobile Transport, Mendel University in Brno, Czech Republic
Krzysztof Lamorski
Institute of Agrophysics Polish Academy of Sciences Lublin, Poland
Martin Libra
Department of Physics Czech University of Life Sciences, Prague, Czech Republic
14th International Workshop for Young Scientists, BioPhys Spring 2015, May 27-29, 2015, Gödöllő, Hungary
73
Csaba Mészáros Department of Physics and Process Control, Szent Istvan University, Gödöllő, Hungary
Joanna Mierczyńska
Institute of Agrophysics Polish Academy of Sciences Lublin, Poland
Marek Molenda
Institute of Agrophysics Polish Academy of Sciences Lublin, Poland
Nurul Imam Muhlis Department of Mechanical Engineering, Institut Teknologi, Bandung, West Java, Indonesia
Šárka Nedomová Department of Food Technology, Mendel University in Brno Czech Republic
Artur Nosalewicz
Institute of Agrophysics Polish Academy of Sciences Lublin, Poland
István Róbert Nikolényi
Department of Physics and Process Control, Szent Istvan University, Gödöllő, Hungary
Jacek Panek
Institute of Agrophysics Polish Academy of Sciences Lublin, Poland
Béla Pályi
Department of Agricultural Mechanization, University of Pannonia, Keszthely, Hungary
Klára Pásztor-Huszár
Department of Refrigeration and Livestocks’ Products, Corvinus University of Budapest, Hungary
Ana Petrovič
Department of Physics, Faculty of Engineering, Slovak University of Agriculture, Nitra, Slovak Republic
Gábor Pintér
Department of Agricultural Mechanization, University of Pannonia, Keszthely, Hungary
Adam Polcar
Department of Technology and Automobile Transport, Mendel University in Brno, Czech Republic
Tomáš Regrut
Department of Physics, Faculty of Engineering, Slovak University of Agriculture, Nitra, Slovak Republic
14th International Workshop for Young Scientists, BioPhys Spring 2015, May 27-29, 2015, Gödöllő, Hungary
74
Dani Rusirawan
Department of Mechanical Engineering, Institut Teknologi, Bandung, West Java, Indonesia
Petr Šařec
Department of Machinery Utilization, Czech University of Life Science Prague, Czech Republic
István Seres
Department of Physics and Process Control, Szent Istvan University, Gödöllő, Hungary
Joanna Siecińska
Institute of Agrophysics Polish Academy of Sciences Lublin, Poland
Anna Siedliska
Institute of Agrophysics Polish Academy of Sciences Lublin, Poland
Riswanti Sigalingging
Department of Mechanical Engineering, Czech University of Life Sciences, Prague, Czech Republic
Natália Simon
Department of Physics and Control, Corvinus University of Budapest, Hungary
Cezary Sławiński
Institute of Agrophysics Polish Academy of Sciences Lublin, Poland
Jana Šmitalová
Department of Storage and Processing of Plant Products, Slovak University of Agriculture in Nitra, Slovak Republic
Zofia Sokołowska
Institute of Agrophysics Polish Academy of Sciences Lublin, Poland
Lenka Staroňová
Department of Production Engineering, Faculty of Engineering, Slovak University, Nitra, Slovak Republic
Wioleta Stelmach
Institute of Agrophysics Polish Academy of Sciences Lublin, Poland
Paweł Szarlip
Institute of Agrophysics Polish Academy of Sciences Lublin, Poland
Monika Szymańska-Chargot
Institute of Agrophysics Polish Academy of Sciences Lublin, Poland
14th International Workshop for Young Scientists, BioPhys Spring 2015, May 27-29, 2015, Gödöllő, Hungary
75
János Tóth
Department of Physics and Process Control, Szent Istvan University, Gödöllő, Hungary
Andrzej Trembaczowski
Mass Spectrometry Laboratory, Maria Curie-Skłodowska University Lublin, Poland
Michal Valach Department of Physics, Faculty of Engineering, Slovak University of Agriculture, Nitra, Slovak Republic
Piroska Víg
Department of Physics and Process Control, Szent Istvan University, Gödöllő, Hungary
Jiří Votava
Department of Technology and Automobile Transport, Mendel University in Brno, Czech Republic
Vlasta Vozarova
Department of Physics, Faculty of Engineering, Slovak University of Agriculture, Nitra, Slovak Republic
Erasmus Wisdom Boatri Department of Mechanical Eng., Czech University of Life Sciences, Prague, Czech Republic
Anton Wollner Department of Agricultural, Transport and Technologies, University of South Bohemia, České Budějovice, Czech Republic
Artur Zdunek Institute of Agrophysics Polish Academy of Sciences Lublin, Poland
Nikola Žemličková Department of Machinery Utilization, Czech University of Life Science Prague, Czech Republic
Henrik Zsiborács Department of Agricultural Mechanization, University of Pannonia, Keszthely, Hungary
Szent István University
Faculty of Mechanical Engineering
Institute for Environmental Engineering Systems
Department of Physics and Process Control
H-2100 Gödöllő, Páter Károly u.1, Hungary
fft.szie.hu
E-mail: [email protected]
ISBN 978-83-89969-37-8