Embed Size (px)
Citation preview
Physiology Lessons for use with the
Biopac Student Lab
Lesson 14
BIOFEEDBACK Relaxation and Arousal
Manual Revision 3.7.3 090308
Richard Pflanzer, Ph.D. Associate Professor
Indiana University School of Medicine Purdue University School of Science
J.C. Uyehara, Ph.D.
Biologist BIOPAC Systems, Inc.
William McMullen
Vice President BIOPAC Systems, Inc.
BIOPAC® Systems, Inc. 42 Aero Camino, Goleta, CA 93117 (805) 685-0066, Fax (805) 685-0067
Email: [email protected] Web: www.biopac.com
© BIOPAC Systems, Inc.
E
DA
/GS
R
Page 4 Biopac Student Lab
II. EXPERIMENTAL OBJECTIVES 1) Introduce the concept of biofeedback training for relaxation.
2) Measure levels of arousal via heart rate and electrodermal activity (EDA).
III. MATERIALS • BIOPAC disposable vinyl electrodes (EL503), 3 electrodes per Subject
• Electrode lead (SS2L)
• BIOPAC EDA setup
o Disposable Setup: EDA/GSR Lead (SS57L) and EDA Gelled Electrodes (EL507 x 2)
o Reusable setup: EDA/GSR transducer (SS3L) and Electrode gel (GEL1) • Computer system
• Biopac Student Lab 3.7
• BIOPAC data acquisition unit (MP36, MP35, or MP30 with cable and power)
IV. EXPERIMENTAL METHODS For further explanation, use the online support options under the Help Menu.
A. SET UP FAST TRACK Set Up DETAILED EXPLANATION OF SET UP STEPS
1. Turn the computer ON. The desktop should appear on the monitor. If it does not appear, ask the laboratory instructor for assistance.
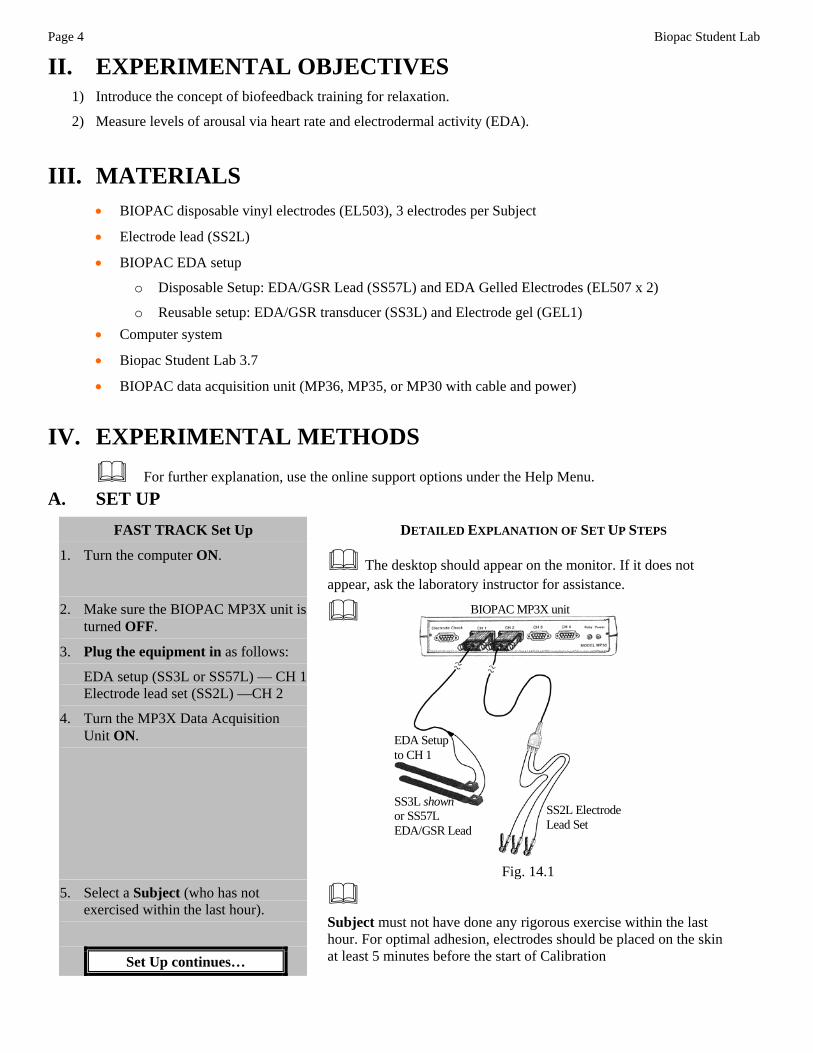
2. Make sure the BIOPAC MP3X unit is turned OFF.
3. Plug the equipment in as follows:
EDA setup (SS3L or SS57L) — CH 1 Electrode lead set (SS2L) —CH 2
4. Turn the MP3X Data Acquisition Unit ON.
Fig. 14.1 5. Select a Subject (who has not
exercised within the last hour).
SS2L Electrode Lead Set
SS3L shown or SS57L EDA/GSR Lead
EDA Setup to CH 1
BIOPAC MP3X unit
Set Up continues…
Subject must not have done any rigorous exercise within the last hour. For optimal adhesion, electrodes should be placed on the skin at least 5 minutes before the start of Calibration
Lesson 14: Biofeedback Page 5
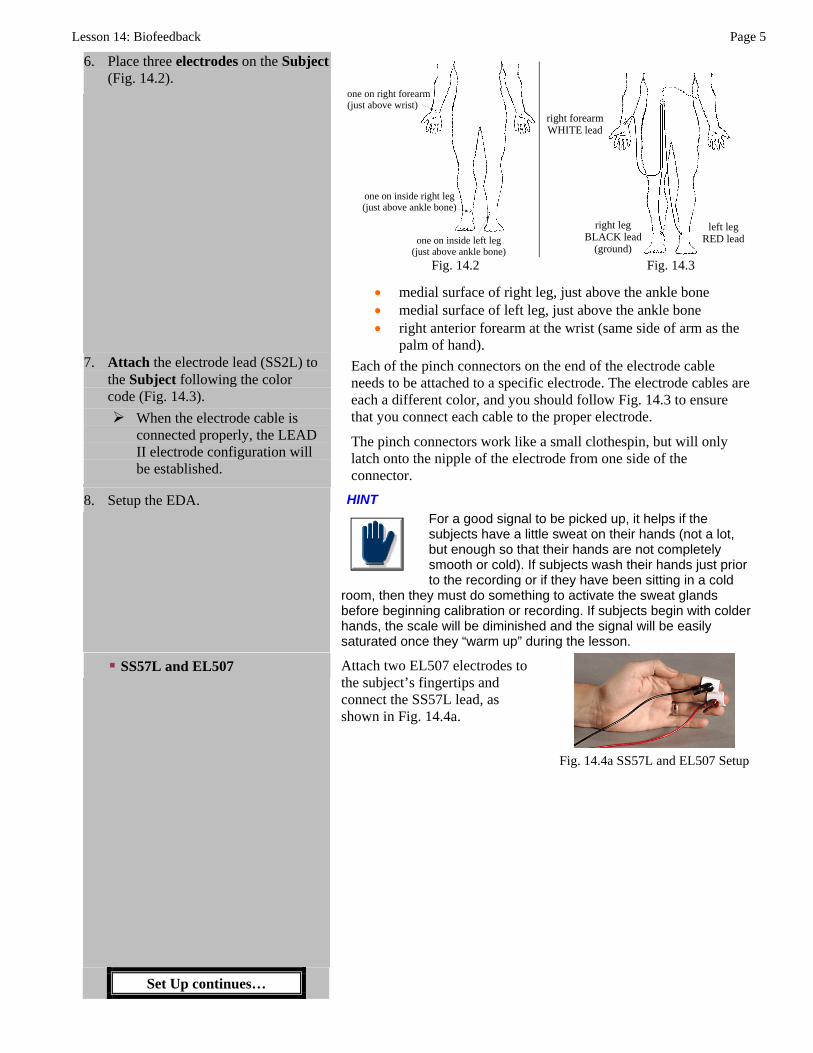
one on right forearm (just above wrist)
one on inside right leg (just above ankle bone)
one on inside left leg (just above ankle bone)
right forearmWHITE lead
right legBLACK lead
(ground)
left legRED lead
6. Place three electrodes on the Subject(Fig. 14.2).
Fig. 14.2 Fig. 14.3
• medial surface of right leg, just above the ankle bone • medial surface of left leg, just above the ankle bone • right anterior forearm at the wrist (same side of arm as the
palm of hand). 7. Attach the electrode lead (SS2L) to
the Subject following the color code (Fig. 14.3).
When the electrode cable is connected properly, the LEAD II electrode configuration will be established.
Each of the pinch connectors on the end of the electrode cable needs to be attached to a specific electrode. The electrode cables are each a different color, and you should follow Fig. 14.3 to ensure that you connect each cable to the proper electrode.
The pinch connectors work like a small clothespin, but will only latch onto the nipple of the electrode from one side of the connector.
8. Setup the EDA. HINT For a good signal to be picked up, it helps if the subjects have a little sweat on their hands (not a lot, but enough so that their hands are not completely smooth or cold). If subjects wash their hands just prior to the recording or if they have been sitting in a cold
room, then they must do something to activate the sweat glands before beginning calibration or recording. If subjects begin with colder hands, the scale will be diminished and the signal will be easily saturated once they “warm up” during the lesson.
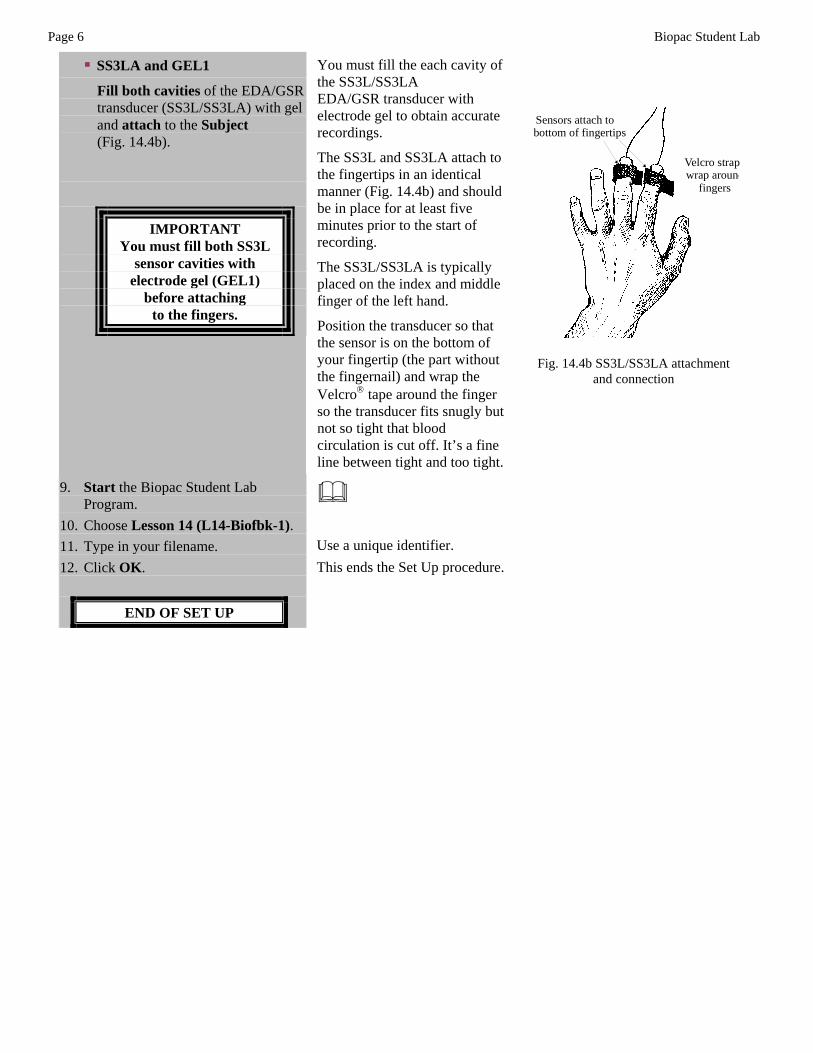
SS57L and EL507 Attach two EL507 electrodes to the subject’s fingertips and connect the SS57L lead, as shown in Fig. 14.4a.
Fig. 14.4a SS57L and EL507 Setup
Set Up continues…
Page 6 Biopac Student Lab
SS3LA and GEL1
Fill both cavities of the EDA/GSR transducer (SS3L/SS3LA) with gel and attach to the Subject (Fig. 14.4b).
IMPORTANT You must fill both SS3L
sensor cavities with electrode gel (GEL1)
before attaching to the fingers.
You must fill the each cavity of the SS3L/SS3LA EDA/GSR transducer with electrode gel to obtain accurate recordings.
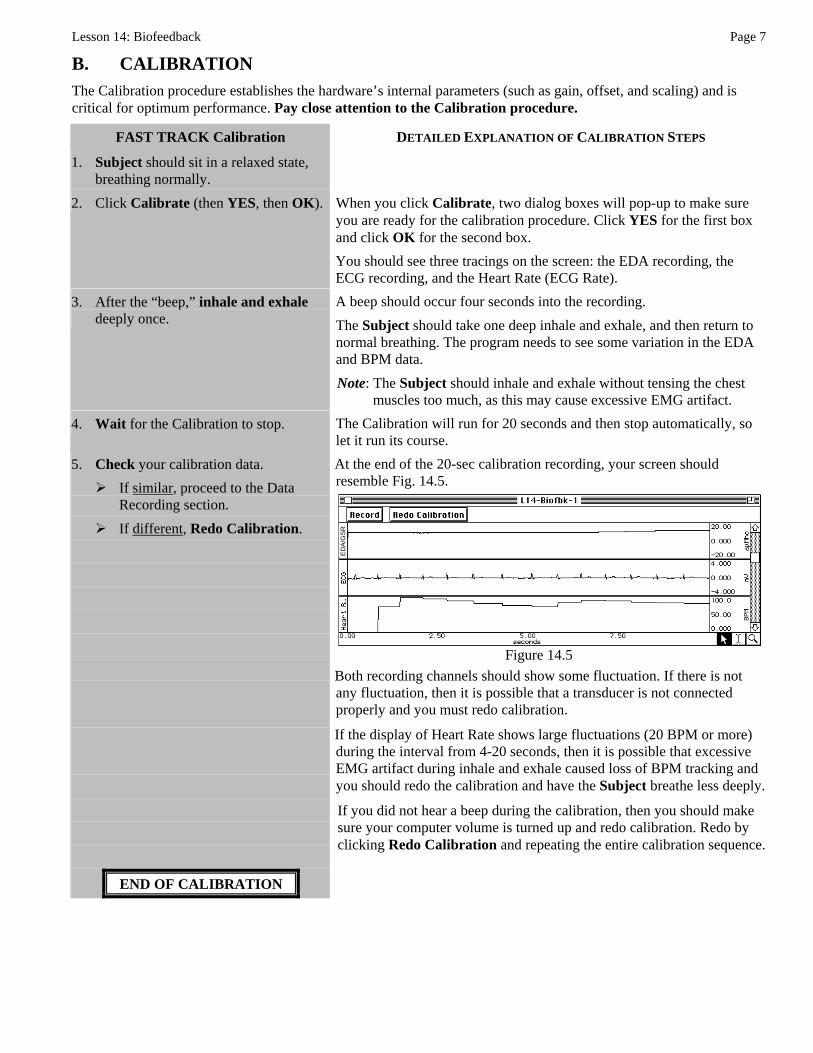
The SS3L and SS3LA attach to the fingertips in an identical manner (Fig. 14.4b) and should be in place for at least five minutes prior to the start of recording.
The SS3L/SS3LA is typically placed on the index and middle finger of the left hand.
Position the transducer so that the sensor is on the bottom of your fingertip (the part without the fingernail) and wrap the Velcro® tape around the finger so the transducer fits snugly but not so tight that blood circulation is cut off. It’s a fine line between tight and too tight.
Sensors attach tobottom of fingertips
Velcro strapwrap around
fingers
Fig. 14.4b SS3L/SS3LA attachment
and connection
9. Start the Biopac Student Lab Program.
10. Choose Lesson 14 (L14-Biofbk-1).
Use a unique identifier. 11. Type in your filename. This ends the Set Up procedure. 12. Click OK.
END OF SET UP
Lesson 14: Biofeedback Page 7
B. CALIBRATION The Calibration procedure establishes the hardware’s internal parameters (such as gain, offset, and scaling) and is critical for optimum performance. Pay close attention to the Calibration procedure.
FAST TRACK Calibration DETAILED EXPLANATION OF CALIBRATION STEPS
1. Subject should sit in a relaxed state, breathing normally.
2. Click Calibrate (then YES, then OK). When you click Calibrate, two dialog boxes will pop-up to make sure you are ready for the calibration procedure. Click YES for the first box and click OK for the second box. You should see three tracings on the screen: the EDA recording, the ECG recording, and the Heart Rate (ECG Rate).
3. After the “beep,” inhale and exhale deeply once.
A beep should occur four seconds into the recording. The Subject should take one deep inhale and exhale, and then return to normal breathing. The program needs to see some variation in the EDA and BPM data. Note: The Subject should inhale and exhale without tensing the chest
muscles too much, as this may cause excessive EMG artifact. 4. Wait for the Calibration to stop. The Calibration will run for 20 seconds and then stop automatically, so
let it run its course. 5. Check your calibration data.
If similar, proceed to the Data Recording section.
If different, Redo Calibration.
At the end of the 20-sec calibration recording, your screen should resemble Fig. 14.5.
ED
A/G
SR
Figure 14.5
END OF CALIBRATION
Both recording channels should show some fluctuation. If there is not any fluctuation, then it is possible that a transducer is not connected properly and you must redo calibration.
If the display of Heart Rate shows large fluctuations (20 BPM or more) during the interval from 4-20 seconds, then it is possible that excessive EMG artifact during inhale and exhale caused loss of BPM tracking and you should redo the calibration and have the Subject breathe less deeply.
If you did not hear a beep during the calibration, then you should make sure your computer volume is turned up and redo calibration. Redo by clicking Redo Calibration and repeating the entire calibration sequence.
Page 8 Biopac Student Lab
C. RECORDING LESSON DATA FAST TRACK Recording DETAILED EXPLANATION OF RECORDING STEPS
1. Prepare for the recording. In order to work efficiently, read this entire section so you will know what to do for each recording segment.
This lesson requires that the Subject concentrate on the monitor display of Heart Rate and Arousal (EDA) and try to change the reading(s) without physical movement. Heart Rate and level of arousal (EDA) are independent, so the Subject may be able to change one or the other or both.
Check the last line of the journal and note the total amount of time available for the recording.
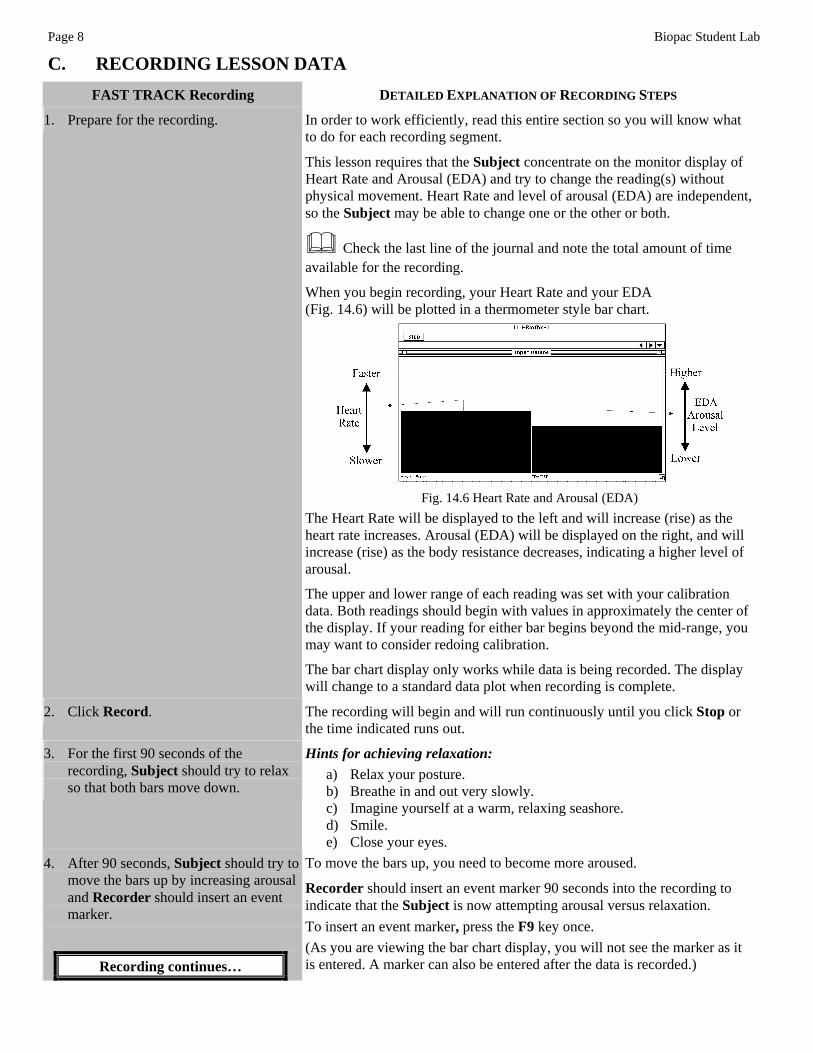
When you begin recording, your Heart Rate and your EDA (Fig. 14.6) will be plotted in a thermometer style bar chart.
Fig. 14.6 Heart Rate and Arousal (EDA)
The Heart Rate will be displayed to the left and will increase (rise) as the heart rate increases. Arousal (EDA) will be displayed on the right, and will increase (rise) as the body resistance decreases, indicating a higher level of arousal.
The upper and lower range of each reading was set with your calibration data. Both readings should begin with values in approximately the center of the display. If your reading for either bar begins beyond the mid-range, you may want to consider redoing calibration.
The bar chart display only works while data is being recorded. The display will change to a standard data plot when recording is complete.
2. Click Record. The recording will begin and will run continuously until you click Stop or the time indicated runs out.
3. For the first 90 seconds of the recording, Subject should try to relax so that both bars move down.
Hints for achieving relaxation: a) Relax your posture. b) Breathe in and out very slowly. c) Imagine yourself at a warm, relaxing seashore. d) Smile. e) Close your eyes.
4. After 90 seconds, Subject should try to move the bars up by increasing arousal and Recorder should insert an event marker.
Recording continues…
To move the bars up, you need to become more aroused.
Recorder should insert an event marker 90 seconds into the recording to indicate that the Subject is now attempting arousal versus relaxation. To insert an event marker, press the F9 key once. (As you are viewing the bar chart display, you will not see the marker as it is entered. A marker can also be entered after the data is recorded.)
Lesson 14: Biofeedback Page 9
∇ Insert event marker at 90 seconds. (No marker label is needed.)
Hints for achieving arousal:
a) Think of a stressful situation. b) Have the Director clap behind you. c) Make a scowl with your face. d) Hold your breath.
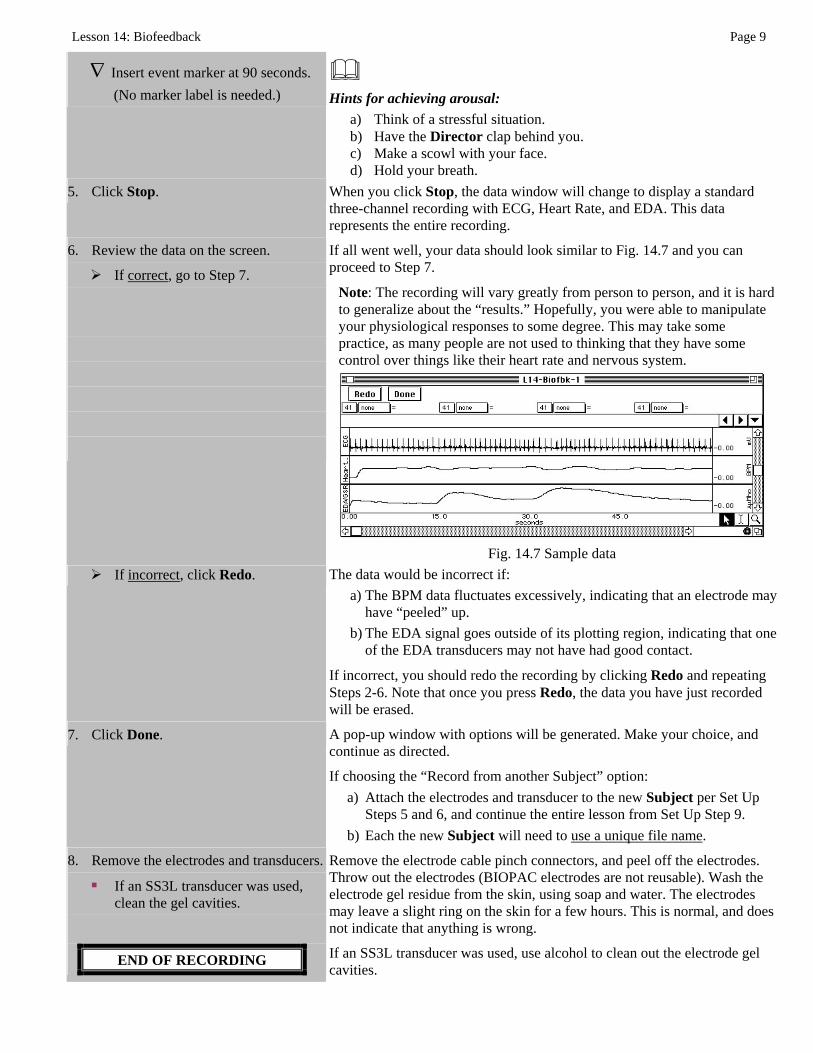
5. Click Stop. When you click Stop, the data window will change to display a standard three-channel recording with ECG, Heart Rate, and EDA. This data represents the entire recording.
6. Review the data on the screen.
If correct, go to Step 7.
If all went well, your data should look similar to Fig. 14.7 and you can proceed to Step 7.
Note: The recording will vary greatly from person to person, and it is hard to generalize about the “results.” Hopefully, you were able to manipulate your physiological responses to some degree. This may take some practice, as many people are not used to thinking that they have some control over things like their heart rate and nervous system.
Fig. 14.7 Sample data
If incorrect, click Redo. The data would be incorrect if: a) The BPM data fluctuates excessively, indicating that an electrode may
have “peeled” up. b) The EDA signal goes outside of its plotting region, indicating that one
of the EDA transducers may not have had good contact.
If incorrect, you should redo the recording by clicking Redo and repeating Steps 2-6. Note that once you press Redo, the data you have just recorded will be erased.
7. Click Done. A pop-up window with options will be generated. Make your choice, and continue as directed.
If choosing the “Record from another Subject” option: a) Attach the electrodes and transducer to the new Subject per Set Up
Steps 5 and 6, and continue the entire lesson from Set Up Step 9. b) Each the new Subject will need to use a unique file name.
8. Remove the electrodes and transducers.
If an SS3L transducer was used, clean the gel cavities.
END OF RECORDING
Remove the electrode cable pinch connectors, and peel off the electrodes. Throw out the electrodes (BIOPAC electrodes are not reusable). Wash the electrode gel residue from the skin, using soap and water. The electrodes may leave a slight ring on the skin for a few hours. This is normal, and does not indicate that anything is wrong.
If an SS3L transducer was used, use alcohol to clean out the electrode gel cavities.
Page 10 Biopac Student Lab
V. DATA ANALYSIS FAST TRACK Data Analysis DETAILED EXPLANATION OF DATA ANALYSIS STEPS
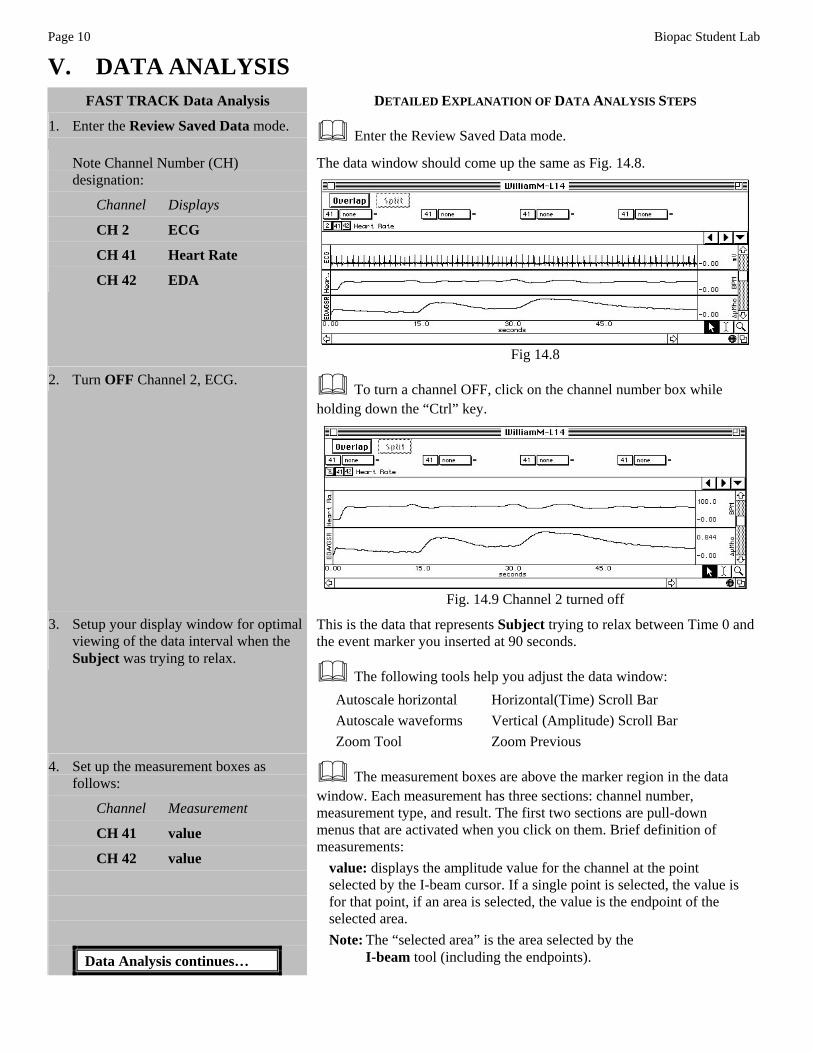
1. Enter the Review Saved Data mode. Enter the Review Saved Data mode.
Note Channel Number (CH) designation:
Channel Displays
CH 2 ECG
CH 41 Heart Rate
CH 42 EDA
The data window should come up the same as Fig. 14.8.
Fig 14.8
2. Turn OFF Channel 2, ECG. To turn a channel OFF, click on the channel number box while holding down the “Ctrl” key.
Fig. 14.9 Channel 2 turned off
3. Setup your display window for optimal viewing of the data interval when the Subject was trying to relax.
This is the data that represents Subject trying to relax between Time 0 and the event marker you inserted at 90 seconds.
The following tools help you adjust the data window: Autoscale horizontal Horizontal(Time) Scroll Bar Autoscale waveforms Vertical (Amplitude) Scroll Bar Zoom Tool Zoom Previous
4. Set up the measurement boxes as follows:
Channel Measurement
CH 41 value
CH 42 value
Data Analysis continues…
The measurement boxes are above the marker region in the data window. Each measurement has three sections: channel number, measurement type, and result. The first two sections are pull-down menus that are activated when you click on them. Brief definition of measurements:
value: displays the amplitude value for the channel at the point selected by the I-beam cursor. If a single point is selected, the value is for that point, if an area is selected, the value is the endpoint of the selected area. Note: The “selected area” is the area selected by the
I-beam tool (including the endpoints).
Lesson 14: Biofeedback Page 11
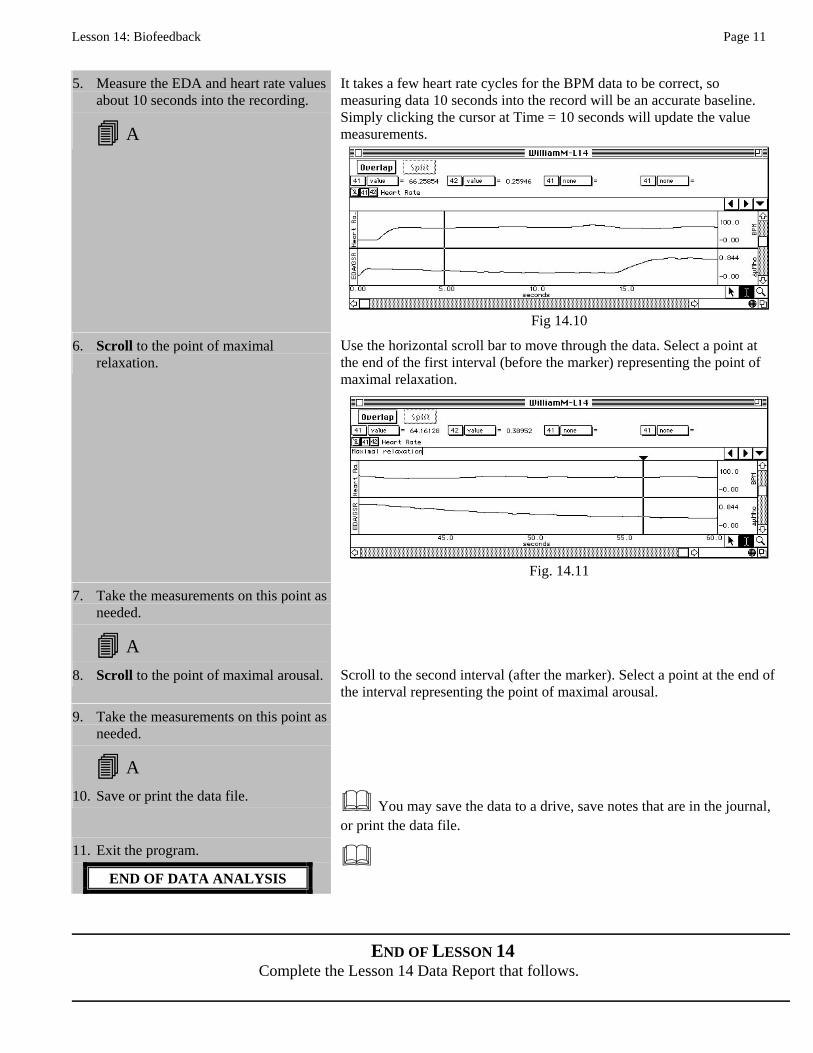
5. Measure the EDA and heart rate values
about 10 seconds into the recording.
A
It takes a few heart rate cycles for the BPM data to be correct, so measuring data 10 seconds into the record will be an accurate baseline. Simply clicking the cursor at Time = 10 seconds will update the value measurements.
Fig 14.10
6. Scroll to the point of maximal relaxation.
Use the horizontal scroll bar to move through the data. Select a point at the end of the first interval (before the marker) representing the point of maximal relaxation.
Fig. 14.11
7. Take the measurements on this point as needed.
A
8. Scroll to the point of maximal arousal. Scroll to the second interval (after the marker). Select a point at the end of the interval representing the point of maximal arousal.
9. Take the measurements on this point as needed.
A
10. Save or print the data file. You may save the data to a drive, save notes that are in the journal, or print the data file.
11. Exit the program.
END OF DATA ANALYSIS
END OF LESSON 14 Complete the Lesson 14 Data Report that follows.

Page 12 L14: Biofeedback
Data Report starts on next page.
Biopac Student Lab Page 13
BIOFEEDBACK Relaxation and Arousal
DATA REPORT
Student’s Name:
Lab Section:
Date:
I. Data and Calculations Subject Profile
Name Height
Age Weight
Gender: Male / Female
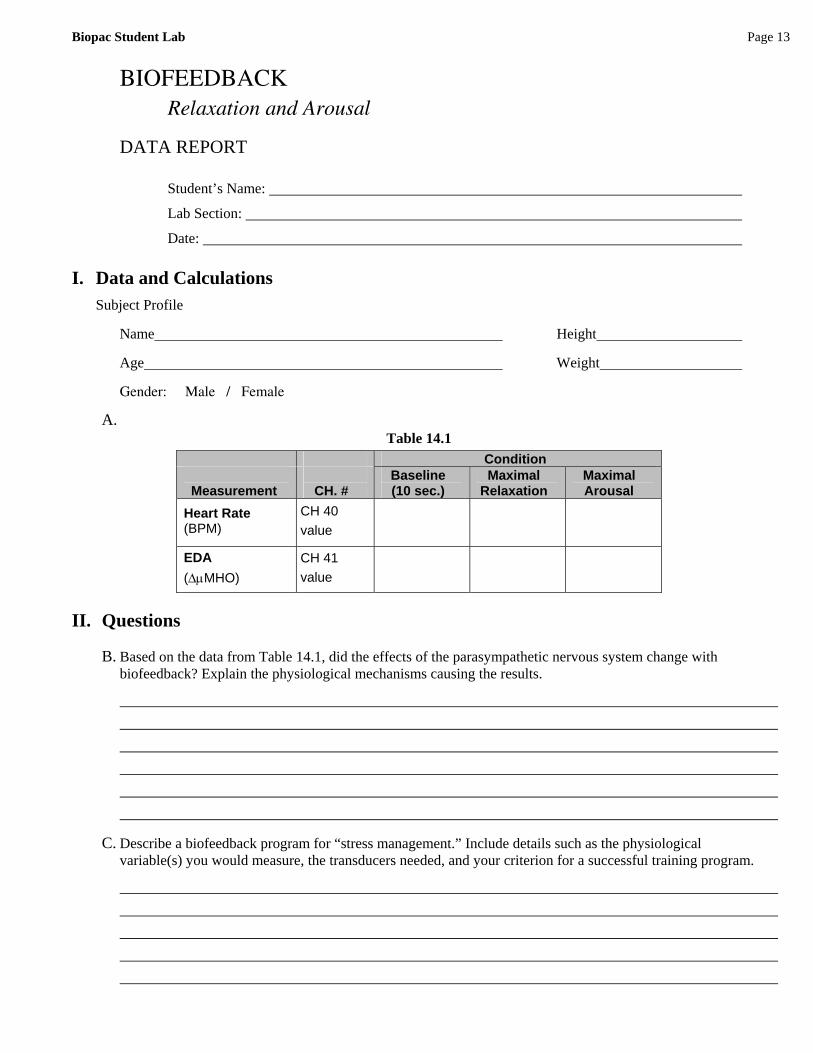
A. Table 14.1
Condition
Measurement
CH. # Baseline (10 sec.)
Maximal Relaxation
Maximal Arousal
Heart Rate (BPM)
CH 40 value
EDA (ΔμMHO)
CH 41 value
II. Questions
B. Based on the data from Table 14.1, did the effects of the parasympathetic nervous system change with biofeedback? Explain the physiological mechanisms causing the results.
C. Describe a biofeedback program for “stress management.” Include details such as the physiological variable(s) you would measure, the transducers needed, and your criterion for a successful training program.

Page 14 L14: Biofeedback
D. Name the branches of the autonomic nervous system and explain their function.
E. Define Biofeedback and explain in general terms how it works.
F. What change, if any, did your EDA recording show when you were aroused? Relaxed?
G. Why is EDA a useful measure for biofeedback training?
End of Lesson 14 Data Report