Embed Size (px)
Citation preview
UCRL-BOOK-230768
Biomolecular Modification ofInorganic Crystal Growth
J. J. De Yoreo
May 8, 2007
Perspectives on inorganic, organic and biological crystalgrowth [electronic resource] : from fundamentals toapplications : based on the lectures presented at the 13thInternational Summer School on Crystal Growth, Park City,Utah, 5-11 August 2007 / editors, Marek Skowronski, James J.DeYoreo, Christine A. Wang

This document was prepared as an account of work sponsored by an agency of the United States Government. Neither the United States Government nor the University of California nor any of their employees, makes any warranty, express or implied, or assumes any legal liability or responsibility for the accuracy, completeness, or usefulness of any information, apparatus, product, or process disclosed, or represents that its use would not infringe privately owned rights. Reference herein to any specific commercial product, process, or service by trade name, trademark, manufacturer, or otherwise, does not necessarily constitute or imply its endorsement, recommendation, or favoring by the United States Government or the University of California. The views and opinions of authors expressed herein do not necessarily state or reflect those of the United States Government or the University of California, and shall not be used for advertising or product endorsement purposes.
Updated October 14, 2003

Biomolecular Modification of Inorganic Crystal Growth
James J. De Yoreo
Chemistry, Materials and Life Sciences Directorate Lawrence Livermore National Laboratory
Livermore, CA 94551
Abstract. The fascinating shapes and hierarchical designs of biomineralized structures are an inspiration to materials scientists because of the potential they suggest for biomolecular control over materials synthesis. Conversely, the failure to prevent or limit tissue mineralization in the vascular, skeletal, and urinary systems is a common source of disease. Understanding the mechanisms by which organisms direct or limit crystallization has long been a central challenge to the biomineralization community. One prevailing view is that mineral-associated macromolecules are responsible for either inhibiting crystallization or initiating and stabilizing non-equilibrium crystal polymorphs and morphologies through interactions between anionic moieties and cations in solution or at mineralizing surfaces. In particular, biomolecules that present carboxyl groups to the growing crystal have been implicated as primary modulators of growth. Here we review the results from a combination of in situ atomic force microscopy (AFM) and molecular modeling (MM) studies to investigate the effect of specific interactions between carboxylate-rich biomolecules and atomic steps on crystal surfaces during the growth of carbonates, oxalates and phosphates of calcium. Specifically, we how the growth kinetics and morphology depend on the concentration of additives that include citrate, simple amino acids, synthetic Asp-rich polypeptides, and naturally occurring Asp-rich proteins found in both functional and pathological mineral tissues. The results reveal a consistent picture of shape modification in which stereochemical matching of modifiers to specific atomic steps drives shape modification. Inhibition and other changes in growth kinetics are shown to be due to a range of mechanisms that depend on chemistry and molecular size. Some effects are well described by classic crystal growth theories, but others, such as step acceleration due to peptide charge and hydrophylicity, were previously unrealized. Finally, we show that the molecular scale observations are well correlated with macroscopic growth rate data.
Keywords: Crystal growth from solution, atomic force microscopy, impurities, biomolecules PACS: 81.10.Aj , 81.10.Dn, 68.37.Ps, 87.14.-g
INTRODUCTION
Biomineralization is a process through which living organisms produce inorganic materials as solutions to their functional requirements. They do so by creating organic matrices that act as templates to direct the nucleation stage and introduce soluble macromolecules that both stabilize non-equilibrium phases - including amorphous phases — and modulate growth of a variety of inorganic crystals [1,2]. Biomineral formation impacts a diverse set of scientific and technological disciplines, particularly environmental biology, geochemistry and medicine, but also holds the potential to inspire new approaches in materials science.
Biomineralization occurs in the oceans on such a large scale that it influences many aspects of seawater chemistry and results in large-scale sequestration of CO2 in the form of calcium carbonate sediments that chronicle the interplay between biota and the earth system back into the Cambrian [3]. Attempts to use the fossil record as a measure of ancient earth environments and the progression of geochemical processes, or alternatively, to direct those processes towards artificial sequestering of CO2 require a fundamental understanding of the physical and chemical controls on biomineralization.
Proper formation of mineralized tissue within our bones and teeth are of obvious importance for human health. But equally significant are the many examples of pathological mineralization or demineralization. Examples include vascular calcification, osteporosis, urinary stone formation, tooth decay and hyper-mineralization of the skeleton [1,2]. Various phases of calcium phosphate, particularly carbonated hydroxyapatite, and calcium oxalates, especially calcium oxalate monhydrate (COM), are the most significant in the context of health and disease. Whether one is focused on developing theraputics to treat these pathologies or defining the mechanisms of disease, an understanding of the physical and chemical controls on tissue mineralization is critical.
Mimicking biomineralization processes presents a potential opportunity for creating new strategies towards materials synthesis. Biomineral structures exhibit complex topologies, hierarchical design, and unique materials properties. Thus, an understanding of the physical mechanisms by which biological systems use macromolecules to control crystallization can provide insights into methods of synthesizing crystalline structures for application across a wide range of technologies.
It is with these last two applications in mind that we review the results of a series of combined AFM and molecular modeling investigations into the effects of naturally occurring proteins, synthetic peptides, amino acids, and other small bioorganic molecules on the growth of calcium carbonate and oxalate at molecular length scales. Rather than cover all of the systems we have explored in a cursory manner, we have chosen a few examples to review in some detail. The work on the effects of amino acids and peptides focuses on acidic molecules, most notably aspartic acid and polyaspartate-rich peptide chains, because of the near-universal presence of such residues in proteins associated with carbonate and oxalate biominerals [1,2,4,5].
Modifying the Shapes of Crystals
The shapes of crystals are controlled by a combination of energetic and kinetic factors [6,7]. The equilibrium shape is that which minimizes the total surface free energy of the crystal, which is turn the sum of the individual products of surface area times interfacial energy (see Fig. 1(a)). Thus low-energy faces are preferentially expressed. On the other hand, crystal shape is rarely achieved by equilibration in a solution at equilibrium conditions but rather during exposure to growth conditions. The slowest growing faces become the largest and rapidly growing faces either become small or disappear altogether. Not surprisingly, the faces which are the low energy faces tend to also be those that grow slowly. Thus faces expressed during growth tend to be those expressed at equilibrium as well, although the sizes of the faces depend more critically on kinetic factors as well as the details of the growth sources, (such as
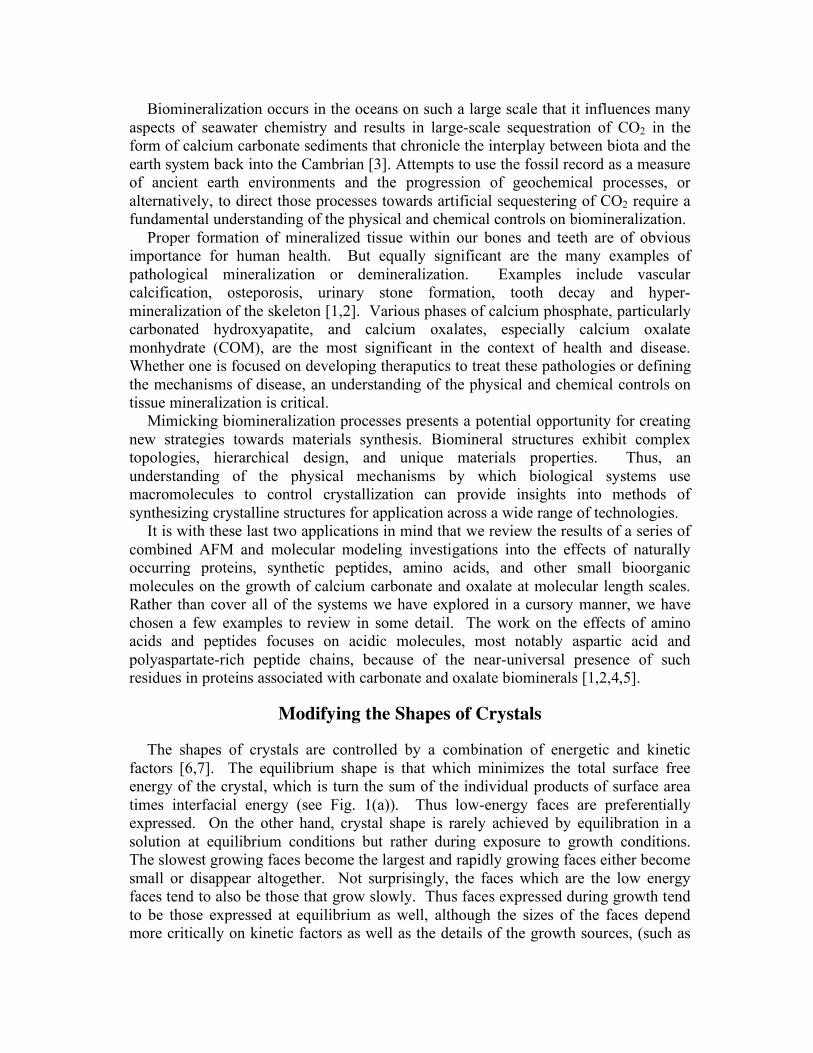
the number of steps generated at a dislocation). Because the chemical and structural factors leading to low energy faces are also present at the step edges, the shapes of growth hillocks as wells as the equilibrium shape of the critical nucleus also tend to mimic the shapes of the growth faces, although, once again, kinetic factors lead to preferential expression of certain steps. Strictly speaking, the orientational dependence of the step edge energy, which is what determines the equilibrium step shape, is not the same as that of the surface energy in the same plane. For one thing, crystal facets are the result of true cusps in the dependence of surface energy on orientation, which is a 2D feature [6,9]. In contrast, while it is the minima in the dependence of step-edge energy on orientation that lead to the preferential expression of certain step directions, due to the presence of kinks, in 1D there are no true cusps (see Fig. 1(b)) [6]. As Fig. 2 shows for calcite, as a result of these relationships, the shape of the crystal face often mimics the hillock shape, which in turn mimics the shape of the critical step segment.
FIGURE 1. Schematic illustrating the relationship between (a) interfacial free energy and crystal shape, and (b) step edge free energy and step shape for simple cases. After [8].
As a result of these relationships, it is possible to modify the shapes of crystals by
introducing ions or molecules that alter the shapes of growth hillocks through interactions with the step edges. These growth modifiers can be organic and include both peptides and large proteins, but even small inorganic modifiers may play a role in this process, given their presence in naturally occurring waters and cellular fluids [2]. Four general mechanisms have been described by which ions or molecules can modify growth hillocks, either by changing the step speed or by altering the step edge energy [8]. They are: 1) incorporation, 2) step pinning, 3) kink blocking, and 4) step-edge adsorption. Each of these major mechanisms for growth inhibition exhibits a characteristic dependence of step speed on supersaturation and impurity concentration as illustrated in Fig. 3.
FIGURE 2. Example from calcite showing close similarity between step shape, hillock shape and facet shape . After [8].
Modifying Growth Kinetics
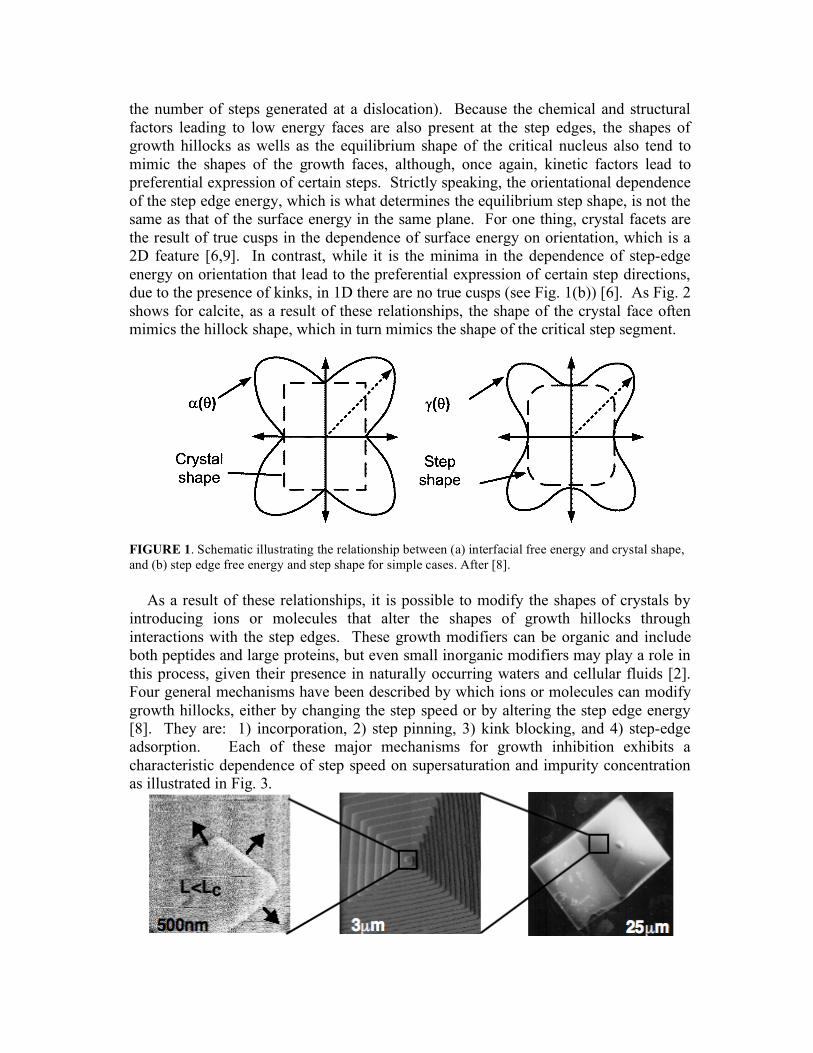
The rate at which is crystal grows is ultimately determined by the balance of attachment and detachment events at step edges. Because the growth shape is controlled by the elementary step kinetics, changes in growth rate due to alterations in step kinetics generally go hand-in-hand with shape modification. However, as Fig. 3 illustrates, almost all mechanisms lead to growth inhibition and the underlying source can either be kinetic or thermodynamic. For example, the blocking of kink sites by impurities can reduce the rate of step growth just because the number of potential attachment sites is reduced. This is a purely kinetic effect. In contrast, if inhibition is caused by the creation of pinning sites that prevents a particular site along a step from advancing, then the step will stop if the spacing between such sites drops below the critical step length, which is a thermodynamic phenomenon associated with the Gibbs-Thomson effect [10]. In what follows, wherever possible, we will provide a mechanism for the observed changes in step kinetics and relate them to the thermodynamic and kinetic factors that control growth.
FIGURE 3. The 4 models for impurity interactions and their effect on step kinetics: (a) step pinning, (b) incorporation, (c) kink blocking, and (d) surfactant action. After [8].
GROWTH AND INHIBITION OF CALCIUM OXALATE MONOHYDRATE
Relationship Between Growth Dynamics and Molecular Structure
Calcium oxalate monohydrate (COM, CaC2O4•H2O), the most thermodynamically stable form of calcium oxalate (CaOx), is the primary constituent of the majority of
human kidney stones. Although normal urine is often supersaturated with respect to calcium oxalate, human kidney stone formation is usually suppressed by urinary inhibitors such as citrate, magnesium, osteopontin, and Tamm-Horsfall protein. In recent studies, researchers sought to determine the structural relationships between these inhibitors and the COM surface, as well as the mechanisms of inhibition [11].
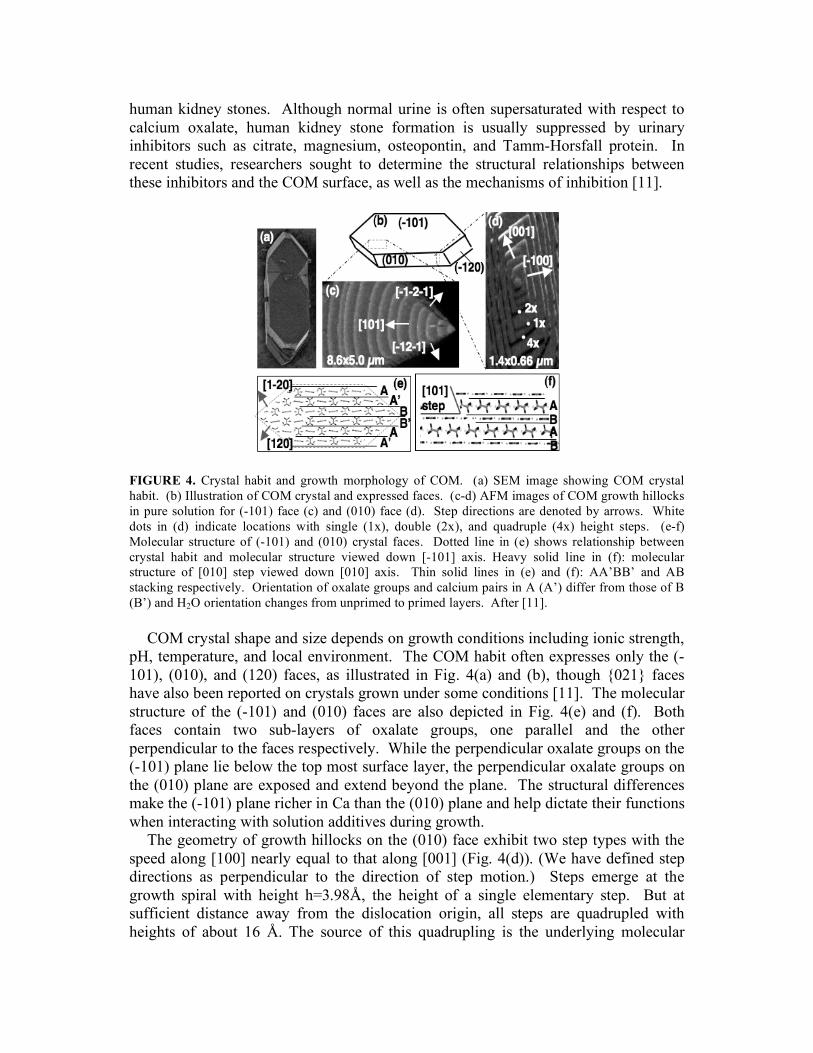
FIGURE 4. Crystal habit and growth morphology of COM. (a) SEM image showing COM crystal habit. (b) Illustration of COM crystal and expressed faces. (c-d) AFM images of COM growth hillocks in pure solution for (-101) face (c) and (010) face (d). Step directions are denoted by arrows. White dots in (d) indicate locations with single (1x), double (2x), and quadruple (4x) height steps. (e-f) Molecular structure of (-101) and (010) crystal faces. Dotted line in (e) shows relationship between crystal habit and molecular structure viewed down [-101] axis. Heavy solid line in (f): molecular structure of [010] step viewed down [010] axis. Thin solid lines in (e) and (f): AA’BB’ and AB stacking respectively. Orientation of oxalate groups and calcium pairs in A (A’) differ from those of B (B’) and H2O orientation changes from unprimed to primed layers. After [11].
COM crystal shape and size depends on growth conditions including ionic strength,
pH, temperature, and local environment. The COM habit often expresses only the (-101), (010), and (120) faces, as illustrated in Fig. 4(a) and (b), though {021} faces have also been reported on crystals grown under some conditions [11]. The molecular structure of the (-101) and (010) faces are also depicted in Fig. 4(e) and (f). Both faces contain two sub-layers of oxalate groups, one parallel and the other perpendicular to the faces respectively. While the perpendicular oxalate groups on the (-101) plane lie below the top most surface layer, the perpendicular oxalate groups on the (010) plane are exposed and extend beyond the plane. The structural differences make the (-101) plane richer in Ca than the (010) plane and help dictate their functions when interacting with solution additives during growth.
The geometry of growth hillocks on the (010) face exhibit two step types with the speed along [100] nearly equal to that along [001] (Fig. 4(d)). (We have defined step directions as perpendicular to the direction of step motion.) Steps emerge at the growth spiral with height h=3.98Å, the height of a single elementary step. But at sufficient distance away from the dislocation origin, all steps are quadrupled with heights of about 16 Å. The source of this quadrupling is the underlying molecular
packing of COM, which defines a repeating four-layer structure perpendicular to the (010) face (Fig. 4(e)). Because the differences between each layer are subtle, being related to differences in oxalate angle and water orientations, they lead to small differences in step speed between the layers. Because faster steps eventually catch up to slower steps, after a few turns of the dislocation spiral, step bunches display the periodicity of four-fold packing symmetry. This turns out to be an important characteristic of COM, because proteins that are too large to effectively interact with 3.98Å single–height steps, can still impact growth on this face through interactions with the 16Å quadruple-height steps.
Growth hillocks on the (-101) face exhibit a triangular morphology that differs from its equilibrium hexagonal habit (Fig 4(c)). Due to their high speeds, steps propagating towards the {010}, (1-20) and (120) faces are immediately eliminated at the growth spiral center and are not present. Instead a slower step moving towards [101] truncates the angle formed by the [1-21] and [121] directed steps. During growth, these [101] directed steps move about ten times faster than [-1-2-1] and [-12-1] directed steps. This means that there is a large anisotropy in attachment/detachment kinetics between these and the [101] steps and gives rise to the dramatically different terrace widths between the two types of steps (Fig. 4(c)). The (-101) hillocks grow on single 6.3Å high steps consisting of two sublayers with thicknesses of 2.4Å and 4.9Å respectively and having very different structures. In one, the oxalates lie flat and, in the other, they are perpendicular to the face (Fig. 4(f)). The exclusive expression of single 6.3Å steps on this face shows that the net rate of attachment to the lower sublayer is much slower than to the upper. Based on electrostatic considerations alone, the flat lying oxalate, Ca-rich layer should be on top.
The Effect of Citrate on COM Growth
Inhibition by citrate is of interest for several reasons [11]. First, because citrate deficiency in the urinary tract is often found in stone formers, a fundamental understanding of how citrate affects the growth of COM can provide insights into the role that citrate plays in kidney stone pathogenesis. Second, a physiochemical understanding of such role may uncover new avenues for more effective therapy of renal stone disease. Third, because citrate is a small molecule, it is amenable to molecular modeling. Finally, citrate is both non-planar and contains three carboxylic groups, making it an excellent model for developing insights based on simulations into the role of the acidic peptides and proteins that are considered to be important modulators of biomineralization.
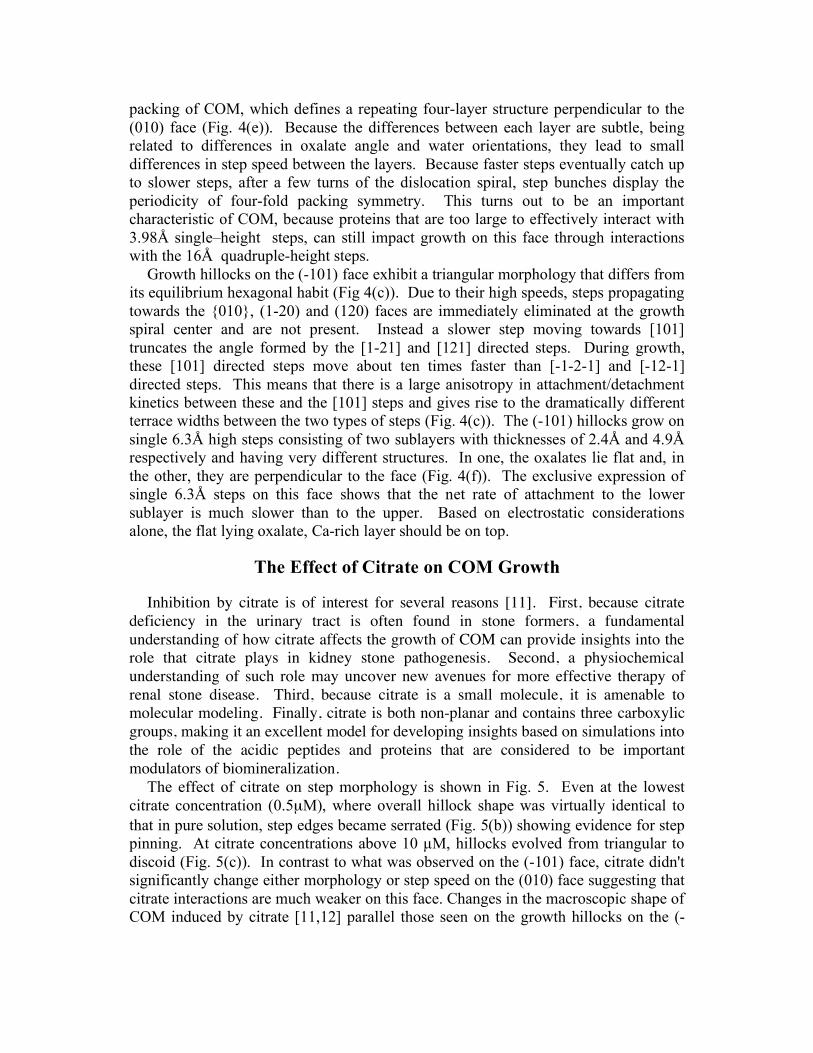
The effect of citrate on step morphology is shown in Fig. 5. Even at the lowest citrate concentration (0.5µM), where overall hillock shape was virtually identical to that in pure solution, step edges became serrated (Fig. 5(b)) showing evidence for step pinning. At citrate concentrations above 10 µM, hillocks evolved from triangular to discoid (Fig. 5(c)). In contrast to what was observed on the (-101) face, citrate didn't significantly change either morphology or step speed on the (010) face suggesting that citrate interactions are much weaker on this face. Changes in the macroscopic shape of COM induced by citrate [11,12] parallel those seen on the growth hillocks on the (-
101) face (Fig. 5). Thus, step-specific pinning on the (-101) face by citrate causes both inhibition of COM growth and modification of COM shape.
FIGURE 5. (a-c) Sequential AFM showing effect of citrate on growth of the COM (-101) face for σ = 0.7, citrate-to-[Ca] = 0.02, [Ca]-to-oxalate = 1. (a) t = 0, (b) t = 10 min, and (c) t = 33 min. Image size = 4.1x3.3 microns.. (d-g) SEM images of COM crystals formed at citrate concentrations of (d) 0, (e) 10-
4 M, (f) 10-3 M, and (g) 2 x 10⁻³ M. Scale bar: 10 µm. (Courtesy Journal of Urology). After [12]. The stereochemical source of the highly step-specific interactions of citrate with
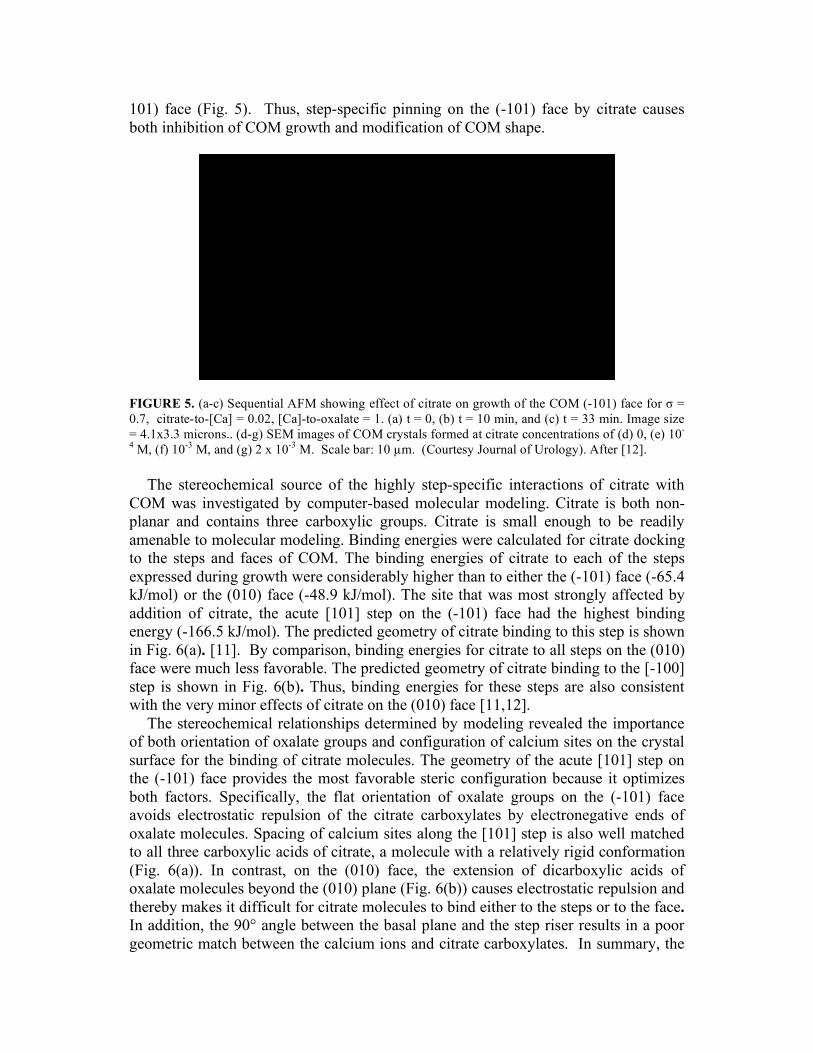
COM was investigated by computer-based molecular modeling. Citrate is both non-planar and contains three carboxylic groups. Citrate is small enough to be readily amenable to molecular modeling. Binding energies were calculated for citrate docking to the steps and faces of COM. The binding energies of citrate to each of the steps expressed during growth were considerably higher than to either the (-101) face (-65.4 kJ/mol) or the (010) face (-48.9 kJ/mol). The site that was most strongly affected by addition of citrate, the acute [101] step on the (-101) face had the highest binding energy (-166.5 kJ/mol). The predicted geometry of citrate binding to this step is shown in Fig. 6(a). [11]. By comparison, binding energies for citrate to all steps on the (010) face were much less favorable. The predicted geometry of citrate binding to the [-100] step is shown in Fig. 6(b). Thus, binding energies for these steps are also consistent with the very minor effects of citrate on the (010) face [11,12].
The stereochemical relationships determined by modeling revealed the importance of both orientation of oxalate groups and configuration of calcium sites on the crystal surface for the binding of citrate molecules. The geometry of the acute [101] step on the (-101) face provides the most favorable steric configuration because it optimizes both factors. Specifically, the flat orientation of oxalate groups on the (-101) face avoids electrostatic repulsion of the citrate carboxylates by electronegative ends of oxalate molecules. Spacing of calcium sites along the [101] step is also well matched to all three carboxylic acids of citrate, a molecule with a relatively rigid conformation (Fig. 6(a)). In contrast, on the (010) face, the extension of dicarboxylic acids of oxalate molecules beyond the (010) plane (Fig. 6(b)) causes electrostatic repulsion and thereby makes it difficult for citrate molecules to bind either to the steps or to the face. In addition, the 90° angle between the basal plane and the step riser results in a poor geometric match between the calcium ions and citrate carboxylates. In summary, the
geometric relationships and molecular modeling calculations rationalize the AFM results. Strong citrate-step interactions lead to pinning of all steps on the (-101) face. However, differences in binding energies among steps on this face result in asymmetric reductions in step kinetics that cause the citrate-induced changes in COM morphology.
FIGURE 6. Geometries of citrate binding to (a) the [101] step on the (-101) face and (b) the [100] step on the (010) face of COM in the minimum energy configurations. For ease of viewing, molecules in the step riser plane are shaded in light grey. Chemical bonds between the citrate molecules and calcium ions and between the hydroxyl groups and the oxalate ions are displayed by grey lines. (b) C Solid circles: Ca2+, Black: O, Dark grey: C, Off-white: H. Inset triangles and parallelograms refer to hillock shapes seen in Fig. 4. Heavy line indicates which step is illustrated by the model. After [12].
The Mechanism of COM Inhibition by Citrate
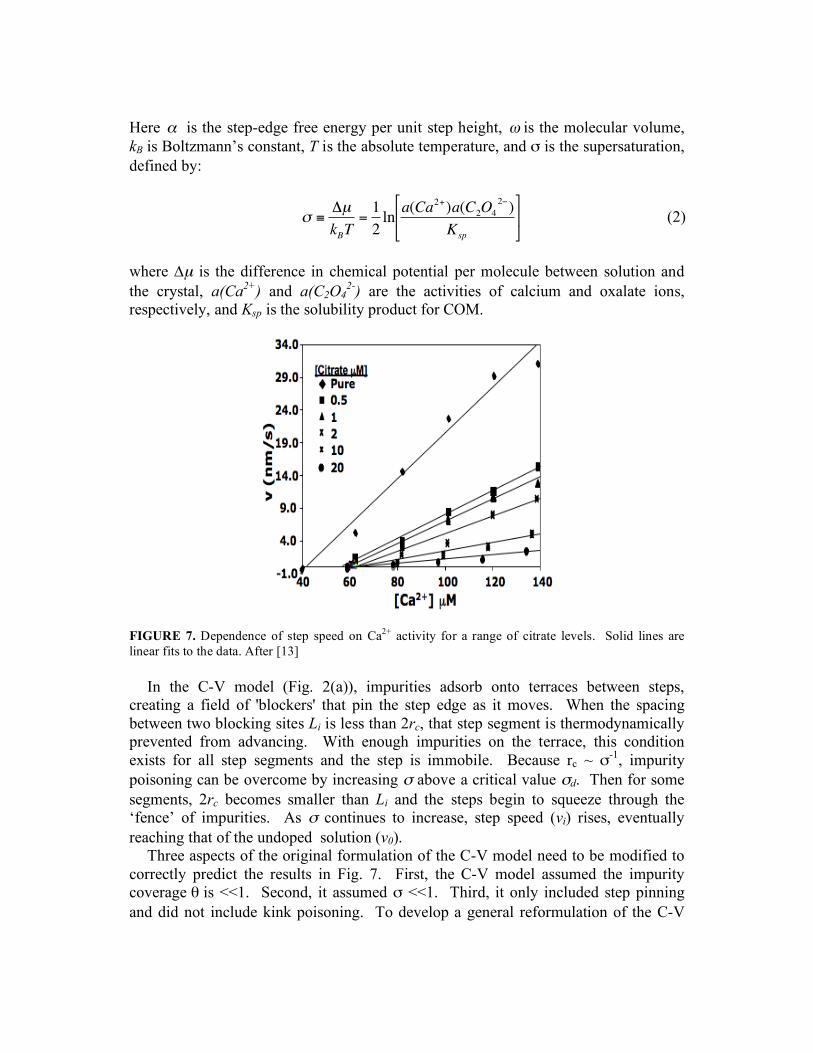
We now turn to the mechanism of inhibition on the (-101) face. The dependence of the [-101] step speed on citrate concentration (Fig. 7) shows that citrate has two primary effects on step kinetics: 1) it creates a “dead zone” of positive supersaturation where no growth occurs and 2) it reduces the slope of the curves. Both effects increase with increasing citrate concentration. Both the dead zone and step morphology suggest that the step pinning model of Cabrera and Vermilyea (C-V) [10] might describe the mechanism of inhibition. The basis of the C-V model is the Gibbs-Thomson (G-T) effect, which relates differences in free energy between step and solution to step curvature [6-8]. In essence, greater curvature leads to smaller numbers of nearest neighbors along a step edge, reducing thermodynamic stability and increasing excess step free energy. The G-T effect predicts a critical curvature rc
-1, above which the excess step free energy exceeds the chemical potential difference between crystal and solution. Consequently, steps can not exceed this curvature, which is set by the critical step radius rc [7]:
!
rc
="#
kBT$
. (1)
Here ! is the step-edge free energy per unit step height, ! is the molecular volume, kB is Boltzmann’s constant, T is the absolute temperature, and σ is the supersaturation, defined by:
!
" #$µ
kBT=1
2lna(Ca
2+)a(C2O4
2%)
Ksp
&
' (
)
* + (2)
where ∆µ is the difference in chemical potential per molecule between solution and the crystal, a(Ca2+) and a(C2O4
2-) are the activities of calcium and oxalate ions, respectively, and Ksp is the solubility product for COM.
FIGURE 7. Dependence of step speed on Ca2+ activity for a range of citrate levels. Solid lines are linear fits to the data. After [13]
In the C-V model (Fig. 2(a)), impurities adsorb onto terraces between steps, creating a field of 'blockers' that pin the step edge as it moves. When the spacing between two blocking sites Li is less than 2rc, that step segment is thermodynamically prevented from advancing. With enough impurities on the terrace, this condition exists for all step segments and the step is immobile. Because rc ~ σ-1, impurity poisoning can be overcome by increasing σ above a critical value σd. Then for some segments, 2rc becomes smaller than Li and the steps begin to squeeze through the ‘fence’ of impurities. As σ continues to increase, step speed (vi) rises, eventually reaching that of the undoped solution (v0).
Three aspects of the original formulation of the C-V model need to be modified to correctly predict the results in Fig. 7. First, the C-V model assumed the impurity coverage θ is <<1. Second, it assumed σ <<1. Third, it only included step pinning and did not include kink poisoning. To develop a general reformulation of the C-V
model, we start with the linear dependence of v on solute activity (Fig. 7) generally observed in aqueous systems [8]:
!
v = "(a # ae) (3)
where a and ae are the actual and equilibrium activities for straight steps and β, the kinetic coefficient, is proportional to the density nk of kink sites along a step [10]. Using an exact expression of the G-T effect for ae vs. rc correct at all σ [14] we obtain a new relationship between v and σ [13]:
!
vi= "(a # a
e) 1#
e$d #1
e$ #1
%
& '
(
) * for
!
" #"d (4)
We express the impurity θ coverage using a Langmuir expression [13]:
iDA
iDA
Ckk
Ckk
)/(1
)/(
+=! (5)
Using Li ∝ 2rc at σ = σd and recognizing that Li = (θ h/ω)−0.5 where h is the step height (ω/h = area per surface site) we obtain a general expression for σd [13]:
!
"d
=2(#h)1/ 2$
B1kBT%(k
A/k
D)C
i
1+ (kA/k
D)C
i
&
' (
)
* +
0.5
= A1A2Ci
1+ A2Ci
&
' (
)
* +
0.5
(6)
Here B1 is the product of the fraction of adsorbed surface impurities that stick to a step and pin it and a factor of order unity given by the percolation threshold for the step to move through a field of blockers [16]. In the limit of very low coverage (θ << 1), Eqn. 6 reduces to the form of the original C-V expression.
Finally, we assume that some fraction of adsorbed impurities can slow steps by poisoning kink sites without pinning steps. To include this possibility, an expression for nk vs. θ is derived and used to scale according to [13]:
!
1"#
#0
=1"nK
nK ,0
$
% &
'
( ) =1" 1"
B2* 0.5
nK ,0
$
% &
'
( ) = A
3
A2Ci
1+ A2Ci
$
% &
'
( )
0.5
(7)
Here A2 = kA/kD should be the same as in Eqn 6, A3 = B2/nK,0, and B2, in analogy to B1, gives the fraction of adsorbed impurities that poison kinks.
As Fig. 8 shows, the measured dependencies of σd and 1-β/β0 on citrate concentration are well fit by these expressions. Moreover, the best fits give nearly identical values of kA/ kD for both dependencies. Apparently, the surface coverage of impurities is indeed a significant fraction of the available sites and both subpopulations that poison kinks and pin steps come from this single adsorbed reservoir.

Combining the expressions for β and σd (Eqns. 6,7) with the expression for v of σ (Eqn. 4) we obtain a general expression for inhibition that accounts for high σ, Langmuir-type impurity adsorption, and reductions in β in terms of three fitting parameters A1, A2, and A3. These are, in turn, controlled by three fundamental parameters of the system: the step edge energy α, the kink density nk, and the ratio of the adsorption to desorption rate constants kA/ kD. The curves in Fig. 9 are best fits using Eqn. 6 where β and σd are given by Eqns. 6 and 7. This reformulation gives an excellent match to the experimental results and the values of σd and β/β0 extracted from the fits are nearly identical to the measured values shown in Fig. 8. Thus, this model of COM inhibition by citrate is self-consistent.
FIGURE 8. Dependence of σd (open boxes) and 1-β/β0 (solid circles) on citrate concentration. Dotted line is fit according to original C-V model (Eqn. 3, σd~C0.5). Solid lines are fits according to Eqns. 6,7. After [13].
FIGURE 9. Dependence of v/v0 on citrate concentration. Dotted line is fit of original C-V model (v/v0 ~ [1-AC0.5]0.5). Solid lines are best fits to data according to modified model (Eqn. 4) where the expressions for σd and βb in Eqns. 6 and 7 have been used. After [13].

MODULATION OF CALCITE GROWTH
Growth Dynamics in the Pure System
Growth of calcite from pure solutions occurs on six identical {1014} faces of a rhombehedron through the propagation of 3.1Å monomolecular steps generated either by dislocations or, at sufficiently high supersaturations, by 2D nucleation [14]. The advance of these steps leads to the formation of polygonal growth hillocks with steps parallel to the <441> directions as illustrated in Fig. 2. The presence of a c-glide plane generates two distinct pairs of crystallographically identical steps denoted as the obtuse (+) and acute (-) steps due to the angles that the step risers make with the terraces [17]. The terrace widths of the two step types, T± are related the step speeds, v± through T+/T- = v+/v-.
Teng et al. [14] used AFM to image the birth of a new spiral segment on calcite (Fig. 10) and to provide the first detailed, molecular scale experimental analysis of the development of the growth spiral. For the rhombehedral spiral of calcite, they showed that the terrace widths for the two step directions become [14]:
T+ = 2(1+κ)<Lc>/sinφ and T- = 2(1+1/ κ)<Lc>/sinφ (8)
where κ is v+/v-, <Lc> is the average value of the critical step length for the two step directions and φ is the angle between adjacent turns of the spiral. Lc is given by [14]: Lc± = 2ωα±/kTσ (9) Where α± is the average step edge energy associated with generating a new step in the obtuse and acute directions for each of the two step directions. Assuming this thermodynamic picture of critical length applies, measuring changes in average terrace width provides a semi-quantitative measure of the changes in step edge energy.
FIGURE 10. AFM images showing birth of a new step segment on calcite. In (a), the smallest step is below the critical length and not moving. In (b) it has exceeded critical length and begun to move. A new sub-critical step segment appears. After [14].
Importance of chirality in shape modification by simple amino acids
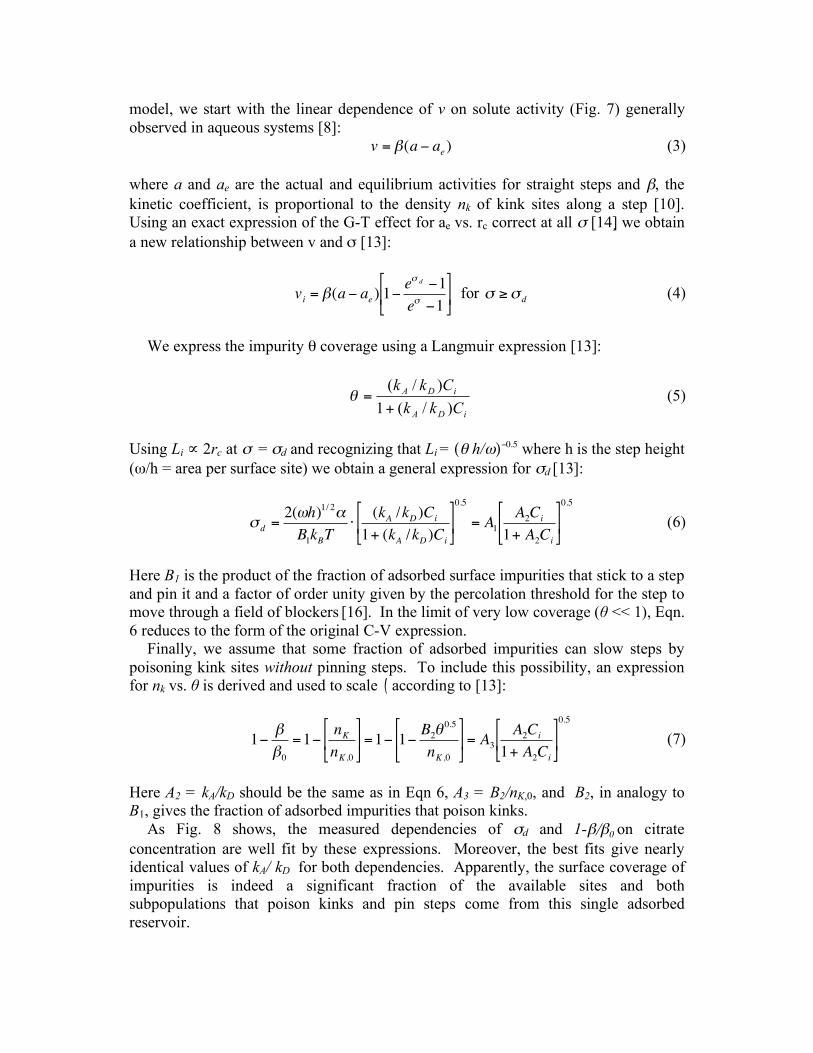
Due to their common presence in proteins found in association with carbonate biominerals, acidic amino acids have been investigated as model modifiers of calcite growth. Previous studies of macroscopic crystal shapes were used to derive a model of shape modification based on binding of these compounds to the otherwise unexpressed (hk0) faces of calcite [1,2,15]. In order to build a quantitative physical picture of modification, the effect of glycine, aspartic acid and glutamic acid on step speed, critical length and growth hillock, etchpit and crystal morphology were examined as a function of amino acid chirality and concentration [15]. Addition of all amino acids during growth, led to stabilization of the (hk0) family of planes. When the amino acid had a chiral structure, the addition of pure L-and D- forms resulted in anisotropic expression of these planes so that the resulting growth hillock, etchpits and crystal morphologies displayed mirror symmetry about the glide plane of calcite. The case of growth with aspartic acid is shown in Figs. 11. The addition of glycine, an achiral molecule, or racemic mixtures of D and L aspartic and glutamic acid, led to symmetric forms. Because the overall facet shape exhibited the same shape as the emerging step at the dislocation source, the growth hillock geometry was used to construct the modified Wullf diagram for the orientational dependence of the step edge energy (Fig. 12). Asp caused the appearance of a new minimum energy direction that replaces the two scute step minima and gives a reduction in the average step edge energy as is reflected in the reduced terrace width (Fig. 11). (Note that this approach again depends on the appropriateness of the thermodynamic picture of steps discussed above.) Measurements of step speed as a function of Asp concentration showed little effect until the Asp level exceeded about 10nM, or 10-100 times the Ca activity. Contrast this to the inhibitory effects of citrate and OPN on COM at concentrations of ~100 nM and 5nM, respectively. Thus, Asp has little effect on step kinetics while strongly affecting the step-edge energetics.
FIGURE 11. AFM images of growth on {104} calcite faces growing in (a) pure, (b) L-Asp- and (c) D-Asp- bearing solutions, and SEM images of crystals nucleated in similar solution. After [15].
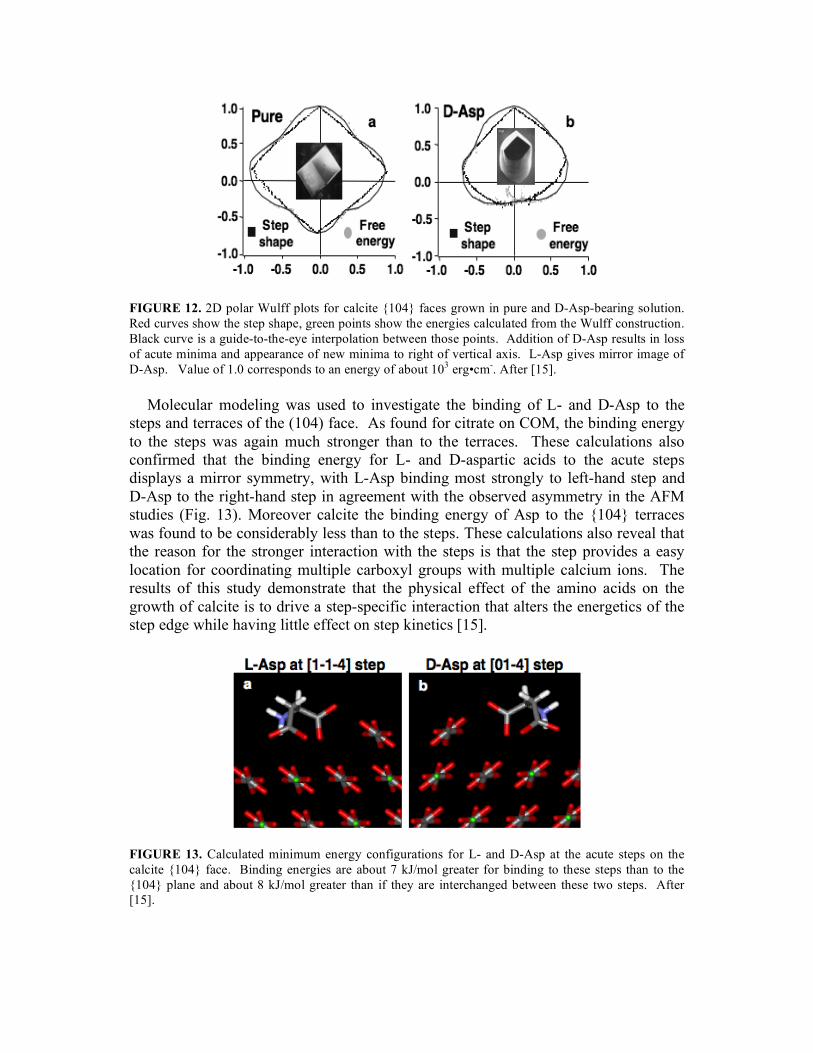
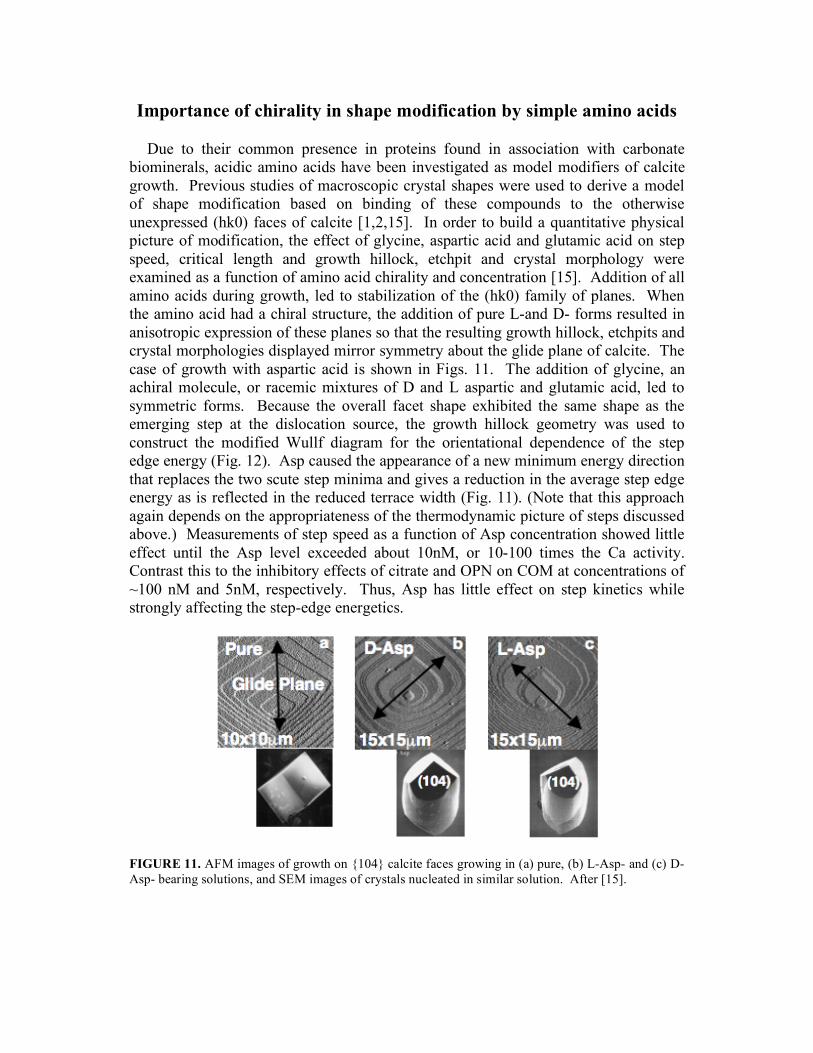
FIGURE 12. 2D polar Wulff plots for calcite {104} faces grown in pure and D-Asp-bearing solution. Red curves show the step shape, green points show the energies calculated from the Wulff construction. Black curve is a guide-to-the-eye interpolation between those points. Addition of D-Asp results in loss of acute minima and appearance of new minima to right of vertical axis. L-Asp gives mirror image of D-Asp. Value of 1.0 corresponds to an energy of about 103 erg•cm-. After [15].
Molecular modeling was used to investigate the binding of L- and D-Asp to the
steps and terraces of the (104) face. As found for citrate on COM, the binding energy to the steps was again much stronger than to the terraces. These calculations also confirmed that the binding energy for L- and D-aspartic acids to the acute steps displays a mirror symmetry, with L-Asp binding most strongly to left-hand step and D-Asp to the right-hand step in agreement with the observed asymmetry in the AFM studies (Fig. 13). Moreover calcite the binding energy of Asp to the {104} terraces was found to be considerably less than to the steps. These calculations also reveal that the reason for the stronger interaction with the steps is that the step provides a easy location for coordinating multiple carboxyl groups with multiple calcium ions. The results of this study demonstrate that the physical effect of the amino acids on the growth of calcite is to drive a step-specific interaction that alters the energetics of the step edge while having little effect on step kinetics [15].
FIGURE 13. Calculated minimum energy configurations for L- and D-Asp at the acute steps on the calcite {104} face. Binding energies are about 7 kJ/mol greater for binding to these steps than to the {104} plane and about 8 kJ/mol greater than if they are interchanged between these two steps. After [15].
The Effect of Full Proteins Extracted from Abalone Shell
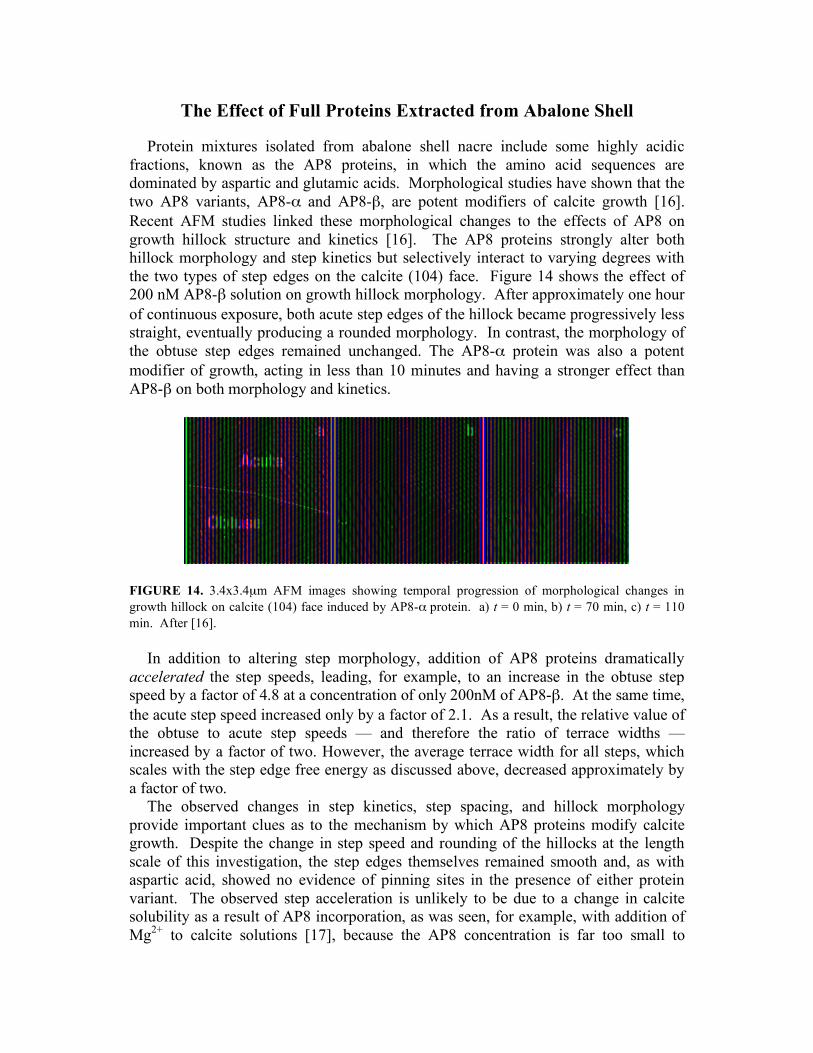
Protein mixtures isolated from abalone shell nacre include some highly acidic fractions, known as the AP8 proteins, in which the amino acid sequences are dominated by aspartic and glutamic acids. Morphological studies have shown that the two AP8 variants, AP8-α and AP8-β, are potent modifiers of calcite growth [16]. Recent AFM studies linked these morphological changes to the effects of AP8 on growth hillock structure and kinetics [16]. The AP8 proteins strongly alter both hillock morphology and step kinetics but selectively interact to varying degrees with the two types of step edges on the calcite (104) face. Figure 14 shows the effect of 200 nM AP8-β solution on growth hillock morphology. After approximately one hour of continuous exposure, both acute step edges of the hillock became progressively less straight, eventually producing a rounded morphology. In contrast, the morphology of the obtuse step edges remained unchanged. The AP8-α protein was also a potent modifier of growth, acting in less than 10 minutes and having a stronger effect than AP8-β on both morphology and kinetics.
FIGURE 14. 3.4x3.4µm AFM images showing temporal progression of morphological changes in growth hillock on calcite (104) face induced by AP8-α protein. a) t = 0 min, b) t = 70 min, c) t = 110 min. After [16].
In addition to altering step morphology, addition of AP8 proteins dramatically
accelerated the step speeds, leading, for example, to an increase in the obtuse step speed by a factor of 4.8 at a concentration of only 200nM of AP8-β. At the same time, the acute step speed increased only by a factor of 2.1. As a result, the relative value of the obtuse to acute step speeds — and therefore the ratio of terrace widths — increased by a factor of two. However, the average terrace width for all steps, which scales with the step edge free energy as discussed above, decreased approximately by a factor of two.
The observed changes in step kinetics, step spacing, and hillock morphology provide important clues as to the mechanism by which AP8 proteins modify calcite growth. Despite the change in step speed and rounding of the hillocks at the length scale of this investigation, the step edges themselves remained smooth and, as with aspartic acid, showed no evidence of pinning sites in the presence of either protein variant. The observed step acceleration is unlikely to be due to a change in calcite solubility as a result of AP8 incorporation, as was seen, for example, with addition of Mg2+ to calcite solutions [17], because the AP8 concentration is far too small to
produce a significant effect. Moreover, because acidic proteins tend to reduce Ca2+
activity in solution and would likely introduce strain into the crystal lattice, we would expect the incorporation of AP8 to lower the step speeds, not raise them. Likewise, if AP8 acted to poison kink sites, the step speeds would decrease rather than increase. In fact, of the four end-member models for modification by additives discussed in the Introduction — 1) step pinning, 2) incorporation, 3) kink poisoning, and 4) surfaction — an increase in step speed accompanied by changes in average step spacing and hillock shape without step pinning is consistent with only the fourth one. Thus we postulate that, as with the simple amino acids like Asp [15], AP8 proteins act as surfactants to modify the thermodynamics and kinetics of calcium and carbonate attachment at step edges without significant pinning, poisoning, or incorporation.
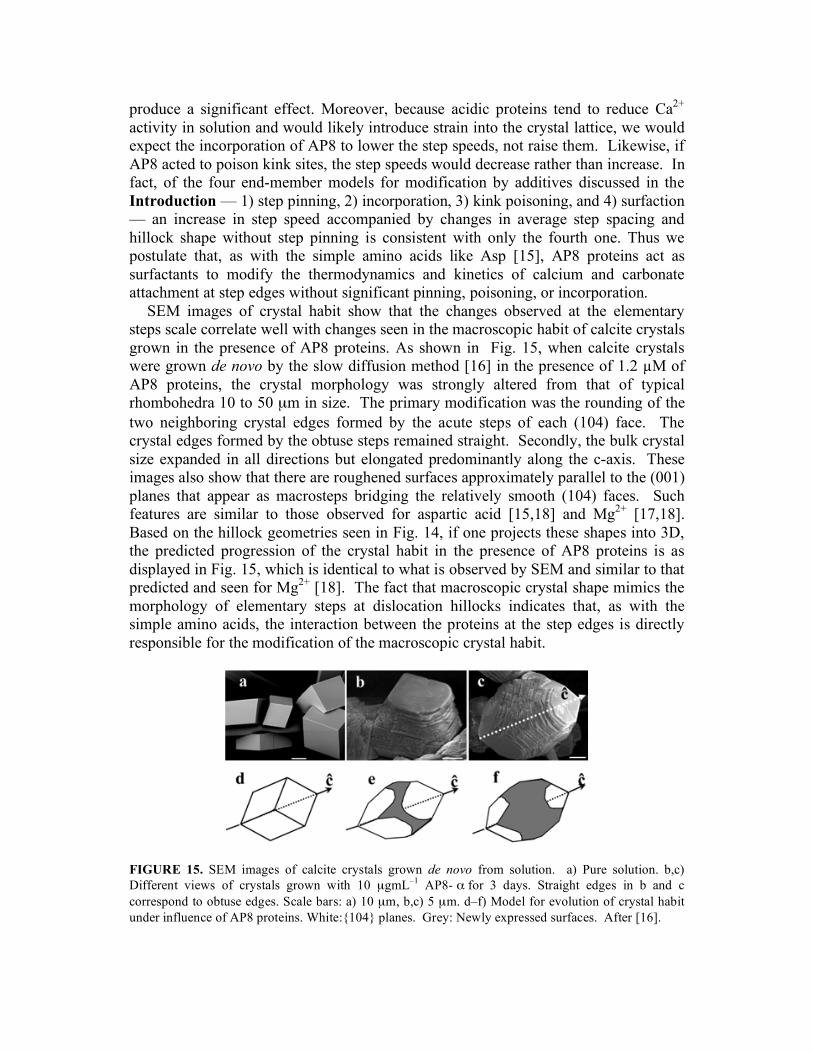
SEM images of crystal habit show that the changes observed at the elementary steps scale correlate well with changes seen in the macroscopic habit of calcite crystals grown in the presence of AP8 proteins. As shown in Fig. 15, when calcite crystals were grown de novo by the slow diffusion method [16] in the presence of 1.2 µM of AP8 proteins, the crystal morphology was strongly altered from that of typical rhombohedra 10 to 50 µm in size. The primary modification was the rounding of the two neighboring crystal edges formed by the acute steps of each (104) face. The crystal edges formed by the obtuse steps remained straight. Secondly, the bulk crystal size expanded in all directions but elongated predominantly along the c-axis. These images also show that there are roughened surfaces approximately parallel to the (001) planes that appear as macrosteps bridging the relatively smooth (104) faces. Such features are similar to those observed for aspartic acid [15,18] and Mg2+ [17,18]. Based on the hillock geometries seen in Fig. 14, if one projects these shapes into 3D, the predicted progression of the crystal habit in the presence of AP8 proteins is as displayed in Fig. 15, which is identical to what is observed by SEM and similar to that predicted and seen for Mg2+ [18]. The fact that macroscopic crystal shape mimics the morphology of elementary steps at dislocation hillocks indicates that, as with the simple amino acids, the interaction between the proteins at the step edges is directly responsible for the modification of the macroscopic crystal habit.
FIGURE 15. SEM images of calcite crystals grown de novo from solution. a) Pure solution. b,c) Different views of crystals grown with 10 µgmL–1 AP8- α for 3 days. Straight edges in b and c correspond to obtuse edges. Scale bars: a) 10 µm, b,c) 5 µm. d–f) Model for evolution of crystal habit under influence of AP8 proteins. White:{104} planes. Grey: Newly expressed surfaces. After [16].
The Effect of Peptide Chain Length on Calcite Step Inhibition
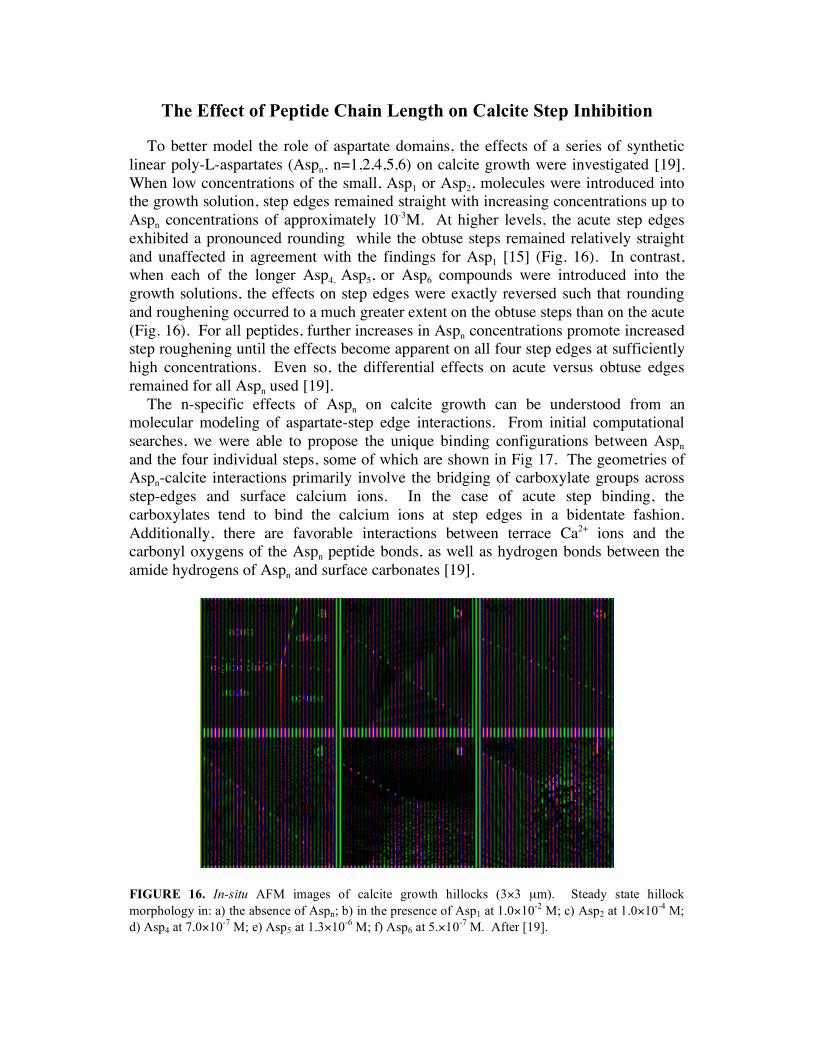
To better model the role of aspartate domains, the effects of a series of synthetic linear poly-L-aspartates (Aspn, n=1,2,4,5,6) on calcite growth were investigated [19]. When low concentrations of the small, Asp1 or Asp2, molecules were introduced into the growth solution, step edges remained straight with increasing concentrations up to Aspn concentrations of approximately 10-3M. At higher levels, the acute step edges exhibited a pronounced rounding while the obtuse steps remained relatively straight and unaffected in agreement with the findings for Asp1 [15] (Fig. 16). In contrast, when each of the longer Asp4, Asp5, or Asp6 compounds were introduced into the growth solutions, the effects on step edges were exactly reversed such that rounding and roughening occurred to a much greater extent on the obtuse steps than on the acute (Fig. 16). For all peptides, further increases in Aspn concentrations promote increased step roughening until the effects become apparent on all four step edges at sufficiently high concentrations. Even so, the differential effects on acute versus obtuse edges remained for all Aspn used [19].
The n-specific effects of Aspn on calcite growth can be understood from an molecular modeling of aspartate-step edge interactions. From initial computational searches, we were able to propose the unique binding configurations between Aspn and the four individual steps, some of which are shown in Fig 17. The geometries of Aspn-calcite interactions primarily involve the bridging of carboxylate groups across step-edges and surface calcium ions. In the case of acute step binding, the carboxylates tend to bind the calcium ions at step edges in a bidentate fashion. Additionally, there are favorable interactions between terrace Ca2+ ions and the carbonyl oxygens of the Aspn peptide bonds, as well as hydrogen bonds between the amide hydrogens of Aspn and surface carbonates [19].
FIGURE 16. In-situ AFM images of calcite growth hillocks (3×3 µm). Steady state hillock morphology in: a) the absence of Aspn; b) in the presence of Asp1 at 1.0×10⁻² M; c) Asp2 at 1.0×10⁻⁴ M; d) Asp4 at 7.0×10⁻⁷ M; e) Asp5 at 1.3×10⁻⁶ M; f) Asp6 at 5.×10-7 M. After [19].
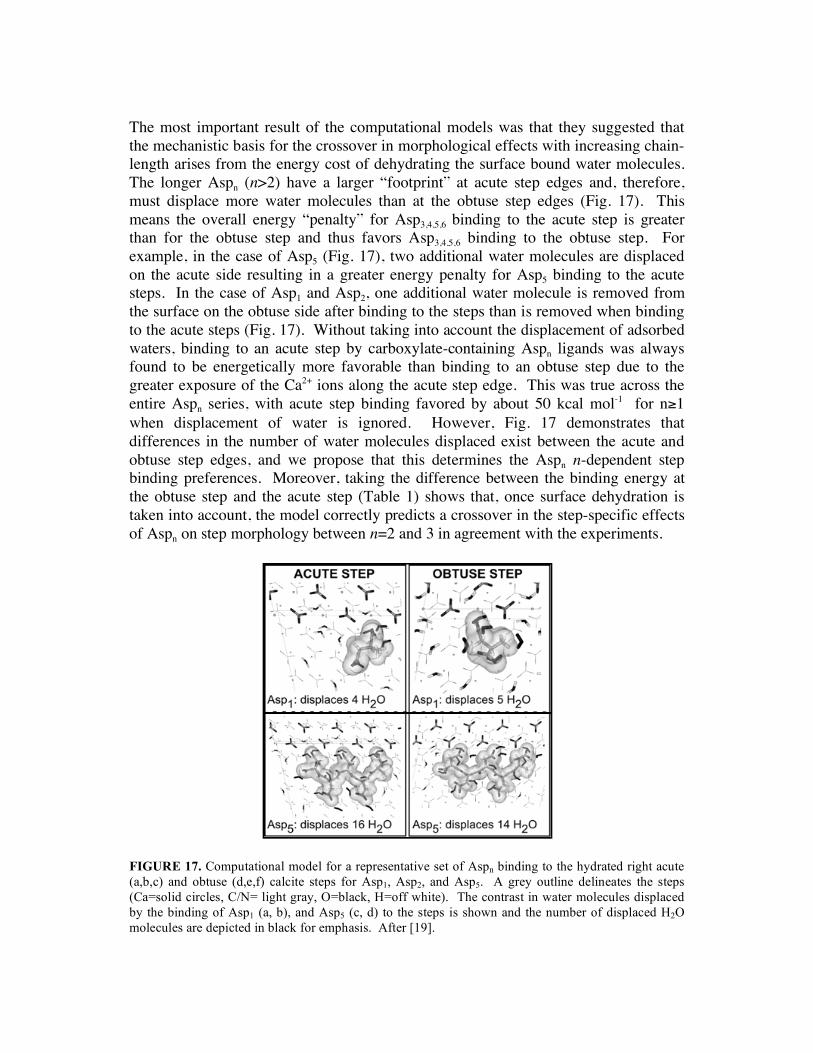
The most important result of the computational models was that they suggested that the mechanistic basis for the crossover in morphological effects with increasing chain-length arises from the energy cost of dehydrating the surface bound water molecules. The longer Aspn (n>2) have a larger “footprint” at acute step edges and, therefore, must displace more water molecules than at the obtuse step edges (Fig. 17). This means the overall energy “penalty” for Asp3,4,5,6 binding to the acute step is greater than for the obtuse step and thus favors Asp3,4,5,6 binding to the obtuse step. For example, in the case of Asp5 (Fig. 17), two additional water molecules are displaced on the acute side resulting in a greater energy penalty for Asp5 binding to the acute steps. In the case of Asp1 and Asp2, one additional water molecule is removed from the surface on the obtuse side after binding to the steps than is removed when binding to the acute steps (Fig. 17). Without taking into account the displacement of adsorbed waters, binding to an acute step by carboxylate-containing Aspn ligands was always found to be energetically more favorable than binding to an obtuse step due to the greater exposure of the Ca2+ ions along the acute step edge. This was true across the entire Aspn series, with acute step binding favored by about 50 kcal mol-1 for n≥1 when displacement of water is ignored. However, Fig. 17 demonstrates that differences in the number of water molecules displaced exist between the acute and obtuse step edges, and we propose that this determines the Aspn n-dependent step binding preferences. Moreover, taking the difference between the binding energy at the obtuse step and the acute step (Table 1) shows that, once surface dehydration is taken into account, the model correctly predicts a crossover in the step-specific effects of Aspn on step morphology between n=2 and 3 in agreement with the experiments.
FIGURE 17. Computational model for a representative set of Aspn binding to the hydrated right acute (a,b,c) and obtuse (d,e,f) calcite steps for Asp1, Asp2, and Asp5. A grey outline delineates the steps (Ca=solid circles, C/N= light gray, O=black, H=off white). The contrast in water molecules displaced by the binding of Asp1 (a, b), and Asp5 (c, d) to the steps is shown and the number of displaced H2O molecules are depicted in black for emphasis. After [19].
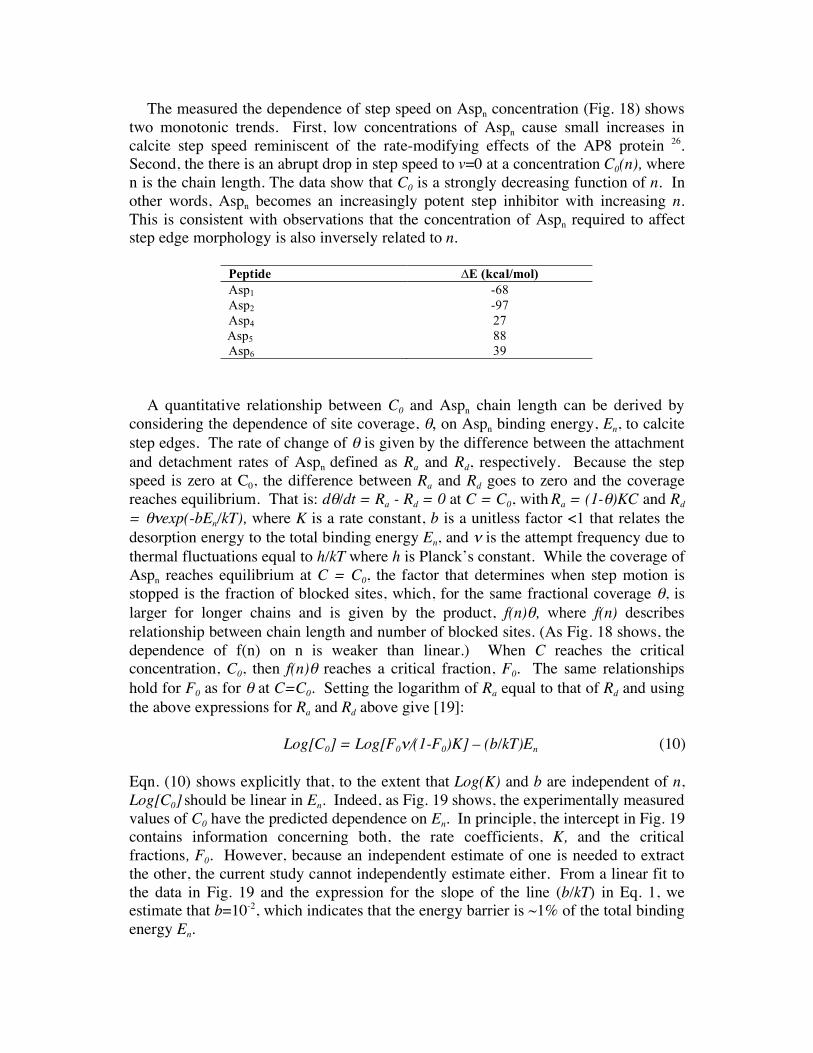
The measured the dependence of step speed on Aspn concentration (Fig. 18) shows two monotonic trends. First, low concentrations of Aspn cause small increases in calcite step speed reminiscent of the rate-modifying effects of the AP8 protein 26. Second, the there is an abrupt drop in step speed to v=0 at a concentration C0(n), where n is the chain length. The data show that C0 is a strongly decreasing function of n. In other words, Aspn becomes an increasingly potent step inhibitor with increasing n. This is consistent with observations that the concentration of Aspn required to affect step edge morphology is also inversely related to n.
Peptide ∆E (kcal/mol) Asp1 -68 Asp2 -97 Asp4 27 Asp5 88 Asp6 39
A quantitative relationship between C0 and Aspn chain length can be derived by
considering the dependence of site coverage, θ, on Aspn binding energy, En, to calcite step edges. The rate of change of θ is given by the difference between the attachment and detachment rates of Aspn defined as Ra and Rd, respectively. Because the step speed is zero at C0, the difference between Ra and Rd goes to zero and the coverage reaches equilibrium. That is: dθ/dt = Ra - Rd = 0 at C = C0, with Ra = (1-θ)KC and Rd = θνexp(-bEn/kT), where K is a rate constant, b is a unitless factor <1 that relates the desorption energy to the total binding energy En, and ν is the attempt frequency due to thermal fluctuations equal to h/kT where h is Planck’s constant. While the coverage of Aspn reaches equilibrium at C = C0, the factor that determines when step motion is stopped is the fraction of blocked sites, which, for the same fractional coverage θ, is larger for longer chains and is given by the product, f(n)θ, where f(n) describes relationship between chain length and number of blocked sites. (As Fig. 18 shows, the dependence of f(n) on n is weaker than linear.) When C reaches the critical concentration, C0, then f(n)θ reaches a critical fraction, F0. The same relationships hold for F0 as for θ at C=C0. Setting the logarithm of Ra equal to that of Rd and using the above expressions for Ra and Rd above give [19]:
Log[C0] = Log[F0ν/(1-F0)K] – (b/kT)En (10)
Eqn. (10) shows explicitly that, to the extent that Log(K) and b are independent of n, Log[C0] should be linear in En. Indeed, as Fig. 19 shows, the experimentally measured values of C0 have the predicted dependence on En. In principle, the intercept in Fig. 19 contains information concerning both, the rate coefficients, K, and the critical fractions, F0. However, because an independent estimate of one is needed to extract the other, the current study cannot independently estimate either. From a linear fit to the data in Fig. 19 and the expression for the slope of the line (b/kT) in Eq. 1, we estimate that b=10-2, which indicates that the energy barrier is ~1% of the total binding energy En.
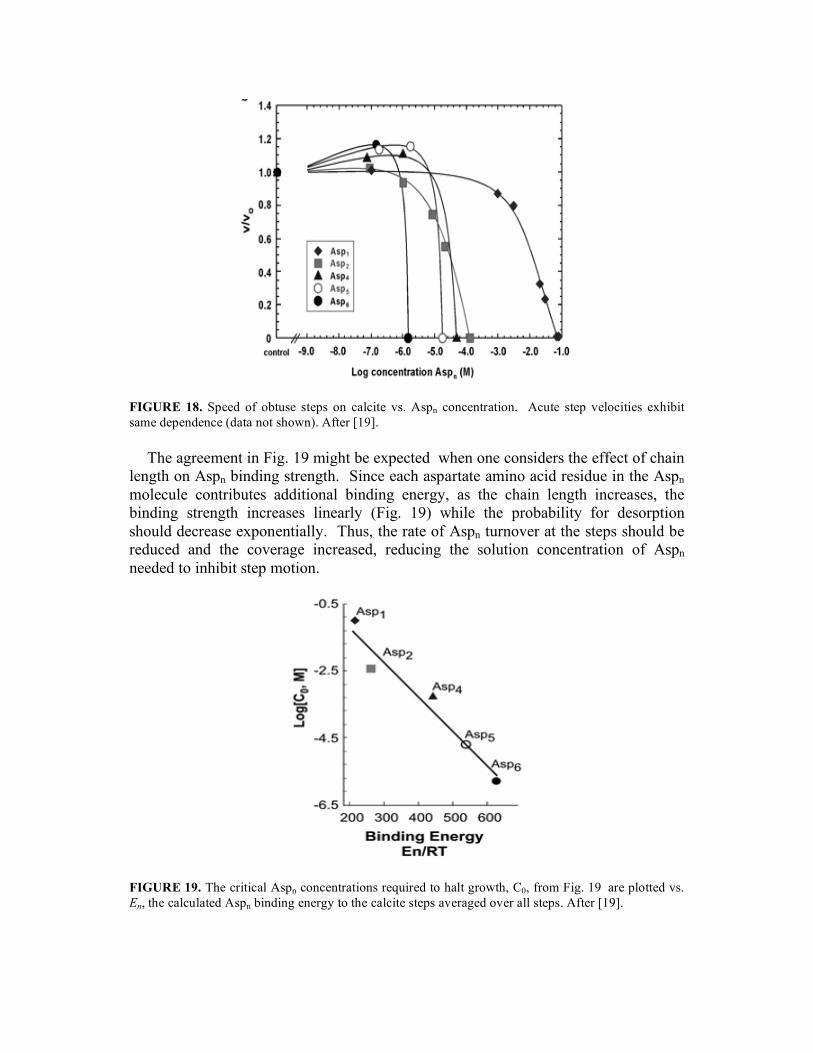
FIGURE 18. Speed of obtuse steps on calcite vs. Aspn concentration. Acute step velocities exhibit same dependence (data not shown). After [19].
The agreement in Fig. 19 might be expected when one considers the effect of chain length on Aspn binding strength. Since each aspartate amino acid residue in the Aspn molecule contributes additional binding energy, as the chain length increases, the binding strength increases linearly (Fig. 19) while the probability for desorption should decrease exponentially. Thus, the rate of Aspn turnover at the steps should be reduced and the coverage increased, reducing the solution concentration of Aspn needed to inhibit step motion.
FIGURE 19. The critical Aspn concentrations required to halt growth, C0, from Fig. 19 are plotted vs. En, the calculated Aspn binding energy to the calcite steps averaged over all steps. After [19].
CONCLUSIONS
The examples reviewed in this chapter show that the mechanisms of growth modification by biomolecules can vary greatly both between systems and even within a single system, depending on the specific chemistry of the modifier as well as its concentration relative to that of the solute itself. None-the-less, in all of the systems we have examined — both the ones discussed here and others — a clear conclusion as to the source of shape modification has emerged: Control of crystal shape arises from step-specific interactions between growth modifiers and individual step edges on pre-existing crystal faces [18]. Moreover, the common appearance of new, rough, rounded faces, which clearly are not facets, results not from stereochemical matching to a particular atomic plane of the crystal, but rather from changes in the elementary step shape that, through the self-replicating process of crystal growth, generate a similarly modified bulk crystal habit. Thus the emergence of new facets and pseudofacets is a macroscopic manifestation of the kinetic implications of molecular scale interactions at the step edges. Having said that, one must recognize that the expression of rough, non-equilibrium surfaces through this process requires the pile up of the modified steps at the edges of the growing facets. None-the-less, these results argue for a shift in the paradigm of stereochemical recognition away from the previous view that the appearance of new shapes and facets arises through matching of the biomolecule to the atomic planes of those new facets, towards a model that recognizes the paramount role of steps on existing faces. In particular, the inherently non-planar nature of these steps provides an environment in which multiple bonding accommodations provide a high degree of coordination and, consequently, a large binding energy for non-planar growth modifiers (Figs. 1(c) and (f)). In making this shift, the terrace-ledge-kink model of Burton-Cabrera and Frank [7] at last merges smoothly with the concept of stereochemical recognition proposed two decades ago [18].
No such common theme can be discerned from the data on kinetic effects. The mechanisms of kinetic modification range from inhibition that increases most strongly at low additive concentration, as is the case with citrate poisoning of COM, to inhibition that appears suddenly at high concentrations, as with Asp rich peptides in the calcite system, and most surprisingly, to growth acceleration at low peptide concentrations. While it is comforting to see that the traditional CV-type and kink poisoning models seem to provide a good explanation in the regime of inhibition, the case of acceleration has no such traditional basis. We have no formalism for growth acceleration that we can compare to the data and are forced to rely on purely phenomenological models. What is most difficult about the challenge of understanding this effect is that is clearly is related to subtle changes in energies that come from a region of crystal-solution interface that is not easily probed. Indeed, the correlation between the magnitude of the acceleration and the charge and hydrophylicity of the peptides reported elsewhere [20] highlights what is amongst the most important challenges for the next decade, namely that of understanding the three-fold structural relationship between protein, solution and mineral surface.
ACKNOWLEDGEMENTS
This work was performed under the auspices of the U.S. Department of Energy by the University of California, Lawrence Livermore National Laboratory, under contract No. W-7405-Eng-48.
REFERENCES
1. S. Mann, Biomineralization: Principles and concepts in bioinorganic materials chemistry, Oxford University Press, New York, 2001, pp. 198.
2. P. M. Dove, J. J. DeYoreo and S. Weiner, Rev. Minerology Geochem, 54, 1-381, (2003). 3. H. D. Holland, B. Lazar and M. McCaffrey, Nature 320, 27-33, (1986). 4. S. Weiner and L. Addadi, Trends in Biological Sciences, 16, 7 (1991). 5. J. R. Hoyer, J. R. Asplin, L. Otvos Jr., Kidney Int. 60, 77-82, (2001). 6. A. A. Chernov, Sov. Phys. Uspekhi, 4, 116-148, (1961); Modern Crystallography III: Crystal
Growth, Springer, Berlin, (1984). 7. W.K. Burton, N. Carbrera and F.C. Frank, Royal Soc. London Philos. Trans., A243, 299-358
(1951). 8. De Yoreo J. J. and P. Vekilov, Rev. Minerology Geochem, 54, 57-94, (2003). 9. C. Herring, Collection: Structure and properties of solid surfaces, McGraw-Hill, New York, 1951
pp. 143. 10. N. Cabrera and D. A. Vermilyea, “The growth of crystals from solution” in Growth and perfection
of crystals, edited by R. H. Doremus, B. W. Roberts and D. Turnbull, Wiley, New York, 1958, pp. 393-410.
11. For a review, see J. J. De Yoreo, S. R. Qiu and J. R. Hoyer, Am. J. Physiology-R. 291, F1123 - F1132, (2006) and references within.
12. S.R. Qiu A. Wierzbicki, Alan Salter, S. Zepeda, C.A. Orme, J.R. Hoyer, G.H. Nancollas, A.M. Cody, and J.J. De Yoreo, J. Amer. Chem. Soc. 127, 9036-9044, (2005).
13. M. Weaver, S.R. Qiu, J.H. Hoyer, W.H. Casey, G.H. Nancollas and J.J. De Yoreo, ChemPhysChem. 7, 2081-2084 (2006); J. Cryst. Growth (In press).
14. H. H. Teng, P. M. Dove, C. A. Orme. and J. J. De Yoreo, Science, 282, 724-727, (1998); Geochim. Cosmochim. Acta, 64, 2255-2266, (2000).
15. C.A. Orme, A. Noy, A. Wierzbicki, M.Y. McBride, M. Grantham, P. M. Dove and J. J. De Yoreo, Nature 411: 775-779, (2001).
16. G. Fu, S. R. Qiu, C. A. Orme, D. E. Morse and J. J. De Yoreo, Adv. Mater., 17, 2678-2683, (2005). 17. K. J. Davis, P. M. Dove and J. J. De Yoreo, Science, 290, 1134-1137, (2000). 18. J. J. De Yoreo, and P. M. Dove, Science 306, 1301 (2004). 19. S. Elhadj, A. Salter, A. Wierzbicki, J.J. De Yoreo, N. Han and P.M. Dove, Cryst. Growth Des. 6,
197-201, (2006). 20. S. Elhadj, P.M. Dove, A. Wierzbicki, J.R. Hoyer and J.J. De Yoreo, Proc. Natl. Acad. Sci., 51,
19237-19242, (2006).


![Visual Analysis of Biomolecular Cavities: State of … · Visual Analysis of Biomolecular Cavities: ... [KKL 15], the methods for ... Krone et al. / Visual Analysis of Biomolecular](https://img.pdfslide.us/doc/110x75/5b5d7e7a7f8b9ad2198e82c2/visual-analysis-of-biomolecular-cavities-state-of-visual-analysis-of-biomolecular.jpg)