Embed Size (px)
Citation preview

USDA Forest Service Proceedings RMRS-P-41. 2006. 673
In: Andrews, Patricia L.; Butler, Bret W., comps. 2006. Fuels Management—How to Measure Success: Conference Proceedings. 2006 28-30 March; Portland, OR. Proceedings RMRS-P-41. Fort Collins, CO: U.S. Department of Agriculture, Forest Service, Rocky Mountain Research Station.
1 L andscape Model i ng A na ly s t with Management & Engineering Technologies, Inc., El Paso, TX. [email protected]
2 Economist at the College of Forestry and Conservat ion, Universit y of Montana, Missoula, MT.
3 Research Forester with the Economic Aspects of Ecosystem Management on Forest Lands research unit of the USDA Forest Service, Rocky Mountain Research Station, Missoula, MT.
4 Economist with the Economic Aspects of Ecosystem Management on Forest Lands research unit of the USDA Forest Service, Rocky Mountain Research Station, Missoula, MT.
5 Cha i r of Forest Management Department at the College of Forestry and Conservat ion, Universit y of Montana, Missoula, MT.
6 Ph.D. student at the College of Forestry and Conservation, University of Montana, Missoula, MT.
Abstract—Utilization of small-sized wood (biomass) from forests as a potential source of renewable energy is an increasingly important aspect of fuels management on public lands as an alternative to traditional disposal methods (open burning). The potential for biomass utilization to enhance the economics of treating hazardous forest fuels was examined on the Bitterroot National Forest and surrounding areas. Initial forest stand conditions were identified from Forest Inventory and Analysis (FIA) data. The Forest Vegetation Simulator (FVS) was used to simulate stand growth and development and estimate removed volumes. Harvest and haul cost models were used to estimate stump to mill costs and these were integrated into MAGIS, a natural resources decision-sup-port system. Temporal and spatial implications of utilization were examined through optimization modeling with MAGIS to identify sustainable quantities and associated costs based on accessibility, haul distance, flow, and quantity of small-diameter mate-rial. This study enables land managers, investors, and policy-makers to make informed economic and environmental decisions regarding biomass as a renewable energy source in the Bitterroot National Forest area and will serve as a model for biomass utilization in other areas.
Introduction
In the western U.S. there are approximately 15.8 million acres of acces-sible forestland that could benefit from mechanical fuel treatments to reduce hazardous fuels and disastrous effects of severe wildfires (USFS 2003). Me-chanical treatments will produce significant quantities of currently sub- and non-merchantable biomass material not suitable for lumber or pulp produc-tion that must be disposed to avoid leaving hazardous fuels in the forest. Traditionally, this biomass has been disposed onsite by burning, which has drawbacks such as potential escape, air quality issues and limited burning windows.
Research has indicated that fuel treatments on public lands have the potential to produce an abundance of biomass (Barbour and others 2004, USDOI Unpublished, USFS 2003), but competitive markets for this material are generally lacking. However, gaining popularity, momentum, and finan-cial feasibility is utilization of this traditional waste material for renewable energy production, specifically, thermal energy production at relatively small scales in rural areas throughout the Western U.S. With the establishment of the Fuels for Schools Program, a collaboration of federal and state agen-cies providing financial subsidies and incentives, small scale thermal energy production facilities are now being constructed (www.schoolsforfuels.org). Other potential uses of biomass are also being investigated (LeVan-Green
Biomass Utilization Modeling on the Bitterroot National Forest
Robin P. Silverstein1, Dan Loeffler2, J. Greg Jones3, Dave E. Calkin4, Hans R. Zuuring5, and Martin Twer6

674 USDA Forest Service Proceedings RMRS-P-41. 2006.
Silverstein, Loeffler, Jones, Calkin, Zuuring, and Twer Biomass Utilization Modeling on the Bitterroot National Forest
and Livingston 2003). Thus, outlets for biomass are forming, providing an alternative to onsite burning.
This paper compares the economic tradeoffs between biomass recovery from fuel treatment for renewable energy production and biomass disposal by open burning in Ravalli County, Montana. We have integrated fuel treatments devised with Bitterroot National Forest personnel with several independent and exogenous models to develop a set of biomass disposal alternatives. These alternatives reflect realistic choices managers must make when determining if biomass utilization for renewable energy production is economically justified or if onsite burning may be the best option. From this notion of alternative disposal options, we have devised a spatial and temporal model of biomass utilization economics based on site distance from a utilization center.
Methods
Study AreaThe location specified for this analysis – the Bitterroot National Forest
in western Montana – was chosen due to a number of economic and envi-ronmental factors it has in common with other communities in the inland western U.S. The area has an abundance of National Forest land, a growing population particularly in the Wildland Urban Interface (WUI), and con-tains a significant amount of forestland categorized as moderately to highly removed from historical wildfire regimes (USFS 2003b). Furthermore, this area is within proximal distance of a modest amount of existing wood products infrastructure with biomass utilization capacity. These include two recently established, small-scale facilities within the study area capable of utilizing biomass for thermal energy, and in adjacent Missoula county to the North, a sawmill and a pulpmill that utilizes biomass as hogfuel.
Silvicultural Treatments Selected for the Bitterroot National Forest
A wide variety of silvicultural treatments are available to land managers to achieve differing fuel treatment objectives. In this analysis we focused on mechanical treatments designed to reduce wildfire effects and restore forests to sustainable and historical conditions, where prescribed burning would not be feasible under present conditions. Discussions with Bitterroot National Forest (BNF) silvicultural and fire management personnel yielded the fol-lowing three prescriptions:
1) Thin from below (TB9) – cut and remove all trees up to a 9 inches diameter breast height (d.b.h.); apply this prescription only to stands having 1) basal area (BA) greater than 50 ft2/ac for trees greater than 9 inches d.b.h., or 2) BA greater than 20 ft2/ac for trees 9 inches d.b.h. or greater where there are at least 109 trees per acre that are 9 inches d.b.h. or less. This prescription may be applied in all stands excluding lodgepole, white pine, grand fir and sub alpine fir.
2) Moderate density (Moderate) – cut and remove all trees up to 7 inches d.b.h., plus some larger diameter trees with a target residual stand having 100 ft2/ac BA in the largest and healthiest trees; apply this prescription
USDA Forest Service Proceedings RMRS-P-41. 2006. 675
Biomass Utilization Modeling on the Bitterroot National Forest Silverstein, Loeffler, Jones, Calkin, Zuuring, and Twer
only to stands having a BA greater than 100 ft2/ac for trees 7 inches d.b.h. or greater. Grand fir and sub alpine fir are removed first, and then the smallest Douglas fir, ponderosa pine and western larch are cut equally until the desired BA is achieved. This prescription may be applied in all stands excluding lodgepole and white pine.
3) Comprehensive restoration (Comprehensive) – cut and remove all trees up to 7 inches d.b.h., plus some larger diameter trees with a tar-get residual stand having 50 ft2/ac in fire resistant tree species such as ponderosa pine, western larch, and large Douglas fir. Remaining tree sizes, numbers, and their locations will restore the stand to a sustain-able structure given current conditions. Apply this prescription only to stands having a BA greater than 50 ft2/ac for trees 7 inches d.b.h. or greater. This prescription was designed for application in ponderosa pine habitat types only.
Timber Volume EstimationForest Inventory and Analysis (FIA, http://www.fia.fs.fed.us/) data were
used to estimate the volume of merchantable logs (7+ inches d.b.h. to a 4.5 inch top) and sub-merchantable biomass (whole trees less than 7 inches d.b.h. and tops and limbs of harvested trees 7+ inches d.b.h.) that would be removed by the three mechanical fuel reduction prescriptions. A whole tree harvest system was assumed. To obtain an adequate amount of stand data, FIA plots were selected from six western Montana counties having forest conditions similar to those found in Ravalli County, yielding a total of 912 FIA plots.
These data were imported into the Northern Idaho/Inland Empire variant of the Forest Vegetation Simulator (FVS, http://www.fs.fed.us/fmsc/fvs/) to predict merchantable timber volumes and biomass harvested from applying each of the three fuel treatment prescriptions described earlier. We assumed that no cut stems, tops, or branchwood were left in the stand, in other words everything cut was removed.
To capture the dynamic aspect of timber stand composition over time, as well as to allow stands to move between vegetation states, the FIA plot growth was simulated using FVS for up to five decades from 1997, the most recent inventory year, to 2007,…, 2047. Each plot was grown from its inventory condition to each of these decadal time periods and then the fuel treatment prescriptions were applied. Based on the forest conditions for applying each of the three treatments, the Comprehensive prescription set consisted of 2,703 plots, the Moderate prescription set had 1,346 plots and the TB9 prescription set had 2,267 plots. Many plots qualified for more than one prescription.
Weights for all merchantable logs that would be removed from the FIA plots by the prescriptions were computed through a combination of the FVS Database Extension, tree component ratio equations from Jenkins and others (2003), and dry cubic foot weights obtained from Reinhardt and Crookston (2004). Quadratic mean diameter (QMD) and trees per acre cut were tal-lied for both the merchantable and non-merchantable categories. The Fire and Fuels Extension was utilized to estimate the weight of the total biomass removed. Subtracting the removed merchantable log weight from the weight of the total biomass removed yielded weight of the sub- or non-merchantable biomass. We assumed that all cut stems and branchwood were removed from the stand (FVS YARDLOSS keyword). Statistics are displayed in tables 1 through 3.

676 USDA Forest Service Proceedings RMRS-P-41. 2006.
Silverstein, Loeffler, Jones, Calkin, Zuuring, and Twer Biomass Utilization Modeling on the Bitterroot National Forest
Table1—Summary statistics of quadratic mean diameter (QMD), cubic feet, trees per acre cut, biomass, and harvest costs for trees removed using the Comprehensive prescription (n=2,703).
HarvestCostperAcre QMD QMD Treesper Treesper Total With Without >7” <=7” CubicFt CubicFt AcreCut AcreCut Removed Biomass Biomass BiomassStatistics DBH DBH >7”DBH <=7”DBH >7”DBH <=7”DBH (drytons) (drytons) Chipping Chipping
Mean 11.93 3.53 1,740.77 269.07 97.69 215.31 39.22 13.09 $1,595 $1,458Std.Error 0.06 0.04 25.06 6.47 1.20 6.59 0.45 0.15 $19 $17 of MeanStd.Deviation 3.13 1.98 1,302.63 336.38 62.57 342.62 23.63 7.97 $980 $897Median 11.27 3.84 1,471.76 148.41 87.64 95.81 36.00 11.81 $1,468 $1,335
Table2—Summary statistics of quadratic mean diameter (QMD), cubic feet, trees per acre cut, biomass, and harvest costs for trees removed using the Moderate prescription (n=1,346).
HarvestCostperAcre QMD QMD Treesper Treesper Total With Without >7” <=7” CubicFt CubicFt AcreCut AcreCut Removed Biomass Biomass BiomassStatistics DBH DBH >7”DBH <=7”DBH >7”DBH <=7”DBH (drytons) (drytons) Chipping Chipping
Mean 10.29 3.71 1,126.87 250.82 80.21 201.11 27.09 10.37 $1,223 $1,117Std.Error 0.07 0.05 28.17 7.91 1.51 8.79 0.51 0.18 $22 $20 of MeanStd.Deviation 2.40 1.89 1,033.35 290.18 55.42 322.38 18.68 6.78 $804 $736Median 9.83 4.01 834.83 155.24 70.38 94.53 23.00 8.95 $1,067 $968
Table3—Summary statistics of quadratic mean diameter (QMD), cubic feet, trees per acre cut, biomass, and harvest costs for trees removed using the TB9 prescription (n=2,267).
HarvestCostperAcre QMD QMD Treesper Treesper Total With Without >7” <=7” CubicFt CubicFt AcreCut AcreCut Removed Biomass Biomass BiomassStatistics DBH DBH >7”DBH <=7”DBH >7”DBH <=7”DBH (drytons) (drytons) Chipping Chipping
Mean 6.93 3.93 261.98 304.70 42.21 250.10 12.30 8.26 $763 $693Std.Error 0.06 0.04 5.38 7.02 0.82 7.55 0.22 0.16 $16 $14 of MeanStd.Deviation 2.77 1.74 255.92 334.10 39.15 359.57 10.36 7.61 $738 $673Median 7.93 4.12 187.99 192.20 32.13 131.55 10.00 6.00 $562 $517
Modeling Treatment CostsTreatment costs (excluding administrative and planning) were modeled for
each application of the three treatments applied to the FIA plots summarized in tables 1 to 3 using the Fuel Reduction Cost Simulator (FRCS, Fight and others 2006). Required FRCS input variables include trees per acre removed, QMD, average tree volume, green wood weight, and residue weight to bole weight fractions. These were calculated from the cut tree lists (tables 1 to 3), regression equations from Jenkins and others (2003) and dry wood weights from Reinhardt and Crookston (2004) adjusted to 50 percent wood fiber

USDA Forest Service Proceedings RMRS-P-41. 2006. 677
Biomass Utilization Modeling on the Bitterroot National Forest Silverstein, Loeffler, Jones, Calkin, Zuuring, and Twer
moisture content. We used the average slope of 22 percent for lands identi-fied through GIS analysis. We specified a whole tree system with an average skidding distance of 800 feet. The model was calibrated to reflect western Montana wage rates – $24.60/hour for fallers and/or buckers and $16.13/hour for all others (2002 dollars, ACINET 2003). The model’s default labor benefit rate of 35 percent was retained, and move-in costs were not included. Tables 1 to 3 display summary statistics from the harvest cost modeling.
Haul Cost Estimation Material delivery costs from the logging unit to an end use facility
can often determine the financial success of mechanical treatment opera-tions. Western Montana is home to several locations that utilize biomass as thermal-energy fuel, and therefore, haul distances are not as great as many other locations. For our analysis we specified two end use locations as des-tinations for the biomass and one end use facility for merchantable logs that resulted from implementing the three fuel reduction prescriptions. These are respectively the towns of Darby in the southern portion of Ravalli County, Frenchtown in western Missoula County and Milltown in southern Missoula County (fig. 1).
Figure 1—Location of delivery points. Darby and Frenchtown for biomass. Milltown for t i m b e r p r o d u c t s . G r a y shaded area is the study area polygons.

678 USDA Forest Service Proceedings RMRS-P-41. 2006.
Silverstein, Loeffler, Jones, Calkin, Zuuring, and Twer Biomass Utilization Modeling on the Bitterroot National Forest
Haul costs were estimated on a per mile basis for each of two types of roads, paved and non-paved, using the Forest Residue Trucking Model (FoRTS; http://www.srs.fs.usda.gov/forestops/) and a GIS road coverage for the study area (Loeffler and others 2006). We further verified our results from FoRTS with the Log Truck Haul Cost Appraisal model (http://www.fs.fed.us/r6/nr/fp/FPWebPage/FP70104A/Programs.htm). Chip truck haul costs were based upon hourly roll-off container truck operating costs and average miles per hour speed, and log truck haul costs were based upon the hourly costs of operating a tractor trailer. We calibrated the haul cost model to reflect local wages and conditions using an average driver wage of $16/hour with 35 percent benefit rate. We assumed the chip truck would haul 16 green tons of chips and the log truck 28 tons, diesel fuel costs $2.50/gallon and oil costs $9/gallon.
We estimated haul costs for log trucks delivering merchantable logs to Milltown (where a mill exists that purchases logs) and roll-off container trucks hauling biomass to both Frenchtown and Darby. Distances in both paved and non-paved miles (total miles is the sum of paved and non-paved) were tallied from the polygons identified in the GIS portion of this analysis to Darby, Frenchtown, and Milltown. Average speeds were estimated at 15 miles per hour on non-paved roads and 45 miles per hour on paved roads. Using these estimates, costs per mile for each road surface type were estimated us-ing the FoRTS model as the quotient of operating costs per driving hour and average miles per hour speed (table 4). Differences in the costs per mile are attributable to changes in variable truck operating costs when combinations of road types change. These average costs per mile were then multiplied by the actual paved and unpaved distances for each polygon to compute unique haul costs for each polygon.
Selection of Analysis AreaGIS data were used to identify the stands in the frequent fire regime class
where mechanical treatment is appropriate and feasible. The current vegeta-tion was represented by the vegetation states assigned to the stand polygons by Chew and others (2004). Based on fuel management objectives, only those vegetation states having the dominant tree species displayed in table 5 were considered for treatment. Additional characteristics of vegetation states included size class (QMD of SS = <5”, Pole = 5” to 8.9”, Medium = 9” to 14.9”, Large = 15” to 20.9”, and Very large = 21”+) and density (crown canopy cover of 1 = 0 to 15%, 2 = 15 to 39%, 3 = 40 to 69%, 4 = 70 to 100%). The FIA plots were categorized into these pre-treatment vegetation states. Since FIA data did not exist for certain vegetation states (21 percent by area), missing data was interpolated through a method of substituting
Table4—Round trip distances and haul cost to the three end use locations.
AverageRoundTripMiles CostperMileEndUseLocations- Non-paved Non-pavedMontanatowns PavedRoads Roads PavedRoads Roads
Darby(chiptruck) 38 13 $1.26 $3.78Frenchtown(chiptruck) 134 16 $1.37 $4.10Milltown(logtruck) 124 16 $1.36 $4.08

USDA Forest Service Proceedings RMRS-P-41. 2006. 679
Biomass Utilization Modeling on the Bitterroot National Forest Silverstein, Loeffler, Jones, Calkin, Zuuring, and Twer
based on proportional data from other vegetation states. From the GIS data we restricted analysis to non-wilderness areas, with slopes less than or equal to 35 percent (based on the requirements of the whole tree ground-based harvest system), only lands categorized as FRCC 2 or 3 (USFS 2003b) and polygons that fell within a 1500 foot buffer of existing roads. The resulting polygons are included in figure 1.
MAGIS Modeling ParametersMAGIS (Multi-resource Analysis and Geographic Information System) is
an optimization model designed to solve complex spatial and temporal sched-uling problems in natural resource management (Zuuring and others 1995). MAGIS is based on a mixed-integer mathematical programming formulation that includes vegetation management options for treatment unit polygons and an optional network component for analyzing road access and associated costs and resource impacts (Weintraub and others 1994). Decision variables for each treatment unit polygon include “no action” and treatment options comprised of alternative management regimes that vary by the treatment(s) they prescribe over time, and the period when the management regime is implemented.
The objective of this study was to analyze the quantities of biomass that could be made available by treating hazardous fuels accessible from existing roads. Haul distances and costs were incorporated into the vegetation man-agement alternatives along with costs of burning biomass on site. Separate decision variables were created for each combination of vegetation manage-ment treatment option (TB9, Moderate, and Comprehensive) and the three options for biomass disposal from the treatments: Burning (pile burning at logging site), biomass hauled to Darby, and biomass hauled to Frenchtown. This resulted in up to nine possible treatment choices for the optimization solver to choose from for each treatment unit polygon.
Vegetation Succession—Successional pathways were used to determine changes in vegetation states in 5 decadal time steps (50 year planning ho-rizon) if no hazardous fuel treatment is undertaken. These predicted states describe the vegetation that would exist when the future treatment options would occur. The most important successional pathways in terms of acres are listed in table 6.
Table5—Tree species combinations selected for analysis.
Dominantspecies Descriptions
DF Douglas-fir(Pseudotsuga menziesii) DF-GF Douglas-fir-Grandfir(Abies grandis) DF-LP Douglas-fir-Lodgepolepine(Pinus contorta) DF-LP-AF Douglas-fir-Lodgepolepine-Subalpinefir(Abies lasiocarpa) L-DF-LP Western larch (Laryx occidentalis)-Douglas-fir-Lodgepolepine L-DF-PP Westernlarch-Douglas-fir-Ponderosapine(Pinus ponderosa) PP Ponderosa pine PP-DF Ponderosapine-Douglas-fir
680 USDA Forest Service Proceedings RMRS-P-41. 2006.
Silverstein, Loeffler, Jones, Calkin, Zuuring, and Twer Biomass Utilization Modeling on the Bitterroot National Forest
Effects Functions—Functions that were used as constraints or objectives by period within the model consisted of the following:
1) Total acreage functions: total acres: treated, treated with TB9, treated with Comprehensive, treated with Moderate, with biomass removal, with pile burning, of FRCC treated (class 2 and 3, tabulated separately), and of WUI treated
2) Cost functions: total costs, cost of biomass removal (stump-to-truck and chipping), site costs (merchantable (stump to truck) and any biomass removal or preparation for pile burning), haul costs of biomass (to Darby or Frenchtown, tabulated separately), haul costs of merchantable (to Milltown), and costs of pile burning
3) Revenue functions: biomass revenue, merchantable revenue, and total revenue
4) Net value functions: total net value (total revenues minus total costs), biomass net value (biomass revenue minus biomass removal and haul costs)
5) Volume/weight functions: merchantable volume and biomass weight
These functions incorporate the volume and cost computations described earlier. The value of delivered merchantable material was set at $2 per cubic foot, and the value of delivered biomass was set at $13 per green ton. Both values were based on current local markets. The cost of pile burning was estimated at $100 per acre.
Results
MAGIS can be used to develop many types of spatial and temporal analy-ses. We present five analyses that capture the economic aspects of utilizing biomass produced by mechanical hazardous fuel treatments. For each, we describe the question, the MAGIS set up and runs made to address the ques-tion, then present the results.
Table6—Pathways for the major vegetation states in the study area.
Habitat Initialdominantspecies, Acres Successionalchanges:resultingdominantgroupa sizeclass,density (1000) species,sizeclass,density
B2 PP, SS, 2 76 4th decade goes to PP, Pole, 2 5th decade goes to PP-DF, Pole, 2
A2 PP, SS, 2 16 3rd decade goes to PP, Pole, 2 5th decade goes to PP, Medium, 2
B2 L-DF-PP, Large, 3 13 no changes B2 L-DF-PP, Medium, 3 12 2nd decade goes to L-DF-PP, Medium, 4 5th decade goes to L-DF-PP, Large, 4
B2 DF, Large, 3 7 no changes B2 DF, Medium, 3 5 2nd decade goes to DF, Large, 3a Habitat group descriptions: A2 is warm and dry, and B2 is moderately warm and dry.

USDA Forest Service Proceedings RMRS-P-41. 2006. 681
Biomass Utilization Modeling on the Bitterroot National Forest Silverstein, Loeffler, Jones, Calkin, Zuuring, and Twer
Maximum Net Value by Treatment PrescriptionThis section investigates the extent to which each of the three mechanical
fuel treatment prescriptions result in a positive net return, and the number of treatment acres expected to result in a positive net return. Three scenarios were run that constrained treatment prescription to biomass utilization first to only the Comprehensive prescription, next to only the Moderate prescrip-tion, and last to only the TB9 prescription. Each scenario optimized on the objective function of maximum net value in period one. The results showed that acres that could be treated with a positive return were 20,984, 56,421, and 60,689 for TB9, Moderate, and Comprehensive, respectively, from 160,954 treatable acres in the study area. The costs, revenues, and net values per acre for these prescriptions are displayed in figure 2. The vast majority of the total revenue predicted for these treatments comes from the commercial component that would be removed. The Comprehensive prescription had an understandably higher net value than the TB9, with the Moderate prescription falling in between, as was expected from the level of commercial products each prescription produces. The net values per acre treated for positive valued units for TB9, Moderate, and Comprehensive were $83, $1,632, and $2,939, respectively, which support the basic findings Fiedler and others (1999) with regard to the economic value of the Comprehensive prescription.
A Spatial View of Economic Importance of Biomass Mill Location
Haul costs are known to be an important economic component in the feasibility of off-site biomass utilization. As such, the location of biomass mar-kets affects the economics of biomass utilization. In this section we compare the economics of biomass utilization with on-site burning for three biomass market scenarios: 1) markets at both Darby and Frenchtown, 2) market only at Darby, and 3) market only at Frenchtown. In each scenario we assume the markets can utilize all the biomass these scenarios would deliver. All three scenarios maximized net value in period one as the objective function and
Figure 2—Costs, revenues and resulting net value for the three mechanical fuel treatment prescriptions applied where they result in positive returns. Site costs include merchantable (stump-to-truck) and any biomass removal (stump-to-truck and chipping) or preparation for pile burning. Haul costs include hauling merchantable material and biomass for biomass scenario. Merch revenue is the revenue for merchantable material.

682 USDA Forest Service Proceedings RMRS-P-41. 2006.
Silverstein, Loeffler, Jones, Calkin, Zuuring, and Twer Biomass Utilization Modeling on the Bitterroot National Forest
constrained acres treated to include all that were treatable. The first scenario (markets at both Darby and Frenchtown) had no other constraints. The sec-ond scenario constrained biomass delivery to Darby only. The third scenario constrained delivery to Frenchtown only.
Results mapped in figure 3, panels a to c, show the most economical disposal of biomass for each polygon. When delivery was allowed to both Darby and Frenchtown, it was most economical to deliver 82 percent (by area treated) of the biomass to centrally located Darby, while the northern 16 percent of biomass went to Frenchtown, north of the study area, and only 2 percent was burned on the peripheral units (fig. 3, panel a). When Darby was the only location, biomass delivery (97 percent) was more economic than burning (3 percent) (fig. 3, panel b). Finally, when Frenchtown was the only location, biomass delivery fell to 57 percent and burning increased to 43 percent (fig. 3, panel c). In this scenario, burning was more cost effective in the southern area away from the northern mill site and the paved delivery routes that run down the center of the study area. This result clearly shows the importance of biomass markets nearer to the forest resources, whereby Darby, with an average haul distance of 25 miles one-way, showed biomass utilization to be profitable in 97 percent of the area, whereas Frenchtown, with an average haul distance of 75 miles one-way, showed biomass utilization to be profitable in only 57 percent of the area.
Figure 3—Spatial view of use of small diameter materials to maximize net value for all treatable acres for three biomass market scenarios: a) markets at both Darby and Frenchtown; b) market at Darby only; and c) market at Frenchtown only. See figure 1 for mill locations.

USDA Forest Service Proceedings RMRS-P-41. 2006. 683
Biomass Utilization Modeling on the Bitterroot National Forest Silverstein, Loeffler, Jones, Calkin, Zuuring, and Twer
Biomass Utilization versus Burning for Selected ZonesWe also compared the economics of utilizing biomass created by mechani-
cal fuel treatments with pile burning within specific zones, first all acres in FRCC class 3, and next in WUI acres. For this comparison, net value was maximized for scenarios that treated all 71,984 acres of FRCC class 3 and all 119,126 acres of WUI with either solely biomass utilization or solely pile burning in period one. Utilizing biomass while treating all FRCC class 3 acres resulted in a positive average net value for applying mechanical fuel reduction treatments, whereas pile burning resulted in a negative average net value. As can be seen in figure 4, the additional revenue came primarily from biomass, which offset increased haul costs enough to show the positive return. The biomass revenue is understandably high in FRCC 3 areas as this indicates a fire regime condition class that has grown with thicker forests which would provide more biomass in these mechanical fuel treatments. Treating WUI acres showed positive net values for biomass utilization and burning, with modest increases from biomass revenue offsetting haul costs (fig. 5). The WUI zone generated higher merchantable revenue than the FRCC 3 zone because of a higher percentage of area in size classes over 9” d.b.h. (27 percent for WUI versus 11 percent for FRCC 3).
Figure 4—Costs, revenues and resulting net value for treatment of all FRCC 3 acres exclusively using biomass utilization or burning. Site costs include merchantable (stump to truck) and any biomass removal (stump to truck and chipping) or preparation for pile burning. Haul costs include hauling merchantable material and biomass for biomass scenario. Merch. revenue is the revenue from merchantable material.
Figure 5—Costs, revenues and resulting net value for treatment of all WUI acres exclusively using biomass utilization or burning. Categories as defined in figure 4.
684 USDA Forest Service Proceedings RMRS-P-41. 2006.
Silverstein, Loeffler, Jones, Calkin, Zuuring, and Twer Biomass Utilization Modeling on the Bitterroot National Forest
Comparing Biomass Utilization with Pile Burning for TB9 on Lands Classified as FRCC 3
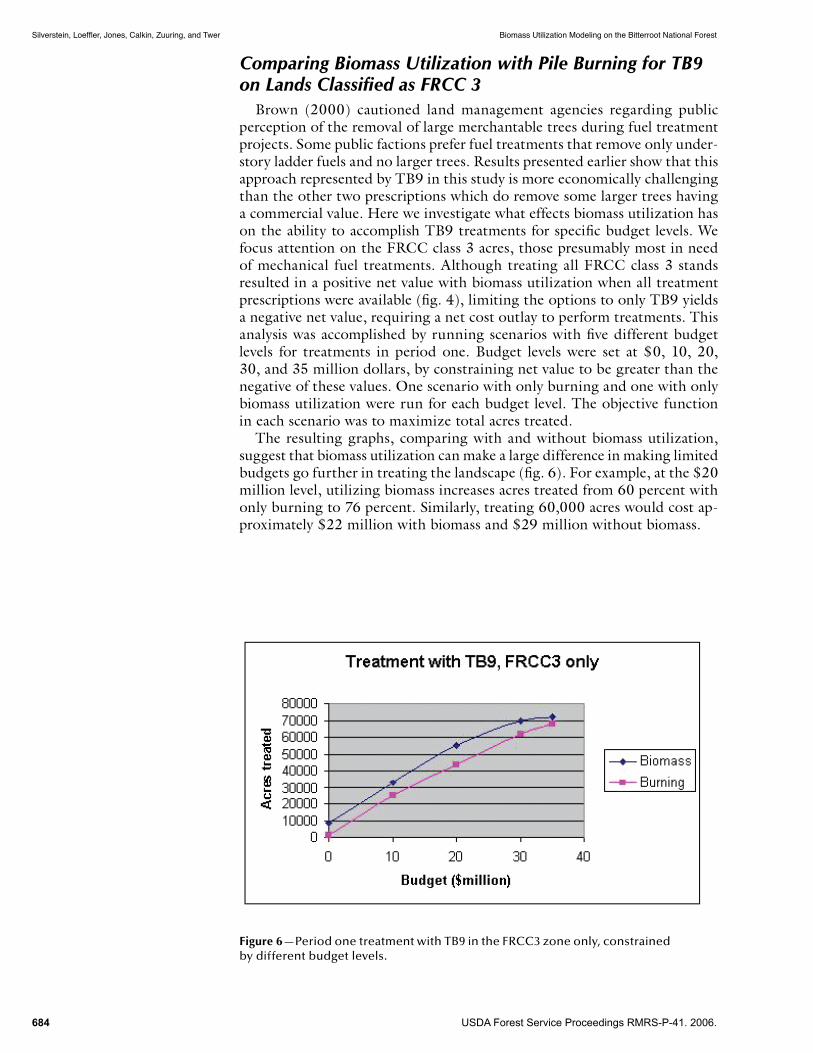
Brown (2000) cautioned land management agencies regarding public perception of the removal of large merchantable trees during fuel treatment projects. Some public factions prefer fuel treatments that remove only under-story ladder fuels and no larger trees. Results presented earlier show that this approach represented by TB9 in this study is more economically challenging than the other two prescriptions which do remove some larger trees having a commercial value. Here we investigate what effects biomass utilization has on the ability to accomplish TB9 treatments for specific budget levels. We focus attention on the FRCC class 3 acres, those presumably most in need of mechanical fuel treatments. Although treating all FRCC class 3 stands resulted in a positive net value with biomass utilization when all treatment prescriptions were available (fig. 4), limiting the options to only TB9 yields a negative net value, requiring a net cost outlay to perform treatments. This analysis was accomplished by running scenarios with five different budget levels for treatments in period one. Budget levels were set at $0, 10, 20, 30, and 35 million dollars, by constraining net value to be greater than the negative of these values. One scenario with only burning and one with only biomass utilization were run for each budget level. The objective function in each scenario was to maximize total acres treated.
The resulting graphs, comparing with and without biomass utilization, suggest that biomass utilization can make a large difference in making limited budgets go further in treating the landscape (fig. 6). For example, at the $20 million level, utilizing biomass increases acres treated from 60 percent with only burning to 76 percent. Similarly, treating 60,000 acres would cost ap-proximately $22 million with biomass and $29 million without biomass.
Figure 6—Period one treatment with TB9 in the FRCC3 zone only, constrained by different budget levels.

USDA Forest Service Proceedings RMRS-P-41. 2006. 685
Biomass Utilization Modeling on the Bitterroot National Forest Silverstein, Loeffler, Jones, Calkin, Zuuring, and Twer
Figure 7—The volume of biomass per decade obtainable with treatments that maximized even-flow net value at different levels.
Even Flow of Biomass Utilization Across Five DecadesIs biomass produced by mechanical fuel treatments sustainable over time?
This is an important question for potential investors in new biomass process-ing facilities. To address this question multiple scenarios were run to identify the maximum sustainable biomass quantity per decade from mechanical fuel treatments over five decades. This was accomplished by constraining the periods 2 through 5 biomass volumes to identical minimum levels and then using the biomass volume in period 1 as the objective function in suc-cessive solutions until the resulting period one biomass volume equaled the constrained level for the other periods. This occurred at 758,800 tons of biomass volume per decade.
Next we looked at the amount of biomass that would be produced at dif-ferent levels of acres treated per decade. These scenarios set constraints at intervals of 5,000 acres treated per decade and used an even-flow of net value as the objective function. The outcome provides economically efficient biomass volumes per decade at different treatment levels (fig. 7). After 15,000 acres per decade, the rate of increase in additional biomass volume with additional acres treated drops as a point of maximum efficiency is reached.
Discussion
Our findings demonstrate that utilizing small diameter wood can enhance the economics of performing fuel treatments to reduce the risk of wildfire and restore forests to natural conditions. By applying a common mechanical fuel treatment prescription, in many instances it is more efficient to extract and utilize the biomass than it is to pile and burn it on site. The breakeven

686 USDA Forest Service Proceedings RMRS-P-41. 2006.
Silverstein, Loeffler, Jones, Calkin, Zuuring, and Twer Biomass Utilization Modeling on the Bitterroot National Forest
point between biomass utilization and pile and burning is dependent on haul distances and costs to biomass markets as shown in the maps presented in figure 3. The advantage of biomass utilization is also present in the thin from below prescription, TB9, which removes very little commercial product. These analyses show that the acres that can be treated by TB9 within a fixed budget can be increased by utilizing the biomass created by the treatment rather than pile and burning it on site.
For this paper we analyzed the economics of biomass utilization when conducting fuel treatments focusing on maximizing net value for the major-ity of the spatial and temporal modeling. However, the principles and the modeling techniques developed here could easily be adopted by managers and planners with different objectives. For example, considerable effort has been invested into determining where best to place fuel treatments to reduce the risk of wildfire (Weise and others 1999, Agee and others 2000, Hof and Omi 2003, Jones and others 2003). Treatment locations can be based on predictions of fire behavior models that do not consider economics (Finney 2001). However, the modeling system presented here is flexible and indices such as crown fire reduction or fire spread rates (Finney 2003) could also be used as the driver to guide treatment placement. With this approach, analy-sis can be conducted that considers both fire behavior (through use of the crown fire reduction or fire spread indexes) and economics in locating places to apply treatments.
For businesses to establish small diameter wood processing facilities, a guaranteed, long term supply is necessary (Stewart and others 2004; Keegan and others 2005). The analysis presented in this paper indicates that with the current fuels conditions and expected growth of forest fuels in the future as quantified in the successional pathways, significant sustainable volumes of biomass could be made available from applying mechanical fuel treatments to acres in need of fuel reduction treatments over the next five decades. The aspect of this question we have not been able to analyze is whether these me-chanical treatments will actually occur on the ground, which on public land is dependent largely on local as well as national political and legal processes.
There are understandable environmental concerns when proposing the removal of vast quantities of woody material from a national forest. Our analysis found the Comprehensive prescription to be the most economically efficient method of treating the landscape and utilizing biomass in the pro-cess. Although this was designed as a prescription for ecological restoration (Fiedler and others 1999), the present political climate which influences man-agement decisions indicates extraction of this much material would likely be controversial, whether or not environmentally sound. The TB9 prescription, on the other hand, has the potential to address the fire danger problem with less controversy, though at higher net costs, as shown here, and perhaps less effectively (Fiedler and others 2003). Furthermore, establishing markets for biomass utilization to face the immediate problem of overstocked forests has the potential to create a future demand for forest products that can not be met in an ecologically sound way once the ecosystems are truly restored. The even-flow analysis indicated this is not an immediate concern in the study area, but ecological restoration may occur much sooner in other locations. Thus, the question of sustainability is important for environmental as well as economic reasons, and would be an important direction for further research to expand on what we have begun here.
USDA Forest Service Proceedings RMRS-P-41. 2006. 687
Biomass Utilization Modeling on the Bitterroot National Forest Silverstein, Loeffler, Jones, Calkin, Zuuring, and Twer
Literature Cited
ACINET. 2003. America’s Career Infonet. Available at: http://www.acinet.org/acinet/default.asp
Agee, J. K.; Bahro, B.; Finney, M. A.; Omi, P. N.; Sapsis, D. B.; Skinner, C. N.; van Wagtendonk, J. W.; Weatherspoon, C.P. 2000. The use of fuel breaks in landscape fire management. Forest Ecology and Management. 127:55-66.
Barbour, R. J.; Fight, R. D.; Christensen, G. A.; Pinjuv, G. L.; Nagubadi, R. V. 2004. Thinning and prescribed fire and projected trends in wood product potential, financial return, and fire hazard in Montana. PNW-GTR-606. U.S. Department of Agriculture, Forest Service, Pacific Northwest Research Station.
Brown, R. 2000. Thinning, fire, and forest restoration: A science-based approach for national forests in the interior Northwest. Defenders of Wildlife. Portland, OR. 26p.
Chew, J. D.; Stalling, C.; Moeller, K. 2004. Integrating knowledge for simulating vegetation change at landscape scales. Western Journal of Applied Forestry. 19:102-108.
Fiedler, C. E.; Keegan, C. E. III; Wichman, D. P.; Arno, S. F. 1999. Product and economic implications of ecological restoration. Forest Products Journal. 42(2):19-23.
Fiedler, C. E.; Keegan, C. E. III; Morgan, T. A.; Woodall, C. W. 2003. Fire hazard and potential treatment effectiveness: a statewide assessment in Montana. Journal of Forestry. 7(2):7.
Fight, R. D.; Hartsough, B. R.; Noordijk, P. 2006. Fuel Reduction Cost Simulator. Beta version.
Finney, M. A. 2001. Design and regular landscape fuel treatment patterns for modifying fire growth and behavior. Forest Science. 47:219-228.
Finney, M. A. 2003. Calculation of fire spread rates across random landscapes. International Journal of Wildland Fire. 12(2):167-174.
Hof, J.; Omi, P. 2003. Scheduling removals for fuels management. In USDA Forest Service Proceedings RMRS-P-29: 367-378.
Jenkins, J. C.; Chojnacky, D. C.; Heath, L. S.; Birdsey, R. A. 2003. National-Scale Biomass Estimators for United States Tree Species. Forest Science, 49(1):12-35.
Jones, G.; Chew, J.; Silverstein, R.; Stalling, C.; Sullivan, J.; Troutwine, J.; Weise, D.; Garwood, D. 2003. Spatial analysis of fuel treatment options for chaparral on the Angeles National Forest. In: USDA Forest Service Gen. Tech. Rep. PSW-GTR (in press).
Keegan, C. E. III; Morgan, T. A.; Wagner, F. G.; Cohn, P. J.; Blatner, K. A.; Spoelma, T. P.; Shook, S. R. 2005. Capacity fur utilization of USDA Forest Service, Region 1 small-diameter timber. Forest Products Journal. 55:143-147.
LeVan-Green, S. L.; Livingston, J.M. 2003. Uses of small-diameter and low-value forest thinnings. Ecological Restoration. 21:34-38.
Loeffler, D.; Calkin, D. E.; Silverstein, R. P. 2006. Estimating Volumes and Costs of Forest Biomass in Western Montana Using Forest Inventory and Geospatial Data. Forest Products Journal [in press].
Reinhardt, E. D.; Crookston, N. L. 2004. The Fire and Fuels Extension to the Forest Vegetation Simulator, Addendum. RMRS-GTR-116. USDA Forest Service Rocky Mountain Research Station.
Stewart, H.G.; Blatner, K. A.; Keegan, C. III. 2004. Risk and feasibility of processing small-diameter material in the U.S. West Part II: market pulp and oriented strandboard. Forest Products Journal. 54:104-108.

688 USDA Forest Service Proceedings RMRS-P-41. 2006.
Silverstein, Loeffler, Jones, Calkin, Zuuring, and Twer Biomass Utilization Modeling on the Bitterroot National Forest
USDOI. Unpublished. Biomass Energy Opportunities on Public Lands.
Available at: http://www.blm.gov/nhp/efoia/wo/fy04/im2004-227attach3.pdf
USFS. 2003. A Strategic Assessment of Forest Biomass and Fuel Reduction Treatments in Western States. http://www.fs.fed.us/research/infocenter.html
USFS. 2003b. USDA Forest Service Northern Region National Fire Plan Cohesive Strategy Geospatial Database. http://www.fs.fed.us/r1/cohesive_strategy/datafr.html
Weintraub, A.; Jones, G.; Magendzo, A.; Meacham, M.; Kirby, M. 1994. A heuristic system to solve mixed integer forest planning models. Operations Research. 42:1010-1024.
Weise, D. R.; Kimberlin, R.; Arbaugh, M.; Chew, J.; Jones, G.; Merzenich, J.; Van Wagendonk, J. W.; Wiitala, M. 1999. A risk-based comparison of potential fuel treatment trade-off models. In: Neuenschwander, L. F.; Ryan, K. C.; Gollberg, G. E. (Eds.), Proceedings from the Joint Fire Science Conference and Workshop, Crossing the Millennium: Integrating Spatial Technologies and Ecological Principles for a New Age in Fire Management. Vol. II, Boise, ID. June 15-17, 1999. The University of Idaho and the International Association of Wildland Fire: 96-102.
Zuuring, H. R.; Wood, W. L.; Jones, J. G. 1995. Overview of MAGIS: a multi-resource analysis and geographic information system. USDA Forest Service Research Note, INT-427.