Embed Size (px)
Citation preview

Allwright et al. Biotechnol Biofuels (2016) 9:195 DOI 10.1186/s13068-016-0603-1
RESEARCH
Biomass traits and candidate genes for bioenergy revealed through association genetics in coppiced European Populus nigra (L.)Mike Robert Allwright1, Adrienne Payne1, Giovanni Emiliani2, Suzanne Milner1, Maud Viger1, Franchesca Rouse1, Joost J. B. Keurentjes3, Aurélie Bérard4, Henning Wildhagen5, Patricia Faivre‑Rampant4, Andrea Polle5, Michele Morgante6,7 and Gail Taylor1*
Abstract
Background: Second generation (2G) bioenergy from lignocellulosic feedstocks has the potential to develop as a sustainable source of renewable energy; however, significant hurdles still remain for large‑scale commercialisation. Populus is considered as a promising 2G feedstock and understanding the genetic basis of biomass yield and feed‑stock quality are a research priority in this model tree species.
Results: We report the first coppiced biomass study for 714 members of a wide population of European black poplar (Populus nigra L.), a native European tree, selected from 20 river populations ranging in latitude and longitude between 40.5 and 52.1°N and 1.0 and 16.4°E, respectively. When grown at a single site in southern UK, significant Site of Origin (SO) effects were seen for 14 of the 15 directly measured or derived traits including biomass yield, leaf area and stomatal index. There was significant correlation (p < 0.001) between biomass yield traits over 3 years of harvest which identified leaf size and cell production as strong predictors of biomass yield. A 12 K Illumina genotyping array (constructed from 10,331 SNPs in 14 QTL regions and 4648 genes) highlighted significant population genetic struc‑ture with pairwise FST showing strong differentiation (p < 0.001) between the Spanish and Italian subpopulations. Robust associations reaching genome‑wide significance are reported for main stem height and cell number per leaf; two traits tightly linked to biomass yield. These genotyping and phenotypic data were also used to show the pres‑ence of significant isolation by distance (IBD) and isolation by adaption (IBA) within this population.
Conclusions: The three associations identified reaching genome‑wide significance at p < 0.05 include a transcription factor; a putative stress response gene and a gene of unknown function. None of them have been previously linked to bioenergy yield; were shown to be differentially expressed in a panel of three selected genotypes from the col‑lection and represent exciting, novel candidates for further study in a bioenergy tree native to Europe and Euro‑Asia. A further 26 markers (22 genes) were found to reach putative significance and are also of interest for biomass yield, leaf area, epidermal cell expansion and stomatal patterning. This research on European P. nigra provides an important foundation for the development of commercial native trees for bioenergy and for advanced, molecular breeding in these species.
Keywords: Short rotation coppice (SRC), Yield, Lignocellulosic, Genetics, Salicaceae, Leaf area
© 2016 The Author(s). This article is distributed under the terms of the Creative Commons Attribution 4.0 International License (http://creativecommons.org/licenses/by/4.0/), which permits unrestricted use, distribution, and reproduction in any medium, provided you give appropriate credit to the original author(s) and the source, provide a link to the Creative Commons license, and indicate if changes were made. The Creative Commons Public Domain Dedication waiver (http://creativecommons.org/publicdomain/zero/1.0/) applies to the data made available in this article, unless otherwise stated.
Open Access
Biotechnology for Biofuels
*Correspondence: [email protected] 1 Centre for Biological Sciences, Life Sciences Building, University of Southampton, Southampton SO17 1BJ, UKFull list of author information is available at the end of the article

Page 2 of 22Allwright et al. Biotechnol Biofuels (2016) 9:195
BackgroundShort rotation coppice (SRC) or short rotation forestry (SRF) Populus is widely considered as a promising ligno-cellulosic feedstock for second generation biofuel pro-duction [1, 2]; being fast growing [3], widespread in the northern hemisphere [4], genetically diverse [5, 6], read-ily transformed [7] and already established as a model tree species [8, 9]. Mapping pedigrees and genetic linkage maps [10–13] exist for a number of Populus species [14] and the P. trichocarpa genome, which at around 550 Mb is small for a forest tree [15], has been fully sequenced [16]. A number of bioinformatics tools assist in the exploration and utilisation of these genetic and genomic resources; including PopGenIE [17] and POParray [18]. Most recently Populus became the first forest tree for which CRISPR/Cas genome editing has been success-fully demonstrated [19]. This offers significant potential and suggests that candidate genes identified for traits of interest could be progressed rapidly to commercialisation using such accelerated molecular breeding approaches [14].
Considerable research effort has been employed to elucidate the genetic basis of phenotypes of interest in Populus with much focus on mapping quantitative trait loci (QTL) for cell wall composition [20]; biomass yield [1, 21, 22]; biomass distribution [23]; drought tolerance [24, 25]; water-use efficiency (WUE) [26]; pest resistance [13]; bud set and flush [27, 28] and responses to nitrogen deficiency [29], elevated CO2 [30, 31] and ozone [32]. Recently, however, inbred mapping pedigrees, which are limited in their recombination events and QTL size in out-breeding populations such as Populus, have been replaced with wide natural populations that are particu-larly beneficial for trees since they capture increased genetic variation [33]. This includes the mapping popu-lation utilised in this work; with genotypes drawn from across the western European range for this native tree. Research in this genetic background is particularly important given the tendency for Populus commerciali-sation to be focussed on F1 hybrids originating outside Europe [14] and because climate change will require more resilient germplasm planting that will only emerge from a better understanding of the genetic basis of adap-tive traits such as biomass production [34].
Association mapping is a powerful technique for elu-cidating the genetic basis of qualitative and quantitative traits in species of interest, seeking statistical associations between genotypic markers (generally single nucleotide polymorphisms, SNPs) and defined phenotypic quali-ties within a population [33]. Such associations exist as a result of linkage disequilibrium (LD), defined as the non-random association of alleles at different loci, by which the genotype present at one locus is not independent of
another locus [34–36]. LD can result from genetic link-age (i.e. a close physical genomic association reducing or eliminating recombination between two polymorphisms during meiotic division); selection (natural or artificial) and admixture; all of which perturb linkage equilibrium [35, 37]. LD underpins all association genetics studies and can allow the identification or confirmation of can-didate genes contributing to the phenotype in question and provide genetic markers to assist in selective breed-ing efforts [38]. LD in this population has been previously shown to decay rapidly with the value of r dropping to half its maximum value within 4 kb [39].
Whilst association mapping can be performed within targeted areas of a genome; for example within candidate genes [40]; falling costs and rapid progress in sequencing and genotyping methods [41, 42] have increased the prev-alence of genome-wide association studies (GWAS). Next generation sequencing (NGS) techniques allow large numbers of single nucleotide polymorphisms (SNPs) to be identified within a genome and high-throughput SNP arrays (‘chips’) allow many individuals to be genotyped for multiple markers simultaneously [43]. A number of recent publications in P. trichocarpa have made use of a 34 K array covering 3543 genes [44] in GWAS for wood quality [45], biomass, ecophysiology, phenology [46, 47] and disease resistance [48] traits. This array has also been employed in understanding the impact of geographical and environmental factors on phenotypic variation and genetic structure within P. trichocarpa across its North American range [49].
Studies in P.trichocarpa exceed those published in any other Populus species, however, in Europe, Populus nigra L. (black poplar) is the native cottonwood (Aigeiros); also found across North Africa and Central Asia [50, 51]. It is an ecologically important and endangered riparian, pioneer species [52–54]; for which only extremely small-scale candidate gene association studies have previously been reported. For example, Guerra et al. [55] used 433 SNPs from 39 candidate genes for cellulose and lignin biosynthesis to genotype an association population of 599 individuals; identifying 6 trait-marker associations. It follows that prior to the development of the genotyping array utilised here [39] the study of population structure within its European range had been restricted to analysis of small numbers of AFLP and microsatellite markers [53, 54]. Understanding population structure is an important consideration for conducting GWAS [56] and providing robust trait-associated markers for subsequent advanced breeding programmes [57, 58]; as well as being of value for conservation efforts in threatened species such as this one [54, 59, 60].
The aim of this research was to elucidate the links between biomass traits and their underlying genetic
Page 3 of 22Allwright et al. Biotechnol Biofuels (2016) 9:195
architecture. In particular we aim to unravel complex traits considered important for the development of the native black poplar as a sustainable source of lignocel-lulosics for the bioenergy industry, particularly across Europe where native species are likely to be preferred. This work describes the first use of phenotyping and genotyping data together from a 12K Illumina Infinium genotyping array which provides SNP markers an order of magnitude greater in number than previous studies in P. nigra and with coverage of a far greater proportion of the genome. We focus on traits with moderate to high heritability and considered to be underpinning biomass production including leaf development, stomatal pat-terning, height and stem volume index [31, 61] as well as saccharification potential [62]. These genetic and phe-notypic datasets have been considered together in the first GWAS study in this species, identifying candidate genes for bioenergy traits as well as valuable insight into the challenges and opportunities for further such studies in both this and other significantly structured and geo-graphically disparate populations.
MethodsMapping population and UK field trialThe P. nigra population [54, 63, 64] is a wide, natural population of more than 1000 diverse genotypes drawn from riparian ecosystems across Western Europe; namely France, Italy, Spain, Germany, Netherlands and Hun-gary [39, 65]. Cuttings taken from mature trees in situ were established and propagated in a stool bed at INRA, UAGPF, Orléans and ramets from this stool bed, estab-lished for more than 5 years, were cut and established for this work in a field trial (common garden) in Northing-ton, south-east UK; (51°12′N, 1°21′E) in 2009. It is pos-sible that sites of propagation can significantly influence structural and functional aspects of the genome in clon-ally propagated Populus, including response to drought stress [66]. In this study, however, sourcing all plant material for this trial from a stable, well established stool bed should act to minimise this variation, although it cannot be entirely ruled out. Such effects may otherwise bias estimates of heritability, inter-trait correlations and genetic potential in common garden experiments [67]. 931 genotypes (714 genotyped on the Illumina array rep-resenting 20 sampled sites) were planted at 0.80 × 0.80 m spacing in double rows, spaced by 3 m. The site was laid out in six fully replicated, randomised blocks with 4 rows per block and a double row of guards surrounding the site as a whole. Trees were coppiced to 5 cm in Febru-ary 2010 and 2013 and received mechanical weed con-trol as required. No fertiliser was applied at any time or irrigation post establishment, although trees were irri-gated in 2009. The latitude and longitude of the sampled
subpopulations and their sample sizes (n) are provided in Table 1; a map of the region from which the population is drawn is shown in Fig. 1.
Phenotyping for bioenergy‑related traitsAs shown in Additional file 1: Figure S1, in February 2011 (1st year of growth post 1st coppice), February 2012 (2nd year of growth post 1st coppice) and November 2013 (1st year of growth post 2nd coppice) leading stem height and all primary stem diameters (22 cm above the ground) were measured for all trees for all genotypes and used to calculate stem-volume index (SVI) as a proxy to biomass yield [68] according to the equations:
Area of individual stem (An)
(
mm2)
=(
D/
2)2
∗ π
Total basal area (BA) =∑
(A1,A2, . . .An)
SVI(
cm3)
= BA ∗H
Table 1 Sites of Origin (SO) for P. nigra association map-ping population at Northington, UK
Subpopulation names are given in the first column followed by the country within which they are located. The number of individual genotypes within each subpopulation is provided (N) and their mean latitudinal and longitudinal coordinates for statistical analysis and calculation of pairwise geographic distances. “Individuals” are unique genotypes from outside of the given subpopulations
SO Nation N Latitude°N Longitude°E
Basento Italy 16 40.5 16.4
Paglia Italy 21 42.8 11.8
Ticino‑North Italy 56 45.3 9.0
Ticino‑South Italy 37 45.2 9.1
Bonny France 33 47.6 2.8
Dranse France 35 46.4 6.5
Drome 1 France 55 44.7 5.4
Drome 6 France 53 44.8 4.9
Erstein France 13 48.4 7.7
Guilly France 31 47.8 2.3
Ramieres France 37 44.7 4.9
Rhinau France 19 48.3 7.7
Loire France 44 46.4 3.2
Strasbourg France 18 48.6 7.8
Taubergiessen France 4 48.3 7.7
Val Allier France 134 46.4 3.3
Ebro‑Alfranca Spain 24 41.6 1.0
Ebro‑Novillas Spain 24 41.9 1.4
Kuhkopf Germany 33 49.8 8.5
Netherlands Netherlands 23 52.1 5.7
Individuals France (2), Italy (1), Hungary (1)
4 – –

Page 4 of 22Allwright et al. Biotechnol Biofuels (2016) 9:195
where H is the height of the leading stem and n is the number of primary stems (i.e. all stems which originate from the original main stem). Additionally, following the 2013 measurements 50 trees were cut, oven-dried for 48 h at 105 °C and weighed to allow estimated oven-dry biomass (EB) to be calculated from SVI (see Additional file 1: Figure S2). In August 2012 (3rd year of growth post 1st coppice) main stems from each tree were sam-pled at 1 m above the ground and assayed for wood sac-charification potential (SP) according to the methodology described by Van Acker et al. [69]. In brief debarked, air-dried samples were milled in a Retsch 300MM Mixer Miller with the resultant powder sieved and the frac-tion falling between 150 and 850 µm retained. Moisture content was calculated from weight loss of an aliquot of each sample after oven-drying at 105 °C and desiccation to reach a constant weight. A 10 mg sample of un-dried powder underwent acid pre-treatment and ethanol wash steps followed by 48 h saccharification with fungal cel-lulose (Trichoderma reesei) and cellobiase (Aspergillus niger) enzymes (Sigma-Aldrich, USA) at 55 °C in a rotat-ing thermomixer. Supernatant was assayed with GOD-POD (glucose oxidase, horseradish peroxidase and ABTS dye) solution [69, 70] which undergoes a colour change on reaction with glucose through the oxidation of the
ABTS dye; thus permitting spectrophotometric (ELx800 Absorbance Reader, BioTek, USA) glucose quantification from sample absorbance at 405 nm. SP is calculated as sample glucose yield as a percentage of post pre-treat-ment oven-dry weight.
In August 2013 (1st year of growth post 2nd coppice) the first, mature leaf was sampled from the main stem for all genotypes in the course of a single week and imaged. Epidermal cell imprints were taken from the abaxial leaf surface using clear nail varnish and Sellotape® and mounted on glass slides as described previously [30]. Slides were viewed with a Zeiss light microscope and imaged with a mounted digital camera. Image J [71] was used to find mature leaf area (LA) from the scanned leaf images [24, 72] and to find epidermal cell area (CA; cal-culated as the mean average of ten cells per image) and epidermal cell (ECD) and stomatal densities (SD) from the abaxial imprint images [30, 73]. These were used to calculate stomatal index (SI) according to the equation:
And epidermal cell number per leaf (CNPL) according to the equation:
SI(%) =[
SD/
(SD+ ECD)]
∗ 100
CNPL = LA/
CA
Fig. 1 Map illustrating the nations and major river locations from which the P. nigra association population is drawn and the colours employed to illustrate these nations in subsequent figures

Page 5 of 22Allwright et al. Biotechnol Biofuels (2016) 9:195
Additionally, the leaves were oven-dried at 80 °C for 48 h and weighed enabling specific leaf area (SLA) to be calcu-lated according to the equation:
Statistical analysisFor each trait only genotypes with measurements for at least two replicates and which had been genotyped on the Illumina array were considered in statistical analyses; this in view of the risk of undetected clonal duplication from nature among so-called ‘unique’ ungenotyped indi-viduals in this species [39, 52, 54]. Traits were tested for normality and transformed as required before a general linear model (GLM) was conducted for each in SPSS’ [74] “univariate” GLM function:
where µ is the group mean, Si is the effect of site of origin i (SO, see Table 1) considered as fixed and Gj(i) and Bk are the effects of genotype j (nested within SO) and block k, respectively; both considered as random. In the case of saccharification potential where sample processing was completed in multiple runs over several weeks the fac-tor ‘Run’ was additionally included as a random effect to account for laboratory drift. Individual genotypes (singlet genotypes not sampled from a defined river population) were excluded from this analysis but included in GWAS. In view of the significant block effect (Bk) found for all traits (Additional file 3: Table S1) the ‘EMMEANS’ func-tion was employed in SPSS [74] to provide block adjusted estimated marginal means for each genotype for each trait and these were used for all subsequent, downstream analyses. Minitab [75] was used to find Pearson’s corre-lation coefficient (r) for pairwise correlations between traits and with latitude and longitude of origin.
Genotyping dataThe genotyping data utilised in this work arises from a 12 K Illumina Infinium II Genotyping BeadChip array and full details of the DNA extraction, sequencing, design and quality testing for which have been recently reported [39]. In summary, SNPs were called from the re-sequencing and alignment of 51 P. nigra genotypes (4 high coverage individuals, >25× and 47 low coverage individuals, 2–21×). SNPs selected for the array were drawn from 14 QTL regions and 2916 candidate genes (based on transcriptome studies and the literature) for biomass yield, bud phenology, wood quality, rust resist-ance and water-use efficiency traits as well as 1732 addi-tional gene models spread throughout the genome [39]. The population (1106 individuals of which 714 are con-sidered in this work) was genotyped using this array
SLA(
mm2/
g)
= LA/
Leafmass
Yijk = µ+ Si + Gj(i) + Bk + εijk
according to Illumina’s Infinium protocol. After Illumina technical dropout 9127 SNPs (88 % of initial 10,331) remained on the array of which 8259 (located within 4903 genes, average of 1.68 SNPs per gene [39]) were pol-ymorphic and showed good quality genotype clustering and signal intensity. A further 593 SNPs were removed as unsuitable for GWAS as follows: no minor allele homozy-gotes (208); failed heritability-based SNP validation (165); GenTrain score <0.50 (208); SNP not assigned to one of 19 linkage groups (11) and duplicated marker on array (1). The resulting 7666 SNP marker set for the 714 individuals cultivated and phenotyped at the Northing-ton site was filtered in TASSEL [76] to remove markers with minor allele frequency (MAF) <0.05; minimum call rate <0.90 and heterozygote frequency >0.95 to produce a final marker set of 7343 informative SNPs for association analyses (Additional file 2).
Population Genetic StructureThe 7343 SNP marker set was further filtered for popu-lation genetic structure analysis. First, markers were fil-tered for Hardy–Weinberg equilibrium (HWE) in R using the function ‘HWChisqMat’ in the package ‘Hardy–Weinberg’ [77]. This provided 4029 markers of which 3279 had complete information (no missing data). These markers were then filtered in PLINK [78] for linkage dis-equilibrium (LD) at r2 < 0.2 [47, 79] to produce a second, reduced marker set of 2390 putatively neutral, unlinked SNPs for genetic structure analyses.
Genetic structure was investigated by three approaches:I. The reduced marker set (2390 markers) was entered
in the program STRUCTURE [80] which employs model-based clustering for inferring population structure from genotyping marker data. It may be utilised to estimate the value of K, i.e. the number of subpopulations or clus-ters of genotypes within a population and to produce a Q-matrix in which individual genotypes are probabilis-tically assigned to K clusters with the proportional like-lihood of membership of a given cluster expressed as a decimal between 0 and 1 and with individual probabili-ties summing to 1 across all clusters for a given genotype. In this instance STRUCTURE’s admixture model with correlated allele frequencies [81] was used to model K’s 1–10 (to ensure the capture of the true value of K) with ten iterations for each value of K and 20,000 burn-in and 100,000 run-length for each iteration. The ‘Struc-ture Harvester’ tool at UCLA [82] was then used to find the best estimate for the true value of K according to the method of Evanno et al. [83].
II. Principal component analysis (PCA) of genetic variance in the R package ‘prcomp’ [84] was performed using both the full (7343 SNPs) and reduced (2390 SNPs) marker sets. The number of significant principal

Page 6 of 22Allwright et al. Biotechnol Biofuels (2016) 9:195
components was determined by a broken stick model [85] implemented in the R package ‘vegan’. The significant principal components from the reduced marker set were employed in genetic structure correction in GWAS model II (see below). The eigenvalue loadings from the PCA of the full marker set were used to identify top loading SNPs (top 0.2 % of eigenvalues, 15 SNPs) for PC1 and 2 with a view to locating chromosomal regions enriched in mark-ers related to population genetic differentiation [49].
III. Pairwise FST (genetic distance) estimates were cal-culated between the 20 represented sampled populations in the program Arlequin 3.5 [86]. A PCA was performed on the biomass and leaf trait data (i.e. excluding SP for which the Dranse sub-population was not represented) and Euclidian distances calculated between the 20 sub-populations using the first 2 PCs of the phenotypic variation. Pairwise geographic distances between sub-populations were calculated using the haversine formula [87]. Simple and partial Mantel tests [88–90] were then conducted in Arlequin (1000 permutations) between these three pairwise distance matrices where the correla-tion coefficient between genetic and geographic distances controlling for phenotypic distance (Gen, Geog|Pheno) is considered a measure of isolation by distance (IBD) and the correlation coefficient between genetic and pheno-typic distances controlling for geographic distance (Gen, Pheno|Geog) is considered a measure of isolation by adaption (IBA) [91].
Meff, GWAS, model selection and heritabilityEffective marker number (Meff) in the full 7343 marker set (accounting for non-independence between mark-ers arising from LD) was calculated in the Genetic type 1 Error Calculator (GEC) which provides a robust estima-tion of the number of independent tests being performed for multiple test correction in GWAS; so as to control the genome-wide type 1 error rate at 0.05 [92]. The genome-wide significance level for trait-marker associations from the models below was then calculated as α = 0.05/Meff. Meff was found to equal 5690 and thus the threshold was calculated as α = 8.79 × 10⁻⁶.
Six distinct models were considered for GWAS and executed in TASSEL [76] for all traits using the full marker set. MLMs (models 4 and 5) were run using opti-mum compression:
1. Simple general linear model (GLM) without correc-tion for population genetic structure:
where Y is a vector of phenotypic values; β is an unknown vector containing fixed effects for genetic markers; X is the known design matrix and e is the unobserved vector of random residuals.
Y = Xβ + e
2. GLM using significant PCs from reduced marker set PCA for genetic structure correction (P-model) with notation as for model I but β contains fixed effects for both genetic markers and population structure (PCs).
3. GLM using Q-matrix with optimal K from STRUC-TURE for genetic structure correction (Q-model) with notation as for model II but population fixed effects in β derived from Q-matrix instead of PCs.
4. Mixed linear model (MLM) with a kinship matrix created from the reduced, 2390 marker set using the Effi-cient Mixed Model Association (EMMA) algorithm [56] in the R package ‘GAPIT’ [93] for genetic structure cor-rection (K-model):
where Y is a vector of phenotypic values; β is an unknown vector containing fixed effects for genetic markers; u is an unknown vector of random additive genetic effects; X and Z are the known design matrices and e is the unob-served vector of random residuals.
5. The full animal model [94] MLM using Q-matrix from STRUCTURE and EMMA kinship matrix for genetic structure correction (Q + K-model) with nota-tion as for model IV but β contains fixed effects for both genetic markers and population structure (Q-matrix).
6. Full animal model MLM using significant PCs of genetic variation and EMMA kinship matrix for genetic structure correction (P + K-model) with notation as for model IV but β contains fixed effects for both genetic markers and population structure (PCs).
To determine the most appropriate of the above mod-els for identifying reliable trait-marker associations on a trait-specific basis the unified mixed model framework used by McKown et al. [47] was employed; utilising the Bayesian Information Criterion (BIC) to compare log-likelihood values between models [95]. This was per-formed in R using the functions ‘lm’ and ‘lmekin’ in the packages ‘coxme’ [96] and ‘MuMIn’ [97].
The R package ‘heritability’ [98] was employed to cal-culate h2 for each phenotype using the individual obser-vations for each genotypic replicate (transformed for normality). The function ‘marker_h2′ was used to fit a mixed model using the EMMA kinship matrix and the seven significant principle components of the genetic variation as covariants. Narrow sense heritability is cal-culated according to the equation:
where σg2 is the additive genetic variance and σr
2 is resid-ual (error) variance such that σg
2 +σr2equates to the total
model variance. Trait heritabilities were regressed against
Y = Xβ + Zu+ e
h2 = σ 2/(
σ 2g + σ 2
r
)

Page 7 of 22Allwright et al. Biotechnol Biofuels (2016) 9:195
their absolute correlation coefficients with latitude and longitude in Minitab.
ResultsTrait variation, correlations and heritabilitiesData were transformed for normality as appropriate; Fig. 2 shows the frequency distributions of estimated bio-mass yield 2013, epidermal cell number per leaf and sac-charification following transformation. Additional file 3: Table S1 shows the highly significant (p < 0.001) effect of genotype for all traits studied. Estimated biomass yield (Fig. 3a) varied between 0.05 and 6.52 tonnes ha−1 y−1. Similarly epidermal leaf cell number (Fig. 3b) varied between approximately 0.8 and 27 million cells per leaf. Glucose release (saccharification potential—Fig. 3c) as a percentage of PPT CWR (post pre-treatment, oven-dry, cell wall residue) varied from 2.2 to 19.58 %.
Site of Origin (SO) was significant for all traits with the exception of saccharification potential for which the SO effect narrowly missed significance with the random factors block and run included in the GLM. The pres-ence of a significant block effect necessitated the use of block adjusted marginal means in downstream analyses. This wide genetic variation displayed in traits, related to both genotype and SO, highlights the potential of this natural germplasm collection to provide diversity for future selection and breeding efforts for this native Euro-pean tree species. Figure 3 shows box plots for estimated biomass 2013 (EB-13), epidermal cell number per leaf area (CNPL-13), saccharification potential (SP-12), leaf
area (LA-13), epidermal cell area (CA-13) and stomatal index (SI-13) by SO to give an indication of the extent and nature of the population-wide variation (boxplots for all other traits are available in supplementary Additional file 1: Figure S3).
Figure 4 visualises the direction, magnitude and sig-nificance of Pearson’s r pairwise correlation between all traits and with latitude and longitude of genotype origin. Additional file 1: Figure S4A shows the correlation matrix itself with exact Pearson’s r and p-values displayed and trait heritabilities (h2) shown across the matrix diagonal. Additional file 1: Figure S4B depicts the same data as a scatter plot matrix. Biomass traits (estimated biomass yield, main stem height, basal area and primary stem count) show strong positive (r > 0.5) correlations within and where applicable between years as well as consist-ently significant, weak to moderate positive (p < 0.05, 0 < r < 0.5) correlations with longitude of origin. Bio-mass yield, height and basal area from 2013 also show a significant correlation with latitude. Leaf area (mature leaf size) 2013 shows a strong positive relationship with biomass yield from all years with the strongest correla-tion with EB-13 (r = 0.814, p < 0.001). It is also signifi-cantly positively correlated with both latitude (r = 0.422, p < 0.001) and longitude (r = 0.381, p < 0.001) of origin. By contrast specific leaf area (SLA-13) shows a mod-erate but significant negative correlation with EB-13 (r = −0.271, p < 0.001) and with leaf area (r = −0.283, p < 0.001). Epidermal cell number per leaf (CNPL-13) is naturally very tightly correlated with leaf area (r = 0.973,
Fig. 2 Histograms illustrate trait frequency distribution following Box‑Cox transformation for a Estimated biomass yield 2013 (EB‑13); b Epidermal cell number per leaf (CNPL‑13) and c Saccharification potential (glucose yield) 2012 (SP‑12)

Page 8 of 22Allwright et al. Biotechnol Biofuels (2016) 9:195
p < 0.001) and in turn shows a strong positive correlation with EB-11, 12 and 13. Cell area (CA-13) shows a weak negative correlation with EB-13 (r = −0.154, p < 0.001) and LA-13 (r = −0.227, p < 0.001) and a strong negative correlation with stomatal density (0.579, p < 0.001). Sto-matal density and index (SD-13 and SI-13) show weak to moderate positive correlations with biomass traits in all years, leaf area and latitude and longitude of origin. Sac-charification potential (SP-12) appears largely unrelated to the other traits measured with only very weak and in
most cases non-significant correlations found. It shows no significant correlation with latitude and only a very weak relationship with longitude (r = 0.092, p = 0.021); as might be expected in view of its lacking an effect for SO in the GLM analysis.
Narrow-sense trait heritabilities (h2) ranged from 0.250 for SLA-13 to 0.497 for LA-13 (Additional file 1: Figure S4A). Heritability for biomass yield was moderate but consistent; ranging from 0.407 for EB-12 to 0.494 for EB-13. Figure 5 shows trait heritabilities did not regress
Fig. 3 Box plots depict range, interquartile range, median and mean (cross) for a Epidermal cell number per leaf 2013 (CNPL‑13); b Estimated oven‑dry biomass yield 2013 (EB‑13); c Saccharification potential (glucose release) 2012 (SP‑12); d Leaf area 2013 (LA‑13); e Epidermal cell area 2013 (CA‑13); f Stomatal index 2013 (SI‑13)

Page 9 of 22Allwright et al. Biotechnol Biofuels (2016) 9:195
significantly with their correlation coefficients (r) for lati-tude of origin (F1, 13 = 1.61, p = 0.226, r2 = 0.112) but regressed strongly for longitude (F1, 13 = 23.37, p < 0.001, r2 = 0.643).
Population genetic structureSTRUCTURE analysis after the method of Evanno et al. [83]. found the optimal value of K to be 2; i.e. the pop-ulation of 714 genotypes is broken into 2 broad clus-ters shown in Fig. 6a. This model suggests the strongest differentiation in the population to be between the Spanish (Ebro) and Northern Italian (Ticino) subpopu-lations. However, for comparison, Fig. 6b shows the cluster memberships for K = 7 as previously proposed by Faivre-Rampant et al. [39]. While in contrast to the optimal model according to STRUCTURE, this visu-alisation serves to illustrate finer scale differentiation between subpopulations and the extent and nature of admixing which are less apparent from the K = 2 model. Thus, both models have something to offer in the inter-pretation of structure for this complex population. The Southern Italian (Basento) and Northern Italian (Ticino) genotypes are shown to belong to clearly distinct clusters with a degree of admixing in central Italy (Paglia). The
German subpopulation (Kuhkopf) is strongly assigned to a unique cluster and is closely related to the more north-erly Netherlands (NL) genotypes. Genotypes drawn from subpopulations on the France-Germany border (Rhinau, Strasbourg, Taubergiessen and Erstein) are also strongly assigned to this cluster but show some admixing with the Ticino subpopulation and with subpopulations in South-ern and Central France as do the individuals from Dranse on the France-Switzerland border. The Central French subpopulations (Loire, Val Allier, Bonny and Guilly) are all predominantly assigned to their own cluster, whereas the Southern French (Drome and Ramieres) show more admixing; including with the distinctive Spanish popula-tions (Ebro).
The PCA of the neutral genetic variance (2390 SNPs) revealed 7 significant PCs according to a broken stick model (see scree plot in Additional file 1: Figure S5); cumulatively explaining 12.2 % of the variation. These significant PCs were used in the GWAS P-model (model II). PCs 1, 2 and 3 explained 3.91, 2.18 and 1.95 %, respec-tively; a scatter plot of which (Additional file 1: Figure S6) shows good agreement with STRUCTURE (Fig. 6) with distinctive clusters for the Northern and Central/Southern Italian genotypes; a close relationship between German
Fig. 4 Pairwise trait correlations are visualised with line colours and widths conferred according to the strength and direction of Pearson’s correla‑tion coefficient (r) between trait pairs. Non‑significant correlations are depicted with grey, point 1 lines. Significant positive and negative correlations (p < 0.05) are depicted with point 2 lines coloured light green or light red, respectively. Strong positive and negative correlations (r > 0.5) are depicted with point 3 lines coloured dark green or dark red, respectively. Very strong positive correlations (r > 0.8) are also shown in dark green with point 4 lines

Page 10 of 22Allwright et al. Biotechnol Biofuels (2016) 9:195
and Dutch individuals and the Spanish populations sepa-rated from the other nations by the more diffusely arrayed French. PCs 1–3 regress significantly with latitude and lon-gitude of origin: PC1 with latitude (F1, 710 = 41.5, p < 0.001, r2 = 0.055); PC1 with longitude (F1, 710 = 319.28, p < 0.001, r2 = 0.310); PC2 with latitude (F1, 710 = 6.23, p = 0.013, r2 = 0.009); PC2 with longitude (F1, 710 = 257.92, p < 0.001, r2 = 0.267); PC3 with latitude (F1, 710 = 59.82, p < 0.001, r2 = 0.078); PC3 with longitude (F1, 710 = 9.35, p = 0.002, r2 = 0.013) (Additional file 1: Figure S7).
The PCA for all markers (7343 SNPs) also showed 7 sig-nificant PCs cumulatively explaining 16.3 % of the varia-tion. PCs 1 and 2 explained 6.78 and 2.60 %, respectively, and the individual marker eigenvalues reveal clusters of top loading SNPs for both PCs. For PC1 3 of the top loaded SNPs are within a tight cluster (73 kb) on chromo-some 10; 3 are within a 15 kb region of chromosome 6 while a further 8 of the top 15 (0.2 %) are located within a 1.5Mbp region of chromosome 17. For PC2 a group of 6 top loaded SNPs are located within a 15 kb region on chromosome 6 with a further 3 located in a 62 kb region of chromosome 8. Additional file 4: Table S2 shows the top 74 (1 %) loaded SNPs for PCs 1 and 2.
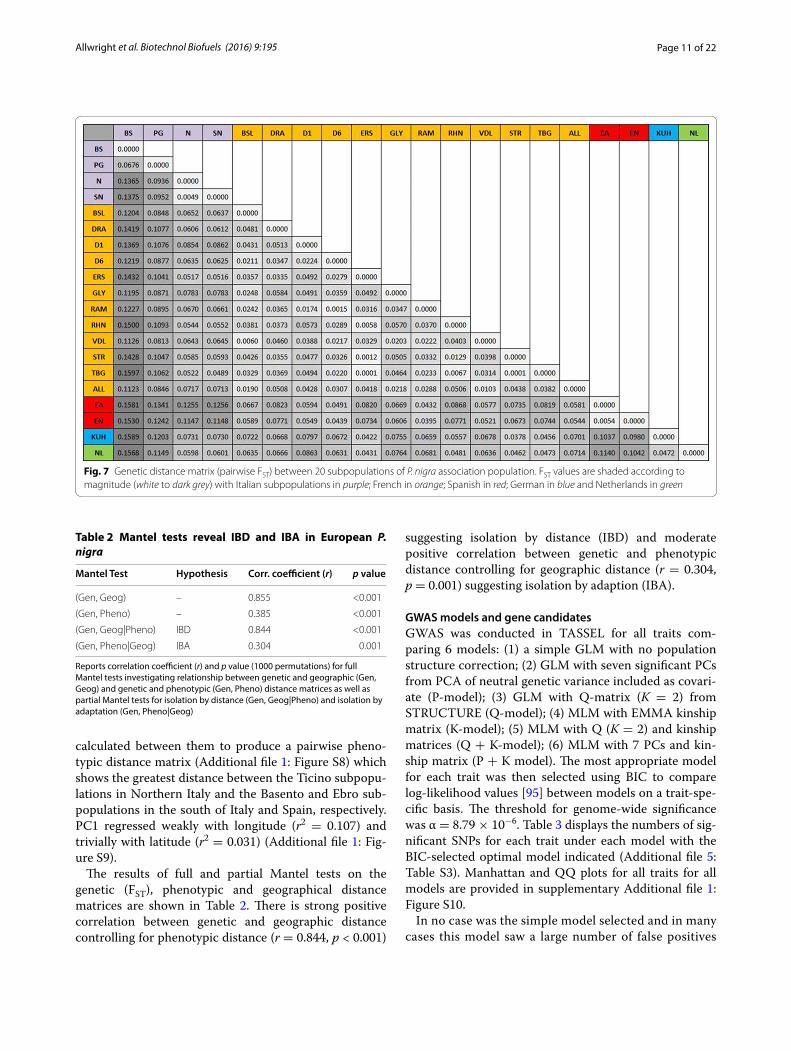
Pairwise FST (calculated from the reduced, putatively neutral 2390 SNP marker set) between subpopulations
(Fig. 7) shows that the Southern Italian (Basento) geno-types are the most genetically distant group with pairwise FST ranging from 0.112 (Val Allier) to 0.159 (Kuhkopf) against all other groups excepting the Central Italian (Paglia, FST = 0.068). As predicted from STRUCTURE the Spanish (Ebro) and Northern Italian (Ticino) are also more distantly related (FST range from 0.115 to 0.126). The German and Dutch subpopulations are again shown to be closely related (FST = 0.047). Within France FST is generally low with the greatest differentiation between Rhinau (France-Germany border) and the southerly Drome 1 (FST = 0.057).
The phenotypic PCA showed 2 significant PCs explain-ing 51.9 and 15.9 % of the phenotypic variance, respec-tively. The mean eigenvalues for these were calculated for the 20 sampled sites and the Euclidian distances
Fig. 5 Trait heritabilities show significant positive regression with their correlation coefficients (r) for a longitude of origin (r2 = 0.643) but not b latitude of origin (r2 = 0.112)
Fig. 6 Satellite map of P. nigra association population subpopula‑tion locations and their mean proportional cluster allocations from STRUCTURE for a K = 2 and b K = 7
Page 11 of 22Allwright et al. Biotechnol Biofuels (2016) 9:195
calculated between them to produce a pairwise pheno-typic distance matrix (Additional file 1: Figure S8) which shows the greatest distance between the Ticino subpopu-lations in Northern Italy and the Basento and Ebro sub-populations in the south of Italy and Spain, respectively. PC1 regressed weakly with longitude (r2 = 0.107) and trivially with latitude (r2 = 0.031) (Additional file 1: Fig-ure S9).
The results of full and partial Mantel tests on the genetic (FST), phenotypic and geographical distance matrices are shown in Table 2. There is strong positive correlation between genetic and geographic distance controlling for phenotypic distance (r = 0.844, p < 0.001)
suggesting isolation by distance (IBD) and moderate positive correlation between genetic and phenotypic distance controlling for geographic distance (r = 0.304, p = 0.001) suggesting isolation by adaption (IBA).
GWAS models and gene candidatesGWAS was conducted in TASSEL for all traits com-paring 6 models: (1) a simple GLM with no population structure correction; (2) GLM with seven significant PCs from PCA of neutral genetic variance included as covari-ate (P-model); (3) GLM with Q-matrix (K = 2) from STRUCTURE (Q-model); (4) MLM with EMMA kinship matrix (K-model); (5) MLM with Q (K = 2) and kinship matrices (Q + K-model); (6) MLM with 7 PCs and kin-ship matrix (P + K model). The most appropriate model for each trait was then selected using BIC to compare log-likelihood values [95] between models on a trait-spe-cific basis. The threshold for genome-wide significance was α = 8.79 × 10⁻⁶. Table 3 displays the numbers of sig-nificant SNPs for each trait under each model with the BIC-selected optimal model indicated (Additional file 5: Table S3). Manhattan and QQ plots for all traits for all models are provided in supplementary Additional file 1: Figure S10.
In no case was the simple model selected and in many cases this model saw a large number of false positives
Fig. 7 Genetic distance matrix (pairwise FST) between 20 subpopulations of P. nigra association population. FST values are shaded according to magnitude (white to dark grey) with Italian subpopulations in purple; French in orange; Spanish in red; German in blue and Netherlands in green
Table 2 Mantel tests reveal IBD and IBA in European P. nigra
Reports correlation coefficient (r) and p value (1000 permutations) for full Mantel tests investigating relationship between genetic and geographic (Gen, Geog) and genetic and phenotypic (Gen, Pheno) distance matrices as well as partial Mantel tests for isolation by distance (Gen, Geog|Pheno) and isolation by adaptation (Gen, Pheno|Geog)
Mantel Test Hypothesis Corr. coefficient (r) p value
(Gen, Geog) – 0.855 <0.001
(Gen, Pheno) – 0.385 <0.001
(Gen, Geog|Pheno) IBD 0.844 <0.001
(Gen, Pheno|Geog) IBA 0.304 0.001

Page 12 of 22Allwright et al. Biotechnol Biofuels (2016) 9:195
arising from the lack of population structure correction (see QQ plots in Additional file 1: Figure S10). Under the simple model the number of ‘significant’ associa-tions ranged from 1 (SP-12) to 2908 (CNPL-13) with a mean of 1112. The number of such associations showed strong positive regression with trait heritability; F1,
13 = 31.14, p < 0.001, r2 = 0.706 (Additional file 1: Fig-ure S11). The P-model was selected for 3 traits; the Q-model for 1 trait; the K-model for 3 traits and the Q + K model for the remaining 8. The P + K model was not selected for any traits and appeared to represent overfitting. Under these optimal models only 3 trait-marker associations reach genome-wide significance; 1 for Height-11, 1 for Height-13 and 1 for CNPL-13 (all Q + K model). Figure 8 displays Manhattan and QQ plots for these genome-wide significant associations. Table 4 shows the numbers of trait-marker associa-tions for the optimal models at a range of significance thresholds.
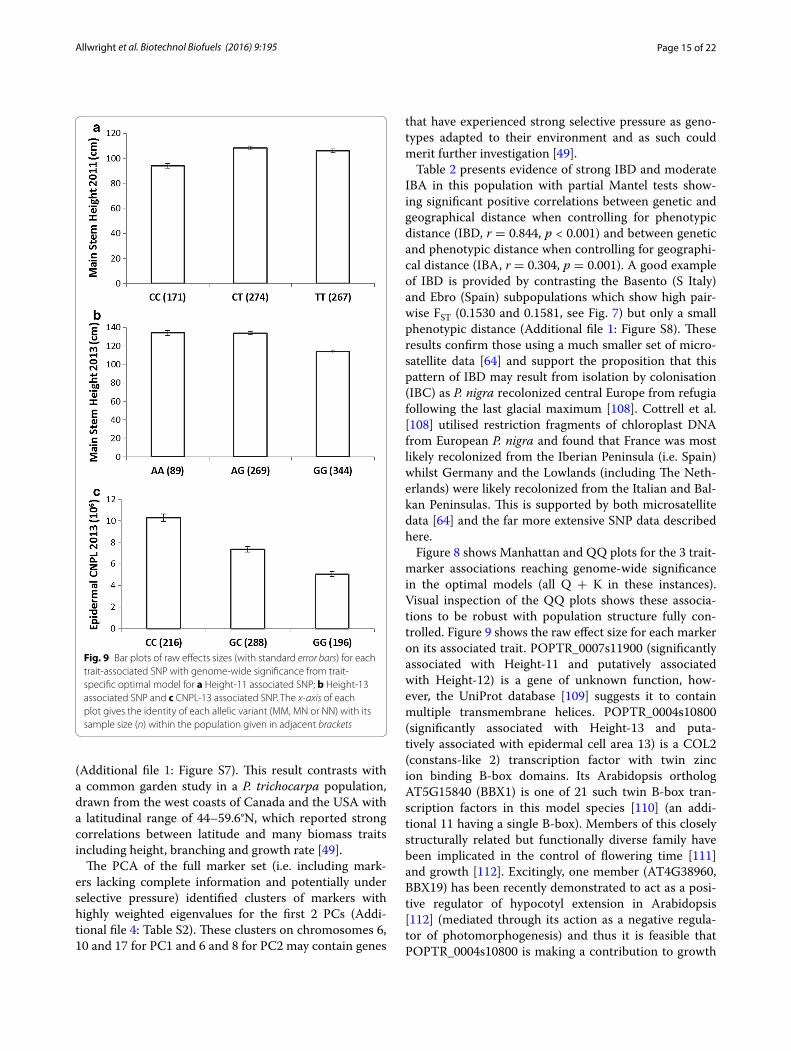
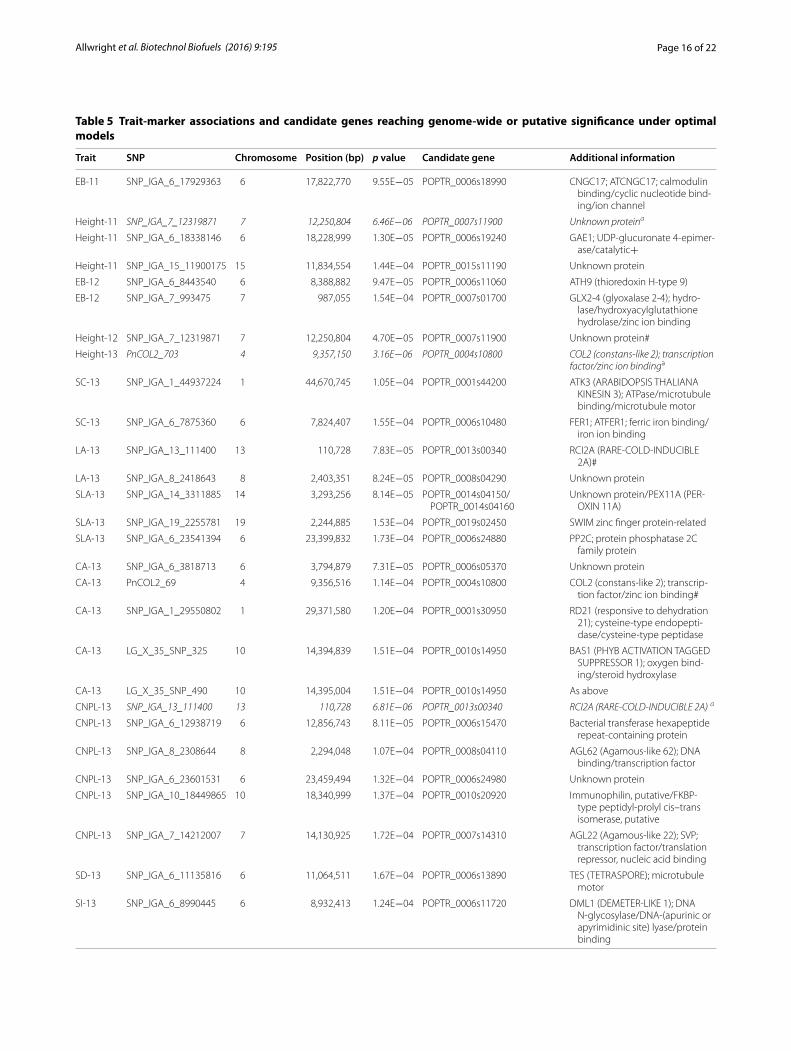
The 3 associated SNPs for Height-11 (also puta-tively associated with Height-12), Height-13 and CNPL-13 (also putatively associated with LA-13) are located on chromosome 7 within an intron of the gene POPTR_0007s11900; chromosome 4 within the first exon of the gene POPTR_0004s10800 (synonymous) and 1 kb to the 3′ end of the gene POPTR_0013s00340, respec-tively. The bar plots in Fig. 9 display the relationship between each marker and its associated trait. All 29 sig-nificantly and putatively trait-associated SNPs and their gene candidates are shown in Table 5.
DiscussionThe bioenergy trait data reported here demonstrates the extent of phenotypic variation within this P. nigra asso-ciation mapping population with greater than tenfold differences between genotypic extremes for many key traits (e.g. biomass yield, leaf area and saccharification potential, Fig. 3) and a significant genotypic effect for all traits measured. This provides important novel data for a Populus that is native to Europe and a source of previ-ously uncharacterised variation that may be harnessed in future for selection and breeding pipelines. Importantly, biomass yield traits were consistent across time with strong correlations within and between growing seasons and across a coppice cycle and possess moderate nar-row sense heritabilities (Additional file 1: Figure S4). This is an important finding since it suggests that simple to measure traits such as leaf size and leaf cell number may be considered as early diagnostic indicators of tree yield in a long-lived crop that may take several years to reach maturity. In addition, these are also promising qualities for association genetics within the population, enabling us to identify informative candidate genes for future molecular breeding efforts [99] for improved biomass yield in Populus. Irrespective of end use, consistent high biomass productivity is a key trait and this population is a useful resource to elucidate the genetics of biomass and biomass-related traits. For liquid fuel applications wood quality and biomass digestibility are also important con-siderations and a research priority [100, 101]. The lim-ited correlations between saccharification potential and
Table 3 Number of significant trait-SNP associations under all models
Number of significant trait-SNP associations at α < 8.79 × 10⁻⁶ under 6 possible models: (1) simple GLM (no genetic structure correction); (2) GLM with seven significant principal components of neutral genetic variation; (3) GLM with Q-matrix (K = 2) from STRUCTURE; (4) MLM with EMMA kinship matrix; (5) MLM with EMMA kinship and Q-matrix; (6) MLM with EMMA kinship and significant principal components of genetic variation. aIndicates the optimal model selected by comparison of log-likelihoods using BIC
Trait Model I Model II Model III Model IV Model V Model VI
EB‑11 925 0 27 0a 0 0
Height‑11 600 1 6 1 1a 0
EB‑12 1492 0 56 0 0a 0
Height‑12 1385 0 26 0 0a 0
EB‑13 1750 0 17 0 0a 0
Height‑13 1517 1 8 1 1a 1
BA‑13 1690 0 21 0 0a 0
SC‑13 334 0 8 0a 0 0
LA‑13 2803 1 162 2 0a 0
SLA‑13 157 0a 42 0 0 0
CA‑13 321 0 0a 0 0 0
CNPL‑13 2908 2 146 3 1a 0
SD‑13 705 0a 10 0 0 0
SI‑13 99 0a 18 0 0 0
SP‑12 1 0 1 0a 0 0

Page 13 of 22Allwright et al. Biotechnol Biofuels (2016) 9:195
biomass traits shown in Fig. 4 (strongest relationship is with biomass yield 2011, r = −0.107) are encourag-ing since they imply that gains in biomass yield may be obtainable without negative impacts on the quality traits underpinning feedstock processing.
The strong correlation between leaf area (individual leaf size) and biomass yield in 2013 (r = 0.814) has been previously reported in Populus [61, 102] in pedigree mapping populations and here we confirm the value of leaf area as a highly heritable (h2 = 0.497) diagnostic
Fig. 8 QQ and Manhattan plots for the Q + K (optimal) models for the 3 traits with SNPs reaching genome‑wide significance. Red and blue lines on Manhattan plots illustrate genome wide (α < 8.79 × 10⁻⁶) and putative (α < 1.76 × 10⁻⁴) significance levels, respectively. a QQ plot for Height‑11 associated SNP on chromosome 7; b Manhattan plot for Height‑11 association; c QQ plot for Height‑13 associated SNP on chromosome 4; d Man‑hattan plot for Height‑13 associated SNP; e QQ plot for CNPL‑13 associated SNP on chromosome 13; f Manhattan plot for CNPL‑13 associated SNP

Page 14 of 22Allwright et al. Biotechnol Biofuels (2016) 9:195
indicator of biomass productivity [103]. Interestingly, epi-dermal cell number was significantly more heritable than epidermal cell area (h2 = 0.480 and 0.270, respectively) and showed a far stronger correlation with total leaf area (Pearson’s r = 0.973 and −0.227, respectively). Previous research [65] in this population has also shown that leaf cell production rather than cell expansion is highly herit-able and the role of cell production in the development of large leaves is well established [104]. This is likely due to cell expansion being driven by biophysical events in the cell whilst cell production is driven by the cell cycle and signalling which are strongly genetically determined and hence highly heritable [105]. The cell division phase of leaf development, which follows the emergence of the primordium from the shoot apical meristem (SAM), is central to determining the total number of cells in the leaf and hence it’s final, developed size. The extent of cell production in this phase is dependent on the rate of pas-sage through the cell cycle which is controlled by pro-teins involved in DNA replication and mitosis and those that regulate them; e.g. cyclins, ubiquitin ligases and gib-berellin oxidases [105]. The transgenically altered expres-sion of proteins involved in cell cycle regulation has been shown to impact final leaf size in Arabidopsis [106, 107] and if such genes can be identified in bioenergy Populus they may prove valuable candidates for leaf development and biomass yield.
Figure 3 shows the Spanish and Southern Italian sub-populations had the lowest biomass yields and smallest leaves with subpopulations from northern Italy, Ger-many, The Netherlands and the French–German border
showing the highest biomass production and largest leaves. It is possible that genotypes originating from regions geographically closer and climatically similar to Northington are performing optimally in this experi-ment. Such G × E interactions can only be investigated through multiple site or environment trials, however, which can be challenging in large populations such as the one described here although current research is under-way to test this population at two levels of soil mois-ture. Furthermore, there is clear evidence in this case that phenotype is strongly influenced by geographical factors with all traits with the exception of saccharifica-tion potential (p = 0.056) showing a strongly significant (p < 0.001) effect for Site of Origin (SO). Additionally, all traits show a weak to moderate correlation with lon-gitude of origin and 9 (of 15) show a significant rela-tionship with latitude of origin. Further evidence that phenotypic variation is more closely aligned with longi-tude than latitude (i.e. trait variation follows a predomi-nantly east–west cline) is provided in Fig. 5 displaying the far greater strength of the regression of trait heritabili-ties against their correlation coefficients with longitude (r2 = 0.643) than latitude (r2 = 0.112). The first princi-pal component of the PCA of phenotypic variance also showed a stronger regression with longitude (r2 = 0.104) than latitude (r2 = 0.032) (Additional file 1: Figure S9). This assessment is supported by the PCA of the neu-tral genetic variance; the first 2 principal components thereof showing only a trivial relationship with latitude (r2 = 0.055 and 0.009, respectively) but a clear relation-ship with longitude (r2 = 0.310 and 0.267 ,respectively)
Table 4 Significant trait-SNP associations under optimal model at three significance levels
Number of significant trait-SNP associations under the optimal model for each trait at 3 significance levels: 5 % α = 0.05/5690 (8.79 × 10⁻⁶); 10 %) α = 0.1/5690 (1.76 × 10⁻⁵); Putative) α = 1/5690 (1.76 × 10⁻⁴)
Trait Model 5 % (α < 8.79 × 10⁻⁶) 10 % (α < 1.76 × 10⁻⁵) Putative (α < 1.76 × 10⁻⁴)
EB‑11 K (IV) 0 0 1
Height‑11 Q + K (V) 1 2 3
EB‑12 Q + K (V) 0 0 2
Height‑12 Q + K (V) 0 0 1
EB‑13 Q + K (V) 0 0 0
Height‑13 Q + K (V) 1 1 1
BA‑13 Q + K (V) 0 0 0
SC‑13 K (IV) 0 0 2
LA‑13 Q + K (V) 0 0 2
SLA‑13 P (II) 0 0 3
CA‑13 Q (III) 0 0 5
CNPL‑13 Q + K (V) 1 1 6
SD‑13 P (II) 0 0 1
SI‑13 P (II) 0 0 1
SP‑12 K (IV) 0 0 1
Page 15 of 22Allwright et al. Biotechnol Biofuels (2016) 9:195
(Additional file 1: Figure S7). This result contrasts with a common garden study in a P. trichocarpa population, drawn from the west coasts of Canada and the USA with a latitudinal range of 44–59.6°N, which reported strong correlations between latitude and many biomass traits including height, branching and growth rate [49].
The PCA of the full marker set (i.e. including mark-ers lacking complete information and potentially under selective pressure) identified clusters of markers with highly weighted eigenvalues for the first 2 PCs (Addi-tional file 4: Table S2). These clusters on chromosomes 6, 10 and 17 for PC1 and 6 and 8 for PC2 may contain genes
that have experienced strong selective pressure as geno-types adapted to their environment and as such could merit further investigation [49].
Table 2 presents evidence of strong IBD and moderate IBA in this population with partial Mantel tests show-ing significant positive correlations between genetic and geographical distance when controlling for phenotypic distance (IBD, r = 0.844, p < 0.001) and between genetic and phenotypic distance when controlling for geographi-cal distance (IBA, r = 0.304, p = 0.001). A good example of IBD is provided by contrasting the Basento (S Italy) and Ebro (Spain) subpopulations which show high pair-wise FST (0.1530 and 0.1581, see Fig. 7) but only a small phenotypic distance (Additional file 1: Figure S8). These results confirm those using a much smaller set of micro-satellite data [64] and support the proposition that this pattern of IBD may result from isolation by colonisation (IBC) as P. nigra recolonized central Europe from refugia following the last glacial maximum [108]. Cottrell et al. [108] utilised restriction fragments of chloroplast DNA from European P. nigra and found that France was most likely recolonized from the Iberian Peninsula (i.e. Spain) whilst Germany and the Lowlands (including The Neth-erlands) were likely recolonized from the Italian and Bal-kan Peninsulas. This is supported by both microsatellite data [64] and the far more extensive SNP data described here.
Figure 8 shows Manhattan and QQ plots for the 3 trait-marker associations reaching genome-wide significance in the optimal models (all Q + K in these instances). Visual inspection of the QQ plots shows these associa-tions to be robust with population structure fully con-trolled. Figure 9 shows the raw effect size for each marker on its associated trait. POPTR_0007s11900 (significantly associated with Height-11 and putatively associated with Height-12) is a gene of unknown function, how-ever, the UniProt database [109] suggests it to contain multiple transmembrane helices. POPTR_0004s10800 (significantly associated with Height-13 and puta-tively associated with epidermal cell area 13) is a COL2 (constans-like 2) transcription factor with twin zinc ion binding B-box domains. Its Arabidopsis ortholog AT5G15840 (BBX1) is one of 21 such twin B-box tran-scription factors in this model species [110] (an addi-tional 11 having a single B-box). Members of this closely structurally related but functionally diverse family have been implicated in the control of flowering time [111] and growth [112]. Excitingly, one member (AT4G38960, BBX19) has been recently demonstrated to act as a posi-tive regulator of hypocotyl extension in Arabidopsis [112] (mediated through its action as a negative regula-tor of photomorphogenesis) and thus it is feasible that POPTR_0004s10800 is making a contribution to growth
Fig. 9 Bar plots of raw effects sizes (with standard error bars) for each trait‑associated SNP with genome‑wide significance from trait‑specific optimal model for a Height‑11 associated SNP; b Height‑13 associated SNP and c CNPL‑13 associated SNP. The x-axis of each plot gives the identity of each allelic variant (MM, MN or NN) with its sample size (n) within the population given in adjacent brackets
Page 16 of 22Allwright et al. Biotechnol Biofuels (2016) 9:195
Table 5 Trait-marker associations and candidate genes reaching genome-wide or putative significance under optimal models
Trait SNP Chromosome Position (bp) p value Candidate gene Additional information
EB‑11 SNP_IGA_6_17929363 6 17,822,770 9.55E−05 POPTR_0006s18990 CNGC17; ATCNGC17; calmodulin binding/cyclic nucleotide bind‑ing/ion channel
Height‑11 SNP_IGA_7_12319871 7 12,250,804 6.46E−06 POPTR_0007s11900 Unknown proteina
Height‑11 SNP_IGA_6_18338146 6 18,228,999 1.30E−05 POPTR_0006s19240 GAE1; UDP‑glucuronate 4‑epimer‑ase/catalytic+
Height‑11 SNP_IGA_15_11900175 15 11,834,554 1.44E−04 POPTR_0015s11190 Unknown protein
EB‑12 SNP_IGA_6_8443540 6 8,388,882 9.47E−05 POPTR_0006s11060 ATH9 (thioredoxin H‑type 9)
EB‑12 SNP_IGA_7_993475 7 987,055 1.54E−04 POPTR_0007s01700 GLX2‑4 (glyoxalase 2‑4); hydro‑lase/hydroxyacylglutathione hydrolase/zinc ion binding
Height‑12 SNP_IGA_7_12319871 7 12,250,804 4.70E−05 POPTR_0007s11900 Unknown protein#
Height‑13 PnCOL2_703 4 9,357,150 3.16E−06 POPTR_0004s10800 COL2 (constans‑like 2); transcription factor/zinc ion bindinga
SC‑13 SNP_IGA_1_44937224 1 44,670,745 1.05E−04 POPTR_0001s44200 ATK3 (ARABIDOPSIS THALIANA KINESIN 3); ATPase/microtubule binding/microtubule motor
SC‑13 SNP_IGA_6_7875360 6 7,824,407 1.55E−04 POPTR_0006s10480 FER1; ATFER1; ferric iron binding/iron ion binding
LA‑13 SNP_IGA_13_111400 13 110,728 7.83E−05 POPTR_0013s00340 RCI2A (RARE‑COLD‑INDUCIBLE 2A)#
LA‑13 SNP_IGA_8_2418643 8 2,403,351 8.24E−05 POPTR_0008s04290 Unknown protein
SLA‑13 SNP_IGA_14_3311885 14 3,293,256 8.14E−05 POPTR_0014s04150/POPTR_0014s04160
Unknown protein/PEX11A (PER‑OXIN 11A)
SLA‑13 SNP_IGA_19_2255781 19 2,244,885 1.53E−04 POPTR_0019s02450 SWIM zinc finger protein‑related
SLA‑13 SNP_IGA_6_23541394 6 23,399,832 1.73E−04 POPTR_0006s24880 PP2C; protein phosphatase 2C family protein
CA‑13 SNP_IGA_6_3818713 6 3,794,879 7.31E−05 POPTR_0006s05370 Unknown protein
CA‑13 PnCOL2_69 4 9,356,516 1.14E−04 POPTR_0004s10800 COL2 (constans‑like 2); transcrip‑tion factor/zinc ion binding#
CA‑13 SNP_IGA_1_29550802 1 29,371,580 1.20E−04 POPTR_0001s30950 RD21 (responsive to dehydration 21); cysteine‑type endopepti‑dase/cysteine‑type peptidase
CA‑13 LG_X_35_SNP_325 10 14,394,839 1.51E−04 POPTR_0010s14950 BAS1 (PHYB ACTIVATION TAGGED SUPPRESSOR 1); oxygen bind‑ing/steroid hydroxylase
CA‑13 LG_X_35_SNP_490 10 14,395,004 1.51E−04 POPTR_0010s14950 As above
CNPL‑13 SNP_IGA_13_111400 13 110,728 6.81E−06 POPTR_0013s00340 RCI2A (RARE‑COLD‑INDUCIBLE 2A) a
CNPL‑13 SNP_IGA_6_12938719 6 12,856,743 8.11E−05 POPTR_0006s15470 Bacterial transferase hexapeptide repeat‑containing protein
CNPL‑13 SNP_IGA_8_2308644 8 2,294,048 1.07E−04 POPTR_0008s04110 AGL62 (Agamous‑like 62); DNA binding/transcription factor
CNPL‑13 SNP_IGA_6_23601531 6 23,459,494 1.32E−04 POPTR_0006s24980 Unknown protein
CNPL‑13 SNP_IGA_10_18449865 10 18,340,999 1.37E−04 POPTR_0010s20920 Immunophilin, putative/FKBP‑type peptidyl‑prolyl cis–trans isomerase, putative
CNPL‑13 SNP_IGA_7_14212007 7 14,130,925 1.72E−04 POPTR_0007s14310 AGL22 (Agamous‑like 22); SVP; transcription factor/translation repressor, nucleic acid binding
SD‑13 SNP_IGA_6_11135816 6 11,064,511 1.67E−04 POPTR_0006s13890 TES (TETRASPORE); microtubule motor
SI‑13 SNP_IGA_6_8990445 6 8,932,413 1.24E−04 POPTR_0006s11720 DML1 (DEMETER‑LIKE 1); DNA N‑glycosylase/DNA‑(apurinic or apyrimidinic site) lyase/protein binding

Page 17 of 22Allwright et al. Biotechnol Biofuels (2016) 9:195
in Populus. Encouragingly, in a recent glasshouse trial of 3 diverse genotypes drawn from this population, POPTR_0004s10800 was shown to be differentially expressed in developing xylem (Additional file 1: Figure S12); with significantly (p = 0.005) higher expression lev-els seen in the genotype possessing the “A” allele associ-ated with greater height in this study (also see Fig. 9b). POPTR_0013s00340 (significantly associated with CNPL-13 and putatively associated with the closely cor-related LA-13) is similar to hydrophobic protein RCI2A; its Arabidopsis ortholog AT3G05880 has been linked to the stress response and cold tolerance [113, 114]. Addi-tional file 1: Figure S12 shows POPTR_0013s00340 to be differentially expressed in both developing xylem and leaf tissue in glasshouse grown P. nigra. These functional data provide another line of evidence to support these genes’ role in biomass determination in Populus. None of these genes has been previously linked to biomass yield or bio-energy in the literature and as such they represent novel candidates for further work.
Table 5 shows all 29 SNPs (25 genes) reaching genome-wide or putative significance for yield traits, leaf area, epidermal cell size, cell number per leaf and stomatal pat-terning. Five of the genes are of entirely unknown func-tion and while none have been previously implicated in bioenergy traits in Populus; there are several genes of par-ticular interest among the putative candidates which have been characterised in Arabidopsis. POPTR_0006s19240 is putatively associated with Height-11 (significant genome-wide association at p < 0.1). Its Arabidopsis ortholog AT4G30440 (known as GAE1) is a UDP-glu-coronate 4-epimerase enzyme involved in pectin bio-synthesis. When GAE1 expression was suppressed in conjunction with its homolog GAE6 in Arabidopsis the mutants displayed a mutant phenotype compris-ing slightly reduced size, leaf brittleness and suppressed immunity [115]. POPTR_0006s11060 is putatively associ-ated with estimated biomass yield in 2012 and its Arabi-dopsis ortholog AT3G08710 is better known as ATH9. ATH9 is a membrane associated thioredoxin which has been shown to be plasma membrane associated and mobile between cells; suggesting a role in cell communi-cation. A loss of function mutation in this gene in Arabi-dopsis resulted in impaired growth and development
[116]. Two linked SNPs in POPTR_0010s14950 are puta-tively associated with epidermal cell area. This gene’s Arabidopsis ortholog is BAS1 (AT2G26710) which, like BBX19 discussed above, has been shown to play a role in the regulation of photomorphogenesis in Arabidopsis and thus impact upon hypocotyl elongation and cotyle-don expansion [117]. POPTR_0008s04110 is putatively associated with epidermal cell number per leaf. Interest-ingly, its ortholog in Arabidopsis (the transcription fac-tor Agamous-like 62, AGL62) has been demonstrated as essential in endosperm development where it acts as a regulator of cellularization in the plant embryo and is expressed strongly in the syncytial phase of mitotic cell production [118, 119]. In view of the strong relation-ship between biomass yield and leaf area (which appears to be driven largely by epidermal cell production) can-didate genes for the control of mitotic cell division in the developing leaf could be very valuable as discussed above. While there is no report in the literature at pre-sent for such a role for POPTR_0008s04110; the poplar eFP browser [120] does show it to be strongly expressed in young leaves, an expression level that drops markedly in developed leaves. Another gene putatively associated with CNPL-13, POPTR_0007s14310, is also ortholo-gous to an Agamous-like transcription factor (AGL22) in Arabidopsis. This gene is known as Short Vegetative Phase (SVP) due to its well established role as a repres-sor of floral development; acting to regulate cell differ-entiation and floral meristem determination [121]. Thus, we have identified a suite of candidate genes that may be explored further using reverse genetic approaches, such as those provided by CRISPR-CAS technology already available in Populus [122].
The tendency for uncorrected population structure to cause inflated and false positive test statistics for trait-marker associations is well documented and much effort has been invested in developing robust methodologies for its control [56, 123, 124]. Such structure has posed a challenge to researchers utilising the 34 K genotyping array developed for P. trichocarpa [44]. Publications for biomass yield; wood quality; ecophysiology and disease resistance traits in this species have variously employed kinship matrices; principal components of genetic vari-ance and Q-matrices to ensure the reporting of robust
Table 5 continued
Trait SNP Chromosome Position (bp) p value Candidate gene Additional information
SP‑12 SNP_IGA_1_31674244 1 31,482,266 1.60E−04 POPTR_0001s33290 Zinc finger (DHHC type) family protein
Under optimal models there are 29 SNPs (representing 25 candidate genes) reaching at least the putative significance level (α < 1.76 × 10⁻⁴) of which 4 are significant at p < 0.1 (indicated by a +) and three are significant at p < 0.05 (in italic typeface and indicated by a). Genes putatively associated with one trait whilst significantly associated with another at p < 0.05 are indicated by a #

Page 18 of 22Allwright et al. Biotechnol Biofuels (2016) 9:195
associations [45–48]. Here, a large excess of false posi-tives was observed when a simple, uncorrected model was employed with larger numbers of inflated values occurring for more highly heritable traits (e.g. LA-13, see Table 3). It was thus considered important to explore structure more thoroughly and its impact on trait asso-ciations was interrogated using a strategy similar to that of McKown et al. [47]. We used BIC to compare log-likelihoods between GWAS models using no correction; PCs, Q-matrix, kinship matrix or both Q-matrix/PCs and K-matrix together. It appears that this P. nigra asso-ciation population is more highly structured than that for P. trichocarpa. McKown et al. [47] found that in all cases the simple, P or Q-models were sufficient and no traits required the more stringent K, Q + K or P + K models unlike in this work. They also found only PC1 of the neu-tral genetic variance to be significant opposed to the first 7 PCs in this instance. It follows that the numbers of sig-nificant associations discovered in the studies described in P. trichocarpa vastly exceed those reported here. Whilst this can be partly attributed to the superior num-bers of SNPs on the 34 K chip and the greater numbers of traits phenotyped it is also likely that the lack of strong population structure in the P. trichocarpa association population is enormously beneficial in preventing over-correction by the application of more stringent models to control for stratification. Nevertheless, the associations provided above can be considered as robust for this out-breeding tree native to Europe and provide a firm basis for further proof of concept testing.
ConclusionsOur research on native European black poplar provides a significant foundation for the development of com-mercial native trees for bioenergy and has identified important early diagnostic traits (leaf size and cell num-ber) underpinning robust yield assessments over several years. We have been able to link these biomass traits to a set of candidate genes, varying from strong to putative but worthy of further investigation, that show differential expression in preliminary validation analysis. Although population structure; relatively low marker density and rapid decay of LD [39] have rendered association genetic analysis challenging; 3 robust associations were identified at full genome-wide significance for important biomass traits and 22 further genes are considered putative. It has been estimated [39] that 67–134K SNPs would be neces-sary to tag the entire genome (assuming an even marker density genome-wide) and, whilst greatly in excess of those available to this work, this number is within the scope of modern genotyping-by-sequencing (GBS) meth-odologies [42, 125]. A future GWAS in this population with a larger marker set more fully capturing the gene
space may, therefore, be more fruitful in terms of the numbers of trait-marker associations obtained; notwith-standing increased penalisation for multiple testing cor-rections. Nevertheless, this study has provided valuable information regarding the likely challenges of working within this population and identified a modest number of gene candidates for bioenergy arising from the 12K array. Earlier work on the population’s genetic structure, based on small numbers of amplified DNA fragments and neu-tral markers prior to Next Generation Sequencing (NGS) approaches, has also been confirmed [54, 64, 108].
Abbreviations2G: 2nd generation; AFLP: amplified fragment length polymorphism; BIC: Bayesian Information Criterion; CA: cell area; CNPL: epidermal cell number per leaf; DNA: deoxyribonucleic acid; EB: estimated biomass; ECD: epidermal cell density; EMMA: efficient mixed model association; GLM: general linear model; GOD‑POD: glucose oxidase peroxidase; GWAS: genome wide association study; G × E: genetic × environment; IBA: isolation by adaption; IBD: isolation by distance; LA: leaf area; LD: linkage disequilibrium; Meff: effective marker number; MLM: mixed linear model; PC: principal component; PCA: principal component analysis; PPT CWR: post pre‑treatment cell wall residue; QQ: quantile quantile; QTL: quantitative trait loci; SAM: shoot apical meristem; SD: stomatal density; SI: stomatal index; SLA: specific leaf area; SNP: single nucleo‑tide polymorphism; SO: site of origin; SP: saccharification potential; SRC: short rotation coppice; SRF: short rotation forestry; SVI: stem volume index.
Authors’ contributionsMRA, ACP, FR, SM and MV collected phenotypic data, MRA analysed the phenotypic and genetic data and drafted the manuscript, GE and JJBK con‑tributed to genetic analysis. PFR, AB, MV and ACP developed the 12 K Illumina array resource. MM supported DNA sequencing and genotyping. HW and AP provided expression data for gene candidates. All authors commented on the manuscript. GT was PI and conceived and designed the study, contributed to data analysis and writing. All authors read and approved the final manuscript.
Author details1 Centre for Biological Sciences, Life Sciences Building, University of South‑ampton, Southampton SO17 1BJ, UK. 2 CNR‑IVALSA, Sesto Fiorentino, via Madonna del Piano, 10, 50019 Sesto Fiorentino, FI, Italy. 3 Laboratory of Genetics, Wageningen University and Research, 6708PB Wageningen, The Netherlands. 4 US1279 EPGV, CEA‑IG/CNG, INRA, 91057 Evry, France. 5 Georg‑August‑Universität Göttingen, 37077 Göttingen, Germany. 6 Dipartimento di Scienze agroalimentari, ambientali e animali, Università di Udine, Via delle
Additional files
Additional file 1. containing supplementary figures S1 to S11. Supple‑mentary figure legends are contained within the file.
Additional file 2. containing the SNP marker set derived from the 12 K Illumina array genotyping and employed here for GWAS.
Additional file 3. containing supplementary table S1; showing the results of the general linear model run for all phenotypic traits.
Additional file 4. containing supplementary table S2; depicting the top 1 % loading SNPs for the first 2 principal components of the genetic variation.
Additional file 5. containing supplementary table S3; showing the BIC values for optimal model selection for GWAS.
Additional file 6. containing supplementary Table 1096 S4; reporting the raw and normalised RNAseq count data used for supplementary Figure S12.

Page 19 of 22Allwright et al. Biotechnol Biofuels (2016) 9:195
Scienze 206, 33100 Udine, Italy. 7 Istituto di Genomica Applicata (IGA), via J. Linussio 51, 33100 Udine, Italy.
AcknowledgementsThe authors acknowledge C. Bastien and M. Villar (INRA, UAGPF, Orléans) and the owners of the EVOLTREE collection for access to the referenced genetic resources for black poplar and O. Forestier for the assistance of Guéméné‑Pen‑fao/ONF‑State‑Nursery in the management of the stoolbed and preparation of the cuttings. We are grateful to the CEA‑IG/CNG teams of A. Boland (DNA and Cell Bank service) and MT. Bihoreau (Illumina Sequencing and Infinium genotyping facilities). We acknowledge the input of many TaylorLab members (2009–2014) who helped to plant and maintain this population including Mat‑thew Nelson, Yunan Lin, Jenn DeWoody, Catriona Murray, Stacey Selmes, Pat‑rick Stephenson, Billy Valdes, and a large number of undergraduate students who assisted with the biomass measurements in 2011, 2012 and 2013.
Competing interestsThe authors declare that they have no competing interests.
Availability of supporting dataAll supporting data is provided with this submission and additional files are detailed below.
Consent for publicationThe authors give their consent for the publication of the manuscript and all supporting documents and data.
FundingThis research was funded by the Fifth, Sixth and Seventh Frameworks for Research within the EU as part of projects POPYOMICS (FP5‑QLK5‑CT‑2002‑00953), EVOLTREE (FP6‑16322), ENERGYPOPLAR (FP7‑211917) and WATBIO (FP7‑311922) alongside funding from BBSRC.
Received: 9 May 2016 Accepted: 22 August 2016
References 1. Rae AM, Street NR, Robinson KM, Harris N, Taylor G. Five QTL hotspots
for yield in short rotation coppice bioenergy poplar: the poplar biomass loci. BMC Plant Biol. 2009;9:23.
2. Sannigrahi P, Ragauskas AJ, Tuskan G. Poplar as a feedstock for biofuels: a review of compositional characteristics. Biofuels Bioprod Biorefining. 2010;4:209–26.
3. Zsuffa L, Giordano E, Pryor LD, Stettler RF. Trends in poplar culture: some global and regional perspectives. In: Stettler RF, Bradshaw HD, Heilman PE, Hinckley TM, editors. Biology of populus and its implications for management and conservation. Ottawa: NRC Research Press; 1996. p. 515–39.
4. Eckenwalder JE. Systematics and evolution of populus. In: Stettler RF, Bradshaw HD, Heilman PE, Hinckley TM, editors. Biology of populus and its implications for management and conservation. Ottawa: NRC Research Press; 1996. p. 7–32.
5. van der Schoot J, Pospiskova M, Vosman B, Smulders MJ. Development and characterization of microsatellite markers in black poplar (Populus nigra L.). Theor Appl Genet. 2000;101:317–22.
6. Cole CT. Allelic and population variation of microsatellite loci in aspen (Populus tremuloides). New Phytol. 2005;167:155–64.
7. Kim S, Kim Y, Ee YL, Hoi IC, Oshi CPJ, Ee KL, Ae HB. The transgenic poplar as an efficient bioreactor system for the production of xylanase. Biosci Biotechnol Biochem. 2012;76:1140–5.
8. Taylor G. Populus: Arabidopsis for forestry. Do we need a model tree? Ann Bot. 2002;90:681–9.
9. Jansson S, Douglas CJ. Populus: a model system for plant biology. Annu Rev Plant Biol. 2007;58:435–58.
10. Cervera M, Ivens B, Gusma J, Liu BH, Hostyn V, Van Slycken J, Van Montagu M, Boerjan W. Dense genetic linkage maps of three populus species (Populus deltoides, P. nigra and P. trichocarpa) based on AFLP and microsatellite markers. Genetics. 2001;158:787–809.
11. Yin T, Zhang X, Huang M, Wang M, Zhuge Q, Tu S, Zhu L, Wu R. Molecular linkage maps of the Populus genome. Genome. 2002;45:541–55.
12. Gaudet M, Jorge V, Paolucci I, Beritognolo I, Mugnozza GS, Sabatti M. Genetic linkage maps of Populus nigra L. including AFLPs, SSRs, SNPs, and sex trait. Tree Genet Genomes. 2008;4:25–36.
13. Carletti G, Carra A, Allegro G, Vietto L, Desiderio F, Bagnaresi P, Gianinetti A, Cattivelli L, Valè G, Nervo G. QTLs for woolly poplar aphid (Phloeo-myzus passerinii L.) resistance detected in an inter‑specific Populus deltoides × P. nigra mapping population. PLoS ONE. 2016;11:e0152569.
14. Allwright MR, Taylor G. Molecular breeding for improved second gen‑eration bioenergy crops. Trends Plant Sci. 2016;21:43–54.
15. Bradshaw HD Jr, Stettler RF. Molecular genetics of growth and devel‑opment in Populus. I. Triploidy in hybrid poplars. Theor Appl Genet. 1993;86–86:301–7.
16. Tuskan G, Difazio S, Jansson S, Bohlmann J, Grigoriev I, Hellsten U, Putnam N, Ralph S, Rombauts S, Salamov A, Schein J, Sterck L, Aerts A, Bhalerao RR, Bhalerao RP, Blaudez D, Boerjan W, Brun A, Brunner A, Busov V, Campbell M, Carlson J, Chalot M, Chapman J, Chen G‑L, Cooper D, Coutinho PM, Couturier J, Covert S, Cronk Q, et al. The genome of black cottonwood, Populus trichocarpa (Torr & Gray). Sci‑ence. 2006;313:1596–604.
17. Sjödin A, Street NR, Sandberg G, Gustafsson P, Jansson S. The populus genome integrative explorer (PopGenIE): a new resource for exploring the Populus genome. New Phytol. 2009;182:1013–25.
18. Tsai C‑J, Ranjan P, DiFazio S, Tuskan G, Johnson V. Poplar genome micro‑arrays. In: Joshi CP, editor. Genetics, genomics and breeding of poplars. Enfield.: Science Publishers; 2011. p. 112–27.
19. Zhou X, Jacobs T, Xue L, Harding S, Tsai C. Exploiting SNPs for biallelic CRISPR mutations in the outcrossing woody perennial Populus reveals 4‑coumarate: CoA ligase specificity and redundancy. New Phytol. 2015;208:298–301.
20. Ranjan P, Yin T, Zhang X, Kalluri UC, Yang X, Jawdy S, Tuskan G. Bioinfor‑matics‑based identification of candidate genes from QTLs associated with cell wall traits in populus. BioEnergy Res. 2010;3:172–82.
21. Bradshaw HD Jr, Stettler RF. Molecular genetics of growth and develop‑ment in populus. IV. Mapping QTLs with large effects on growth, form, and phenology traits in a forest tree. Genetics. 1995;139:963–73.
22. Rae AM, Pinel MPC, Bastien C, Sabatti M, Street NR, Tucker J, Dixon C, Marron N, Dillen SY, Taylor G. QTL for yield in bioenergy populus: iden‑tifying G × E interactions from growth at three contrasting sites. Tree Genet Genomes. 2007;4:97–112.
23. Wullschleger SD, Yin TM, Difazio SP, Tschaplinski TJ, Gunter LE, Davis MF, Tuskan GA. Phenotypic variation in growth and biomass distribution for two advanced‑generation pedigrees of hybrid poplar. Can J For Res. 2005;35:1779–89.
24. Street NR, Skogström O, Sjödin A, Tucker J, Rodríguez‑Acosta M, Nils‑son P, Jansson S, Taylor G. The genetics and genomics of the drought response in Populus. Plant J. 2006;48:321–41.
25. Tschaplinski TJ, Tuskan G, Sewell MM, Gebre GM, Todd DE, Pendley CD. Phenotypic variation and quantitative trait locus identification for osmotic potential in an interspecific hybrid inbred F2 poplar pedigree grown in contrasting environments. Tree Physiol. 2006;26:595–604.
26. Monclus R, Leplé J‑C, Bastien C, Bert P‑F, Villar M, Marron N, Brignolas F, Jorge V. Integrating genome annotation and QTL position to identify candidate genes for productivity, architecture and water‑use efficiency in Populus spp. BMC Plant Biol. 2012;12:173.
27. Frewen BE, Chen TH, Howe GT, Davis J, Rohde A, Boerjan W, Bradshaw HD. Quantitative trait loci and candidate gene mapping of bud set and bud flush in populus. Genetics. 2000;154:837–45.
28. Fabbrini F, Gaudet M, Bastien C, Zaina G, Harfouche A, Beritognolo I, Marron N, Morgante M, Scarascia‑Mugnozza G, Sabatti M. Phenotypic plasticity, QTL mapping and genomic characterization of bud set in black poplar. BMC Plant Biol. 2012;12:47.
29. Novaes E, Osorio L, Drost DR, Miles BL, Boaventura‑Novaes CRD, Benedict C, Dervinis C, Yu Q, Sykes R, Davis M, Martin TA, Peter GF, Kirst M. Quantitative genetic analysis of biomass and wood chemistry of Populus under different nitrogen levels. New Phytol. 2009;182:878–90.
30. Raea M, Ferris R, Tallis MJ, Taylor G. Elucidating genomic regions deter‑mining enhanced leaf growth and delayed senescence in elevated CO2. Plant, Cell Environ. 2006;29:1730–41.

Page 20 of 22Allwright et al. Biotechnol Biofuels (2016) 9:195
31. Rae AM, Tricker PJ, Bunn SM, Taylor G. Adaptation of tree growth to elevated CO2: quantitative trait loci for biomass in Populus. New Phytol. 2007;175:59–69.
32. Street NR, Tallis MJ, James T, Mikael B, Jaakko K, Mark B, Taylor G. The physiological, transcriptional and genetic responses of an ozone‑sensitive and an ozone tolerant poplar and selected extremes of their F2 progeny. Environ Pollut. 2011;159:45–54.
33. Ingvarsson PK, Street NR. Association genetics of complex traits in plants. New Phytol. 2010;189:909–22.
34. Neale DB, Kremer A. Forest tree genomics: growing resources and applications. Nat Rev Genet. 2011;12:111–22.
35. Flint‑Garcia S, Thornsberry JM, Buckler ES. Structure of linkage disequi‑librium in plants. Annu Rev Plant Biol. 2003;54:357–74.
36. Gaut BS, Long AD. The lowdown on linkage disequilibrium. Plant Cell. 2003;15:1502–6.
37. Gupta PK, Rustgi S, Kulwal PL. Linkage disequilibrium and association studies in higher plants: present status and future prospects. Plant Mol Biol. 2005;57:461–85.
38. Tester M, Langridge P. Breeding technologies to increase crop produc‑tion in a changing world. Science. 2010;327:818–22.
39. Faivre‑Rampant P, Zaina G, Jorge V, Giacomello S, Segura V, Scalabrin S, Guérin V, De Paoli E, Aluome C, Viger M, Cattonaro F, Payne A, PaulSte‑phenRaj P, Le Paslier M, Berard A, Allwright MR, Villar M, Taylor G, Bastien C, Morgante M: New resources for genetic studies in Populus nigra: genome wide SNP discovery and development of a 12 k Infinium array. Mol Ecol Resour 2016. (epub ahead of print).
40. Teare MD. Genetic epidemeology: candidate gene association studies. In: Teare MD, Totowa NJ, editors. Methods in molecular biology, vol. 713. New York: Humana Press; 2011. p. 105–17.
41. Rounsley SD, Last RL. Shotguns and SNPs: how fast and cheap sequenc‑ing is revolutionizing plant biology. Plant J. 2010;61:922–7.
42. Davey JW, Hohenlohe PA, Etter PD, Boone JQ, Catchen JM, Blaxter ML. Genome‑wide genetic marker discovery and genotyping using next‑generation sequencing. Nat Rev Genet. 2011;12:499–510.
43. Ganal MW, Polley A, Graner E‑M, Plieske J, Wieseke R, Luerssen H, Durstewitz G. Large SNP arrays for genotyping in crop plants. J Biosci. 2012;37:821–8.
44. Geraldes A, Difazio SP, Slavov GT, Ranjan P, Muchero W, Hannemann J, Gunter LE, Wymore M, Grassa CJ, Farzaneh N, Porth I, McKown D, Skyba O, Li E, Fujita M, Klápště J, Martin J, Schackwitz W, Pennacchio C, Rokhsar D, Friedmann MC, Wasteneys GO, Guy RD, El‑Kassaby Y, Mansfield SD, Cronk QCB, Ehlting J, Douglas CJ, Tuskan G. A 34 K SNP genotyping array for Populus trichocarpa: design, application to the study of natural populations and transferability to other Populus species. Mol Ecol Resour. 2013;13:306–23.
45. Porth I, Klapšte J, Skyba O, Hannemann J, McKown AD, Guy RD, Difazio SP, Muchero W, Ranjan P, Tuskan G, Friedmann MC, Ehlting J, Cronk QCB, El‑Kassaby Y, Douglas CJ, Mansfield SD. Genome‑wide association map‑ping for wood characteristics in Populus identifies an array of candidate single nucleotide polymorphisms. New Phytol. 2013;200:710–26.
46. McKown AD, Guy RD, Quamme L, Klápště J, La Mantia J, Constabel CP, El‑Kassaby Y, Hamelin RC, Zifkin M, Azam MS. Association genetics, geography, and ecophysiology link stomatal patterning in Populus trichocarpa with carbon gain and disease resistance trade‑offs. Mol Ecol. 2014;23:5771–90.
47. McKown AD, Klápště J, Guy RD, Geraldes A, Porth I, Hannemann J, Friedmann M, Muchero W, Tuskan G, Ehlting J, Cronk QCB, El‑Kassaby Y, Mansfield SD, Douglas CJ. Genome‑wide association implicates numer‑ous genes underlying ecological trait variation in natural populations of Populus trichocarpa. New Phytol. 2014;203:535–53.
48. La Mantia J, Klápště J, El‑Kassaby Y, Azam S, Guy RD, Douglas CJ, Mansfield SD, Hamelin R. Association Analysis Identifies Melamp‑sora × columbiana Poplar leaf rust resistance SNPs. PLoS ONE. 2013;8:78423.
49. McKown AD, Guy RD, Klápště J, Geraldes A, Friedmann M, Cronk QCB, El‑Kassaby Y, Mansfield SD, Douglas CJ. Geographical and environmen‑tal gradients shape phenotypic trait variation and genetic structure in Populus trichocarpa. New Phytol. 2014;201:1263–76.
50. Chu Y, Su X, Huang Q, Zhang X. Patterns of DNA sequence variation at candidate gene loci in black poplar (Populus nigra L.) as revealed by single nucleotide polymorphisms. Genetica. 2009;137:141–50.
51. Slavov G, Zhelev P. Salient Biological Features, Systematics, and Genetic Variation of Populus. In: Jansson S, Bhalerao R, Groover A, editors. Genetics and genomics of populus. New York: Springer; 2010. p. 15–38.
52. Arens P, Coops H, Jansen J, Vosman B. Molecular genetic analysis of black poplar (Populus nigra L.) along Dutch rivers. Mol Ecol. 1998;7:11–8.
53. Pospíšková M, Šálková I. Population structure and parentage analysis of black poplar along the Morava River. Can J For Res. 2006;36:1067–76.
54. Smulders MJM, Cottrell JE, Lefèvre F, van der Schoot J, Arens P, Vosman B, Tabbener HE, Grassi F, Fossati T, Castiglione S, Krystufek V, Fluch S, Burg K, Vornam B, Pohl A, Gebhardt K, Alba N, Agúndez D, Maestro C, Notivol E, Volosyanchuk R, Pospíšková M, Bordács S, Bovenschen J, van Dam BC, Koelewijn HP, Halfmaerten D, Ivens B, van Slycken J, Broeck V, et al. Structure of the genetic diversity in black poplar (Populus nigra L.) populations across European river systems: consequences for conserva‑tion and restoration. For Ecol. Manage. 2008;255:1388–99.
55. Guerra FP, Wegrzyn JL, Sykes R, Davis MF, Stanton BJ, Neale DB. Associa‑tion genetics of chemical wood properties in black poplar (Populus nigra). New Phytol. 2013;197:162–76.
56. Kang HM, Zaitlen N, Wade CM, Kirby A, Heckerman D, Daly MJ, Eskin E. Efficient control of population structure in model organism association mapping. Genetics. 2008;178:1709–23.
57. Collard BCY, Mackill DJ. Marker‑assisted selection: an approach for preci‑sion plant breeding in the twenty‑first century. Philos Trans R Soc Lond B Biol Sci. 2008;363:557–72.
58. Xu Y, Lu Y, Xie C, Gao S, Wan J, Prasanna BM. Whole‑genome strategies for marker‑assisted plant breeding. Mol Breed. 2012;29:833–54.
59. Faria PJ, Guedes NMR, Yamashita C, Martuscelli P, Miyaki CY. Genetic variation and population structure of the endangered Hyacinth Macaw (Anodorhynchus hyacinthinus): implications for conservation. Biodivers Conserv. 2008;17:765–79.
60. Allendorf FW, Hohenlohe P, Luikart G. Genomics and the future of conservation genetics. Nat Rev Genet. 2010;11:697–709.
61. Rae AM, Robinson KM, Street NR, Taylor G. Morphological and physi‑ological traits influencing biomass productivity in short‑rotation cop‑pice poplar. Can J For Res. 2015;2004(34):1488–98.
62. Brereton NJB, Pitre FE, Hanley SJ, Ray MJ, Karp A, Murphy RJ. QTL map‑ping of enzymatic saccharification in short rotation coppice willow and its independence from biomass yield. BioEnergy Res. 2010;3:251–61.
63. Rohde A, Storme V, Jorge V, Gaudet M, Vitacolonna N, Fabbrini F, Ruttink T, Zaina G, Marron N, Dillen S, Steenackers M, Sabatti M, Morgante M, Boerjan W, Bastien C. Bud set in poplar–genetic dissection of a complex trait in natural and hybrid populations. New Phytol. 2011;189:106–21.
64. DeWoody J, Trewin H, Taylor G. Genetic and morphological differentia‑tion in Populus nigra L. Isolation by colonization or isolation by adapta‑tion? Mol Ecol. 2015;24(11):2335.
65. Viger M, Smith HK, Trewin H, Trewin TG. Adaptive mechanisms and genomic plasticity for drought tolerance identified in European black poplar (Populus nigra L.). Tree Physiol. 2016. doi:10.1093/treephys/tpw017.
66. Raj S, Bräutigam K, Hamanishi ET, Wilkins O, Thomas BR, Schroeder W, Mansfield SD, Plant AL, Campbell MM. Clone history shapes Populus drought responses. Proc Natl Acad Sci USA. 2011;108:12521–6.
67. Pounders CT, Foster GS. Multiple propagation effects on genetic estimates of rooting for Western Hemlock. J Am Soc Hortic Sci. 1992;117:651–5.
68. Zianis D, Muukkonen P, Mäkipää R, Mencuccini M. Biomass and stem volume equations for tree species in Europe. Silva Fennica Monographs 4. 63 P. The Finnish Forest Research Institute; 2005.
69. Van Acker R, Vanholme R, Storme V, Mortimer JC, Dupree P, Boerjan W. Lignin biosynthesis perturbations affect secondary cell wall composi‑tion and saccharification yield in Arabidopsis thaliana. Biotechnol Biofuels. 2013;6(1):1.
70. Bankar SB, Bule MV, Singhal RS, Ananthanarayan L. Glucose oxidase–an overview. Biotechnol Adv. 2009;27:489–501.
71. Abràmoff MD, Magalhães PJ, Ram SJ. Image processing with ImageJ. Biophotonics Int. 2004;11:36–42.
72. Viger M, Rodriguez‑Acosta M, Rae AM, Morison JIL, Taylor G. Toward improved drought tolerance in bioenergy crops: QTL for carbon iso‑tope composition and stomatal conductance in Populus. Food Energy Secur. 2013;2:220–36.

Page 21 of 22Allwright et al. Biotechnol Biofuels (2016) 9:195
73. Ferris R, Taylor G. Stomatal characteristics of four native herbs following exposure to elevated CO2. Ann Bot. 1994;73:447–53.
74. IBM Corp.: SPSS. 2013:IBM SPSS Statistics for Windows, Version 22.0. Arm.
75. Minitab Statistical Software: Minitab. 2010:State College, PA: Minitab, Inc. (http://www.minitab.com).
76. Bradbury PJ, Zhang Z, Kroon DE, Casstevens TM, Ramdoss Y, Buckler ES. TASSEL: software for association mapping of complex traits in diverse samples. Bioinformatics. 2007;23:2633–5.
77. Graffelman J, Camarena JM. Graphical tests for Hardy–Weinberg equi‑librium based on the ternary plot. Hum Hered. 2008;65:77–84.
78. Purcell S, Neale B, Todd‑Brown K, Thomas L, Ferreira MR, Bender D, Maller J, Sklar P, de Bakker PIW, Daly MJ, Sham PC. PLINK: a tool set for whole‑genome association and population‑based linkage analyses. Am J Hum Genet. 2007;81:559–75.
79. Wang D, Sun Y, Stang P, Berlin J, Wilcox M, Li Q. Comparison of methods for correcting population stratification in a genome‑wide association study of rheumatoid arthritis: principal‑component analysis versus multidimensional scaling. BMC Proc. 2009;3(Suppl 7):S109.
80. Pritchard JK, Stephens M, Donnelly P. Inference of population structure using multilocus genotype data. Genetics. 2000;155:945–59.
81. Falush D, Stephens M, Pritchard JK. Inference of population structure using multilocus genotype data: linked loci and correlated allele frequencies. Genetics. 2003;164:1567–87.
82. Earl D, VonHoldt BM. STRUCTURE HARVESTER: a website and program for visualizing STRUCTURE output and implementing the Evanno method. Conserv Genet Resour. 2012;4:359–61.
83. Evanno G, Regnaut S, Goudet J. Detecting the number of clusters of individuals using the software STRUCTURE: a simulation study. Mol Ecol. 2005;14:2611–20.
84. R Core Team: R: A language and environment for statistical computing. 2013.
85. Jackson DA. Stopping rules in principal components analysis: a compar‑ison of heuristical and statistical approaches. Ecology. 1993;74:2204–14.
86. Excoffier L, Lischer HEL. Arlequin suite ver 3.5: a new series of programs to perform population genetics analyses under Linux and Windows. Mol Ecol Resour. 2010;10:564–7.
87. Sinnott RW. Virtues of the haversine. Sky telescope. 1984;68:158. 88. Mantel N. Cancer research. Cancer Res. 1967;27(February):209–20. 89. Smouse PE, Long JC, Sokal RR. Multiple regression and correlation
extensions of the mantel test of matrix correspondence. Syst Zool. 1986;35:627–32.
90. Manly BFJ. Randomization and monte carlo methods in biology. 2nd ed. New York: Chapman and Hall; 1997.
91. Funk DJ, Egan SP, Nosil P. Isolation by adaptation in Neochlamisus leaf beetles: host‑related selection promotes neutral genomic divergence. Mol Ecol. 2011;20:4671–82.
92. Li M‑X, Yeung JMY, Cherny SS, Sham PC. Evaluating the effective num‑bers of independent tests and significant p‑value thresholds in com‑mercial genotyping arrays and public imputation reference datasets. Hum Genet. 2012;131:747–56.
93. Lipka AE, Tian F, Wang Q, Peiffer J, Li M, Bradbury PJ, Gore M, Buckler ES, Zhang Z. GAPIT: genome association and prediction integrated tool. Bioinformatics. 2012;28:2397–9.
94. Henderson CR. Applications of linear models in animal breeding. 1984. 95. Yu J, Pressoir G, Briggs WH, VrohBi I, Yamasaki M, Doebley JF, McMullen
MD, Gaut BS, Nielsen DM, Holland JB, Kresovich S, Buckler ES. A unified mixed‑model method for association mapping that accounts for multi‑ple levels of relatedness. Nat Genet. 2006;38:203–8.
96. Therneau T: Mixed effects cox models. 2012. 97. Barton K: MuMIn: Multi‑model inference. 2014. 98. Kruijer AW: Package “heritability.” 2015. 99. Nieminen K, Robischon M, Immanen J, Helariutta Y. Towards optimizing
wood development in bioenergy trees. New Phytol. 2012;194:46–53. 100. Van Acker R, Leplé J‑C, Aerts D, Storme V, Goeminne G, Ivens B, Légée
F, Lapierre C, Piens K, Van Montagu MCE, Santoro N, Foster CE, Ralph J, Soetaert W, Pilate G, Boerjan W. Improved saccharification and ethanol yield from field‑grown transgenic poplar deficient in cinnamoyl‑CoA reductase. Proc Natl Acad Sci U S A. 2014;111:845–50.
101. Polle A, Janz D, Teichmann T, Lipka V. Poplar genetic engineering: promoting desirable wood characteristics and pest resistance. Appl Microbiol Biotechnol. 2013;97:5669–79.
102. Marron N, Dillen SY, Ceulemans R. Evaluation of leaf traits for indirect selection of high yielding poplar hybrids. Environ Exp Bot. 2007;61:103–16.
103. Ridge CR, Hinckley TM, Stettler RF, Van Volkenburgh E. Leaf growth characteristics of fast‑growing poplar hybrids Populus trichocarpa x P. deltoides. Tree Physiol. 1986;1:209–16.
104. Marcotrigiano M. A role for leaf epidermis in the control of leaf size and the rate and extent of mesophyll cell division. Am J Bot. 2010;97:224–33.
105. Gonzalez N, Vanhaeren H, Inzé D. Leaf size control: complex coordina‑tion of cell division and expansion. Trends Plant Sci. 2012;17:332–40.
106. Silverstone L, Jung HS, Dill A, Kawaide H, Kamiya Y, Sun TP. Repressing a repressor: gibberellin‑induced rapid reduction of the RGA protein in Arabidopsis. Plant Cell. 2001;13:1555–66.
107. Eloy NB, deFreitasLima M, VanDamme D, Vanhaeren H, Gonzalez N, De Milde L, Hemerly AS, Beemster GTS, Inzé D, Ferreira PCG. The APC/C subunit 10 plays an essential role in cell proliferation during leaf devel‑opment. Plant J. 2011;68:351–63.
108. Cottrell JE, Krystufek V, Tabbener HE, Milner D, Connolly T, Sing L, Fluch S, Burg K, Lefèvre F, Achard P, Bordács S, Gebhardt K, Vornam B, Smulders MJM, Vanden Broeck HV, Slycken J, Storme V, Boerjan W, Castiglione S, Fossati T, Alba N, Agúndez D, Maestro C, Notivol E, Boven‑schen J, van Dam BC. Postglacial migration of Populus nigra L lessons learnt from chloroplast DNA. For Ecol Manage. 2005;219:293–312.
109. The UniProt Consortium. UniProt: a hub for protein information. Nucleic Acids Res. 2015;43:204–12.
110. Khanna R, Kronmiller B, Maszle DR, Coupland G, Holm M, Mizuno T, Wu S‑H. The Arabidopsis B‑box zinc finger family. Plant Cell. 2009;21:3416–20.
111. Robson F, Costa MMR, Hepworth SR, Vizir I, Pieiro M, Reeves PH, Putterill J, Coupland G. Functional importance of conserved domains in the flowering‑time gene CONSTANS demonstrated by analysis of mutant alleles and transgenic plants. Plant J. 2001;28:619–31.
112. Wang C‑Q, Sarmast MK, Jiang J, Dehesh K. The transcriptional regulator bbx19 promotes hypocotyl growth by facilitating COP1‑mediated early flowering3 degradation in Arabidopsis. Plant Cell. 2015;27:1128–39.
113. Medina J, Rodríguez‑Franco M, Peñalosa A, Carrascosa MJ, Neuhaus G, Salinas J. Arabidopsis mutants deregulated in RCI2A expression reveal new signaling pathways in abiotic stress responses. Plant J. 2005;42:586–97.
114. Sivankalyani V, Geetha M, Subramanyam K, Girija S. Ectopic expression of Arabidopsis RCI2A gene contributes to cold tolerance in tomato. Transgenic Res. 2014;24(2):237–51.
115. Bethke G, Thao A, Xiong G, Li B, Soltis NE, Hatsugai N, Hillmer RA, Katagiri F, Kliebenstein DJ, Pauly M, Glazebrook J. Pectin biosynthesis is critical for cell wall integrity and immunity in Arabidopsis thaliana. Plant Cell. 2016;28:404.
116. Meng L, Wong JH, Feldman LJ, Lemaux PG, Buchanan BB. A membrane‑associated thioredoxin required for plant growth moves from cell to cell, suggestive of a role in intercellular communication. Proc Natl Acad Sci USA. 2010;107:3900–5.
117. Turk EM, Fujioka S, Seto H, Shimada Y, Takatsuto S, Yoshida S, Wang H, Torres QI, Ward JM, Murthy G, Zhang J, Walker JC, Neff MM. BAS1 and SOB7 act redundantly to modulate Arabidopsis photomorphogenesis via unique brassinosteroid inactivation mechanisms. Plant J. 2005;42:23–34.
118. Hehenberger E, Kradolfer D, Kohler C. Endosperm cellularization defines an important developmental transition for embryo development. Development. 2012;139:2031–9.
119. Kang I‑H, Steffen JG, Portereiko MF, Lloyd A, Drews GN. The AGL62 MADS domain protein regulates cellularization during endosperm development in Arabidopsis. Plant Cell. 2008;20:635–47.
120. Wilkins O, Nahal H, Foong J, Provart NJ, Campbell MM. Expansion and diversification of the Populus R2R3‑MYB family of transcription factors. Plant Physiol. 2009;149:981–93.
121. Andrés F, Porri A, Torti S, Mateos J, Romera‑Branchat M, García‑Martínez JL, Fornara F, Gregis V, Kater MM, Coupland G. Short vegetative phase reduces gibberellin biosynthesis at the Arabidopsis shoot apex to regulate the floral transition. Proc Natl Acad Sci USA. 2014;111:E2760–9.

Page 22 of 22Allwright et al. Biotechnol Biofuels (2016) 9:195
• We accept pre-submission inquiries
• Our selector tool helps you to find the most relevant journal
• We provide round the clock customer support
• Convenient online submission
• Thorough peer review
• Inclusion in PubMed and all major indexing services
• Maximum visibility for your research
Submit your manuscript atwww.biomedcentral.com/submit
Submit your next manuscript to BioMed Central and we will help you at every step:
122. Fan D, Liu T, Li C, Jiao B, Li S, Hou Y, Luo K. Efficient CRISPR/Cas9‑medi‑ated targeted mutagenesis in Populus in the first generation. Sci Rep. 2015;5:12217.
123. Kang HM, Sul JH, Service SK, Zaitlen N, Kong SY, Freimer NB, Sabatti C, Eskin E. Variance component model to account for sample structure in genome‑wide association studies. Nat Genet. 2010;42:348–54.
124. Atwell S, Huang YS, Vilhjálmsson BJ, Willems G, Horton M, Li Y, Meng D, Platt A, Tarone AM, Hu TT, Jiang R, Muliyati NW, Zhang X, Amer MA, Baxter I, Brachi B, Chory J, Dean C, Debieu M, de Meaux J, Ecker JR, Faure N, Kniskern JM, Jones JDG, Michael T, Nemri A, Roux F, Salt DE, Tang C,
Todesco M, et al. Genome‑wide association study of 107 phenotypes in Arabidopsis thaliana inbred lines. Nature. 2010;465:627–31.
125. Zhou L. Holliday J a: targeted enrichment of the black cottonwood (Populus trichocarpa) gene space using sequence capture. BMC Genom. 2012;13:703.