Embed Size (px)
Citation preview

III
BIOMASS THERMAL PRE-TREATMENT FOR CO-
GASIFICATION: CO2 TORREFACTION
MOHAMMAD HAFIZUDDIN BIN MOHD YUSOFF
Thesis submitted in partial fulfilment of the requirements
for the award of the degree of
Bachelor of Chemical Engineering
Faculty of Chemical & Natural Resources Engineering
UNIVERSITI MALAYSIA PAHANG
JUNE 2015
©MOHAMMAD HAFIZUDDIN BIN MOHD YUSOFF (2015)
VIII
ABSTRACT
Biomass has been a very reliable alternative for renewable fuel to reduce the use of
conventional fuel due to environmental concern and sustainability issue. In order to
reduce the emission of the harmful greenhouse gases and to promote sustainable
environment, the renewable energy is the perfect solution to achieve the targets. But there
are some problems that needs to be overcome before the biomass can be utilised as
biochar or biofuel through gasification by using the torrefaction method. Torrefaction of
biomass is a pre-treatment process that aims to improve the fuel properties by lowering
the moisture content and increasing the energy density at temperature between 200°C to
300°C in either inert or non-inert environment. The objective of this work is to study the
effect of CO2 concentration present during torrefaction at temperature 240°C and 280°C.
In addition, the impact of torrefaction time was also evaluated at 15 and 30 minutes. In
this study, the sample used is empty fruit bunches (EFB) from palm oil mills in Felda
Lepar. The torrefaction reactor consists of a vertical stainless-steel tubular reactor
equipped with an electrically heated furnace. The experimental apparatus is setup consist
of gas tanks, N2 and CO2 that are controlled by regulators and furnace. The gas will be
mixed at 0%, 10%, 15%, and 21% value of CO2 while the rest is N2. It was determined
that the mass yield is decreased with increased in the CO2 concentration. This suggests
the occurrence of oxidative reaction, for example the Boudouard reaction and an
enhancement of volatile matter release. The heating value of the torrefied biomass shows
an increasing trend, with temperature increased. This is consistent with the findings in the
literature, which primarily indicates improved fuel properties. The comparable mass loss
at lower temperatures improved fuel properties, makes utilization of carbon dioxide as a
torrefaction medium for pre-treating biomass as an attractive technology.

IX
ABSTRAK
Biojisim adalah alternatif yang sangat berguna untuk bahan api yang boleh diperbaharui
bagi mengurangkan penggunaan bahan api konvensional berikutan kebimbangan keatas
isu kelestarian alam sekitar. Dalam usaha untuk mengurangkan pelepasan gas rumah hijau
yang berbahaya dan untuk menggalakkan persekitaran yang sihat, sumber tenaga boleh
diperbaharui adalah penyelesaian yang sempurna untuk mencapai sasaran tersebut. Tetapi
terdapat beberapa masalah yang perlu diatasi sebelum biojisim boleh ditukar ke arang
atau bahan api bio dengan menggunakan kaedah gasifikasi. Kaedah ‘torrefaction’ untuk
biomass adalah satu proses pra-rawatan yang bertujuan untuk meningkatkan sifat-sifat
bahan api dengan mengurangkan kandungan kelembapan dan meningkatkan ketumpatan
tenaga pada suhu antara 200 ° C hingga 300 °C dalam persekitaran lengai atau tidak
lengai. Objektif kajian ini adalah untuk mengkaji kesan kepekatan CO2 yang hadir dalam
kaedah “torrefaction” pada suhu 240 ° C dan 280 ° C. Di samping itu, kesan masa
torrefaction juga telah dinilai pada 15 dan 30 minit. Di dalam kajian ini, sampel yang
digunakan ialah Buah Tandan kosong (EFB) yang diambil dari kilang kelapa sawit di
Felda Lepar. Reaktor torrefaction terdiri daripada reaktor tiub menegak yang diperbuat
dari keluli tahan karat dilengkapi dengan perapian elektrik yang dipanaskan. Antara
peralatan eksperimen yang digunakan terdiri daripada tong gas yang mengandungi N2 dan
CO2 dikawal bersama dengan pengawal selia dan relau. Gas tersebut akan bercampur
pada 0%, 10%, 15%, dan 21% kepekatan gas CO2 yang mana selebihnya adalah gas N2.
Ia telah didapati bahawa kadar hasil jisim telah berkurang dengan peningkatan dalam
kepekatan CO2. Ini menunjukkan berlakunya reaksi oksidatif, sebagai contoh reaksi
Boudouard dan penambahan pada ruapan bahan. Nilai kalori pada biojisim yang telah
dipanaskan menunjukkan peningkatan pada aliran, dengan suhu meningkat. Ini selaras
dengan keputusan daripada lain-lain artikel, terutamanya yang menujukkan ciri-ciri bahan
api yang lebih baik. Perbandingan kehilangan jisim pada suhu yang lebih rendah yang
memperbaiki sifat bahan api pada biojisim menjadikan penggunaan karbon dioksida
sebagai medium torrefaction untuk kaedah pra-rawatan biojisim yang menarik.

X
TABLE OF CONTENTS
SUPERVISOR’S DECLARATION ............................................................................... IV
STUDENT’S DECLARATION ...................................................................................... V
Dedication ....................................................................................................................... VI
ACKNOWLEDGEMENT ............................................................................................. VII
ABSTRACT ................................................................................................................. VIII
ABSTRAK ...................................................................................................................... IX
TABLE OF CONTENTS ................................................................................................. X
LIST OF FIGURES ....................................................................................................... XII
LIST OF TABLES ....................................................................................................... XIII
LIST OF SYMBOL ..................................................................................................... XIV
LIST OF ABBREVIATION ......................................................................................... XV
CHAPTER 1 ..................................................................................................................... 1
1 INTRODUCTION .................................................................................................... 1
1.1 Background study............................................................................................... 1
1.2 Motivation and statement of problem ................................................................ 2
1.3 Research objectives ............................................................................................ 3
1.4 Scope of this research ......................................................................................... 3
1.5 Organisation of this thesis .................................................................................. 4
2 LITERATURE REVIEW ......................................................................................... 5
2.1 Overview ............................................................................................................ 5
2.2 Biomass .............................................................................................................. 5
2.3 Torrefaction Process ........................................................................................... 6
2.4 Previous work on Torrefaction Process ............................................................. 7
2.5 Torrefaction Technologies in Industries ............................................................ 7
2.6 Gasification of Biomass ..................................................................................... 9
3 MATERIALS AND METHODS ............................................................................ 10
3.1 Overview .......................................................................................................... 10
3.2 Preparation of biomass samples ....................................................................... 10
3.3 Torrefaction experiments ................................................................................. 12
3.4 Data Analysis ................................................................................................... 14
3.4.1 Gas Pycnometer ........................................................................................ 14

XI
3.4.2 Thermogravimetric analysis (TGA) .......................................................... 15
3.4.3 CHNS analyzer ......................................................................................... 16
3.4.4 Scanning Electron Microscopic (SEM) .................................................... 16
3.4.5 Characterization of EFB samples ............................................................. 17
4 RESULTS AND DISCUSSION ............................................................................. 18
4.1 Overview .......................................................................................................... 18
4.2 Analysis on raw EFB ....................................................................................... 18
4.3 Effect of temperature and CO2 concentration on mass yield of EFB .............. 19
4.4 Fuel Characteristic of torrefied biomass .......................................................... 22
4.5 Effect of temperature and concentration CO2 on calorific value of biochar .... 23
4.6 The effect of temperature and CO2 concentration on energy yield of EFB. .... 24
4.7 SEM Analysis on torrefied biomass ................................................................. 24
4.8 Summary .......................................................................................................... 32
5 CONCLUSION ....................................................................................................... 33
5.1 Conclusion........................................................................................................ 33
6 REFERENCES ....................................................................................................... 34
7 APPENDICES ........................................................................................................ 37

XII
LIST OF FIGURES
Figure 2-1-Auger screw type reactor ................................................................................ 8
Figure 3-1 Raw Empty Fruit Bunches (EFB) ................................................................. 11
Figure 3-2 Flow Chart of Preparation of Samples .......................................................... 11
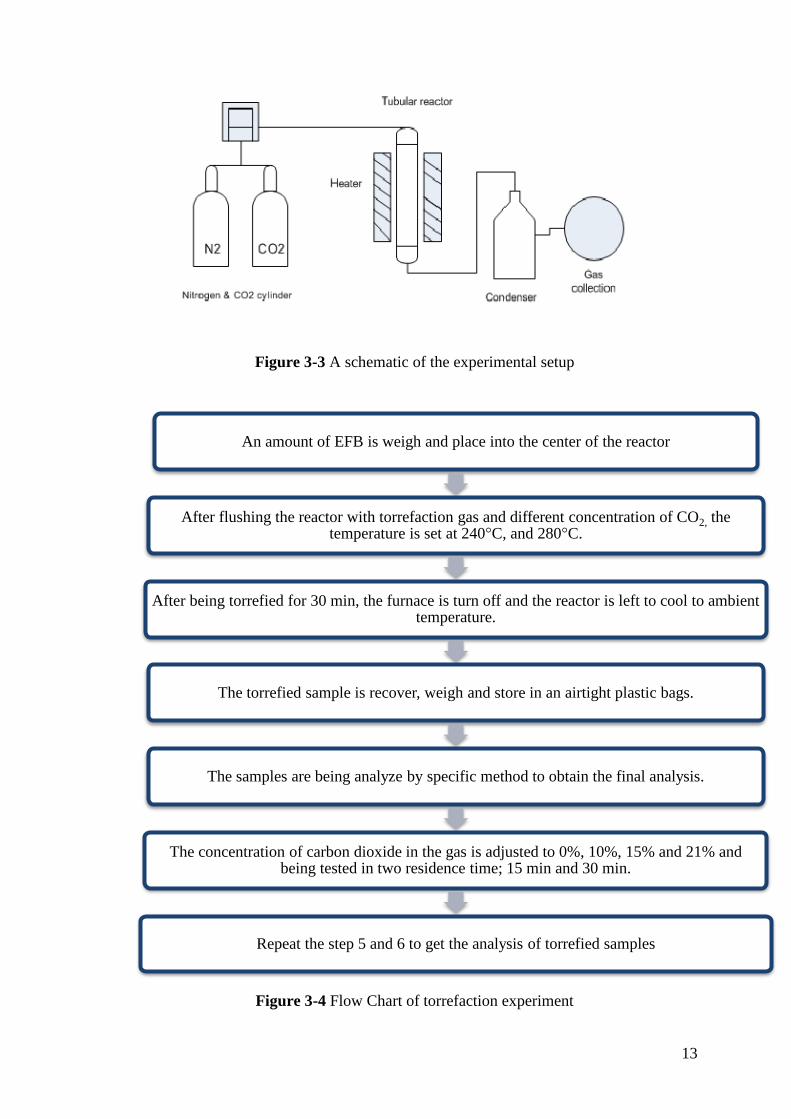
Figure 3-3 A schematic of the experimental setup ......................................................... 13
Figure 3-4 Flow Chart of torrefaction experiment .......................................................... 13
Figure 3-5 Mechanical Grinder in FKKSA Open Lab ................................................... 14
Figure 3-6 Gas pycnometer ............................................................................................. 15
Figure 4-1 Graph of Mass yield and Temperature .......................................................... 20
Figure 4-2 Graph Mass yield vs concentration CO2 in 15 min ....................................... 21
Figure 4-3 Graph Calorific Value vs concentration of CO2 ........................................... 23
Figure 4-4 Graph of energy yield vs temperature ........................................................... 24
Figure 4-5- Scanning Electron Microscopy (SEM) image for raw EFB at magnification
(a)50x, (b)100x, (c)500x and (d)1000x. ......................................................................... 25

XIII
LIST OF TABLES
Table 4-1 Proximate, heating value and particle density of the raw Empty Fruit Bunch
........................................................................................................................................ 19
Table 4-2- Proximate Analysis of torrefied EFB ............................................................ 22
Table 4-3- SEM images of torrefied EFB at 240oC and 280oC, 10% CO2 in 30 min .... 26
Table 4-4- SEM images of torrefied EFB at 240oC and 280oC, 15% CO2 in 30 min .... 27
Table 4-5 - SEM images of torrefied EFB at 240oC and 280oC, 21% CO2 in 30 min ... 28
Table 4-6- SEM images of torrefied EFB at 240oC and 280oC, 10% CO2 in 15 min .... 29
Table 4-7 - SEM images of torrefied EFB at 240oC and 280oC, 15% CO2 in 15 min ... 30
Table 4-8 - SEM images of torrefied EFB at 240oC and 280oC, 21% CO2 in 15 min ... 31

XIV
LIST OF SYMBOL
% - Percentage
°C - Degree Celsius
g - Gram
min - Minute

XV
LIST OF ABBREVIATION
EFB - Empty Fruit Bunch
O/C - Oxygen-Carbon Ratio
𝑦𝑀 - Mass yield
CO2 - Carbon Dioxide
𝐶𝑉 - Calorific value (MJ/kg)
𝑦𝐸 - Energy yield
TGA - Thermogravimetric analysis
HHV - Higher heating value
1
CHAPTER 1
1 INTRODUCTION
1.1 Background study
Biomass has been known as a renewable fuel that can be used to produce heat and
power. The increasing of world population and economic growth leads to increase in
world energy demand and consumption especially in developing countries. Many of the
renewable energies sources such as solar, wind, biomass, tide, wave and geothermal
energy are being developed nowadays (Lund, 2007). Moreover, the depletion of
conventional fuel over the years has urged scientists all over the world to think about the
solution for this problem. Therefore, a reliable affordable and clean energy supply such
as biomass as a substitute to fossil fuels has become more promising.
Renewable energy especially biomass seems to be most promising option for
Malaysia. Malaysia was the second largest producer of palm oil, producing 18.9 million
tonnes, or 38% of the total world supply in 2011 (PalmOilWorld.org 2011). There are
many of waste products from the palm oil industry that can be used as a biomass. They
include empty fruit bunches (EFB), mesocarp fiber, kernel shells, fronds and trunks
(Uemura et al., 2013). Normally, biomass is burned to release the chemical energy in the
material and convert it into heat energy and carbon dioxide (CO2) produced is released
into the atmosphere. It is considered a carbon-neutral fuel that is based on the cycle
between carbon and the atmosphere (Chen and Wu, 2009). Even though there are some
problems need to be overcome such as lower calorific value, high moisture content (Chen
et al., 2011), low energy density and high ash content (Uemura et al., 2013), its potentials
are limitless.
CO2 is one of the greenhouse gases that is released into the environment during
combustion of fossil and renewable sources. Hot gases produced from boiler exhaust that
have higher percentage of CO2 in it that easy to obtain makes it an alternative option to
be used as the biomass pre-treatment medium.

2
Among technologies developed to improve these problems is the torrefaction
process, in which the biomass are thermally treated in temperature between 200 to 300°C
under atmospheric conditions without the presence of any types of oxidizer (Peng et al.,
2012). Recently, it was found that the presence of a small quantity of oxidizer at the
torrefaction condition has the potential to improve the properties of torrefied biomass
(Thanapal et al., 2014, Uemura et al., 2013).
As for this research, the study will be concerning on the investigation of the
optimum temperature and the effectiveness of carbon dioxide in the torrefaction process
that will help to increase the fuel properties of biomass using empty fruit bunches.
Therefore, the study will be the seed of hope for the solution to our global energy problem
besides promoting the potential of local agricultural waste.
1.2 Motivation and statement of problem
There are many reports about global warming and changing of earth’s climate that
is a big threat and challenge in our era. The main factor that causes this kind of disaster
is the release of greenhouse gases to the environment. So, to reduce the emission of these
greenhouse gases and to promote sustainable environment, the renewable energy is the
perfect solution to achieve the targets. On the other hand, Malaysia also one of the biggest
producer of palm oil in the world. There are a lot of biomass feedstock that can be used
to produce many type of products such as bio-based value added products, bio-fuel and
direct fuel for power generation.
Basically for this study, the aim is to improve the fuel properties for the biomass
so that the gasification process that takes place after torrefaction will be more efficient.
Mainly the biomass has low energy density in combination with its high moisture content
result that uses more energy in the gasification process. This is because higher gasification
efficiencies can be achieved for fuels with low O/C ratios, such as coal, than for fuels
with high O/C ratios such as biomass (Prins et al., 2003).

3
Using raw biomass for the gasification process will results in poor syngas
production and will results in high tar concentration. Thermal pre-treatment or
torrefaction of biomass is a promising method to convert biomass to high energy density
hence a superior biomass in the form of bio char. So, under certain torrefaction conditions,
the torrefied biomass can have properties comparable to low rank coals that may be used
for heat and power generation (Chen and Kuo, 2010).
In this study, torrefaction of empty fruit bunches was carried out in a fixed tubular
reactor in the presence of carbon dioxide ranging from 0% to 21%. The effects of carbon
dioxide, temperature and torrefaction time on the mass and energy yields were
investigated. The EFB was dried, ground and sieved before torrefaction.
1.3 Research objectives
This research project aims to investigate the effectiveness of CO2 in enhancing the
torrefaction process in producing bio-char with properties compatible to coal. Moreover,
this study aims to improve the torrefaction process by using different concentration of
carbon dioxide, CO2 as an enhancer. The optimum temperature to be used in this process
will also be determined. This is then followed by the characterization of the properties of
biomass based on the analysis that will be conducted.
1.4 Scope of this research
The following are the scope of this research:
a) To study the effect of temperature at 240°C and 280°C on the biomass samples in
the torrefaction process.
b) To study the effect of concentration of CO2 at 10%, 15% and 21% in enhancing
the torrefaction process.
c) To investigate the effect of torrefaction time in the torrefaction process.

4
1.5 Organisation of this thesis
The structure of the reminder of the thesis is outlined as follows:
Chapter 2 provides a description of the torrefaction process that is the important theory
in this study. Also, there are general description on the condition of the torrefaction
process and why this process is suitable to change the properties of biomass that will be
used in the gasification process. This chapter also provides a brief discussion of previous
study conducted in the torrefaction process.
Chapter 3 gives a review of the procedure be conducted for the experiment. First, the
preparation of samples was explained before proceed to the experiment. In this chapter,
we explained about how to prepare the samples and the initial drying before the EFB can
be torrefied. Also, there are explanation about the procedure to conduct the torrefaction
experiment whether for inert torrefaction gas or the mixture between nitrogen and oxygen.
Chapter 4 gives the results for preparation of samples and the expected result obtained
from the journal. In this chapter, some of graph was plotted to shown the trend of mass
yield over the temperature as well as the concentration of CO2. Some of discussion also
presented to support the result from the previous works.
Chapter 5 draws together a summary of the full thesis and outlines the future work which
might be derived from this work.

5
2 LITERATURE REVIEW
2.1 Overview
This chapter presents the basic principles of torrefaction process that will be
conducted in this study. It also contains the general knowledge about the torrefaction
process and the way to conduct the experiment regarding this process. Moreover, the
extensive review from selected journals with the citation is also included in this chapter.
Some of the findings in the review and method of previous works also included.
2.2 Biomass
Biomass is organic material from recently living things, including plant matter
from trees, grasses, and agricultural crops. The chemical composition of biomass varies
among species, but basically consists of high, but variable moisture content, a fibrous
structure consisting of lignin, carbohydrates or sugars, and ash.
Common sources of biomass are included agricultural which varies from food
grain, bagasse, corn stalk, straw, seed hulls, nutshells and manure from cattle. In
Malaysia, the biomass from oil palm wastes such as mesocarp fibre, kernel shell, empty
fruit bunch, fronds and trunk are mostly available. Some disadvantages of biomass are it
cannot be stored or transport for a long shipping because of the hygroscopic nature (Chen
and Kuo 2010).
The hydrophilic nature of biomass is related to the presence of OH groups in
biomass. Hemicellulose was found to have the highest potential to adsorb water, followed
by cellulose and lignin. Those structure are contain in the biomass that will increase the
moisture content of it. Hence, the reason of the hydrophobic nature of torrefied biomass
can be recognized to reduce amount of hemicellulose and OH groups in the biomass
(Thanapal, et al. 2014).

6
2.3 Torrefaction Process
Torrefaction is one of the thermal pre-treatment techniques used to improve the
properties of biomass (Deng et al., 2009). In this process, the raw biomass is heated in an
inert or nitrogen atmosphere at temperatures between 200 - 300°C (Uemura et al., 2013,
Deng et al., 2009). It is based on the removal of oxygen from biomass which aims to
produce a fuel with increased energy density. A fraction of the volatile matter of the dry
biomass is removed as well as the moisture. In the torrefaction process, the properties of
biomass can be altered depending on its hydrophilic, fibrous and severity so that the
product is brittle and easy to grind (Koppejan et al., 2012). There are studies that proved
that characteristic of lignocellulosic can be improved into a useful biofuel.
There are many advantages of torrefaction process such as (1) reduce the moisture
content and O/C ratio (Couhert et al., 2009), (2) increase the higher heating value (HHV)
or energy density (Yan et al., 2009) of biomass. Also, the torrefied biomass shows more
uniform properties such as moisture content compared to the raw biomass (Chen Hsu et
al., 2011).
Torrefied biomass mainly used as a renewable fuel for combustion or gasification
(Prins, et al., 2003). Torrefaction process is one of best pre-treatment method for biomass
before the gasification process take place. Torrefaction studies involving biomass have
mostly been conducted on woody (Lauan) blocks (Chen Hsu et al., 2011), pine chips and
logging residue chips (Phanphanich and Mani, 2011), rice straw and rape stalk (Deng et
al., 2009), empty fruit bunches (EFB) (Uemura et al., 2013), bamboo (Chen et al., 2011),
mesocarp fiber, kernel shell, beech wood (Couhert et al., 2009) and willow.
Chen et al., (2011) torrefied the woody biomass (Lauan) blocks and recommended
that the operation should be conducted at the temperature of 250°C and time longer than
1 hour. Deng et al. (2009) studied the yields of solid and liquid product of rice straw and
rape stalk at temperature 200°C, 250°C and 300°C. The result showed that as the
temperature increases, the yield of solid decreases. Couhert et al.(2009) stated that the
energy density increases with torrefaction temperature and found an increase of 20% at a
torrefaction temperature of 280°C.

7
2.4 Previous work on Torrefaction Process
One of the previous study of the torrefaction process using the CO2 as the
enhancer used woody biomass which are mesquite and juniper as their samples (Thanapal,
et al. 2014). The higher mass loss at the temperature range for torrefaction was obtained
by using the CO2 compared to the inert atmosphere. Other than that, by comparing the
mass and energy yield of the torrefaction of mesquite and juniper, the optimum
temperature seems to be at 240°C. The use of CO2 as the torrefaction medium was found
to improve the grindability of the biomass because of the increased surface area of
biomass samples.
Research done by Arias et al. (2008) on the torrefaction of eucalyptus showed that
torrefaction of raw biomass increases the grindability of the biomass. The samples
(eucalyptus) were torrefied between 240°C and 280°C with varying residence times
between 15 minutes to 3 hours. The size distribution analysis showed an increase in the
residence time at a given temperature resulted in smaller particle sizes, indicating easier
grindability.
Some of the previous work is mostly discussed on the effect of temperature and
residence time on different biomass but most of them are not focused about the effect of
biomass in non-inert atmosphere for torrefaction. The uses of CO2 in torrefaction process
will provide an opportunity for a lower pretreatment cost of biomass.
2.5 Torrefaction Technologies in Industries
Some torrefaction technologies are proficient of handling feedstock with small
particles such as sawdust and other are capable of processing large particles. Example of
torrefaction technologies that can be found in industries nowadays such as rotating drum,
screw reactor, torbed reactor and fixed bed. The most important reactor technologies are
briefly described below according to their advantages.
The rotating drum is a continuous reactor and can be regarded as proven
technology for various application (Koppejan, et al., 2012). For torrefaction applications,
the biomass in the reactor can be either directly or indirectly heated using superheated
steam of flue gas resulting from the combustion of volatiles.

8
Besides that, screw type reactor also being used in torrefaction process. It is a
continuous reactor, consisting of one or multiple auger screws that transport the biomass
through the reactor (Junsatien, et al., 2013). A disadvantage of screw reactor is the
formation of char on the hot zones that caused limited mixing of the biomass. A screw
reactor is relatively inexpensive, however the scaleability is limited because the ratio of
screw surface are to reactor volume decreases for larger reactors.
Figure 2-1-Auger screw type reactor
The torbed reactor basically are proven technology for various applications,
including combustion. Recently, torrefaction process are done in torbed technology only
in batchwise that is very small scale (2 kg/h). In a torbed reactor, a heat carrying medium
is blown from the bottom of the bed with high velocity that gives biomass particles inside
the reactor both a vertical and horizontal movement (Harrison 2014). It can heat up to
380°C that resulting in higher loss of volatiles.

9
2.6 Gasification of Biomass
Gasification is the conversion of raw materials into solid or liquid fuel gas that is
valuable and convenient or chemical raw materials that can be burned to release energy
or used for production of high-value added chemicals (Prabir, 2013). The low moisture
content and good ratios of C/H/O in the biomass samples after torrefaction is excellent
for gasification. Meanwhile, gasification that involved biomass is the conversion of an
organically derived, carbonaceous feedstock by partial oxidation into a gaseous product,
synthesis gas or “syngas” consisting primarily of hydrogen (H2) and carbon monoxide
(CO), with lesser amounts of carbon dioxide (CO2), water (H2O), methane (CH4), higher
hydrocarbons and nitrogen (N2) (Jared P., 2002).
Sometimes pyrolysis, which takes place in higher temperatures and produces a
mixture of gases with hydrogen content can be considered as biomass gasification.
Gasification of biomass is generally observed to follow these reaction:
𝐵𝑖𝑜𝑚𝑎𝑠𝑠 + 𝐻𝑒𝑎𝑡 𝑦𝑖𝑒𝑙𝑑𝑠→ 𝐶𝑂, 𝐶𝑂2, 𝐻2𝑂,𝐻2, 𝐶𝐻4 𝑎𝑛𝑑 𝑜𝑡ℎ𝑒𝑟 𝐶𝐻𝑠, +𝑎𝑠ℎ + 𝑐ℎ𝑎𝑟
In the gasification process, the particle size and moisture contents are the crucial
factor for operation. Hence, the smaller particle size gives additional surface area to react
in the gasification process and there is more energy is required at the high operating
temperature to break the complex long chain of lignincellulosic biomass into simplest
carbon chain of syngas. Gasification using torrefied biomass could potentially benefit
from improved flow properties of the feedstock, increased levels of H2 and CO2 in the
resulting syngas, and improved overall process efficiencies (Koppejan, Sokhansanj, et al.,
2012). The grindability could be considered positive aspect in the case of entrained flow
gasifier. As of yet, there is hardly any practical knowledge available on the options and
limitations of torrefied biomass for gasification. Gasification of low quality biomass
results in poor synthetic gas quality and high tar concentration.
10
3 MATERIALS AND METHODS
3.1 Overview
This chapter presents a methodology to conduct the torrefaction experiment by
using certain raw materials and experiment setup. Preparation of EFB samples and
procedure for torrefaction experiment is included here. Several characterization tests are
done to determine the characteristic of EFB and the effectiveness of torrefaction process.
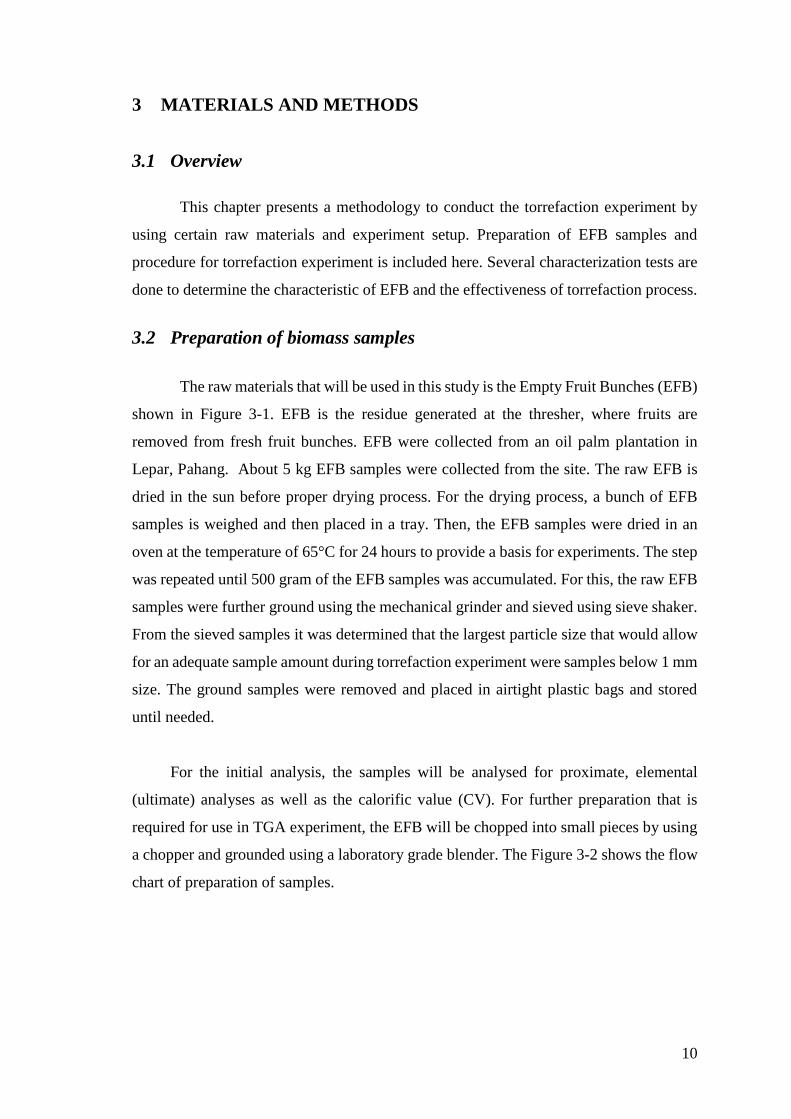
3.2 Preparation of biomass samples
The raw materials that will be used in this study is the Empty Fruit Bunches (EFB)
shown in Figure 3-1. EFB is the residue generated at the thresher, where fruits are
removed from fresh fruit bunches. EFB were collected from an oil palm plantation in
Lepar, Pahang. About 5 kg EFB samples were collected from the site. The raw EFB is
dried in the sun before proper drying process. For the drying process, a bunch of EFB
samples is weighed and then placed in a tray. Then, the EFB samples were dried in an
oven at the temperature of 65°C for 24 hours to provide a basis for experiments. The step
was repeated until 500 gram of the EFB samples was accumulated. For this, the raw EFB
samples were further ground using the mechanical grinder and sieved using sieve shaker.
From the sieved samples it was determined that the largest particle size that would allow
for an adequate sample amount during torrefaction experiment were samples below 1 mm
size. The ground samples were removed and placed in airtight plastic bags and stored
until needed.
For the initial analysis, the samples will be analysed for proximate, elemental
(ultimate) analyses as well as the calorific value (CV). For further preparation that is
required for use in TGA experiment, the EFB will be chopped into small pieces by using
a chopper and grounded using a laboratory grade blender. The Figure 3-2 shows the flow
chart of preparation of samples.

11
Figure 3-1 Raw Empty Fruit Bunches (EFB)
Figure 3-2 Flow Chart of Preparation of Samples
The EFB samples are collected from the oil palm plantation in Felda Lepar
Then, the EFB samples is dried in an oven with the temperature of 65°C for 24 hours
After that, the EFB samples are grinded into a mechanical grinder to get about 8 mm to 5 mm in the range of size.
EFB samples is blended inside the laboratory blender to minimise the size into 2mm and below.
Next, the samples are sieved into different range of size such as 2 mm-1 mm,0.99 mm to 0.5 mm and 0.49 mm to 0.25 mm.
The sample is analyzed to get the proximate, ultimate and particle density for intial analysis
The samples are cooled and stored in the airtight plastic bags until further use.

12
3.3 Torrefaction experiments
The experimental setup consists of a N2 cylinder tank, CO2 cylinder tank, and a
vertical stainless-steel tubular reactor equipped with an electrically heated furnace and a
liquid/gas collection unit. The experiment consists of two parts; the first part is inert
torrefaction that only nitrogen gas flowed into the reactor. The second part is carbon
dioxide and nitrogen that co-feed flowed into the reactor. The nitrogen and carbon dioxide
tank was used to supply nitrogen and carbon dioxide as a carrier gas for providing an inert
environment in the torrefaction experiment. The volumetric flow rate of nitrogen was
controlled by an electronic mass flow controller. A schematic diagram of the experiments
is shown in Figure 3-3.
A total of 3 g of EFB sample was weighed and put in a tubular reactor. The reactor
was placed at the center of the furnace. When the EFB samples were in the furnace, they
are heated in the furnace at a heating rate of 10 °C/min until the desired torrefaction
temperature is reached at 200 - 300°C. N2/CO2 was used to purge the reactor depending
on the medium used for torrefaction.
A constant flow of 50 mL/min of N2/CO2 was set using variable area mass flow
controller to maintain inert/non reacting environment during the process. After flushing
the reactor with torrefaction gas and different concentration of CO2, the temperature is set
at 240°C and 280°C. The samples were heated from room temperature to the desired
temperature and kept constant within 30 minutes. After being torrefied for 30 minutes,
the furnace is turn off and the reactor is left to cool to ambient temperature. Then the
torrefied sample is recovered, weighed and kept in airtight plastic bags prior to further
analysis. The gas product from the decomposition reaction of biomass is channelled to
the bottom of reactor, passed through a condenser at room temperature. The concentration
of carbon dioxide in the gas stream is also adjusted to 0%, 10%, 15% and 21vol% to
investigate the effect of carbon dioxide concentration on torrefaction. The torrefaction
gas is prepared by mixing the nitrogen with carbon dioxide under ambient temperature.
Figure 3-4 summarizes the work flow of experiments after 30 minutes in the furnace.
13
Figure 3-3 A schematic of the experimental setup
Figure 3-4 Flow Chart of torrefaction experiment
An amount of EFB is weigh and place into the center of the reactor
After flushing the reactor with torrefaction gas and different concentration of CO2, the temperature is set at 240°C, and 280°C.
After being torrefied for 30 min, the furnace is turn off and the reactor is left to cool to ambient temperature.
The torrefied sample is recover, weigh and store in an airtight plastic bags.
The samples are being analyze by specific method to obtain the final analysis.
The concentration of carbon dioxide in the gas is adjusted to 0%, 10%, 15% and 21% and being tested in two residence time; 15 min and 30 min.
Repeat the step 5 and 6 to get the analysis of torrefied samples

14
Grinder is used to shred or grind the EFB into small, about 8 to 10 mm in length is shown
in Figure 3-5.
Figure 3-5 Mechanical Grinder in FKKSA Open Lab
3.4 Data Analysis
3.4.1 Gas Pycnometer
A pycnometer shown in Figure 3-6 is a device used to determine the density of a
material. A pycnometer is usually made of glass, with a close-fitting ground glass stopper
with a capillary tube through it, so that air bubbles may escape from the apparatus. The
particle density of a powder, to which the usual method of weighing cannot be applied,
can also be determined with a pycnometer.

15
Figure 3-6 Gas pycnometer
3.4.2 Thermogravimetric analysis (TGA)
The samples are also tested by using a thermogravimetric analyzer (TGA) to obtain
the proximate analysis. TGA is a thermal analysis technique performed to determine the
changes in the weight of a sample as a function of temperature. TGA of the raw samples
is carried out using PerkinElmer Pyris 1 TGA. The sample (5mg) is loaded into a sample
pan, and 100 mL/min of nitrogen is used to maintain inert environment. The samples are
heated at a constant rate of 10oC/min from room temperature to 900 oC. The results from
TGA will be displayed in term of decomposition graph and used to determine moisture
content, volatile matter, fixed carbon and ash content in the EFB. The increased mass loss
showed when using the CO2 as purge gas when tested with TGA (Eseltine, 2011).
The the heating rate of 10°C /min was executed by a thermogravimetry where the
temperature ranged from 25 to 600°C. In TGA, 5 mg of sample was tested where the flow
rate of carried gas was 40ml/min. The data collected by the TGA can be analyzed in a
many ways. The most basic analysis of TGA data is in the creation of thermograms which
plot the weight loss of the substance being tested versus temperature (time can also be
used as the x-axis). Thermograms give a basic picture of the thermal breakdown of a
substance over a given temperature range.