Embed Size (px)
Citation preview

Biomass Expected Returns:The Capital Asset Pricing Model
Larry Sullivan, Project Management Consultant
Adjunct Professor, The Citadel
Economic Geography
Trident Technical College
Lawrence D. Sullivan & Company, Inc.
Carla M. Wood, Ph.D.
Advanced Bioeconomy Feedstocks ConferenceRoyal Sonesta Hotel, Vieux Carré
New Orleans, LouisianaJune 9-10, 2015
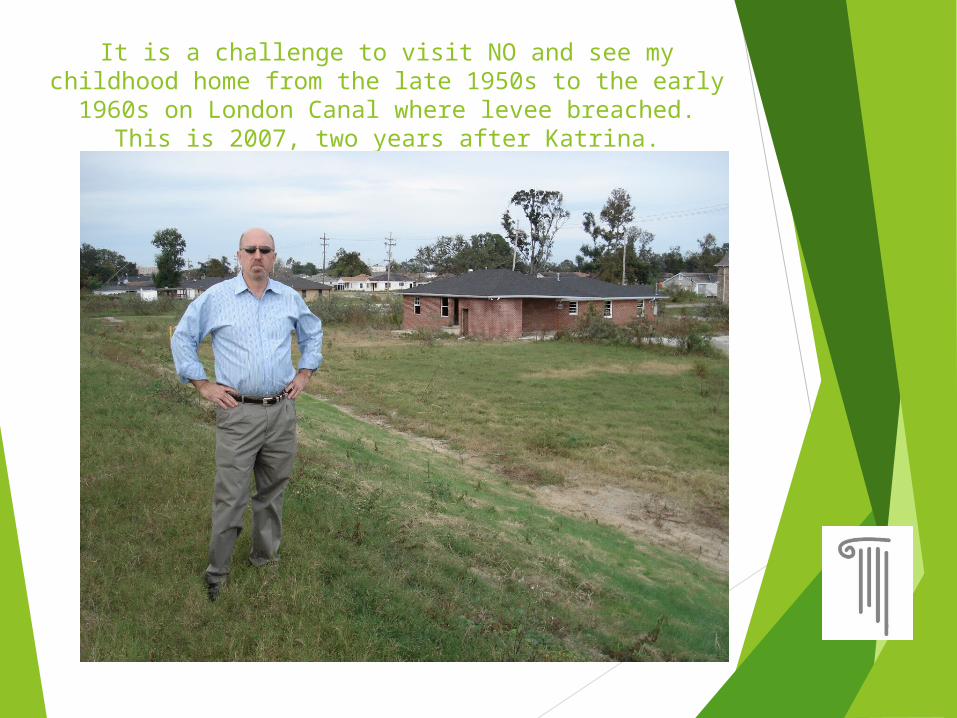
It is a challenge to visit NO and see my childhood home from the late 1950s to the early 1960s on London Canal
where levee breached. This is 2007, two years after Katrina.

Lawrence D. Sullivan – Past & Present
20 Years in Oil & Gas (Dresser,
Imperial Chemical Industries &
Conoco/Dupont) as Petroleum
Engineer and Manager
Last 13 Years in Biofuels, Biomass,
Biochemicals - Early Stage Firms
15 Years Living and Working
Outside the USA – SEAsia, Middle
East, EU & Africa
Speaker at 35 Conferences –
Beginning at 2004 Biotechnica
America on Biofuels
Advisor to Gerson Lehrman
Clients
Top 2% Expert since 2004
Due Diligence for GLG Clients
Turner, Mason & Company - Oil
Refiner Acquisitions of Biofuel
Assets in 2008 and 2009
Expert Witness
Adjunct Faculty at Trident
Technical College and Adjunct
Professor at The Citadel
3

Carla M. Wood, Ph.D.
Academic Career
B.S., The Evergreen State College - Biochemistry
Ph.D., Texas A&M University – Biochemistry & Cell Biology
Post Doctorate, Baylor College of Medicine, Depts. of Cell Biology – Human DNA Repair, Cellular Transformation & Mutagenesis
Staff Scientist, NIH, National Institute on Aging, Molecular Genetics – Genes of Senescence, Stress Response, & DNA Damage
Research Assistant Professor, University of Minnesota – 1) Expression Analysis of Non-Receptor Protein Tyrosine Kinases in Childhood Leukemia 2) Biomarkers in Multiple Myeloma
Patent Law Technical Advisor, Merchant & Gould, LLC, Minneapolis & Seattle
Consulting Career
Consultant at L. D. Sullivan & Co.
Since 2004 (Owner Since 1998)
Advisor to Gerson Lehrman
Group Clients - Top 2% Experts
Due Diligence for GLG Clients
Expert Witness Biotechnology
Cases
4

Outline of Presentation – Themes
1. What is the Capital Asset Pricing Model (CAPM) and who uses it?
2. Return on Capital Employed (ROCE) on investments in raw materials production (e.g., Extraction, Forestry, Agriculture, etc.) with focus on the “arm’s length transactions” between owner of biomass and buyers of biomass.
3. ROCE on the Basic Chemicals (generally has “mining” components)
4. ROCE on the conversion of raw materials to petrochemical intermediates (and Basic Chemicals as well as Seven Building Blocks)
5. Capital Investment Expectations and Conclusions
References and Sources:
www.bizstats.com
Measuring and Addressing Investment Risk in the Second-Generation Biofuels Industry. ICCT. December 2013. www.theicct.org
NexantThinking™ “Next Generation Biofeedstocks: Resources for Renewables” www.Nexant.com Addresses raw materials
Luxresearch, http://web.luxresearchinc.com/download-webinar-alternative-fuels-9_23_14
5

General Concepts for Presentation – Terms Defined Private Enterprise without
state ownership is foundation in US although government is the single largest landowner and hence biomass owner. And, Crown Lands in Canada is noted. Private Land is the Exception, not rule of our world
Tax Credits (income versus excise) – no income, no credit!
Crop Insurance and Forestry?
Export Import Bank – oil subsidy and incentives for oil (issues of depletion compared to renewables)
Basic Land Value or BLV
“Arm’s Length Transactions”
Lifestyle Ranching & Farming Decisions
Forestry versus Agriculture and the BCAP Program
Bone Dry Metric Tonne (2,205 pounds)
Real Estate Investment Trusts (REIT) - Forestry
Master Limited Partnerships (MLP) – O&G
Farm gate, FOB, ex-works, C&F, CIF, etc. Or, what is the price laid on the side of the road?
What is “Economic Rent” and why few talk about it in public?
CAPM shows early or pre-mature IPOs challenged the investors and resulted in excessive ROI expectations
Beta in the CAPM
Cases with KIOR, GEVO, SYNM, CERE, AMRS, etc.
GEVO should be compared to PEIX and GPRE as they use corn as feedstocks.

Capital Asset Pricing ModelReturn on Capital Employed
(ROCE)Formula: Terms:
Return on Capital Employed (both equity and debt) or Equity or Debt
Beta of 1.0 moves with markets
Market Return is set by Investors
Risk Free example is United Kingdom Perpetual Bonds
ICCT reports that Beta on public biotech requires high ROCE for investment
7
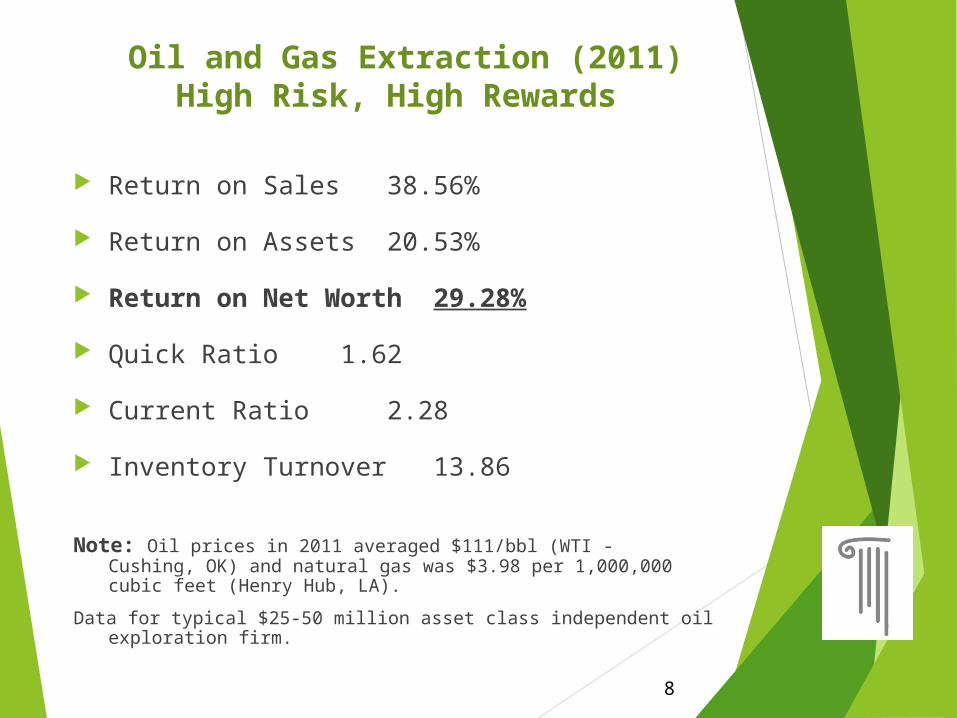
Oil and Gas Extraction (2011)High Risk, High Rewards
Return on Sales 38.56%
Return on Assets 20.53%
Return on Net Worth 29.28%
Quick Ratio 1.62
Current Ratio 2.28
Inventory Turnover 13.86
Note: Oil prices in 2011 averaged $111/bbl (WTI - Cushing, OK) and natural gas was $3.98 per 1,000,000 cubic feet (Henry Hub, LA).
Data for typical $25-50 million asset class independent oil exploration firm.
8
Farmers and Real Estate Investment Trusts (REITs)
The DOE Billion Ton Study and Update relative to landowners
does not look at expected return on Bare Land Value (BLV).
Generally landowner and REIT are passive. They own land the
resources under it or on it. Sometimes they retain ownership
and lease for value added but are not active in the value chain
as Pulp & Paper went offshore and/or exited (MWV, IP, etc.)
Landowners – technology firm with genetics or equipment to
convert cellulose to sugars – conversion company to make
cellulose into biofuels, biochemicals or power – who is whom?
Levi Strauss was quoted to be “mining the miners….”

Extraction Industries: Agriculture and Forestry (2011)
Return on Sales Ag 17.81% Forestry 3.14%
Return on Assets Ag 28.42% Forestry 20.62%
Return on Net Worth Ag 72.02% Forestry
137.39%
Quick Ratio Ag 0.8 Forestry 0.48
Current Ratio Ag 1.11 Forestry 0.5
Inventory Turnover Ag 4.53 Forestry 88.26
Notes: LLC, Inc., (no MLPs) with Net Assets from $1000 – 500,000 which would include
farmer-owned cooperative societies, cattle ranchers, independent forestry owners
and small time miners. Does not cover processors like ADM, Cargill, Bunge or REITs
in forestry, agriculture and mining like Plum Creek or Hancock.
65% of SE USA Forestry is “ma and pa” or small time land owners or “Sole Proprietors”
who make at 10.86% “net profit….” 10
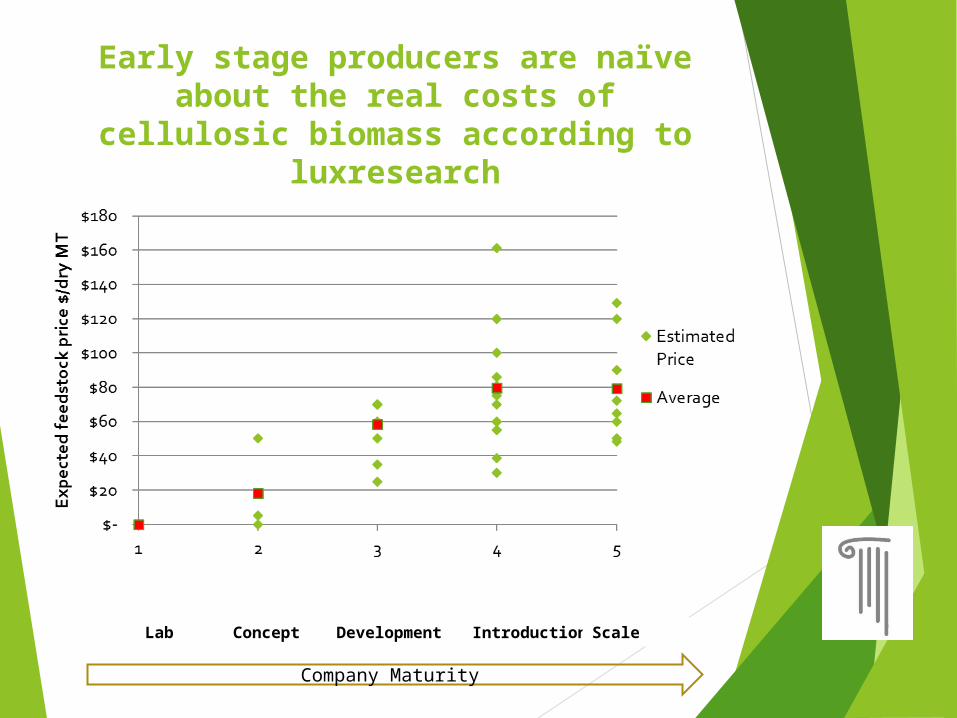
Early stage producers are naïve about the real costs of cellulosic biomass according to luxresearch
Lab Concept Development Introduction Scale
Company Maturity

Gartner’s Time Lines compared to the Typical S Curve
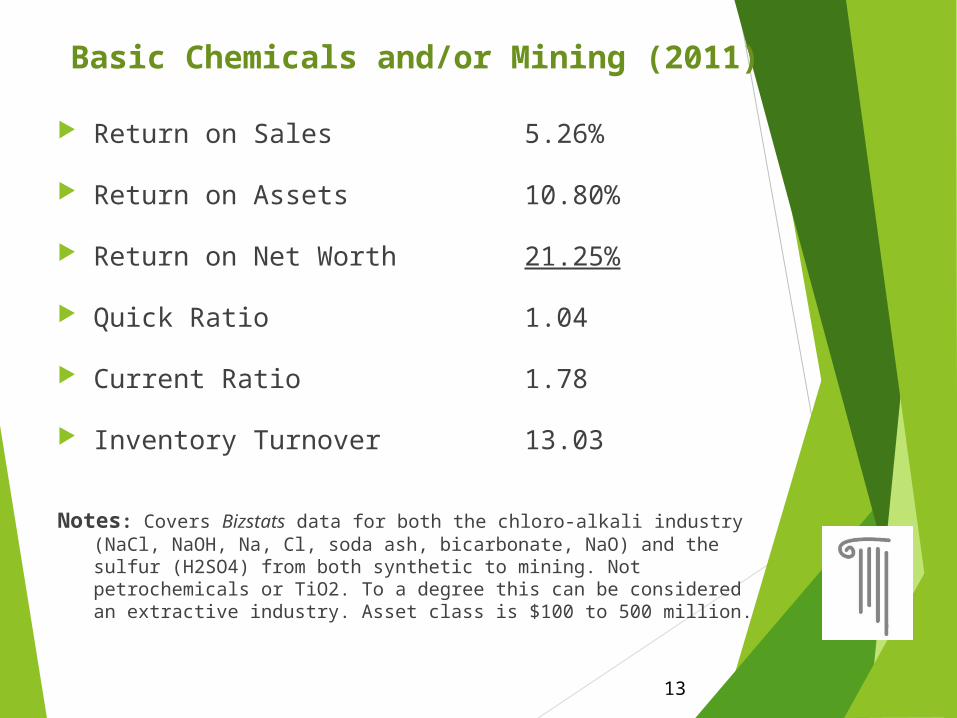
Basic Chemicals and/or Mining (2011)
Return on Sales 5.26%
Return on Assets 10.80%
Return on Net Worth 21.25%
Quick Ratio 1.04
Current Ratio 1.78
Inventory Turnover 13.03
Notes: Covers Bizstats data for both the chloro-alkali industry (NaCl, NaOH, Na, Cl, soda ash, bicarbonate, NaO) and the sulfur (H2SO4) from both synthetic to mining. Not petrochemicals or TiO2. To a degree this can be considered an extractive industry. Asset class is $100 to 500 million.
13

Petroleum Refining (2011)
Return on Sales 24.46%
Return on Assets 31.02%
Return on Net Worth 46.33%
Quick Ratio 2.96
Current Ratio 3.93
Inventory Turnover 8.69
Notes: Covers Bizstats data for both independent refiners (e.g., Tesoro, Valero) and integrated oil & gas production companies who own refinery assets (e.g., Shell, ExxonMobil, Total, BP). It does not cover NYSE traded part State Owned Enterprises (SOE) of China, Brazil, Norway. The typical refinery in this class is $25 - 500 million in asset class.
14

Conversion of Olefins to Petrochemical Plastics (2011)
Return on Sales 6.04%
Return on Assets 8.72%
Return on Net Worth 18.47%
Quick Ratio 1.08
Current Ratio 1.97
Inventory Turnover 6.36
Notes: this includes Bizstats heading “resins, synthetic rubber, and fibers & filaments” for example polypropylene, not propylene, or PET resin, not para-xylene, ethylene glycol or dimethyl terephthalate. Asset Class here is $100 – 250 million. Cargill Natureworks PLA Plastics could be in this class. 15

Why Make Biofuels? US Fuel Projections
16
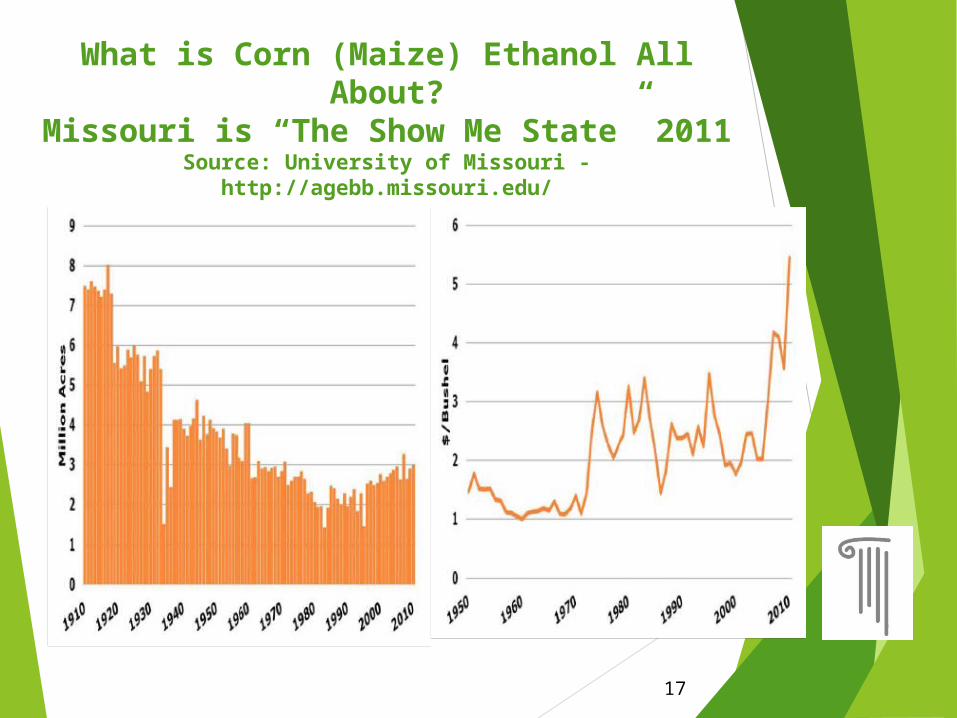
What is Corn (Maize) Ethanol All About?
Missouri is “The Show Me State” 2011Source: University of Missouri - http://agebb.missouri.edu/
17

Corn Ethanol – Follow the MoneyHigher Yields, Better Basis and Farm
Incomes UpUS Farm Policy is a SuccessBushels Per Acre Farm Income in
Millions
18
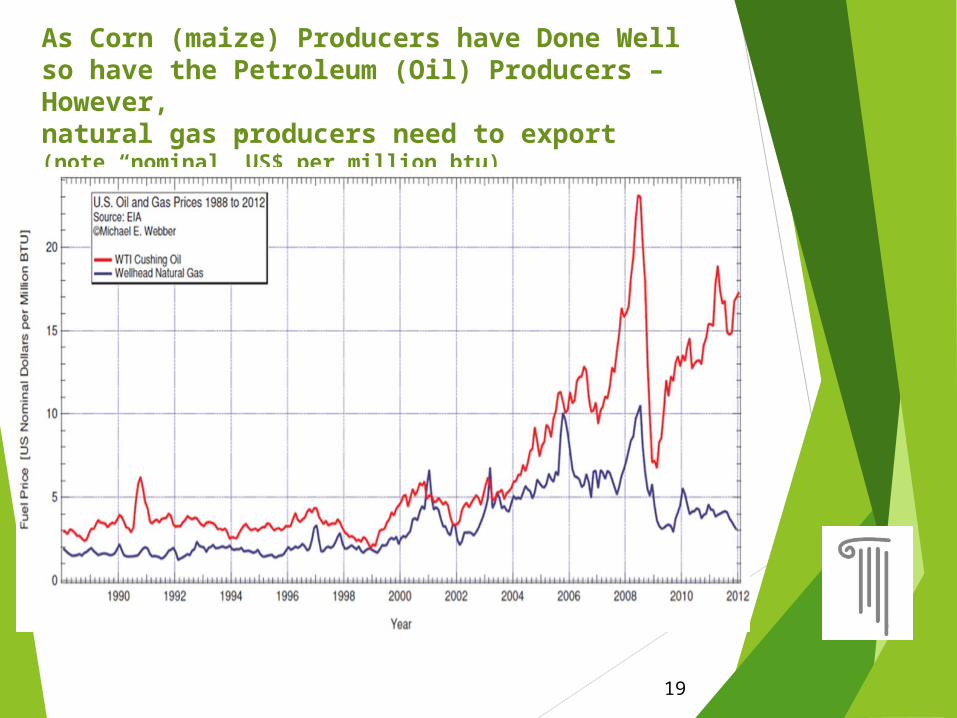
As Corn (maize) Producers have Done Wellso have the Petroleum (Oil) Producers – However,natural gas producers need to export(note “nominal” US$ per million btu)
19

Fundamental Economics - Petrochemicals
If integrated to large refinery complex (BASF, Shell, ExxonMobil,
Saudi Aramco, etc.), then petrochemicals are world class cost
basis. In biomass it appears algae could be the only integrated
pursuit.
If a stand-alone facility, then purchasing of the key intermediates
could be disadvantaged depending upon locations in the world.
Historic fuels/refinery ROI over 40 years averages 9.6%
Historic standalone petrochemicals are 16.7% - however it is 5 -
7% the size of the fuel markets with few producers and buyers.
Most integrated refinery and petrochemical plants have ROI
between the two above since locations can widely for returns. And
there are many national petrochemical firms like Sabic which
operate outside these parameters.
Source – www.bizstats.com and 35 years in oil and gas, petrochemicals.20
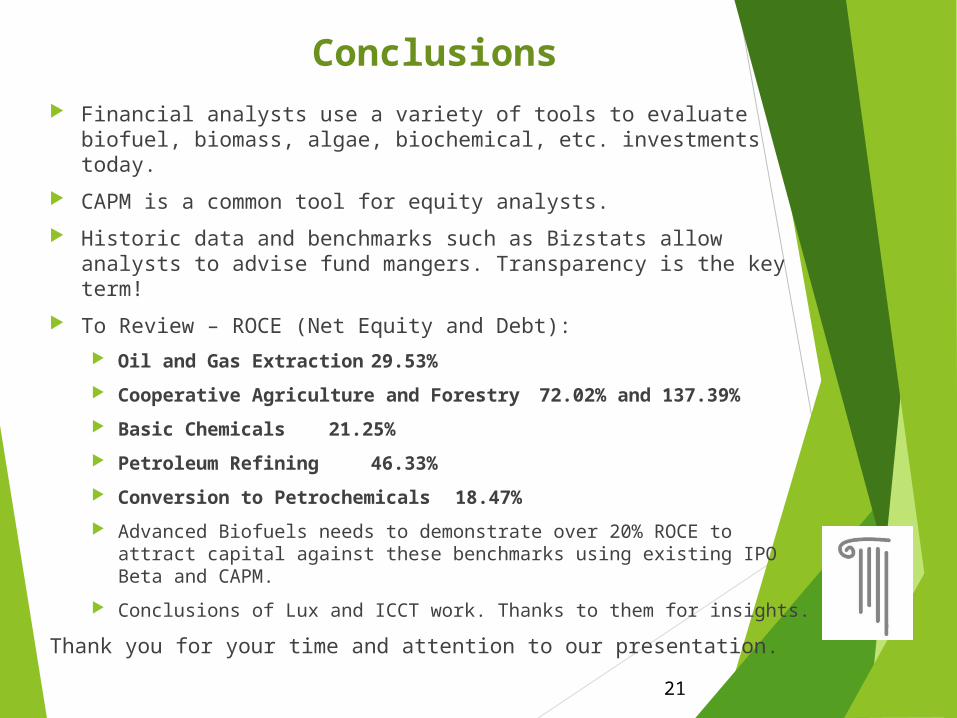
Conclusions Financial analysts use a variety of tools to evaluate biofuel,
biomass, algae, biochemical, etc. investments today.
CAPM is a common tool for equity analysts.
Historic data and benchmarks such as Bizstats allow analysts to advise fund mangers. Transparency is the key term!
To Review – ROCE (Net Equity and Debt): Oil and Gas Extraction 29.53%
Cooperative Agriculture and Forestry 72.02% and 137.39%
Basic Chemicals 21.25%
Petroleum Refining 46.33%
Conversion to Petrochemicals 18.47%
Advanced Biofuels needs to demonstrate over 20% ROCE to attract capital against these benchmarks using existing IPO Beta and CAPM.
Conclusions of Lux and ICCT work. Thanks to them for insights.
Thank you for your time and attention to our presentation.21