Embed Size (px)
Citation preview
���� ������� ������� �� �������� � ��������� �������
������� �� � ��� ����
������ ���� ��������� ����� ����� � ��������� ������� ����
��������________________________________________________________________________________
��������� � ����������� ������ �������
����� �������
���������� ����� ����� �� ��������
�����
BIOMASS
A SUSTAINABLE ENERGY SOURCE
Pier Ugo FOSCOLOPROF. OF CHEMICAL REACTION ENGINEERING
University of L’Aquila, ItalyDepartment of Chemistry, Chemical Engineering and Materials
www.ing.univaq.it [email protected]
Phone: +39 0862 434214 Fax: +39 0862 434203
Biomass gasification and fluid-dynamics of fluidized bed reactors are actively cultivated in the CRE laboratory at UNIVAQ since more than 25 years, at the level of theoretical and experimentalresearch investigations, including industrial contracts.
Research GroupProf. Pier Ugo Foscolo, full professor in Chemical Reaction Engineering, author of more than 70 papers in International Scientific Journals and as many Conference presentations;
Prof. Larry Gibilaro, previously employed (as full professor) at University College London. His outstanding experience in Fluidization-Dynamics has been recently condensed in a book published by Butterworth-Heinemann;
Prof. Antonio Germanà, part-time professor of Chemical and Process Plant Design. He has a long standing academic and professional experience in plant design, construction and commissioning;
Dr Ing. Nader Jand, assistant professor in Chemical Engineering, withoutstanding doctoral and post-doctoral experience in biomass gasification both, at experimental and model developing level;
Post doctoral researchers, PhD students and technical staff
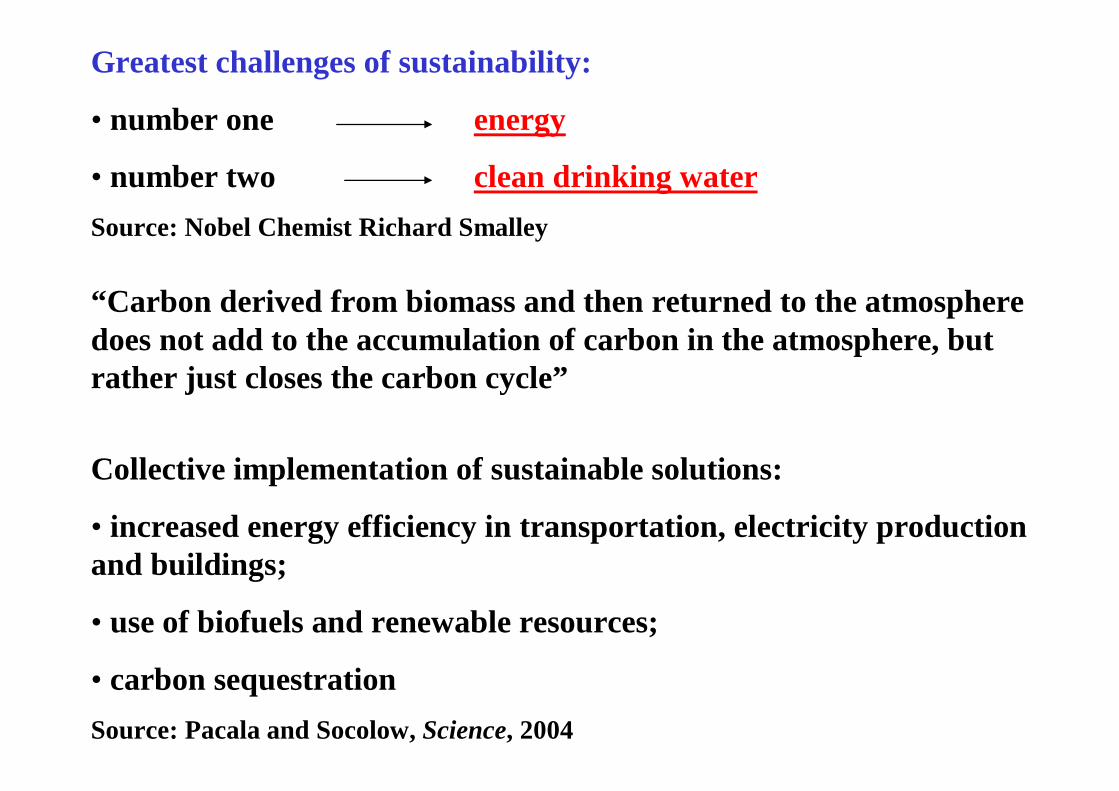
Greatest challenges of sustainability:
• number one energy
• number two clean drinking waterSource: Nobel Chemist Richard Smalley
“Carbon derived from biomass and then returned to the atmospheredoes not add to the accumulation of carbon in the atmosphere, butrather just closes the carbon cycle”
Collective implementation of sustainable solutions:
• increased energy efficiency in transportation, electricity production and buildings;
• use of biofuels and renewable resources;
• carbon sequestrationSource: Pacala and Socolow, Science, 2004
B
I
O
M
A
S
S
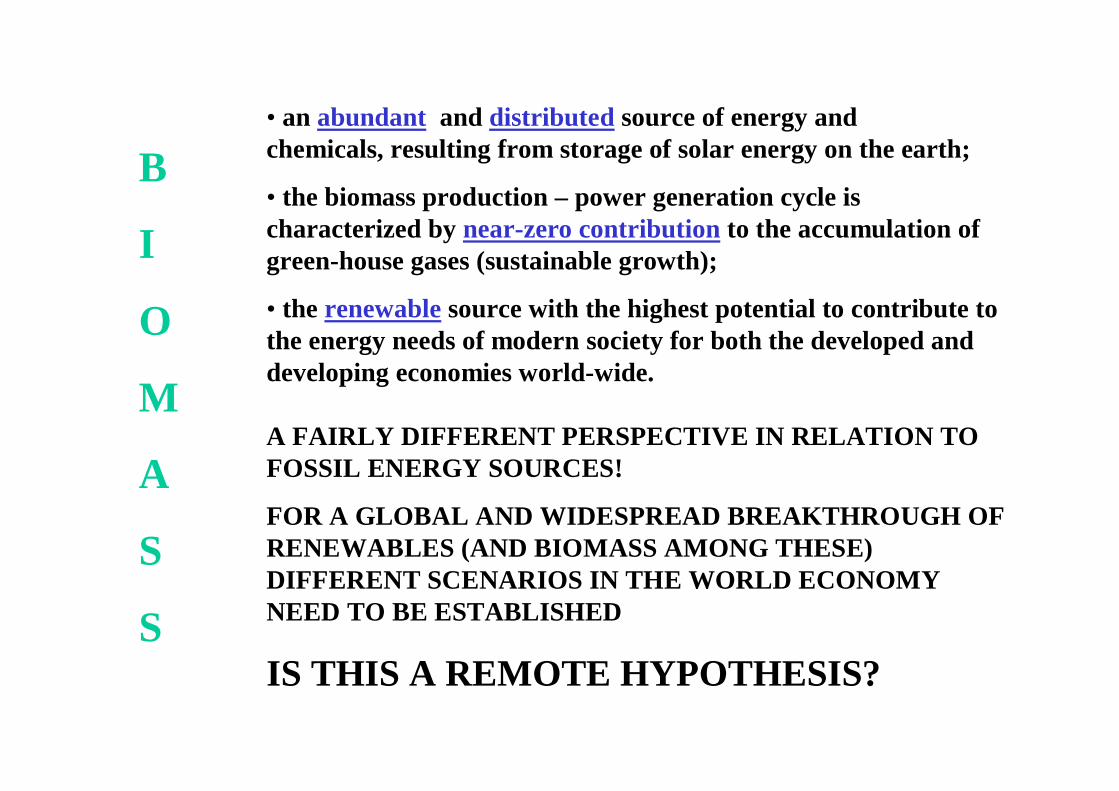
• an abundant and distributed source of energy and chemicals, resulting from storage of solar energy on the earth;
• the biomass production – power generation cycle ischaracterized by near-zero contribution to the accumulation of green-house gases (sustainable growth);
• the renewable source with the highest potential to contribute tothe energy needs of modern society for both the developed and developing economies world-wide.
A FAIRLY DIFFERENT PERSPECTIVE IN RELATION TO FOSSIL ENERGY SOURCES!
FOR A GLOBAL AND WIDESPREAD BREAKTHROUGH OF RENEWABLES (AND BIOMASS AMONG THESE) DIFFERENT SCENARIOS IN THE WORLD ECONOMY NEED TO BE ESTABLISHED
IS THIS A REMOTE HYPOTHESIS?
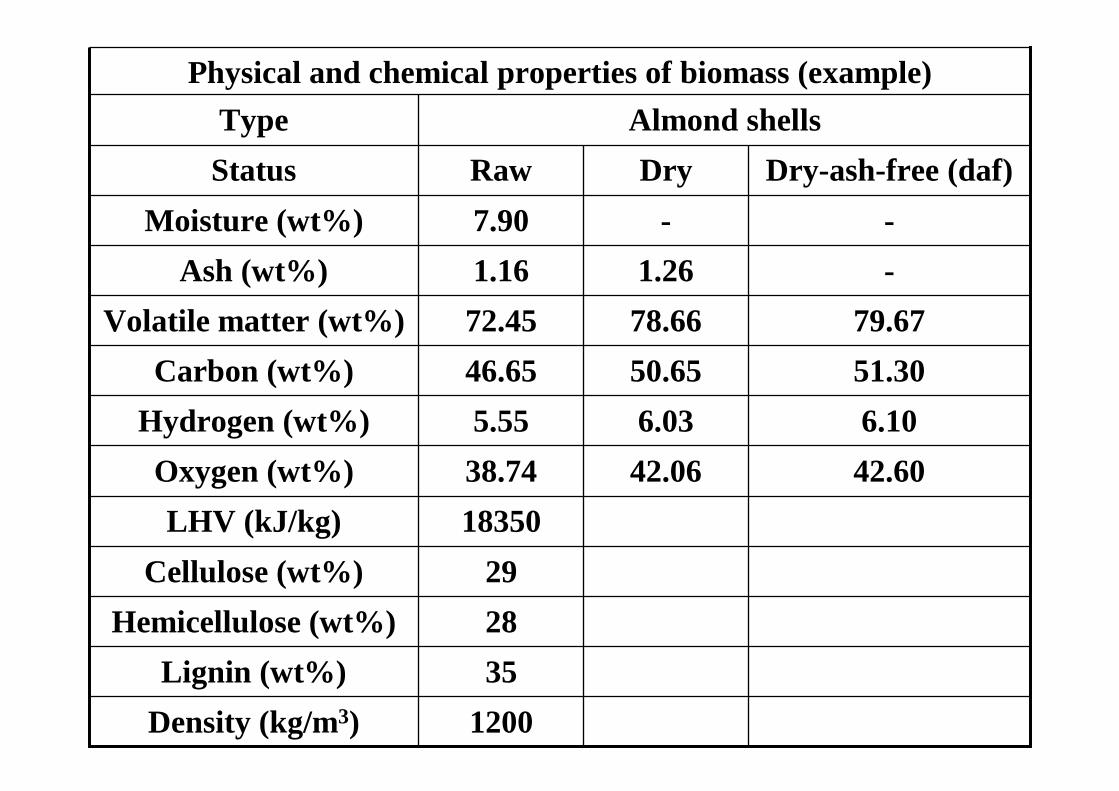
1200Density (kg/m3)35Lignin (wt%)28Hemicellulose (wt%)29Cellulose (wt%)
18350LHV (kJ/kg)42.6042.0638.74Oxygen (wt%)6.106.035.55Hydrogen (wt%)51.3050.6546.65Carbon (wt%)79.6778.6672.45Volatile matter (wt%)
-1.261.16Ash (wt%)--7.90Moisture (wt%)
Dry-ash-free (daf)DryRawStatusAlmond shellsType
Physical and chemical properties of biomass (example)
B
I
O
⏐
R
E
S
I
D
U
E
S
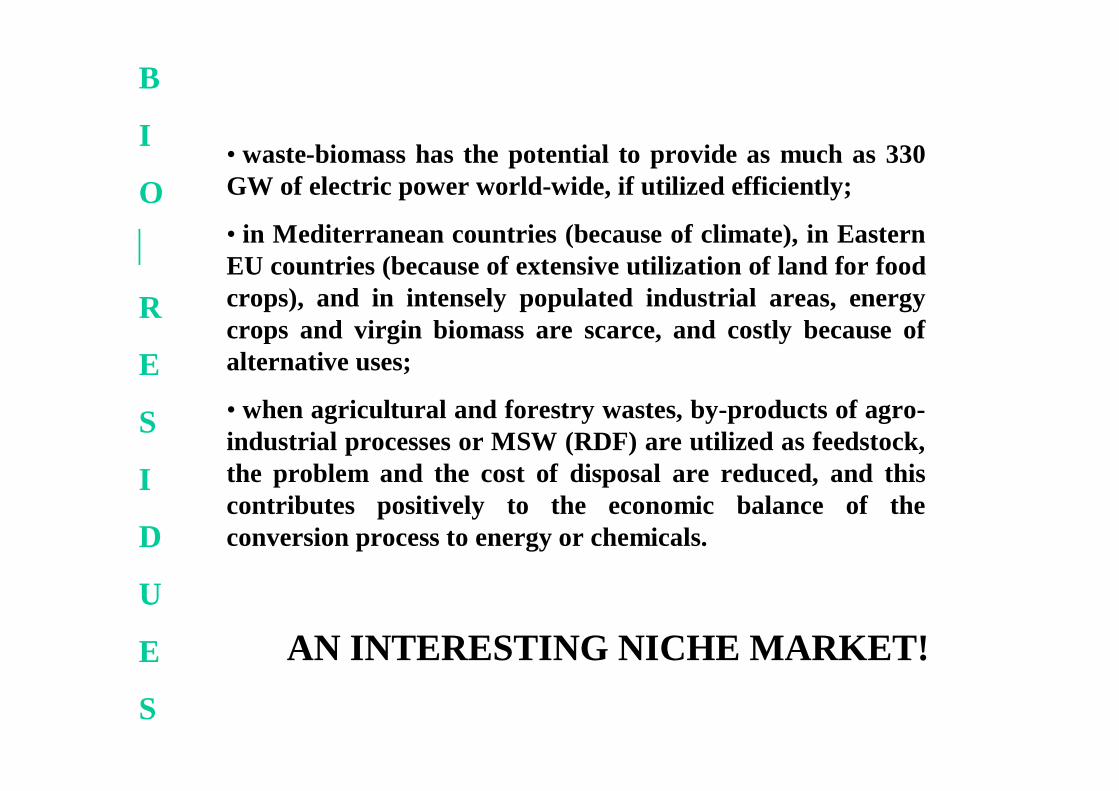
• waste-biomass has the potential to provide as much as 330 GW of electric power world-wide, if utilized efficiently;
• in Mediterranean countries (because of climate), in EasternEU countries (because of extensive utilization of land for food crops), and in intensely populated industrial areas, energycrops and virgin biomass are scarce, and costly because of alternative uses;
• when agricultural and forestry wastes, by-products of agro-industrial processes or MSW (RDF) are utilized as feedstock, the problem and the cost of disposal are reduced, and thiscontributes positively to the economic balance of the conversion process to energy or chemicals.
AN INTERESTING NICHE MARKET!
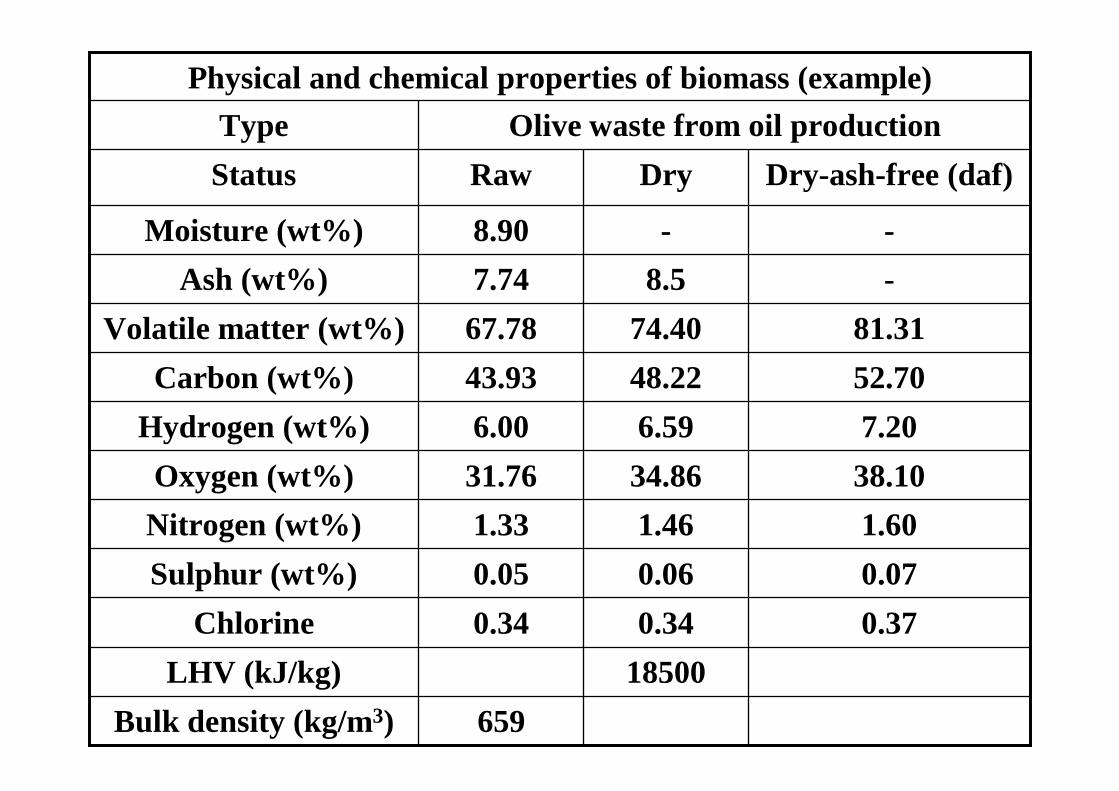
18500LHV (kJ/kg)659Bulk density (kg/m3)
0.370.340.34Chlorine0.070.060.05Sulphur (wt%)1.601.461.33Nitrogen (wt%)38.1034.8631.76Oxygen (wt%)7.206.596.00Hydrogen (wt%)52.7048.2243.93Carbon (wt%)81.3174.4067.78Volatile matter (wt%)
-8.57.74Ash (wt%)--8.90Moisture (wt%)
Dry-ash-free (daf)DryRawStatusOlive waste from oil productionType
Physical and chemical properties of biomass (example)
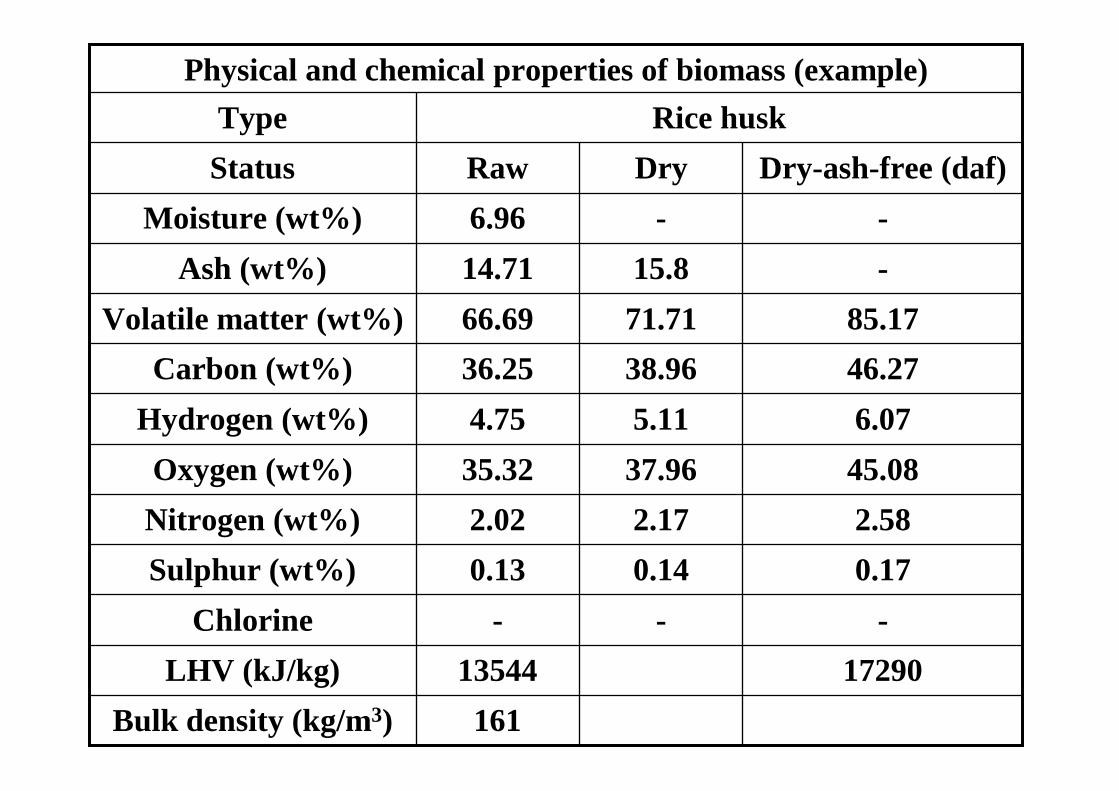
1729013544LHV (kJ/kg)161Bulk density (kg/m3)
---Chlorine0.170.140.13Sulphur (wt%)2.582.172.02Nitrogen (wt%)45.0837.9635.32Oxygen (wt%)6.075.114.75Hydrogen (wt%)46.2738.9636.25Carbon (wt%)85.1771.7166.69Volatile matter (wt%)
-15.814.71Ash (wt%)--6.96Moisture (wt%)
Dry-ash-free (daf)DryRawStatusRice huskType
Physical and chemical properties of biomass (example)
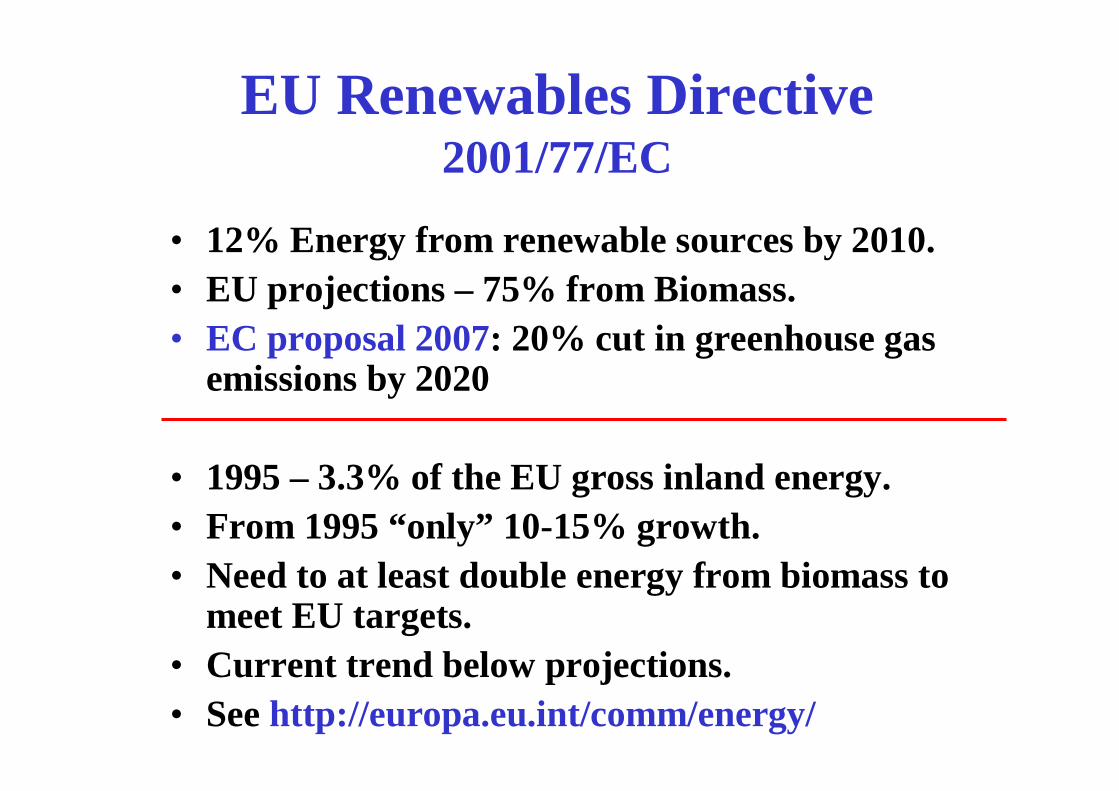
EU Renewables Directive 2001/77/EC
• 12% Energy from renewable sources by 2010.• EU projections – 75% from Biomass.• EC proposal 2007: 20% cut in greenhouse gas
emissions by 2020
• 1995 – 3.3% of the EU gross inland energy. • From 1995 “only” 10-15% growth.• Need to at least double energy from biomass to
meet EU targets.• Current trend below projections.• See http://europa.eu.int/comm/energy/
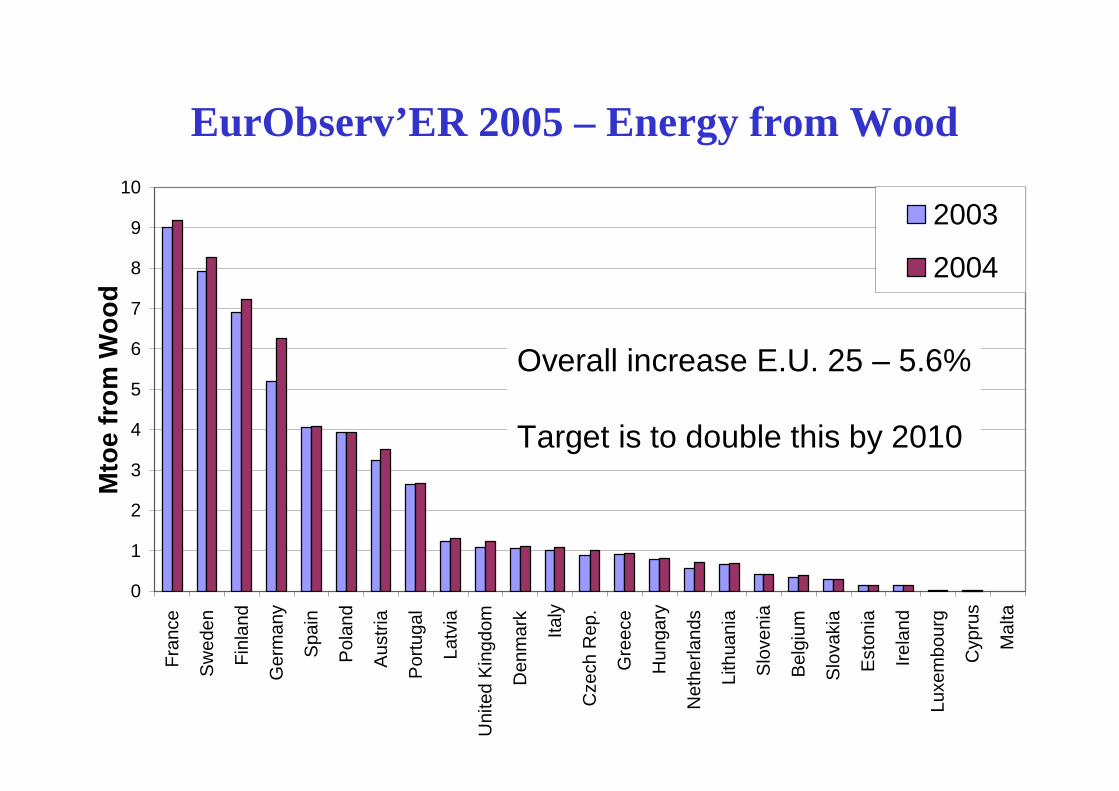
EurObserv’ER 2005 – Energy from Wood
0
1
2
3
4
5
6
7
8
9
10Fr
ance
Sw
eden
Finl
and
Ger
man
y
Spa
in
Pol
and
Aus
tria
Por
tuga
l
Latv
ia
Uni
ted
Kin
gdom
Den
mar
k
Italy
Cze
ch R
ep.
Gre
ece
Hun
gary
Net
herla
nds
Lith
uani
a
Slo
veni
a
Bel
gium
Slo
vaki
a
Est
onia
Irela
nd
Luxe
mbo
urg
Cyp
rus
Mal
ta
Mto
e fr
om W
ood
2003
2004
Overall increase E.U. 25 – 5.6%
Target is to double this by 2010
0
5
10
15
20
25
30
35
40To
tal E
.U. 2
5
Finl
and
Sw
eden
Ger
man
y
Spa
in
Uni
ted
Kin
gdom
Net
herla
nds
Den
mar
k
Fran
ce
Aus
tria
Portu
gal
Hun
gary
Pol
and
Cze
ch R
ep.
Bel
gium
Italy
Slov
akia
Slov
enia
Esto
nia
Latv
ia
Lith
uani
a
Elec
tric
ity fr
om W
ood
TWh
2003
2004
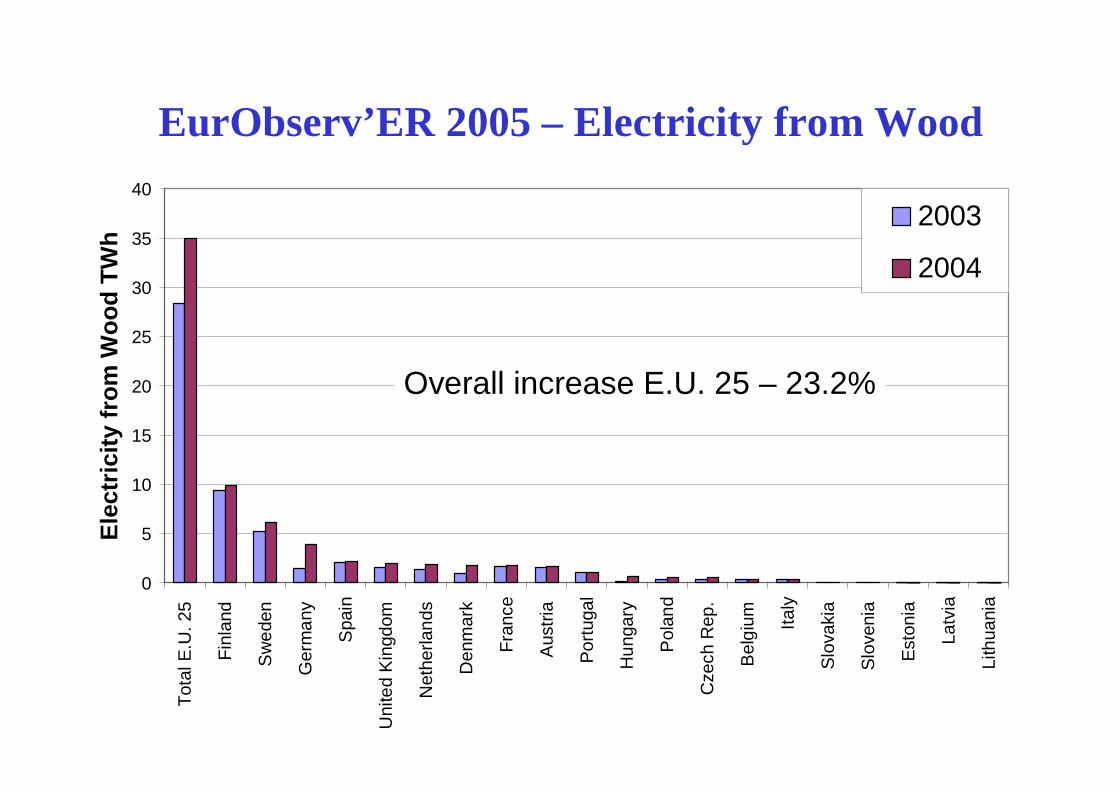
EurObserv’ER 2005 – Electricity from Wood
Overall increase E.U. 25 – 23.2%
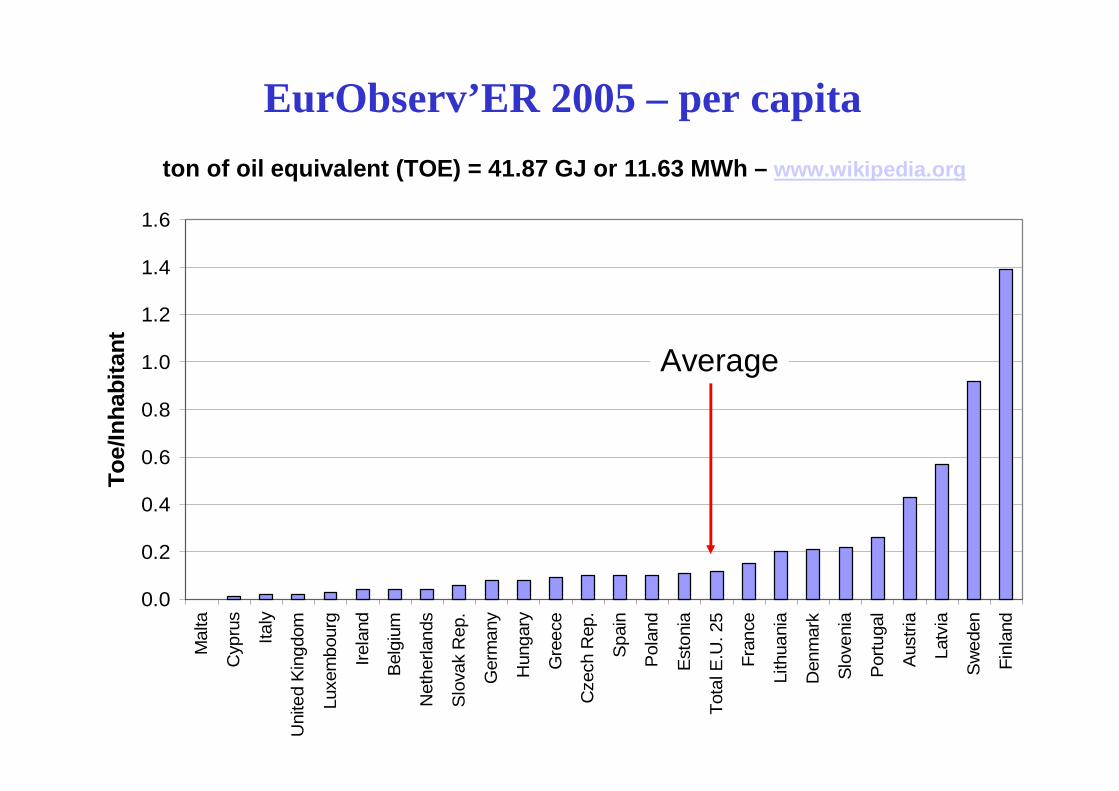
EurObserv’ER 2005 – per capita
0.0
0.2
0.4
0.6
0.8
1.0
1.2
1.4
1.6M
alta
Cyp
rus
Italy
Uni
ted
Kin
gdom
Luxe
mbo
urg
Irela
nd
Bel
gium
Net
herla
nds
Slo
vak
Rep
.
Ger
man
y
Hun
gary
Gre
ece
Cze
ch R
ep.
Spa
in
Pol
and
Est
onia
Tota
l E.U
. 25
Fran
ce
Lith
uani
a
Den
mar
k
Slov
enia
Por
tuga
l
Aus
tria
Latv
ia
Sw
eden
Finl
and
Toe/
Inha
bita
nt Average
ton of oil equivalent (TOE) = 41.87 GJ or 11.63 MWh – www.wikipedia.org
0
0.5
1
1.5
2
2.5
3
3.5
4
4.5To
tal E
.U. 2
5
Uni
ted
Kin
gdom
Ger
man
y
Spa
in
Fran
ce
Italy
Sw
eden
Net
herla
nds
Den
mar
k
Portu
gal
Cze
ch R
ep.
Pol
and
Belg
ium
Aus
tria
Gre
ece
Irela
nd
Finl
and
Slo
veni
a
Luxe
mbo
urg
Slo
vaki
a
Esto
nia
Hun
gary
Bio
gas
in E
urop
e M
toe
2003
2004
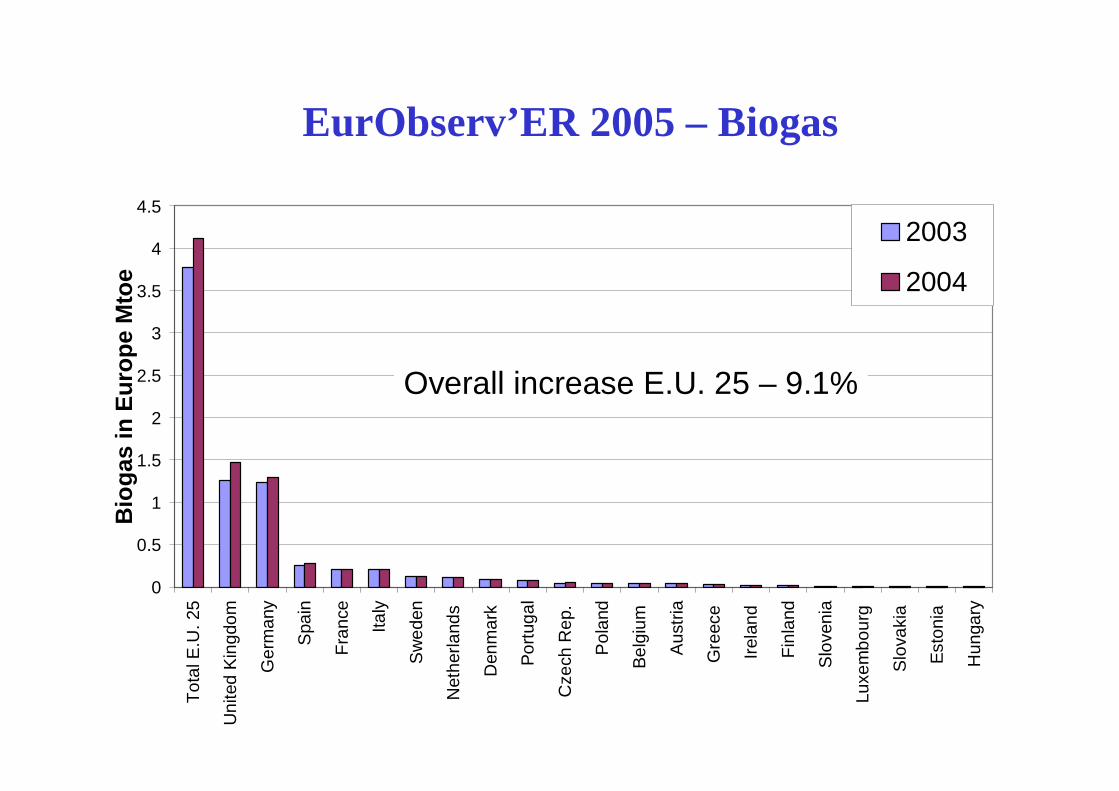
EurObserv’ER 2005 – Biogas
Overall increase E.U. 25 – 9.1%
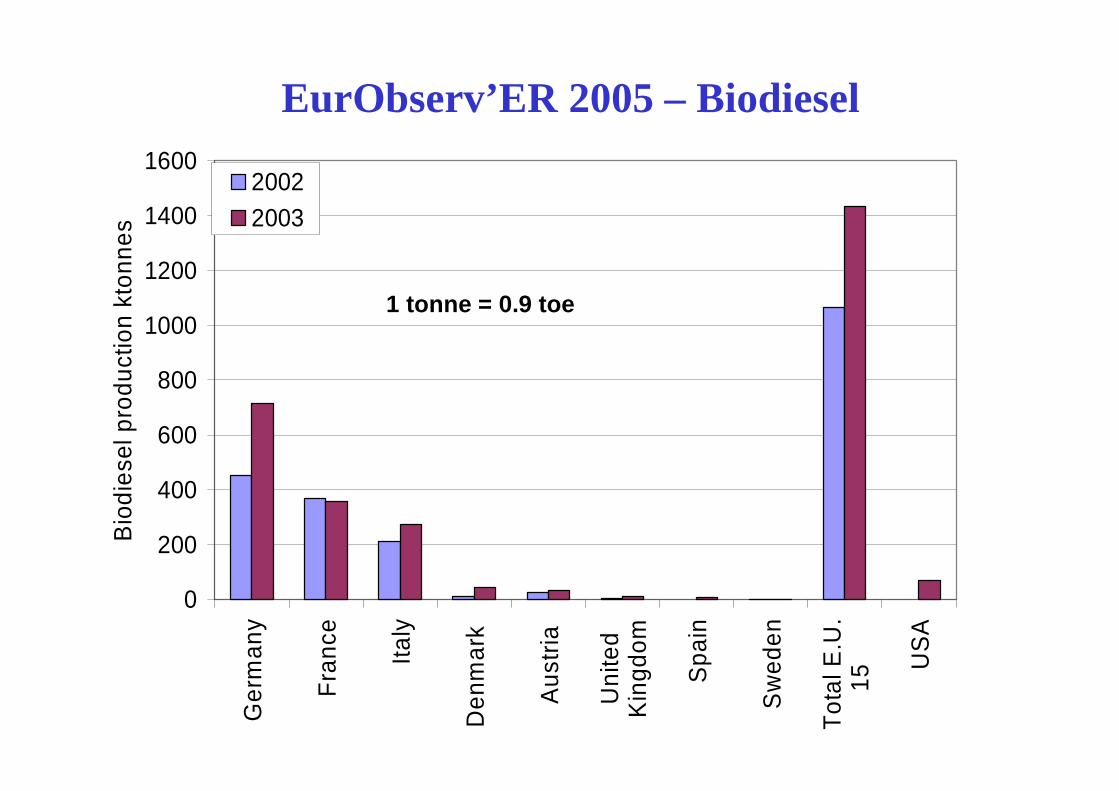
EurObserv’ER 2005 – Biodiesel
0
200
400
600
800
1000
1200
1400
1600
Ger
man
y
Fran
ce
Italy
Den
mar
k
Aus
tria
Uni
ted
King
dom
Spai
n
Sw
eden
Tota
l E.U
.15
USA
Bio
dies
el p
rodu
ctio
n kt
onne
s
20022003
1 tonne = 0.9 toe
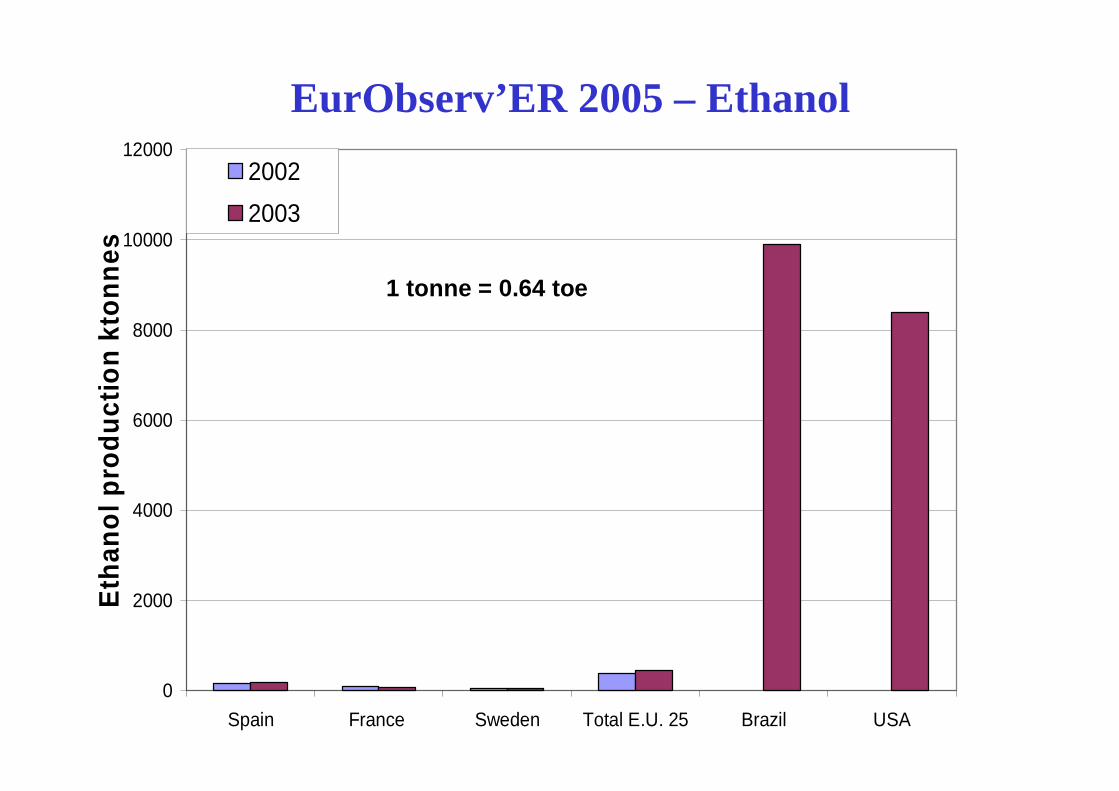
EurObserv’ER 2005 – Ethanol
0
2000
4000
6000
8000
10000
12000
Spain France Sweden Total E.U. 25 Brazil USA
Etha
nol p
rodu
ctio
n kt
onne
s
20022003
1 tonne = 0.64 toe
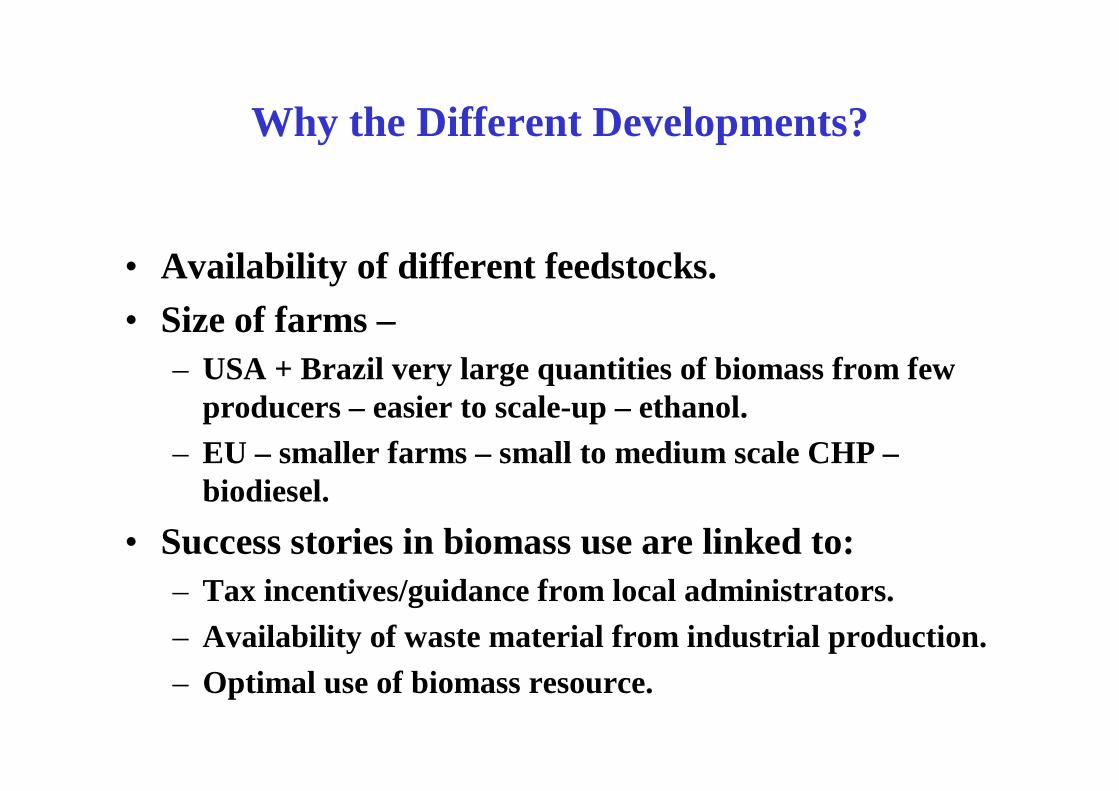
Why the Different Developments?
• Availability of different feedstocks.• Size of farms –
– USA + Brazil very large quantities of biomass from few producers – easier to scale-up – ethanol.
– EU – smaller farms – small to medium scale CHP –biodiesel.
• Success stories in biomass use are linked to:– Tax incentives/guidance from local administrators.– Availability of waste material from industrial production.– Optimal use of biomass resource.
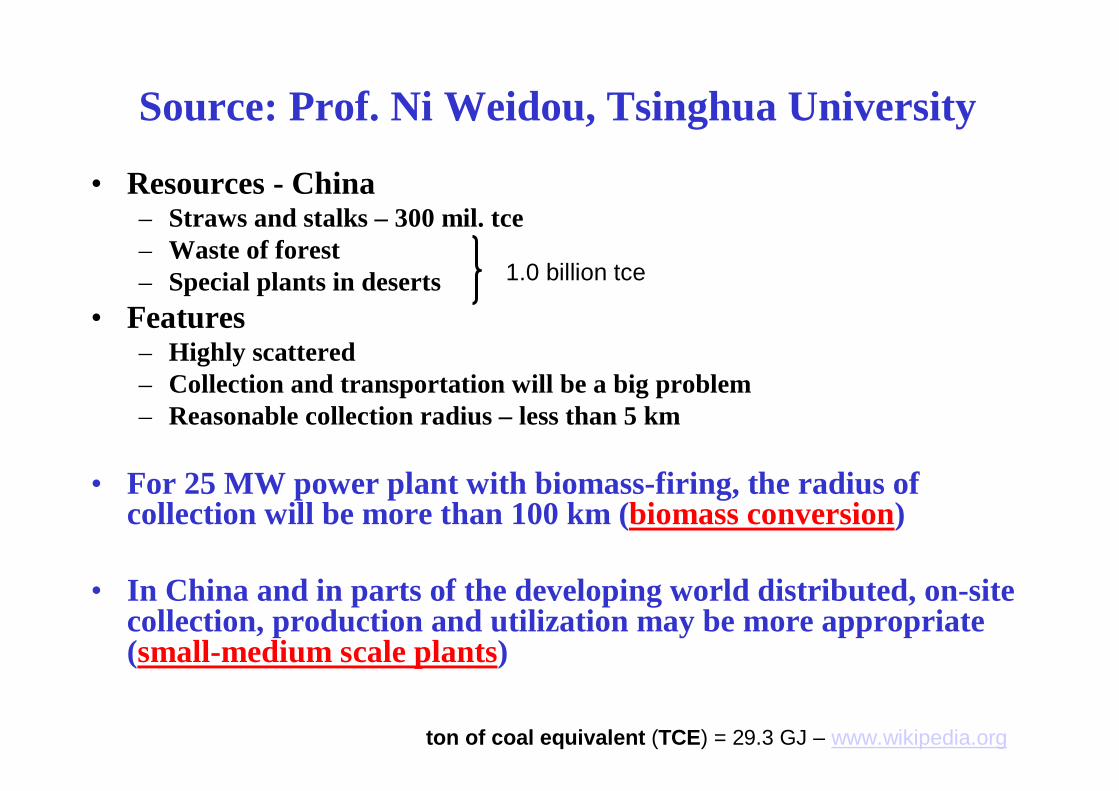
Source: Prof. Ni Weidou, Tsinghua University
• Resources - China– Straws and stalks – 300 mil. tce– Waste of forest– Special plants in deserts
• Features– Highly scattered– Collection and transportation will be a big problem– Reasonable collection radius – less than 5 km
• For 25 MW power plant with biomass-firing, the radius of collection will be more than 100 km (biomass conversion)
• In China and in parts of the developing world distributed, on-site collection, production and utilization may be more appropriate (small-medium scale plants)
1.0 billion tce
ton of coal equivalent (TCE) = 29.3 GJ – www.wikipedia.org
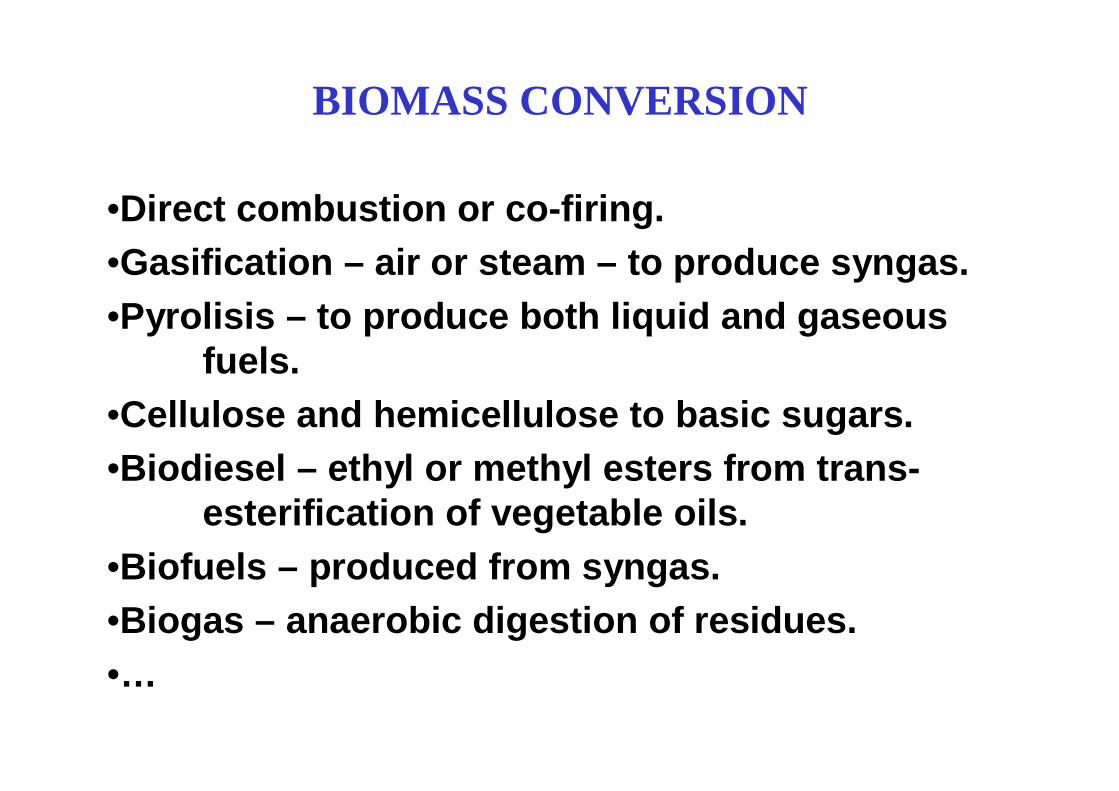
•Direct combustion or co-firing.•Gasification – air or steam – to produce syngas.•Pyrolisis – to produce both liquid and gaseous
fuels.•Cellulose and hemicellulose to basic sugars.•Biodiesel – ethyl or methyl esters from trans-
esterification of vegetable oils.•Biofuels – produced from syngas.•Biogas – anaerobic digestion of residues.•…
BIOMASS CONVERSION
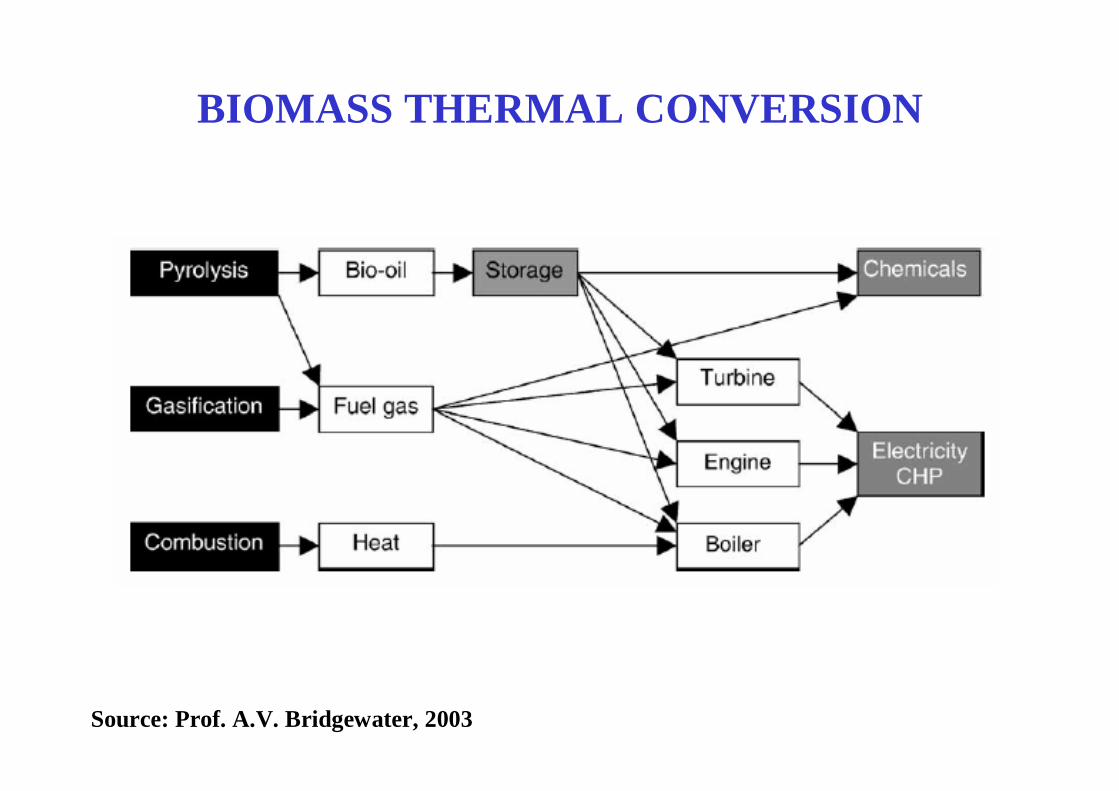
BIOMASS THERMAL CONVERSION
Source: Prof. A.V. Bridgewater, 2003
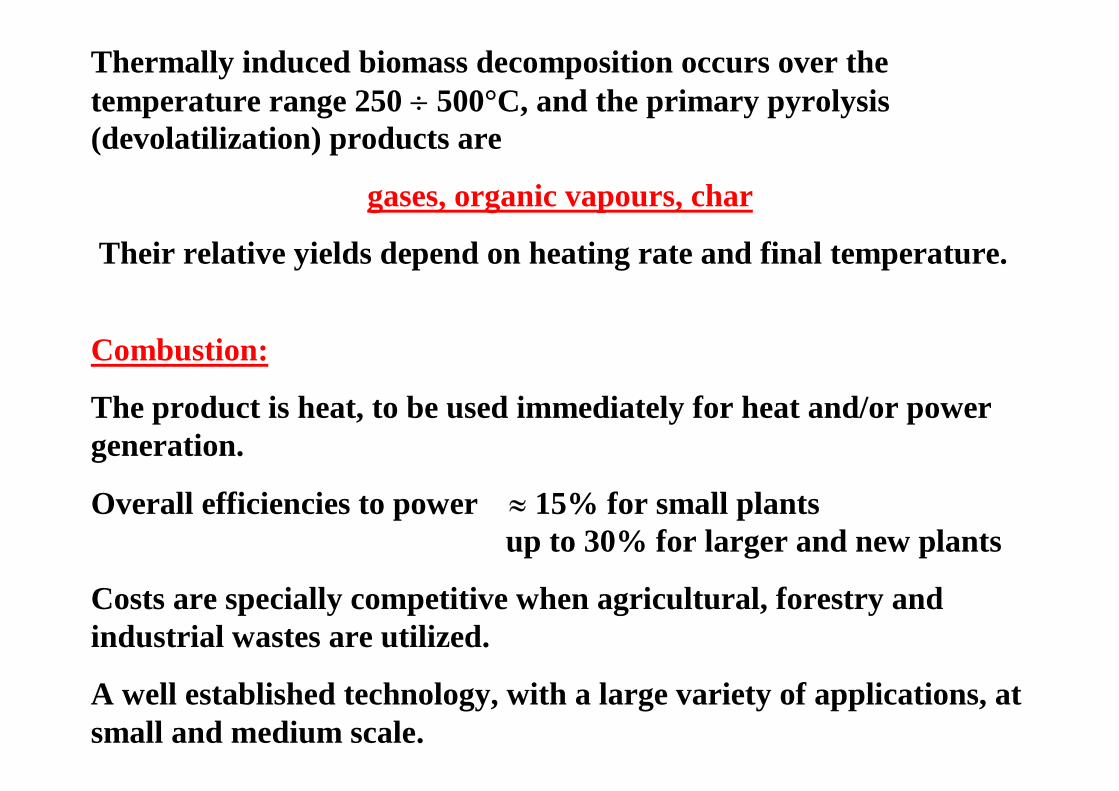
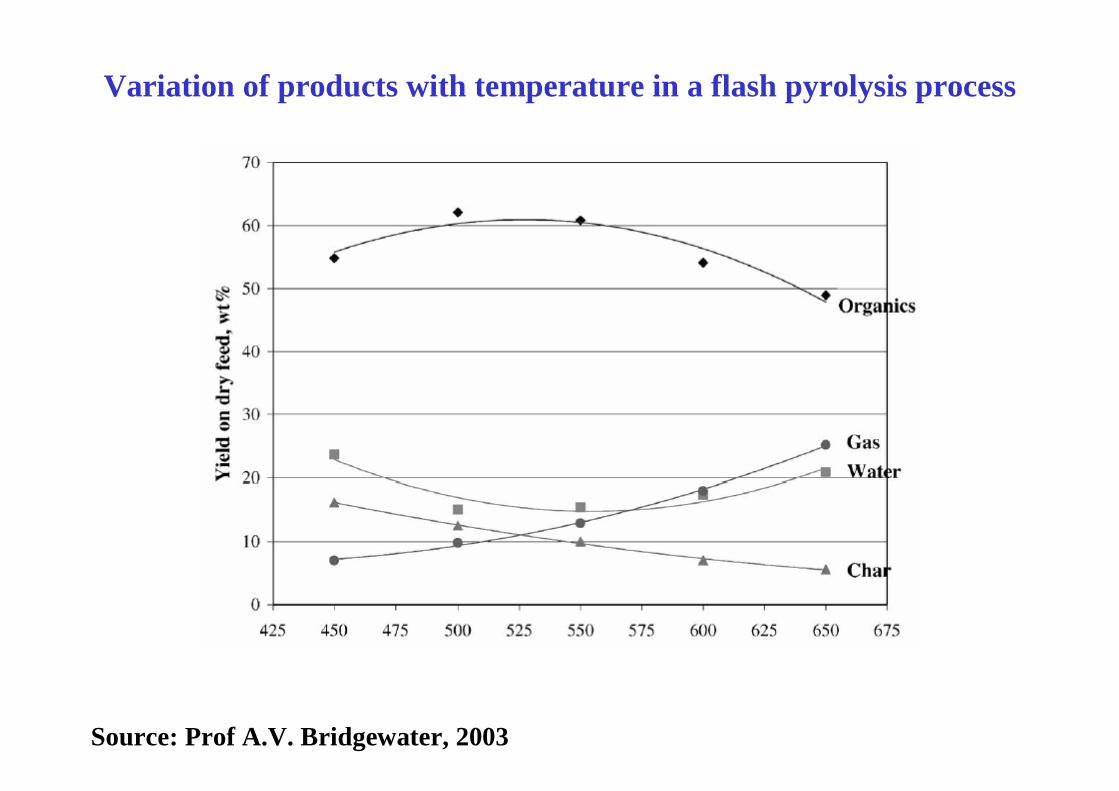
Thermally induced biomass decomposition occurs over the temperature range 250 ÷ 500°C, and the primary pyrolysis (devolatilization) products are
gases, organic vapours, char
Their relative yields depend on heating rate and final temperature.
Combustion:
The product is heat, to be used immediately for heat and/or power generation.
Overall efficiencies to power ≈ 15% for small plantsup to 30% for larger and new plants
Costs are specially competitive when agricultural, forestry and industrial wastes are utilized.
A well established technology, with a large variety of applications, at small and medium scale.
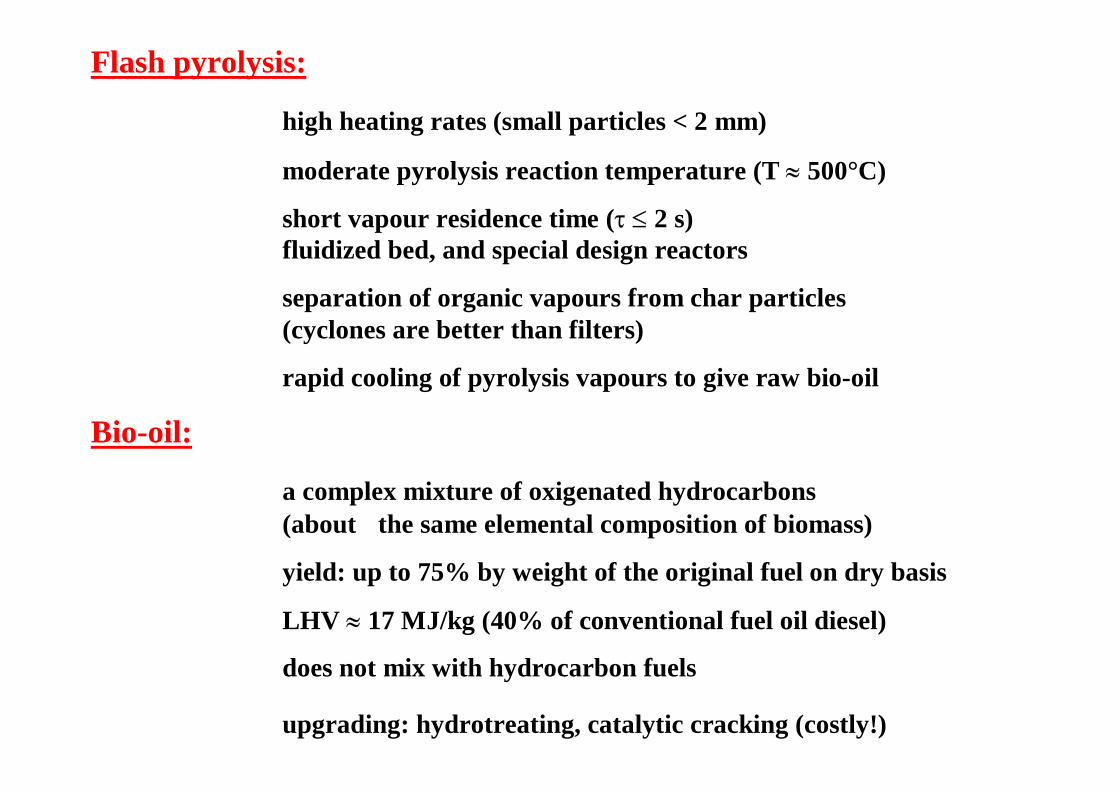
Flash pyrolysis:
high heating rates (small particles < 2 mm)
moderate pyrolysis reaction temperature (T ≈ 500°C)
short vapour residence time (τ ≤ 2 s)fluidized bed, and special design reactors
separation of organic vapours from char particles(cyclones are better than filters)
rapid cooling of pyrolysis vapours to give raw bio-oil
Bio-oil:
a complex mixture of oxigenated hydrocarbons(about the same elemental composition of biomass)
yield: up to 75% by weight of the original fuel on dry basis
LHV ≈ 17 MJ/kg (40% of conventional fuel oil diesel)
does not mix with hydrocarbon fuels
upgrading: hydrotreating, catalytic cracking (costly!)
Source: Prof A.V. Bridgewater, 2003
Variation of products with temperature in a flash pyrolysis process
Gasification:
fuel gas (CO, CO2, H2, CH4) is obtained by partial oxidation and steamor pyrolytic reforming of vapours and char (air/O2/steam gasification)
T ≤ 850°C, to avoid ash sintering phenomena
τ > 2 s, to allow enhancement of heterogeneous reactions
fixed and fluidized bed gasification reactors
primary and downstream catalytic treatments improve gas quality
up to 85% by weight of the original dry biomass is converted in gas
LHV: from 4 MJ/Nm3 (air gasification) to 12 MJ/Nm3 (O2/steamgasification)
hot gas efficiency up to 95% (total energy in raw gas/energy in the feed)
cold gas efficiency up to 80% (raw gas/biomass feedstock heating value)
Gasification:
the closest to industrial exploitation from among the available conversionoptions, for efficient power generation and synthesis of commoditychemicals;
it can be well integrated with MCFC or SOFC (molten carbonate and solid oxide fuel cells accept syn-gas as a fuel because operate at high temperature), and FC + turbine or gas turbine + steam turbine combinedcycles for stationary power generation, with net electric efficiencies > 40% (pressurized gasification);
it is a source of hydrogen: a pure H2 energy vector is obtainable bycombining biomass gasification with a CO2 sorption process (for instance, with calcined dolomite) for a variety of utilities and applications;
the technologies to obtain chemicals from the producer gas are commercially available. Major obstacles are: Large scale operation and High gas quality;
gasification will be able to better penetrate di energy markets if it iscompletely integrated into a biomass system.
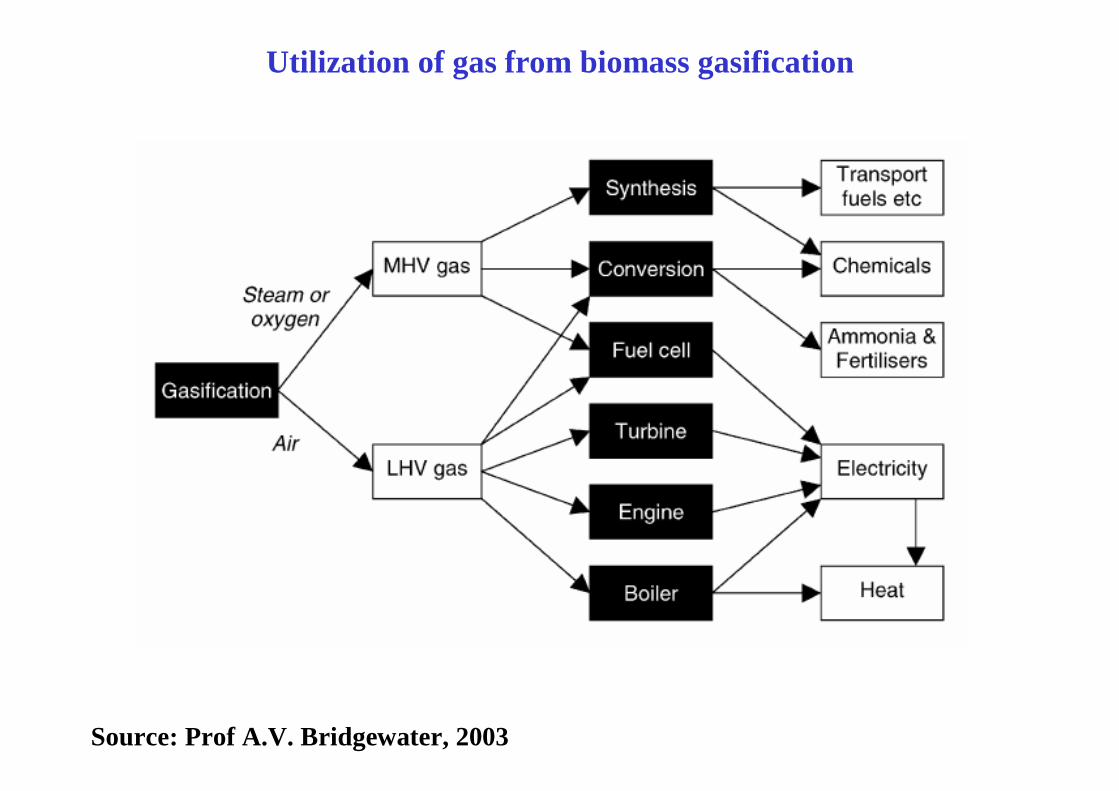
Utilization of gas from biomass gasification
Source: Prof A.V. Bridgewater, 2003
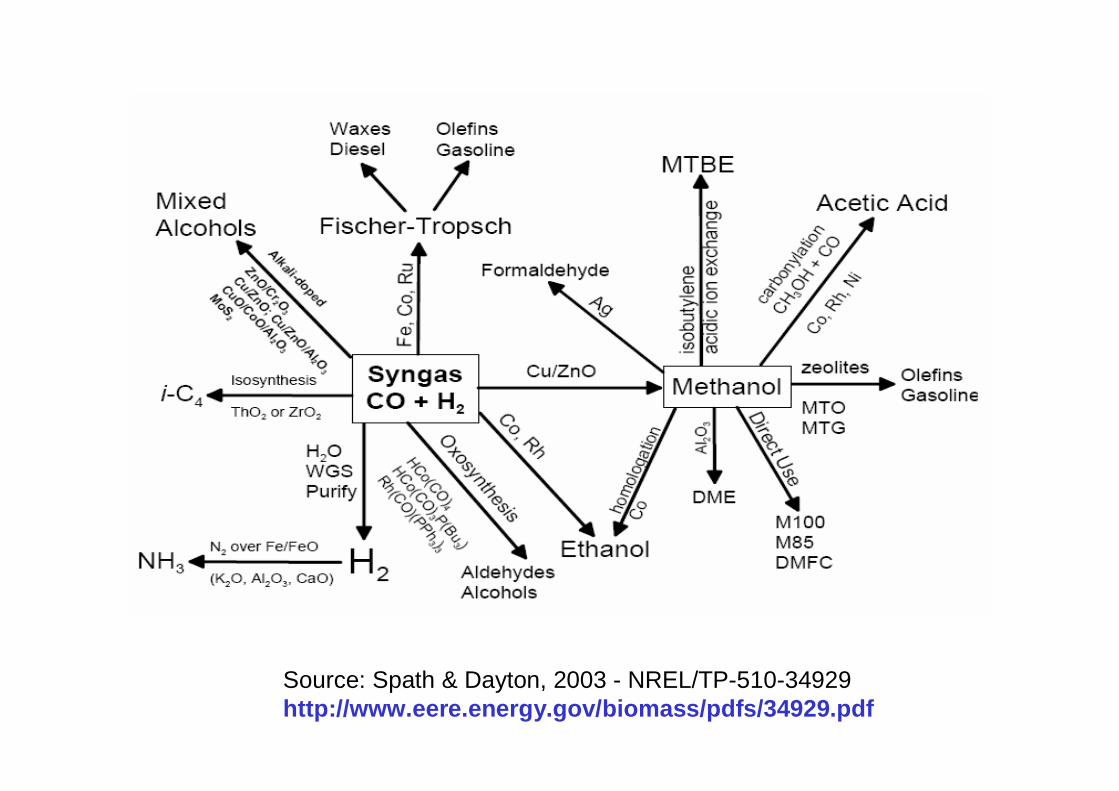
Source: Spath & Dayton, 2003 - NREL/TP-510-34929 http://www.eere.energy.gov/biomass/pdfs/34929.pdf
( )
)(98108)(27362544232
21223)(22)(21
sg
glNaOaHaCa
CzHCzOHzHNzNzHCzOCzOCz
HzNOxOHxOHxNOHC
+++++++
+⇒++++ γ
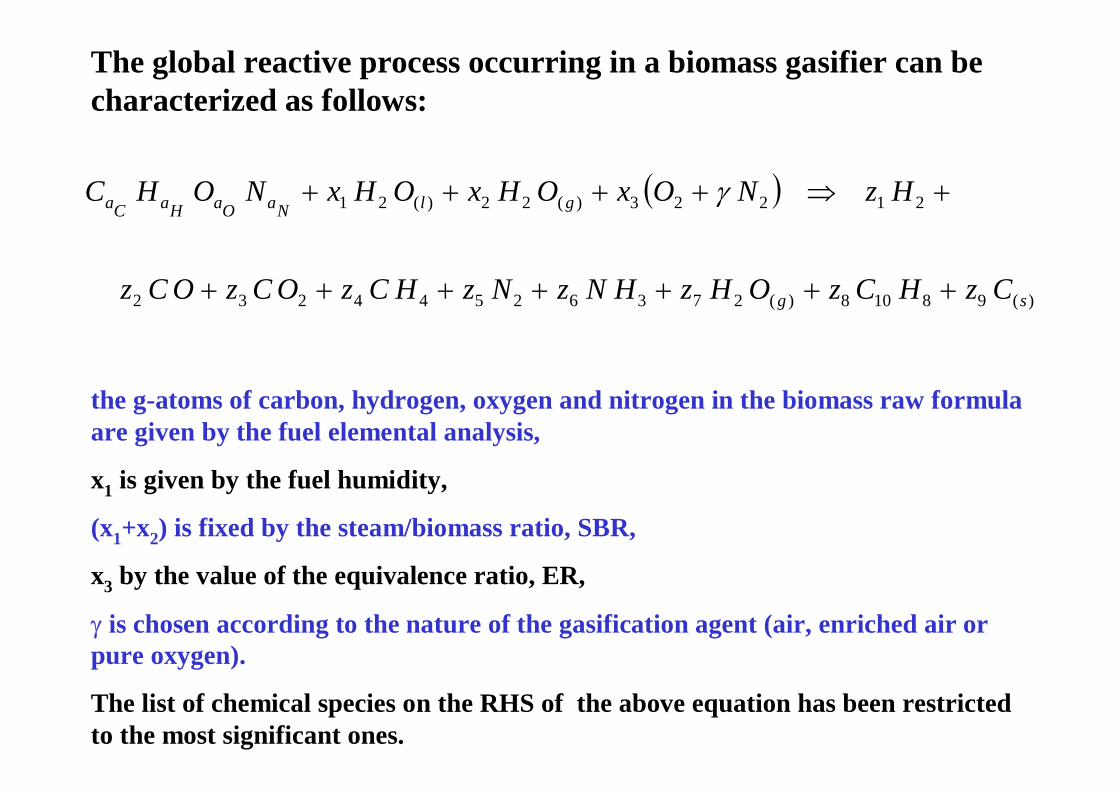
The global reactive process occurring in a biomass gasifier can be characterized as follows:
the g-atoms of carbon, hydrogen, oxygen and nitrogen in the biomass raw formula are given by the fuel elemental analysis,
x1 is given by the fuel humidity,
(x1+x2) is fixed by the steam/biomass ratio, SBR,
x3 by the value of the equivalence ratio, ER,
γ is chosen according to the nature of the gasification agent (air, enriched air or pure oxygen).
The list of chemical species on the RHS of the above equation has been restricted to the most significant ones.
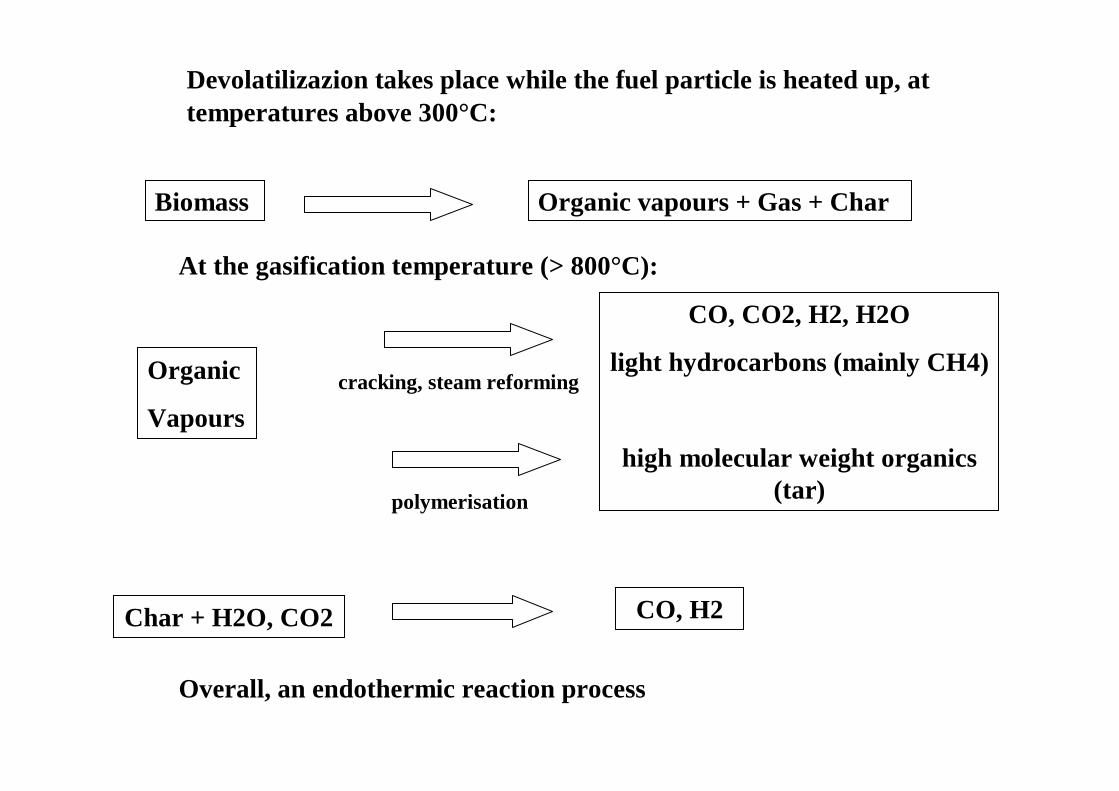
At the gasification temperature (> 800°C):
CO, CO2, H2, H2O
light hydrocarbons (mainly CH4)
high molecular weight organics(tar)
Organic
Vapours
Char + H2O, CO2 CO, H2
cracking, steam reforming
polymerisation
Overall, an endothermic reaction process
Devolatilizazion takes place while the fuel particle is heated up, at temperatures above 300°C:
Biomass Organic vapours + Gas + Char
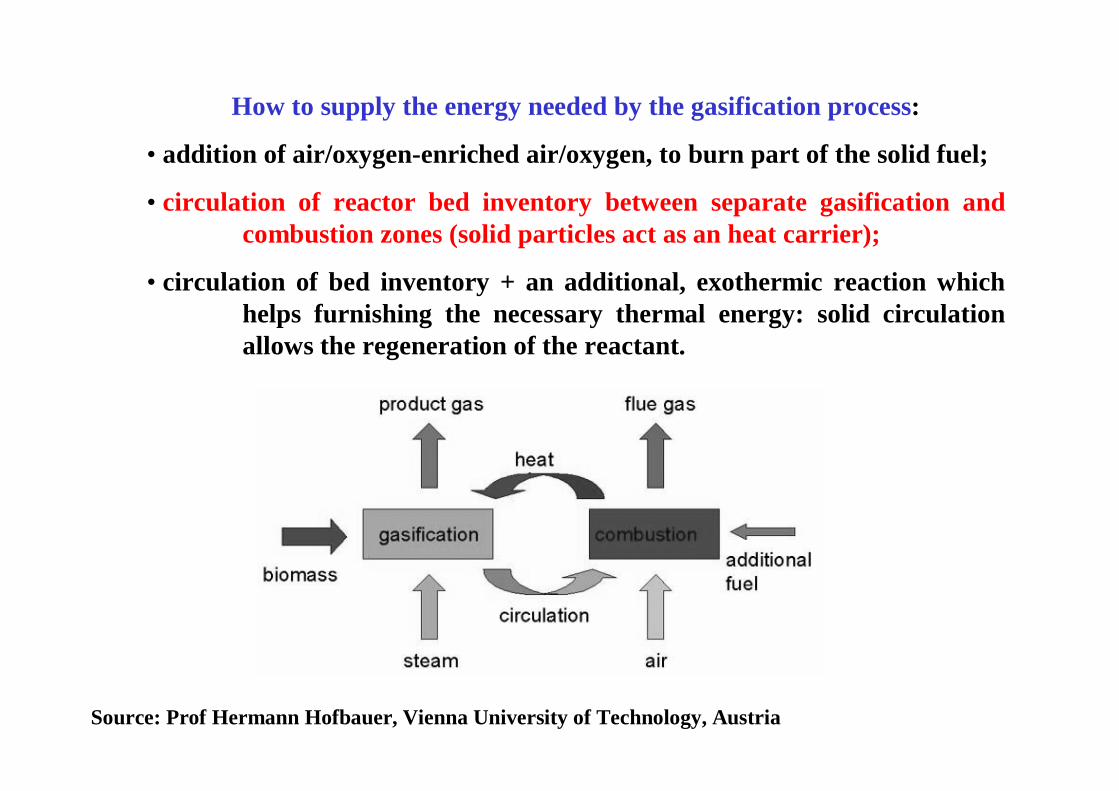
How to supply the energy needed by the gasification process:
• addition of air/oxygen-enriched air/oxygen, to burn part of the solid fuel;
• circulation of reactor bed inventory between separate gasification and combustion zones (solid particles act as an heat carrier);
• circulation of bed inventory + an additional, exothermic reaction whichhelps furnishing the necessary thermal energy: solid circulationallows the regeneration of the reactant.
Source: Prof Hermann Hofbauer, Vienna University of Technology, Austria
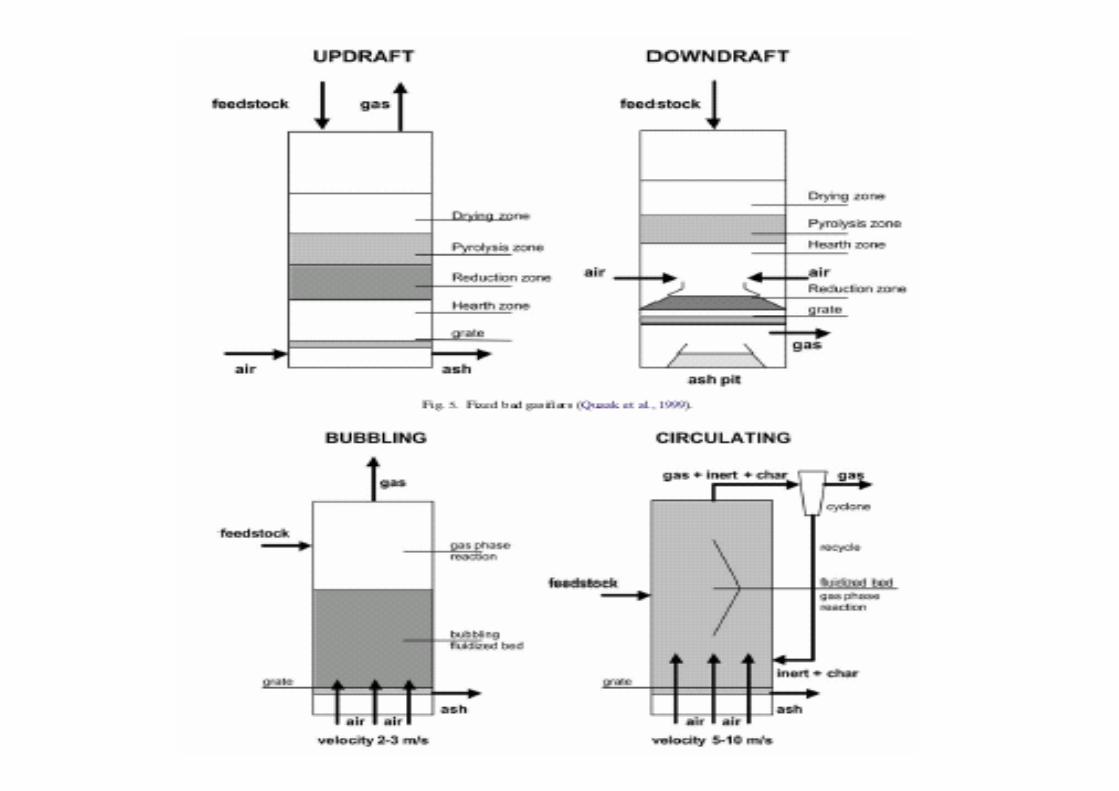
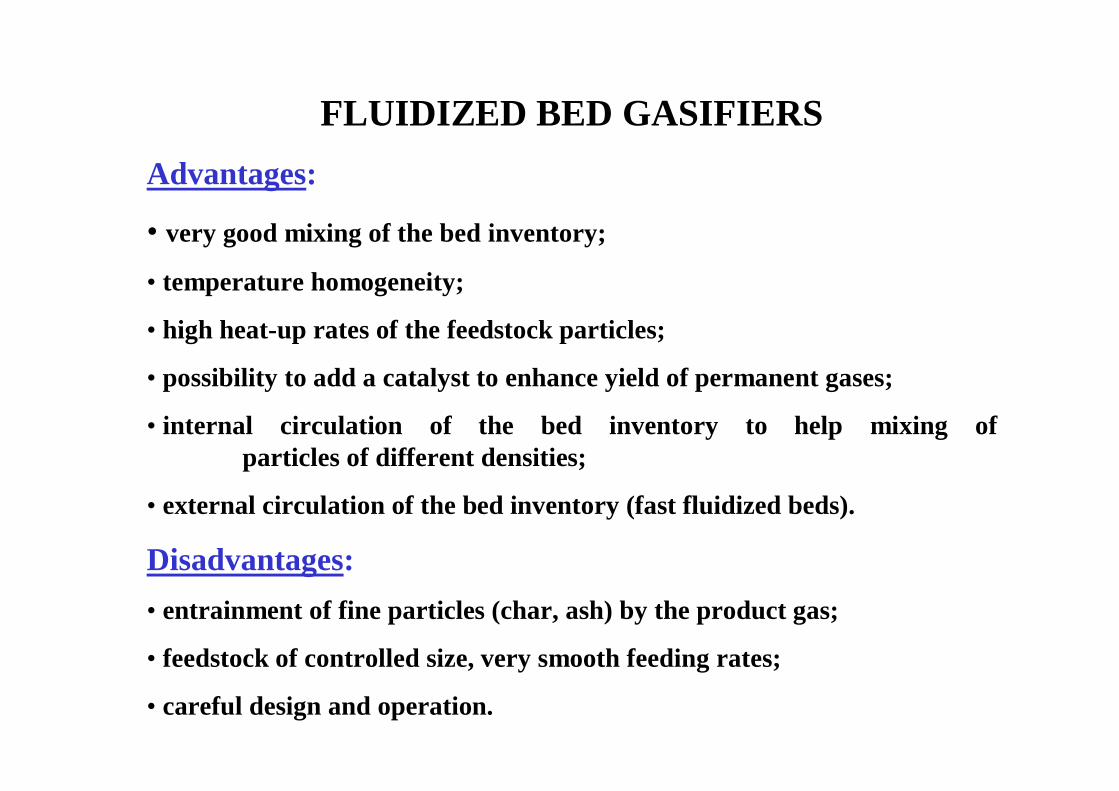
FLUIDIZED BED GASIFIERSAdvantages:
• very good mixing of the bed inventory;
• temperature homogeneity;
• high heat-up rates of the feedstock particles;
• possibility to add a catalyst to enhance yield of permanent gases;
• internal circulation of the bed inventory to help mixing of particles of different densities;
• external circulation of the bed inventory (fast fluidized beds).
Disadvantages:• entrainment of fine particles (char, ash) by the product gas;
• feedstock of controlled size, very smooth feeding rates;
• careful design and operation.
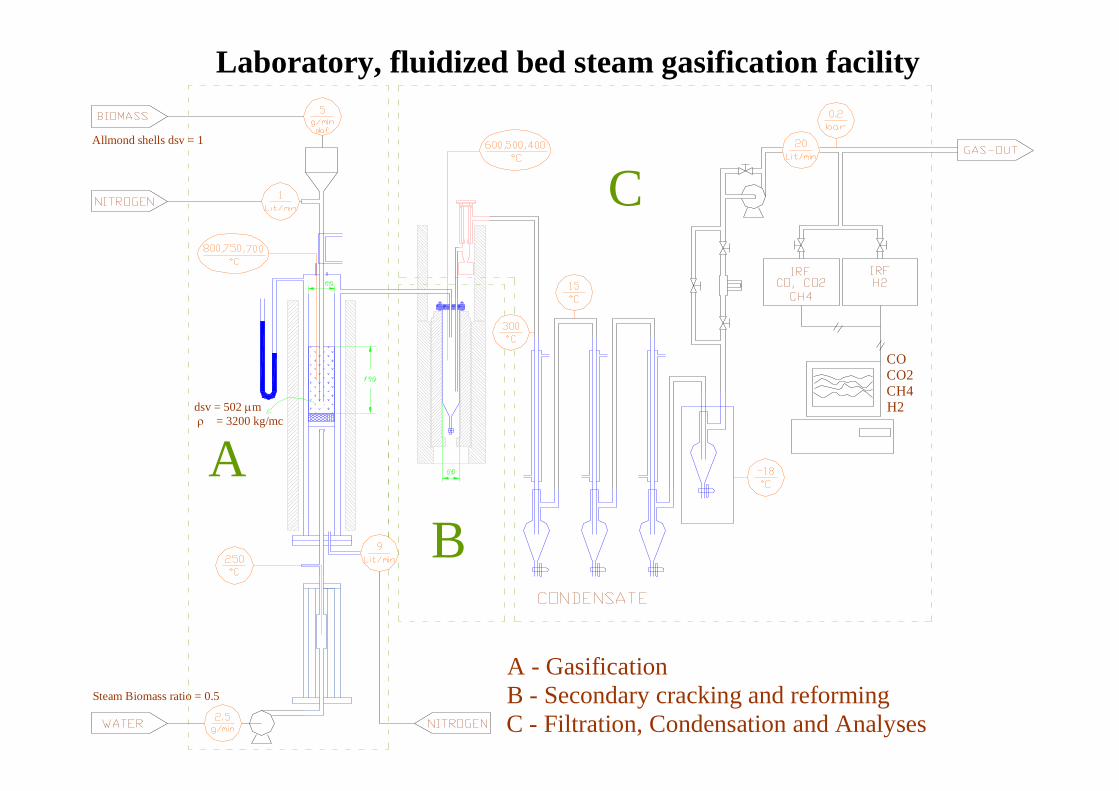
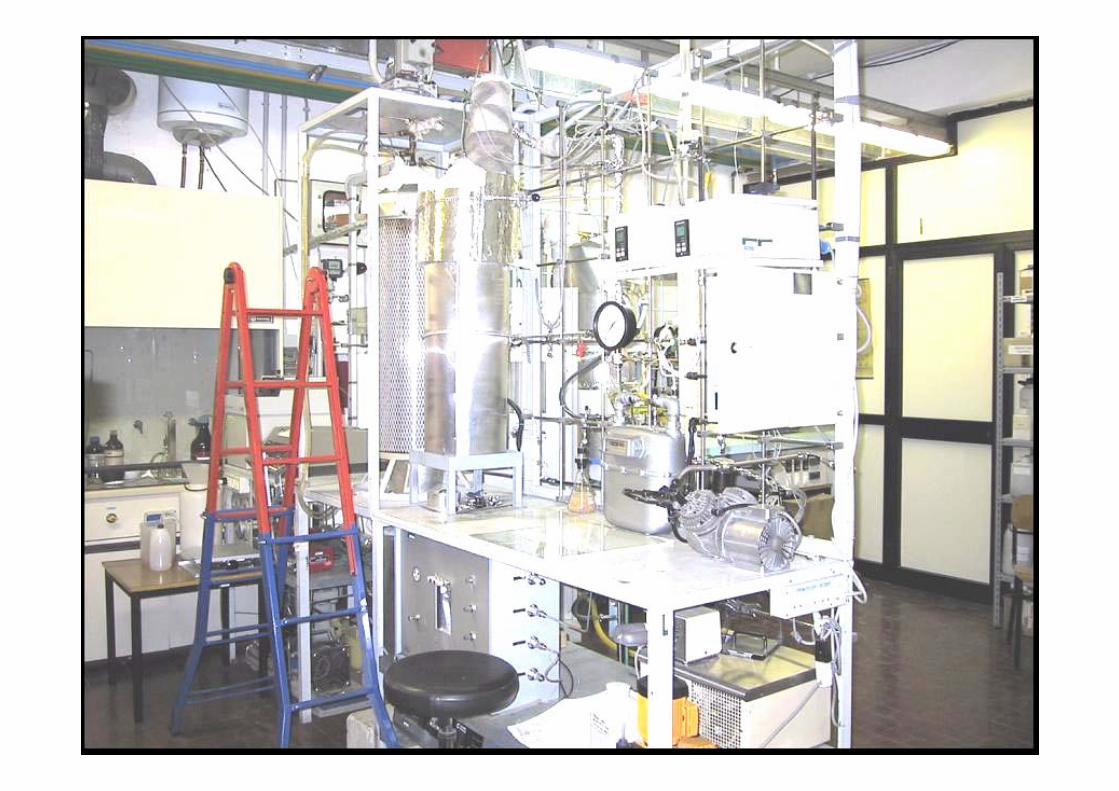
Laboratory, fluidized bed steam gasification facility
A
A - GasificationB - Secondary cracking and reformingC - Filtration, Condensation and Analyses
COCO2CH4H2
B
C
dsv = 502 µmρ = 3200 kg/mc
Steam Biomass ratio = 0.5
Allmond shells dsv = 1
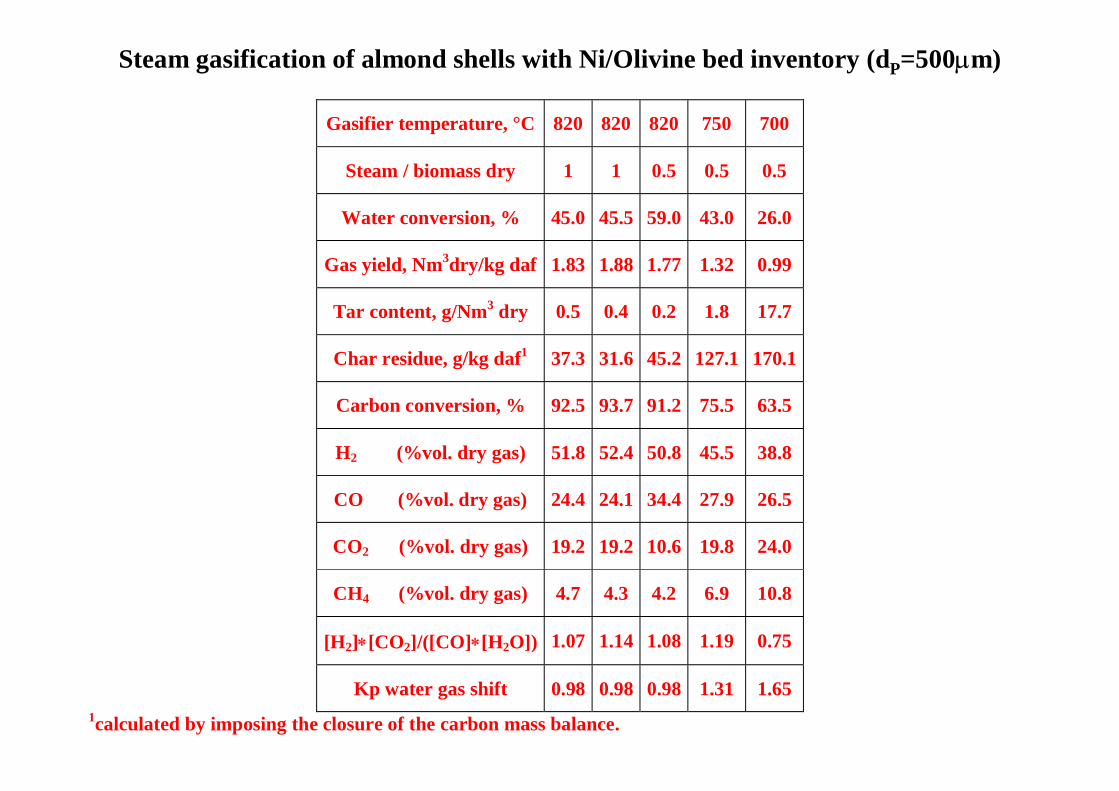
Gasifier temperature, °C 820 820 820 750 700
Steam / biomass dry 1 1 0.5 0.5 0.5
Water conversion, % 45.0 45.5 59.0 43.0 26.0
Gas yield, Nm3dry/kg daf 1.83 1.88 1.77 1.32 0.99
Tar content, g/Nm3 dry 0.5 0.4 0.2 1.8 17.7
Char residue, g/kg daf1 37.3 31.6 45.2 127.1 170.1
Carbon conversion, % 92.5 93.7 91.2 75.5 63.5
H2 (%vol. dry gas) 51.8 52.4 50.8 45.5 38.8
CO (%vol. dry gas) 24.4 24.1 34.4 27.9 26.5
CO2 (%vol. dry gas) 19.2 19.2 10.6 19.8 24.0
CH4 (%vol. dry gas) 4.7 4.3 4.2 6.9 10.8
[H2]∗[CO2]/([CO]∗[H2O]) 1.07 1.14 1.08 1.19 0.75
Kp water gas shift 0.98 0.98 0.98 1.31 1.65 1calculated by imposing the closure of the carbon mass balance.
Steam gasification of almond shells with Ni/Olivine bed inventory (dP=500µm)
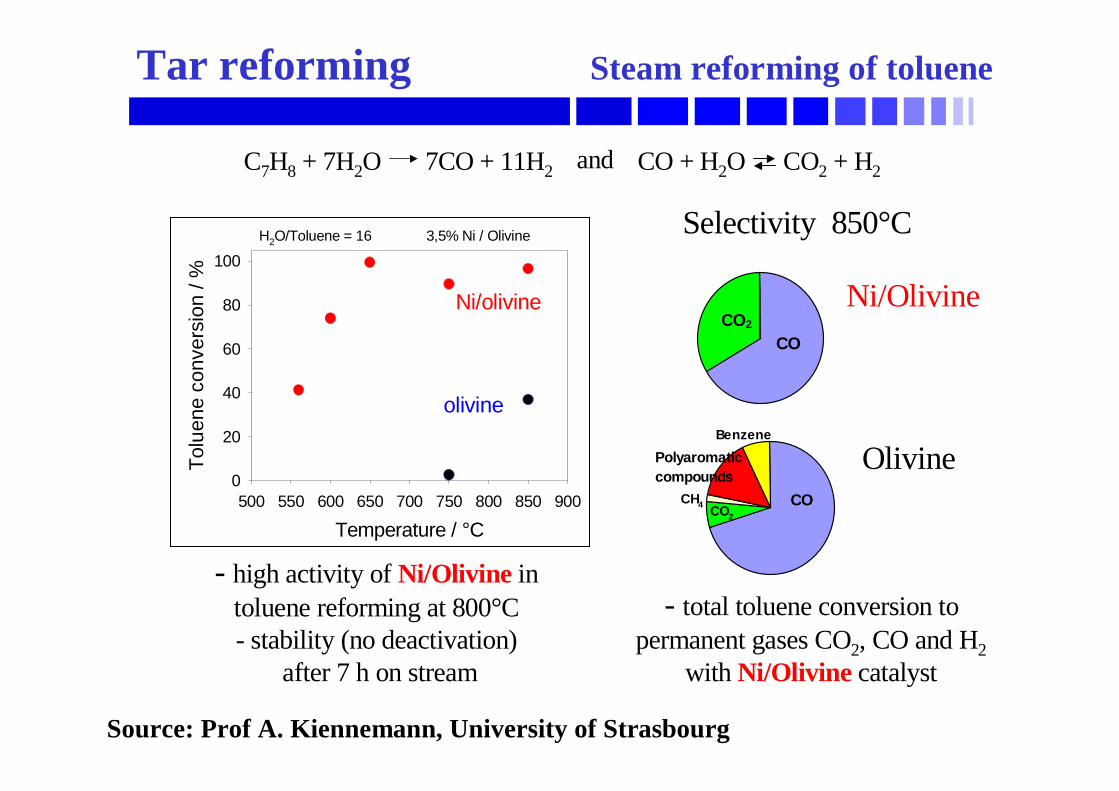
C7H8 + 7H2O 7CO + 11H2 CO + H2O CO2 + H2 and
Temperature / °C500 550 600 650 700 750 800 850 900
Tolu
ene
conv
ersi
on /
%
0
20
40
60
80
100
Ni/olivine
olivine
H2O/Toluene = 16 3,5% Ni / Olivine
COCO2
CO
Polyaromaticcompounds
Benzene
CH4 CO2
Ni/Olivine
Olivine
Selectivity 850°C
- high activity of Ni/Olivine in toluene reforming at 800°C - stability (no deactivation)
after 7 h on stream
- total toluene conversion to permanent gases CO2, CO and H2
with Ni/Olivine catalyst
Tar reforming Steam reforming of toluene
Source: Prof A. Kiennemann, University of Strasbourg
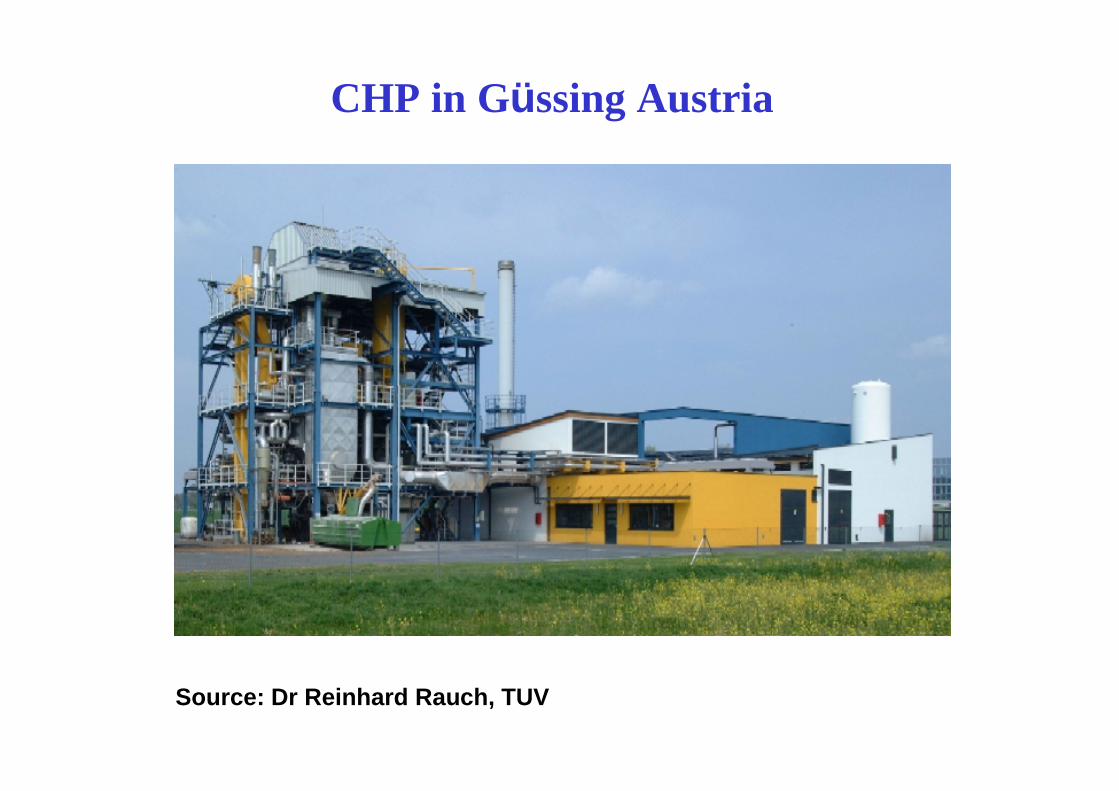
CHP in Güssing Austria
Source: Dr Reinhard Rauch, TUV
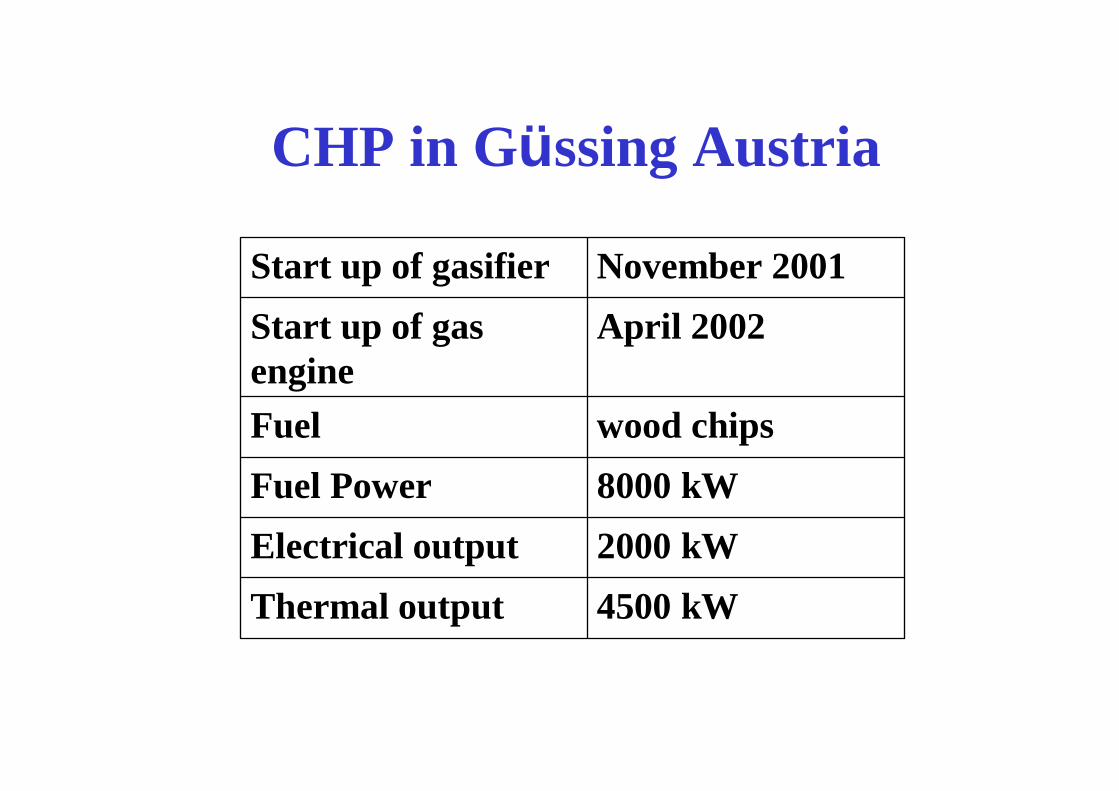
CHP in Güssing Austria
4500 kWThermal output 2000 kWElectrical output 8000 kWFuel Powerwood chipsFuel
April 2002Start up of gas engine
November 2001Start up of gasifier
Güssing Austria – Reasons for Success
• 40% of region is covered by forest.• In early ’90s the Major decided to change
the energy supply of the city to local renewable sources.
• District heating now supplies 95% of users• 2 MW production covers the city’s demand
for electricity.• Biodiesel is produced from a RME plant
built in 1990.
R&D Projects at pilot scale
• Direct coupling of biomass gasification and fuel cellfunded in part by EC (JOR3-CT97-00196 and ENK5-CT2000-00314)and by the Italian Goverment (FISR, GU n° 146, June 24, 2004).
• Electricity generation from wood scraps and rice huska bilateral project between Italy and China, involving the LiaoningInstitute for Energy Resources (LIER), ENEA (Trisaia Research Centre) and the University of L’Aquila.
Construction and Operationof an Integrated Pilot Plant
• 500 kWth fast internally circulating fluidized
bed (FICFB) gasifier for catalytic biomass
steam-gasification.
• Hot gas clean-up system for acid compounds
removal by adsorption on a basic powder, and
ceramic candle fine particle filtration.
• 125 kWe Molten Carbonate Fuel Cell (MCFC)
Accompanying Research Tasks
• Development of a low-cost Ni-olivine catalyst for hydrogen enhancement and tar reduction.
• Laboratory scale experimentation for gasification kinetics.
• CFD model of the gasifier.• Flowsheet simulation tool of the whole
system, to develop optimal operation and control strategies.
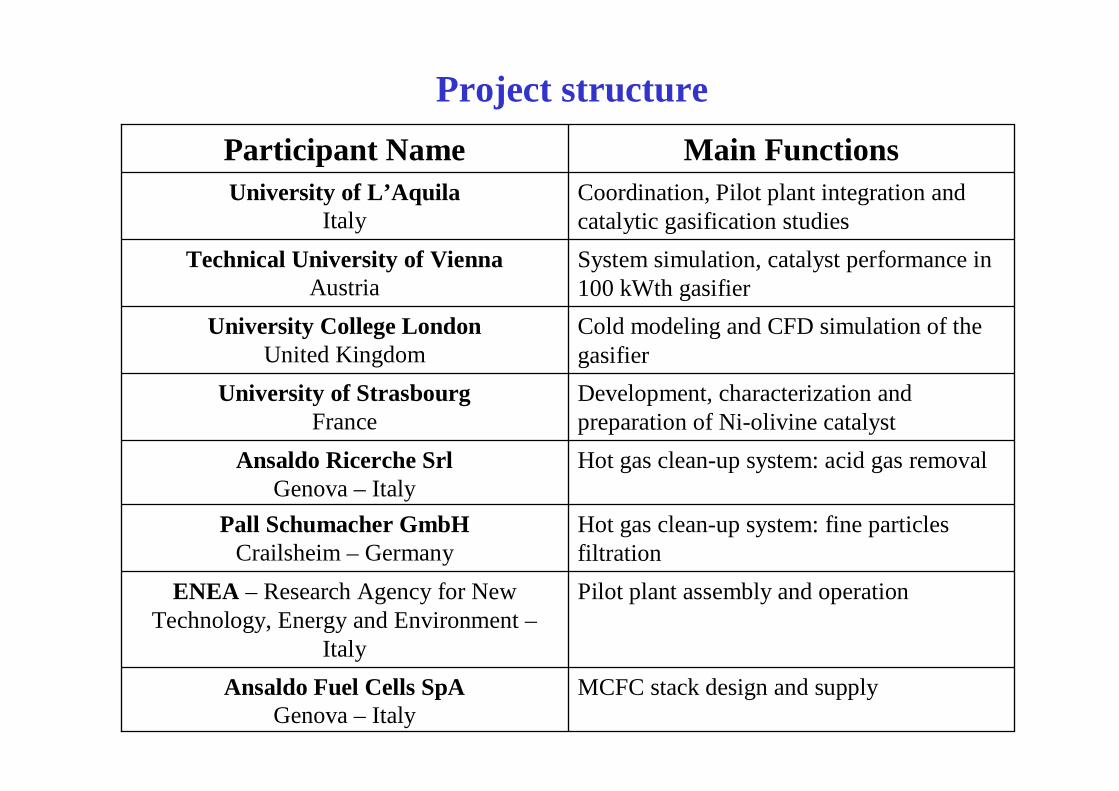
MCFC stack design and supplyAnsaldo Fuel Cells SpAGenova – Italy
Pilot plant assembly and operationENEA – Research Agency for New Technology, Energy and Environment –
Italy
Hot gas clean-up system: fine particles filtration
Pall Schumacher GmbHCrailsheim – Germany
Hot gas clean-up system: acid gas removalAnsaldo Ricerche SrlGenova – Italy
Development, characterization and preparation of Ni-olivine catalyst
University of StrasbourgFrance
Cold modeling and CFD simulation of the gasifier
University College LondonUnited Kingdom
System simulation, catalyst performance in 100 kWth gasifier
Technical University of ViennaAustria
Coordination, Pilot plant integration and catalytic gasification studies
University of L’AquilaItaly
Main FunctionsParticipant Name
Project structure
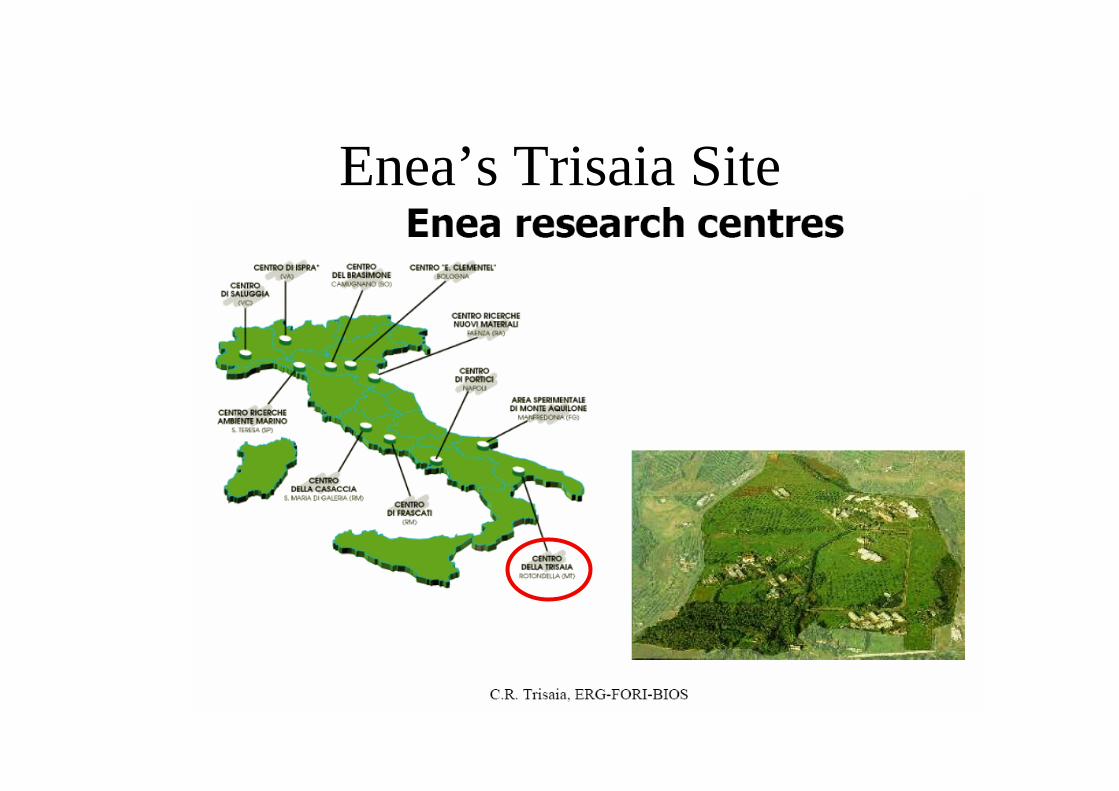
Enea’s Trisaia Site
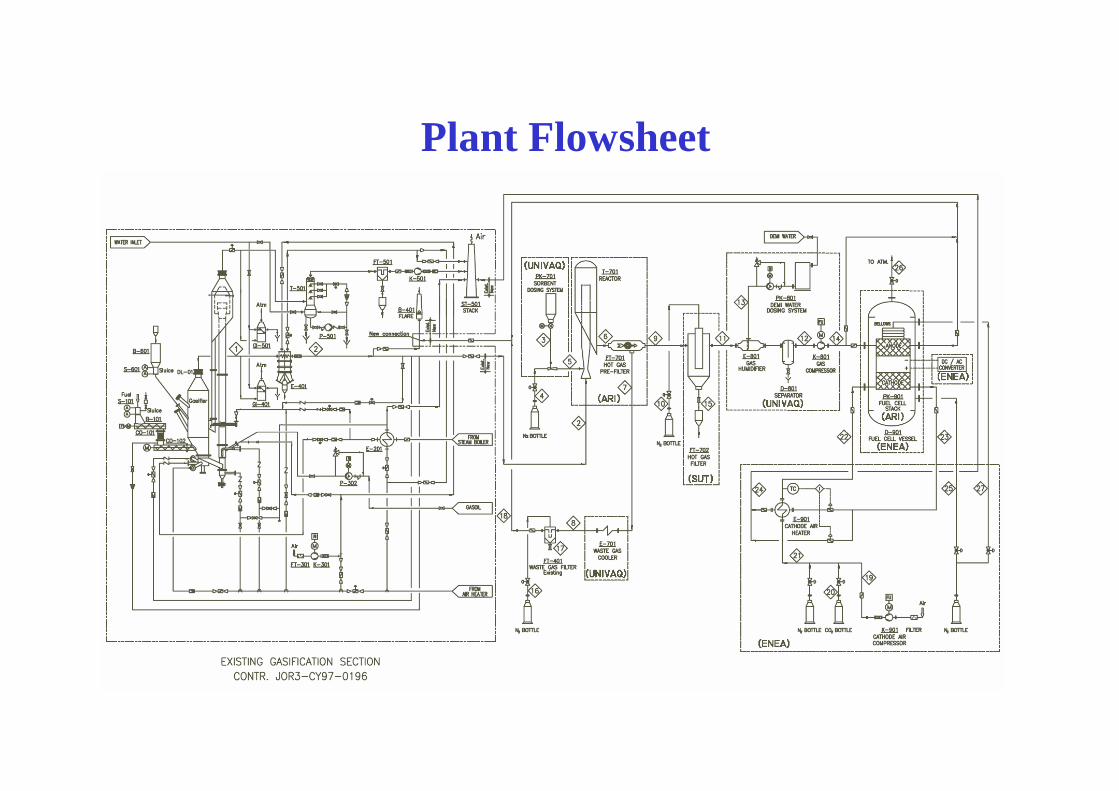
Plant Flowsheet
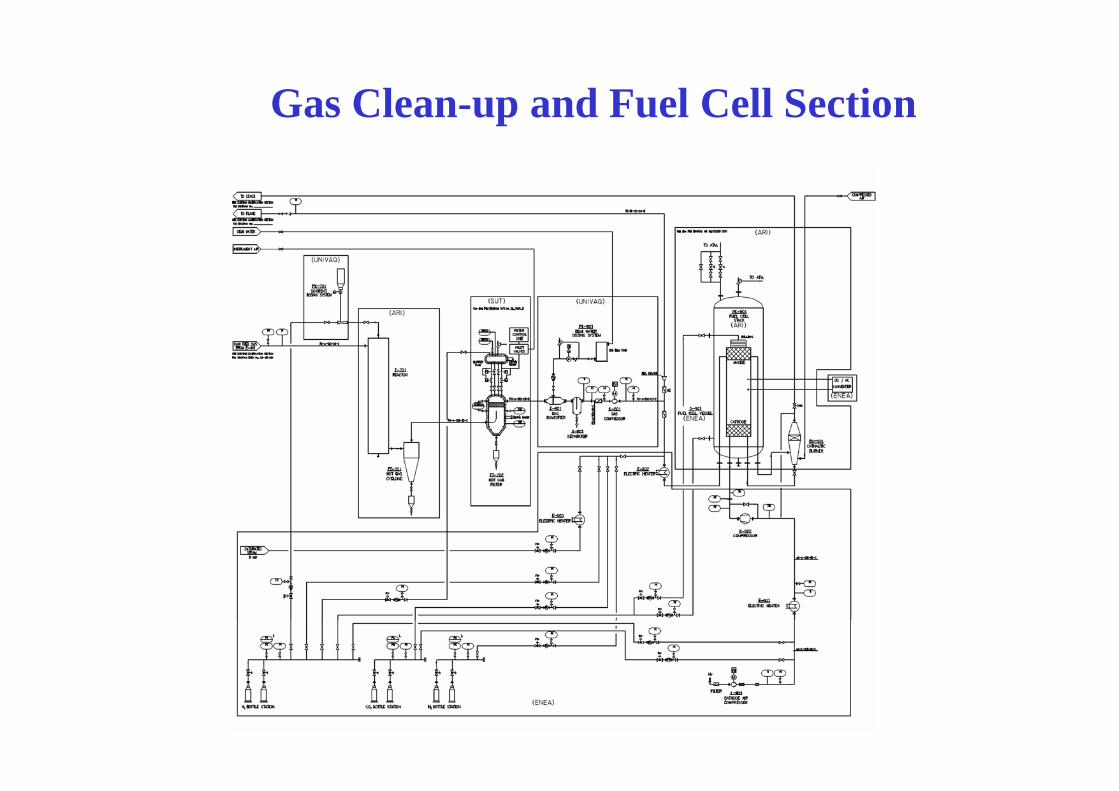
Gas Clean-up and Fuel Cell Section
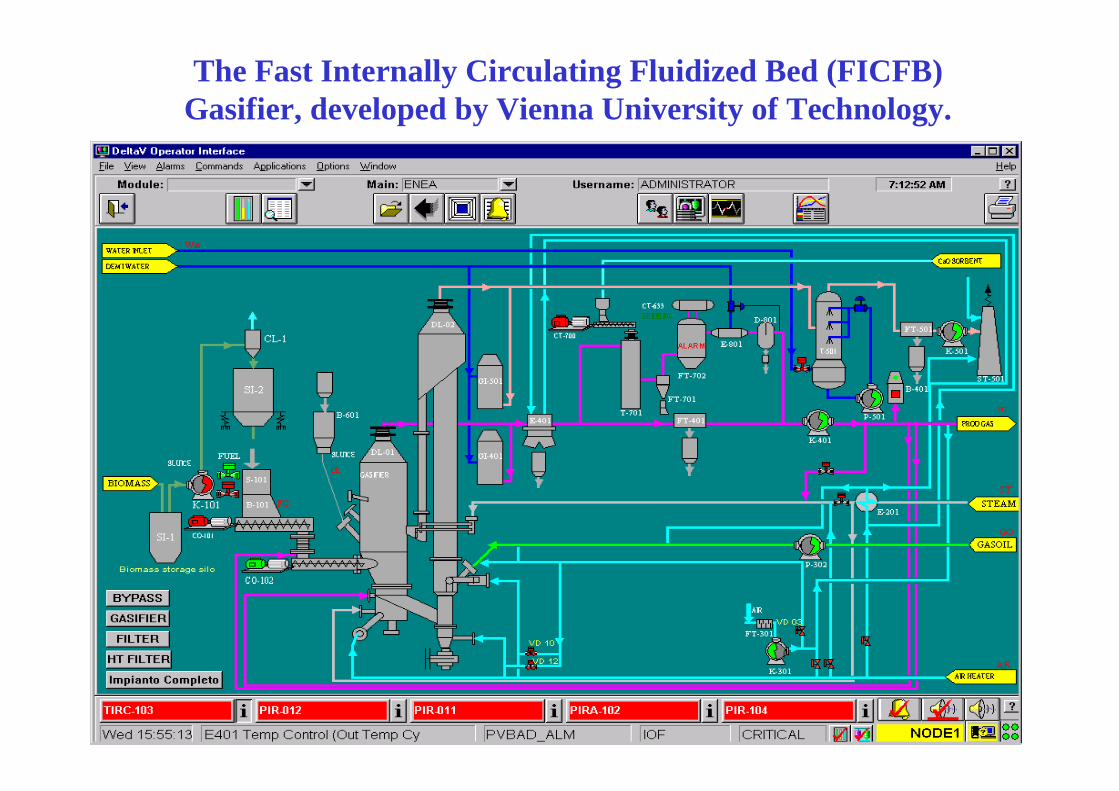
The Fast Internally Circulating Fluidized Bed (FICFB) Gasifier, developed by Vienna University of Technology.
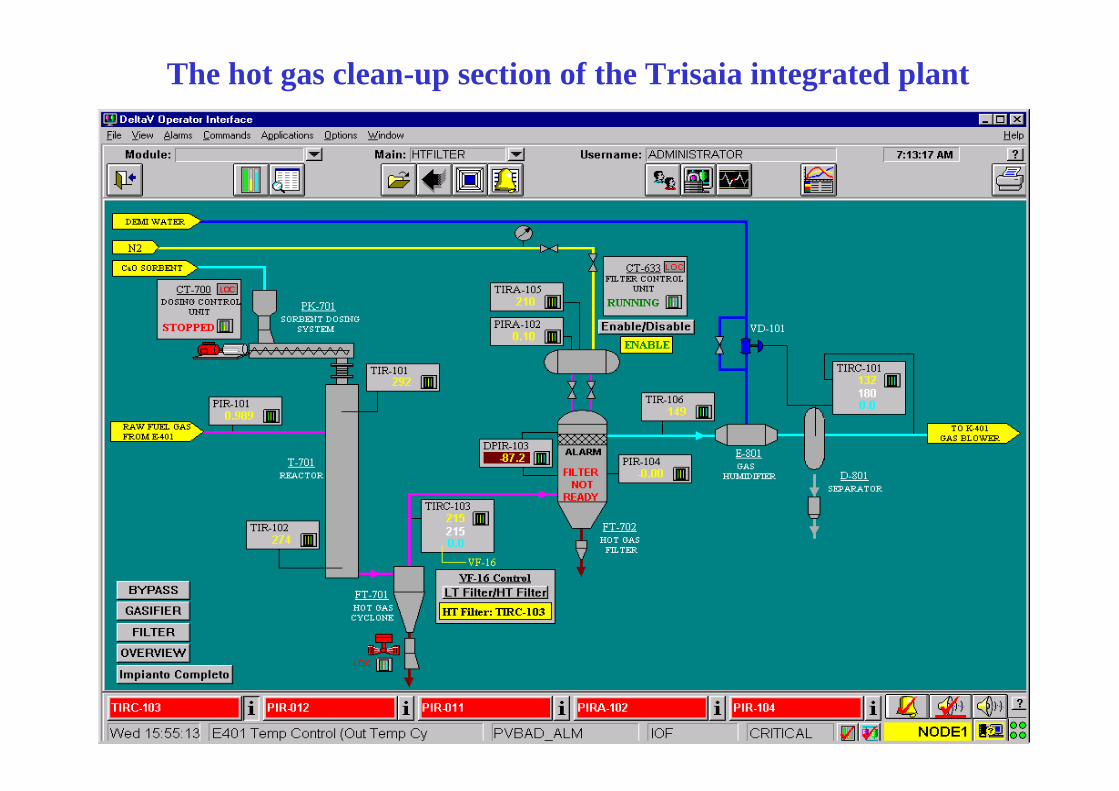
The hot gas clean-up section of the Trisaia integrated plant
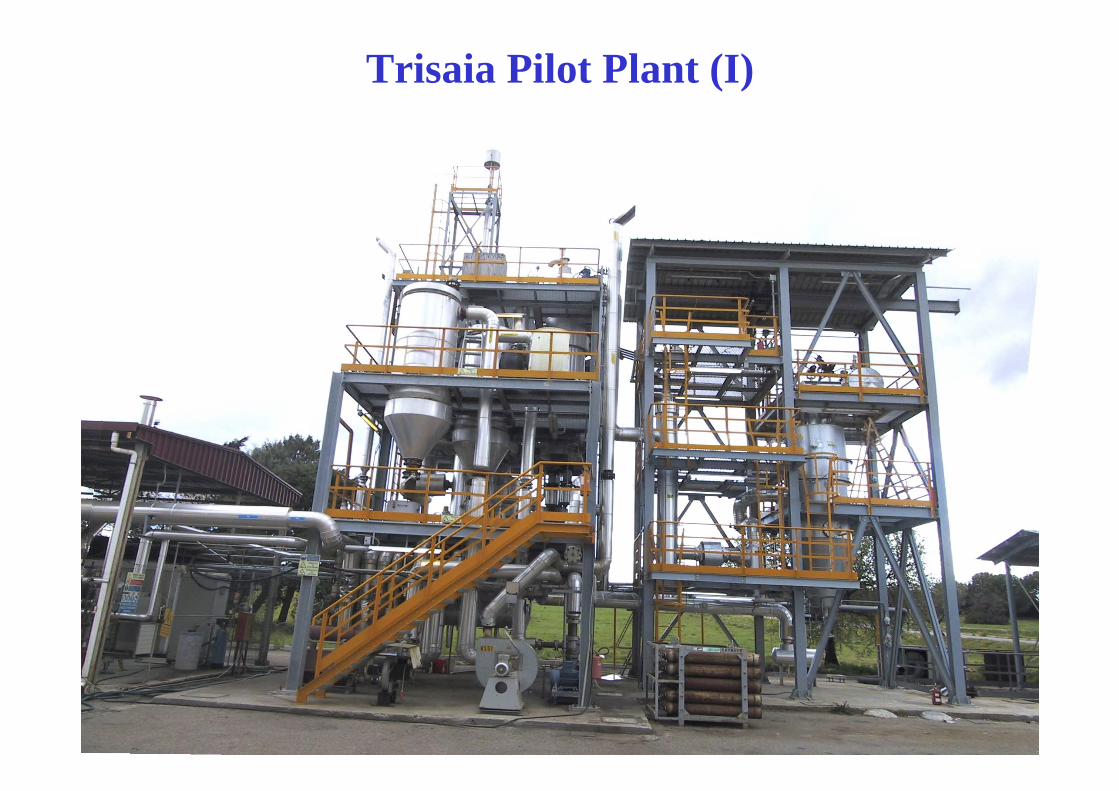
Trisaia Pilot Plant (I)
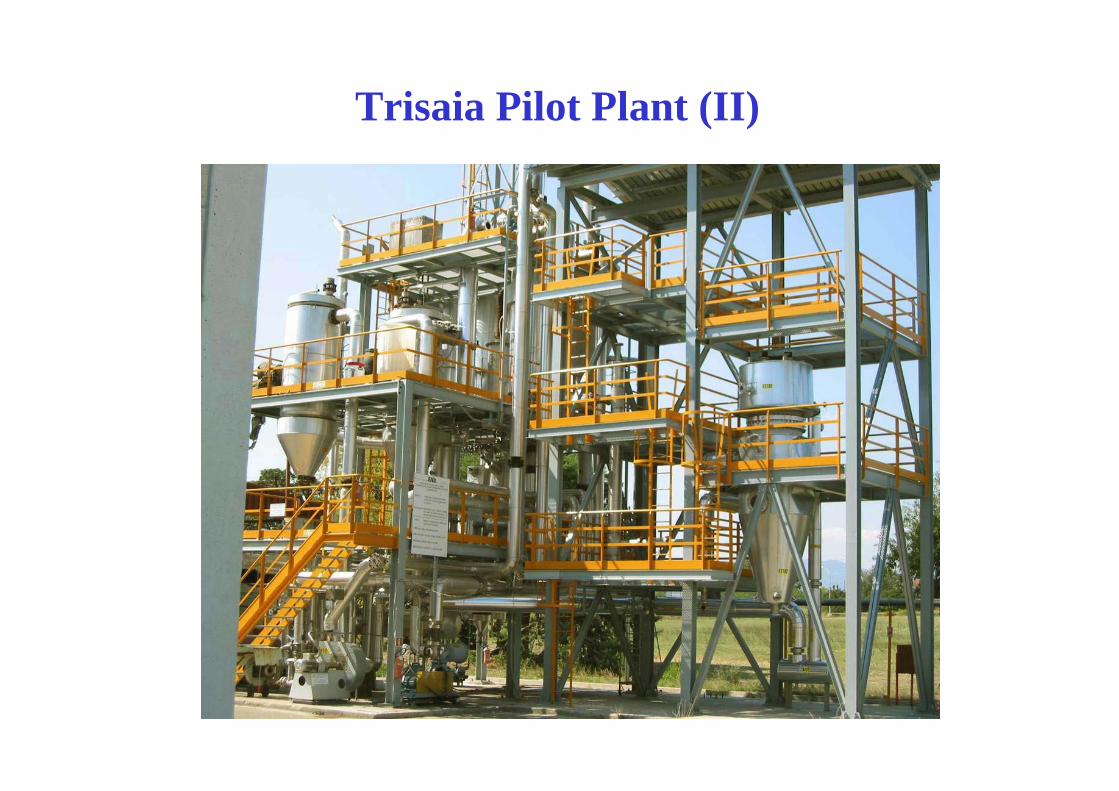
Trisaia Pilot Plant (II)
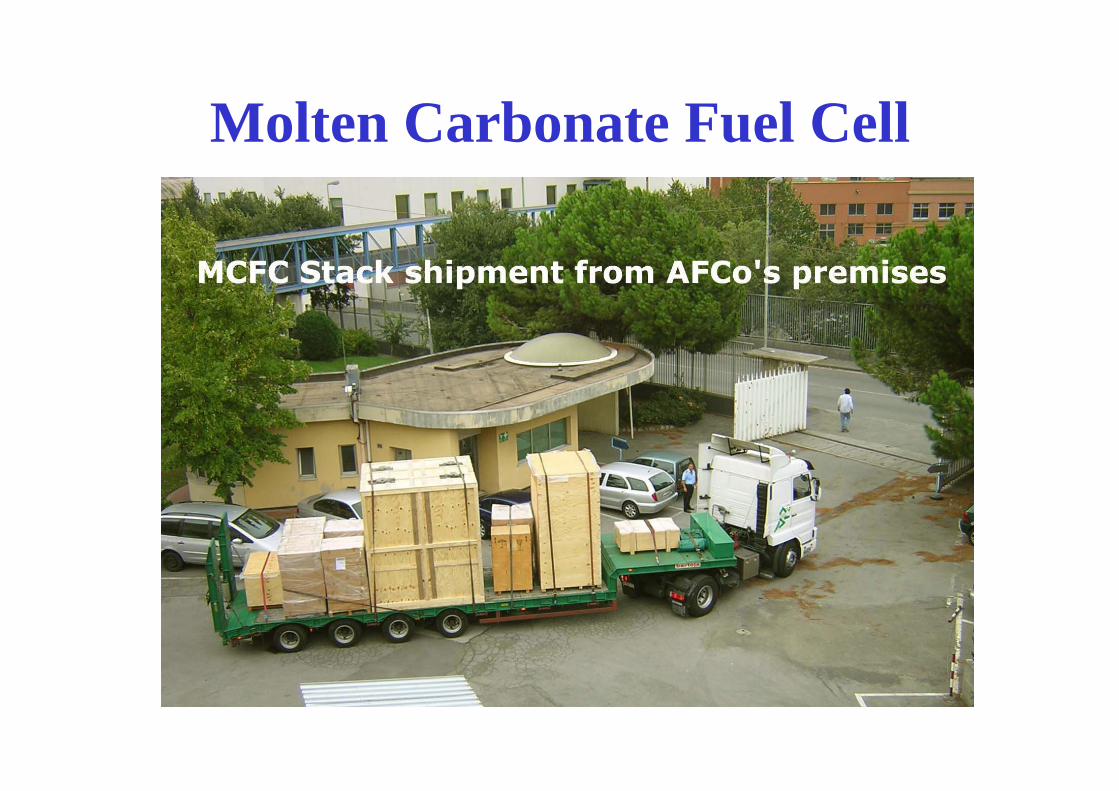
Molten Carbonate Fuel Cell
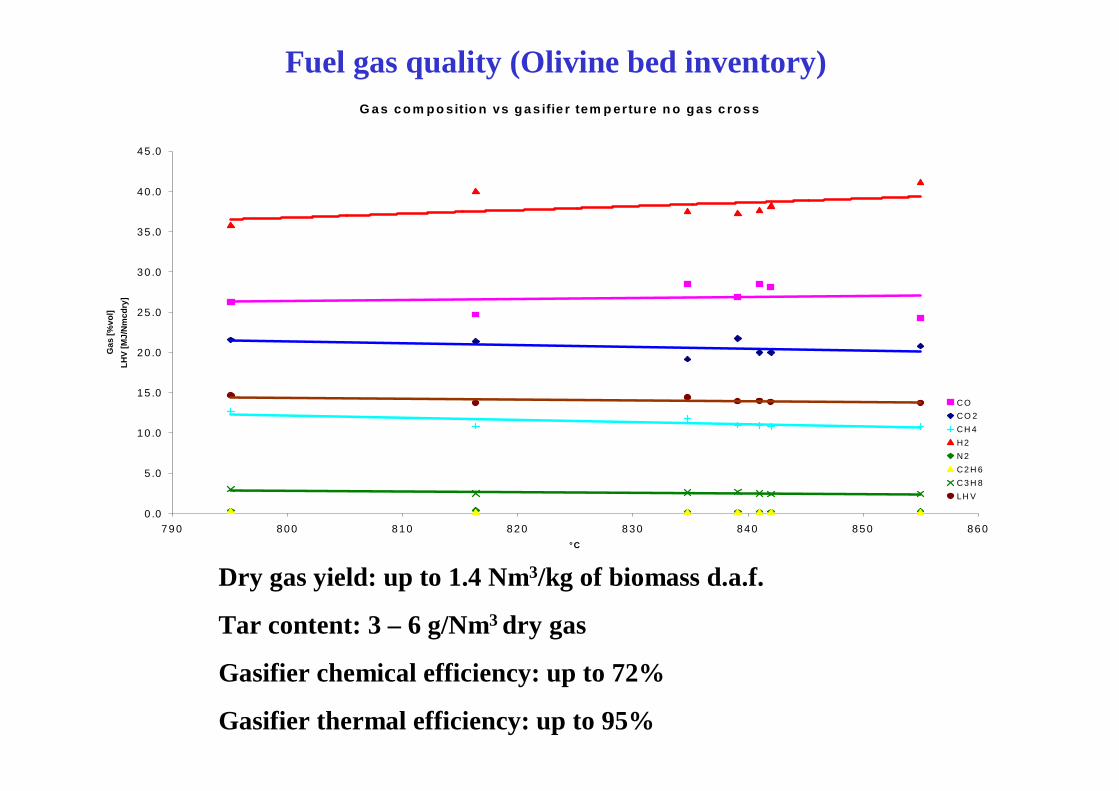
Fuel gas quality (Olivine bed inventory)
Dry gas yield: up to 1.4 Nm3/kg of biomass d.a.f.
Tar content: 3 – 6 g/Nm3 dry gas
Gasifier chemical efficiency: up to 72%
Gasifier thermal efficiency: up to 95%
G a s c o m p o sitio n vs g a s ifie r tem p ertu re n o g a s c ro s s
0 .0
5 .0
10 .0
15 .0
20 .0
25 .0
30 .0
35 .0
40 .0
45 .0
790 800 810 820 830 840 850 860°C
Gas
[%vo
l]LH
V [M
J/N
mcd
ry]
COCO 2CH 4H2N2C2 H 6C3 H 8LH V
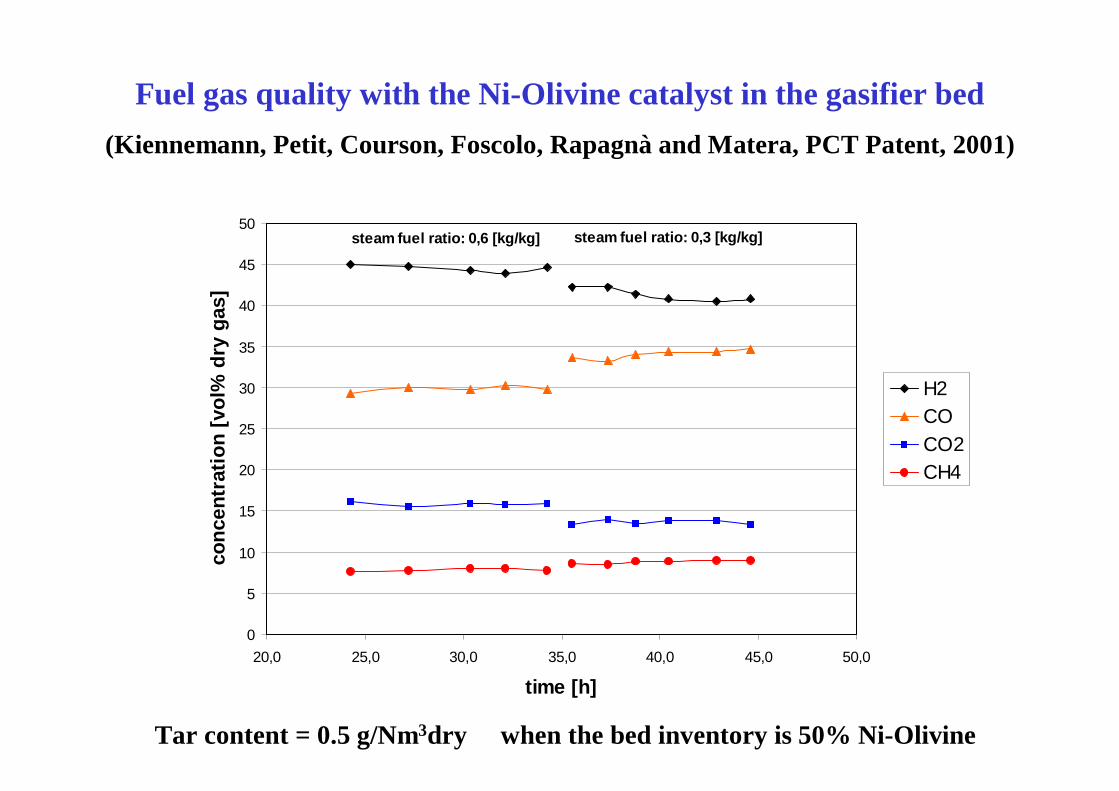
Fuel gas quality with the Ni-Olivine catalyst in the gasifier bed(Kiennemann, Petit, Courson, Foscolo, Rapagnà and Matera, PCT Patent, 2001)
Tar content = 0.5 g/Nm3dry when the bed inventory is 50% Ni-Olivine
0
5
10
15
20
25
30
35
40
45
50
20,0 25,0 30,0 35,0 40,0 45,0 50,0
time [h]
conc
entr
atio
n [v
ol%
dry
gas
]
H2COCO2CH4
steam fuel ratio: 0,6 [kg/kg] steam fuel ratio: 0,3 [kg/kg]
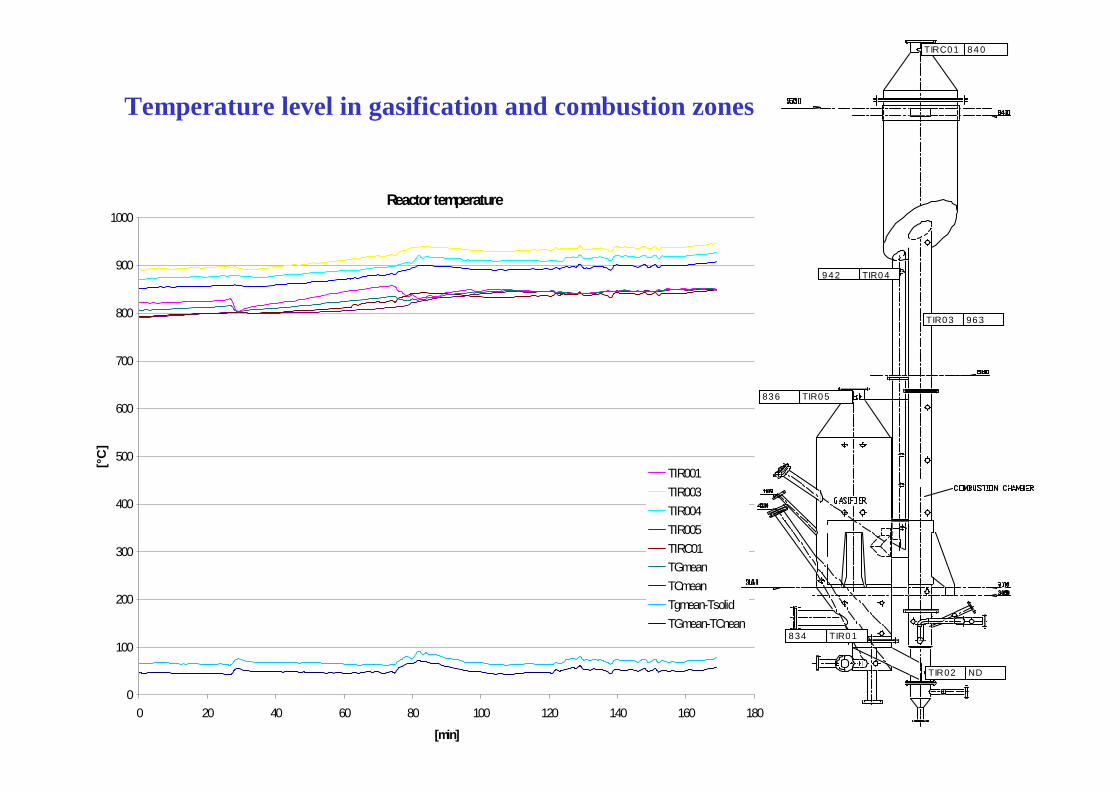
Reactor temperature
0
100
200
300
400
500
600
700
800
900
1000
0 20 40 60 80 100 120 140 160 180
[min]
[°C
]
TIR001TIR003TIR004TIR005TIRC01TGmeanTCmeanTgmean-TsolidTGmean-TCnean
Temperature level in gasification and combustion zones
TIR0 3
TIRC0 1
TIR0 5
TIR0 4
TIR0 1
8 4 0
96 3
8 34
9 4 2
83 6
TIR02 ND
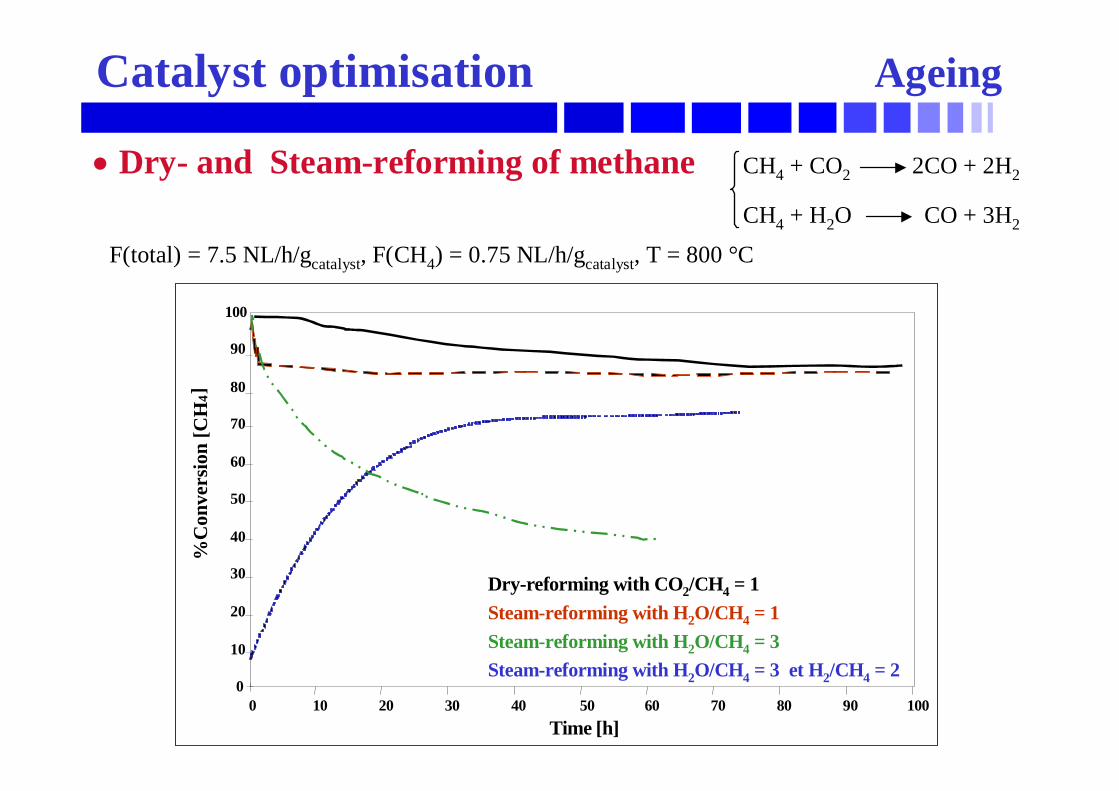
• Dry- and Steam-reforming of methane CH4 + CO2 2CO + 2H2
CH4 + H2O CO + 3H2
F(total) = 7.5 NL/h/gcatalyst, F(CH4) = 0.75 NL/h/gcatalyst, T = 800 °C
Dry-reforming with CO2/CH4 = 1Steam-reforming with H2O/CH4 = 1Steam-reforming with H2O/CH4 = 3Steam-reforming with H2O/CH4 = 3 et H2/CH4 = 2
0
10
20
30
40
50
60
70
80
90
100
0 10 20 30 40 50 60 70 80 90 100
%C
onve
rsio
n [C
H4]
Time [h]
Catalyst optimisation Ageing
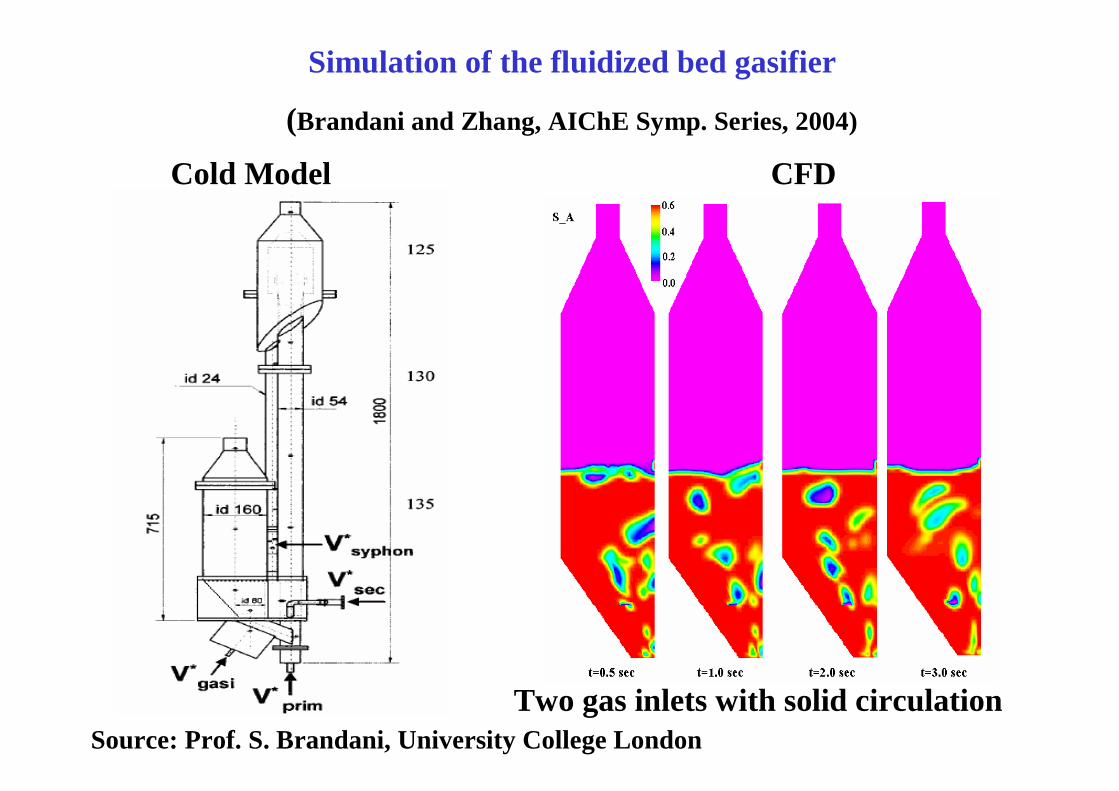
Simulation of the fluidized bed gasifier
(Brandani and Zhang, AIChE Symp. Series, 2004)
Cold Model CFD
Two gas inlets with solid circulationSource: Prof. S. Brandani, University College London
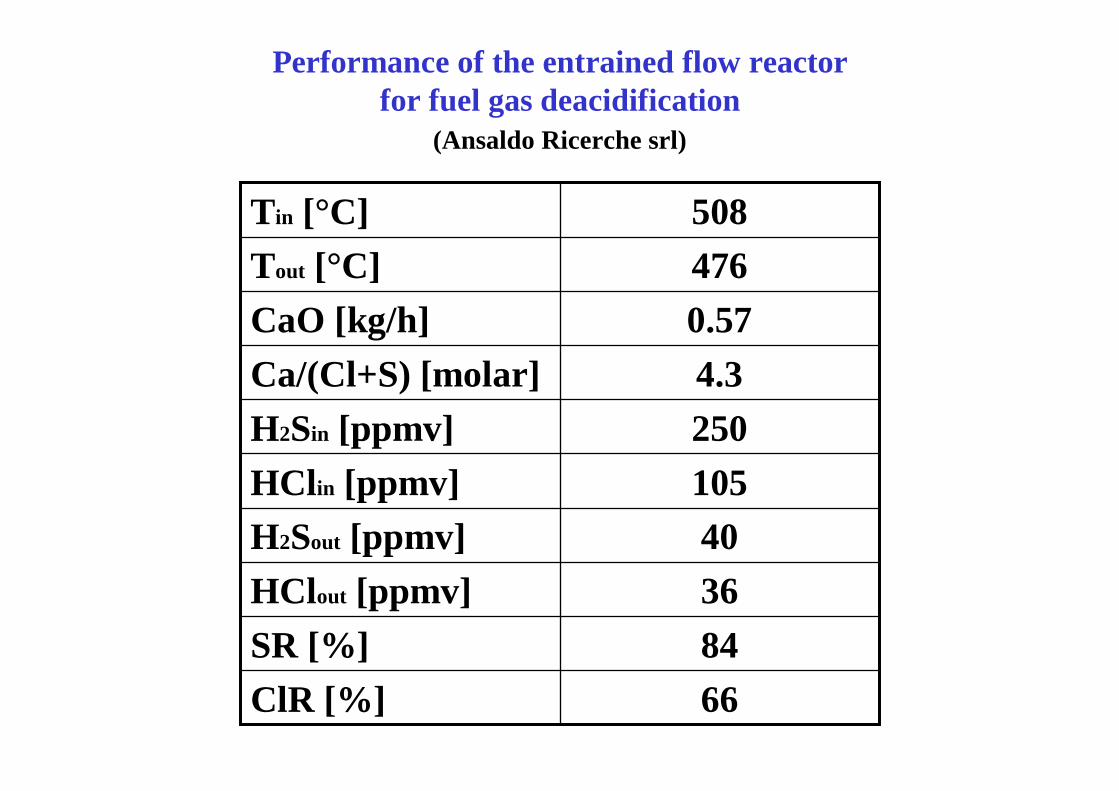
476Tout [°C]
66ClR [%]84SR [%]36HClout [ppmv]40H2Sout [ppmv]105HClin [ppmv]250H2Sin [ppmv]4.3Ca/(Cl+S) [molar]0.57CaO [kg/h]
508Tin [°C]
Performance of the entrained flow reactorfor fuel gas deacidification
(Ansaldo Ricerche srl)
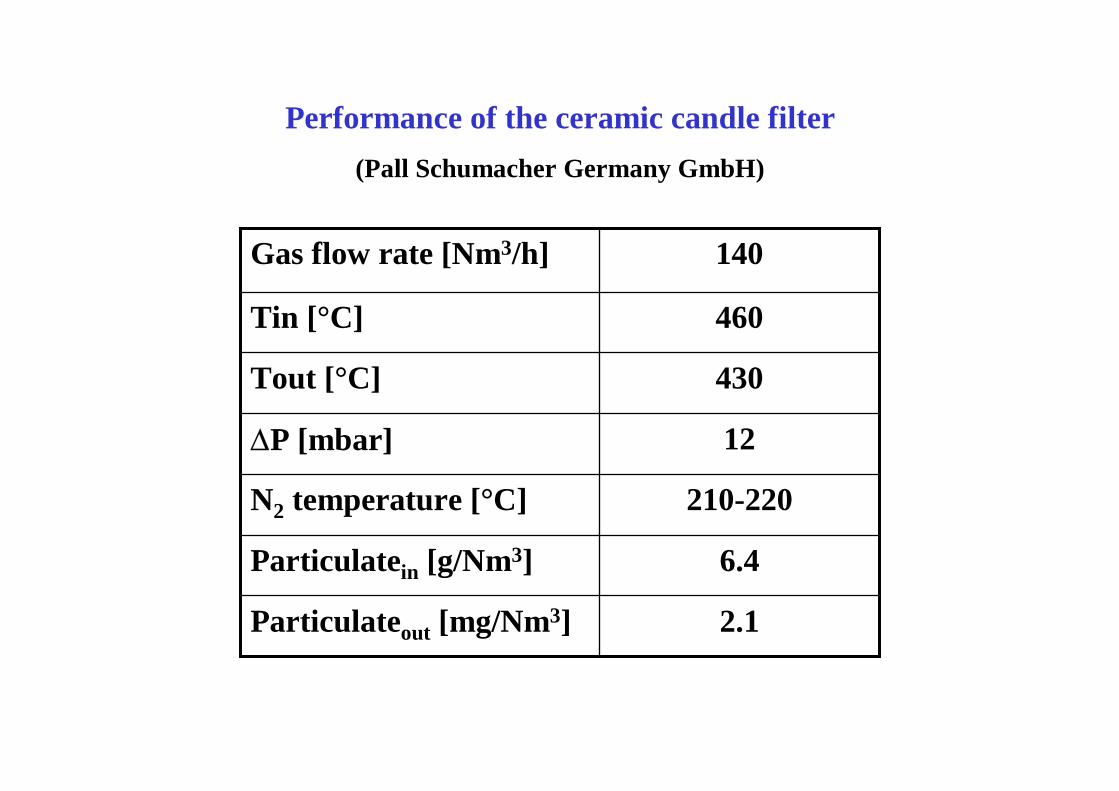
2.1Particulateout [mg/Nm3]
6.4Particulatein [g/Nm3]
210-220N2 temperature [°C]
12∆P [mbar]
430Tout [°C]
460Tin [°C]
140Gas flow rate [Nm3/h]
Performance of the ceramic candle filter(Pall Schumacher Germany GmbH)
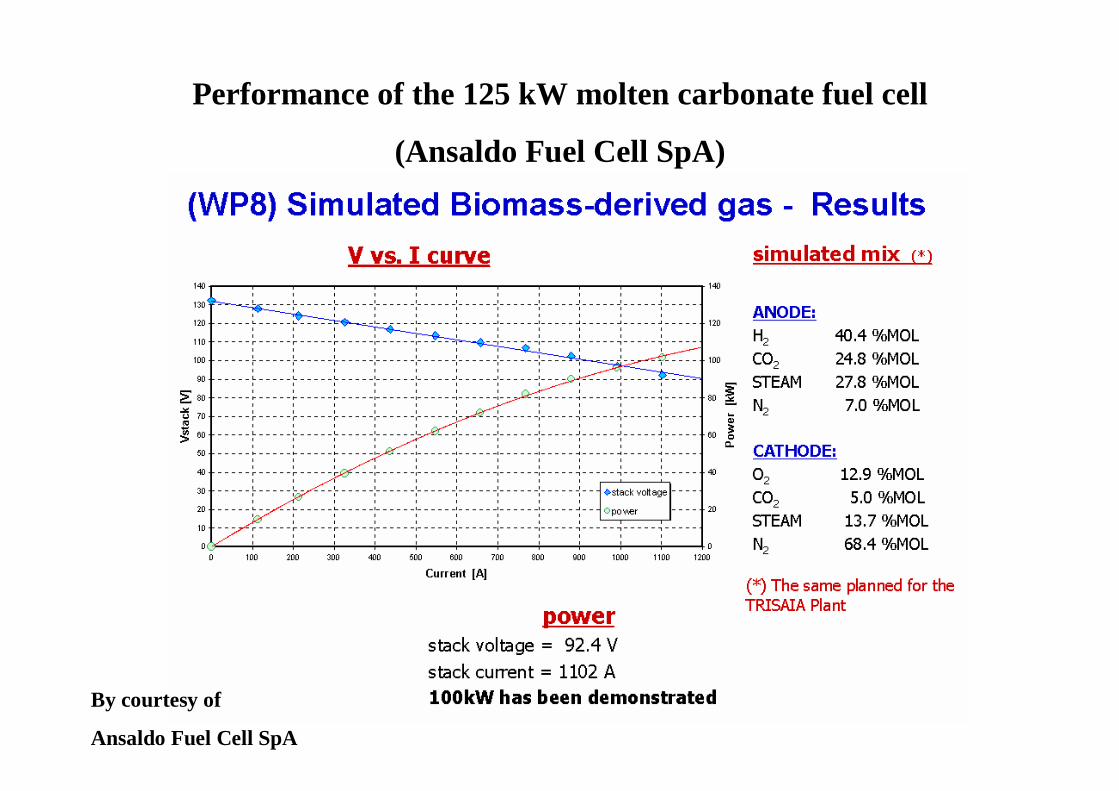
Performance of the 125 kW molten carbonate fuel cell
(Ansaldo Fuel Cell SpA)
By courtesy of
Ansaldo Fuel Cell SpA
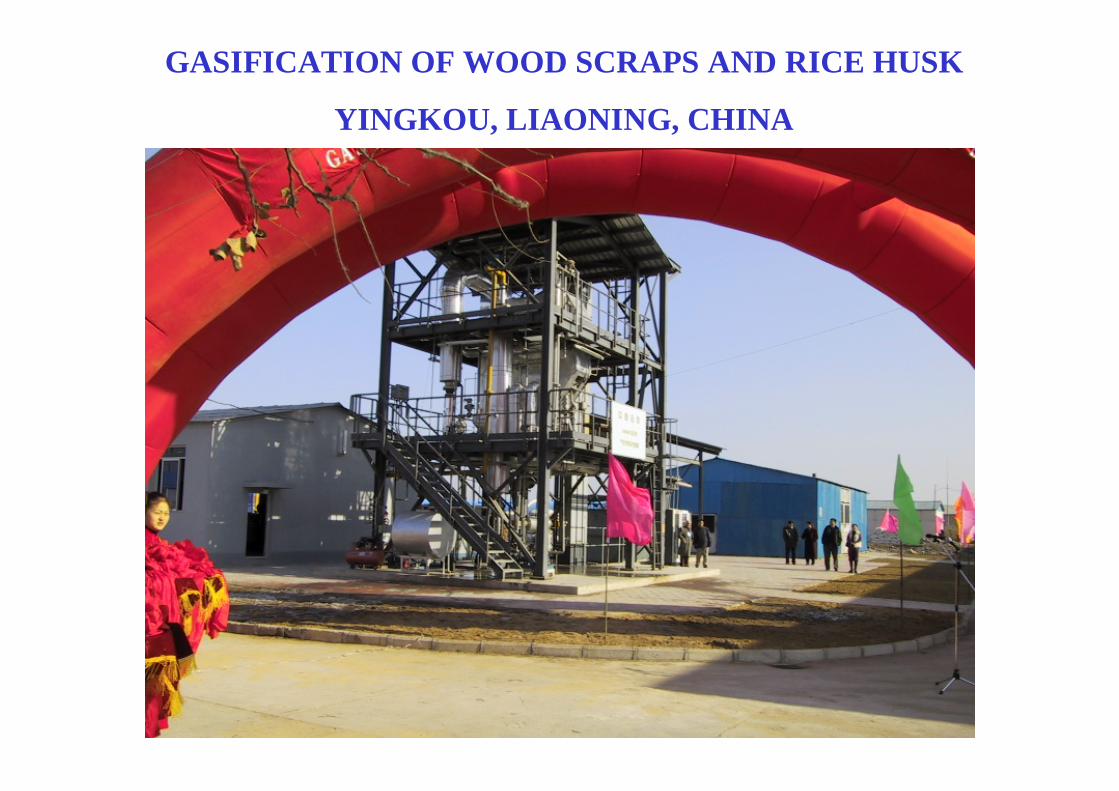
GASIFICATION OF WOOD SCRAPS AND RICE HUSK
YINGKOU, LIAONING, CHINA
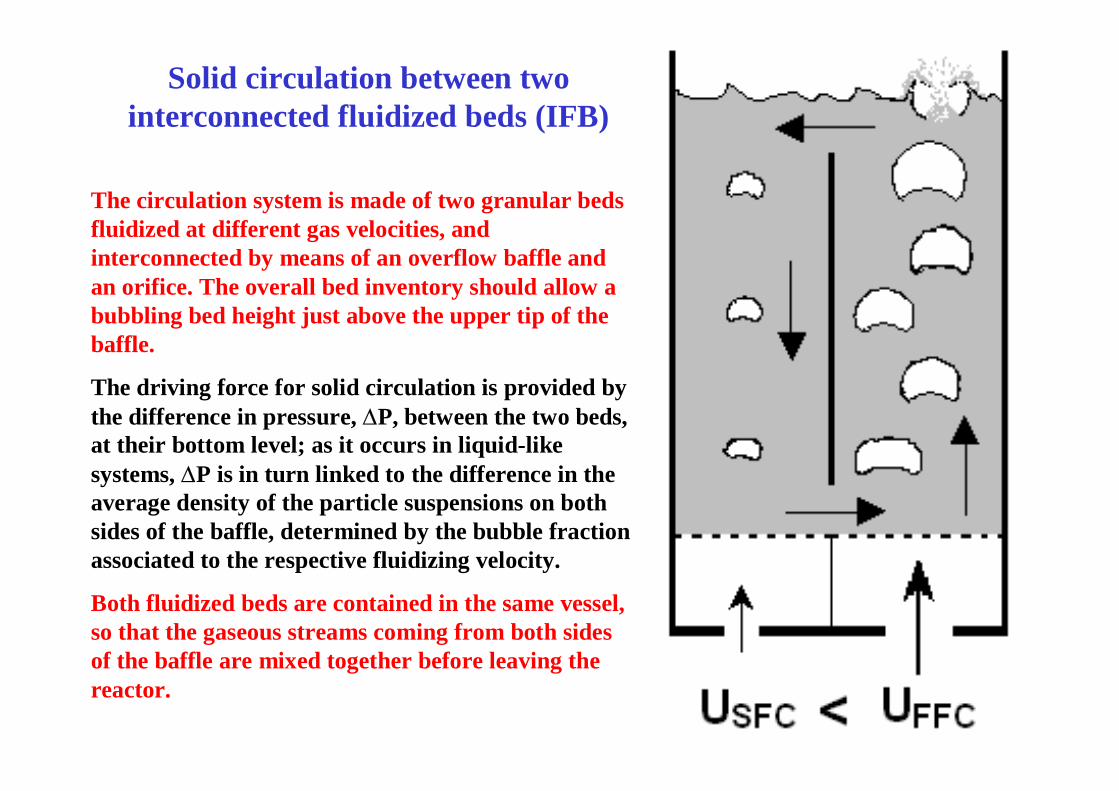
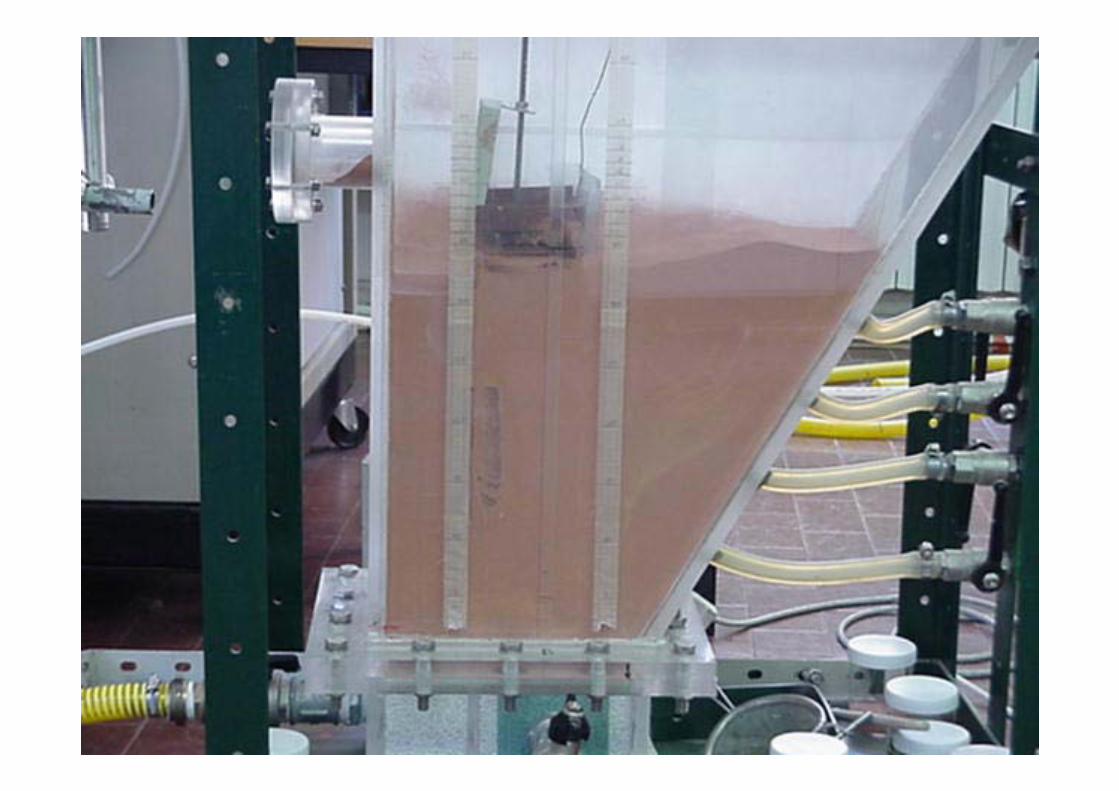
The circulation system is made of two granular beds fluidized at different gas velocities, and interconnected by means of an overflow baffle and an orifice. The overall bed inventory should allow a bubbling bed height just above the upper tip of the baffle.
The driving force for solid circulation is provided by the difference in pressure, ∆P, between the two beds, at their bottom level; as it occurs in liquid-like systems, ∆P is in turn linked to the difference in the average density of the particle suspensions on both sides of the baffle, determined by the bubble fraction associated to the respective fluidizing velocity.
Both fluidized beds are contained in the same vessel, so that the gaseous streams coming from both sides of the baffle are mixed together before leaving the reactor.
Solid circulation between two interconnected fluidized beds (IFB)
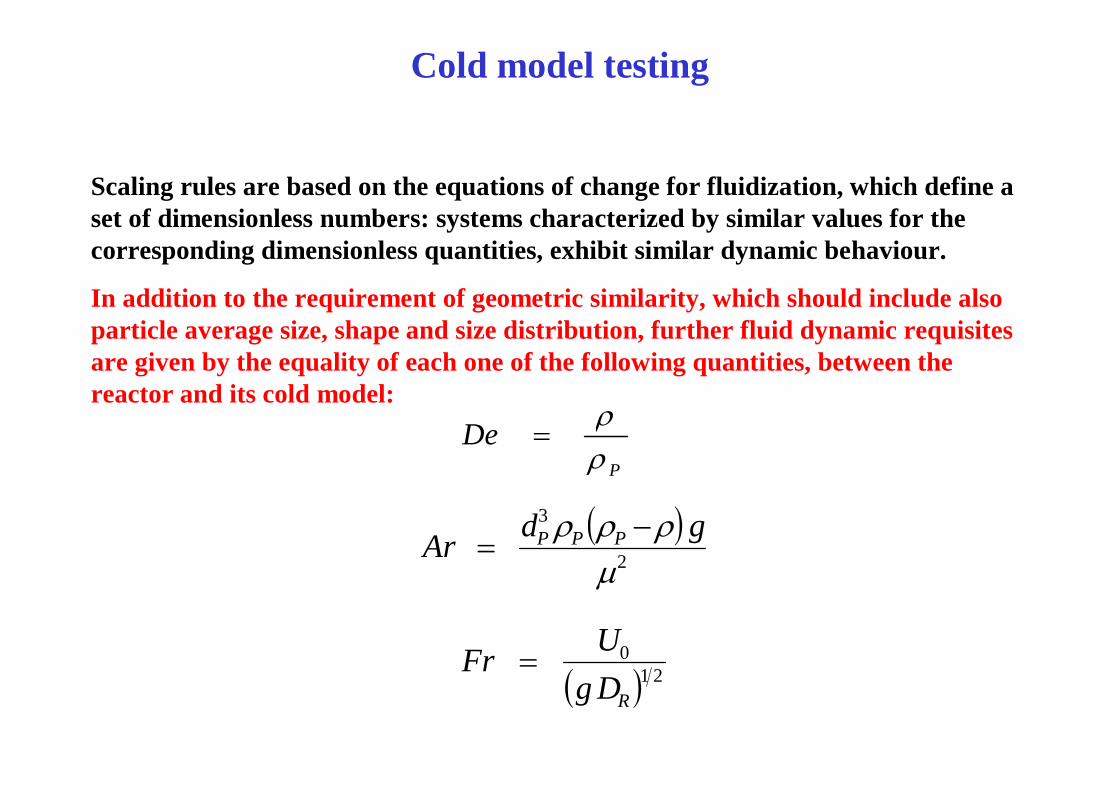
Cold model testing
Scaling rules are based on the equations of change for fluidization, which define a set of dimensionless numbers: systems characterized by similar values for the corresponding dimensionless quantities, exhibit similar dynamic behaviour.
In addition to the requirement of geometric similarity, which should include also particle average size, shape and size distribution, further fluid dynamic requisites are given by the equality of each one of the following quantities, between the reactor and its cold model:
( )2
3
µρρρ gdAr PPP −
=
P
Deρρ
=
( ) 210
RDgUFr =
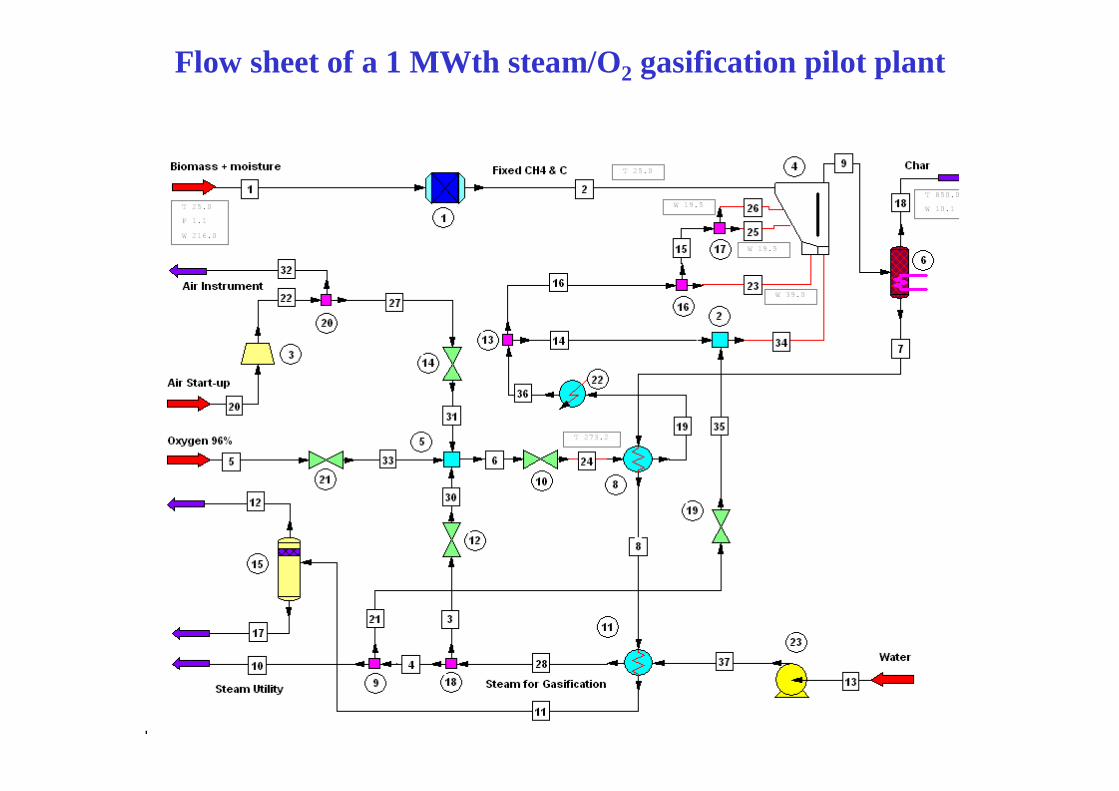
Flow sheet of a 1 MWth steam/O2 gasification pilot plant
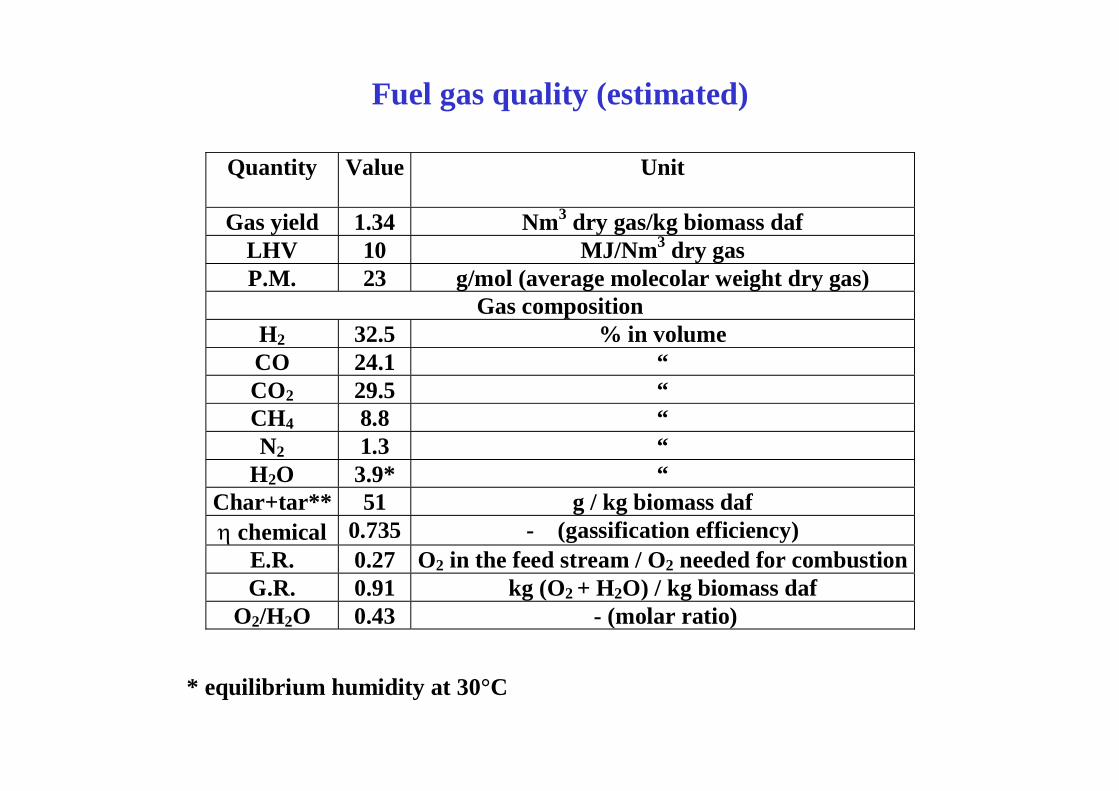
Quantity
Value Unit
Gas yield 1.34 Nm3 dry gas/kg biomass daf LHV 10 MJ/Nm3 dry gas P.M. 23 g/mol (average molecolar weight dry gas)
Gas composition H2 32.5 % in volume CO 24.1 “ CO2 29.5 “ CH4 8.8 “ N2 1.3 “
H2O 3.9* “ Char+tar** 51 g / kg biomass daf η chemical 0.735 - (gassification efficiency)
E.R. 0.27 O2 in the feed stream / O2 needed for combustionG.R. 0.91 kg (O2 + H2O) / kg biomass daf
O2/H2O 0.43 - (molar ratio)
* equilibrium humidity at 30°C
Fuel gas quality (estimated)