Embed Size (px)
Citation preview

Journal of Thyroid Research
Guest Editors: Oliver Gimm, Maria Domenica Castellone, Cuong Hoang-Vu, and Electron Kebebew
Biomarkers in Thyroid Tumor Research: New Diagnostic Tools and Potential Targets of Molecular-Based Therapy
Biomarkers in Thyroid Tumor Research:New Diagnostic Tools and Potential Targets ofMolecular-Based Therapy
Journal of Thyroid Research
Biomarkers in Thyroid Tumor Research:New Diagnostic Tools and Potential Targets ofMolecular-Based Therapy
Guest Editors: Oliver Gimm, Maria Domenica Castellone,Cuong Hoang-Vu, and Electron Kebebew

Copyright © 2011 SAGE-Hindawi Access to Research. All rights reserved.
This is a special issue published in “Journal of Thyroid Research.” All articles are open access articles distributed under the CreativeCommons Attribution License, which permits unrestricted use, distribution, and reproduction in any medium, provided the originalwork is properly cited.

Editorial Board
P. Beck-Peccoz, ItalyFausto Bogazzi, ItalyGlenn D. Braunstein, USAS. Y. Cheng, USAOrlo H. Clark, USAG. L. Clayman, USAAlbert A. Driedger, CanadaThomas J. Fahey, UKNadir Rashad Farid, TunisiaDouglas L. Fraker, USAGary L. Francis, USAJeremy L. Freeman, CanadaEric M. Genden, USA
Ronald A. Ghossein, USADavid Goldenberg, USAM. Gross, USAK. Kaserer, AustriaChristian Koch, USANoriyuki Koibuchi, JapanMarian Ludgate, UKC. Marcocci, ItalyAidan McElduff, AustraliaFiemu Nwariaku, USAA. Pinchera, ItalyMelanie Richards, USAJoanne Rovet, Canada
A. R. Shaha, USACarmen C. Solorzano, USAJulie A. Sosa, USAB. Stack, USAHiroshi E. Takami, JapanGiovanni Tallini, ItalyMassimo Tonacchera, ItalyDuncan Topliss, AustraliaJack R. Wall, AustraliaMalcolm H. Wheeler, UKMingzhao M. Xing, USAMasanobu Yamada, Japan

Contents
Biomarkers in Thyroid Tumor Research: New Diagnostic Tools and Potential Targets of Molecular-BasedTherapy, Oliver Gimm, Maria Domenica Castellone, Cuong Hoang-Vu, and Electron KebebewVolume 2011, Article ID 631593, 2 pages
Rap2A Is Upregulated in Invasive Cells Dissected from Follicular Thyroid Cancer, Indira Prabakaran,Jillian R. Grau, Robert Lewis, Douglas L. Fraker, and Marina A. GuvakovaVolume 2011, Article ID 979840, 6 pages
Leptin: A Correlated Peptide to Papillary Thyroid Carcinoma?, Mehdi Hedayati, Parichehr Yaghmaei,Zahra Pooyamanesh, Marjan Zarif Yeganeh, and Laleh Hoghooghi RadVolume 2011, Article ID 832163, 5 pages
Hypoxia-Inducible Factor in Thyroid Carcinoma, Natalie Burrows, Muhammad Babur, Julia Resch,Kaye J. Williams, and Georg BrabantVolume 2011, Article ID 762905, 17 pages
Lymph Node Thyroglobulin Measurement in Diagnosis of Neck Metastases of Differentiated ThyroidCarcinoma, Luca Giovanella, Luca Ceriani, and Sergio SurianoVolume 2011, Article ID 621839, 7 pages
Clinical Utility of Serum Interleukin-8 and Interferon-Alpha in Thyroid Diseases, Toral P. Kobawala,Girish H. Patel, Dhara R. Gajjar, Kamini N. Patel, Premal B. Thakor, Urvi B. Parekh, Kirti M. Patel,Shilin N. Shukla, and Pankaj M. ShahVolume 2011, Article ID 270149, 10 pages

SAGE-Hindawi Access to ResearchJournal of Thyroid ResearchVolume 2011, Article ID 631593, 2 pagesdoi:10.4061/2011/631593
Editorial
Biomarkers in Thyroid Tumor Research: New Diagnostic Toolsand Potential Targets of Molecular-Based Therapy
Oliver Gimm,1 Maria Domenica Castellone,2 Cuong Hoang-Vu,3 and Electron Kebebew4
1 Department of Clinical and Experimental Medicine, Faculty of Health Sciences, Linkoping University; Department of Surgery,County Council of Ostergotland, 58185 Linkoping, Sweden
2 CNR c/o Dipartimento di Biologia e Patologia Cellulare e Molecolare, Istituto di Oncologia Sperimentale “G. Salvatore”,Universita Federico II, 80131 Napoli, Italy
3 Universitatsklinik und Poliklinik fur Allgemein-, Viszeral- und Gefaßchirurgie, Martin-Luther Universitat, 06097 Halle, Germany4 Endocrine Oncology Section, Surgery Branch, National Cancer Institute, National Institutes of Health, Bethesda, MD 20892, USA
Correspondence should be addressed to Oliver Gimm, [email protected]
Received 21 November 2011; Accepted 21 November 2011
Copyright © 2011 Oliver Gimm et al. This is an open access article distributed under the Creative Commons Attribution License,which permits unrestricted use, distribution, and reproduction in any medium, provided the original work is properly cited.
Thyroid cancer’s incidence has increased dramatically overthe last years and it now accounts for 2.6% of all newcancers when epithelial skin cancers are excluded. Thisincrease has been partially attributed to improved screeningmethods, mainly ultrasonography identifying subclinical tu-mors. However, the evidence that also the number of moreadvanced tumors and thus thyroid-cancer-associated mor-tality is increasing suggests that the underlying cause isnot completely understood [1]. The molecular basis of thy-roid carcinogenesis has been widely investigated, leading tothe discovery of oncogenes such as BRAF, RAS, and RETas major players in tumor development and progression.Recently, however, it has been shown that the rate of BRAFmutations that have been associated with a more aggressivetumor type in papillary thyroid carcinomas has increasedover time [2]. This oncogenic addiction to specific geneticchanges has highlighted thyroid cancer as an ideal modelfor targeted therapy using biological inhibitors and smallmolecule inhibitors of RET and BRAF, which have alreadyreached the clinic [3]. Our ability to detect persistent andrecurrent malignant thyroid tumors has also improved as aresult of more sensitive biochemical tumor marker assays,although it is unclear whether these higher rates indicateclinically significant disease.
The articles published in this special issue shed newlight on the molecular mechanisms involved in thyroidtumors and propose novel diagnostic and therapeutic targets
against this disease. The results could have important clinicalramifications in the management of patients with thyroidtumors.
Thyroid follicular neoplasms represent a diagnostic chal-lenge, as thyroid fine-needle aspiration biopsy cannot distin-guish benign from malignant tumors in up to 30% of cases.An important goal would be to identify diagnostic and prog-nostic markers that could help avoid unnecessary surgeries,which can result in complications such as recurrent laryngealnerve palsy and, in the case of bilateral thyroid surgery,hypoparathyroidism. The main preoperative diagnostic chal-lenge concerns follicular thyroid lesions. Traditionally, thedistinction between follicular thyroid adenomas and car-cinomas is made histologically when there is evidence ofcapsular and/or vascular invasion. Preoperative markers are,therefore, sought after. Prabakaran and colleagues analyzedthe expression levels of various genes in archival thyroidtissue. They found that RAP2A, a member of the ras familythat is closely related to Ras, was significantly associatedwith higher expression in microdissected carcinoma cellsthat have invaded through the thyroid capsule and enteredblood vessels than in thyroid tumor cells growing under thecapsule. They concluded that RAP2A may be a biomarkerassociated with invasion of thyroid follicular cells. If theirfinding can be confirmed in larger studies, the evaluationof this marker in fine-needle aspiration aspirates may bewarranted and informative.
2 Journal of Thyroid Research
In another study, T. Kobawala and colleagues report onthe clinical utility of interleukin-8 (IL-8) and interferon-alpha in the diagnosis of thyroid diseases. IL-8 is a well-characterized chemotactic cytokine that is produced by ma-crophages and other cell types such as epithelial cells. Inter-feron-alpha is an antiviral and anti-proliferative agent thatcan stimulate both macrophages and natural killer cells toelicit an anti-viral response. It has also been shown to beactive against tumors. The authors have analyzed 88 patientswith various types of thyroid diseases. They found overallincreased levels of serum IL-8 in patients with thyroid carci-noma as compared to various benign disorders. While thereis a large overlap between the serum IL-8 levels in patientswith malignant and benign thyroid diseases, these datasupport the idea that chronic inflammatory processes mayplay an important role in the development and progressionof cancer and provide new therapeutic targets in malignantthyroid tumors.
Among the novel diagnostic markers proposed in thisissue, M. Hedayati and colleagues report on leptin levels in83 patients with papillary thyroid and 90 healthy controlpersons. Leptin is a neuroendocrine hormone that has a vari-ety of different effects including effects on the immune sys-tem and the thyroid gland. The authors found significantlyhigher serum leptin level in patients with thyroid canceras compared to the control group including a difference bysex.
In another article, l. Giovanella and colleagues have in-vestigated thyroglobulin as a marker of recurrent or persist-ent disease by analyzing the levels of thyroglobulin in lymphnodes in order to analyze the presence of metastatic thyroidtissue. Thyroglobulin is a protein synthesized by the thyroidgland and stored in the follicular lumen. Since, under normalconditions, thyroglobulin can only be found inside the thy-roid gland, it has been used for decades as a sensitive tumormarker to detect persistent and recurrent disease in patientswith differentiated thyroid cancer of follicular cell origin (themost common types of thyroid cancer). Thyroglobulin can,however, also be used preoperatively to guide the extent ofsurgery in patients with persistent or recurrent disease. Theyfound that thyroglobulin levels higher than 1.1 ng/mL inaspirates from cervical lymph nodes were highly sensitive forthe presence of metastases. Both sensitivity and specificitywere higher than that of cytology from fine-needle aspirates.This approach can thus help guide the need and extentof lymph node dissection in patients who have suspiciouslymph nodes on ultrasound but with inconclusive cytologicfindings either in the preoperative setting or during followup.
Finally, N. Burrows and colleagues report on the role ofhypoxia-inducible factor-1 (HIF-1) in thyroid carcinoma ag-gressiveness. HIF-1 regulates the expression of several genesthat have been shown to be involved in tumor cell survival,progression, metastasis, and even resistance to both chem-otherapy and radiotherapy. In this study, the authors showthat both hypoxia and oncogenic signaling pathways caninduce HIF-1 in thyroid carcinoma. Based on their analysis,they also suggest that targeting HIF-1 might improve the
poor therapeutic response of advanced thyroid carcinoma toradiotherapy.
Oliver GimmMaria Domenica Castellone
Cuong Hoang-VuElectron Kebebew
References
[1] A. Y. Chen, A. Jemal, and E. M. Ward, “Increasing incidence ofdifferentiated thyroid cancer in the United States, 1988–2005,”Cancer, vol. 115, no. 16, pp. 3801–3807, 2009.
[2] A. Mathur, W. Moses, R. Rahbari et al., “Higher rate ofBRAF mutation in papillary thyroid cancer over time: a single-institution study,” Cancer, vol. 117, no. 19, pp. 4390–4395, 2011.
[3] M. Schlumberger and S. I. Sherman, “Clinical trials for pro-gressive differentiated thyroid cancer: patient selection, studydesign, and recent advances,” Thyroid, vol. 19, no. 12, pp. 1393–1400, 2009.
SAGE-Hindawi Access to ResearchJournal of Thyroid ResearchVolume 2011, Article ID 979840, 6 pagesdoi:10.4061/2011/979840
Research Article
Rap2A Is Upregulated in Invasive Cells Dissected fromFollicular Thyroid Cancer
Indira Prabakaran,1 Jillian R. Grau,2 Robert Lewis,1
Douglas L. Fraker,1 and Marina A. Guvakova1
1 Department of Surgery, School of Medicine, University of Pennsylvania, Philadelphia, PA 19104, USA2 Department of Pathology and Laboratory Medicine, School of Medicine, University of Pennsylvania, Philadelphia, PA 19104, USA
Correspondence should be addressed to Marina A. Guvakova, [email protected]
Received 11 April 2011; Revised 3 August 2011; Accepted 13 August 2011
Academic Editor: Maria Domenica Castellone
Copyright © 2011 Indira Prabakaran et al. This is an open access article distributed under the Creative Commons AttributionLicense, which permits unrestricted use, distribution, and reproduction in any medium, provided the original work is properlycited.
The development of molecular biomarkers (BMs) of follicular thyroid carcinoma is aimed at advancing diagnosis of follicularneoplasm, as histological examination of those tumors does not lend itself to definitive diagnosis of carcinoma. We assessedthe relative levels of expression of 6 genes: CCND2, PCSK2, PLAB, RAP2A, TSHR, and IGF-1R in archived thyroid tissue. Thequantitative real-time PCR analysis revealed a significant change in 3 genes: PSCK2 (a 22.4-fold decrease, P = 2.81E − 2), PLAB(an 8.3-fold increase, P = 9.81E − 12), and RAP2A (a 6.3-fold increase, P = 9.13E − 10) in carcinoma compared with adenoma.Expression of PCSK2 was equally low, PLAB was equally high, whereas RAP2A expression was significantly higher (25.9-fold,P = 0.039) in microdissected carcinoma cells that have invaded through the thyroid capsule and entered blood vessels than inthyroid tumor cells growing under the capsule. Thus, RAP2A appeared as a unique and worthy of further evaluation candidate BMassociated with invasion of thyroid follicular cells.
1. Introduction
Differentiated thyroid carcinomas originating from the fol-licular epithelium have a papillary (range, 65–88%) and a fol-licular (range, 9–23%) histotype [1]. Although follicular thy-roid carcinomas (FTCs) are the second most common differ-entiated thyroid cancers, they are more aggressive than pap-illary thyroid carcinomas (PTCs) and invade into the capsule(minimally invasive) and veins (angioinvasive) within thethyroid gland. Importantly, mortality is related to the degreeof invasion [2]. Furthermore, FTC has a greater rate of recur-rence and is frequently associated with distant metastasis tothe lung, bone, brain, and liver [3, 4]. Total thyroidectomyrepresents the dominant method of surgical treatment forfollicular neoplasms diagnosed preoperatively by fine needleaspirates (FNAs). Distinguishing follicular adenoma fromminimally invasive or encapsulated angioinvasive carcinomain FNA can be extremely challenging [3, 5]. Gene and micro-RNA (miRNA) expression profiling are being investigated toidentify potential BMs differentiating benign from malignant
follicular tumors [6, 7]. Such BMs might be clinically usefulto help predicting follicular thyroid malignancy and reducethe frequency of surgical procedures by identifying those pa-tients with benign lesions who do not require surgical ex-cision. So far, however, global genetic screens have notimproved preoperative diagnosis of FTC. Hence, novel ap-proaches are necessary to identify potential preoperativemolecular BMs to facilitate the diagnosis of FTC. One of theapproaches could be discovering specific molecular BMsassociated with invasion of thyroid follicular cells.
2. Materials and Methods
2.1. Thyroid Tissue. Cases of follicular-patterned thyroidcancer are quite rare; even lesser is the number of remainingsamples available for research. For this study, a unique cohortof patients diagnosed with follicular-patterned thyroid can-cer was identified on review of medical records from the Hos-pital of University of Pennsylvania between 1992 and 2007.
2 Journal of Thyroid Research
After reexamination of 16 available formalin-fixed, paraffin-embedded (FFPE) tissues (for histological presence of vas-cular and/or capsular invasion) and initial determination ofintegrity of total RNA in the tissue scrapes, we found that twosamples had degraded RNA, one sample had too little RNA tobe amplified by in vitro transcription (IVT), in two samplesthe areas of invasion had already been cut through, and 10specimens fully met study’s criteria. Subsequently, the studywas performed in specimens from 8 patients diagnosed withFTC, 1 patient diagnosed with FTC-Hurthle cell carcinoma(HCC), 1 patient diagnosed with HCC, and 10 patientsdiagnosed with follicular thyroid adenoma (FTA). Groupsof patients with FTA (mean age, 52.4 ± 16.2 SD years) andfollicular thyroid malignancy (mean age, 50.8 ± 13.1 SD,years) were age matched (Table 1). Ten normal FFPE thyroidsamples were from patients who underwent surgery afterdiagnosis of larynx squamous cell carcinoma (mean age,62.4 ± 7.0 SD, years). Histopathological analysis of all tissueswas performed by a surgical pathology fellow (JG) and con-firmed by a thyroid pathologist (Dr. Virginia LiVolsi). Thestudy protocol was approved by the University of Pennsylva-nia Institutional Review Board committee.
2.2. Thyroid Tissue Analysis: RNA Extraction, cDNA Synthesis,and Quantitative Real-Time PCR (Q-RT-PCR). RNA was ex-tracted from the normal, adenoma, and cancer tissue scrapesusing the Absolutely RNA FFPE kit (Stratagene, La Jolla,CA). In addition, RNA was extracted from a snap frozenthyroid carcinoma using the High Pure RNA Tissue kit(Roche Diagnostics, Indianapolis, IN) to use as a positivecontrol and generate a standard curve for all subsequent PCRreactions. Integrity of RNA from a snap frozen tissue wasdetermined by 260 to 280 nm ratio using a DU 640 spec-trophotometer (Beckman Coulter, Fullerton, CA). Integrityof the scraped tissue RNA was assessed by Q-RT-PCRusing 3′ACTB and 5′ACTB primers (Table 2) and theParadise Sample Quality Assessment Kit (Molecular Devices,Sunnyvale, CA). 10–100 ng of the scraped tissue RNA or500 ng of a positive control RNA were reverse-transcribedinto single-stranded cDNA using the first-strand cDNAsynthesis kit (Roche Diagnostics, Indianapolis, IN). cDNAsynthesis was carried out in a 20 μL reaction mix containing5 mM MgCl2, 1 mM dNTPs, 0.04 units of random primersp(dN)6, 50 units of RNase inhibitor, and 20 units of AvianMyeloblastosis Virus (AMV) reverse transcriptase. Q-RT-PCR was performed using 3 μL of the first-strand cDNAwith 1 μM of the housekeeping gene, ACTB, or target gene-specific primers (Table 2) using the LightCycler 2.0 (RocheMolecular Biochemicals, Mannheim, Germany) instrumentand the LightCycler Fast Start DNA MasterPLUS SYBR Green1 kit (Roche Diagnostics, Indianapolis, IN) according tothe manufacturer’s instructions. PCR parameters were a10 min preincubation time at 95◦C followed by 45 cycles ofdenaturation (10 sec at 95◦C), annealing (10 sec at 55◦C),and extension (25 sec at 72◦C). A standard curve for eachof the target and housekeeping gene was generated for everyPCR run to determine levels of gene expression. All reactionswere performed in duplicates with at least three repeats.
Relative expression of each target gene in all samples wasdetermined as a ratio of mRNA of target gene to mRNA ofthe housekeeping gene as described in [8].
2.3. Laser-Capture Microdissection (LCM). LCM was per-formed as in the frozen thyroid tissue samples [9] with mod-ifications. Briefly, FFPE blocks of FTC were cut into 7 μmthick sections, mounted on RNase-free membrane slides(MMI, Manchester, NH), deparaffinated with d-limonene,rehydrated with sequential washes of 100%, 95%, and 75%ethanol, and then washed in nuclease-free water. Next,slides were stained with Paradise staining solution (ArcturusEngineering Inc., Mountain View, CA), dehydrated in Xylenefor a minimum of 5 min, and air dried. Cells from areasof angioinvasion, capsular invasion, and tumor under thecapsule were dissected onto Capsure HS LCM Caps (MMI,Manchester, NH) using a Laser Capture Micro-dissectionmicroscope Nikon ECLIPSE TE 2000-S and MMI Cell Toolssoftware (MMI, Manchester, NH).
2.4. Dissected Thyroid Cancer Cell Analysis: RNA Extractionand Amplification, cDNA Synthesis, and Q-RT-PCR. RNAwas extracted from laser-captured microdissected cancercells using the Absolutely RNA FFPE kit (Stratagene, La Jolla,CA). Assessment of the integrity of cellular RNA was per-formed by Q-RT-PCR using 3′ACTB and 5′ACTB primers.Amplification of RNA from laser-captured microdissectedcells was performed using the Ambion MessageAmp II aRNAkit (Ambion, Austin, TX). We used the IVT method which isbased on the linear amplification protocol developed and val-idated previously [10, 11]. The advantage of such a techniqueis that the product of the reaction is unable to act as templateand the yield of any individual species within a mixedpopulation is for the most part determined by the templateconcentration that is not changed. Amplification was linearwhen at least 1ng of LCM RNA was used as the input for IVT.Two rounds of linear amplification of the mRNA fractionof at least 1 ng total cellular RNA were performed. First-strand cDNA synthesis yielded cDNA incorporating a T-7promoter sequence. This cDNA was converted to a double-stranded transcription template by a second-strand synthesisreaction utilizing exogenous primers that yielded double-stranded cDNA. Double-stranded cDNA was then used asa template for IVT with T7 RNA polymerase to generateamplified antisense RNA (aRNA). Integrity of aRNA sampleswas determined as described above. aRNA samples with a3′ACTB to 5′ACTB ratio of ≤20 or a 260 to 280 nm ratiobetween 1.8 and 2.2 were used for further experiments. 10–100 ng of aRNA was converted to cDNA using 1 μM targetgene-specific primers and the first-strand cDNA synthesiskit (Roche Diagnostics, Indianapolis, IN). Q-RT-PCR wasthen performed for the housekeeping gene, ACTB, andtarget genes as described above. After all the reactions wereperformed in duplicates with at least three repeats, relativeexpression of target genes was determined.
2.5. Statistical Analysis. Data were reported as mean ±standard error of the mean (SEM). Comparisons between
Journal of Thyroid Research 3
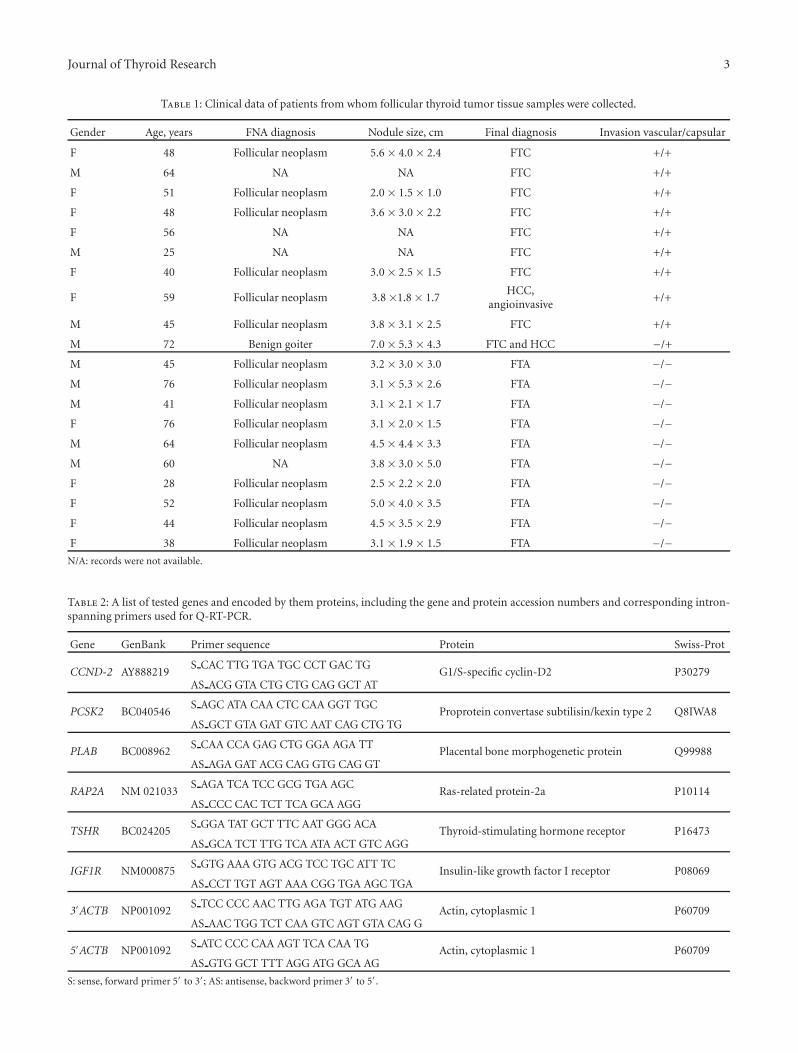
Table 1: Clinical data of patients from whom follicular thyroid tumor tissue samples were collected.
Gender Age, years FNA diagnosis Nodule size, cm Final diagnosis Invasion vascular/capsular
F 48 Follicular neoplasm 5.6 × 4.0 × 2.4 FTC +/+
M 64 NA NA FTC +/+
F 51 Follicular neoplasm 2.0 × 1.5 × 1.0 FTC +/+
F 48 Follicular neoplasm 3.6 × 3.0 × 2.2 FTC +/+
F 56 NA NA FTC +/+
M 25 NA NA FTC +/+
F 40 Follicular neoplasm 3.0 × 2.5 × 1.5 FTC +/+
F 59 Follicular neoplasm 3.8 ×1.8 × 1.7HCC,
angioinvasive+/+
M 45 Follicular neoplasm 3.8 × 3.1 × 2.5 FTC +/+
M 72 Benign goiter 7.0 × 5.3 × 4.3 FTC and HCC −/+
M 45 Follicular neoplasm 3.2 × 3.0 × 3.0 FTA −/−M 76 Follicular neoplasm 3.1 × 5.3 × 2.6 FTA −/−M 41 Follicular neoplasm 3.1 × 2.1 × 1.7 FTA −/−F 76 Follicular neoplasm 3.1 × 2.0 × 1.5 FTA −/−M 64 Follicular neoplasm 4.5 × 4.4 × 3.3 FTA −/−M 60 NA 3.8 × 3.0 × 5.0 FTA −/−F 28 Follicular neoplasm 2.5 × 2.2 × 2.0 FTA −/−F 52 Follicular neoplasm 5.0 × 4.0 × 3.5 FTA −/−F 44 Follicular neoplasm 4.5 × 3.5 × 2.9 FTA −/−F 38 Follicular neoplasm 3.1 × 1.9 × 1.5 FTA −/−
N/A: records were not available.
Table 2: A list of tested genes and encoded by them proteins, including the gene and protein accession numbers and corresponding intron-spanning primers used for Q-RT-PCR.
Gene GenBank Primer sequence Protein Swiss-Prot
CCND-2 AY888219S CAC TTG TGA TGC CCT GAC TG
G1/S-specific cyclin-D2 P30279AS ACG GTA CTG CTG CAG GCT AT
PCSK2 BC040546S AGC ATA CAA CTC CAA GGT TGC
Proprotein convertase subtilisin/kexin type 2 Q8IWA8AS GCT GTA GAT GTC AAT CAG CTG TG
PLAB BC008962S CAA CCA GAG CTG GGA AGA TT
Placental bone morphogenetic protein Q99988AS AGA GAT ACG CAG GTG CAG GT
RAP2A NM 021033S AGA TCA TCC GCG TGA AGC
Ras-related protein-2a P10114AS CCC CAC TCT TCA GCA AGG
TSHR BC024205S GGA TAT GCT TTC AAT GGG ACA
Thyroid-stimulating hormone receptor P16473AS GCA TCT TTG TCA ATA ACT GTC AGG
IGF1R NM000875S GTG AAA GTG ACG TCC TGC ATT TC
Insulin-like growth factor I receptor P08069AS CCT TGT AGT AAA CGG TGA AGC TGA
3′ACTB NP001092S TCC CCC AAC TTG AGA TGT ATG AAG
Actin, cytoplasmic 1 P60709AS AAC TGG TCT CAA GTC AGT GTA CAG G
5′ACTB NP001092S ATC CCC CAA AGT TCA CAA TG
Actin, cytoplasmic 1 P60709AS GTG GCT TTT AGG ATG GCA AG
S: sense, forward primer 5′ to 3′; AS: antisense, backword primer 3′ to 5′.
4 Journal of Thyroid Research
normal, benign, and cancer groups were made by using one-way analysis of variance (ANOVA). A value of P < .05 wasconsidered as statistically significant.
3. Results and Discussion
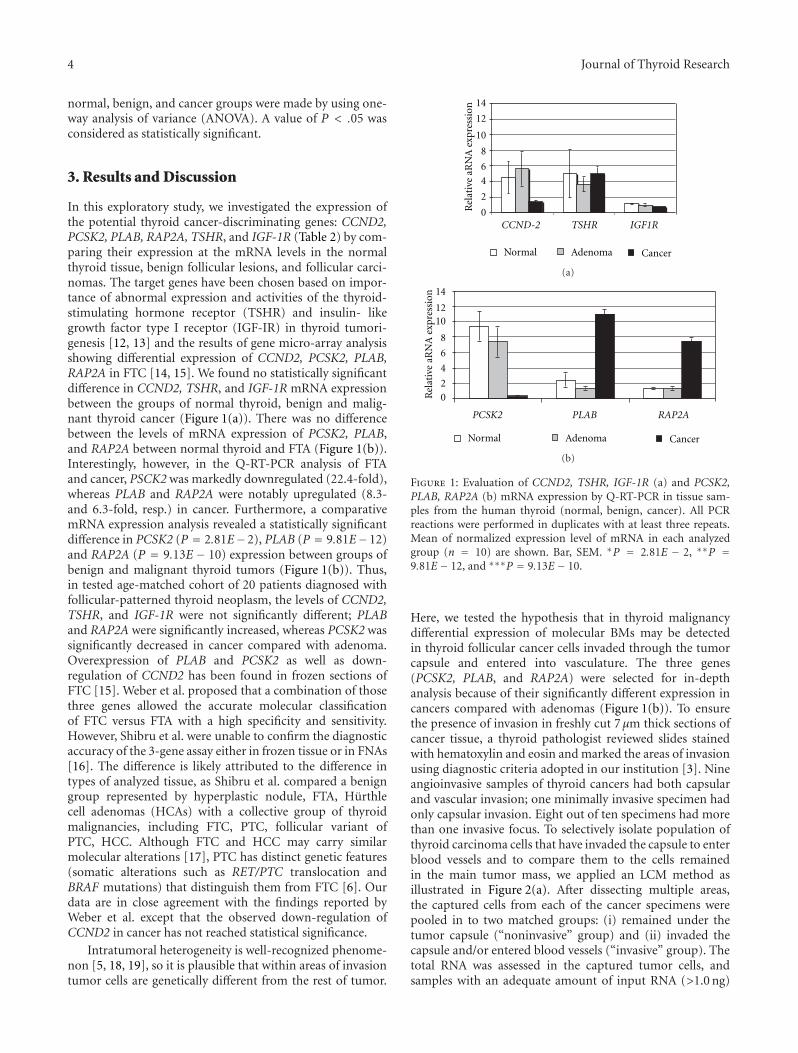
In this exploratory study, we investigated the expression ofthe potential thyroid cancer-discriminating genes: CCND2,PCSK2, PLAB, RAP2A, TSHR, and IGF-1R (Table 2) by com-paring their expression at the mRNA levels in the normalthyroid tissue, benign follicular lesions, and follicular carci-nomas. The target genes have been chosen based on impor-tance of abnormal expression and activities of the thyroid-stimulating hormone receptor (TSHR) and insulin- likegrowth factor type I receptor (IGF-IR) in thyroid tumori-genesis [12, 13] and the results of gene micro-array analysisshowing differential expression of CCND2, PCSK2, PLAB,RAP2A in FTC [14, 15]. We found no statistically significantdifference in CCND2, TSHR, and IGF-1R mRNA expressionbetween the groups of normal thyroid, benign and malig-nant thyroid cancer (Figure 1(a)). There was no differencebetween the levels of mRNA expression of PCSK2, PLAB,and RAP2A between normal thyroid and FTA (Figure 1(b)).Interestingly, however, in the Q-RT-PCR analysis of FTAand cancer, PSCK2 was markedly downregulated (22.4-fold),whereas PLAB and RAP2A were notably upregulated (8.3-and 6.3-fold, resp.) in cancer. Furthermore, a comparativemRNA expression analysis revealed a statistically significantdifference in PCSK2 (P = 2.81E−2), PLAB (P = 9.81E−12)and RAP2A (P = 9.13E − 10) expression between groups ofbenign and malignant thyroid tumors (Figure 1(b)). Thus,in tested age-matched cohort of 20 patients diagnosed withfollicular-patterned thyroid neoplasm, the levels of CCND2,TSHR, and IGF-1R were not significantly different; PLABand RAP2A were significantly increased, whereas PCSK2 wassignificantly decreased in cancer compared with adenoma.Overexpression of PLAB and PCSK2 as well as down-regulation of CCND2 has been found in frozen sections ofFTC [15]. Weber et al. proposed that a combination of thosethree genes allowed the accurate molecular classificationof FTC versus FTA with a high specificity and sensitivity.However, Shibru et al. were unable to confirm the diagnosticaccuracy of the 3-gene assay either in frozen tissue or in FNAs[16]. The difference is likely attributed to the difference intypes of analyzed tissue, as Shibru et al. compared a benigngroup represented by hyperplastic nodule, FTA, Hurthlecell adenomas (HCAs) with a collective group of thyroidmalignancies, including FTC, PTC, follicular variant ofPTC, HCC. Although FTC and HCC may carry similarmolecular alterations [17], PTC has distinct genetic features(somatic alterations such as RET/PTC translocation andBRAF mutations) that distinguish them from FTC [6]. Ourdata are in close agreement with the findings reported byWeber et al. except that the observed down-regulation ofCCND2 in cancer has not reached statistical significance.
Intratumoral heterogeneity is well-recognized phenome-non [5, 18, 19], so it is plausible that within areas of invasiontumor cells are genetically different from the rest of tumor.
0
2
4
6
8
10
12
14
CCND-2 TSHR IGF1R
Rel
ativ
eaR
NA
expr
essi
on
Normal Adenoma Cancer
(a)
02
4
6
8
1012
14
PCSK2 PLAB RAP2A
Normal Adenoma CancerR
elat
ive
aRN
Aex
pres
sion
(b)
Figure 1: Evaluation of CCND2, TSHR, IGF-1R (a) and PCSK2,PLAB, RAP2A (b) mRNA expression by Q-RT-PCR in tissue sam-ples from the human thyroid (normal, benign, cancer). All PCRreactions were performed in duplicates with at least three repeats.Mean of normalized expression level of mRNA in each analyzedgroup (n = 10) are shown. Bar, SEM. ∗P = 2.81E − 2, ∗∗P =9.81E− 12, and ∗∗∗P = 9.13E − 10.
Here, we tested the hypothesis that in thyroid malignancydifferential expression of molecular BMs may be detectedin thyroid follicular cancer cells invaded through the tumorcapsule and entered into vasculature. The three genes(PCSK2, PLAB, and RAP2A) were selected for in-depthanalysis because of their significantly different expression incancers compared with adenomas (Figure 1(b)). To ensurethe presence of invasion in freshly cut 7 μm thick sections ofcancer tissue, a thyroid pathologist reviewed slides stainedwith hematoxylin and eosin and marked the areas of invasionusing diagnostic criteria adopted in our institution [3]. Nineangioinvasive samples of thyroid cancers had both capsularand vascular invasion; one minimally invasive specimen hadonly capsular invasion. Eight out of ten specimens had morethan one invasive focus. To selectively isolate population ofthyroid carcinoma cells that have invaded the capsule to enterblood vessels and to compare them to the cells remainedin the main tumor mass, we applied an LCM method asillustrated in Figure 2(a). After dissecting multiple areas,the captured cells from each of the cancer specimens werepooled in to two matched groups: (i) remained under thetumor capsule (“noninvasive” group) and (ii) invaded thecapsule and/or entered blood vessels (“invasive” group). Thetotal RNA was assessed in the captured tumor cells, andsamples with an adequate amount of input RNA (>1.0 ng)

Journal of Thyroid Research 5
1 1
2
2
(a)
PCSK2 PLAB RAP2A
0
5
10
15
20
25
30
Cancer (noninv) Cancer (inv)
Rel
ativ
eaR
NA
expr
essi
on
(b)
Figure 2: An example of laser-capture micro-dissection in follicularthyroid carcinoma. (a) FTC tissue before (left) and after collectingthe groups of cells from the main tumor mass (inset 1) and angioin-vasive area (inset 2). Original magnification, 200x. (b) Histogram,relative expression of PCSK2, PLAB, RAP2A in the cells collectedfrom matched noninvasive and invasive areas of the same specimens(n = 4). Mean of normalized expression levels of aRNA in eachgroup is shown. Bar, SEM. ∗P = 0.039.
were subjected to two rounds of linear amplification by invitro transcription to further increase the amount of RNA.Twice-amplified aRNA of high quality only was used fora cDNA preparation and Q-RT-PCR with specific primersfor target genes. As expected from the analysis of tissuescrapes, PSCK2 expression was low in the cells from themain tumor mass; it was insignificantly different (P =0.322) in invasive cells dissected from the same specimens(Figure 2(b)). Likewise, PLAB expression was equally highin both types of dissected cells (P = 0.698). The results ofthe Q-RT-PCR analysis for RAP2A aRNA were intriguing, asthe relative level of RAP2A expression was 25.9-fold higher(P = 0.039) in the cells dissected from areas of inva-sion. RAP2A encodes Ras-related protein 2a (Rap-2a), amember of the Ras family of small GTPases (Rap1a/b andRap2a/b/c) that has been reported to induce cytoskeletonrearrangements promoting cell rounding and cell migration[20, 21]. Although activating mutations of Rap have notbeen reported, up regulation of Rap activating guaninenucleotide exchange factors [22, 23] and down regulation ofRap GTPase-activating proteins promoting Rap inactivation[24, 25] have been found in human tumors including thyroidcarcinomas [26]. High levels of expression of Rap2, but not
Rap1, have been detected in human thyroid cancer cell lines.Importantly, Rap2 protein expression was several fold higherin anaplastic than in well-differentiated papillary thyroidcancer cells [27]. Furthermore, increased Rap activity hasbeen shown to promote carcinoma cells invasion in vitroand in vivo [28, 29]. We found up regulation of humangene encoding Rap-2a in follicular thyroid cancer tissue,particularly in the regions enriched with invasive cancer cells.It could be speculated that thyroid tumor cells “require” thegenetic changes in RAP2A, in addition to PSCK2 and PLAB,to allow them to invade and/or “maintain and flourish” inthe nonnative areas of the tumor capsule and blood vessels.
4. Conclusions
We demonstrated the feasibility of combining LCM and Q-RT-PCR for analysis of gene expression in microscopic clus-ters dissected from FFPE thyroid tissue. Our study is a firstand important step in the assessment of novel molecularBMs associated with invasion of follicular thyroid carcinomacells, despite the relatively small sample size. Validation ofdiagnostic applicability of RAP2A requires a follow-up workin larger tissue sample sets.
Conflict of Interests
The authors declare that they have no competing interests.
Acknowledgments
The authors are extremely grateful to Dr. Virginia LiVolsifor reviewing clinical samples of follicular thyroid tumorsand providing critical comments on the paper. They alsothank members of the Eastern Division of the CooperativeHuman Tissue Network for providing frozen samples of thethyroid and members of the Gastrointestinal MorphologyCore at the University of Pennsylvania for sharing with usa laser-capture micro-dissection work station. Special thanksto Theresa Pasha for excellent technical support. J. R. Grau,current address: Lehigh Valley Health Network, Departmentof Pathology and Laboratory Medicine, Cedar Crest & I-78,P.O. Box 689, Allentown, Pennsylvania 18105-1556.
References
[1] L. Enewold, K. Zhu, E. Ron et al., “Rising thyroid cancerincidence in the United States by demographic and tumorcharacteristics, 1980–2005,” Cancer Epidemiology Biomarkersand Prevention, vol. 18, no. 3, pp. 784–791, 2009.
[2] C. Y. Lo, W. F. Chan, K. Y. Lam, and K. Y. Wan, “Follicularthyroid carcinoma: the role of histology and staging systemsin predicting survival,” Annals of Surgery, vol. 242, no. 5, pp.708–715, 2005.
[3] Z. W. Baloch and V. A. LiVolsi, “Our approach to follicular-patterned lesions of the thyroid,” Journal of Clinical Pathology,vol. 60, no. 3, pp. 244–250, 2007.
[4] R. L. Witt, “Initial surgical management of thyroid cancer,”Surgical Oncology Clinics of North America, vol. 17, no. 1, pp.71–91, 2008.
6 Journal of Thyroid Research
[5] J. L. Hunt, V. A. Livolsi, Z. W. Baloch et al., “A novel microdis-section and genotyping of follicular-derived thyroid tumors topredict aggressiveness,” Human Pathology, vol. 34, no. 4, pp.375–380, 2003.
[6] M. Eszlinger, K. Krohn, S. Hauptmann, H. Dralle, T. J. Gior-dano, and R. Paschke, “Perspectives for improved and moreaccurate classification of thyroid epithelial tumors,” Journalof Clinical Endocrinology and Metabolism, vol. 93, no. 9, pp.3286–3294, 2008.
[7] F. Weber, R. E. Teresi, C. E. Broelsch, A. Frilling, and C. Eng,“A limited set of human MicroRNA Is deregulated in follicularthyroid carcinoma,” Journal of Clinical Endocrinology andMetabolism, vol. 91, no. 9, pp. 3584–3591, 2006.
[8] J. Becker, P. Schmidt, F. Musshoff, M. Fitzenreiter, and B.Madea, “MOR1 receptor mRNA expression in human brainsof drug-related fatalities—a real-time PCR quantification,”Forensic Science International, vol. 140, no. 1, pp. 13–20, 2004.
[9] K. Kaserer, V. Knezevic, B. Pichlhofer et al., “Constructionof cDNA libraries from microdissected benign and malignantthyroid tissue,” Laboratory Investigation, vol. 82, no. 12, pp.1707–1714, 2002.
[10] R. N. Van Gelder, M. E. Von Zastrow, A. Yool, W. C. Dement,J. D. Barchas, and J. H. Eberwine, “Amplified RNA synthesizedfrom limited quantities of heterogeneous cDNA,” Proceedingsof the National Academy of Sciences of the United States ofAmerica, vol. 87, no. 5, pp. 1663–1667, 1990.
[11] H. Zhao, T. Hastie, M. L. Whitfield, A. L. Børresen-Dale, andS. S. Jeffrey, “Optimization and evaluation of T7 based RNAlinear amplification protocols for cDNA microarray analysis,”BMC Genomics, vol. 3, article 31, 2002.
[12] A. Ciampolillo, C. De Tullio, E. Perlino, and E. Maiorano, “TheIGF-I axis in thyroid carcinoma,” Current PharmaceuticalDesign, vol. 13, no. 7, pp. 729–735, 2007.
[13] C. Garcıa-Jimenez and P. Santisteban, “TSH signalling andcancer,” Arquivos Brasileiros de Endocrinologia e Metabologia,vol. 51, no. 5, pp. 654–671, 2007.
[14] S. Chevillard, N. Ugolin, P. Vielh et al., “Gene expression pro-filing of differentiated thyroid neoplasms: diagnostic andclinical implications,” Clinical Cancer Research, vol. 10, no. 19,pp. 6586–6597, 2004.
[15] F. Weber, L. Shen, M. A. Aldred et al., “Genetic classificationof benign and malignant thyroid follicular neoplasia based ona three-gene combination,” Journal of Clinical Endocrinologyand Metabolism, vol. 90, no. 5, pp. 2512–2521, 2005.
[16] D. Shibru, J. Hwang, E. Khanafshar, Q. Y. Duh, O. H. Clark,and E. Kebebew, “Does the 3-gene diagnostic assay accuratelydistinguish benign from malignant thyroid neoplasms?” Can-cer, vol. 113, no. 5, pp. 930–935, 2008.
[17] F. Weber, M. A. Aldred, C. D. Morrison et al., “Silencingof the maternally imprinted tumor suppressor ARHI con-tributes to follicular thyroid carcinogenesis,” Journal of ClinicalEndocrinology and Metabolism, vol. 90, no. 2, pp. 1149–1155,2005.
[18] S. Glockner, H. Buurman, W. Kleeberger, U. Lehmann, andH. Kreipe, “Marked intratumoral heterogeneity of c-myc andcyclinD1 but not of c-erbB2 amplification in breast cancer,”Laboratory Investigation, vol. 82, no. 10, pp. 1419–1426, 2002.
[19] S. M. Wiseman, T. R. Loree, W. L. Hicks et al., “Anaplasticthyroid cancer evolved from papillary carcinoma: demon-stration of anaplastic transformation by means of the inter-simple sequence repeat polymerase chain reaction,” Archivesof Otolaryngology—Head and Neck Surgery, vol. 129, no. 1, pp.96–100, 2003.
[20] S. J. McLeod, A. H. Y. Li, R. L. Lee, A. E. Burgess, and M. R.Gold, “The Rap GTPases regulate B cell migration toward thechemokine stromal cell-derived factor-1 (CXCL12): potentialrole for Rap2 in promoting B cell migration,” Journal ofImmunology, vol. 169, no. 3, pp. 1365–1371, 2002.
[21] K. Taira, M. Umikawa, K. Takei et al., “The traf2- and nck-interacting kinase as a putative effector of Rap2 to regulateactin cytoskeleton,” The Journal of Biological Chemistry, vol.279, no. 47, pp. 49488–49496, 2004.
[22] T. Hirata, H. Nagai, K. Koizumi et al., “Amplification, up-regulation and over-expression of C3G (CRK SH3 domain-binding guanine nucleotide-releasing factor) in non-small celllung cancers,” Journal of Human Genetics, vol. 49, no. 6, pp.290–295, 2004.
[23] V. Yajnik, C. Paulding, R. Sordella et al., “DOCK4, a GTPaseactivator, is disrupted during tumorigenesis,” Cell, vol. 112, no.5, pp. 673–684, 2003.
[24] D. H. Gutmann, S. Saporito-Irwin, J. E. DeClue, R. Wienecke,and A. Guha, “Alterations in the rap1 signaling pathway arecommon in human gliomas,” Oncogene, vol. 15, no. 13, pp.1611–1616, 1997.
[25] L. Zhang, L. Chenwei, R. Mahmood et al., “Identification of aputative tumor suppressor gene Rap1GAP in pancreatic can-cer,” Cancer Research, vol. 66, no. 2, pp. 898–906, 2006.
[26] A. Nellore, K. Paziana, C. Ma et al., “Loss of rap1GAP inpapillary thyroid cancer,” Journal of Clinical Endocrinology andMetabolism, vol. 94, no. 3, pp. 1026–1032, 2009.
[27] X. Dong, C. Korch, and J. L. Meinkoth, “Histone deacetylaseinhibitors upregulate Rap1GAP and inhibit Rap activity inthyroid tumor cells,” Endocrine-Related Cancer, vol. 18, no. 3,pp. 301–310, 2011.
[28] C. L. Bailey, P. Kelly, and P. J. Casey, “Activation of Rap1 pro-motes prostate cancer metastasis,” Cancer Research, vol. 69, no.12, pp. 4962–4968, 2009.
[29] M. Itoh, C. M. Nelson, C. A. Myers, and M. J. Bissell, “Rap1integrates tissue polarity, lumen formation, and tumorigenicpotential in human breast epithelial cells,” Cancer Research,vol. 67, no. 10, pp. 4759–4766, 2007.

SAGE-Hindawi Access to ResearchJournal of Thyroid ResearchVolume 2011, Article ID 832163, 5 pagesdoi:10.4061/2011/832163
Research Article
Leptin: A Correlated Peptide to Papillary Thyroid Carcinoma?
Mehdi Hedayati,1 Parichehr Yaghmaei,2 Zahra Pooyamanesh,2
Marjan Zarif Yeganeh,1 and Laleh Hoghooghi Rad1
1 Obesity Research Center, Research Institute for Endocrine Sciences, Shahid Beheshti University of Medical Sciences,1985717413 Tehran, Iran
2 Department of Biology, Faculty of Basic Sciences, Science Research Campus of Islamic Azad University, 1939614484 Tehran, Iran
Correspondence should be addressed to Mehdi Hedayati, [email protected]
Received 25 April 2011; Revised 11 July 2011; Accepted 12 August 2011
Academic Editor: Oliver Gimm
Copyright © 2011 Mehdi Hedayati et al. This is an open access article distributed under the Creative Commons AttributionLicense, which permits unrestricted use, distribution, and reproduction in any medium, provided the original work is properlycited.
Introduction. Leptin as an adipose-tissue-related peptide hormone contributes to the control of food intake, energy expenditure,and other activities such as cell proliferation. Therefore, association of leptin level with thyroid cancer has been suggested recently.Considering that thyroid cancer is the most common endocrine cancer, the aim of this study was evaluation of leptin levels inthyroid cancer. Materials and Methods. 83 patients with papillary thyroid cancer (35 males and 48 females) with 90 healthy personsas control group (40 male and 50 females) were selected. serum thyroxine, thyrotropin, and leptin levels were determined in bothgroups. As a body fat tissue affects leptin level, so height and weight were measured and body mass index was calculated too.Results. There was no statistically significant difference in age, serum Thyroxine, and Thyrotropin levels. BMI in women was morethan in men in both groups. Serum leptin levels in thyroid cancer group were significantly higher than control group (P < 0.05).Conclusion. The results of this study showed an acceptable association between the hormone Leptin levels with papillary thyroidcancer, so it may be considerad as a correlated peptide which may help in the diagnosis or confirmation of thyroid cancer besidein other specific tumor markers.
1. Introduction
leptin with 16 kDa molecular weight mainly produces bywhite adipose tissue cells [1]. So its level is proportionalto the adipose tissue mass [2]. leptin as a neuroendocrinehormone has effects on the glucose metabolism, sexualmaturation, reproduction, pituitary-adrenal axis, immunesystem, thyroid, and growth hormones level [3–6]. Theassociation between this neuroendocrine hormone withobesity and some cancers has been proposed. Probablythis hormone is an important risk factor in carcinogenesis,because obesity itself can promote tumorgenesis and is a riskfactor for cancer over time [7, 8]. On the other hand, leptinplays an important role in the oxidation reactions such asfatty acid oxidation [9] and angiogenesis [10]. There aremany reports concerning the effect of leptin on stimulationof cell mitosis and its involvement in carcinogenic stagesof breast, clone, prostate, lung, kidney, and ovary cells[11–16]. Studies have shown that leptin by increase of cell
proliferation and inhibition of apoptosis is involved increating certain types of tumors [17–19].
leptin acts through its receptor on the cell surfaceand its receptor expression also increases following theactivity of PI3K/AKT pathway and increases the activity ofantiapoptosis molecules such as Bcl-XL and XIAP [20]. Insome cancer cells, expression of leptin receptor levels andstimulation by leptin will lead to increase of cell proliferation[21]. leptin stimulates expression of some molecules suchas CyclinD1, CDK2 and c-Myc that result in cell cycleprogression and cell proliferation [21, 22].
The Important molecular pathways, such as JAK/STAT3,PI3K/AKT, ERK/MAPK, in many cancer cells can be acti-vated by leptin/leptin receptors [21–24]. Furthermore, leptinwith the induction of VEGF and VEGF-R2 moleculesexpression plays an important role in the tumorigenesis[25]. These molecules are involved in many malignanciessuch as colon, stomach, endometrial, ovarian, and breastcancer [26–30]. Additionally, increased serum levels of

2 Journal of Thyroid Research
leptin and its receptor have been associated with distantmetastases, disease recurrence, and lower survival in patientswith breast cancer [31]. Increased expression of leptin andits receptor in papillary thyroid cancer has been proved.This hormone probably through its receptor and activationof the PI3K/AKT pathway plays an important role inpapillary thyroid cancer pathogenesis. It also seems that theoncogenic effects of leptin on papillary thyroid carcinomacells are related to the stimulating cell proliferation andapoptosis inhibition. Involvement of thyroid hormones onbasal metabolism and regulating appetite and weight controlin many scientific reports is given explicitly [10, 32–34]. Themost common endocrine malignancy is thyroid cancer, andpapillary form of thyroid cancer is the most common typeof thyroid cancer (80–90%) [32]. The aim of this study wasdetermining the serum leptin levels in patients with papillarythyroid cancer and its comparison with healthy subjects.
2. Materials and Methods
2.1. Subjects
Patients. The case population consisted of 83 individuals,including 35 males and 48 females, 14 to 62 years (meanage 38.6 years) with papillary thyroid cancer (PTC). Theywere referred to Research Institute for Endocrine Sciences,Shahid Beheshti University of Medical Science. Also, 90persons were selected as control group (40 male and 50females) from referred to the laboratory with normal thyroidfunction tests (TSH: 0.3 = 3.5 mIU/L, T4: 4.5 = 12.5 μg/dL,T = Up: 25 = 35% and T3: 75 = 210 ng/mL) with age,sex, BMI matched with case group. Both groups were alsomatched for age and sex. The participants were includedin the survey after obtaining an informed consent. Also,the clinical examination was performed by endocrinologist.The diagnosis of PTC was confirmed by histopathologicdocuments. This study has been approved by InstitutionalReview Board and Ethics Committee of Obesity ResearchCenter, Research Institute for Endocrine Sciences, ShahidBeheshti University of Medical Sciences.
2.2. Methods. Blood sampling was performed in both stud-ied groups. For preparation of serum, 3 mL of whole bloodwas collected from antecubital vein in sitting position andwas incubated 10 min in RT for coagulation. Then seraseparated by 10 min centrifugation at 3000 rpm and theobtained sera were aliquoted in three 0.5 mL microtubes.The isolated serum samples from each individual were storedin 1 mL Eppendorf microtubes at −80◦C (Japan’s Sanyo CCompany).
Anthropometric characteristics, including height andweight of patients and control group, were measured byheight measuring scaled balance (Seca, German company);height with 0.5 cm and weight with 250 g sensitivity werereported. These data were used to calculate the body massindex (kg/m2). Demographic profiles, including age, and sexwere also recorded. Those individuals, who were using drugsaffecting thyroid function and obesity drugs, were excluded.
In groups thyroxine, thyrotropin, and leptin hormoneswere measured by ELISA method. The used kits wereprepared from the Canadian company (DBC Company,Ontario, Canada). The ELISA reader was from TecanAustrian Company and Sunrise Model. Human thyrotropinand leptin hormones were determined based on sandwichELISA method, whereas a thyroxin hormone was measuredaccording to the competitive EIA method. The sensitivityof thyroxine, thyrotropin, and leptin kits was 0.6 μg/dL,0.1 mU/L, and 0.4 ng/mL, respectively. Additionally, thecoefficients of variation for these assays were 6.2%, 7.1%, and6.5%, respectively.
2.2.1. Statistical Analysis. According to the normal distri-bution of data obtained by testing Kolmogorov-Smirnov(KS) (P = 0.68 for case group and P = 0.52 forcontrol group), the frequency, mean and standard deviationwere used to describe characteristics. All the data were innormal distribution (except leptin after normalization). Theindependent t-test was used to compare mean (except leptinwith geometric mean and CI 95%) of variables betweentwo groups. Comparison of qualitative data was done withChi-square test. Further, data was analyzed using statisticalsoftware (SPSS 15), and significant level was considered at0.05.
3. Results
Demographic profiles and anthropometric characteristics ofparticipants are provided in Table 1. The results of thyroidhormones test, including thyroxine and thyrotropin in bothcontrol and patients groups, are given in Table 2. Since theleptin hormone secreted from adipose tissue is different inmale and female, therefore the different levels of measuredleptin hormone in two groups are shown in Table 3 (genderbased). Height, weight, and body mass index between malesand females of both groups were significant (P < 0.05). Inaddition, a significant difference (P < 0.05) was observedbetween the leptin hormone levels in males and femalesin both healthy and cancer groups. The amount of leptinhormone in cancer patients was higher than that in normalindividuals, significantly (P < 0.05).
4. Discussion
Our data showed that the serum leptin levels of Iranianpatients with papillary thyroid carcinoma were significantlyhigher than those in control group subjects. This increasedlevel was observed in both males and females with papillarythyroid carcinoma. As this increased level was observed inboth gender and different ages, so it could be related tothyroid carcinoma and it is independent of sex and age.Even though in this study the leptin level was higher infemales than males in both groups, this is probably relatedto more adipose tissue mass in women. Both leptin andthyroid hormones cause thermogenesis and reduce bodyweight therefore maybe it is considered as a first associationbetween the two hormones. The hunger reduces the leptin

Journal of Thyroid Research 3
Table 1: Anthropometric characteristics of participants.
Group Sex Height (cm) Weight (kg) BMI (kg/m2) Mean age (year)
ControlFemale (50) 159.5 ± 12.1 61.9 ± 0.3 24.5 ± 2.3 38.1 ± 12.5
Male (40) 169.2 ± 10.5 66.3 ± 0.2 23.2 ± 2.0 37.9 ± 15.8
CaseFemale (48) 160.2 ± 11.6 63.7 ± 0.3 24.9 ± 2.7 39.1 ± 13.7
Male (35) 170.4 ± 11.3 68.4 ± 0.2 23.7 ± 2.4 37.5 ± 17.0
Table 2: Serum levels of thyroxin and thyrotropin hormones inparticipants.
Group Thyroxin (μg/dL) Thyrotropin (mU/L)
Control 9.1 ± 2.9 2.4 ± 1.2
Case 8.9 ± 3.0 2.6 ± 1.0
Table 3: Serum leptin levels in participants.
GroupFemales serumleptin level(ng/mL)
Males serum leptinlevel (ng/mL)
Control 4.3 ± 6.9 2.2 ± 5.6
Case19.6 ± 23.3(P < 0.05)
10.4 ± 17.3(P < 0.05)
and thyroid hormones levels [35]. High levels of thyroidhormones decrease leptin expression in adipose tissue. Butthe most studies have not shown significant changes in leptinlevels in hypothyroidism and hyperthyroidism disorders [36,37]. However, increased leptin level in postpartum thyroiditishas been reported [38]. Akinci et al. reported that leptinlevels increased in papillary thyroid carcinoma in Turkishpopulation [39]. But in their study only 34 cases wereinvestigated, the status of thyroid function in patients andhealthy group was not evaluated, and age-matching was notconsidered [39]. In our study, 83 persons were matched forage, sex, and BMI. Assessing thyroid function in patientsand healthy individuals was performed, and no significantdifference was observed in both groups.
In both above studies, BMI in women was higher thanin men, which was quite predictable. In both studies leptinlevels in women were higher than those in men that isbecause of increased fat mass in women. In one studyCheng et al. showed that expression of leptin and/or leptinreceptor in papillary thyroid cancer was associated withneoplasm aggressiveness, including tumor size and lymphnode metastasis [40]. Interestingly, in another study, Uddinet al. demonstrated that leptin plays an important role inpapillary thyroid cancer pathogenesis through PI3K/AKTpathway via its receptor (Ob-R) and is a potential prognosticmarker associated with an aggressive phenotype and poorsurvival [32].
One of the limitations of our study was inability tofollowup the patients after surgery. Therefore, reductionor normalization of high leptin levels in thyroid cancerpatients was not assessed. However, a significant increase ofserum leptin levels in Iranian patients with papillary thyroidcarcinoma maybe used as a reliable marker to diagnose or
confirm papillary thyroid cancer. In addition if the leptinlevels in cancer patients decrease after thyroidectomy, it willbe used for the followup treatment, possibly. So a before-after study is recommended for future investigations insteadof case control study. Thus, leptin level measurement can beused to followup the treatment of patients.
Strongly high leptin level in papillary thyroid cancerpatients in comparison with health subject potentially sug-gests leptin as a peptide marker of papillary thyroid cancer.It means that adipose tissue secreted hormones, proteins,and peptides potentially may have application in diagnosis,confirmation, and/or treatment followup.
Acknowledgments
This study was supported by a research grant from EndocrineResearch Center, Shahid Beheshti University of MedicalSciences. The authors are indebted to kind collaborationof several endocrinology specialists. They express theirgratitude to the staffs of Laboratory at Endocrine ResearchCenter, for their skillful technical assistance.
References
[1] C. Liu, X. J. Liu, G. Barry, N. Ling, R. A. Maki, and E. B.De Souza, “Expression and characterization of a putative highaffinity human soluble leptin receptor,” Endocrinology, vol.138, no. 8, pp. 3548–3554, 1997.
[2] M. Wauters, R. V. Considine, and L. F. Van Gaal, “Humanleptin: from an adipocyte hormone to an endocrine mediator,”European Journal of Endocrinology, vol. 143, no. 3, pp. 293–311, 2000.
[3] M. W. Schwartz, R. J. Seeley, L. A. Campfield, P. Burn, andD. G. Baskin, “Identification of targets of leptin action in rathypothalamus,” Journal of Clinical Investigation, vol. 98, no. 5,pp. 1101–1106, 1996.
[4] R. S. Ahlma, D. Prabakaran, C. Mantzoros et al., “Role ofleptin in the neuroendocrine response to fasting,” Nature, vol.382, no. 6588, pp. 250–252, 1996.
[5] H. F. Escobar-Morreale, F. E. Del Rey, and G. M. De Escobar,“Thyroid hormones influence serum leptin concentrations inthe rat,” Endocrinology, vol. 138, no. 10, pp. 4485–4488, 1997.
[6] M. J. M. Diekman, J. A. Romijn, E. Endert, H. Sauerwein, andW. M. Wiersinga, “Thyroid hormones modulate serum leptinlevels: observations in thyrotoxic and hypothyroid women,”Thyroid, vol. 8, no. 12, pp. 1081–1086, 1998.
[7] L. Vona-Davis and D. P. Rose, “Adipokines as endocrine,paracrine, and autocrine factors in breast cancer risk andprogression,” Endocrine-Related Cancer, vol. 14, no. 2, pp. 189–206, 2007.
4 Journal of Thyroid Research
[8] D. D. Deo, A. P. Rao, S. S. Bose et al., “Differential effects ofleptin on the invasive potential of androgen-dependent and -independent prostate carcinoma cells,” Journal of Biomedicineand Biotechnology, vol. 2008, no. 1, Article ID 163902, 2008.
[9] J. H. Pinkney, S. J. Goodrick, J. Katz et al., “Leptin and thepituitary-thyroid axis: a comparative study in lean, obese,hypothyroid and hyperthyroid subjects,” University of Bristol,Department of Medicine, Bristol Royal Infirmary, Bristol, UK.
[10] H. Y. Park, H. M. Kwon, H. J. Lim et al., “Potential roleof leptin in angiogenesis: leptin induces endothelial cellproliferation and expression of matrix metalloproteinases invivo and in vitro,” Experimental and Molecular Medicine, vol.33, no. 2, pp. 95–102, 2001.
[11] Z. Liu, T. Uesaka, H. Watanabe, and N. Kato, “High fat dietenhances colonic cell proliferation and carcinogenesis in ratsby elevating serum leptin,” International Journal of Oncology,vol. 19, no. 5, pp. 1009–1014, 2001.
[12] R. Brauner, C. Trivin, M. Zerah et al., “Diencephalic syndromedue to hypothalamic tumour: a model of the relationshipbetween weight and puberty onset,” Journal of ClinicalEndocrinology and Metabolism, vol. 91, pp. 2467–2473, 2006.
[13] T. Jaffe and B. Schwartz, “Leptin promotes motility andinvasiveness in human colon cancer cells by activating mul-tiple signal-transduction pathways,” International Journal ofCancer, vol. 123, no. 11, pp. 2543–2556, 2008.
[14] S. N. O’Brien, B. H. Welter, and T. M. Price, “Presence ofleptin in breast cell lines and breast tumors,” Biochemical andBiophysical Research Communications, vol. 259, no. 3, pp. 695–698, 1999.
[15] L. Li, Y. Gao, L. L. Zhang, and D. L. He, “Concomitantactivation of the JAK/STAT3 and ERK1/2 signaling is involvedin leptin-mediated proliferation of renal cell carcinoma Caki-2 cells,” Cancer Biology and Therapy, vol. 7, no. 11, pp. 1787–1792, 2008.
[16] R. Ribeiro, A. Araujo, C. Lopes, and R. Medeiros, “Immunoin-flammatory mechanisms in lung cancer development: is leptina mediator?” Journal of Thoracic Oncology, vol. 2, no. 2, pp.105–108, 2007.
[17] C. Garofalo and E. Surmacz, “Leptin and cancer,” Journal ofCellular Physiology, vol. 207, no. 1, pp. 12–22, 2006.
[18] M. R. Hoda, S. J. Keely, L. S. Bertelsen, W. G. Junger, D.Dharmasena, and K. E. Barrett, “Leptin acts as a mitogenic andantiapoptotic factor for colonic cancer cells,” British Journal ofSurgery, vol. 94, no. 3, pp. 346–354, 2007.
[19] O. O. Ogunwobi and I. L. P. Beales, “The anti-apoptotic andgrowth stimulatory actions of leptin in human colon cancercells involves activation of JNK mitogen activated proteinkinase, JAK2 and PI3 kinase/Akt,” International Journal ofColorectal Disease, vol. 22, no. 4, pp. 401–409, 2007.
[20] S. Uddin, R. Bu, M. Ahmed et al., “Overexpression of leptinreceptor predicts an unfavorable outcome in Middle Easternovarian cancer,” Molecular Cancer, vol. 8, p. 74, 2009.
[21] Q. L. K. Lam, S. Wang, O. K. H. Ko, P. W. Kincade, and L. Lu,“Leptin signaling maintains B-cell homeostasis via inductionof Bcl-2 and cyclin D1,” Proceedings of the National Academyof Sciences of the United States of America, vol. 107, no. 31, pp.13812–13817, 2010.
[22] M. Okumura, M. Yamamoto, H. Sakuma et al., “Leptin andhigh glucose stimulate cell proliferation in MCF-7 humanbreast cancer cells: reciprocal involvement of PKC-α and PPARexpression,” Biochimica et Biophysica Acta—Molecular CellResearch, vol. 1592, no. 2, pp. 107–116, 2002.
[23] D. L. Morris and L. Rui, “Recent advances in understandingleptin signaling and leptin resistance,” American Journal of
Physiology—Endocrinology and Metabolism, vol. 297, no. 6, pp.E1247–E1259, 2009.
[24] Y. Wang, K. K. Kuropatwinski, D. W. White et al., “Leptinreceptor action in hepatic cells,” Journal of Biological Chem-istry, vol. 272, no. 26, pp. 16216–16223, 1997.
[25] R. R. Gonzalez, S. Cherfils, M. Escobar et al., “Leptin signalingpromotes the growth of mammary tumors and increasesthe expression of vascular endothelial growth factor (VEGF)and its receptor type two (VEGF-R2),” Journal of BiologicalChemistry, vol. 281, no. 36, pp. 26320–26328, 2006.
[26] M. Koda, M. Sulkowska, L. Kanczuga-Koda, E. Surmacz, andS. Sulkowski, “Overexpression of the obesity hormone leptinin human colorectal cancer,” Journal of Clinical Pathology, vol.60, no. 8, pp. 902–906, 2007.
[27] S. J. Hong, K. W. Kwon, S. G. Kim et al., “Variation inexpression of gastric leptin according to differentiation andgrowth pattern in gastric adenocarcinoma,” Cytokine, vol. 33,no. 2, pp. 66–71, 2006.
[28] M. Koda, M. Sulkowska, A. Wincewicz et al., “Expressionof leptin, leptin receptor, and hypoxia-inducible factor 1α inhuman endometrial cancer,” Annals of the New York Academyof Sciences, vol. 1095, pp. 90–98, 2007.
[29] M. Ishikawa, J. Kitayama, and H. Nagawa, “Enhanced expres-sion of leptin and leptin receptor (OB-R) in human breastcancer,” Clinical Cancer Research, vol. 10, no. 13, pp. 4325–4331, 2004.
[30] X. Hu, S. C. Juneja, N. J. Maihle, and M. P. Cleary, “Leptin—A growth factor in normal and malignant breast cells and fornormal mammary gland development,” Journal of the NationalCancer Institute, vol. 94, no. 22, pp. 1704–1711, 2002.
[31] N. K. Saxena, D. Sharma, X. Ding et al., “Concomitantactivation of the JAK/STAT, PI3K/AKT, and ERK signalingis involved in leptin-mediated promotion of invasion andmigration of hepatocellular carcinoma cells,” Cancer Research,vol. 67, no. 6, pp. 2497–2507, 2007.
[32] S. Uddin, P. Bavi, A. K. Siraj et al., “Leptin-R and itsassociation with PI3K/AKT signaling pathway in papillarythyroid carcinoma,” Endocrine-Related Cancer, vol. 17, no. 1,pp. 191–202, 2010.
[33] R. Valcavi, M. Zini, R. Peino, F. F. Casanueva, and C. Dieguez,“Influence of thyroid status on serum immunoreactive leptinlevels,” Journal of Clinical Endocrinology and Metabolism, vol.82, no. 5, pp. 1632–1634, 1997.
[34] C. S. Mantzoros, H. N. Rosen, S. L. Greenspan, J. S. Flier,and A. C. Moses, “Short-term hyperthyroidism has no effecton leptin levels in man,” Journal of Clinical Endocrinology andMetabolism, vol. 82, no. 2, pp. 497–499, 1997.
[35] G. Legradi, C. H. Emerson, R. S. Ahima, J. S. Flier, andR. M. Lechan, “Leptin prevents fasting-induced suppressionof prothyrotropin-releasing hormone messenger ribonucleicacid in neurons of the hypothalamic paraventricular nucleus,”Endocrinology, vol. 138, no. 6, pp. 2569–2576, 1997.
[36] S. Sreenan, J. F. Caro, and S. Refetoff, “Thyroid dysfunction isnot associated with alterations in serum leptin levels,” Thyroid,vol. 7, no. 3, pp. 407–409, 1997.
[37] R. Seven, “Thyroid status and leptin in Basedow-Gravesand multinodular goiter patients,” Journal of Toxicology andEnvironmental Health—Part A, vol. 63, no. 8, pp. 575–581,2001.
[38] G. Mazziotti, A. B. Parkes, M. Lage, L. D. K. E. Premaward-hana, F. F. Casanueva, and J. H. Lazarus, “High leptin

Journal of Thyroid Research 5
levels in women developing postpartum thyroiditis,” ClinicalEndocrinology, vol. 60, no. 2, pp. 208–213, 2004.
[39] M. Akinci, F. Kosova, B. Cetin, S. Aslan, Z. Ari, and A. Cetin,“Leptin levels in thyroid cancer,” Asian Journal of Surgery, vol.32, no. 4, pp. 216–223, 2009.
[40] S.-P. Cheng, C.-W. Chi, C.-Y. Tzen et al., “Clinicopathologicsignificance of leptin and leptin receptor expressions inpapillary thyroid carcinoma,” Surgery, vol. 147, no. 6, pp. 847–853, 2010.
SAGE-Hindawi Access to ResearchJournal of Thyroid ResearchVolume 2011, Article ID 762905, 17 pagesdoi:10.4061/2011/762905
Review Article
Hypoxia-Inducible Factor in Thyroid Carcinoma
Natalie Burrows,1 Muhammad Babur,1 Julia Resch,2 Kaye J. Williams,1 and Georg Brabant2
1 Hypoxia and Therapeutics Group, School of Pharmacy and Pharmaceutical Sciences, University of Manchester, Oxford Road,Manchester M13 9PT, UK
2 Experimental and Clinical Endocrinology, Medizinische Klinik I Ratzeburger Allee 160, 23538 Lubeck, Germany
Correspondence should be addressed to Kaye J. Williams, [email protected]
Received 7 March 2011; Accepted 20 April 2011
Academic Editor: Cuong Hoang-Vu
Copyright © 2011 Natalie Burrows et al. This is an open access article distributed under the Creative Commons AttributionLicense, which permits unrestricted use, distribution, and reproduction in any medium, provided the original work is properlycited.
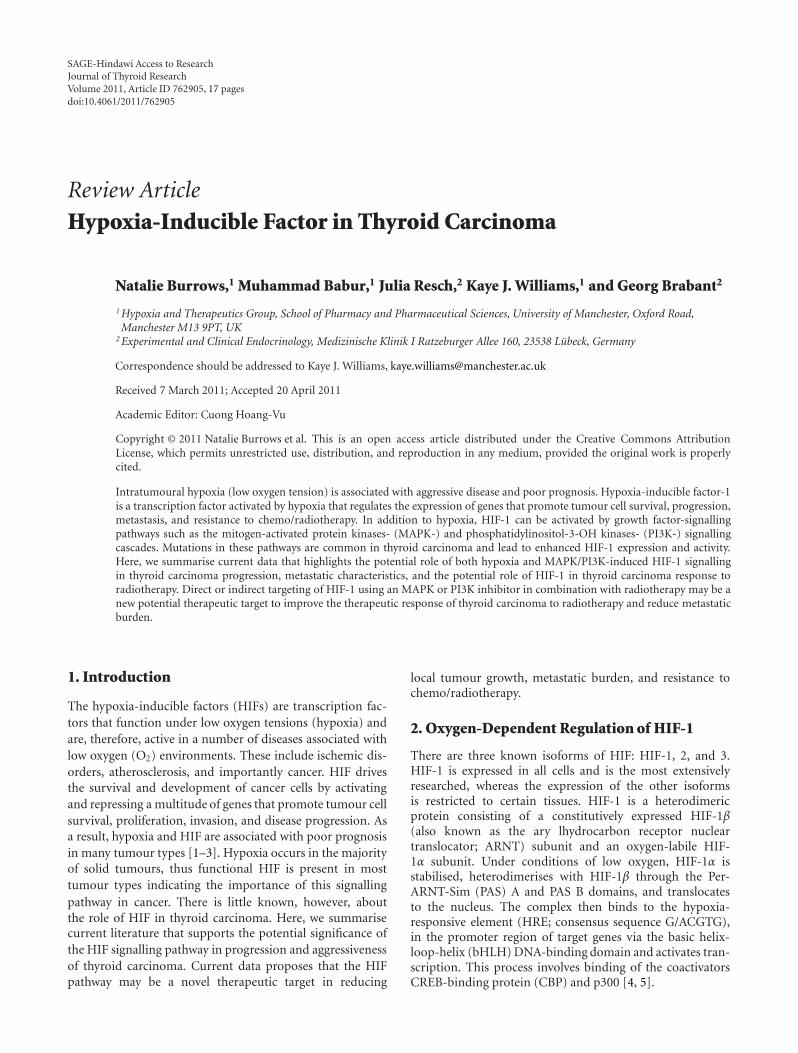
Intratumoural hypoxia (low oxygen tension) is associated with aggressive disease and poor prognosis. Hypoxia-inducible factor-1is a transcription factor activated by hypoxia that regulates the expression of genes that promote tumour cell survival, progression,metastasis, and resistance to chemo/radiotherapy. In addition to hypoxia, HIF-1 can be activated by growth factor-signallingpathways such as the mitogen-activated protein kinases- (MAPK-) and phosphatidylinositol-3-OH kinases- (PI3K-) signallingcascades. Mutations in these pathways are common in thyroid carcinoma and lead to enhanced HIF-1 expression and activity.Here, we summarise current data that highlights the potential role of both hypoxia and MAPK/PI3K-induced HIF-1 signallingin thyroid carcinoma progression, metastatic characteristics, and the potential role of HIF-1 in thyroid carcinoma response toradiotherapy. Direct or indirect targeting of HIF-1 using an MAPK or PI3K inhibitor in combination with radiotherapy may be anew potential therapeutic target to improve the therapeutic response of thyroid carcinoma to radiotherapy and reduce metastaticburden.
1. Introduction
The hypoxia-inducible factors (HIFs) are transcription fac-tors that function under low oxygen tensions (hypoxia) andare, therefore, active in a number of diseases associated withlow oxygen (O2) environments. These include ischemic dis-orders, atherosclerosis, and importantly cancer. HIF drivesthe survival and development of cancer cells by activatingand repressing a multitude of genes that promote tumour cellsurvival, proliferation, invasion, and disease progression. Asa result, hypoxia and HIF are associated with poor prognosisin many tumour types [1–3]. Hypoxia occurs in the majorityof solid tumours, thus functional HIF is present in mosttumour types indicating the importance of this signallingpathway in cancer. There is little known, however, aboutthe role of HIF in thyroid carcinoma. Here, we summarisecurrent literature that supports the potential significance ofthe HIF signalling pathway in progression and aggressivenessof thyroid carcinoma. Current data proposes that the HIFpathway may be a novel therapeutic target in reducing
local tumour growth, metastatic burden, and resistance tochemo/radiotherapy.
2. Oxygen-Dependent Regulation of HIF-1
There are three known isoforms of HIF: HIF-1, 2, and 3.HIF-1 is expressed in all cells and is the most extensivelyresearched, whereas the expression of the other isoformsis restricted to certain tissues. HIF-1 is a heterodimericprotein consisting of a constitutively expressed HIF-1β(also known as the ary lhydrocarbon receptor nucleartranslocator; ARNT) subunit and an oxygen-labile HIF-1α subunit. Under conditions of low oxygen, HIF-1α isstabilised, heterodimerises with HIF-1β through the Per-ARNT-Sim (PAS) A and PAS B domains, and translocatesto the nucleus. The complex then binds to the hypoxia-responsive element (HRE; consensus sequence G/ACGTG),in the promoter region of target genes via the basic helix-loop-helix (bHLH) DNA-binding domain and activates tran-scription. This process involves binding of the coactivatorsCREB-binding protein (CBP) and p300 [4, 5].

2 Journal of Thyroid Research
Under normoxia, HIF-1α is hydroxylated on prolineresidues 402 and/or 564 in the oxygen-dependent degrada-tion domain (ODD). This process is carried out by specificoxygen-dependent enzymes known as proline hydroxylasedomain proteins (PHDs). There are 3 PHDs: 1, 2, and 3.PHD2 is specifically involved in the hydroxylation of HIF-1α.The PHDs use O2 and 2-oxoglutarate (2-OG) as substrates.Upon hydroxylation, von Hippel-Lindau (VHL), a tumour-suppressor protein, binds HIF-1α and recruits the E3ubiquitin ligase, leading to ubiquitination and proteosomaldegradation of HIF-1α (Figure 1). Activation of asparaginylhydroxylases such as factor inhibiting HIF-1 (FIH-1) repre-sents an additional oxygen-dependent mechanism of inhi-bition of HIF-1α activity. FIH-1 hydroxylates asparagine-803 in the C-terminal transcriptional activation domain (C-TAD) of HIF-1α. This modification inhibits the interactionof C-TAD with the transcriptional co-activators CBP/p300,and thus inhibits the transcriptional activity of HIF-1(Figure 1). Under hypoxia, the level of HIF-1α hydroxylationis reduced via inhibition of the PHD2 enzyme, resulting instabilisation and accumulation of HIF-1α protein [4, 5]. Anadditional oxygen-sensitive mechanism of HIF-1 regulationis the generation of reactive oxygen species (ROS) frommitochondria. ROS inactivate PHD2 resulting in directstabilisation of HIF-1α [6].
HIF-2α is likewise regulated by oxygen-dependent hy-droxylation and dimerises with HIF-1β to form the func-tional HIF-2 complex [4, 7]. Both isoforms are similar instructure and function but have differences, particularly inthe N-TADs [8]. This suggests that both isoforms may differin the activation of target genes and the recruitment ofcoactivators. There are also fewer HIF-2α-regulated genescompared to HIF-1α. For example, in MCF-7 breast carci-noma cells, 80% of hypoxia-regulated genes were dependenton HIF-1α. A small group were dependent on HIF-2α, andthe regulation of these genes was due to the interactionof HIF-2α with the transcription factor Elk-1 [9]. Thisinteraction with Elk-1 is unique to HIF-2α.
Although HIF-1α and -2α show some overlap of targetgenes, the proteins do have distinct downstream targets. HIF-1 predominantly regulates the expression of genes encodingglycolytic proteins such as lactate dehydrogenase-A (LDH-A) and carbonic anhydrase-9 (CA-9), whereas in certaintissues expressing both HIF-1 and -2α, expression of genessuch as vascular endothelial growth factor (VEGF) anderythropoietin (EPO) is mainly regulated by HIF-2α [7,10, 11]. In support of this, high expression of HIF-2αbut not -1α has been found in well-vascularised areas ofneuroblastoma and is associated with aggressiveness [12].Although HIF-1α is accepted as the most important of theHIFs, there is increasing evidence suggesting that HIF-2αmay be of equal significance. The expression of HIF-2αis both tissue and cell-type specific, and the regulation oftarget genes differs depending on tissue type, tumour type,and coexpression with HIF-1α. A better understanding ofhow these factors lead to cell-specific differences in HIF-dependent gene regulation may help in the development ofmore effective therapeutics for diseases highly dependent on
hypoxia. The HIF-3α isoform is also hypoxia regulated ina HIF-1-dependent manner and is an inhibitor of HIF-1function [13].
3. Oxygen Independent Mechanisms ofHIF Activation
3.1. Mutations in VHL. VHL targets all the HIF-αs for rapidproteosomal degradation and, as a result, plays a central rolein molecular oxygen sensing [14]. Studies into the phenotypeof VHL knockout (KO) mice provide direct evidence forthe physiological relevance of the HIF pathway and VHL-regulated expression of HIF-1α in both normal foetal devel-opment and cancer progression. Genetic knock-out of VHLin the murine germ line results in embryonic lethality in mid-gestation due to abnormal vasculature formation thoughtto be HIF dependent [15]. In certain hereditary cancerssuch as clear cell renal carcinomas, Chuvash polycythemia,pheochromocytoma of the central nervous system or heman-gioblastoma of the retina, normoxic degradation of HIFare impaired due to mutations in VHL. These tumours areusually well vascularised, a characteristic largely attributed toderegulated HIF-1α signalling [16, 17].
3.2. Metabolic Signalling Pathways. Metabolic signallingpathways such as the tricarboxylic acid (TCA) cycle are alsonecessary for normal regulation of HIF-1α. In addition toO2, PHDs require the substrates 2-OG and ascorbic acidas a cofactor, to catalyze hydroxylation of HIF-1α. Thisreaction produces succinate and CO2 as byproducts. 2-OGis a metabolite of the TCA cycle. As 2-OG is required forthe functionality of PHDs, activity of the TCA cycle regu-lates PHD activity and thus HIF-1α stability. Furthermore,inactivating mutations in enzymes of the TCA cycle leadsto direct stabilisation of HIF-1α protein [18, 19]. Mutationsin fumarate hydratase (FH) and succinate dehydrogenase(SDH) lead to accumulation of fumarate and succinate. Bothfumarate and succinate inhibit PHDs by competing with2-OG for binding to the active site [20, 21]. Inactivatingmutations in SDH have been found in a range of cancersassociated with enhanced HIF-1 and VEGF signalling.These include renal cell carcinomas, gastrointestinal stromal(GIST) tumours, and Carney’s syndrome [22, 23].
3.3. Growth Factor Signalling Pathways. For thyroid can-cer the most important mutational changes occur inthe MAPK/Ras—extracellular signal-regulated kinase (ERK)and the PI3K/AKT signalling cascades [24]. These pathwaysare dominant regulators of many cellular processes includinggrowth, metabolism, cell survival, and angiogenesis andare important in the coordinated interaction of cells withthe microenvironment [25, 26]. Both the MAPK and PI3Ksignalling pathways increase HIF-1 signalling in many cancertypes including thyroid [27–30].
3.4. HIF-1 and the MAPK Pathway. A number of MAPK(p38 and p38γ) and ERK1/2 (p42 and p44) isoforms havebeen found to regulate HIF-1α activity in a cell-specificmanner. MAPK signalling enhances the transactivation of

Journal of Thyroid Research 3
bHLH PAS A PAS B ODD N-TAD C-TAD
N
P402 P562 H803
PHD2
OHOHOH
2-OG + O2
Succinate+ CO2 Succinate
C
+ CO2
FIH-1
2-OG + O2
VHL
CBP/P300
NORMOXIA
Proteosomal degradation
HIF-1α
↑O2
Figure 1: Structure of HIF-1α and the oxygen-dependent regulation of HIF-1α protein stabilisation and activation: The N-terminal regionscontain the basic helix-loop-helix (bHLH) domain involved in DNA-binding and the Per-Arnt-Sim (PAS) A and B domains required forheterodimerisation with HIF-1β. The oxygen-dependent degradation domain (ODD) is where PHD2 hydroxylates proline residues P402 andP562, which enables binding of VHL and proteosomal degradation. The terminal transcriptional activation domains (TADs) are responsiblefor transactivation of target genes. The N-TAD is located towards the N-terminus, with the C-TAD located at the extreme C-terminus. Factorinhibiting HIF-1 (FIH-1) hydroxylates asparagine H803 in the C-TAD, preventing the binding of coactivators CBP/p300, thus inhibitingactivation of HIF-1α. Both hydroxylation processes use 2-oxoglutarate (2-OG) and O2 as substrates and produce succinate and carbondioxide (CO2) as byproducts.
HIF-1α by phosphorylation of HIF-1α co-activators and bydirect phosphorylation of HIF-1α itself. MAPK stimulationleads to the phosphorylation of p300. This phosphorylationfacilitates binding of p300/CBP to the C-TAD and promotesthe transactivation activity of both p300/CBP and HIF-1α.Studies suggest that MAPK does not phosphorylate FIH,and therefore, this signalling cascade is not involved in theoxygen-dependent regulation of HIF-1α [31]. Thus, eventhough MAPK signalling does not depend on sensing oxygentension, activation of this signalling cascade augments theHIF response.
Studies have shown that MAPK can directly phos-phorylate the TADs of HIF-1α. Sang et al. found thatMAPK signalling leads to indirect phosphorylation of C-TAD constructs by MAPK and direct phosphorylation of N-TAD constructs, when expressed in Escherichia coli. However,this direct phosphorylation of the TADs was not necessaryfor binding of p300 and activation of HIF-1 [31]. Otherstudies suggest that direct phosphorylation of HIF-1α byMAPKs has functional consequences on HIF-1 activity. InHeLa and CCL39 cells, p42/44 MAPK (but not p38 MAPKand JNK) increased the transcriptional activity of HIF-1by phosphorylation of HIF-1α and not by increasing thelevel of HIF-1α protein. This was blocked by the MEKinhibitor PD098059 [32]. Conversely, in Hep3B and HEK293cells, activation of the small GTPase Rac1 by hypoxia leadsto Rac1-dependent p38 MAPK signalling resulting in bothenhanced phosphorylation of the N-TAD and transcrip-tional activity of HIF-1α [33, 34]. Another study, however,has shown that Rac1 reduces HIF-1 activity by activating
NAPDH oxidases resulting in enhanced generation of ROSleading to reduced HIF-1 in both normoxia and hypoxia[35]. The effect of Rac1 on MAPK signalling was notshown in this study. Furthermore, the latter group used8% O2 for hypoxia, whereas the first study used 5 and 1%O2 for hypoxia. These functional differences observed byRac1 may, therefore, be dependent upon O2 concentration.Furthermore, different cell lines were used in these studiessuggesting that these differences in Rac1 signalling may bedependent on the activating mutation status of the MAPKpathway in different cell lines. Studies in HeLa cells havealso shown that direct phosphorylation of HIF-1α by p42/44MAPKs not only leads to enhanced HIF-1 transcriptionalactivity, but also promotes nuclear accumulation of HIF-1α[36]. Thus, depending on the cell type, the MAPK signallingcascade can enhance HIF-1 activity via activation of selectivekinases which either directly phosphorylate HIF-1α or co-activators of HIF-1α (Figure 2).
In addition to MAPK signalling leading to enhancedactivity of HIF-1, studies have also shown that the MAPKpathway may increase HIF-1α protein synthesis in certaincancer types. Fukuda et al. showed that MAPK signallingcan increase HIF-1α protein synthesis in HCT116 coloncarcinoma cells. Inhibitors of MAPK blocked HIF-1α pro-tein synthesis, and the overexpression of a constitutivelyactive MAPK kinase (MEK2) induced HIF-1α protein [37](Figure 2).
Genetic mutations in the v-raf murine sarcoma viraloncogene homolog B1 (BRAF) gene, which encodes a serine-threonine kinase, result in hyperactive MAPK signalling.

4 Journal of Thyroid Research
BRAFV600E is the most common genetic mutation withinpapillary thyroid carcinomas (PTCs). On average, approx-imately 50% of all PTCs harbour the BRAFV600E mutation[38]. This BRAF mutant is constitutively active and phos-phorylates MEK1/2 leading to hyperactive MAPK signalling(Figure 2). It is thought that BRAF and, thus, MAPKsignalling are important in the early stages of thyroid tumourdevelopment and predispose cells to become dedifferentiatedtumours [39–41]. This has recently been substantiated in amouse model of a thyroid-specific knock-in of oncogenicBRAF (LSL-BRAFV600E/TPO-Cre), which leads to a highfrequency of invasive PTCs. These mice had high levels ofthyroid stimulating hormone that acted cooperatively withoncogenic BRAF to drive tumour initiation [42].
The GTPase V-Ki-ras2 Kirsten rat sarcoma viral onco-gene homolog (KRAS) is one of three members of the RASfamily of GTPases. KRAS interacts with and activates a num-ber of effector proteins including BRAF and PI3K. Geneticmutations in RAS leading to constitutive activity results inhyperactivation of the PI3K/MAPK pathways, promotingtumour progression in many cancer types including thyroid[43]. Recently, it has been shown that mutations in KRASor BRAF differentially regulate HIF-1α and HIF-2α in coloncarcinoma cells. Mutant KRAS enhanced expression of HIF-1α only, whereas mutant BRAF enhanced expression of bothHIF-1α and -2α. KRAS-induced HIF-1α was dependent onPI3K activation, whereas only HIF-2α was inhibited by theMEK inhibitor PD089059 in BRAF mutant cells [44]. Thesedata highlight the complexity of HIF induction by oncogenicsignalling cascades and may contribute to the phenotypicdifferences observed not only in colon cancer but othercancers harbouring these mutations such as thyroid.
The interplay and activation of MAPK by additionalsignalling pathways promotes HIF-1 activity. In colon cancercells, loss of the tumour suppressor SMAD4 (mothers againstdecapentaplegic (MAD) and the Caenorhabditis elegansprotein SMA-4) led to enhanced HIF-1α activity through theactivation of MEK-ERK and p38 MAPK by Transforminggrowth factor-β (TGF-β) [45].
Stimulation of the MAPK cascade enhances HIF-1signalling mainly by increasing the transcriptional activityof HIF-1α. This will lead to increased expression of HIF-1downstream targets under normoxic conditions and in thepresence of hypoxia will lead to a cooperative enhancementof expression of HIF-1 target genes.
3.5. HIF-1 and the PI3K Pathway. Aberrant activation ofthe PI3K pathway occurs by (a) hyperactive stimulation ofreceptor tyrosine kinases (RTKs) including the insulin-likegrowth factor-1 receptor (IGF-IR), the human epidermalgrowth factor receptor 2 (HER2neuR), and the epidermalgrowth factor receptor (EGFR) and (b) by mutational eventsthat occur in negative regulators of PI3K signalling such asthose in Phosphatase and tensin homolog (PTEN) and p53.Activation of the PI3K pathway is pivotal in the developmentand progression of thyroid cancer aggressiveness and appearsto be predominantly involved in the metastatic behaviourof these tumours [41]. Hyperactive PI3K signalling leads
to stabilisation of HIF-1α in normoxia. This depends onthe activation of AKT and subsequently mammalian targetof rapamycin (mTOR), which increases the translation andactivity of HIF-1α [37, 41, 46, 47].
mTOR is a serine/threonine kinase consisting of mul-tiple protein-binding motifs that enable interaction andphosphorylation of many proteins and is considered acentral signalling molecule for convergence and crosstalkbetween multiple pathways. mTOR phosphorylates andactivates the translational machinery proteins: eukaryotictranslation initiation factor 4E- (eIF-4E-) binding protein(4E-BP1) and p70 S6 kinase. Upon phosphorylation, 4E-BP1 no longer interacts with and represses eIF-4E, and p70S6
phosphorylates and activates the 40 S ribosomal protein.Activation of both eIF-4E and the 40 S ribosomal proteininitiates translation of HIF-1α mRNA (Figure 3) [48, 49].
Stimulation of PI3K signalling by activation of differentRTKs in a variety of cancer types induces protein synthesisof HIF-1α. This has been shown in colon and breastcancer cells via activation of IGF-1R and HER2nueR byIGF-1 and heregulin, respectively, [37, 50]. Stimulation ofPI3K/AKT/mTOR induces the activation of the transla-tional machinery proteins and protein synthesis of HIF-1α. HER2neu is an indicator for poor prognosis in breastcancer and tumours overexpressing HER2 have increasedangiogenesis due to increased expression of the HIF-1 targetgene VEGF. Similarly, overexpression of HIF-1α and VEGFhas been found in prostate cancer cells that have hyperactivePI3K/AKT/mTOR activity as a result of enhanced EGFRsignalling [51].
Depending on the type of RTK that is activated andon the type of cancer, increased HIF-1α protein may bePI3K dependent even in the presence of activated MAPKsignalling or may be dependent on both signalling pathways.Oestrogen-dependent tumours usually display hyperactive,PI3K, HIF-1α, and VEGF signalling. Studies on the effect ofoestrogen induced HIF-1α and VEGF in rat uterine tissuehave shown that although oestrogen receptor signallingstimulates both the PI3K and MAPK signalling cascades,induction of HIF-1α and VEGF was only dependent uponPI3K signalling [52]. However, in HCT116 colon cancer cells,IGF-1 induced HIF-1α protein synthesis involved both thePI3K and MAPK signaling pathways [37]. Enhanced activityof HIF-1 by growth factor receptor signalling pathways isboth receptor and cell specific and highlights the complexityof HIF-1 regulation by these signalling cascades.
Loss of negative regulators of the PI3K pathway includingPTEN, p53 and the tumour-suppressor proteins tuberoussclerosis proteins TSC1 (hamartin), TSC2 (tuberin), andpromyelocytic leukemia (PML) leads to hyperactive PI3K-signalling. PTEN is a phosphatase that dephosphorylatesthe PI3K products, and thus inhibits PI3K downstreamsignalling. Loss of PTEN or loss of function of PTEN hasbeen found in a range of cancers including prostate, glioma,and thyroid [53–55]. Loss of PTEN has been associatedwith enhanced angiogenesis and cancer progression possiblythrough PI3K-induced HIF-1α and downstream targetsincluding VEGF. Loss of function or deletion of the tumoursuppressor p53 is common in many cancer types including

Journal of Thyroid Research 5
(p42/44)
p70S6K
HIF-1α protein synthesis
eIF-4E
HIF-1α transcriptionalactivity
4E-BP1
RTKs
VEGFCA-9
GLUT-1
MAPK
p300/CBP
Rac1BRAFKRAS HypoxiaMEK1/2
ERK1/2
(p38/3γ)
Figure 2: Regulation of HIF-1α by the MAPK pathway. Stimulation of receptor tyrosine kinases (RTKs) by growth factors, or activatingmutations in the RAS family of GTPases, such as KRAS, results in activation of a range of MAPK-signalling proteins. Activation of ERK1/2by MEK1/2 increases HIF-1 signalling (a) by phosphorylating and promoting the interaction of the coactivator p300 with HIF-1α and(b) by phosphorylating and activating the translational regulatory protein p70S6K and by phosphorylating and disrupting the repressiveinteraction of 4E-BP1 with eIF-4E. Activation of these translational machinery proteins leads to increased protein synthesis of HIF-1α.Activation of MAPKs (p38/p38γ) leads to the direct phosphorylation and activation of HIF-1α. Additionally, under hypoxia, activation ofthe small GTPase Rac1 leads to a Rac1 dependent increase in HIF-1α activity via Rac-1 induced activation of p38 MAPK. Genetic mutationsin members of the MAPK signalling pathway such as those in BRAF (BRAFV600E) lead to hyperactive MEK/ERK signalling and enhancedHIF-1α activity.
thyroid. p53 negatively regulates the PI3K pathway byinhibiting transcription of the PIK3CA gene that encodesthe catalytic subunit of PI3K; p110α and by activatingtranscription of PTEN and TSC2 [56, 57]. Furthermore, p53can directly interact with HIF-1α and recruit MDM2, whichtargets HIF-1α for ubiquitination and degradation [28, 58].mTOR activity is negatively regulated by the heterodimerTSC1 (hamartin) and TSC2 (tuberin). This complex isdisrupted and functionally inactivated by AKT leading toenhanced activity of mTOR and upregulation of HIF-1α.This has recently been confirmed in irradiated tumourswhere HIF-1α is activated through this pathway [59]. HIF-1α is not only stimulated through PI3K/AKT activationof mTOR via loss of the TSC1/2 complex, but also viamutational changes leading to loss of TCS2 function. Sub-sequently, HIF-1α downstream targets including VEGF andGlucose transporter-1(GLUT-1) are increased [60]. Hypoxiainhibits mTOR activity in both a HIF-dependent andindependent manner [61]. Under hypoxia, PML negativelyregulates mTOR by directly interacting with and preventingactivation of mTOR by the small GTPase Rheb1. Loss of PMLis observed in a number of sporadic tumours and correlateswith increased VEGF and HIF-1α expression via attenuationof hypoxic mTOR inhibition [62]. Characteristically, patientswith mTOR-associated hamartoma and tumours harbouringmutations in TSC2 and PML are highly vascularised, a com-mon phenotype of tumours arising from mutations in VHL,which have hyperactive HIF-1 and VEGF signalling [60, 62].
Collectively, these tumour types highlight the importance ofHIF-1 in tumour angiogenesis and progression.
Studies in human embryonic kidney cells suggest thatmTOR may directly phosphorylate HIF-1α, promoting bind-ing of p300/CBP and enhancing HIF-1α activity. mTORinteracts with the scaffold protein raptor (regulatory-associated protein of mTOR). Raptor directly interacts withHIF-1α under conditions favouring stabilisation of HIF-1α,that is, hypoxia, resulting in enhanced activity, which was notdue to mTOR induced stabilisation of HIF-1α protein [63].
The pathophysiology behind increased HIF-1α in manysolid tumours is not only restricted to hypoxia, growthfactor signalling cascades, or mutations in components ofthe oxygen-dependent regulatory mechanism of HIF-1, butalso may be mediated by other signalling pathways. A hyper-active Wnt/β-catenin signalling cascade may similarly resultin increased activity of HIF-1 due to the interaction ofβ-catenin with HIF-1α [64, 65]. Collectively, these datahighlight that many pathways are involved in the fine tuningof HIF-1α regulation by oncogenic signalling cascades suchas the ERK-MAPK and PI3K/AKT pathways.
4. The Role of HIF in Cancer
The majority of solid tumours encounter hypoxic stress asa result of (a) limited oxygen diffusion due to the rapidproliferation of tumour cells which outgrow the existingvascular network and (b) by perfusion deficits mediated by

6 Journal of Thyroid Research
RTKs
KRAS PI3K
AKT
mTOR
p70S6K
HIF-1α protein synthesis
PTEN
eIF-4E
HIF-1α transcriptionalactivity
4E-BP1
TSC1/TSC2PML
Raptor p53
VEGFCA-9
GLUT-1
Figure 3: Regulation of HIF-1α by the PI3K pathway. Stimulation of receptor tyrosine kinases (RTKs) by growth factors or activatingmutations in the RAS family of GTPases, such as KRAS, results in activation of PI3K. Activated PI3K enables the phosphorylation andactivation of AKT. AKT in turn activates mammalian mTOR by disrupting the inhibitory interaction of the TSC1/TSC2 complex withmTOR. mTOR enhances HIF-1 signalling in a multimechanistic way (a) By activating the translational machinery proteins p70S6K and EIF-4E leading to enhanced protein synthesis of HIF-1α and (b) By promoting the interaction of HIF-1α with the coactivator p300, possiblyby direct phosphorylation of HIF-1α via interaction with the scaffold protein raptor. Additionally, deletion or loss of function of negativeregulators of the PI3K pathway leads to enhanced signalling and activation of HIF-1. These include PTEN, p53, PML, and TSC1/2. Thephosphatase PTEN dephosphorylates the products of PI3K, inhibiting activation of AKT and subsequent downstream targets. p53 inhibitsPI3K signalling at multiple levels; p53 inhibits transcription of the catalytic subunit of PI3K (p110α), enhances transcription of PTEN andTSC2, interacts with HIF-1α, and recruits MDM2, targeting HIF-1α for proteosomal degradation. PML inhibits mTOR under hypoxia andTSC1/2 interacts with and prevents activation of mTOR in the absence of PI3K activation.
abnormal blood vessel structure and function within thetumour [3, 66, 67]. Exposure to low oxygen tensions resultsin enhanced expression and activity of HIF-1α leading toincreased tumour cell survival and growth under stressfulenvironments. Over one hundred HIF target genes havebeen identified. HIF promotes tumour cell survival andprogression by regulating multiple genes including thoseinvolved in angiogenesis (VEGF), anaerobic metabolism(GLUT-1), control of intracellular pH (CA-9), regulation ofcell cycle, DNA damage response, proliferation and apoptosis(p21 and p27) and extracellular matrix remodelling and cellmigration (lysyl oxidase (LOX), and matrix-metalloprotease-1 and -9 (MMP-1 and -9)) [68–71].
Clinically, hypoxia and HIF-1 has been associated withpoor prognosis in a range of cancers including uterine,breast, and nonsmall cell lung cancer as well as poortreatment response in cancers such as nasopharyngealcancer [1–3, 72]. Additionally, coexpression of HIF-1αwith other pro-oncogenic proteins has been shown to bea significant prognostic predictor of survival. In patientswith nonsmall cell lung cancer, coexpression of HIF-1αwith Snail or TWIST1 has been shown to reduce overallsurvival and recurrence-free survival [73]. Expression ofHIF-2α and coexpression with EGFR and insulin-like growthfactor-binding protein-2 (IGFBP-2) has also been linked
to reduced survival in patients with higher grade astrocy-tomas [74].
The HIFs act as the most important sensors of oxygenhomeostasis. Constant HIF activation is a common featurein many cancers and is becoming increasingly recognized asa target for therapeutic intervention.
5. HIF and Chemo/Radiotherapy
5.1. HIF and Chemoresistance. HIF-1α has been found toupregulate expression of the ATP-binding cassette (ABC)transporter family of proteins and multidrug resistancerelated proteins (MRPs) in certain tumours and cancer celllines. The ABC-transporter proteins can efflux chemother-apeutic agents out of the cell, namely, taxanes or anthracy-clines resulting in reduced cytotoxicity and cell death [75–77].
The HIF-1 downstream target VEGF has also been impli-cated in chemoresistance. Blockade of VEGF signalling canpromote normalisation of the tumour vasculature resultingin enhanced delivery of chemotherapeutics into the tumour.This has been observed in anaplastic thyroid carcinomaxenografts, where bevacizumab (inhibitory monoclonal anti-body against VEGF) lowered tumour interstitial pressure andreduced vascular permeability [78]. Due to enhanced VEGF
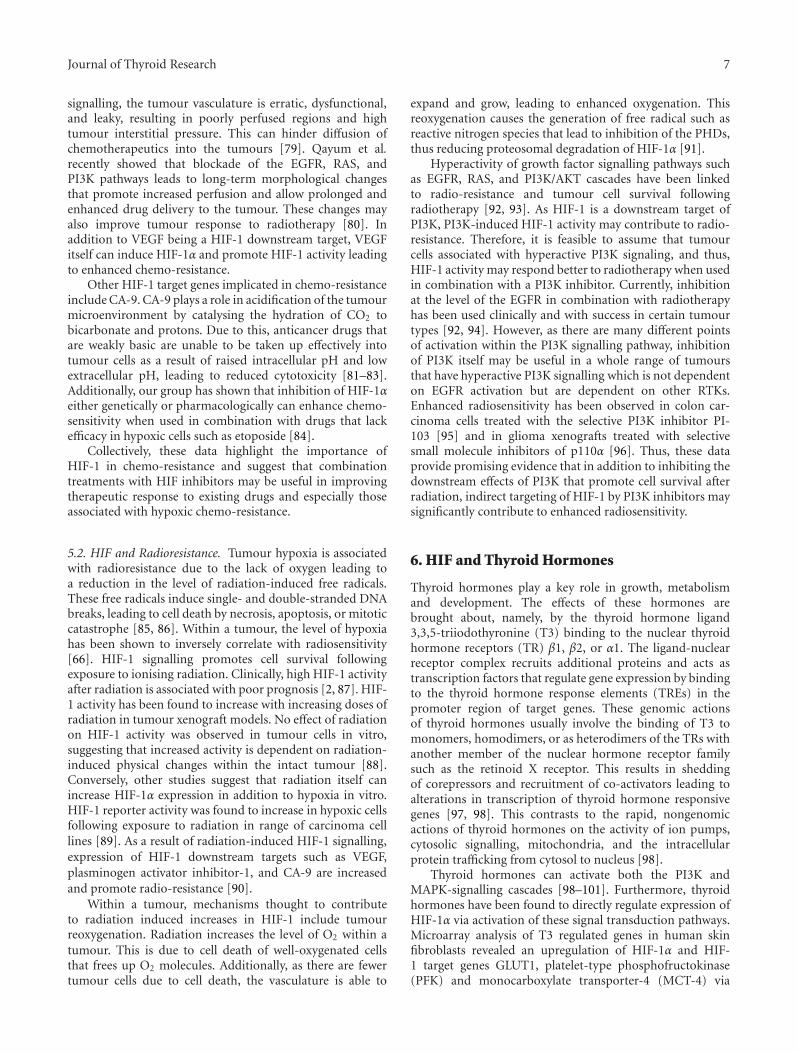
Journal of Thyroid Research 7
signalling, the tumour vasculature is erratic, dysfunctional,and leaky, resulting in poorly perfused regions and hightumour interstitial pressure. This can hinder diffusion ofchemotherapeutics into the tumours [79]. Qayum et al.recently showed that blockade of the EGFR, RAS, andPI3K pathways leads to long-term morphological changesthat promote increased perfusion and allow prolonged andenhanced drug delivery to the tumour. These changes mayalso improve tumour response to radiotherapy [80]. Inaddition to VEGF being a HIF-1 downstream target, VEGFitself can induce HIF-1α and promote HIF-1 activity leadingto enhanced chemo-resistance.
Other HIF-1 target genes implicated in chemo-resistanceinclude CA-9. CA-9 plays a role in acidification of the tumourmicroenvironment by catalysing the hydration of CO2 tobicarbonate and protons. Due to this, anticancer drugs thatare weakly basic are unable to be taken up effectively intotumour cells as a result of raised intracellular pH and lowextracellular pH, leading to reduced cytotoxicity [81–83].Additionally, our group has shown that inhibition of HIF-1αeither genetically or pharmacologically can enhance chemo-sensitivity when used in combination with drugs that lackefficacy in hypoxic cells such as etoposide [84].
Collectively, these data highlight the importance ofHIF-1 in chemo-resistance and suggest that combinationtreatments with HIF inhibitors may be useful in improvingtherapeutic response to existing drugs and especially thoseassociated with hypoxic chemo-resistance.
5.2. HIF and Radioresistance. Tumour hypoxia is associatedwith radioresistance due to the lack of oxygen leading toa reduction in the level of radiation-induced free radicals.These free radicals induce single- and double-stranded DNAbreaks, leading to cell death by necrosis, apoptosis, or mitoticcatastrophe [85, 86]. Within a tumour, the level of hypoxiahas been shown to inversely correlate with radiosensitivity[66]. HIF-1 signalling promotes cell survival followingexposure to ionising radiation. Clinically, high HIF-1 activityafter radiation is associated with poor prognosis [2, 87]. HIF-1 activity has been found to increase with increasing doses ofradiation in tumour xenograft models. No effect of radiationon HIF-1 activity was observed in tumour cells in vitro,suggesting that increased activity is dependent on radiation-induced physical changes within the intact tumour [88].Conversely, other studies suggest that radiation itself canincrease HIF-1α expression in addition to hypoxia in vitro.HIF-1 reporter activity was found to increase in hypoxic cellsfollowing exposure to radiation in range of carcinoma celllines [89]. As a result of radiation-induced HIF-1 signalling,expression of HIF-1 downstream targets such as VEGF,plasminogen activator inhibitor-1, and CA-9 are increasedand promote radio-resistance [90].
Within a tumour, mechanisms thought to contributeto radiation induced increases in HIF-1 include tumourreoxygenation. Radiation increases the level of O2 within atumour. This is due to cell death of well-oxygenated cellsthat frees up O2 molecules. Additionally, as there are fewertumour cells due to cell death, the vasculature is able to
expand and grow, leading to enhanced oxygenation. Thisreoxygenation causes the generation of free radical such asreactive nitrogen species that lead to inhibition of the PHDs,thus reducing proteosomal degradation of HIF-1α [91].
Hyperactivity of growth factor signalling pathways suchas EGFR, RAS, and PI3K/AKT cascades have been linkedto radio-resistance and tumour cell survival followingradiotherapy [92, 93]. As HIF-1 is a downstream target ofPI3K, PI3K-induced HIF-1 activity may contribute to radio-resistance. Therefore, it is feasible to assume that tumourcells associated with hyperactive PI3K signaling, and thus,HIF-1 activity may respond better to radiotherapy when usedin combination with a PI3K inhibitor. Currently, inhibitionat the level of the EGFR in combination with radiotherapyhas been used clinically and with success in certain tumourtypes [92, 94]. However, as there are many different pointsof activation within the PI3K signalling pathway, inhibitionof PI3K itself may be useful in a whole range of tumoursthat have hyperactive PI3K signalling which is not dependenton EGFR activation but are dependent on other RTKs.Enhanced radiosensitivity has been observed in colon car-cinoma cells treated with the selective PI3K inhibitor PI-103 [95] and in glioma xenografts treated with selectivesmall molecule inhibitors of p110α [96]. Thus, these dataprovide promising evidence that in addition to inhibiting thedownstream effects of PI3K that promote cell survival afterradiation, indirect targeting of HIF-1 by PI3K inhibitors maysignificantly contribute to enhanced radiosensitivity.
6. HIF and Thyroid Hormones
Thyroid hormones play a key role in growth, metabolismand development. The effects of these hormones arebrought about, namely, by the thyroid hormone ligand3,3,5-triiodothyronine (T3) binding to the nuclear thyroidhormone receptors (TR) β1, β2, or α1. The ligand-nuclearreceptor complex recruits additional proteins and acts astranscription factors that regulate gene expression by bindingto the thyroid hormone response elements (TREs) in thepromoter region of target genes. These genomic actionsof thyroid hormones usually involve the binding of T3 tomonomers, homodimers, or as heterodimers of the TRs withanother member of the nuclear hormone receptor familysuch as the retinoid X receptor. This results in sheddingof corepressors and recruitment of co-activators leading toalterations in transcription of thyroid hormone responsivegenes [97, 98]. This contrasts to the rapid, nongenomicactions of thyroid hormones on the activity of ion pumps,cytosolic signalling, mitochondria, and the intracellularprotein trafficking from cytosol to nucleus [98].
Thyroid hormones can activate both the PI3K andMAPK-signalling cascades [98–101]. Furthermore, thyroidhormones have been found to directly regulate expression ofHIF-1α via activation of these signal transduction pathways.Microarray analysis of T3 regulated genes in human skinfibroblasts revealed an upregulation of HIF-1α and HIF-1 target genes GLUT1, platelet-type phosphofructokinase(PFK) and monocarboxylate transporter-4 (MCT-4) via

8 Journal of Thyroid Research
T3/TRβ signalling. The specificity of this upregulation byT3 was confirmed in fibroblasts from patients with aninactivating mutation in TRβ. These fibroblasts did not showany such changes in gene expression of HIF-1α and targetgenes [99]. The direct upregulation of HIF-1α by T3 resultedin a T3 indirect increase of GLUT-1, PFK, and MCT-4expression via enhanced HIF-1α activity. This direct increasein HIF-1α activity was due to T3/TRβ activation of PI3K(Figure 4). Other studies have also shown that a TRβ mutant(TRβPV/PV) interacts with the PI3K-regulatory subunit p85αleading to enhanced PI3K signalling, promoting thyroidcarcinogenesis in a mouse model of spontaneous follicularthyroid cancer (thyroid hormone receptorPV/PV mice) [100].This may lead to enhanced HIF-1α signalling in vivo.
T3 can also increase HIF-1α expression through inter-action with the TRα members. In endothelial cells, T3promotes the interaction of TRα1 with the PI3K subunitp85α, leading to increased phosphorylation and activation ofAKT and endothelial nitric oxide synthase (eNOS). This isthought to contribute to the vasodilatory and cardiovascularprotective effects of thyroid hormones [101]. It is likely thatthis T3-induced PI3K activity in endothelial cells wouldenhance HIF-1α activity, which may contribute to the vascu-lar effects of thyroid hormone, as eNOS is a HIF-1 regulatedgene [102]. In glioma cells, stimulation of PI3K/AKT by T3induces shuttling of TRα from the cytoplasm to the nucleus,and promotes transcription of HIF-1α mRNA (Figure 4).This T3-dependent process was inhibited by treatment withthe PI3K inhibitor LY294002 but not by the ERK inhibitorPD098095 [98]. T3-induced expression of HIF1-α and thedownstream target VEGF has been verified in a gastriccancer cell line and in vivo mouse model. Accumulationof HIF-1α was due to T3 dependent activation of thePI3K signalling cascade. Interestingly, in addition to PI3K-signalling, HIF-1α overexpression by T3 may be regulated byfumarate accumulation; this accumulation was enhanced byT3-mediated inactivation of fumarate hydratase and reducedin the presence of 2-oxoglutarate [103] (Figure 4). These datalink thyroid hormones with metabolic proteins and the HIF-1 signalling pathway in carcinogenesis and provide a meansfor understanding the adaptive mechanisms of tumour cellsto metabolic stress.
Interestingly, T4 but not T3 has been found to impact onHIF-1α expression via interaction with the TRβ1 in glioblas-toma (U-87) cells. This process was dependent on MAPK(ERK1/2) signalling as PD098095 inhibited T4-induced HIF-1α expression [98]. In CV-1 cells transfected with TRβ1,T4-activated MAPK signalling led to the interaction ofMAPK with TRβ1 and enhanced phosphorylation and TRβ1signalling [104]. Other studies have shown that both T3and T4 can promote HIF-1α activity by activating the PI3Kpathway. In hepatoma cells, T3 and to a lesser extent T4increased expression of the HIF-1 target genes EPO andadrenomedullin (ADM), by stimulating the PI3K pathway,thus leading to increased translation of HIF-1α mRNA. Noeffects on HIF-1α protein stability/proteosomal degradationwere observed [105].
In addition to the rapid nongenomic induction of HIF-1α by thyroid hormones via activation of growth factor
signalling cascades, thyroid hormones have been shown toinduce HIF-1α via the classic genomic actions of TRs. T3 canindirectly increase HIF-1α mRNA in a range of carcinomacell lines that express hepatic leukemia factor (HLF). Thisregulation appears to be independent of a major proteinkinase pathway, as the inhibition of members of both theMAPK and PI3K kinase pathways, including mTOR, had noeffect on T3-mediated HIF-1α expression. T3 induction ofHIF-1α was dependent on HLF-mediated gene expression ofHIF-1α. This stimulation of HLF was in turn mediated byT3-activation of the TRβ-retinoid X receptor α heterodimer.Increased HIF-1α was, therefore, solely at the mRNA leveland independent of translation [106] (Figure 4).
A close link between thyroid hormones and HIF isfurther substantiated by data on the activity of deiodinasetype 3 (DIO3). Hypoxia induces DIO3, the physiologicalinactivator of T3, which catalyses the conversion of T3 tothe metabolically inactive T2 (Figure 4). As this effect wasalso mimicked by hypoxia mimetics such as cobalt chloride,a direct action of HIF-1 was suspected. HIF-1α directlyinteracts with the DIO3 promoter, and thus stimulates DIO3activity. This, in turn, induces a reduction of T3-dependentactivation of metabolic pathways and represents a protectivemechanism to reduce metabolic rate in tissues subjected tohypoxia [107].
The effect of T3 and T4 on HIF-1α is both receptorand cell specific. Furthermore, interaction of these hormoneswith additional signalling cascades provides insight into theimportance of thyroid hormones in driving carcinogenesisby upregulating prosurvival pathways and those involvedin the adaptation to the stressful conditions of the tumourmicroenvironment. An understanding of how these hor-mones and their receptors differentially regulate HIF-1α inboth normal tissue and cancer may help identify the mostappropriate drug treatment to improve therapeutic response.
7. HIF and Thyroid Cancer
7.1. Clinical Significance of HIF-1 and Thyroid Carcinomas.Recently we expanded on the potential pathophysiologicalimportance of HIF-1α in thyroid carcinomas by showingthat HIF-1α protein was variably expressed in primarythyroid carcinomas associated with advancing tumour grade.Tumour samples were representative of papillary (PTC),follicular (FTC), and anaplastic (ATC) thyroid carcinomas[26]. HIF-1α expression was absent from normal thyroidtissue. Interestingly and consistent with previous findings ina range of cancers, HIF-1α expression was highest in the mostaggressive dedifferentiated anaplastic thyroid carcinomas(ATCs). However, analysis of vessel number and distributionvia Von Willebrand factor (vWF) immunostaining wereunable to link HIF-1α expression and vessel distribution.This may have been expected due to the short half-life ofHIF-1α and transient regions of hypoxia that occur as aresult of the erratic and dysfunctional vasculature, HIF-1αexpression may not always be detected. Similarly to HIF-1α, highest expression of GLUT-1 was observed in ATCs andcell lines derived from ATCs, with lower expression observed
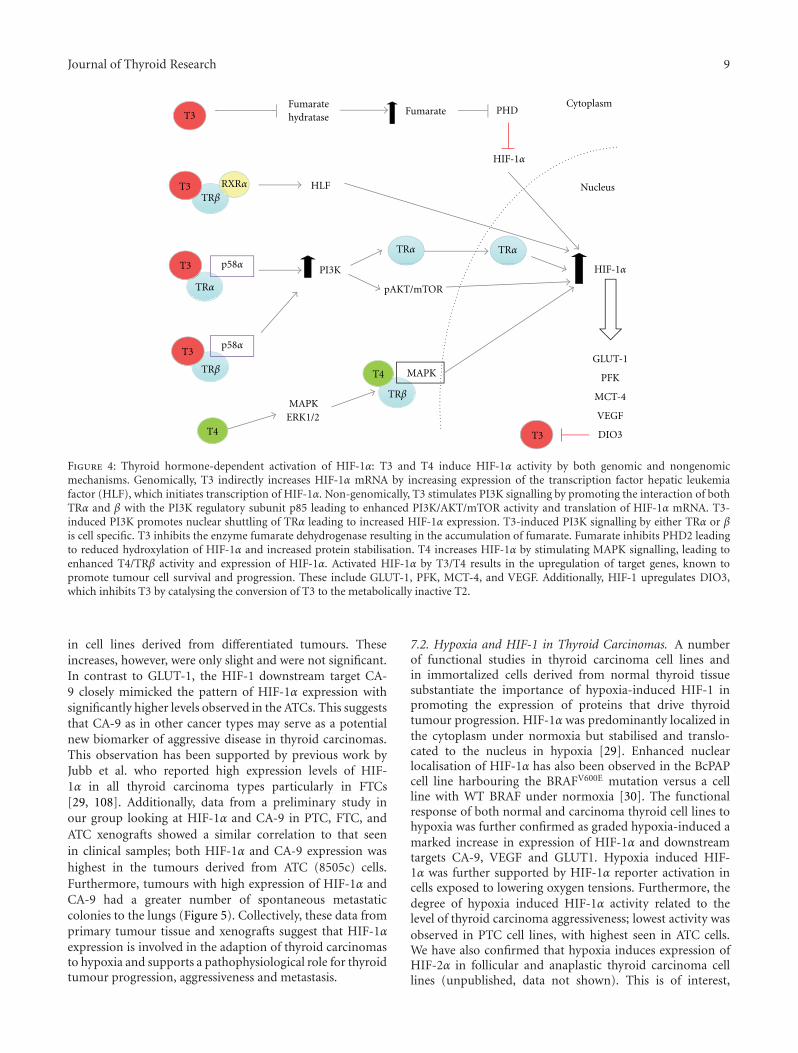
Journal of Thyroid Research 9
T3
T3
T3
T3
T3
RXRαTRβ
TRβ
TRβ
p58α
p58α
TRα
TRαTRα
T4
T4
FumarateFumarate
hydratase
HLF
PI3K
MAPK
MAPK
pAKT/mTOR
PHD
HIF-1α
HIF-1α
Cytoplasm
Nucleus
GLUT-1
PFK
MCT-4
VEGF
DIO3
ERK1/2
Figure 4: Thyroid hormone-dependent activation of HIF-1α: T3 and T4 induce HIF-1α activity by both genomic and nongenomicmechanisms. Genomically, T3 indirectly increases HIF-1α mRNA by increasing expression of the transcription factor hepatic leukemiafactor (HLF), which initiates transcription of HIF-1α. Non-genomically, T3 stimulates PI3K signalling by promoting the interaction of bothTRα and β with the PI3K regulatory subunit p85 leading to enhanced PI3K/AKT/mTOR activity and translation of HIF-1α mRNA. T3-induced PI3K promotes nuclear shuttling of TRα leading to increased HIF-1α expression. T3-induced PI3K signalling by either TRα or βis cell specific. T3 inhibits the enzyme fumarate dehydrogenase resulting in the accumulation of fumarate. Fumarate inhibits PHD2 leadingto reduced hydroxylation of HIF-1α and increased protein stabilisation. T4 increases HIF-1α by stimulating MAPK signalling, leading toenhanced T4/TRβ activity and expression of HIF-1α. Activated HIF-1α by T3/T4 results in the upregulation of target genes, known topromote tumour cell survival and progression. These include GLUT-1, PFK, MCT-4, and VEGF. Additionally, HIF-1 upregulates DIO3,which inhibits T3 by catalysing the conversion of T3 to the metabolically inactive T2.
in cell lines derived from differentiated tumours. Theseincreases, however, were only slight and were not significant.In contrast to GLUT-1, the HIF-1 downstream target CA-9 closely mimicked the pattern of HIF-1α expression withsignificantly higher levels observed in the ATCs. This suggeststhat CA-9 as in other cancer types may serve as a potentialnew biomarker of aggressive disease in thyroid carcinomas.This observation has been supported by previous work byJubb et al. who reported high expression levels of HIF-1α in all thyroid carcinoma types particularly in FTCs[29, 108]. Additionally, data from a preliminary study inour group looking at HIF-1α and CA-9 in PTC, FTC, andATC xenografts showed a similar correlation to that seenin clinical samples; both HIF-1α and CA-9 expression washighest in the tumours derived from ATC (8505c) cells.Furthermore, tumours with high expression of HIF-1α andCA-9 had a greater number of spontaneous metastaticcolonies to the lungs (Figure 5). Collectively, these data fromprimary tumour tissue and xenografts suggest that HIF-1αexpression is involved in the adaption of thyroid carcinomasto hypoxia and supports a pathophysiological role for thyroidtumour progression, aggressiveness and metastasis.
7.2. Hypoxia and HIF-1 in Thyroid Carcinomas. A numberof functional studies in thyroid carcinoma cell lines andin immortalized cells derived from normal thyroid tissuesubstantiate the importance of hypoxia-induced HIF-1 inpromoting the expression of proteins that drive thyroidtumour progression. HIF-1α was predominantly localized inthe cytoplasm under normoxia but stabilised and translo-cated to the nucleus in hypoxia [29]. Enhanced nuclearlocalisation of HIF-1α has also been observed in the BcPAPcell line harbouring the BRAFV600E mutation versus a cellline with WT BRAF under normoxia [30]. The functionalresponse of both normal and carcinoma thyroid cell lines tohypoxia was further confirmed as graded hypoxia-induced amarked increase in expression of HIF-1α and downstreamtargets CA-9, VEGF and GLUT1. Hypoxia induced HIF-1α was further supported by HIF-1α reporter activation incells exposed to lowering oxygen tensions. Furthermore, thedegree of hypoxia induced HIF-1α activity related to thelevel of thyroid carcinoma aggressiveness; lowest activity wasobserved in PTC cell lines, with highest seen in ATC cells.We have also confirmed that hypoxia induces expression ofHIF-2α in follicular and anaplastic thyroid carcinoma celllines (unpublished, data not shown). This is of interest,

10 Journal of Thyroid Research
Tumour type:
HIF-1α
BcPAP (PTC) FTC133 (FTC) WRO (FTC) 8505c (ATC)
(a)
Tota
lsco
re
BcPAP FTC133 WRO 8505c
HIF-1α expression CA-9 expression
4
5
6
7
8
Tumour
BcPAP FTC133 WRO 8505c
Tumour
0
1
2
3
4
5
6P < .05
(b)
0
40
80
120
160
200
Met
asta
tic
colo
nie
s/m
glu
ng
BcPAPFTC133WRO 8505c
Tumour
(c)
Figure 5: HIF-1α and CA-9 protein expression and metastatic potential are highest in tumours derived from follicular (WRO) and anaplastic(8505c) cell lines. Briefly, BcPAP, FTC133, WRO and 8505c cells were implanted sub-cutaneously in female CBA nu/nu nude mice. Oncetumours reached 450 mm3, tumour tissue and fresh lung tissue were excised. Tumour sections were immuno-stained for HIF-1α. Freshlyexcised lung tissue was enzymatically digested, plated out in serial dilution and left until visible colonies formed. Colonies were stained,counted and number of metastatic colonies per mg lung tissue calculated. (For full methods, see supplementary materials and methods whichis located at doi: 10.406/2011/762905). (a) Immunohistochemical staining for HIF-1α (brown staining). One example of HIF-1α stainingfor each tumour type: BcPAP, FTC133, WRO and 8505c are displayed. (b) Semiquantitative analysis of HIF-1α and CA-9 immunostainingquantified according to Allred et al. [109]. The total score is representative of intensity and proportion of staining. HIF-1α was highlyexpressed in all tumour types with highest expression observed in the 8505c tumours. CA-9 was also expressed in all tumour types withsignificantly higher expression observed in 8505c tumours (P < .05, one way Anova, with Tukey post test). (c) The number of spontaneousmetastatic colonies cultured from enzymatically digested lung tissue that was excised from mice bearing WRO, 8505c, FTC133, and BcPAPtumours. The highest number of colonies counted were from the lungs of mice bearing FTC (WRO) and ATC (8505c) tumours. Data arerepresentative of the mean ± S.D. of 5 independent mice for each tumour type.
as the HIFs are known to regulate genes differentially inmany different cancer types. Therefore, expression in thyroidcarcinoma may account for some of the phenotypic differ-ences seen between the different classifications of thyroidcarcinoma.
7.3. Growth-Factor Signalling Pathways and HIF-1 in ThyroidCarcinomas. We found that in addition to hypoxia, growthfactor-signalling pathways also induced HIF-1α expressionand activity in thyroid carcinoma cell lines. Induction ofHIF-1α by pathways such as the MAPK and PI3K signalling
cascades have been described in a range of cancer types(see oxygen-independent regulation of HIF) [110]. Themajority of thyroid carcinomas have mutations in growthfactor signalling pathways. Mutations in the BRAF gene(BRAFV600E) leading to hyperactive MAPK/ERK signallinghave been found in approximately 50% of all PTCs [38].Recently, this mutation has been reported to increase thetranscription and expression of HIF-1α protein [30].
KRAS has been found to differentially regulate HIFsin certain cancer types [44]. Activating mutations in theRAS family of GTPases, such as those found in KRAS,
Journal of Thyroid Research 11
HIF-1α
Tumour aggressiveness Cell migration/spreading/metastasis
PI3K pathway MAPK pathwayHypoxia
In thyroid cancer
Radiosensitivity
Figure 6: Mechanisms of induction of HIF-1α and downstream effects of HIF-1 signalling in thyroid carcinomas. HIF-1 activity is inducednot only by hypoxia but by the oncogenic MAPK and PI3K signalling pathways. Clinically, expression of HIF-1α and the downstream targetCA-9 have been linked with thyroid carcinoma aggressiveness. It is well known that HIF-1 plays an important role in tumour development,metastasis, and aggressiveness and is ultimately correlated with poor prognosis. Enhanced HIF-1 signalling by hypoxia and the PI3K/MAPKpathways may play an important role in the metastatic characteristics of thyroid carcinoma. HIF-1-induced MET upregulation has beenimplicated in promoting invasiveness of PTC. HIF-1 signalling may also play a prominent role in the therapeutic response to radiotherapyin thyroid carcinoma.
have been found in approximately 20% of PTCs and morespecifically the follicular variant of PTC suggesting themutation promotes aggressive phenotype [43]. As KRASactivates both BRAF and PI3K, it would be interesting todetermine the role of KRAS in the context of HIF activityand aggressive phenotype in thyroid tumours and thyroidcarcinoma cell lines harbouring this mutation.
Studies have shown that highest levels of HIF-1α expres-sion and activity were detected in thyroid tumours andtumour cell lines harbouring classic mutations in BRAFand PI3K [29, 30]. Thus, the current data supports theimportance of oncogenic activation of HIF-1 in thyroidcancer and aggressive disease [46]. Direct intervention withpharmacological inhibitors of these pathways (LY294002 forPI3K, PD098059 for ERK/MAPK, and sorafenib for inhibi-tion of RAF-1 kinase/BRAF) or by genetic modulation; (re-expression of PTEN in PTEN null cell lines and silencing ofmutant BRAF), further support the close dependency of HIFexpression on oncogenic signalling. Interestingly, inhibitionof HIF-1α reporter activity was much more substantial asa consequence of LY294002 treatment under varying O2
tensions compared to PD98059 even in cell lines with noknown mutation in the PI3K pathway. These findings areparticularly interesting with regard to the frequent mutationsin the PI3K/AKT pathway found in up to 15% of PTCand approximately 50% of FTC [111, 112], where PI3K-pathway mutations have been directly linked to tumouraggressiveness [41]. HIF-1α silencing reduced expression ofHIF-1 target genes like CA-9. Thus, blocking HIF-1α, eitherdirectly or through inhibition of the PI3K pathway in thyroidcarcinomas, may decrease aggressiveness and thus open newtherapeutic options [46].
7.4. HIF and VEGF in Thyroid Carcinomas. VEGF serumlevels are elevated in thyroid carcinomas, and this is asso-ciated with poor tumour prognosis [113–116]. As one ofthe most important downstream targets of HIF-1 signalling,VEGF has not yet been linked clinically to HIF activity inthyroid carcinomas. A number of studies using antagonistsof VEGF signalling for the treatment of advanced thyroidcarcinomas have been reported with some positive results([117–120]. However, no data are currently available onthe effect on VEGF levels by direct targeting of HIF-1. Wehave reported that VEGF levels are significantly increasedby anoxia in thyroid carcinoma cells lines derived fromPTC, FTC and ATC. Additionally, highest basal levels ofVEGF were observed in the PTEN—null FTC133 follicularthyroid carcinoma cell lines [29]. This suggests that thetwo different signalling pathways may act synergisticallyto increase VEGF. The anoxia-induced increases in VEGFexpression did not, however, match the pattern of HIF-1αreporter activity in varying thyroid carcinoma cell lines. Thissuggests that the level of dependency on either the HIF-1 or growth factor-signalling pathways to induce VEGF isspecific to the type of thyroid carcinoma cell line. Currentunpublished data from our group supports a prominentrole and an important link between the PI3K and HIF-1 pathways in the regulation of VEGF. Furthermore, wehave found that inhibition of these pathways has profoundeffects on VEGF expression in thyroid carcinoma cell lines.These data provide a new angle for therapeutic approachesof thyroid carcinoma as drugs which target HIF-1 signallingmay be more efficacious in downregulating VEGF dependentsignalling in these tumours.

12 Journal of Thyroid Research
7.5. HIF-1, Migration, and Metastasis in Thyroid Carcinomas.Hypoxia and HIF-1 have been associated with increasedmigration and metastasis in a range of cancer types [121–123]. We have found that hypoxia significantly increasedmigration in cell lines derived from PTCs and FTCs. Addi-tionally, we have exciting data that supports a prominent roleof PI3K and HIF-1 signalling in metastatic characteristics ofFTC and ATC (unpublished).
Studies have shown a link between hypoxia/HIF-1α andMNNG HOS transforming gene (MET) upregulation inclinical PTCs. MET is a receptor tyrosine kinase that isstimulated by hepatocyte growth factor (HGF). Stimulationresults in the activation of signal transduction pathways suchas PI3K, which promote migration, invasion, and the releaseof cytokines and proangiogenic factors such as VEGF [124,125]. Additionally, MET activation promotes migration andinvasion by stimulating the translocation of β-catenin fromthe cytoplasm to the nucleus [126]. MET is highly expressedin PTC, and this high expression of MET is thought to be dueto HIF-1 induced upregulation in hypoxic regions of PTCs.Furthermore, higher expression of MET and HIF-1α mRNAwas found at the periphery of tumours (in cells located atthe invading front) compared to the centre in 44% of PTCs[127]. These were characterised to have a more aggressivephenotype. Collectively, these data suggest that HIF-1 mayplay a role in promoting migration and aggressiveness inPTC.
Taken together, these data highlight the importanceof hypoxia, HIF-1α and PI3K signalling as a means ofpromoting metastatic characteristics and driving aggressivedisease in thyroid carcinomas (Figure 6).
8. HIF-1 and Sensitivity to Radiotherapyin Thyroid Carcinomas
There is increasing evidence for the role of HIF in tumourcell sensitivity to chemo- and importantly radiotherapy [77,84, 128]. As discussed above, HIF-1 stabilisation and actiondepend on growth factor-signalling pathways. Thus, manyinhibitors of growth factor signalling affect HIF-1 expressionand downstream targets. Anticancer drugs that target thesepathways possess antiangiogenic properties and includethe BCR-ABL kinase inhibitor imatinib (Gleevec), EGFRinhibitors such as gefitinib, erlotinib, and cetuximab, theHER2neu inhibitor trastuzumab, and the mTOR inhibitorsrapamycin, temsirolimus, and everolimus. Collectively, thesedrugs all target the translation of HIF-1α mRNA intoprotein [129]. Modulation of HIF-1α expression can increasetumour sensitivity, in particular to radiotherapy in certaincancer types (see HIF and radio-resistance). Thus, HIF-1signalling may be a particularly important feature for thesensitivity of dedifferentiated thyroid carcinomas to externalbeam radiation. This has yet to be investigated.
It has been shown that tumour cell apoptosis is increasedwhen targeted radioiodide therapy is combined with angio-genic inhibitors, which represents an indirect approach tocircumvent HIF-1—dependent radio-resistance [130]. Datadiscussed here support the view that targeting of HIF-1 may
serve as a more direct approach to overcome HIF depen-dent adaptation of thyroid carcinoma cells to radiotherapy.Preliminary data from our group in FTC and ATC cell linessupports this notion of HIF-1 signalling playing a role inradio-resistance (unpublished). As described earlier, PI3Khas been found to play an important role in HIF-1α inducedexpression and activity in thyroid carcinoma cell lines underboth normoxia and anoxia. Therefore, targeting HIF-1 eitherdirectly or by use of a PI3K-inhibitor may improve thetherapeutic response of thyroid carcinoma to radiotherapy.
Currently, there is no data available on whether inhi-bition of HIF-1 may reflect on the sensitivity of moredifferentiated tumours to standard radiotherapy. It is con-ceivable that in patients receiving external beam radiationtreatment and particularly in patients with a poor responsebut positive uptake of radioiodine, any augmentation of thesensitivity towards irradiation-induced apoptosis would befavourable (Figure 6). Studies in our group on animal modelsof metastatic follicular and anaplastic thyroid carcinomaswill hopefully allow us to answers some of these questionsin the future.
9. Conclusions
HIF-1 is potently induced by both hypoxia and oncogenicsignalling pathways in thyroid carcinoma, and its expressionand activity have been correlated with aggressiveness. Cur-rent literature suggests that PI3K and MAPK pathways pro-mote aggressive and metastatic disease in part via the upreg-ulation of HIF-1 activity. With the known effects of hypoxia,PI3K/MAPK pathways, and HIF-1 on desensitisation toradiotherapy, HIF-1 may be a new and important therapeutictarget in reducing local tumour growth, metastatic burden,and radio-resistance in thyroid carcinoma.
Financial Support
Cancer Research UK (K. J. Williams C7820/A8696; sup-porting N. Burrows) EU FP7 Metoxia Grant agreement no.222741 (K. J. Williams supporting M. Babur), and WellcomeTrust project grant, UK 082794 (G. Brabant, supporting J.Resch).
Acknowledgment
K. J. Williams and G. Brabant contributed equally to thework.
References
[1] P. Birner, M. Schindl, A. Obermair, G. Breitenecker, and G.Oberhuber, “Expression of hypoxia-inducible factor 1alphain epithelial ovarian tumors: its impact on prognosis and onresponse to chemotherapy,” Clinical Cancer Research, vol. 7,no. 6, pp. 1661–1668, 2001.
[2] D. M. Aebersold, P. Burri, K. T. Beer et al., “Expressionof hypoxia-inducible factor-1alpha: a novel predictive andprognostic parameter in the radiotherapy of oropharyngealcancer,” Cancer Research, vol. 61, no. 7, pp. 2911–2916, 2001.
Journal of Thyroid Research 13
[3] M. Hockel and P. Vaupel, “Tumor hypoxia: definitions andcurrent clinical, biologic, and molecular aspects,” Journal ofthe National Cancer Institute, vol. 93, no. 4, pp. 266–276,2001.
[4] M. C. Brahimi-Horn and J. Pouyssegur, “Harnessing thehypoxia-inducible factor in cancer and ischemic disease,”Biochemical Pharmacology, vol. 73, no. 3, pp. 450–457, 2007.
[5] K. Hirota and G. L. Semenza, “Regulation of hypoxia-inducible factor 1 by prolyl and asparaginyl hydroxylases,”Biochemical and Biophysical Research Communications, vol.338, no. 1, pp. 610–616, 2005.
[6] J. Pouyssegur and F. Mechta-Grigoriou, “Redox regulation ofthe hypoxia-inducible factor,” Biological Chemistry, vol. 387,no. 10-11, pp. 1337–1346, 2006.
[7] S. A. Patel and M. C. Simon, “Biology of hypoxia-induciblefactor-2α in development and disease,” Cell Death & Differ-entiation, vol. 15, no. 4, pp. 628–634, 2008.
[8] A. Loboda, A. Jozkowicz, and J. Dulak, “HIF-1 and HIF-2transcription factors—similar but not identical,” Molecules &Cells, vol. 29, no. 5, pp. 435–442, 2010.
[9] O. Aprelikova, M. Wood, S. Tackett, G. V. R. Chandramouli,and J. C. Barrett, “Role of ETS transcription factors inthe hypoxia-inducible factor-2 target gene selection,” CancerResearch, vol. 66, no. 11, pp. 5641–5647, 2006.
[10] C. J. Hu, LI. Y. Wang, L. A. Chodosh, B. Keith, and M. C.Simon, “Differential roles of hypoxia-inducible factor 1alpha(HIF-1alpha) and HIF-2alpha in hypoxic gene regulation,”Molecular and Cellular Biology, vol. 23, no. 24, pp. 9361–9374,2003.
[11] C. Warnecke, Z. Zaborowska, J. Kurreck et al., “Differ-entiating the functional role of hypoxia-inducible factor(HIF)-1alpha and HIF-2alpha (EPAS-1) by the use of RNAinterference: erythropoietin is a HIF-2alpha target gene inHep3B and Kelly cells,” The FASEB Journal, vol. 18, no. 12,pp. 1462–1464, 2004.
[12] L. Holmquist-Mengelbier, E. Fredlund, T. Lofstedt et al.,“Recruitment of HIF-1alpha and HIF-2alpha to commontarget genes is differentially regulated in neuroblastoma: HIF-2alpha promotes an aggressive phenotype,” Cancer Cell, vol.10, no. 5, pp. 413–423, 2006.
[13] T. Tanaka, M. Wiesener, W. Bernhardt, K. U. Eckardt, andC. Warnecke, “The human HIF (hypoxia-inducible factor)-3alpha gene is a HIF-1 target gene and may modulate hypoxicgene induction,” Biochemical Journal, vol. 424, no. 1, pp. 143–151, 2009.
[14] P. H. Maxwell, M. S. Wlesener, G. W. Chang et al., “Thetumour suppressor protein VHL targets hypoxia-induciblefactors for oxygen-dependent proteolysis,” Nature, vol. 399,no. 6733, pp. 271–275, 1999.
[15] J. R. Gnarra, J. M. Ward, F. D. Porter et al., “Defectiveplacental vasculogenesis causes embryonic lethality in VHL-deficient mice,” Proceedings of the National Academy ofSciences of the United States of America, vol. 94, no. 17, pp.9102–9107, 1997.
[16] S. C. Clifford, M. E. Cockman, A. C. Smallwood et al., “Con-trasting effects on HIF-1alpha regulation by disease-causingpVHL mutations correlate with patterns of tumourigenesisinvon Hippel-Lindau disease,” Human Molecular Genetics,vol. 10, no. 10, pp. 1029–1038, 2001.
[17] P. P. Kapitsinou and V. H. Haase, “The VHL tumor sup-pressor and HIF: insights from genetic studies in mice,” CellDeath & Differentiation, vol. 15, no. 4, pp. 650–659, 2008.
[18] C. J. Schofield and P. J. Ratcliffe, “Signalling hypoxia byHIF hydroxylases,” Biochemical and Biophysical ResearchCommunications, vol. 338, no. 1, pp. 617–626, 2005.
[19] W. M. Linehan, R. Srinivasan, and L. S. Schmidt, “Thegenetic basis of kidney cancer: a metabolic disease,” NatureReviews Urology, vol. 7, no. 5, pp. 277–285, 2010.
[20] P. J. Pollard, N. C. Wortham, and I. P. Tomlinson, “The TCAcycle and tumorigenesis: the examples of fumarate hydrataseand succinate dehydrogenase,” Annals of Medicine, vol. 35,no. 8, pp. 632–639, 2003.
[21] M. A. Selak, S. M. Armour, E. D. MacKenzie et al., “Succinatelinks TCA cycle dysfunction to oncogenesis by inhibitingHIF-alpha; prolyl hydroxylase,” Cancer Cell, vol. 7, no. 1, pp.77–85, 2005.
[22] E. Gottlieb and I. P. Tomlinson, “Mitochondrial tumoursuppressors: a genetic and biochemical update,” NatureReviews Cancer, vol. 5, no. 11, pp. 857–866, 2005.
[23] B. Pasini and C. A. Stratakis, “SDH mutations in tumori-genesis and inherited endocrine tumours: lesson from thephaeochromocytoma-paraganglioma syndromes,” Journal ofInternal Medicine, vol. 266, no. 1, pp. 19–42, 2009.
[24] J. A. Fagin and N. Mitsiades, “Molecular pathology of thyroidcancer: diagnostic and clinical implications,” Best Practice &Research Clinical Endocrinology & Metabolism, vol. 22, no. 6,pp. 955–969, 2008.
[25] D. Roymans and H. Slegers, “Phosphatidylinositol 3-kinasesin tumor progression,” European Journal of Biochemistry, vol.268, no. 3, pp. 487–498, 2001.
[26] M. Hanada, J. Feng, and B. A. Hemmings, “Structure,regulation and function of PKB/AKT—A major therapeutictarget,” Biochimica et Biophysica Acta, vol. 1697, no. 1-2, pp.3–16, 2004.
[27] E. Berra, J. Milanini, D. E. Richard et al., “Signaling angio-genesis via p42/p44 MAP kinase and hypoxia,” BiochemicalPharmacology, vol. 60, no. 8, pp. 1171–1178, 2000.
[28] G. L. Semenza, “HIF-1 and tumor progression: pathophysi-ology and therapeutics,” Trends in Molecular Medicine, vol. 8,no. 4, supplement, pp. S62–S67, 2002.
[29] N. Burrows, J. Resch, R. L. Cowen et al., “Expressionof hypoxia-inducible factor 1alpha in thyroid carcinomas,”Endocrine-Related Cancer, vol. 17, no. 1, pp. 61–72, 2010.
[30] M. Zerilli, G. Zito, A. Martorana et al., “BRAF mutationinfluences hypoxia-inducible factor-1alpha expression levelsin papillary thyroid cancer,” Modern Pathology, vol. 28, no. 3,pp. 1052–1060, 2010.
[31] N. Sang, D. P. Stiehl, J. Bohensky, I. Leshchinsky, V. Srinivas,and J. Caro, “MAPK signaling up-regulates the activity ofhypoxia-inducible factors by its effects on p300,” The Journalof Biological Chemistry, vol. 278, no. 16, pp. 14013–14019,2003.
[32] D. E. Richard, E. Berra, E. Gothie, D. Roux, and J. Pouyssegur,“p42/p44 mitogen-activated protein kinases phosphorylatehypoxia-reducible factor (HIF-1alpha) and enhance thetranscriptional activity of HIF-1,” The Journal of BiologicalChemistry, vol. 274, no. 46, pp. 32631–32637, 1999.
[33] K. Hirota and G. L. Semenza, “Rac1 Activity is Required forthe Activation of Hypoxia-inducible Factor 1,” The Journal ofBiological Chemistry, vol. 276, no. 24, pp. 21166–21172, 2001.
[34] G. L. Semenza, “Signal transduction to hypoxia-induciblefactor 1,” Biochemical Pharmacology, vol. 64, no. 5-6, pp. 993–998, 2002.
14 Journal of Thyroid Research
[35] A. Gorlach, U. Berchner-Pfannschmidt, C. Wotzlaw et al.,“Reactive oxygen species modulate HIF-I mediated PAI-Iexpression: involvement of the GTPase RacI,” Thrombosis &Haemostasis, vol. 89, no. 5, pp. 926–935, 2003.
[36] I. Mylonis, G. Chachami, M. Samiotaki et al., “Identificationof MAPK phosphorylation sites and their role in thelocalization and activity of hypoxia-inducible factor-1alpha,”The Journal of Biological Chemistry, vol. 281, no. 44, pp.33095–33106, 2006.
[37] R. Fukuda, K. Hirota, F. Fan, Y. D. Jung, L. M. Ellis, and G.L. Semenza, “Insulin-like growth factor 1 induces hypoxia-inducible factor 1-mediated vascular endothelial growthfactor expression, which is dependent on MAP kinase andphosphatidylinositol 3-kinase signaling in colon cancer cells,”The Journal of Biological Chemistry, vol. 277, no. 41, pp.38205–38211, 2002.
[38] K. T. Tang and C. H. Lee, “BRAF mutation in papillary thy-roid carcinoma: pathogenic role and clinical implications,”Journal of the Chinese Medical Association, vol. 73, no. 3, pp.113–128, 2010.
[39] R. Ciampi and Y. E. Nikiforov, “Minireview: RET/PTC rear-rangements and braf mutations in thyroid tumorigenesis,”Endocrinology, vol. 148, no. 3, pp. 936–941, 2007.
[40] Y. Li, M. Nakamura, and K. Kakudo, “Targeting of the BRAFgene in papillary thyroid carcinoma (review),” OncologyReports, vol. 22, no. 4, pp. 671–681, 2009.
[41] J. E. Paes and M. D. Ringel, “Dysregulation of the phos-phatidylinositol 3-kinase pathway in thyroid neoplasia,”Endocrinology and Metabolism Clinics of North America, vol.37, no. 2, pp. 375–387, 2008.
[42] A. T. Franco, R. Malaguarnera, S. Refetoff et al., “Thy-rotrophin receptor signaling dependence of Braf-inducedthyroid tumor initiation in mice,” Proceedings of the NationalAcademy of Sciences of the United States of America, vol. 108,no. 4, pp. 1615–1620, 2011.
[43] A. Greco, M. G. Borrello, C. Miranda, D. Degl’Innocenti, andM. A. Pieroiti, “Molecular pathology of differentiated thyroidcancer,” Quarterly Journal of Nuclear Medicine and MolecularImaging, vol. 53, no. 5, pp. 440–454, 2009.
[44] H. Kikuchi, M. S. Pino, Z. Min, S. Shirasawa, and D. C.Chung, “Oncogenic KRAS and BRAF differentially regulatehypoxia-inducible factor-1alpha and -2alpha in colon can-cer,” Cancer Research, vol. 69, no. 21, pp. 8499–8506, 2009.
[45] P. Papageorgis, K. Cheng, S. Ozturk et al., “Smad4 inacti-vation promotes malignancy and drug resistance of coloncancer,” Cancer Research, vol. 71, no. 3, pp. 998–1008, 2011.
[46] J. I. Bardos and M. Ashcroft, “Hypoxia-inducible factor-1and oncogenic signalling,” BioEssays, vol. 26, no. 3, pp. 262–269, 2004.
[47] M. Saji and M. D. Ringel, “The PI3K-Akt-mTOR pathway ininitiation and progression of thyroid tumors,” Molecular &Cellular Endocrinology, vol. 321, no. 1, pp. 20–28, 2010.
[48] A. C. Gingras, B. Raught, and N. Sonenberg, “Regulationof translation initiation by FRAP/mTOR,” Genes & Develop-ment, vol. 15, no. 7, pp. 807–826, 2001.
[49] R. T. Peterson, B. N. Desai, J. S. Hardwick, and S. L.Schreiber, “Protein phosphatase 2A interacts with the 70-kDa S6 kinase and is activated by inhibition of FKBP12-rapamycin-associated protein,” Proceedings of the NationalAcademy of Sciences of the United States of America, vol. 96,no. 8, pp. 4438–4442, 1999.
[50] E. Laughner, P. Taghavi, K. Chiles, P. C. Mahon, andG. L. Semenza, “HER2 (neu) signaling increases the rateof hypoxia-inducible factor 1alpha (HIF-1alpha) synthesis:novel mechanism for HIF-1-mediated vascular endothelialgrowth factor expression,” Molecular & Cellular Biology, vol.21, no. 12, pp. 3995–4004, 2001.
[51] H. Zhong, K. Chiles, D. Feldser et al., “Modulationof hypoxia-inducible factor 1alpha expression bythe epidermal growth factor/phosphatidylinositol 3-kinase/PTEN/AKT/FRAP pathway in human prostate cancercells: implications for tumor angiogenesis and therapeutics,”Cancer Research, vol. 60, no. 6, pp. 1541–1545, 2000.
[52] A. A. Kazi and R. D. Koos, “Estrogen-induced activation ofhypoxia-inducible factor-1alpha, vascular endothelial growthfactor expression, and edema in the uterus are mediated bythe phosphatidylinositol 3-kinase/Akt pathway,” Endocrinol-ogy, vol. 148, no. 5, pp. 2363–2374, 2007.
[53] N. D. Deocampo, H. Huang, and D. J. Tindall, “The role ofPTEN in the progression and survival of prostate cancer,”Minerva Endocrinologica, vol. 28, no. 2, pp. 145–153, 2003.
[54] W. Zundel, C. Schindler, D. Haas-Kogan et al., “Loss ofPTEN facilitates HIF-1-mediated gene expression,” Genesand Development, vol. 14, no. 4, pp. 391–396, 2000.
[55] C. Eng, “Role of PTEN, a lipid phosphatase upstream effectorof protein kinase B, in epithelial thyroid carcinogenesis,”Annals of the New York Academy of Sciences, vol. 968, pp. 213–221, 2002.
[56] A. Astanehe, D. Arenillas, W. W. Wasserman et al., “Mecha-nisms underlying p53 regulation of PIK3CA transcription inovarian surface epithelium and in ovarian cancer,” Journal ofCell Science, vol. 121, no. 5, pp. 664–674, 2008.
[57] M. Cully, H. You, A. J. Levine, and T. W. Mak, “Beyond PTENmutations: the PI3K pathway as an integrator of multipleinputs during tumorigenesis,” Nature Reviews Cancer, vol. 6,no. 3, pp. 184–192, 2006.
[58] R. Ravi, B. Mookerjee, Z. M. Bhujwalla et al., “Regulation oftumor angiogenesis by p53-induced degradation of hypoxia-inducible factor 1alpha,” Genes & Development, vol. 14, no. 1,pp. 34–44, 2000.
[59] H. Harada, S. Itasaka, S. Kizaka-Kondoh et al., “TheAkt/mTOR pathway assures the synthesis of HIF-1alphaprotein in a glucose- and reoxygenation-dependent mannerin irradiated tumors,” The Journal of Biological Chemistry,vol. 284, no. 8, pp. 5332–5342, 2009.
[60] J. B. Brugarolas, F. Vazquez, A. Reddy, W. R. Sellers, and W.G. Kaelin, “TSC2 regulates VEGF through mTOR-dependentand -independent pathways,” Cancer Cell, vol. 4, no. 2, pp.147–158, 2003.
[61] E. A. Dunlop and A. R. Tee, “Mammalian target of rapamycincomplex 1: signalling inputs, substrates and feedback mech-anisms,” Cellular Signalling, vol. 21, no. 6, pp. 827–835, 2009.
[62] R. Bernardi, I. Guernah, D. Jin et al., “PML inhibits HIF-1alpha translation and neoangiogenesis through repressionof mTOR,” Nature, vol. 442, no. 7104, pp. 779–785, 2006.
[63] S. C. Land and A. R. Tee, “Hypoxia-inducible factor 1aplha isregulated by the mammalian target of rapamycin (mTOR)via an mTOR signaling motif,” The Journal of BiologicalChemistry, vol. 282, no. 28, pp. 20534–20543, 2007.
[64] A. Kaidi, A. C. Williams, and C. Paraskeva, “Interactionbetween alpha-catenin and HIF-1 promotes cellular adapta-tion to hypoxia,” Nature Cell Biology, vol. 9, no. 2, pp. 210–217, 2007.
Journal of Thyroid Research 15
[65] M. M. Baldewijns, I. J. H. Van Vlodrop, P. B. Vermeulen, P.M. M. B. Soetekouw, M. Van Engeland, and A. P. De Bruıne,“VHL and HIF signalling in renal cell carcinogenesis,” TheJournal of Pathology, vol. 221, no. 2, pp. 125–138, 2010.
[66] M. Hockel and P. Vaupel, “Biological consequences of tumorhypoxia,” Seminars in Oncology, vol. 28, no. 2, supplement 8,pp. 36–41, 2001.
[67] P. Vaupel and L. Harrison, “Tumor hypoxia: causativefactors, compensatory mechanisms, and cellular response,”Oncologist, vol. 9, supplement 5, pp. 4–9, 2004.
[68] A. Chavez, L. F. Miranda, P. Pichiule, and J. C. Chavez, “Mito-chondria and hypoxia-induced gene expression mediated byhypoxia-inducible factors,” Annals of the New York Academyof Sciences, vol. 1147, pp. 312–320, 2008.
[69] Y. Jiang, W. Zhang, K. Kondo et al., “Gene expressionprofiling in a renal cell carcinoma cell line: dissectingVHL and hypoxia-dependent pathways,” Molecular CancerResearch, vol. 1, no. 6, pp. 453–462, 2003.
[70] W. G. Kaelin Jr., “The von Hippel-Lindau tumour suppressorprotein: O2 sensing and cancer,” Nature Reviews Cancer, vol.8, no. 11, pp. 865–873, 2008.
[71] J. A. Bertout, S. A. Patel, and M. C. Simon, “The impact of O2
availability on human cancer,” Nature Reviews Cancer, vol. 8,no. 12, pp. 967–975, 2008.
[72] M. Milani and A. L. Harris, “Targeting tumour hypoxia inbreast cancer,” European Journal of Cancer, vol. 44, no. 18,pp. 2766–2773, 2008.
[73] J. J. Hung, M. H. Yang, H. S. Hsu, W. H. Hsu, J. S. Liu, and K.J. Wu, “Prognostic significance of hypoxia-inducible factor-1alpha, TWIST1 and Snail expression in resectable non-smallcell lung cancer,” Thorax, vol. 64, no. 12, pp. 1082–1089,2009.
[74] C. A. Scrideli, C. G. Carlotti, J. F. Mata et al., “Prognosticsignificance of co-overexpression of the EGFR/IGFBP-2/HIF-2A genes in astrocytomas,” Journal of Neuro-Oncology, vol.83, no. 3, pp. 233–239, 2007.
[75] K. M. Comerford, T. J. Wallace, J. Karhausen, N. A. Louis,M. C. Montalto, and S. P. Colgan, “Hypoxia-inducible factor-1-dependent regulation of the multidrug resistance (MDR1)gene,” Cancer Research, vol. 62, no. 12, pp. 3387–3394, 2002.
[76] S. Park, C. Shimizu, T. Shimoyama et al., “Gene expressionprofiling of ATP-binding cassette (ABC) transporters asa predictor of the pathologic response to neoadjuvantchemotherapy in breast cancer patients,” Breast CancerResearch and Treatment, vol. 99, no. 1, pp. 9–17, 2006.
[77] H. Yasuda, “Solid tumor physiology and hypoxia-inducedchemo/radio-resistance: novel strategy for cancer therapy:nitric oxide donor as a therapeutic enhancer,” Nitric Oxide—Biology and Chemistry, vol. 19, no. 2, pp. 205–216, 2008.
[78] A. V. Salnikov, N. E. Heldin, L. B. Stuhr et al., “Inhibitionof carcinoma cell-derived VEGF reduces inflammatory char-acteristics in xenograft carcinoma,” International Journal ofCancer, vol. 119, no. 12, pp. 2795–2802, 2006.
[79] Y. Boucher, L. T. Baxter, and R. K. Jain, “Interstitial pres-sure gradients in tissue-isolated and subcutaneous tumors:implications for therapy,” Cancer Research, vol. 50, no. 15, pp.4478–4484, 1990.
[80] N. Qayum, R. J. Muschel, H. I. Jae et al., “Tumor vascularchanges mediated by inhibition of oncogenic signaling,”Cancer Research, vol. 69, no. 15, pp. 6347–6354, 2009.
[81] S. Pastorekova, J. Kopacek, and J. Pastorek, “Carbonicanhydrase inhibitors and the management of cancer,” Current
Topics in Medicinal Chemistry, vol. 7, no. 9, pp. 865–878,2007.
[82] S. E. Rademakers, P. N. Span, J. H. A. M. Kaanders, F. C. G. J.Sweep, A. J. Van der Kogel, and J. Bussink, “Molecular aspectsof tumour hypoxia,” Molecular Oncology, vol. 2, no. 1, pp. 41–53, 2008.
[83] N. Raghunand and R. J. Gillies, “pH and chemotherapy,”Novartis Foundation Symposium, vol. 240, pp. 199–211, 2001.
[84] L. M. Brown, R. L. Cowen, C. Debray et al., “Reversinghypoxic cell chemoresistance in vitro using genetic and smallmolecule approaches targeting hypoxia inducible factor-1,”Molecular Pharmacology, vol. 69, no. 2, pp. 411–418, 2006.
[85] M. Abend, “Reasons to reconsider the significance of apop-tosis for cancer therapy,” International Journal of RadiationBiology, vol. 79, no. 12, pp. 927–941, 2003.
[86] D. Eriksson and T. Stigbrand, “Radiation-induced cell deathmechanisms,” Tumor Biology, vol. 31, no. 4, pp. 363–372,2010.
[87] M. I. Koukourakis, A. Giatromanolaki, E. Sivridis et al.,“Hypoxia-inducible factor (HIF1A and HIF2A), angiogene-sis, and chemoradiotherapy outcome of squamous cell head-and-neck cancer,” International Journal of Radiation OncologyBiology Physics, vol. 53, no. 5, pp. 1192–1202, 2002.
[88] B. J. Moeller, Y. Cao, C. Y. Li, and M. W. Dewhirst, “Radi-ation activates HIF-1 to regulate vascular radiosensitivityin tumors: role of reoxygenation, free radicals, and stressgranules,” Cancer Cell, vol. 5, no. 5, pp. 429–441, 2004.
[89] N. Chadderton, R. L. Cowen, F. C. D. Sheppard et al., “Dualresponsive promoters to target therapeutic gene expressionto radiation-resistant hypoxic tumor cells,” InternationalJournal of Radiation Oncology Biology Physics, vol. 62, no. 1,pp. 213–222, 2005.
[90] M. I. Koukourakis, S. M. Bentzen, A. Giatromanolaki etal., “Endogenous markers of two separate hypoxia responsepathways (hypoxia inducible factor 2 alpha and carbonicanhydrase 9) are associated with radiotherapy failure inhead and neck cancer patients recruited in the CHARTrandomized trial,” Journal of Clinical Oncology, vol. 24, no.5, pp. 727–735, 2006.
[91] E. Metzen, J. Zhou, W. Jelkmann, J. Fandrey, and B. Brune,“Nitric oxide impairs normoxic degradation of HIF-1alphaby inhibition of prolyl hydroxylases,” Molecular Biology of theCell, vol. 14, no. 8, pp. 3470–3481, 2003.
[92] L. Milas, K. Mason, N. Hunter et al., “In vivo enhancementof tumor radioresponse by C225 antiepidermal growth factorreceptor antibody,” Clinical Cancer Research, vol. 6, no. 2, pp.701–708, 2000.
[93] T. J. Kim, J. W. Lee, S. Y. Song et al., “Increased expressionof pAKT is associated with radiation resistance in cervicalcancer,” British Journal of Cancer, vol. 94, no. 11, pp. 1678–1682, 2006.
[94] J. A. Bonner, P. M. Harari, J. Giralt et al., “Radiotherapyplus cetuximab for squamous-cell carcinoma of the head andneck,” New England Journal of Medicine, vol. 354, no. 6, pp.567–578, 2006.
[95] R. Prevo, E. Deutsch, O. Sampson et al., “Class I PI3 kinaseinhibition by the pyridinylfuranopyrimidine inhibitor PI-103 enhances tumor radiosensitivity,” Cancer Research, vol.68, no. 14, pp. 5915–5923, 2008.
[96] J. S. Chen, L. J. Zhou, M. Entin-Meer et al., “Characterizationof structurally distinct, isoform-selective phosphoinositide3’-kinase inhibitors in combination with radiation in the
16 Journal of Thyroid Research
treatment of glioblastoma,” Molecular Cancer Therapeutics,vol. 7, no. 4, pp. 841–850, 2008.
[97] X. Li, E. A. Kimbrel, D.J. Kenan, and D. P. McDonnell, “Directinteractions between corepressors and coactivators permitthe integration of nuclear receptor-mediated repression andactivation,” Molecular Endocrinology, vol. 16, no. 7, pp. 1482–1491, 2002.
[98] H. Y. Lin, M. Sun, H. Y. Tang et al., “L-thyroxine vs.3,5,3’-triiodo-L-thyronine and cell proliferation: activationof mitogen-activated protein kinase and phosphatidylinositol3-kinase,” American Journal of Physiology, vol. 296, no. 5, pp.C980–C991, 2009.
[99] L. C. Moeller, X. Cao, A. M. Dumitrescu, H. Seo, andS. Refetoff, “Thyroid hormone mediated changes in geneexpression can be initiated by cytosolic action of the thyroidhormone receptor beta through the phosphatidylinositol 3-kinase pathway,” Nuclear Receptor Signaling Atlas, vol. 4, p.e020, 2006.
[100] F. Furuya, J. A. Hanover, and S. Y. Cheng, “Activation ofphosphatidylinositol 3-kinase signaling by a mutant thyroidhormone β receptor,” Proceedings of the National Academy ofSciences of the United States of America, vol. 103, no. 6, pp.1780–1785, 2006.
[101] Y. Hiroi, H. H. Kim, H. Ying et al., “Rapid nongenomicactions of thyroid hormone,” Proceedings of the NationalAcademy of Sciences of the United States of America, vol. 103,no. 38, pp. 14104–14109, 2006.
[102] L. A. Palmer, G. L. Semenza, M. H. Stoler, and R. A. Johns,“Hypoxia induces type II NOS gene expression in pulmonaryartery endothelial cells via HIF-1,” American Journal ofPhysiology, vol. 274, no. 2, pp. L212–L219, 1998.
[103] R. Liu, Z. Li, S. Bai et al., “Mechanism of cancer celladaptation to metabolic stress: proteomics identificationof a novel thyroid hormone-mediated gastric carcinogenicsignaling pathway,” Molecular & Cellular Proteomics, vol. 8,no. 1, pp. 70–85, 2009.
[104] H. Y. Lin, S. Zhang, B. L. West et al., “Identificationof the putative MAP kinase docking site in the thyroidhormone receptor-alpha1 DNA-binding domain: functionalconsequences of mutations at the docking site,” Biochemistry,vol. 42, no. 24, pp. 7571–7579, 2003.
[105] Y. Ma, P. Freitag, J Zhou, B. Brune, S. Frede, and J.Fandrey, “Thyroid hormone induces erythropoietin geneexpression through augmented accumulation of hypoxia-inducible factor-1,” American Journal of Physiology, vol. 287,no. 3, pp. R600–R607, 2004.
[106] T. Otto and J. Fandrey, “Thyroid hormone induces hypoxia-inducible factor 1alpha gene expression through thyroidhormone receptor beta/retinoid x receptor alpha-dependentactivation of hepatic leukemia factor,” Endocrinology, vol.149, no. 5, pp. 2241–2250, 2008.
[107] W. S. Simonides, M. A. Mulcahey, E. M. Redout et al.,“Hypoxia-inducible factor induces local thyroid hormoneinactivation during hypoxic-ischemic disease in rats,” TheJournal of Clinical Investigation, vol. 118, no. 3, pp. 975–983,2008.
[108] A. M. Jubb, T. Q. Pham, A. M. Hanby et al., “Expression ofvascular endothelial growth factor, hypoxia inducible factor1alpha, and carbonic anhydrase IX in human tumours,”Journal of Clinical Pathology, vol. 57, no. 5, pp. 504–512, 2004.
[109] D. C. Allred, G. M. Clark, R. Elledge et al., “Association ofp53 protein expression with tumor cell proliferation rate and
clinical outcome in node-negative breast cancer,” Journal ofthe National Cancer Institute, vol. 85, no. 3, pp. 200–206,1993.
[110] J. Pouyssegur, F. Dayan, and N. M. Mazure, “Hypoxiasignalling in cancer and approaches to enforce tumourregression,” Nature, vol. 441, no. 7092, pp. 437–443, 2006.
[111] P. Hou, D. Liu, Y. Shan et al., “Genetic alterations andtheir relationship in the phosphatidylinositol 3-kinase/Aktpathway in thyroid cancer,” Clinical Cancer Research, vol. 13,no. 4, pp. 1161–1170, 2007.
[112] Y. Wang, P. Hou, H. Yu et al., “High prevalence and mutualexclusivity of genetic alterations in the phosphatidylinositol-3-kinase/Akt pathway in thyroid tumors,” Journal of ClinicalEndocrinology and Metabolism, vol. 92, no. 6, pp. 2387–2390,2007.
[113] G. Bunone, P. Vigneri, L. Mariani et al., “Expression ofangiogenesis stimulators and inhibitors in human thyroidtumors and correlation with clinical pathological features,”American Journal of Pathology, vol. 155, no. 6, pp. 1967–1976,1999.
[114] A. B. Kilicarslan, M. Ogus, C. Arici, H. E. Pestereli, M.Cakir, and G. Karpuzoglu, “Clinical importance of vascularendothelial growth factor (VEGF) for papillary thyroidcarcinomas,” APMIS, vol. 111, no. 3, pp. 439–443, 2003.
[115] C. M. Lennard, A. Patel, J. Wilson et al., “Intensity ofvascular endothelial growth factor expression is associatedwith increased risk of recurrence and decreased disease-freesurvival in papillary thyroid cancer,” Surgery, vol. 129, no. 5,pp. 552–558, 2001.
[116] J. M. Vieira, S. C. Santos, C. Espadinha et al., “Expressionof vascular endothelial growth factor (VEGF) and its recep-tors in thyroid carcinomas of follicular origin: a potentialautocrine loop,” European Journal of Endocrinology, vol. 129,no. 5, pp. 552–558, 2005.
[117] R. T. Kloos, M. H. Shah, M. D. Ringel et al., “Phase II trialof sorafenib in metastatic thyroid cancer,” Journal of ClinicalOncology, vol. 27, no. 10, pp. 1675–1684, 2009.
[118] S. A. Wells Jr., J. E. Gosnell, R. F. Gagel et al., “Vandetanib forthe treatment of patients with locally advanced or metastatichereditary medullary thyroid cancer,” American Journal ofClinical Oncology, vol. 28, no. 5, pp. 767–772, 2010.
[119] V. Gupta-Abramson, A. B. Troxel, A. Nellore et al., “PhaseII trial of sorafenib in advanced thyroid cancer,” Journal ofClinical Oncology, vol. 26, no. 29, pp. 4714–4719, 2008.
[120] M. B. Bass, S. I. Sherman, M. J. Schlumberger et al.,“Biomarkers as predictors of response to treatment withmotesanib in patients with progressive advanced thyroidcancer,” The Journal of Clinical Endocrinology & Metabolism,vol. 95, no. 11, pp. 5018–5027, 2010.
[121] J. T. Erler, K. L. Bennewith, M. Nicolau et al., “Lysyl oxidaseis essential for hypoxia-induced metastasis,” Nature, vol. 440,no. 7088, pp. 1222–1226, 2006.
[122] X. Y. Zhao, T. T. Chen, and L. Xia, “Hypoxia inducible factor-1 mediates expression of galectin-1: the potential role inmigration/invasion of colorectal cancer cells,” Carcinogenesis,vol. 31, no. 8, pp. 1367–1375, 2010.
[123] J. Chen, N. Imanaka, J. Chen, and J. D. Griffin, “Hypoxiapotentiates Notch signaling in breast cancer leading todecreased E-cadherin expression and increased cell migra-tion and invasion,” British Journal of Cancer, vol. 102, no. 2,pp. 351–360, 2010.
[124] S. Scarpino, A. Stoppacciaro, F. Ballerini et al., “Papillarycarcinoma of the thyroid: hepatocyte growth factor (HGF)

Journal of Thyroid Research 17
stimulates tumor cells to release chemokines active inrecruiting dendritic cells,” American Journal of Pathology, vol.156, no. 3, pp. 831–837, 2000.
[125] S. Scarpino, F. C. D’Alena, A. Di Napoli, F. Ballarini, M. Prat,and L. P. Ruco, “Papillary carcinoma of the thyroid: evidencefor a role for hepatocyte growth factor (HGF) in promotingtumour angiogenesis,” The Journal of Pathology, vol. 199, no.2, pp. 243–250, 2003.
[126] T. Brabletz, A Jung, S. Reu et al., “Variable beta-cateninexpression in colorectal cancers indicates tumor progres-sion driven by the tumor environment,” Proceedings of theNational Academy of Sciences of the United States of America,vol. 98, no. 18, pp. 10356–10361, 2001.
[127] S. Scarpino, F. C. d’Alena, A. Di Napoli, A. Pasquini, A.Marzullo, and L. P. Ruco, “Increased expression of Metprotein is associated with up-regulation of hypoxia induciblefactor-I (HIF-I) in tumour cells in papillary carcinoma of thethyroid,” The Journal of Pathology, vol. 202, no. 3, pp. 352–358, 2004.
[128] B. J. Moeller and M. W. Dewhirst, “HIF-1 and tumourradiosensitivity,” British Journal of Cancer, vol. 95, no. 1, pp.1–5, 2006.
[129] G. L. Semenza, “Defining the role of hypoxia-inducible factor1 in cancer biology and therapeutics,” Oncogene, vol. 29, no.5, pp. 625–634, 2010.
[130] C. Magnon, P. Opolon, M. Ricard et al., “Radiation andinhibition of angiogenesis by canstatin synergize to induceHIF-1α-mediated tumor apoptotic switch,” The Journal ofClinical Investigation, vol. 117, no. 7, pp. 1844–1855, 2007.
SAGE-Hindawi Access to ResearchJournal of Thyroid ResearchVolume 2011, Article ID 621839, 7 pagesdoi:10.4061/2011/621839
Research Article
Lymph Node Thyroglobulin Measurement in Diagnosis ofNeck Metastases of Differentiated Thyroid Carcinoma
Luca Giovanella,1, 2 Luca Ceriani,1 and Sergio Suriano1
1 Department of Nuclear Medicine and Thyroid Unit, Oncology Institute of Southern Switzerland, Street Ospedale 12,6500 Bellinzona, Switzerland
2 Department of Clinical Chemistry and Laboratory Medicine, Ente Ospedaliero Cantonale, 6500 Bellinzona, Switzerland
Correspondence should be addressed to Luca Giovanella, [email protected]
Received 27 January 2011; Revised 16 March 2011; Accepted 30 March 2011
Academic Editor: Electron Kebebew
Copyright © 2011 Luca Giovanella et al. This is an open access article distributed under the Creative Commons AttributionLicense, which permits unrestricted use, distribution, and reproduction in any medium, provided the original work is properlycited.
Aim. Enlarged cervical lymph nodes (LNs) in patients with thyroid cancer are usually assessed by fine-needle aspiration cytology(FNAC). Thyroglobulin (Tg) is frequently elevated in malignant FNAC needle wash specimens (FNAC-Tg). The objectives ofthe study were to (1) determine an appropriate diagnostic cut-off for FNAC-Tg levels (2) compare FNAC and FNAC-Tg resultsin a group of 108 patients affected by differentiated thyroid carcinoma (DTC). Methods. A total of 126 consecutive FNACs wereperformed on enlarged LNs and the final diagnosis was confirmed by surgical pathology examination or clinical follow-up. Thebest FNAC-Tg cut-off level was selected by receiver operating curve analysis, and diagnostic performances of FNAC and FNAC-Tgwere compared. Results. The rate of FNAC samples adequate for cytological examination was 77% in contrast FNAC-Tg availablein 100% of aspirates (P < .01). The sensitivity, specificity, and accuracy of FNAC were 71%, 80%, 74%, 100%, 80%, and 94%,respectively. The most appropriate cut-off value for the diagnosis of thyroid cancer metastatic LN was 1.1 ng/mL (sensitivity 100%,specificity 100%). Conclusions. The diagnostic performance of needle washout FNAC-Tg measurement with a cut-off of 1.1 ng/mLcompared favorably with cytology in detecting DTC node metastases.
1. Introduction
The prognosis of patients who receive appropriate treatmentfor thyroid carcinoma is usually favourable, especially fordifferentiated thyroid carcinoma (DTC). However, althoughmost patients have a long-term survival rate, 5% to 20%of patients will develop recurrence during the followup,primarily in the cervical lymph nodes (LNs) [1, 2]. TheseLNs metastases may be detected clinically, but now aremost often discovered on ultrasonography (US) [3]. It isof great importance to differentiate accurately LN metas-tases from benign reactive lymph nodes in order to avoidunnecessary treatment, but also to treat metastatic patientswithout delay. As consequence, diagnostic procedures mustoffer good sensitivity, but also high negative predictivevalue. US criteria distinguishing benign from metastatic orsuspicious LNs have been described but they lack accuracy[4]. US-guided fine needle cytology (FNAC) proved to be
a reliable method in examining the neck in patients whowere previously treated for thyroid cancer [5, 6]. However,sensitivity of FNAC is far from excellent, varying from75% to 85%, and altered by high rate of nondiagnostic orfalse-negative samples. To improve the diagnostic yield ofFNAC, several authors have proposed measurement of Tgin aspirates (FNAC-Tg), particularly in the cases involvingsmall, partially cystic, lymph nodes [7–12]. On the basis ofprior studies, an increased Tg level in the needle washouthas been shown to directly reflect the status of metastaticlymph nodes in patients affected by differentiated thyroidcarcinoma. However, controversies still persist concerningsome issues. First, there are few studies to validate the benefitof FNAC-Tg over FNAC alone, and, second, cut-off valuesranging from 0.9 to 39 ng/mL have been suggested for FNAC-Tg, depending on the method used for the measurement[7, 13–15]. As consequence, the exact place for FNAC-Tg in the management of DTC patients is still debated.

2 Journal of Thyroid Research
This study was then undertaken to (1) determine a diagnosticcut-off value for washout Tg in patients treated by totalthyroidectomy for detecting recurrences, and (2) to comparethe performance of the Tg cut-off value to US-guided FNACfor detecting DTC recurrences.
2. Materials and Methods
Our institutional review board approved our research study,and all subjects gave written informed consent.
2.1. Patients. Between January 2006 and February 2009 atotal of 126 consecutive US-guided FNACs were performedon enlarged LNs. The samples were obtained from 108patients (19 males, 89 females; age 42.7 ± 18.2 years; 91patients with 1, 94 with 2, and 5 with 3 lesions, resp.).All patients had histologically confirmed primary DTC(papillary, n = 99, including two tall-cell variants; follicular,n = 9, including 2 Hurtle cells carcinomas). The primitivecarcinoma was classified pT1 in 34 cases, pT2 in 43 cases, pT3in 24 cases, and pT4 in 7 cases. Forty-five patients (42%) hadLN metastases at diagnosis. All patients underwent (near)total thyroidectomy and subsequent radioiodine ablation(administered activity from 1.85 to 3.70 GBq). The UScriteria for possible malignant infiltration of lymph nodeswere rounded contour, irregular internal echogenicity, punc-tate calcifications, fluids components, and abnormal colourDoppler pattern. Patients with positive cytology and/orFNAC-Tg measurement (n = 86, 96 lesions) underwentsurgery and, if necessary, further radioiodine treatments. Thediagnosis was confirmed in all cases by surgical pathologyexamination. Patients with negative FNAC-Tg measurementand cytology (n = 22, 30 lesions) underwent further followup by serial clinical examinations, serum Tg measurements,neck US, and, whenever necessary, additional imagingprocedures (i.e., radioiodine scan, 18FDG-PET/CT). No DTCrecurrence was detected among these patients (follow up:mean 36 months, range 15–42 months).
2.2. US-Guided FNAC Procedure. All US-guided FNAC pro-cedures were performed on supine patients with the neckhyperextended under continuous real-time US guidancewith a high-resolution transducer (ACUSON×150, Siemens,Erlangen, Germany). Each lesion was aspirated at least twiceby a 21 G needle. The needle was inserted obliquely withinthe transducer plane of view, and moved back and forththrough the nodule to compensate for patient movementand needle deflection. Gradual aspiration was applied by a20 mL syringe connected to Cameco’s device. Contents ofneedles were expelled onto glass slides and smeared witha second slide to spread fluid across the surface. Slideswere fixed in 95% ethanol, papanicolaou stained to identifycellular details, and read by our cytopathologist. Followingcollection of cytology samples the needles were washedby 1 mL of normal saline in a plain serum tube (Vacu-tainer Systems, Plymouth, UK) and the washout directlysent to the laboratory [16]. Cytological examinations wereperformed by experienced cytopathologists and expressedas (1) positive: presence of epithelial cells with atypical
cytological characteristics, or with cytological features ofpapillary carcinoma; (2) negative: reactive lymphadenitis andabsence of malignant cells; (3) inadequate or nondiagnostic:absence of cells or presence of blood cells.
2.3. Tg Measurement. Thyroglobulin was measured in fine-needle washouts using an immunoradiometric assay (IRMA)based on coated tubes with monoclonal antibodies directedagainst distinct epitopes of the molecule of Tg (DYNOtest Tg-plus, BRAHMS Diagnostic GmbH, Berlin, Ger-many). With this measurement, analytic sensitivity, definedas the detectable minimum concentration different fromzero (mean value + 2 standard deviation), and functionalsensitivity, defined as the lowest value that was measuredwith the precision of a maximum 20% interassay variance,were 0.08 ng/mL and 0.2 ng/mL, respectively. We did notmeasure Tg antibodies (FNAC-TgAb) because the clinicalperformance of FNAC-Tg is unaffected by serum TgAb [17].
2.4. Data Analysis. Diagnostic performance (i.e., sensitiv-ity, specificity, positive predictive value, negative predictivevalue, and accuracy) of FNAC and FNAC-Tg was evaluatedby comparing the results of the two procedures to the statusof the patients defined as follows: malignant lymph nodefrom thyroid cancer was proved by histological examinationof surgically resected LNs; benign lymph node was provedby negative histological examination of surgically respectedLNs, or if disappearance or absence of evolution on imagingmodalities was demonstrated at 12 months or more followup.
The Chi-square (χ2) test, performed with SAS version 9.1for Windows (SAS Institute, Cary, NC, US) was employedto compare the diagnostic rate of FNAC and FNAC-Tg.The FNAC-Tg receiver operating characteristic curve wasdeveloped using MedCalc 6.1 software (MedCalc Software,Mariakerke, Belgium). The cut-off values which maximisethe sum of sensitivity plus specificity were determined as thepoints in the upper left hand corner. A P value < .05 wasconsidered to indicate statistical significance.
3. Results
Patients characteristics and cytological, pathological, andbiochemical data are displayed in Table 1. Of the 126lymph node lesions assessed for postoperative recurrencesby US-guided FNAC and FNAC-Tg, 86 (68%) lesions werefinally diagnosed as malignant and the remaining 40 (32%)lesions were diagnosed as benign LNs, respectively. Thefinal diagnosis of the 86 malignant and 8 benign LN wasestablished by surgical pathology; the remaining 32 benignlesions were diagnosed based on imaging follow up after atleast 1 year. The time from thyroid ablation to US-FNACwas 19.5 ± 14.31 and 19.4 ± 13.76 months in patients withbenign and malignant lesions, respectively (P not signifi-cant). Serum Tg levels were higher in patients with malignantlesions (median 4.20 ng/mL, range <0.2–27.10 ng/mL) thanthose with benign lesions (median .80 ng/mL, range <0.2–2.70 ng/mL; P < .0001). Serum TgAb were positive in 11

Journal of Thyroid Research 3
Table 1: Patients characteristics and cytological, pathological, and biochemical data.
Patients Histology pTNMDuration(months)
Tg(ng/mL)
TgAb(IU/mL)
Lesions SitesFNA Final
diagnosisCytology
Tg(ng/mL)
1 PTC pT1N1Mx 6 1.0 <60 1 R II ND <0.2 B
2 PTC pT1NxMx 15 4.6 <60 1 L III Negative 435.2 M
3 PTC pT1NxMx 18 1.7 <60 1 R IV CTM 85.3 M
4 PTC pT1NxMx 30 0.4 <60 1 R III ND <0.2 B
5 PTC pT1N0Mx 6 3.1 <60 1 L II ND 97.2 M
6 PTC pT2N0Mx 19 9.1 <60 2 R IV, VI CTM 118.5 M
7 PTC pT2NxMx 47 <0.2 334 1 L IV CTM 879.4 M
8 PTC pT2N1Mx 6 0.9 78 1 VI Negative 1.1 B
9 PTC pT1N1Mx 9 9.8 <60 1 L II ND 1348.6 M
10 PTC pT2N0Mx 14 1.5 <60 1 L III CTM 358.5 M
11 PTC pT1NxMx 8 12.6 <60 3 R II CTM 2387.4 M
12 PTC pT2NxMx 16 9.7 <60 1 R III CTM 875.9 M
13 PTC pT1NxMx 9 6.3 <60 1 R II CTM 958.6 M
14 PTC pT1N0Mx 11 1.0 <60 1 L III Negative 48.7 M
15 PTC pT2N1Mx 39 9.5 <60 1 L IV CTM >3000 M
16 PTC pT1NxMx 12 0.8 <60 1 L III CTM 107.5 M
17 PTC pT2NxMx 19 2.7 <60 3 R III-IV ND, CTM 541.6RIII B, IV
M
18 PTC pT4N1Mx 6 1.6 <60 1 L III CTM 31.8 M
19 PTC pT1N1Mx 15 0.5 289 1 R IV ND <0.2 B
20 PTC pT2N1Mx 3 2.3 <60 1 L III ND 540.7 M
21 PTC pT1NxMx 34 4.1 <60 1 L III CTM 650.6 M
22 PTC pT2N1Mx 8 <0.2 98 1 L II ND 5.8 M
23 PTC pT1NxMx 9 0.8 <60 2 R II, R III CTM 87.5 M
24 PTC pT4N0Mx 10 1.4 755 1 R II CTM 196.4 M
25 PTC pT2NxMx 21 11 <60 1 R III ND 585.3 M
26 PTC pT1NxMx 9 <0.2 <60 1 R III Negative <0.2 B
27 PTC pT4N1M 12 1.1 160 1 L III Negative 0.3 B
28 PTC pT1N0Mx 23 5.3 <60 1 R III CTM 784.2 M
29 PTC pT2N1Mx 5 <0.2 >1000 1 R III ND <0.2 B
30 PTC pT2N0Mx 22 4.9 <60 1 R III CTM 641.5 M
31 PTC pT1NxMx 36 0.3 367 1 R IV Negative <0.2 B
32 PTC pT1NxMx 15 7.1 <60 1 R III ND 665.4 M
33 PTC pT2N0Mx 41 <0.2 <60 1 L II Negative <0.2 B
34 PTC pT1NxMx 24 2.6 <60 1 R III CTM 570.6 M
35 PTC pT4N0Mx 31 1.4 >1000 3 L IV, VI CTM 96.7 M
36 PTC pT4N1M 12 27.1 <60 1 R II CTM 2987.3 M
37 PTC pT1N1Mx 54 6.8 <60 1 L III CTM 875.6 M
38 PTC pT2NxMx 12 <0.2 149 1 R IV Negative <0.2 B
39 PTC pT2N0Mx 9 0.9 <60 1 R II Negative <0.2 B
40 PTC pT1N0Mx 34 2.4 89 1 L III ND 347.4 M
41 PTC pT2NxMx 14 5.1 <60 1 L IV ND 1655.7 M
42 PTC pT4N1M 8 7.7 <60 1 L III Negative 2076.5 M
43 PTC pT1NxMx 61 1.1 <60 1 VI Negative <0.2 B
44 PTC pT2N0Mx 22 1.0 <60 1 L II CTM 90.6 M
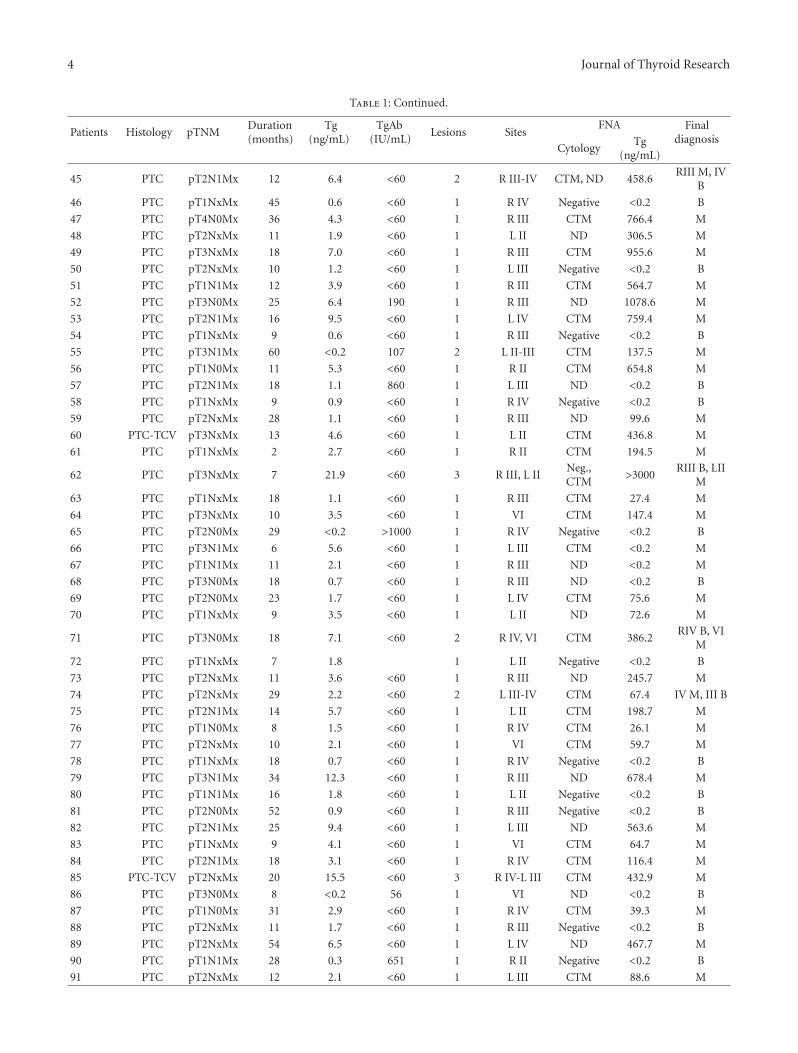
4 Journal of Thyroid Research
Table 1: Continued.
Patients Histology pTNMDuration(months)
Tg(ng/mL)
TgAb(IU/mL)
Lesions SitesFNA Final
diagnosisCytology
Tg(ng/mL)
45 PTC pT2N1Mx 12 6.4 <60 2 R III-IV CTM, ND 458.6RIII M, IV
B
46 PTC pT1NxMx 45 0.6 <60 1 R IV Negative <0.2 B
47 PTC pT4N0Mx 36 4.3 <60 1 R III CTM 766.4 M
48 PTC pT2NxMx 11 1.9 <60 1 L II ND 306.5 M
49 PTC pT3NxMx 18 7.0 <60 1 R III CTM 955.6 M
50 PTC pT2NxMx 10 1.2 <60 1 L III Negative <0.2 B
51 PTC pT1N1Mx 12 3.9 <60 1 R III CTM 564.7 M
52 PTC pT3N0Mx 25 6.4 190 1 R III ND 1078.6 M
53 PTC pT2N1Mx 16 9.5 <60 1 L IV CTM 759.4 M
54 PTC pT1NxMx 9 0.6 <60 1 R III Negative <0.2 B
55 PTC pT3N1Mx 60 <0.2 107 2 L II-III CTM 137.5 M
56 PTC pT1N0Mx 11 5.3 <60 1 R II CTM 654.8 M
57 PTC pT2N1Mx 18 1.1 860 1 L III ND <0.2 B
58 PTC pT1NxMx 9 0.9 <60 1 R IV Negative <0.2 B
59 PTC pT2NxMx 28 1.1 <60 1 R III ND 99.6 M
60 PTC-TCV pT3NxMx 13 4.6 <60 1 L II CTM 436.8 M
61 PTC pT1NxMx 2 2.7 <60 1 R II CTM 194.5 M
62 PTC pT3NxMx 7 21.9 <60 3 R III, L IINeg.,CTM
>3000RIII B, LII
M
63 PTC pT1NxMx 18 1.1 <60 1 R III CTM 27.4 M
64 PTC pT3NxMx 10 3.5 <60 1 VI CTM 147.4 M
65 PTC pT2N0Mx 29 <0.2 >1000 1 R IV Negative <0.2 B
66 PTC pT3N1Mx 6 5.6 <60 1 L III CTM <0.2 M
67 PTC pT1N1Mx 11 2.1 <60 1 R III ND <0.2 M
68 PTC pT3N0Mx 18 0.7 <60 1 R III ND <0.2 B
69 PTC pT2N0Mx 23 1.7 <60 1 L IV CTM 75.6 M
70 PTC pT1NxMx 9 3.5 <60 1 L II ND 72.6 M
71 PTC pT3N0Mx 18 7.1 <60 2 R IV, VI CTM 386.2RIV B, VI
M
72 PTC pT1NxMx 7 1.8 1 L II Negative <0.2 B
73 PTC pT2NxMx 11 3.6 <60 1 R III ND 245.7 M
74 PTC pT2NxMx 29 2.2 <60 2 L III-IV CTM 67.4 IV M, III B
75 PTC pT2N1Mx 14 5.7 <60 1 L II CTM 198.7 M
76 PTC pT1N0Mx 8 1.5 <60 1 R IV CTM 26.1 M
77 PTC pT2NxMx 10 2.1 <60 1 VI CTM 59.7 M
78 PTC pT1NxMx 18 0.7 <60 1 R IV Negative <0.2 B
79 PTC pT3N1Mx 34 12.3 <60 1 R III ND 678.4 M
80 PTC pT1N1Mx 16 1.8 <60 1 L II Negative <0.2 B
81 PTC pT2N0Mx 52 0.9 <60 1 R III Negative <0.2 B
82 PTC pT2N1Mx 25 9.4 <60 1 L III ND 563.6 M
83 PTC pT1NxMx 9 4.1 <60 1 VI CTM 64.7 M
84 PTC pT2N1Mx 18 3.1 <60 1 R IV CTM 116.4 M
85 PTC-TCV pT2NxMx 20 15.5 <60 3 R IV-L III CTM 432.9 M
86 PTC pT3N0Mx 8 <0.2 56 1 VI ND <0.2 B
87 PTC pT1N0Mx 31 2.9 <60 1 R IV CTM 39.3 M
88 PTC pT2NxMx 11 1.7 <60 1 R III Negative <0.2 B
89 PTC pT2NxMx 54 6.5 <60 1 L IV ND 467.7 M
90 PTC pT1N1Mx 28 0.3 651 1 R II Negative <0.2 B
91 PTC pT2NxMx 12 2.1 <60 1 L III CTM 88.6 M
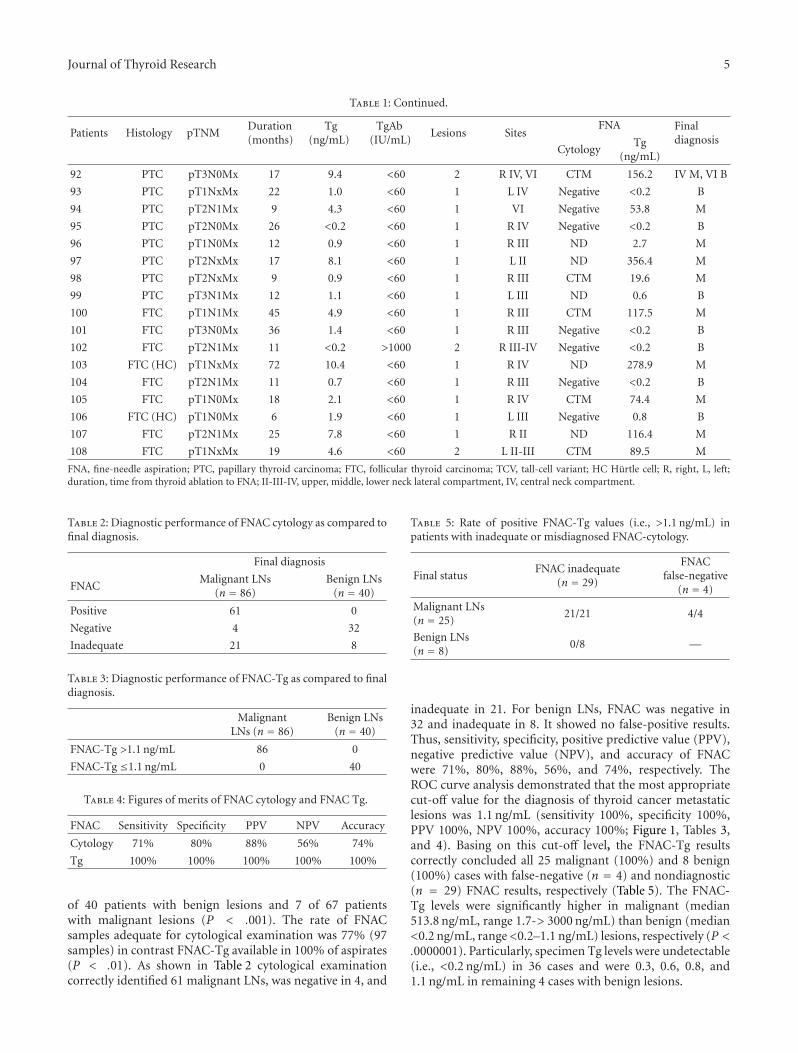
Journal of Thyroid Research 5
Table 1: Continued.
Patients Histology pTNMDuration(months)
Tg(ng/mL)
TgAb(IU/mL)
Lesions SitesFNA Final
diagnosisCytology
Tg(ng/mL)
92 PTC pT3N0Mx 17 9.4 <60 2 R IV, VI CTM 156.2 IV M, VI B
93 PTC pT1NxMx 22 1.0 <60 1 L IV Negative <0.2 B
94 PTC pT2N1Mx 9 4.3 <60 1 VI Negative 53.8 M
95 PTC pT2N0Mx 26 <0.2 <60 1 R IV Negative <0.2 B
96 PTC pT1N0Mx 12 0.9 <60 1 R III ND 2.7 M
97 PTC pT2NxMx 17 8.1 <60 1 L II ND 356.4 M
98 PTC pT2NxMx 9 0.9 <60 1 R III CTM 19.6 M
99 PTC pT3N1Mx 12 1.1 <60 1 L III ND 0.6 B
100 FTC pT1N1Mx 45 4.9 <60 1 R III CTM 117.5 M
101 FTC pT3N0Mx 36 1.4 <60 1 R III Negative <0.2 B
102 FTC pT2N1Mx 11 <0.2 >1000 2 R III-IV Negative <0.2 B
103 FTC (HC) pT1NxMx 72 10.4 <60 1 R IV ND 278.9 M
104 FTC pT2N1Mx 11 0.7 <60 1 R III Negative <0.2 B
105 FTC pT1N0Mx 18 2.1 <60 1 R IV CTM 74.4 M
106 FTC (HC) pT1N0Mx 6 1.9 <60 1 L III Negative 0.8 B
107 FTC pT2N1Mx 25 7.8 <60 1 R II ND 116.4 M
108 FTC pT1NxMx 19 4.6 <60 2 L II-III CTM 89.5 M
FNA, fine-needle aspiration; PTC, papillary thyroid carcinoma; FTC, follicular thyroid carcinoma; TCV, tall-cell variant; HC Hurtle cell; R, right, L, left;duration, time from thyroid ablation to FNA; II-III-IV, upper, middle, lower neck lateral compartment, IV, central neck compartment.
Table 2: Diagnostic performance of FNAC cytology as compared tofinal diagnosis.
Final diagnosis
FNACMalignant LNs
(n = 86)Benign LNs
(n = 40)
Positive 61 0
Negative 4 32
Inadequate 21 8
Table 3: Diagnostic performance of FNAC-Tg as compared to finaldiagnosis.
MalignantLNs (n = 86)
Benign LNs(n = 40)
FNAC-Tg >1.1 ng/mL 86 0
FNAC-Tg ≤1.1 ng/mL 0 40
Table 4: Figures of merits of FNAC cytology and FNAC Tg.
FNAC Sensitivity Specificity PPV NPV Accuracy
Cytology 71% 80% 88% 56% 74%
Tg 100% 100% 100% 100% 100%
of 40 patients with benign lesions and 7 of 67 patientswith malignant lesions (P < .001). The rate of FNACsamples adequate for cytological examination was 77% (97samples) in contrast FNAC-Tg available in 100% of aspirates(P < .01). As shown in Table 2 cytological examinationcorrectly identified 61 malignant LNs, was negative in 4, and
Table 5: Rate of positive FNAC-Tg values (i.e., >1.1 ng/mL) inpatients with inadequate or misdiagnosed FNAC-cytology.
Final statusFNAC inadequate
(n = 29)
FNACfalse-negative
(n = 4)
Malignant LNs(n = 25)
21/21 4/4
Benign LNs(n = 8)
0/8 —
inadequate in 21. For benign LNs, FNAC was negative in32 and inadequate in 8. It showed no false-positive results.Thus, sensitivity, specificity, positive predictive value (PPV),negative predictive value (NPV), and accuracy of FNACwere 71%, 80%, 88%, 56%, and 74%, respectively. TheROC curve analysis demonstrated that the most appropriatecut-off value for the diagnosis of thyroid cancer metastaticlesions was 1.1 ng/mL (sensitivity 100%, specificity 100%,PPV 100%, NPV 100%, accuracy 100%; Figure 1, Tables 3,and 4). Basing on this cut-off level, the FNAC-Tg resultscorrectly concluded all 25 malignant (100%) and 8 benign(100%) cases with false-negative (n = 4) and nondiagnostic(n = 29) FNAC results, respectively (Table 5). The FNAC-Tg levels were significantly higher in malignant (median513.8 ng/mL, range 1.7-> 3000 ng/mL) than benign (median<0.2 ng/mL, range <0.2–1.1 ng/mL) lesions, respectively (P <.0000001). Particularly, specimen Tg levels were undetectable(i.e., <0.2 ng/mL) in 36 cases and were 0.3, 0.6, 0.8, and1.1 ng/mL in remaining 4 cases with benign lesions.
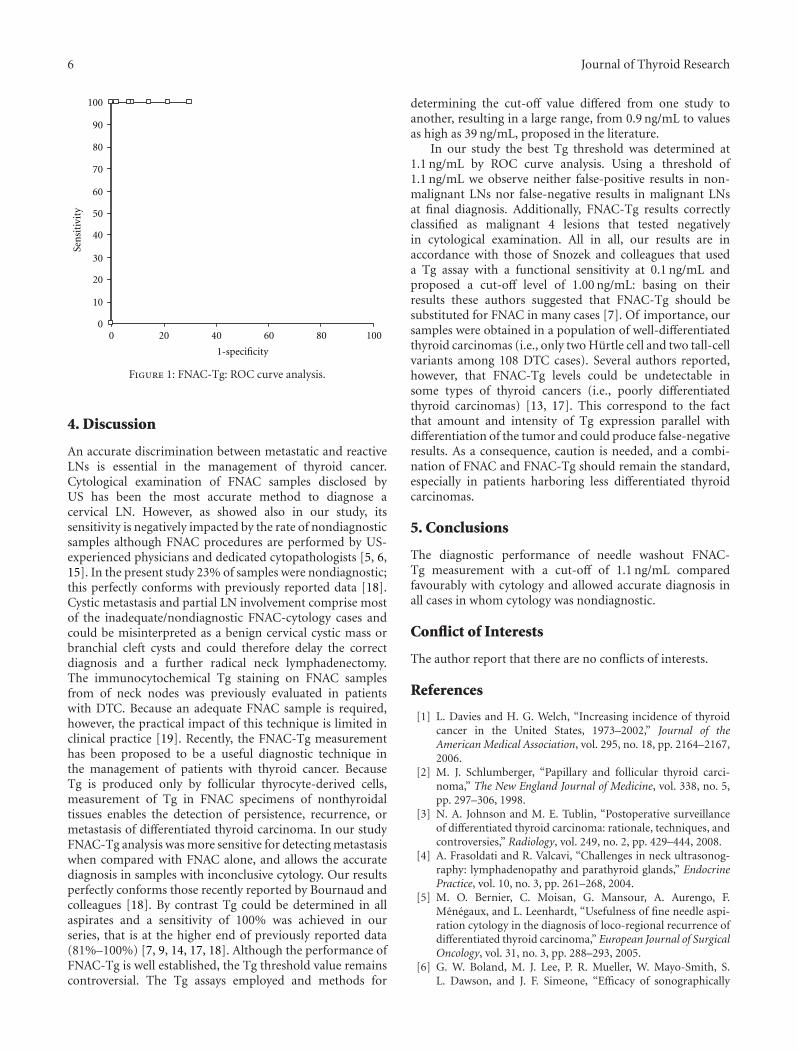
6 Journal of Thyroid Research
0
10
20
30
40
50
60
70
80
90
100
0 20 40 60 80 100
1-specificity
Sen
siti
vity
Figure 1: FNAC-Tg: ROC curve analysis.
4. Discussion
An accurate discrimination between metastatic and reactiveLNs is essential in the management of thyroid cancer.Cytological examination of FNAC samples disclosed byUS has been the most accurate method to diagnose acervical LN. However, as showed also in our study, itssensitivity is negatively impacted by the rate of nondiagnosticsamples although FNAC procedures are performed by US-experienced physicians and dedicated cytopathologists [5, 6,15]. In the present study 23% of samples were nondiagnostic;this perfectly conforms with previously reported data [18].Cystic metastasis and partial LN involvement comprise mostof the inadequate/nondiagnostic FNAC-cytology cases andcould be misinterpreted as a benign cervical cystic mass orbranchial cleft cysts and could therefore delay the correctdiagnosis and a further radical neck lymphadenectomy.The immunocytochemical Tg staining on FNAC samplesfrom of neck nodes was previously evaluated in patientswith DTC. Because an adequate FNAC sample is required,however, the practical impact of this technique is limited inclinical practice [19]. Recently, the FNAC-Tg measurementhas been proposed to be a useful diagnostic technique inthe management of patients with thyroid cancer. BecauseTg is produced only by follicular thyrocyte-derived cells,measurement of Tg in FNAC specimens of nonthyroidaltissues enables the detection of persistence, recurrence, ormetastasis of differentiated thyroid carcinoma. In our studyFNAC-Tg analysis was more sensitive for detecting metastasiswhen compared with FNAC alone, and allows the accuratediagnosis in samples with inconclusive cytology. Our resultsperfectly conforms those recently reported by Bournaud andcolleagues [18]. By contrast Tg could be determined in allaspirates and a sensitivity of 100% was achieved in ourseries, that is at the higher end of previously reported data(81%–100%) [7, 9, 14, 17, 18]. Although the performance ofFNAC-Tg is well established, the Tg threshold value remainscontroversial. The Tg assays employed and methods for
determining the cut-off value differed from one study toanother, resulting in a large range, from 0.9 ng/mL to valuesas high as 39 ng/mL, proposed in the literature.
In our study the best Tg threshold was determined at1.1 ng/mL by ROC curve analysis. Using a threshold of1.1 ng/mL we observe neither false-positive results in non-malignant LNs nor false-negative results in malignant LNsat final diagnosis. Additionally, FNAC-Tg results correctlyclassified as malignant 4 lesions that tested negativelyin cytological examination. All in all, our results are inaccordance with those of Snozek and colleagues that useda Tg assay with a functional sensitivity at 0.1 ng/mL andproposed a cut-off level of 1.00 ng/mL: basing on theirresults these authors suggested that FNAC-Tg should besubstituted for FNAC in many cases [7]. Of importance, oursamples were obtained in a population of well-differentiatedthyroid carcinomas (i.e., only two Hurtle cell and two tall-cellvariants among 108 DTC cases). Several authors reported,however, that FNAC-Tg levels could be undetectable insome types of thyroid cancers (i.e., poorly differentiatedthyroid carcinomas) [13, 17]. This correspond to the factthat amount and intensity of Tg expression parallel withdifferentiation of the tumor and could produce false-negativeresults. As a consequence, caution is needed, and a combi-nation of FNAC and FNAC-Tg should remain the standard,especially in patients harboring less differentiated thyroidcarcinomas.
5. Conclusions
The diagnostic performance of needle washout FNAC-Tg measurement with a cut-off of 1.1 ng/mL comparedfavourably with cytology and allowed accurate diagnosis inall cases in whom cytology was nondiagnostic.
Conflict of Interests
The author report that there are no conflicts of interests.
References
[1] L. Davies and H. G. Welch, “Increasing incidence of thyroidcancer in the United States, 1973–2002,” Journal of theAmerican Medical Association, vol. 295, no. 18, pp. 2164–2167,2006.
[2] M. J. Schlumberger, “Papillary and follicular thyroid carci-noma,” The New England Journal of Medicine, vol. 338, no. 5,pp. 297–306, 1998.
[3] N. A. Johnson and M. E. Tublin, “Postoperative surveillanceof differentiated thyroid carcinoma: rationale, techniques, andcontroversies,” Radiology, vol. 249, no. 2, pp. 429–444, 2008.
[4] A. Frasoldati and R. Valcavi, “Challenges in neck ultrasonog-raphy: lymphadenopathy and parathyroid glands,” EndocrinePractice, vol. 10, no. 3, pp. 261–268, 2004.
[5] M. O. Bernier, C. Moisan, G. Mansour, A. Aurengo, F.Menegaux, and L. Leenhardt, “Usefulness of fine needle aspi-ration cytology in the diagnosis of loco-regional recurrence ofdifferentiated thyroid carcinoma,” European Journal of SurgicalOncology, vol. 31, no. 3, pp. 288–293, 2005.
[6] G. W. Boland, M. J. Lee, P. R. Mueller, W. Mayo-Smith, S.L. Dawson, and J. F. Simeone, “Efficacy of sonographically
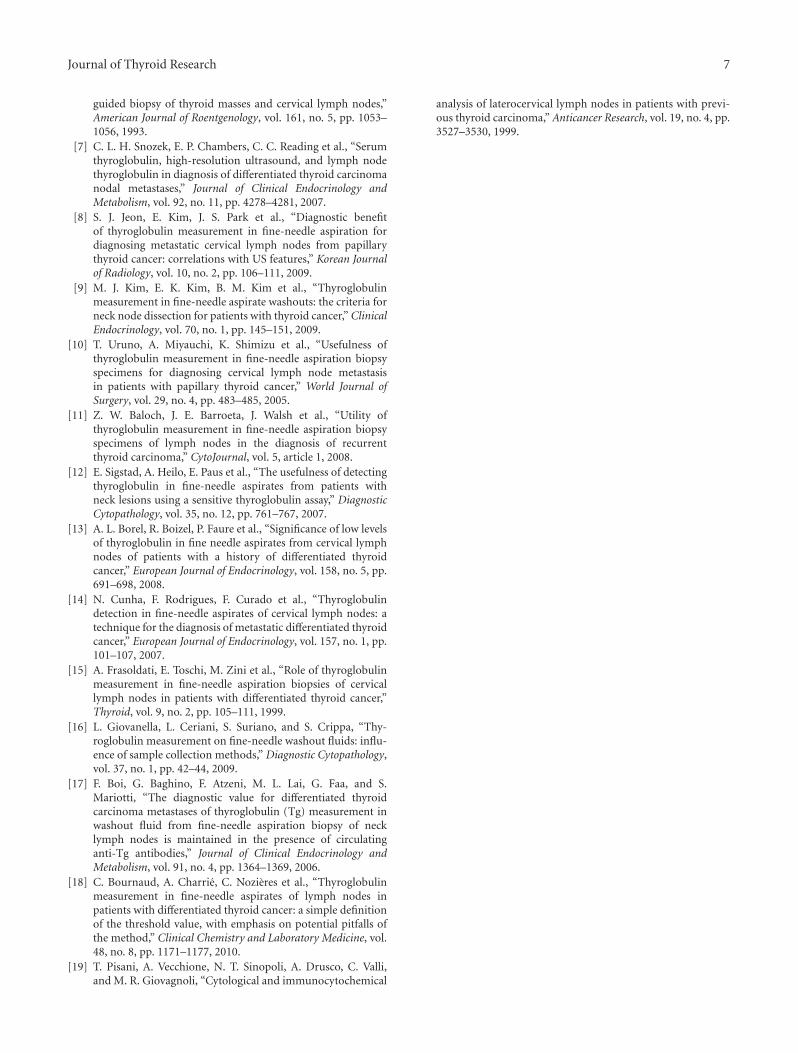
Journal of Thyroid Research 7
guided biopsy of thyroid masses and cervical lymph nodes,”American Journal of Roentgenology, vol. 161, no. 5, pp. 1053–1056, 1993.
[7] C. L. H. Snozek, E. P. Chambers, C. C. Reading et al., “Serumthyroglobulin, high-resolution ultrasound, and lymph nodethyroglobulin in diagnosis of differentiated thyroid carcinomanodal metastases,” Journal of Clinical Endocrinology andMetabolism, vol. 92, no. 11, pp. 4278–4281, 2007.
[8] S. J. Jeon, E. Kim, J. S. Park et al., “Diagnostic benefitof thyroglobulin measurement in fine-needle aspiration fordiagnosing metastatic cervical lymph nodes from papillarythyroid cancer: correlations with US features,” Korean Journalof Radiology, vol. 10, no. 2, pp. 106–111, 2009.
[9] M. J. Kim, E. K. Kim, B. M. Kim et al., “Thyroglobulinmeasurement in fine-needle aspirate washouts: the criteria forneck node dissection for patients with thyroid cancer,” ClinicalEndocrinology, vol. 70, no. 1, pp. 145–151, 2009.
[10] T. Uruno, A. Miyauchi, K. Shimizu et al., “Usefulness ofthyroglobulin measurement in fine-needle aspiration biopsyspecimens for diagnosing cervical lymph node metastasisin patients with papillary thyroid cancer,” World Journal ofSurgery, vol. 29, no. 4, pp. 483–485, 2005.
[11] Z. W. Baloch, J. E. Barroeta, J. Walsh et al., “Utility ofthyroglobulin measurement in fine-needle aspiration biopsyspecimens of lymph nodes in the diagnosis of recurrentthyroid carcinoma,” CytoJournal, vol. 5, article 1, 2008.
[12] E. Sigstad, A. Heilo, E. Paus et al., “The usefulness of detectingthyroglobulin in fine-needle aspirates from patients withneck lesions using a sensitive thyroglobulin assay,” DiagnosticCytopathology, vol. 35, no. 12, pp. 761–767, 2007.
[13] A. L. Borel, R. Boizel, P. Faure et al., “Significance of low levelsof thyroglobulin in fine needle aspirates from cervical lymphnodes of patients with a history of differentiated thyroidcancer,” European Journal of Endocrinology, vol. 158, no. 5, pp.691–698, 2008.
[14] N. Cunha, F. Rodrigues, F. Curado et al., “Thyroglobulindetection in fine-needle aspirates of cervical lymph nodes: atechnique for the diagnosis of metastatic differentiated thyroidcancer,” European Journal of Endocrinology, vol. 157, no. 1, pp.101–107, 2007.
[15] A. Frasoldati, E. Toschi, M. Zini et al., “Role of thyroglobulinmeasurement in fine-needle aspiration biopsies of cervicallymph nodes in patients with differentiated thyroid cancer,”Thyroid, vol. 9, no. 2, pp. 105–111, 1999.
[16] L. Giovanella, L. Ceriani, S. Suriano, and S. Crippa, “Thy-roglobulin measurement on fine-needle washout fluids: influ-ence of sample collection methods,” Diagnostic Cytopathology,vol. 37, no. 1, pp. 42–44, 2009.
[17] F. Boi, G. Baghino, F. Atzeni, M. L. Lai, G. Faa, and S.Mariotti, “The diagnostic value for differentiated thyroidcarcinoma metastases of thyroglobulin (Tg) measurement inwashout fluid from fine-needle aspiration biopsy of necklymph nodes is maintained in the presence of circulatinganti-Tg antibodies,” Journal of Clinical Endocrinology andMetabolism, vol. 91, no. 4, pp. 1364–1369, 2006.
[18] C. Bournaud, A. Charrie, C. Nozieres et al., “Thyroglobulinmeasurement in fine-needle aspirates of lymph nodes inpatients with differentiated thyroid cancer: a simple definitionof the threshold value, with emphasis on potential pitfalls ofthe method,” Clinical Chemistry and Laboratory Medicine, vol.48, no. 8, pp. 1171–1177, 2010.
[19] T. Pisani, A. Vecchione, N. T. Sinopoli, A. Drusco, C. Valli,and M. R. Giovagnoli, “Cytological and immunocytochemical
analysis of laterocervical lymph nodes in patients with previ-ous thyroid carcinoma,” Anticancer Research, vol. 19, no. 4, pp.3527–3530, 1999.
SAGE-Hindawi Access to ResearchJournal of Thyroid ResearchVolume 2011, Article ID 270149, 10 pagesdoi:10.4061/2011/270149
Research Article
Clinical Utility of Serum Interleukin-8 andInterferon-Alpha in Thyroid Diseases
Toral P. Kobawala,1 Girish H. Patel,1, 2 Dhara R. Gajjar,1 Kamini N. Patel,1 Premal B. Thakor,3
Urvi B. Parekh,3 Kirti M. Patel,4 Shilin N. Shukla,4 and Pankaj M. Shah4
1 Division of Molecular Endocrinology, The Gujarat Cancer and Research Institute, NCH Compound, Asarwa,Ahmedabad 380 016, India
2 Clinical Biochemistry Laboratory, The Gujarat Cancer and Research Institute, NCH Compound, Asarwa,Ahmedabad 380 016, India
3 Clinical Endocrinology Department, The Gujarat Cancer and Research Institute, NCH Compound, Asarwa,Ahmedabad 380 016, India
4 Medical Oncology, The Gujarat Cancer and Research Institute, NCH Compound, Asarwa,Ahmedabad 380 016, India
Correspondence should be addressed to Girish H. Patel, ghpatel [email protected]
Received 19 August 2010; Revised 2 December 2010; Accepted 16 December 2010
Academic Editor: Oliver Gimm
Copyright © 2011 Toral P. Kobawala et al. This is an open access article distributed under the Creative Commons AttributionLicense, which permits unrestricted use, distribution, and reproduction in any medium, provided the original work is properlycited.
Serum interleukin-8 (IL-8) and interferon-alpha (IFN-α) levels have been estimated from a total of 88 individuals of which 19were disease-free healthy individuals, and 69 were patients with thyroid diseases: goitre (N = 21), autoimmune diseases (N = 16),and carcinomas (N = 32). Both IL-8 and IFN-α were significantly higher in all the patients as compared to healthy individuals.Serum IL-8 levels showed significant positive correlation with disease stage in thyroid cancer patients. Higher serum IL-8 levelswere associated with advanced disease stage while no significant correlation was observed between serum IFN-α levels and anyof the clinicopathological parameters. IL-8 and IFN-α significantly correlated with each other in anaplastic carcinoma patients.Finally concluding, monitoring the serum IL-8 and IFN-α levels can help differentiate patients with thyroid diseases from healthyindividuals, and IL-8 seems to have a role in the pathogenesis of thyroid diseases and may represent a target for innovativediagnostic and therapeutic strategies.
1. Introduction
Although thyroid problems are among the most commonmedical conditions, because their symptoms often appeargradually, they are commonly misdiagnosed. The three mostcommon thyroid problems are the underactive thyroid, theoveractive thyroid, and thyroid nodules [1]. Based on theseproblems, the disorders of the thyroid gland include: goitre,autoimmune thyroid diseases, as well as thyroid carcinoma.
Thyroid cancer is the fastest growing and most commoncancer of the total endocrine malignancies, accounting for94.5% of the total new endocrine cancers and 65.9% of thedeaths due to endocrine cancers. It is the endocrine tumorthat bears the highest incidence with 33 550 new cases peryear in the US [2]. The vast majority of patients with thyroid
diseases are curable using present treatment modalities.However, accumulating evidences indicate that follicularcell-derived thyroid cancer constitutes a biological contin-uum progressing from the highly curable well-differentiatedthyroid cancer to the universally fatal anaplastic thyroidcancer [3, 4]. An association between thyroid cancer anda history of several benign diseases has been observed inmost studies [5, 6]. However, the molecular mechanismsunderlying thyroid cancer progression remain ill-defined. Soit is important to decipher these mechanisms, since poorlydifferentiated and anaplastic carcinomas account for themajority of thyroid cancer-related deaths.
Moreover, accumulated epidemiologic studies supportthat chronic inflammatory diseases are frequently associatedwith increased risk of cancers [7–9]. It is estimated that
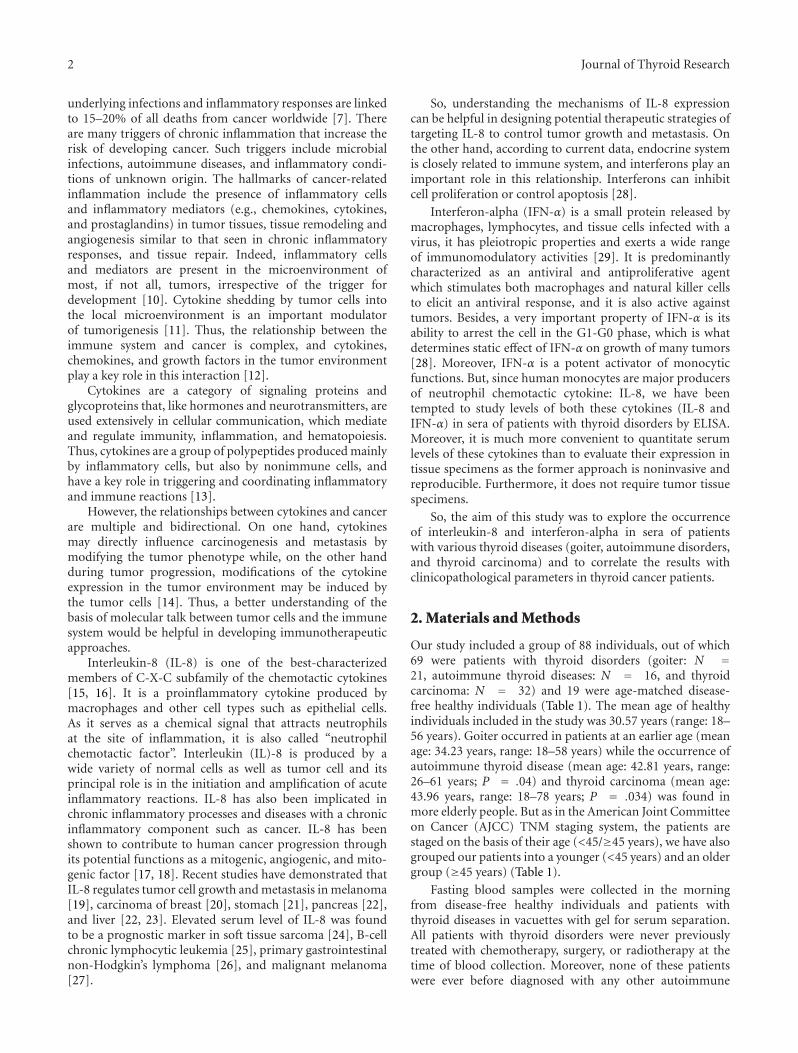
2 Journal of Thyroid Research
underlying infections and inflammatory responses are linkedto 15–20% of all deaths from cancer worldwide [7]. Thereare many triggers of chronic inflammation that increase therisk of developing cancer. Such triggers include microbialinfections, autoimmune diseases, and inflammatory condi-tions of unknown origin. The hallmarks of cancer-relatedinflammation include the presence of inflammatory cellsand inflammatory mediators (e.g., chemokines, cytokines,and prostaglandins) in tumor tissues, tissue remodeling andangiogenesis similar to that seen in chronic inflammatoryresponses, and tissue repair. Indeed, inflammatory cellsand mediators are present in the microenvironment ofmost, if not all, tumors, irrespective of the trigger fordevelopment [10]. Cytokine shedding by tumor cells intothe local microenvironment is an important modulatorof tumorigenesis [11]. Thus, the relationship between theimmune system and cancer is complex, and cytokines,chemokines, and growth factors in the tumor environmentplay a key role in this interaction [12].
Cytokines are a category of signaling proteins andglycoproteins that, like hormones and neurotransmitters, areused extensively in cellular communication, which mediateand regulate immunity, inflammation, and hematopoiesis.Thus, cytokines are a group of polypeptides produced mainlyby inflammatory cells, but also by nonimmune cells, andhave a key role in triggering and coordinating inflammatoryand immune reactions [13].
However, the relationships between cytokines and cancerare multiple and bidirectional. On one hand, cytokinesmay directly influence carcinogenesis and metastasis bymodifying the tumor phenotype while, on the other handduring tumor progression, modifications of the cytokineexpression in the tumor environment may be induced bythe tumor cells [14]. Thus, a better understanding of thebasis of molecular talk between tumor cells and the immunesystem would be helpful in developing immunotherapeuticapproaches.
Interleukin-8 (IL-8) is one of the best-characterizedmembers of C-X-C subfamily of the chemotactic cytokines[15, 16]. It is a proinflammatory cytokine produced bymacrophages and other cell types such as epithelial cells.As it serves as a chemical signal that attracts neutrophilsat the site of inflammation, it is also called “neutrophilchemotactic factor”. Interleukin (IL)-8 is produced by awide variety of normal cells as well as tumor cell and itsprincipal role is in the initiation and amplification of acuteinflammatory reactions. IL-8 has also been implicated inchronic inflammatory processes and diseases with a chronicinflammatory component such as cancer. IL-8 has beenshown to contribute to human cancer progression throughits potential functions as a mitogenic, angiogenic, and mito-genic factor [17, 18]. Recent studies have demonstrated thatIL-8 regulates tumor cell growth and metastasis in melanoma[19], carcinoma of breast [20], stomach [21], pancreas [22],and liver [22, 23]. Elevated serum level of IL-8 was foundto be a prognostic marker in soft tissue sarcoma [24], B-cellchronic lymphocytic leukemia [25], primary gastrointestinalnon-Hodgkin’s lymphoma [26], and malignant melanoma[27].
So, understanding the mechanisms of IL-8 expressioncan be helpful in designing potential therapeutic strategies oftargeting IL-8 to control tumor growth and metastasis. Onthe other hand, according to current data, endocrine systemis closely related to immune system, and interferons play animportant role in this relationship. Interferons can inhibitcell proliferation or control apoptosis [28].
Interferon-alpha (IFN-α) is a small protein released bymacrophages, lymphocytes, and tissue cells infected with avirus, it has pleiotropic properties and exerts a wide rangeof immunomodulatory activities [29]. It is predominantlycharacterized as an antiviral and antiproliferative agentwhich stimulates both macrophages and natural killer cellsto elicit an antiviral response, and it is also active againsttumors. Besides, a very important property of IFN-α is itsability to arrest the cell in the G1-G0 phase, which is whatdetermines static effect of IFN-α on growth of many tumors[28]. Moreover, IFN-α is a potent activator of monocyticfunctions. But, since human monocytes are major producersof neutrophil chemotactic cytokine: IL-8, we have beentempted to study levels of both these cytokines (IL-8 andIFN-α) in sera of patients with thyroid disorders by ELISA.Moreover, it is much more convenient to quantitate serumlevels of these cytokines than to evaluate their expression intissue specimens as the former approach is noninvasive andreproducible. Furthermore, it does not require tumor tissuespecimens.
So, the aim of this study was to explore the occurrenceof interleukin-8 and interferon-alpha in sera of patientswith various thyroid diseases (goiter, autoimmune disorders,and thyroid carcinoma) and to correlate the results withclinicopathological parameters in thyroid cancer patients.
2. Materials and Methods
Our study included a group of 88 individuals, out of which69 were patients with thyroid disorders (goiter: N =21, autoimmune thyroid diseases: N = 16, and thyroidcarcinoma: N = 32) and 19 were age-matched disease-free healthy individuals (Table 1). The mean age of healthyindividuals included in the study was 30.57 years (range: 18–56 years). Goiter occurred in patients at an earlier age (meanage: 34.23 years, range: 18–58 years) while the occurrence ofautoimmune thyroid disease (mean age: 42.81 years, range:26–61 years; P = .04) and thyroid carcinoma (mean age:43.96 years, range: 18–78 years; P = .034) was found inmore elderly people. But as in the American Joint Committeeon Cancer (AJCC) TNM staging system, the patients arestaged on the basis of their age (<45/≥45 years), we have alsogrouped our patients into a younger (<45 years) and an oldergroup (≥45 years) (Table 1).
Fasting blood samples were collected in the morningfrom disease-free healthy individuals and patients withthyroid diseases in vacuettes with gel for serum separation.All patients with thyroid disorders were never previouslytreated with chemotherapy, surgery, or radiotherapy at thetime of blood collection. Moreover, none of these patientswere ever before diagnosed with any other autoimmune

Journal of Thyroid Research 3
Table 1: Characterization of patients with thyroid diseases and healthy individuals.
Subjects N (%)Gender Age
Male Female <45 years ≥45 years
Healthy individuals 19 6 13 15 4
Total Patients 69 16 53 40 29
Goiter 21 (30.43) 3 18 14 7
Autoimmune diseases 16 (23.18) 4 12 9 7
Graves’ disease 12 (17.38) 4 8 7 5
Hashimoto’s disorder 4 (5.79) — 4 2 2
Thyroid carcinoma 32 (46.37) 9 23 17 15
Papillary 18 (26.07) 3 15 12 6
Follicular 7 (10.14) 2 5 2 5
Medullary 4 (5.79) 2 2 2 2
Anaplastic 3 (4.34) 2 1 1 2
disease, no one of them was taking immunosuppressiveor immunomodulant drugs. Prior to pretherapeutic bloodcollection, written consent of the patients was taken.Serums were separated from all blood samples aftercentrifugation and were stored at −80◦C until analysis. IL-8and IFN-α were determined from the serum samples usingcommercially available enzyme immunoassay (EIA) kitsfrom Immunotech (A Beckman Coulter Company, France)following the manufacturer’s instructions. The detailedclinical and histopathological characteristics of all patientswere noted from the case files maintained at Gujarat Cancerand Research Institute (Table 2).
2.1. Statistical Analysis. The results were presented as mean± standard error of mean (M ± S.E.). Mann-Whitney U testwas performed to assess the differences in serum IL-8 andIFN-α levels between healthy individuals and patients withthyroid diseases. Receiver’s operating characteristic (ROC)curves were also constructed to determine the discriminatingefficacy of IL-8 and IFN-α between healthy individuals andpatients with thyroid diseases. P values <.05 were consideredstatistically significant. Also, in thyroid cancer patients, theassociation between IL-8 and IFN-α levels and clinicopatho-logical parameters was analyzed by Mann-Whitney U test,and the spearman’s correlation was used to describe indepen-dent relationship between serum IL-8 and IFN-α levels.
3. Results and Discussion
Serum IL-8 and IFN-α levels were significantly elevatedin all patients with thyroid disorders (goitre, autoimmunethyroid disorders, and thyroid carcinoma) as compared tohealthy individuals. IL-8 and IFN-α levels in thyroid car-cinoma patients with different histopathological subgroupsand stages have also been compared to that of healthyindividuals. Statistically significant higher levels of both thesecytokines were found in patients with papillary and follicular
carcinoma while, in medullary carcinoma patients, IFN-α and, in anaplastic carcinoma patients, IL-8 levels werefound to be significantly increased as compared to healthyindividuals. Early-stage thyroid carcinoma patients exhibitedsignificant higher levels of IFN-α, but not of IL-8, while IL-8 and not IFN-α levels were found significantly elevated inadvanced-stage thyroid carcinoma patients in comparison tohealthy individuals (Tables 3 and 4).
ROC curve (Figure 1(a)) indicates that both IL-8 andIFN-α exhibited a good discriminatory efficacy betweenhealthy individuals and total patients with thyroid diseases(IL-8: AUC-0.756; IFN-α: AUC-0.795). Moreover, the ROCcurves for both the cytokines between healthy individualsand individual groups of patients, that is, goiter, autoim-mune disease, and thyroid cancer, revealed that both IL-8as well as IFN-α showed good sensitivity and specificity todiscriminate between healthy individuals and patients havingdifferent thyroid diseases (goiter- IL-8: AUC-0.774, IFN-α:AUC-0.797; autoimmune thyroid disease- IL-8: AUC-0.711,IFN-α: AUC-0.755, and thyroid cancer- IL-8: AUC-0.767,IFN-α: AUC-0.813) (Figures 1(b)–1(d)). Only IL-8 couldsignificantly discriminate between early- and advanced-stagethyroid cancer patients (Figure 1(e)).
Similar to the present study, Limkov et al. have demon-strated statistically significant differences in IL-8 levelsthyroid disease patients and reference normal group [30].Bossowski and Urban and Siddiqi et al. have also observedsignificantly elevated levels of IL-8 in patients with Graves’disease and nodular goiter as compared to the respectivehealthy control groups [31, 32]. In contrast to these ofstudies, Krassas and colleagues found that IL-8 levels werenot elevated in Graves’ disease, toxic nodular goiter andHashimoto’s thyroiditis [33]. A study by Lee et al. hasshown increased levels of cytokines including IL-8 and IL-10 in patients who frequently developed euthyroid sick syn-dromes followed by allogeneic bone marrow transplantation[34]. Antonelli et al. observed increased CXCL10 levels inautoimmune thyroiditis [35]. Also, they have demonstrated

4 Journal of Thyroid Research
Area under the curve
Test result variables
AreaStd. error
Asymptoticsig.
Asymptotic 95% confidence interval
Lower bound Upper bound
0.756IL-8 0.050 0.001 0.659 0.853
0.795 0.067 0.000 0.663 0.926
0
0.2
0.4
0.6
0.8
1Se
nsi
tivi
ty
Source of the curve
IL-8IFN-αReference line
IFN-α
0 0.2 0.4 0.6 0.8 1
Diagonal segments are produced by ties
1-specificity
(a) Healthy individuals and total patients with thyroid disease
Area under the curve
Test result variables
AreaStd. error
Asymptoticsig.
Asymptotic 95% confidence interval
Lower bound Upper bound
IL-8 0.774 0.075 0.003 0.628 0.921
0.797 0.074 0.001 0.651 0.943IFN-α
0
0.2
0.4
0.6
0.8
1
Sen
siti
vity
Source of the curve
IL-8IFN-αReference line
0 0.2 0.4 0.6 0.8 1
Diagonal segments are produced by ties
1-specificity
(b) Healthy individuals and patients with goiter
Area under the curve
Test result variables
AreaStd. error
Asymptoticsig.
Asymptotic 95% confidence interval
Lower bound Upper bound
IL-8 0.711 0.103 0.034 0.509 0.912
0.755 0.085 0.010 0.589 0.921IFN-α
0
0.2
0.4
0.6
0.8
1
Sen
siti
vity
Source of the curve
IL-8IFN-αReference line
0 0.2 0.4 0.6 0.8 1
Diagonal segments are produced by ties
1-specificity
(c) Healthy individuals and patients with autoimmune thyroid disease
Area under the curve
Test result variables
AreaStd. error
Asymptoticsig.
Asymptotic 95% confidence interval
Lower bound Upper bound
IL-8 0.767 0.067 0.002 0.637 0.898
0.813 0.066 0.000 0.684 0.942IFN-α
0
0.2
0.4
0.6
0.8
1
Sen
siti
vity
Source of the curve
IL-8IFN-αReference line
0 0.2 0.4 0.6 0.8 1
Diagonal segments are produced by ties
1-specificity
(d) Healthy individuals and thyroid cancer patients
Figure 1: Continued.

Journal of Thyroid Research 5
Area under the curve
Test result variables
AreaStd. error
Asymptoticsig.
Asymptotic 95% confidence interval
Lower bound Upper bound
IL-8 0.749 0.090 0.016 0.573 0.925
0.635 0.103 0.193 0.434 0.837IFN-α
0
0.2
0.4
0.6
0.8
1
Sen
siti
vity
Source of the curve
IL-8IFN-αReference line
0 0.2 0.4 0.6 0.8 1
Diagonal segments are produced by ties
1-specificity
(e) Early stage and advanced stage thyroid carcinoma
Figure 1: ROC curves for IL-8 and IFN-α.
elevated circulating levels of CXCL10 and IFN-gamma inpatients with Graves’ disease, particularly in those withGraves’ ophthalmopathy [36]. Increased IL-8 levels have alsobeen observed in patients with other malignancies. In theirstudy, Yi. Ren et al. also found that the level of serum IL-8 wasmarkedly elevated in most patients with HCC as comparedwith healthy subjects [37]. In fact, elevated serum level ofIL-8 was found to be a prognostic marker in soft tissuesarcoma [38], B-cell chronic lymphocytic leukemia [39],primary gastrointestinal non-Hodgkin’s lymphoma [40],and malignant melanoma [41]. So, high serum levels of boththe cytokines in thyroid carcinoma patients may be causedby an excessive production in tumor cells and subsequentrelease into the circulation.
The incidence of patients with thyroid diseases havinghigher levels of IL-8 and IFN-α than those of healthyindividuals has been shown in Figures 2(a)–2(c). Thelevels of IL-8 > 7.00 ng/ml (maximum level of IL-8 inhealthy individuals) were found in 57.10% of patients withgoitre, 56.30% patients having autoimmune diseases and in62.50% thyroid carcinoma patients. While levels of IFN-α > 4.00 ng/ml (maximum level in healthy individuals) wereobserved in only 14.30% patients with goitre, 6.30% patientswith autoimmune diseases and in 18.80% thyroid carcinomapatients.
The incidence of thyroid carcinoma patients havinghigher levels of IL-8 as compared to that of healthy indi-viduals increased with the increase in disease stage. That is,40% of early-stage thyroid carcinoma patients as comparedto 82.40% advanced-stage thyroid carcinoma patients hadhigher IL-8 levels than the maximum range found in healthyindividuals.
Association of the serum IL-8 and IFN-α levels withdifferent clinicopathological parameters have been studiedby Mann-Whitney U test. It revealed that elevated serum IL-8 levels were significantly associated with advanced-diseasestage (Figure 3). In fact, serum IL-8 levels were significantlyincreased in patients with advanced stage compared to thosewith early-stage disease (445.12 ± 214.30 versus 101.56 ±53.89; P = .016).
Moreover, Spearman rank’s correlation analysis revealedsignificant positive relationships between IL-8 levels anddisease stage (r = 0.437, P = .012). IFN-α levels were notsignificantly associated nor did they exhibit any significantrelationship with any of the clinicopathological parameters.Yi Ren et al. demonstrated that high serum IL-8 level cor-related with large tumor volume and advanced tumor stagein patients with hepatocellular carcinoma [37]. IncreasedIL-8 expression has been found in various tumors and insome studies IL-8 serum and/or tissue levels correlate with
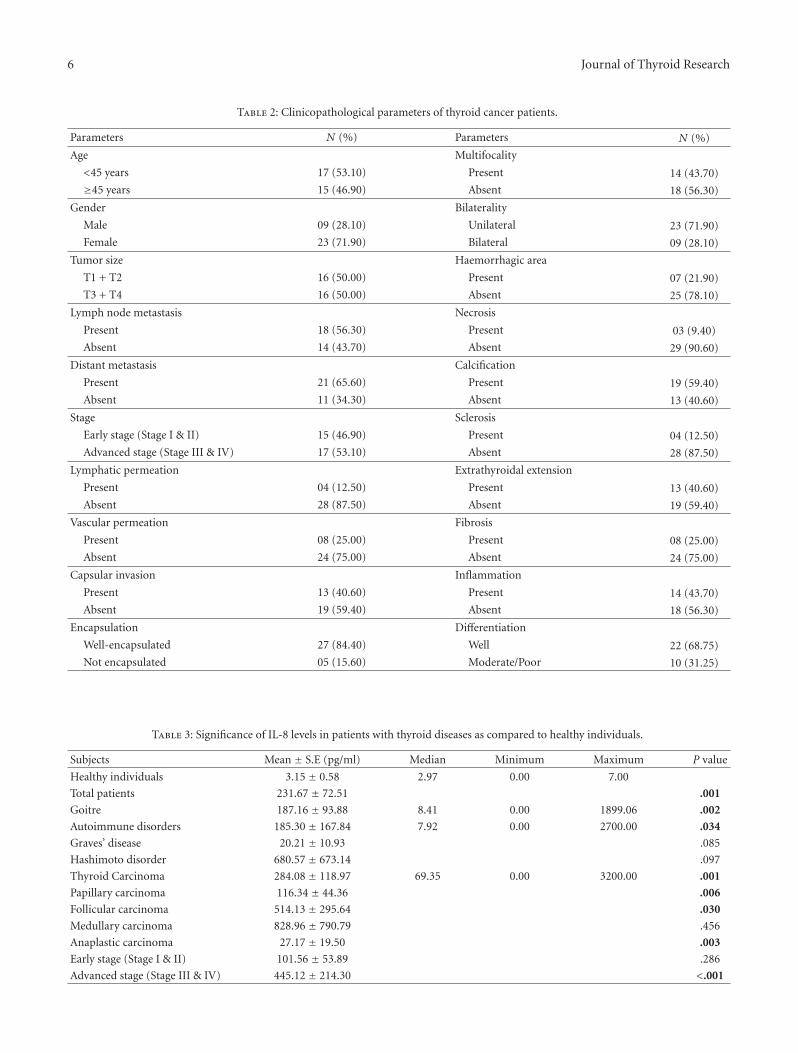
6 Journal of Thyroid Research
Table 2: Clinicopathological parameters of thyroid cancer patients.
Parameters N (%) Parameters N (%)
Age Multifocality
<45 years 17 (53.10) Present 14 (43.70)
≥45 years 15 (46.90) Absent 18 (56.30)
Gender Bilaterality
Male 09 (28.10) Unilateral 23 (71.90)
Female 23 (71.90) Bilateral 09 (28.10)
Tumor size Haemorrhagic area
T1 + T2 16 (50.00) Present 07 (21.90)
T3 + T4 16 (50.00) Absent 25 (78.10)
Lymph node metastasis Necrosis
Present 18 (56.30) Present 03 (9.40)
Absent 14 (43.70) Absent 29 (90.60)
Distant metastasis Calcification
Present 21 (65.60) Present 19 (59.40)
Absent 11 (34.30) Absent 13 (40.60)
Stage Sclerosis
Early stage (Stage I & II) 15 (46.90) Present 04 (12.50)
Advanced stage (Stage III & IV) 17 (53.10) Absent 28 (87.50)
Lymphatic permeation Extrathyroidal extension
Present 04 (12.50) Present 13 (40.60)
Absent 28 (87.50) Absent 19 (59.40)
Vascular permeation Fibrosis
Present 08 (25.00) Present 08 (25.00)
Absent 24 (75.00) Absent 24 (75.00)
Capsular invasion Inflammation
Present 13 (40.60) Present 14 (43.70)
Absent 19 (59.40) Absent 18 (56.30)
Encapsulation Differentiation
Well-encapsulated 27 (84.40) Well 22 (68.75)
Not encapsulated 05 (15.60) Moderate/Poor 10 (31.25)
Table 3: Significance of IL-8 levels in patients with thyroid diseases as compared to healthy individuals.
Subjects Mean ± S.E (pg/ml) Median Minimum Maximum P value
Healthy individuals 3.15 ± 0.58 2.97 0.00 7.00
Total patients 231.67 ± 72.51 .001
Goitre 187.16 ± 93.88 8.41 0.00 1899.06 .002
Autoimmune disorders 185.30 ± 167.84 7.92 0.00 2700.00 .034
Graves’ disease 20.21 ± 10.93 .085
Hashimoto disorder 680.57 ± 673.14 .097
Thyroid Carcinoma 284.08 ± 118.97 69.35 0.00 3200.00 .001
Papillary carcinoma 116.34 ± 44.36 .006
Follicular carcinoma 514.13 ± 295.64 .030
Medullary carcinoma 828.96 ± 790.79 .456
Anaplastic carcinoma 27.17 ± 19.50 .003
Early stage (Stage I & II) 101.56 ± 53.89 .286
Advanced stage (Stage III & IV) 445.12 ± 214.30 <.001
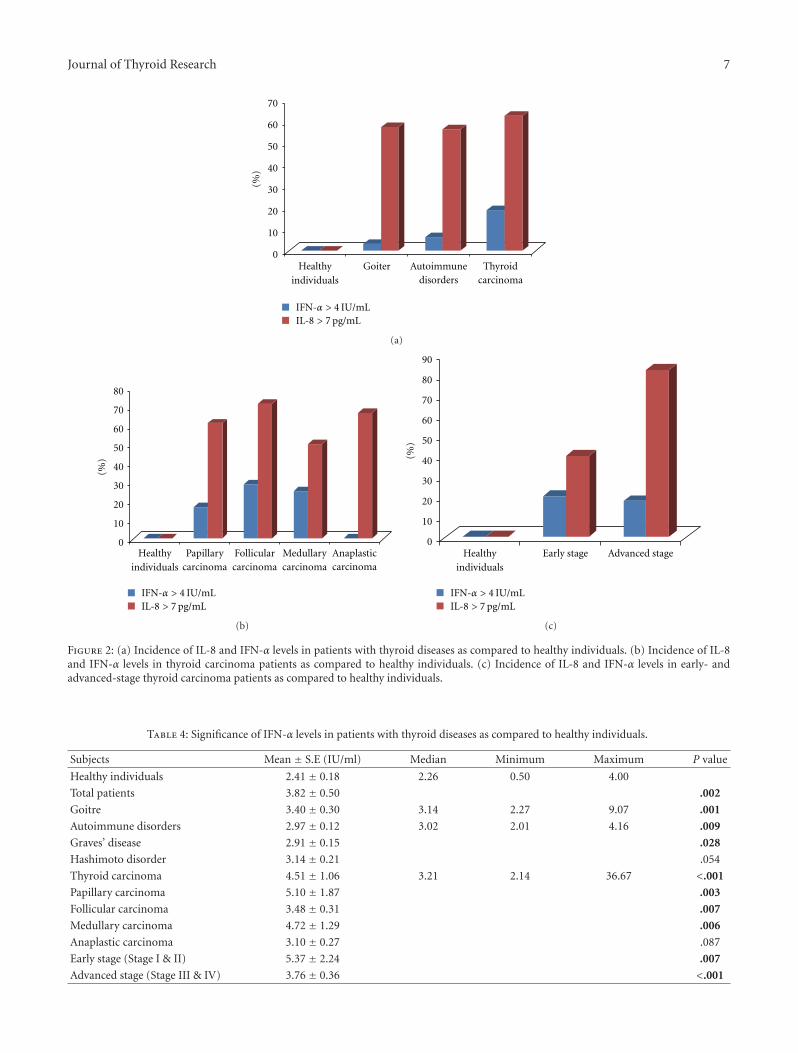
Journal of Thyroid Research 7
0
10
20
30
40
50
60
70
(%)
Healthyindividuals
Goiter Autoimmunedisorders
Thyroidcarcinoma
IFN-α > 4 IU/mLIL-8 > 7 pg/mL
(a)
80
0
10
20
30
40
50
60
70
(%)
Healthyindividuals
IFN-α > 4 IU/mLIL-8 > 7 pg/mL
Papillarycarcinoma
Follicularcarcinoma
Medullarycarcinoma
Anaplasticcarcinoma
(b)
90
80
0
10
20
30
40
50
60
70(%
)
Healthyindividuals
IFN-α > 4 IU/mLIL-8 > 7 pg/mL
Early stage Advanced stage
(c)
Figure 2: (a) Incidence of IL-8 and IFN-α levels in patients with thyroid diseases as compared to healthy individuals. (b) Incidence of IL-8and IFN-α levels in thyroid carcinoma patients as compared to healthy individuals. (c) Incidence of IL-8 and IFN-α levels in early- andadvanced-stage thyroid carcinoma patients as compared to healthy individuals.
Table 4: Significance of IFN-α levels in patients with thyroid diseases as compared to healthy individuals.
Subjects Mean ± S.E (IU/ml) Median Minimum Maximum P value
Healthy individuals 2.41 ± 0.18 2.26 0.50 4.00
Total patients 3.82 ± 0.50 .002
Goitre 3.40 ± 0.30 3.14 2.27 9.07 .001
Autoimmune disorders 2.97 ± 0.12 3.02 2.01 4.16 .009
Graves’ disease 2.91 ± 0.15 .028
Hashimoto disorder 3.14 ± 0.21 .054
Thyroid carcinoma 4.51 ± 1.06 3.21 2.14 36.67 <.001
Papillary carcinoma 5.10 ± 1.87 .003
Follicular carcinoma 3.48 ± 0.31 .007
Medullary carcinoma 4.72 ± 1.29 .006
Anaplastic carcinoma 3.10 ± 0.27 .087
Early stage (Stage I & II) 5.37 ± 2.24 .007
Advanced stage (Stage III & IV) 3.76 ± 0.36 <.001
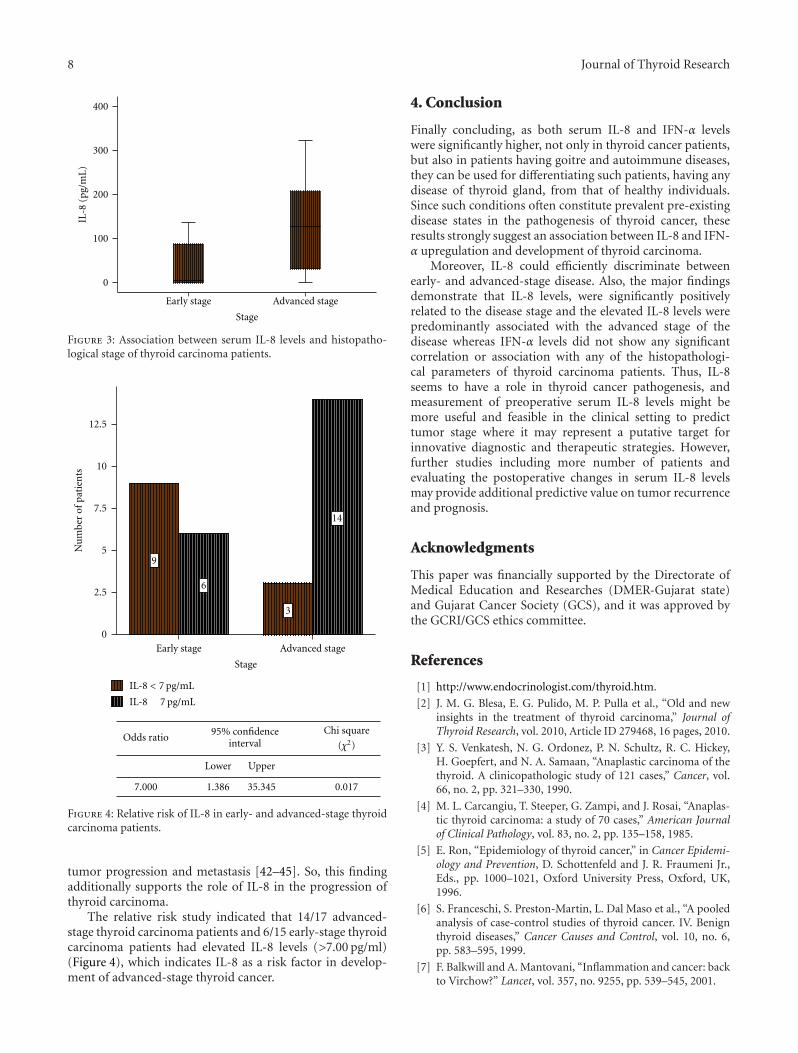
8 Journal of Thyroid Research
0
100
200
300
400
IL-8
(pg/
mL
)
Early stage Advanced stage
Stage
Figure 3: Association between serum IL-8 levels and histopatho-logical stage of thyroid carcinoma patients.
0
2.5
5
7.5
10
12.5
Nu
mbe
rof
pati
ents
Early stage Advanced stage
Stage
9
6
3
14
Lower Upper
1.386 35.345 0.017
IL-8 < 7 pg/mL
IL-8 7 pg/mL
Chi square
(χ2)95% confidence
intervalOdds ratio
7.000
Figure 4: Relative risk of IL-8 in early- and advanced-stage thyroidcarcinoma patients.
tumor progression and metastasis [42–45]. So, this findingadditionally supports the role of IL-8 in the progression ofthyroid carcinoma.
The relative risk study indicated that 14/17 advanced-stage thyroid carcinoma patients and 6/15 early-stage thyroidcarcinoma patients had elevated IL-8 levels (>7.00 pg/ml)(Figure 4), which indicates IL-8 as a risk factor in develop-ment of advanced-stage thyroid cancer.
4. Conclusion
Finally concluding, as both serum IL-8 and IFN-α levelswere significantly higher, not only in thyroid cancer patients,but also in patients having goitre and autoimmune diseases,they can be used for differentiating such patients, having anydisease of thyroid gland, from that of healthy individuals.Since such conditions often constitute prevalent pre-existingdisease states in the pathogenesis of thyroid cancer, theseresults strongly suggest an association between IL-8 and IFN-α upregulation and development of thyroid carcinoma.
Moreover, IL-8 could efficiently discriminate betweenearly- and advanced-stage disease. Also, the major findingsdemonstrate that IL-8 levels, were significantly positivelyrelated to the disease stage and the elevated IL-8 levels werepredominantly associated with the advanced stage of thedisease whereas IFN-α levels did not show any significantcorrelation or association with any of the histopathologi-cal parameters of thyroid carcinoma patients. Thus, IL-8seems to have a role in thyroid cancer pathogenesis, andmeasurement of preoperative serum IL-8 levels might bemore useful and feasible in the clinical setting to predicttumor stage where it may represent a putative target forinnovative diagnostic and therapeutic strategies. However,further studies including more number of patients andevaluating the postoperative changes in serum IL-8 levelsmay provide additional predictive value on tumor recurrenceand prognosis.
Acknowledgments
This paper was financially supported by the Directorate ofMedical Education and Researches (DMER-Gujarat state)and Gujarat Cancer Society (GCS), and it was approved bythe GCRI/GCS ethics committee.
References
[1] http://www.endocrinologist.com/thyroid.htm.
[2] J. M. G. Blesa, E. G. Pulido, M. P. Pulla et al., “Old and newinsights in the treatment of thyroid carcinoma,” Journal ofThyroid Research, vol. 2010, Article ID 279468, 16 pages, 2010.
[3] Y. S. Venkatesh, N. G. Ordonez, P. N. Schultz, R. C. Hickey,H. Goepfert, and N. A. Samaan, “Anaplastic carcinoma of thethyroid. A clinicopathologic study of 121 cases,” Cancer, vol.66, no. 2, pp. 321–330, 1990.
[4] M. L. Carcangiu, T. Steeper, G. Zampi, and J. Rosai, “Anaplas-tic thyroid carcinoma: a study of 70 cases,” American Journalof Clinical Pathology, vol. 83, no. 2, pp. 135–158, 1985.
[5] E. Ron, “Epidemiology of thyroid cancer,” in Cancer Epidemi-ology and Prevention, D. Schottenfeld and J. R. Fraumeni Jr.,Eds., pp. 1000–1021, Oxford University Press, Oxford, UK,1996.
[6] S. Franceschi, S. Preston-Martin, L. Dal Maso et al., “A pooledanalysis of case-control studies of thyroid cancer. IV. Benignthyroid diseases,” Cancer Causes and Control, vol. 10, no. 6,pp. 583–595, 1999.
[7] F. Balkwill and A. Mantovani, “Inflammation and cancer: backto Virchow?” Lancet, vol. 357, no. 9255, pp. 539–545, 2001.
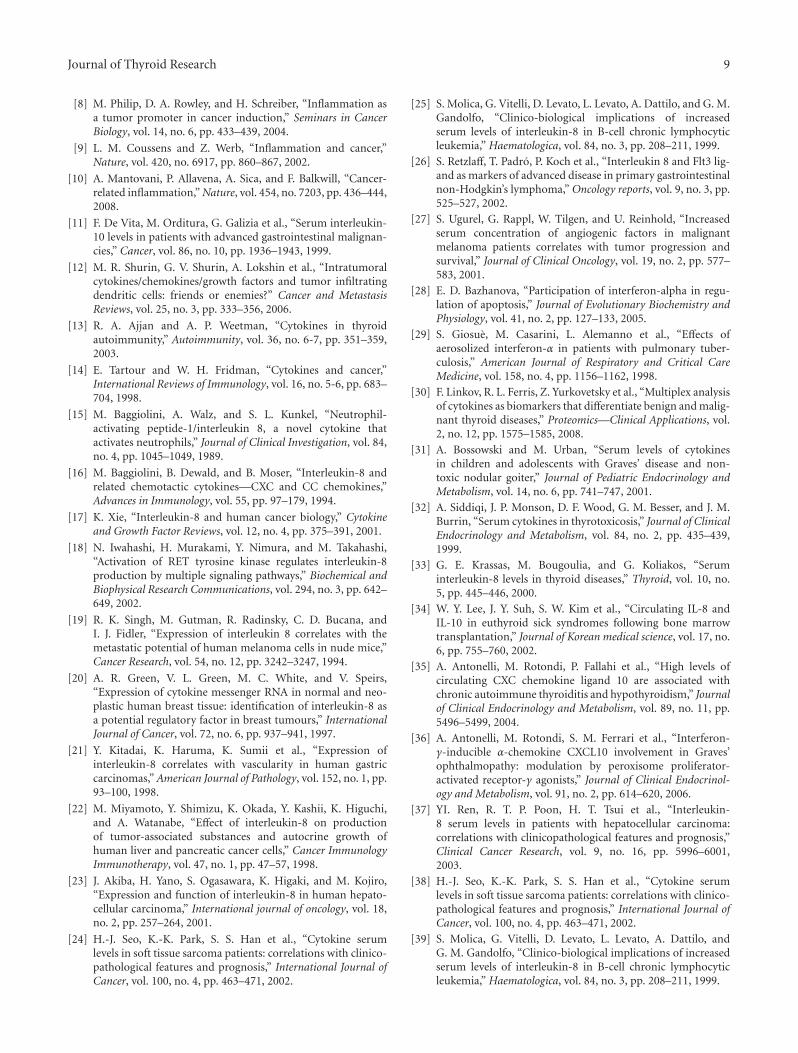
Journal of Thyroid Research 9
[8] M. Philip, D. A. Rowley, and H. Schreiber, “Inflammation asa tumor promoter in cancer induction,” Seminars in CancerBiology, vol. 14, no. 6, pp. 433–439, 2004.
[9] L. M. Coussens and Z. Werb, “Inflammation and cancer,”Nature, vol. 420, no. 6917, pp. 860–867, 2002.
[10] A. Mantovani, P. Allavena, A. Sica, and F. Balkwill, “Cancer-related inflammation,” Nature, vol. 454, no. 7203, pp. 436–444,2008.
[11] F. De Vita, M. Orditura, G. Galizia et al., “Serum interleukin-10 levels in patients with advanced gastrointestinal malignan-cies,” Cancer, vol. 86, no. 10, pp. 1936–1943, 1999.
[12] M. R. Shurin, G. V. Shurin, A. Lokshin et al., “Intratumoralcytokines/chemokines/growth factors and tumor infiltratingdendritic cells: friends or enemies?” Cancer and MetastasisReviews, vol. 25, no. 3, pp. 333–356, 2006.
[13] R. A. Ajjan and A. P. Weetman, “Cytokines in thyroidautoimmunity,” Autoimmunity, vol. 36, no. 6-7, pp. 351–359,2003.
[14] E. Tartour and W. H. Fridman, “Cytokines and cancer,”International Reviews of Immunology, vol. 16, no. 5-6, pp. 683–704, 1998.
[15] M. Baggiolini, A. Walz, and S. L. Kunkel, “Neutrophil-activating peptide-1/interleukin 8, a novel cytokine thatactivates neutrophils,” Journal of Clinical Investigation, vol. 84,no. 4, pp. 1045–1049, 1989.
[16] M. Baggiolini, B. Dewald, and B. Moser, “Interleukin-8 andrelated chemotactic cytokines—CXC and CC chemokines,”Advances in Immunology, vol. 55, pp. 97–179, 1994.
[17] K. Xie, “Interleukin-8 and human cancer biology,” Cytokineand Growth Factor Reviews, vol. 12, no. 4, pp. 375–391, 2001.
[18] N. Iwahashi, H. Murakami, Y. Nimura, and M. Takahashi,“Activation of RET tyrosine kinase regulates interleukin-8production by multiple signaling pathways,” Biochemical andBiophysical Research Communications, vol. 294, no. 3, pp. 642–649, 2002.
[19] R. K. Singh, M. Gutman, R. Radinsky, C. D. Bucana, andI. J. Fidler, “Expression of interleukin 8 correlates with themetastatic potential of human melanoma cells in nude mice,”Cancer Research, vol. 54, no. 12, pp. 3242–3247, 1994.
[20] A. R. Green, V. L. Green, M. C. White, and V. Speirs,“Expression of cytokine messenger RNA in normal and neo-plastic human breast tissue: identification of interleukin-8 asa potential regulatory factor in breast tumours,” InternationalJournal of Cancer, vol. 72, no. 6, pp. 937–941, 1997.
[21] Y. Kitadai, K. Haruma, K. Sumii et al., “Expression ofinterleukin-8 correlates with vascularity in human gastriccarcinomas,” American Journal of Pathology, vol. 152, no. 1, pp.93–100, 1998.
[22] M. Miyamoto, Y. Shimizu, K. Okada, Y. Kashii, K. Higuchi,and A. Watanabe, “Effect of interleukin-8 on productionof tumor-associated substances and autocrine growth ofhuman liver and pancreatic cancer cells,” Cancer ImmunologyImmunotherapy, vol. 47, no. 1, pp. 47–57, 1998.
[23] J. Akiba, H. Yano, S. Ogasawara, K. Higaki, and M. Kojiro,“Expression and function of interleukin-8 in human hepato-cellular carcinoma,” International journal of oncology, vol. 18,no. 2, pp. 257–264, 2001.
[24] H.-J. Seo, K.-K. Park, S. S. Han et al., “Cytokine serumlevels in soft tissue sarcoma patients: correlations with clinico-pathological features and prognosis,” International Journal ofCancer, vol. 100, no. 4, pp. 463–471, 2002.
[25] S. Molica, G. Vitelli, D. Levato, L. Levato, A. Dattilo, and G. M.Gandolfo, “Clinico-biological implications of increasedserum levels of interleukin-8 in B-cell chronic lymphocyticleukemia,” Haematologica, vol. 84, no. 3, pp. 208–211, 1999.
[26] S. Retzlaff, T. Padro, P. Koch et al., “Interleukin 8 and Flt3 lig-and as markers of advanced disease in primary gastrointestinalnon-Hodgkin’s lymphoma,” Oncology reports, vol. 9, no. 3, pp.525–527, 2002.
[27] S. Ugurel, G. Rappl, W. Tilgen, and U. Reinhold, “Increasedserum concentration of angiogenic factors in malignantmelanoma patients correlates with tumor progression andsurvival,” Journal of Clinical Oncology, vol. 19, no. 2, pp. 577–583, 2001.
[28] E. D. Bazhanova, “Participation of interferon-alpha in regu-lation of apoptosis,” Journal of Evolutionary Biochemistry andPhysiology, vol. 41, no. 2, pp. 127–133, 2005.
[29] S. Giosue, M. Casarini, L. Alemanno et al., “Effects ofaerosolized interferon-α in patients with pulmonary tuber-culosis,” American Journal of Respiratory and Critical CareMedicine, vol. 158, no. 4, pp. 1156–1162, 1998.
[30] F. Linkov, R. L. Ferris, Z. Yurkovetsky et al., “Multiplex analysisof cytokines as biomarkers that differentiate benign and malig-nant thyroid diseases,” Proteomics—Clinical Applications, vol.2, no. 12, pp. 1575–1585, 2008.
[31] A. Bossowski and M. Urban, “Serum levels of cytokinesin children and adolescents with Graves’ disease and non-toxic nodular goiter,” Journal of Pediatric Endocrinology andMetabolism, vol. 14, no. 6, pp. 741–747, 2001.
[32] A. Siddiqi, J. P. Monson, D. F. Wood, G. M. Besser, and J. M.Burrin, “Serum cytokines in thyrotoxicosis,” Journal of ClinicalEndocrinology and Metabolism, vol. 84, no. 2, pp. 435–439,1999.
[33] G. E. Krassas, M. Bougoulia, and G. Koliakos, “Seruminterleukin-8 levels in thyroid diseases,” Thyroid, vol. 10, no.5, pp. 445–446, 2000.
[34] W. Y. Lee, J. Y. Suh, S. W. Kim et al., “Circulating IL-8 andIL-10 in euthyroid sick syndromes following bone marrowtransplantation,” Journal of Korean medical science, vol. 17, no.6, pp. 755–760, 2002.
[35] A. Antonelli, M. Rotondi, P. Fallahi et al., “High levels ofcirculating CXC chemokine ligand 10 are associated withchronic autoimmune thyroiditis and hypothyroidism,” Journalof Clinical Endocrinology and Metabolism, vol. 89, no. 11, pp.5496–5499, 2004.
[36] A. Antonelli, M. Rotondi, S. M. Ferrari et al., “Interferon-γ-inducible α-chemokine CXCL10 involvement in Graves’ophthalmopathy: modulation by peroxisome proliferator-activated receptor-γ agonists,” Journal of Clinical Endocrinol-ogy and Metabolism, vol. 91, no. 2, pp. 614–620, 2006.
[37] YI. Ren, R. T. P. Poon, H. T. Tsui et al., “Interleukin-8 serum levels in patients with hepatocellular carcinoma:correlations with clinicopathological features and prognosis,”Clinical Cancer Research, vol. 9, no. 16, pp. 5996–6001,2003.
[38] H.-J. Seo, K.-K. Park, S. S. Han et al., “Cytokine serumlevels in soft tissue sarcoma patients: correlations with clinico-pathological features and prognosis,” International Journal ofCancer, vol. 100, no. 4, pp. 463–471, 2002.
[39] S. Molica, G. Vitelli, D. Levato, L. Levato, A. Dattilo, andG. M. Gandolfo, “Clinico-biological implications of increasedserum levels of interleukin-8 in B-cell chronic lymphocyticleukemia,” Haematologica, vol. 84, no. 3, pp. 208–211, 1999.
10 Journal of Thyroid Research
[40] S. Retzlaff, T. Padro, P. Koch et al., “Interleukin 8 and Flt3 lig-and as markers of advanced disease in primary gastrointestinalnon-Hodgkin’s lymphoma,” Oncology Reports, vol. 9, no. 3, pp.525–527, 2002.
[41] S. Ugurel, G. Rappl, W. Tilgen, and U. Reinhold, “Increasedserum concentration of angiogenic factors in malignantmelanoma patients correlates with tumor progression andsurvival,” Journal of Clinical Oncology, vol. 19, no. 2, pp. 577–583, 2001.
[42] H. Uehara, P. Troncoso, D. Johnston et al., “Expressionof interleukin-8 gene in radical prostatectomy specimens isassociated with advanced pathologic stage,” Prostate, vol. 64,no. 1, pp. 40–49, 2005.
[43] K. H. Lee, S. H. Bae, J. L. Lee et al., “Relationshipbetween urokinase-type plasminogen receptor, interleukin-8 gene expression and clinicopathological features in gastriccancer,” Oncology, vol. 66, no. 3, pp. 210–217, 2004.
[44] Y. C. Chung and Y. F. Chang, “Significance of inflammatorycytokines in the progression of colorectal cancer,” Hepatogas-troenterology, vol. 50, no. 54, pp. 1910–1913, 2003.
[45] A. Yuan, J. J. Chen, P. L. Yao, and P. C. Yang, “The roleof interleukin-8 in cancer cells and microenvironment inter-action,” Frontiers in Bioscience, vol. 10, pp. 853–865, 2005.