Embed Size (px)
Citation preview

BIOMARKERS IN ATOPIC DERMATITIS
Judith Thijs

Biomarkers in atopic dermatitis
Thesis with a summary in Dutch, Utrecht University
© Judith Thijs, 2017
The copyrights of published articles have been transferred to the respective journals.
All rights reserved. No part of this thesis may be reproduced, stored in a retrieval system or transmitted in any other form or by any means, without permission of the author.
ISBN: 978-94-6295-700-8Cover and layout design: Mirjam ThijsPrinted and published by: Proefschriftmaken.nl

Biomarkers in atopic dermatitis
Biomarkers in constitutioneel eczeem
(met een samenvatting in het Nederlands)
Proefschrift
ter verkrijging van de graad van doctor aan de Universiteit Utrecht
op gezag van de rector magnificus, prof. dr. G.J. van der Zwaan,
ingevolge het besluit van het college voor promoties
in het openbaar te verdedigen op
woensdag 20 september 2017
des middags te 12.45 uur
door
Judith Lydia Thijs
geboren op 5 maart 1988 te Eindhoven

Promotor:Prof. dr. C.A.F.M. Bruijnzeel-Koomen
Copromotoren:Dr. D.J. HijnenDr. S. Nierkens
TABLE OF CONTENTS
Chapter 1 General introduction Part I - severity biomarkers Chapter 2 Biomarkers for atopic dermatitis: a systematic review and meta-analysis Chapter 3 A panel of biomarkers for disease severity in atopic dermatitis Chapter 4 EASI p-EASI: Utilising a combination of serum biomarkers offers an objective measurement tool for disease severity in atopic dermatitis patients Chapter 5 Levels of serum TARC, IL-22 and sIL-2R predict disease severity in atopic dermatitis patients treated with Cyclosporin A Chapter 6 Immunoglobulin free light chains in adult atopic dermatitis patients Part II - Biomarkers enabling precision medicine in atopic dermatitis Chapter 7 Serum biomarker profiles suggest that atopic dermatitis is a systemic disease Chapter 8 Moving towards endotypes in atopic dermatitis: identification of patient clusters based on serum biomarker analysis Chapter 9 Predicting therapy response to Mycophenolic acid using UGT1A9 genotyping: Towards personalized medicine in atopic dermatitis Part III - Improving practical aspects of biomarker measurement Chapter 10 New developments in biomarkers for atopic dermatitis Chapter 11 Biomarkers detected in dried blood spots from atopic dermatitis patients strongly correlate with disease severity Chapter 12 General discussion
Chapter 13 Nederlandse samenvatting | Dutch summary Appendices Abbrevations Contributing authors Acknowledgements List of publications Curriculum vitae
7
19
35
43
63
73
85
93
111
123
135
155
197
207

Chapter 1
8
1
1

General introduction
7
1
General introduction
Chapter 1
8
1
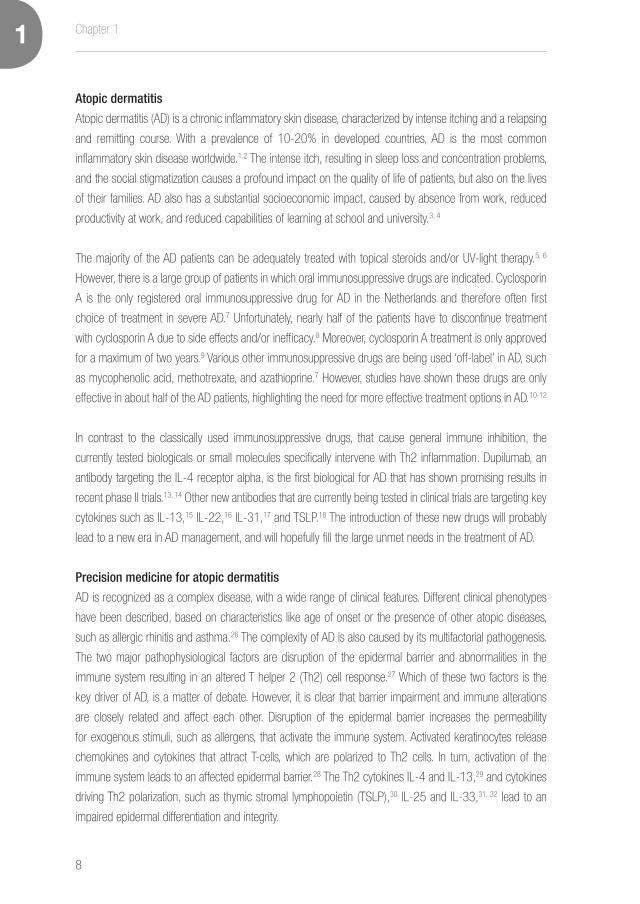
Atopic dermatitis
Atopic dermatitis (AD) is a chronic inflammatory skin disease, characterized by intense itching and a relapsing
and remitting course. With a prevalence of 10-20% in developed countries, AD is the most common
inflammatory skin disease worldwide.1,2 The intense itch, resulting in sleep loss and concentration problems,
and the social stigmatization causes a profound impact on the quality of life of patients, but also on the lives
of their families. AD also has a substantial socioeconomic impact, caused by absence from work, reduced
productivity at work, and reduced capabilities of learning at school and university.3, 4
The majority of the AD patients can be adequately treated with topical steroids and/or UV-light therapy.5, 6
However, there is a large group of patients in which oral immunosuppressive drugs are indicated. Cyclosporin
A is the only registered oral immunosuppressive drug for AD in the Netherlands and therefore often first
choice of treatment in severe AD.7 Unfortunately, nearly half of the patients have to discontinue treatment
with cyclosporin A due to side effects and/or inefficacy.8 Moreover, cyclosporin A treatment is only approved
for a maximum of two years.9 Various other immunosuppressive drugs are being used ‘off-label’ in AD, such
as mycophenolic acid, methotrexate, and azathioprine.7 However, studies have shown these drugs are only
effective in about half of the AD patients, highlighting the need for more effective treatment options in AD.10-12
In contrast to the classically used immunosuppressive drugs, that cause general immune inhibition, the
currently tested biologicals or small molecules specifically intervene with Th2 inflammation. Dupilumab, an
antibody targeting the IL-4 receptor alpha, is the first biological for AD that has shown promising results in
recent phase II trials.13, 14 Other new antibodies that are currently being tested in clinical trials are targeting key
cytokines such as IL-13,15 IL-22,16 IL-31,17 and TSLP.18 The introduction of these new drugs will probably
lead to a new era in AD management, and will hopefully fill the large unmet needs in the treatment of AD.
Precision medicine for atopic dermatitis
AD is recognized as a complex disease, with a wide range of clinical features. Different clinical phenotypes
have been described, based on characteristics like age of onset or the presence of other atopic diseases,
such as allergic rhinitis and asthma.26 The complexity of AD is also caused by its multifactorial pathogenesis.
The two major pathophysiological factors are disruption of the epidermal barrier and abnormalities in the
immune system resulting in an altered T helper 2 (Th2) cell response.27 Which of these two factors is the
key driver of AD, is a matter of debate. However, it is clear that barrier impairment and immune alterations
are closely related and affect each other. Disruption of the epidermal barrier increases the permeability
for exogenous stimuli, such as allergens, that activate the immune system. Activated keratinocytes release
chemokines and cytokines that attract T-cells, which are polarized to Th2 cells. In turn, activation of the
immune system leads to an affected epidermal barrier.28 The Th2 cytokines IL-4 and IL-13,29 and cytokines
driving Th2 polarization, such as thymic stromal lymphopoietin (TSLP),30 IL-25 and IL-33,31, 32 lead to an
impaired epidermal differentiation and integrity.
General introduction
9
1
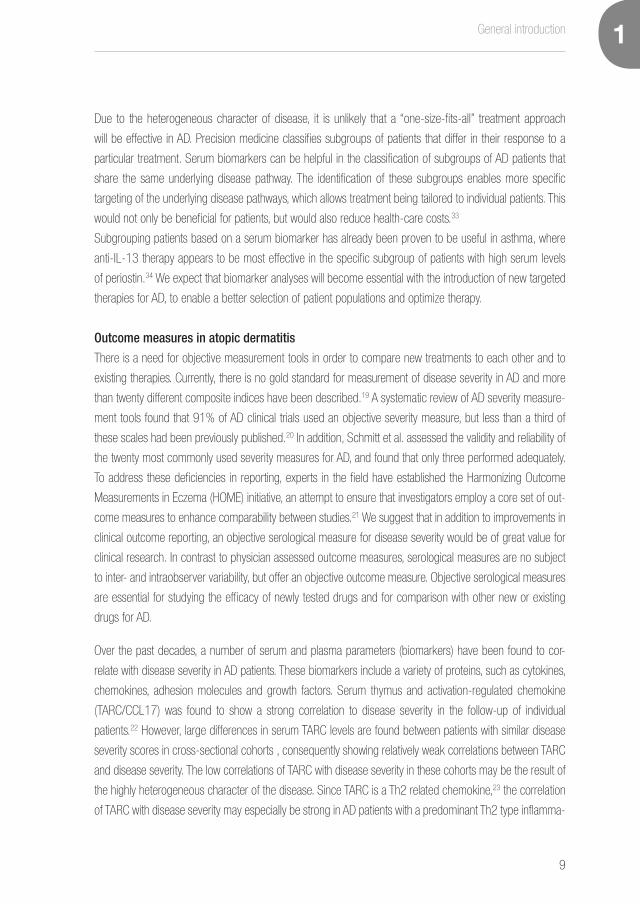
Due to the heterogeneous character of disease, it is unlikely that a “one-size-fits-all” treatment approach
will be effective in AD. Precision medicine classifies subgroups of patients that differ in their response to a
particular treatment. Serum biomarkers can be helpful in the classification of subgroups of AD patients that
share the same underlying disease pathway. The identification of these subgroups enables more specific
targeting of the underlying disease pathways, which allows treatment being tailored to individual patients. This
would not only be beneficial for patients, but would also reduce health-care costs.33
Subgrouping patients based on a serum biomarker has already been proven to be useful in asthma, where
anti-IL-13 therapy appears to be most effective in the specific subgroup of patients with high serum levels
of periostin.34 We expect that biomarker analyses will become essential with the introduction of new targeted
therapies for AD, to enable a better selection of patient populations and optimize therapy.
Outcome measures in atopic dermatitis
There is a need for objective measurement tools in order to compare new treatments to each other and to
existing therapies. Currently, there is no gold standard for measurement of disease severity in AD and more
than twenty different composite indices have been described.19 A systematic review of AD severity measure-
ment tools found that 91% of AD clinical trials used an objective severity measure, but less than a third of
these scales had been previously published.20 In addition, Schmitt et al. assessed the validity and reliability of
the twenty most commonly used severity measures for AD, and found that only three performed adequately.
To address these deficiencies in reporting, experts in the field have established the Harmonizing Outcome
Measurements in Eczema (HOME) initiative, an attempt to ensure that investigators employ a core set of out-
come measures to enhance comparability between studies.21 We suggest that in addition to improvements in
clinical outcome reporting, an objective serological measure for disease severity would be of great value for
clinical research. In contrast to physician assessed outcome measures, serological measures are no subject
to inter- and intraobserver variability, but offer an objective outcome measure. Objective serological measures
are essential for studying the efficacy of newly tested drugs and for comparison with other new or existing
drugs for AD.
Over the past decades, a number of serum and plasma parameters (biomarkers) have been found to cor-
relate with disease severity in AD patients. These biomarkers include a variety of proteins, such as cytokines,
chemokines, adhesion molecules and growth factors. Serum thymus and activation-regulated chemokine
(TARC/CCL17) was found to show a strong correlation to disease severity in the follow-up of individual
patients.22 However, large differences in serum TARC levels are found between patients with similar disease
severity scores in cross-sectional cohorts , consequently showing relatively weak correlations between TARC
and disease severity. The low correlations of TARC with disease severity in these cohorts may be the result of
the highly heterogeneous character of the disease. Since TARC is a Th2 related chemokine,23 the correlation
of TARC with disease severity may especially be strong in AD patients with a predominant Th2 type inflamma-

Chapter 1
10
1
tion, while this correlation may be less strong in for instance an Asian patient population in which Th22 type
inflammation is thought be more important. The use of a panel of biomarkers might overcome this problem. A
panel of biomarkers can assess multiple molecular entities, and might be more suitable for assessing disease
severity in AD compared to an individual biomarker.
Most previously described biomarkers were measured in peripheral blood.24 However, collection of blood
is invasive and less suitable for use in the field because of the need for trained personnel. Blood collection
by venipuncture is also less favorable in pediatric medicine. Potential alternative sources for biomarker mea-
surements in daily practice and longitudinal studies are dried blood spots (DBS) and saliva. DBS have been
used for decades in screening for inherited metabolic diseases in newborns25 and can be obtained using a
simple, minimally invasive, nearly painless procedure that can be done by the patients themselves. Saliva also
contains a wide spectrum of biomolecules, which are transported from the blood capillaries through the epi-
thelium of salivary glands.26 Salivary cortisol levels are for instance routinely used as a biomarker of psycho-
logical stress. DBS and saliva may be used as an accurate non-invasive alternative to serum measurements.
Pharmacogenomic biomarkers in atopic dermatitis treatment
In addition to newly developed therapies, implementation of pharmacogenetic biomarkers can optimize the
performance of current oral immunosuppressive drugs. Pharmacogenetic research explores the effect of
pharmacokinetics, pharmacodynamics, efficacy, and safety of drug treatments in relation to genome varia-
tions.35 The most common genetic variations that have been studied are single-nucleotide polymorphisms
(SNPs), genetic copynumber variations (CNVs), and genomic insertions and deletions.36 All of these genetic
variations can influence the response of a patient to a specific drug. The goal of pharmacogenetic research is
to predict this response. Pharmacogenetic testing provides a tool that can maximize therapeutic efficacy and
safety of drug treatment, with the ultimate goal of creating personalized treatment strategies.35, 36
Pharmacogenetic testing was applied in a recent study investigating the effect of extended release tacrolimus
in severe AD patients.37 Based on the genetic markers CYP3A4/CYP3A5 patients could be classified as poor,
intermediate or extensive metabolizers of tacrolimus, enabling a personalized dosing scheme for the individ-
ual patient.37 Pharmacogenetic testing of SNPs for CYP3A4/CYP3A5 may also be of use in Cyclosporin A
treatment,38 the most commonly used oral immunosuppressive drug in AD.7
Pharmacogenetic testing may also be used to optimize mycophenolic acid treatment. Mycophenolic acid
blood levels are known to have a large inter individual variability. This has been observed in kidney transplant
recipients, in whom a lower level of mycophenolic acid exposure is closely associated with lower efficacy of
drug therapy and acute rejection of the transplanted organ.39, 40 Low mycophenolic acid exposure and in-
creased enzyme activity of the metabolizing enzyme UGT1A9 correlates to the presence of SNPs in the gene
promotor region of UGT1A9.39, 40 Also for AD patients, low mycophenolic acid exposure due to the presence
General introduction
11
1
of UGT1A9 polymorphisms might contribute to inefficacy.
Although pharmacogenetics are currently scarcely used in dermatological treatment, it enables “personalized
medicine” by prescribing drugs based on the genetic makeup of an individual.
Outline of this thesis
In this thesis, we investigated several different applications of biomarkers in AD. Firstly, we focused on bio-
markers as an objective measure for disease severity in AD. Current literature on disease severity biomarkers
in AD was systematically reviewed, and the performance of known biomarkers was analysed in a meta-anal-
ysis described in chapter 2. In a pilot study on 17 AD patients that is described in chapter 3, we investigated
if a combination of biomarkers might be more suitable for assessing disease severity in AD compared to an
individual biomarker. The performance of a combination of biomarkers was further explored in a longitudinal
study including 65 AD patients treated with topical steroids in chapter 4. The applicability of a combination
of biomarkers in AD patients treated with CsA is described in chapter 5. In chapter 6, we investigated the
performance of immunoglobulin free light chains as a biomarker for disease severity in AD.
Secondly, we focused on biomarkers that enable personalized medicine in AD. Chapter 7 focusses on the
presence of systemic inflammation in AD, and the comorbidities that possibly caused by this systemic inflam-
mation. In chapter 8 we tried to dissect the heterogeneity of AD on a biological level using a purely data driven
approach. In chapter 9 we investigated if UGT1A9 mutations can be used as a pharmacogenomic biomarker
for the prediction of response to mycophenolic acid therapy in AD.
A third aim of this thesis was to improve the practical aspects of the application of biomarkers in AD. The
research presented in this thesis is mostly based on biomarker measurement in serum. Chapter 10 provides
an overview of alternative sources that can be used for biomarker measurement. Chapter 11 explores the
possibility of biomarker measurement in dried blood spots from AD patients.

Chapter 1
12
1
REFERENCES
1. Deckers IA, McLean S, Linssen S, Mommers M, van Schayck CP, Sheikh A. Investigating international time trends in the incidence
and prevalence of atopic eczema 1990-2010: a systematic review of epidemiological studies. PLoS One 2012; 7:e39803.
2. Williams H, Stewart A, von Mutius E, Cookson W, Anderson HR. Is eczema really on the increase worldwide? J Allergy Clin
Immunol 2008; 121:947-54 e15.
3. Simpson EL, Bieber T, Eckert L, Wu R, Ardeleanu M, Graham NM, et al. Patient burden of moderate to severe atopic dermatitis
(AD): Insights from a phase 2b clinical trial of dupilumab in adults. J Am Acad Dermatol 2016; 74:491-8.
4. Zuberbier T, Lotvall J, Simoens S, Subramanian SV, Church MK. Economic burden of inadequate management of allergic diseases
in the European Union: a GA(2) LEN review. Allergy 2014; 69:1275-9.
5. Gelmetti C, Wollenberg A. Atopic dermatitis - all you can do from the outside. Br J Dermatol 2014; 170 Suppl 1:19-24.
6. Garritsen FM, Brouwer MW, Limpens J, Spuls PI. Photo(chemo)therapy in the management of atopic dermatitis: an updated
systematic review with implications for practice and research. Br J Dermatol 2014; 170:501-13.
7. Ring J, Alomar A, Bieber T, Deleuran M, Fink-Wagner A, Gelmetti C, et al. Guidelines for treatment of atopic eczema (atopic
dermatitis) Part II. J Eur Acad Dermatol Venereol 2012; 26:1176-93.
8. van der Schaft J, Politiek K, van den Reek JM, Christoffers WA, Kievit W, de Jong EM, et al. Drug survival for ciclosporin A in a
long-term daily practice cohort of adult patients with atopic dermatitis. Br J Dermatol 2015; 172:1621-7.
9. Ring J, Alomar A, Bieber T, Deleuran M, Fink-Wagner A, Gelmetti C, et al. Guidelines for treatment of atopic eczema (atopic
dermatitis) Part II. J Eur Acad Dermatol Venereol 2012; 26:1176-93.
10. Garritsen FM, Roekevisch E, van der Schaft J, Deinum J, Spuls PI, de Bruin-Weller MS. Ten years experience with oral
immunosuppressive treatment in adult patients with atopic dermatitis in two academic centres. J Eur Acad Dermatol Venereol
2015; 29:1905-12.
11. van der Schaft J, Politiek K, van den Reek JM, Kievit W, de Jong EM, Bruijnzeel-Koomen CA, et al. Drug survival for azathioprine
and enteric-coated mycophenolate sodium in a long-term daily practice cohort of adult patients with atopic dermatitis. Br J
Dermatol 2016.
12. Politiek K, van der Schaft J, Coenraads PJ, de Bruin-Weller MS, Schuttelaar ML. Drug survival for methotrexate in a daily practice
cohort of adult patients with severe atopic dermatitis. Br J Dermatol 2016; 174:201-3.
13. Beck LA, Thaci D, Hamilton JD, Graham NM, Bieber T, Rocklin R, et al. Dupilumab treatment in adults with moderate-to-severe
atopic dermatitis. N Engl J Med 2014; 371:130-9.
14. Thaci D, Simpson EL, Beck LA, Bieber T, Blauvelt A, Papp K, et al. Efficacy and safety of dupilumab in adults with moderate-to-
severe atopic dermatitis inadequately controlled by topical treatments: a randomised, placebo-controlled, dose-ranging phase
2b trial. Lancet 2016; 387:40-52.
15. A Study to Evaluate the Safety of Lebrikizumab Compared to Topical Corticosteroids in Adult Patients With Atopic Dermatitis.]
Available from https://clinicaltrials.gov/ct2/show/NCT02465606: Hoffmann-La Roche.
16. A randomized placebo-controlled study to determine the safety, tolerability, pharmacodynamics and clinical efficacy of ILV-094
(an IL-22 antibody) administered intravenously to subjects with atopic dermatitis (AD).] Available from http://clinicaltrials.gov/ct2/
show/NCT01941537: Rockefeller University

General introduction
13
1
17. Nemoto O, Furue M, Nakagawa H, Shiramoto M, Hanada R, Matsuki S, et al. The first trial of CIM331, a humanized antihuman
interleukin-31 receptor A antibody, in healthy volunteers and patients with atopic dermatitis to evaluate safety, tolerability and
pharmacokinetics of a single dose in a randomized, double-blind, placebo-controlled study. Br J Dermatol 2016; 174:296-304.
18. A randomized, double-blind, placebo-controlled, ascending single dose study to evaluate the safety, tolerability, pharmacokinetics
and pharmacodynamics of AMG 157 in healthy subjects and subjects with moderate to severe atopic dermatitis.] Available from
http://clinicaltrials.gov/ct2/show/study/NCT00757042: Amgen.
19. Schmitt J, Langan S, Williams HC. What are the best outcome measurements for atopic eczema? A systematic review. J Allergy
Clin Immunol 2007; 120:1389-98.
20. Charman C, Chambers C, Williams H. Measuring atopic dermatitis severity in randomized controlled clinical trials: what exactly are
we measuring? J Invest Dermatol 2003; 120:932-41.
21. Schmitt J, Langan S, Stamm T, Williams HC. Core outcome domains for controlled trials and clinical recordkeeping in eczema:
international multiperspective Delphi consensus process. J Invest Dermatol 2011; 131:623-30.
22. Landheer J, de Bruin-Weller M, Boonacker C, Hijnen D, Bruijnzeel-Koomen C, Rockmann H. Utility of serum thymus and activation-
regulated chemokine as a biomarker for monitoring of atopic dermatitis severity. J Am Acad Dermatol 2014; 71:1160-6.
23. Imai T, Nagira M, Takagi S, Kakizaki M, Nishimura M, Wang J, et al. Selective recruitment of CCR4-bearing Th2 cells toward
antigen-presenting cells by the CC chemokines thymus and activation-regulated chemokine and macrophage-derived chemokine.
Int Immunol 1999; 11:81-8.
24. Schulz BL, Cooper-White J, Punyadeera CK. Saliva proteome research: current status and future outlook. Crit Rev Biotechnol
2013; 33:246-59.
25. Li W LM. Dried Blood Spots: Applications and Techniques: Wiley; 2014.
26. Garmhausen D, Hagemann T, Bieber T, Dimitriou I, Fimmers R, Diepgen T, et al. Characterization of different courses of atopic
dermatitis in adolescent and adult patients. Allergy 2013; 68:498-506.
27. Eyerich K, Novak N. Immunology of atopic eczema: overcoming the Th1/Th2 paradigm. Allergy 2013; 68:974-82.
28. Elias PM, Steinhoff M. “Outside-to-inside” (and now back to “outside”) pathogenic mechanisms in atopic dermatitis. J Invest
Dermatol 2008; 128:1067-70.
29. Howell MD, Kim BE, Gao P, Grant AV, Boguniewicz M, DeBenedetto A, et al. Cytokine modulation of atopic dermatitis filaggrin skin
expression. J Allergy Clin Immunol 2009; 124:R7-R12.
30. Oyoshi MK, Larson RP, Ziegler SF, Geha RS. Mechanical injury polarizes skin dendritic cells to elicit a T(H)2 response by inducing
cutaneous thymic stromal lymphopoietin expression. J Allergy Clin Immunol 2010; 126:976-84, 84 e1-5.
31. Deleuran M, Hvid M, Kemp K, Christensen GB, Deleuran B, Vestergaard C. IL-25 induces both inflammation and skin barrier
dysfunction in atopic dermatitis. Chem Immunol Allergy 2012; 96:45-9.
32. Savinko T, Matikainen S, Saarialho-Kere U, Lehto M, Wang G, Lehtimaki S, et al. IL-33 and ST2 in atopic dermatitis: expression
profiles and modulation by triggering factors. J Invest Dermatol 2012; 132:1392-400.
33. Jameson JL, Longo DL. Precision medicine--personalized, problematic, and promising. N Engl J Med 2015; 372:2229-34.
34. Corren J, Lemanske RF, Hanania NA, Korenblat PE, Parsey MV, Arron JR, et al. Lebrikizumab treatment in adults with asthma. N
Engl J Med 2011; 365:1088-98.
35. Crews KR, Hicks JK, Pui CH, Relling MV, Evans WE. Pharmacogenomics and individualized medicine: translating scienceinto

Chapter 1
14
1
practice. Clin Pharmacol Ther 2012; 92:467-75.
36. Ventola CL. Role of pharmacogenomic biomarkers in predicting and improving drug response: part 1: the clinical significance of
pharmacogenetic variants. P T 2013; 38:545-60.
37. van der Schaft J, van Schaik RH, van Zuilen AD, Hijnen DJ, Berg MT, van den Broek MP, et al. First experience with extended
release tacrolimus in the treatment of adult patients with severe, difficult to treat atopic dermatitis: Clinical efficacy, safety and dose
finding. J Dermatol Sci 2016; 81:66-8.
38. de Jonge H, Kuypers DR. Pharmacogenetics in solid organ transplantation: current status and future directions. Transplant Rev
(Orlando) 2008; 22:6-20.
39. Kuypers DR, Naesens M, Vermeire S, Vanrenterghem Y. The impact of uridine diphosphate-glucuronosyltransferase 1A9
(UGT1A9) gene promoter region single-nucleotide polymorphisms T-275A and C-2152T on early mycophenolic acid dose-
interval exposure in de novo renal allograft recipients. Clin Pharmacol Ther 2005; 78:351-61.
40. van Schaik RH, van Agteren M, de Fijter JW, Hartmann A, Schmidt J, Budde K, et al. UGT1A9 -275T>A/-2152C>T
polymorphisms correlate with low MPA exposure and acute rejection in MMF/tacrolimus-treated kidney transplant patients. Clin
Pharmacol Ther 2009; 86:319-27.

General introduction
15
1

IPART
SEVERITY BIOMARKERS

Chapter 2
18
2
2

Biomarkers for atopic dermatitis: a systematic review and meta-analysis
19
3
2
Biomarkers for atopic dermatitis: a systematic review and meta-analysis
Judith L. Thijs1, Todor Krastev1, Stephan Weidinger2, Constantinus F. Buckens3, Marjolein S. de Bru-
in-Weller1, Carla A.F.M. Bruijnzeel-Koomen1, Carsten Flohr4, DirkJan Hijnen1
1. Department of Dermatology and Allergy, University Medical Center Utrecht, Utrecht, The Netherlands
2. Department of Dermatology, Venereology and Allergy, University Hospital Schleswig-Holstein, Campus
Kiel, Germany
3. Department of Radiology, University Medical Center Utrecht, Utrecht, The Netherlands
4. Department of Paediatric Dermatology, St John’s Institute of Dermatology, Guy’s and St Thomas’
Hospitals NHS Foundation Trust and King’s College, London, United Kingdom
Current Opinion in Allergy and Clinical Immunology 2015 Oct;15(5):453-60.

Chapter 2
20
2 ABSTRACT
Purpose of review:
A large number of studies investigating the correlation between severity of atopic dermatitis (AD) and various
biomarkers have been published over the past decades. The aim of this review was to identify, evaluate
and synthesize the evidence examining the correlation of biomarkers with disease severity in AD patients,
something that has not been performed previously.
Findings:
Three electronic databases were systematically searched and relevant studies were selected for inclusion.
A total of 222 papers, reporting on 115 different biomarkers in 30.063 patients were critically appraised.
Studies were divided into two main groups. The first group consisted of longitudinal randomized controlled
trials and cohort studies, which reported measurements at multiple time points. The second contained cross-
sectional studies that reported only one measurement per patient. Out of 222 papers, 108 papers reported
sufficient data for meta-analysis. Only four biomarkers were eligible for meta-analysis in the longitudinal
group, and nine in the cross-sectional group.
Summary:
Serum TARC was found to be the most reliable biomarker studied, showing pooled correlation coefficients
of 0.60 (95%CI:0.48-0.70) and 0.64 (95%CI:0.57-0.70) in respectively longitudinal and cross-sectional
studies. Additional biomarkers that could prove useful but require additional research include serum CTACK,
sE-selectin, MDC, LDH and IL-18.

Biomarkers for atopic dermatitis: a systematic review and meta-analysis
21
3
2INTRODUCTION
Atopic dermatitis (AD) is a common, chronic inflammatory skin disease that is frequently associated with a
personal or family history of allergic asthma and/or rhinitis. AD can have profound effects on quality of life and
imposes a high socio-economic burden.1 There has been an increasing interest in AD over the past decades,
reflected in an exponential increase in publications. However, the use of different criteria for the diagnosis of
AD and different outcome measurements hampers study comparability.2
Quantifying disease severity using severity measurement tools such as the SCORing of Atopic
Dermatitis (SCORAD) and Eczema Area Severity Index (EASI) is time consuming and may be subject to intra-
and inter-observer variation.3 In addition, many severity measurement tools that are used in clinical trials have
not been validated. A systematic review of AD severity measurement tools found that 91% of AD clinical trials
used an objective severity measure, but less than a third of these scales had been previously published.4 In
addition, Schmitt et al. assessed the validity and reliability of the 20 most commonly used severity measures
for AD, and found that only three performed adequately. To address these deficiencies in reporting, leading
experts in the field have established the Harmonizing Outcome Measurements in Eczema (HOME) initiative,
an attempt to ensure that investigators employ a core set of outcome measures to enhance comparability
between studies.5 We suggest that in addition to improvements in clinical outcome reporting, an objective
serological measure for disease severity would be of great value for clinical research.
Over the past decades, a number of serum and plasma parameters (biomarkers) have been
found to correlate with disease severity in AD patients. These include a variety of proteins, such as cytokines,
chemokines, adhesion molecules and growth factors. In addition, numerous studies investigating the efficacy
of various treatments for AD patients have also reported biomarker levels in their patients. To the best of
our knowledge, a systematic review of this sprawling literature has not yet been performed. Our aim was to
identify, evaluate and synthesize the evidence examining the correlation of known biomarkers with disease
severity in AD patients.
Chapter 2
22
2 MATERIALS AND METHODS
Search strategy
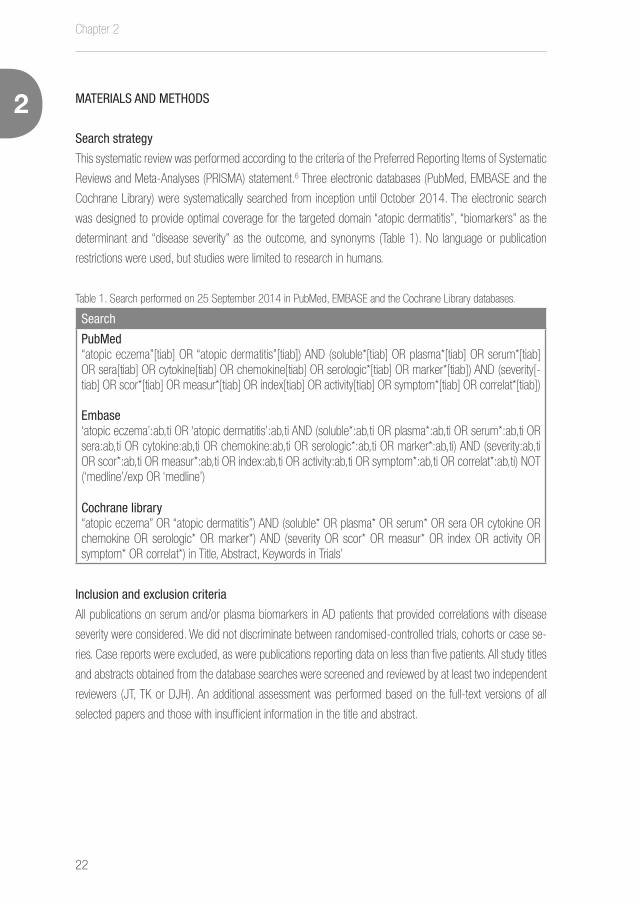
This systematic review was performed according to the criteria of the Preferred Reporting Items of Systematic
Reviews and Meta-Analyses (PRISMA) statement.6 Three electronic databases (PubMed, EMBASE and the
Cochrane Library) were systematically searched from inception until October 2014. The electronic search
was designed to provide optimal coverage for the targeted domain “atopic dermatitis”, “biomarkers” as the
determinant and “disease severity” as the outcome, and synonyms (Table 1). No language or publication
restrictions were used, but studies were limited to research in humans.
Table 1. Search performed on 25 September 2014 in PubMed, EMBASE and the Cochrane Library databases.
Search
PubMed“atopic eczema”[tiab] OR “atopic dermatitis”[tiab]) AND (soluble*[tiab] OR plasma*[tiab] OR serum*[tiab] OR sera[tiab] OR cytokine[tiab] OR chemokine[tiab] OR serologic*[tiab] OR marker*[tiab]) AND (severity[-tiab] OR scor*[tiab] OR measur*[tiab] OR index[tiab] OR activity[tiab] OR symptom*[tiab] OR correlat*[tiab])
Embase‘atopic eczema’:ab,ti OR ‘atopic dermatitis’:ab,ti AND (soluble*:ab,ti OR plasma*:ab,ti OR serum*:ab,ti OR sera:ab,ti OR cytokine:ab,ti OR chemokine:ab,ti OR serologic*:ab,ti OR marker*:ab,ti) AND (severity:ab,ti OR scor*:ab,ti OR measur*:ab,ti OR index:ab,ti OR activity:ab,ti OR symptom*:ab,ti OR correlat*:ab,ti) NOT (‘medline’/exp OR ‘medline’)
Cochrane library“atopic eczema” OR “atopic dermatitis”) AND (soluble* OR plasma* OR serum* OR sera OR cytokine OR chemokine OR serologic* OR marker*) AND (severity OR scor* OR measur* OR index OR activity OR symptom* OR correlat*) in Title, Abstract, Keywords in Trials’
Inclusion and exclusion criteria
All publications on serum and/or plasma biomarkers in AD patients that provided correlations with disease
severity were considered. We did not discriminate between randomised-controlled trials, cohorts or case se-
ries. Case reports were excluded, as were publications reporting data on less than five patients. All study titles
and abstracts obtained from the database searches were screened and reviewed by at least two independent
reviewers (JT, TK or DJH). An additional assessment was performed based on the full-text versions of all
selected papers and those with insufficient information in the title and abstract.

Biomarkers for atopic dermatitis: a systematic review and meta-analysis
23
3
2Figure 1. Flowchart of the study selection process.
Chapter 2
24
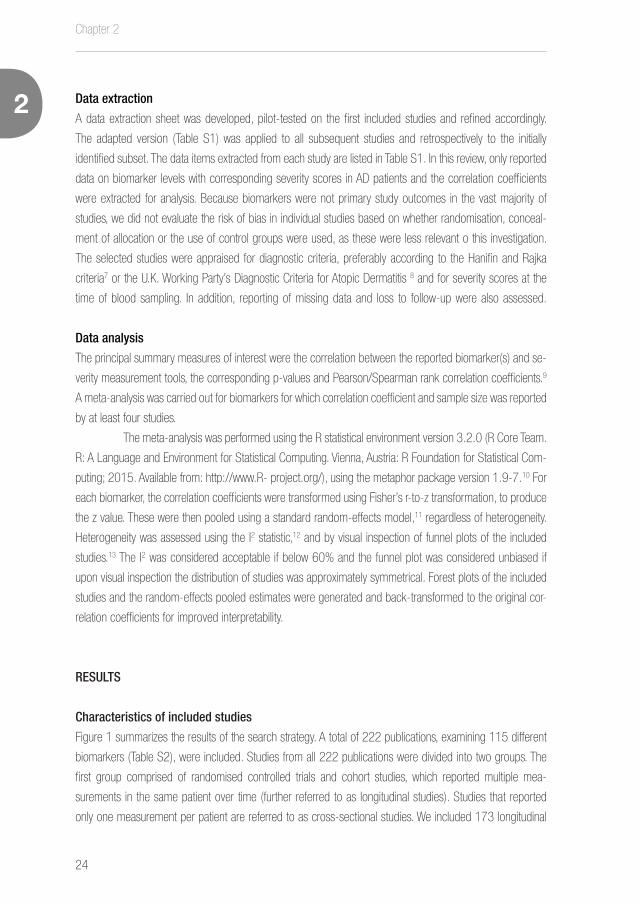
2 Data extraction
A data extraction sheet was developed, pilot-tested on the first included studies and refined accordingly.
The adapted version (Table S1) was applied to all subsequent studies and retrospectively to the initially
identified subset. The data items extracted from each study are listed in Table S1. In this review, only reported
data on biomarker levels with corresponding severity scores in AD patients and the correlation coefficients
were extracted for analysis. Because biomarkers were not primary study outcomes in the vast majority of
studies, we did not evaluate the risk of bias in individual studies based on whether randomisation, conceal-
ment of allocation or the use of control groups were used, as these were less relevant o this investigation.
The selected studies were appraised for diagnostic criteria, preferably according to the Hanifin and Rajka
criteria7 or the U.K. Working Party’s Diagnostic Criteria for Atopic Dermatitis 8 and for severity scores at the
time of blood sampling. In addition, reporting of missing data and loss to follow-up were also assessed.
Data analysis
The principal summary measures of interest were the correlation between the reported biomarker(s) and se-
verity measurement tools, the corresponding p-values and Pearson/Spearman rank correlation coefficients.9
A meta-analysis was carried out for biomarkers for which correlation coefficient and sample size was reported
by at least four studies.
The meta-analysis was performed using the R statistical environment version 3.2.0 (R Core Team.
R: A Language and Environment for Statistical Computing. Vienna, Austria: R Foundation for Statistical Com-
puting; 2015. Available from: http://www.R- project.org/), using the metaphor package version 1.9-7.10 For
each biomarker, the correlation coefficients were transformed using Fisher’s r-to-z transformation, to produce
the z value. These were then pooled using a standard random-effects model,11 regardless of heterogeneity.
Heterogeneity was assessed using the I2 statistic,12 and by visual inspection of funnel plots of the included
studies.13 The I2 was considered acceptable if below 60% and the funnel plot was considered unbiased if
upon visual inspection the distribution of studies was approximately symmetrical. Forest plots of the included
studies and the random-effects pooled estimates were generated and back-transformed to the original cor-
relation coefficients for improved interpretability.
RESULTS
Characteristics of included studies
Figure 1 summarizes the results of the search strategy. A total of 222 publications, examining 115 different
biomarkers (Table S2), were included. Studies from all 222 publications were divided into two groups. The
first group comprised of randomised controlled trials and cohort studies, which reported multiple mea-
surements in the same patient over time (further referred to as longitudinal studies). Studies that reported
only one measurement per patient are referred to as cross-sectional studies. We included 173 longitudinal

Biomarkers for atopic dermatitis: a systematic review and meta-analysis
25
3
2studies with data from a total of 5328 patients and an average follow-up between 4 and 3650 days. A total
of 56 biomarkers were reported in longitudinal studies. Cross-sectional studies comprised 148 publications
with data from a total of 15471 patients, reporting on 65 biomarkers. Some publications describing longi-
tudinal studies also presented cross-sectional study data resulting in overlap between groups. SCORing of
Atopic Dermatitis (SCORAD) was used in 132 studies (59.4% of studies) and thereby the most commonly
used severity score for AD Other disease severity measures included the Eczema Area and Severity Index
(EASI) in eleven studies (5.0%), the Costa score in nine studies (4.1% ), and the Six Area Six Sign Atopic
Dermatitis (SASSAD) in six studies (2.7%). In total, over 30 different clinical severity scores were used.
One hundred and eight papers, examining 64 biomarkers, reported sufficient data for meta-anal-
ysis. Four biomarkers were eligible for meta-analysis in the longitudinal group. In the cross-sectional group,
nine biomarkers were eligible for meta-analysis.
Meta-analysis
Thirty biomarkers have been investigated in 29 longitudinal studies providing sufficient data for me-
ta-analysis. Out of 30 biomarkers, only the correlation coefficients of levels of serum Thymus and Acti-
vation-Regulated Chemokine (TARC/CCL17), serum total IgE, serum Eosinophil Cationic Protein (ECP),
and serum sE-selectin were reported by at least four studies and were therefore eligible for meta-analy-
sis according to our inclusion criteria. The results of the meta-analysis of longitudinal studies are shown
in Figure 2a-2d. Eighty-four cross-sectional studies, investigating 49 biomarkers, provided sufficient
data for meta-analysis. Biomarkers that were reported by at least four studies and thus included in the
meta-analysis, included serum levels of TARC, ECP, total IgE, cutaneous T-cell-attracting chemokine
(CTACK/CCL27), CD30, IL-18, Lactate DeHydrogenase (LDH), macrophage-derived chemokine (MDC)
and Vitamin D. The results of the meta-analysis of cross-sectional studies are shown in Figure 3-5.
Total serum IgE was found the most frequently studied biomarker. However, pooling of data from
the longitudinal studies resulted in a weak correlation coefficient of 0.33 (95% CI: 0.08-0.64). Meta-analysis
of the cross-sectional studies showed only a moderate pooled correlation to disease severity of 0.45 (95% CI:
0.32-0.57). Funnel plot asymmetry was present in funnel plots for both longitudinal and cross-sectional studies
(Figures S1 and S2). Hence, we conclude that total serum IgE levels are not an appropriate biomarker for the
follow-up of disease severity in AD and correlates only moderately to disease severity on a single time point.
TARC/CCL17 is one of the key chemokines involved in homing of CCR4 expressing T cells to the
skin.14 Serum TARC levels were found to significantly correlate to disease severity in AD patients from four
longitudinal studies and in patients from 16 cross-sectional studies. Pooled correlation coefficients showed
a strong correlation in both longitudinal (r=60, 95% CI: 0.48-0.70) and cross-sectional studies (r=0.64,
95% CI: 0.57-0.70). This suggests that serum TARC/CCL17 could potentially be a valuable biomarker for
assessing disease severity in AD as well as evaluating the course of the disease. Although less frequently
investigated, reports on plasma TARC levels also show promising results, but require further investigation.
CTACK/CCL27 is another T cell attracting chemokine that is suggested to play an important role in

Chapter 2
26
2 skin inflammation in AD. CTACK is being produced by keratinocytes, and binds to its receptor CCR10 that is
expressed on skin homing T cells.15 Serum CTACK levels have only been reported in two studies, reporting on
follow up in 16 patients. However, a large number of cross-sectional studies reported serum CTACK levels, and
meta-analysis showed a strong correlation to disease severity (r=0.68, 95% CI: 0.47-0.82). Inspection of the
funnel plot revealed asymmetry. Additional data is needed to determine its usability in the follow-up of AD patients.
Serum sE-selectin is a cell adhesion molecule expressed on vascular endothelium, important
for the migration of inflammatory cells from blood to tissue.16 Four longitudinal studies reported correlation
coefficients, resulting in a pooled correlation coefficient of 0.44 (95% CI: 0.23-0.62), indicating a moderate
correlation. Serum sE-selectin might be a good candidate as a biomarker for disease severity, but requires
further investigation.
ECP is a protein that is released during degranulation of eosinophils. Serum ECP was one of the first
biomarkers related to disease severity in AD.17 Serum ECP was frequently measured during follow-up in longi-
tudinal studies, but only showed a pooled correlation coefficient of 0.34 (95% CI: 0.08-0.56). Cross-section-
al studies showed correlations varying from -0.06 to 0.76, with a pooled correlation coefficient of 0.43 (95%
CI 0.28-0.56). Funnel plots for both longitudinal and cross-sectional studies revealed some asymmetry on
inspection. We conclude that the usability of serum ECP as a biomarker for disease severity is questionable.
MDC/CCL22, like TARC, is a chemoattractant for CCR4-expressing skin homing T
Figure 2A-D. Forest plots of meta-analysis of longitudinal studies.
The heterogeneity (I2) for TARC was 0%; E-Selectin: 0%; IgE: 78%; and ECP: 74%.
A. B.
C. D.
RE Model
0.00 0.40 0.80Correlation Coefficient
Kimura (2014)Beck (2014)Kwon (2009)Fujisawa (2009)
0.68 [ 0.40 , 0.84 ]0.66 [ 0.48 , 0.79 ]0.55 [ 0.14 , 0.80 ]0.48 [ 0.22 , 0.68 ]
0.60 [ 0.48 , 0.70 ]
TARC
RE Model
-0.20 0.20 0.60 1.00Correlation Coefficient
Angelova (2006)Gutgesell (2002)Czech (1996)Morita (1995)
0.50 [ 0.09 , 0.77 ]0.38 [ -0.08 , 0.70 ]0.27 [ -0.15 , 0.61 ]0.73 [ 0.27 , 0.92 ]
0.44 [ 0.23 , 0.62 ]
E-selectin
RE Model
-0.50 0.00 0.50 1.00Correlation Coefficient
Salomon (2008)Neuber (2000)Stevens (1998)Gebhardt (1997)
0.68 [ 0.49 , 0.81 ]0.40 [ -0.31 , 0.82 ]0.10 [ -0.32 , 0.48 ]0.00 [ -0.29 , 0.29 ]
0.33 [ -0.08 , 0.64 ]
IgE
RE Model
-0.50 0.00 0.50 1.00Correlation Coefficient
Angelova (2006)Petermann (2004)Gutgesell (2002)Halmerbauer (1997)Gebhardt (1997)Czech (1992)
0.65 [ 0.30 , 0.84 ]0.10 [ -0.08 , 0.28 ]0.06 [ -0.39 , 0.49 ]0.50 [ 0.07 , 0.77 ]0.09 [ -0.15 , 0.32 ]0.67 [ 0.31 , 0.86 ]
0.34 [ 0.08 , 0.56 ]
ECP

Biomarkers for atopic dermatitis: a systematic review and meta-analysis
27
3
2cells.18 Serum MDC levels showed a strong pooled correlation coefficient in the meta-analysis of
cross-sectional studies of 0.66 (95% CI: 0.52-0.77). Correlation coefficients have only been re-
ported in two longitudinal studies, therefore a meta-analysis on longitudinal studies was not pos-
sible. We conclude that serum MDC is suitable biomarker for measuring disease severity at a sin-
gle time point, but additional data is needed to determine its usability in the follow-up of AD patients.
LDH is an enzyme found in nearly all tissue cells and catalyzes the conversion of pyruvate to lac-
Biomarkers showing a strong correlation with disease severity (heterogeneity (I2) for TARC: 70%; MDC 22%; CTACK: 93%; IL-18: 97%; LDH: 43%)
Figure 3A-E. Forest plots of meta-analysis of cross-sectional studies.
RE Model
-0.20 0.20 0.60 1.00Correlation Coefficient
Landheer (2014)Kataoka (2014)Mizawa (2013)Kou (2012)Machura (2011)van Velsen (2010)Fujisawa (2009)Nakazato (2008)Song (2006b)Song (2006a)Jahnz-Rozyk (2005)Hon (2004) (3)Hijnen (2004)Leung (2003)Kakinuma (2001)
0.48 [ 0.39 , 0.56 ]0.67 [ 0.55 , 0.77 ]0.57 [ 0.26 , 0.77 ]0.79 [ 0.72 , 0.85 ]0.70 [ 0.43 , 0.85 ]0.51 [ 0.29 , 0.68 ]0.60 [ 0.46 , 0.71 ]0.72 [ 0.50 , 0.85 ]0.67 [ 0.57 , 0.75 ]0.60 [ 0.47 , 0.71 ]0.82 [ 0.69 , 0.90 ]0.75 [ 0.17 , 0.94 ]0.56 [ 0.49 , 0.62 ]0.39 [ -0.06 , 0.71 ]0.60 [ -0.05 , 0.89 ]
0.64 [ 0.57 , 0.70 ]
TARC
RE Model
0.00 0.40 0.80Correlation Coefficient
Nakazato (2008)Angelova (2006)Jahnz-Rozyk (2005)Hon (2004) (3)Leung (2003)
0.54 [ 0.24 , 0.74 ]0.55 [ 0.16 , 0.79 ]0.76 [ 0.60 , 0.86 ]0.87 [ 0.48 , 0.97 ]0.61 [ 0.23 , 0.83 ]
0.66 [ 0.52 , 0.77 ]
MDC
RE Model
0.00 0.40 0.80Correlation Coefficient
Machura (2011)Nakazato (2008)Song (2006b)*Song (2006a)*Hon (2004) (3)Hon (2004)Hijnen (2004)
0.79 [ 0.58 , 0.90 ]0.83 [ 0.69 , 0.91 ]0.54 [ 0.39 , 0.66 ]0.43 [ 0.29 , 0.55 ]0.92 [ 0.88 , 0.94 ]0.39 [ 0.08 , 0.64 ]0.52 [ 0.40 , 0.62 ]
0.68 [ 0.47 , 0.82 ]
CTACK
RE Model
0.00 0.40 0.80Correlation Coefficient
Kou (2012)Park (2007)Kim (2007)Aral (2006)Hon (2004) (2)Yoshizawa (2002)
0.47 [ 0.32 , 0.60 ]0.41 [ 0.18 , 0.59 ]0.49 [ 0.25 , 0.68 ]0.99 [ 0.97 , 1.00 ]0.50 [ 0.06 , 0.78 ]0.39 [ 0.00 , 0.68 ]
0.68 [ 0.15 , 0.91 ]
IL-18
RE Model
0.00 0.40 0.80Correlation Coefficient
Kataoka (2014)Mizawa (2013)Kou (2012)Morishima (2010)
0.45 [ 0.27 , 0.60 ]0.46 [ 0.12 , 0.70 ]0.45 [ 0.30 , 0.59 ]0.68 [ 0.51 , 0.80 ]
0.51 [ 0.38 , 0.62 ]
LDH
A. B.
C. D.
E.

Chapter 2
28
2 Figure 4A-B: Forest plots of meta-analysis of cross-sectional studies.
Biomarkers showing a moderate correlation with disease severity (heterogeneity (I2) IgE: 92%; ECP: 67%).
A.
B.
RE Model
-1.00 0.00 1.00Correlation Coefficient
Kataoka (2014)Suarez-Farinas (2013b)*Suarez-Farinas (2013a)*Mizawa (2013)Hon (2013)Kou (2012)Vakirlis (2011)Nagy (2011)Alendar (2011)Morishima (2010)Park (2007)Hon (2007)Song (2006)Park (2006b)*Park (2006a)*Murat-Susic (2006)Lee (2006)Heshmat (2006)Aral (2006)Jahnz-Rozyk (2005)Laske (2004)Kaneko (2003)Gool (2003)Yoshizawa (2002)Folster (2002)Tanaka (2001)Kato (2000)Back (1995)Church (1976)
0.33 [ 0.14 , 0.50 ]0.11 [ -0.60 , 0.72 ]0.76 [ 0.59 , 0.86 ]0.30 [ -0.07 , 0.60 ]0.52 [ 0.35 , 0.66 ]0.30 [ 0.13 , 0.46 ]0.59 [ 0.22 , 0.82 ]0.44 [ 0.26 , 0.60 ]0.01 [ -0.24 , 0.26 ]0.21 [ -0.05 , 0.44 ]0.32 [ 0.08 , 0.52 ]0.62 [ 0.32 , 0.80 ]0.13 [ 0.01 , 0.25 ]0.20 [ 0.03 , 0.35 ]0.26 [ -0.07 , 0.54 ]0.15 [ -0.14 , 0.41 ]0.43 [ 0.22 , 0.60 ]0.20 [ -0.05 , 0.43 ]0.99 [ 0.97 , 1.00 ]0.62 [ 0.39 , 0.78 ]0.31 [ 0.21 , 0.40 ]0.54 [ 0.22 , 0.75 ]0.09 [ -0.11 , 0.28 ]0.42 [ 0.04 , 0.69 ]0.54 [ 0.36 , 0.68 ]0.57 [ 0.17 , 0.81 ]0.47 [ 0.28 , 0.63 ]0.49 [ 0.03 , 0.78 ]0.72 [ 0.44 , 0.87 ]
0.45 [ 0.32 , 0.57 ]
IgE
RE Model
-0.50 0.00 0.50 1.00Correlation Coefficient
Namura (2007)Park (2006b)*Park (2006a)*Murat-Susic (2006)Angelova (2006)Hon (2004) (3)Capoluongo (2001)Breuer (2001)Pucci (2000)Kojima (1994)Czech (1992)
0.30 [ 0.06 , 0.51 ] 0.46 [ 0.32 , 0.59 ] 0.48 [ 0.18 , 0.69 ]-0.06 [ -0.34 , 0.22 ] 0.65 [ 0.30 , 0.84 ] 0.47 [ -0.29 , 0.86 ] 0.76 [ 0.61 , 0.86 ] 0.34 [ 0.03 , 0.59 ] 0.40 [ 0.15 , 0.60 ] 0.40 [ 0.14 , 0.62 ] 0.42 [ -0.04 , 0.73 ]
0.43 [ 0.28 , 0.56 ]
ECP
Biomarkers for atopic dermatitis: a systematic review and meta-analysis
29
3
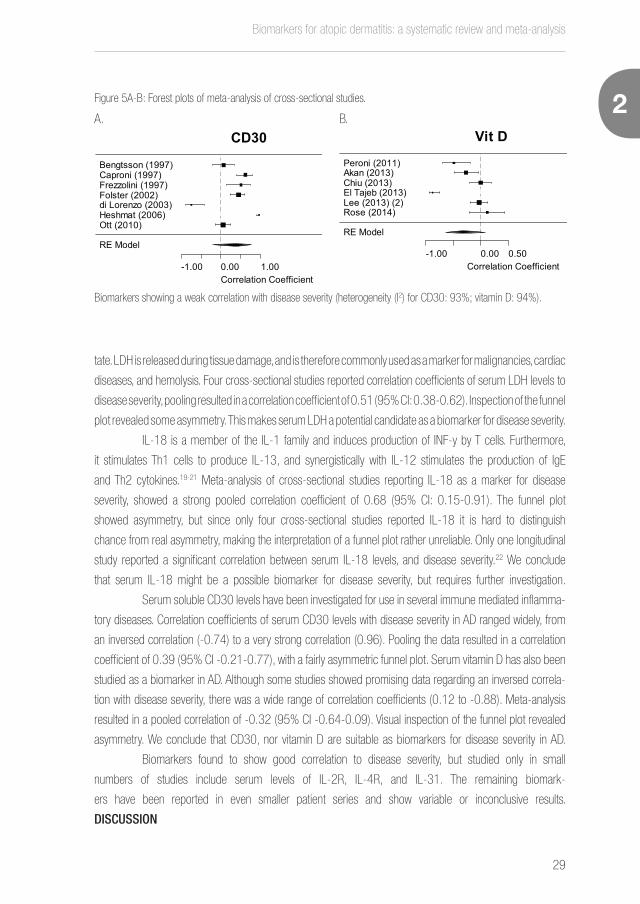
2Figure 5A-B: Forest plots of meta-analysis of cross-sectional studies.
Biomarkers showing a weak correlation with disease severity (heterogeneity (I2) for CD30: 93%; vitamin D: 94%).
RE Model
-1.00 0.00 1.00Correlation Coefficient
Ott (2010)Heshmat (2006)di Lorenzo (2003)Folster (2002)Frezzolini (1997)Caproni (1997)Bengtsson (1997)
0.06 [ -0.14 , 0.25 ] 0.96 [ 0.89 , 0.99 ]-0.74 [ -0.90 , -0.42 ] 0.45 [ 0.25 , 0.61 ] 0.51 [ 0.14 , 0.75 ] 0.62 [ 0.38 , 0.78 ] 0.07 [ -0.22 , 0.35 ]
0.39 [ -0.21 , 0.77 ]
CD30
RE Model
-1.00 0.00 0.50Correlation Coefficient
Rose (2014)Lee (2013) (2)El Tajeb (2013)Chiu (2013)Akan (2013)Peroni (2011)
0.12 [ -0.21 , 0.42 ]-0.03 [ -0.18 , 0.13 ]-0.88 [ -0.94 , -0.76 ] 0.00 [ -0.20 , 0.20 ]-0.27 [ -0.47 , -0.04 ]-0.49 [ -0.70 , -0.20 ]
-0.32 [ -0.64 , 0.09 ]
Vit DA. B.
tate. LDH is released during tissue damage, and is therefore commonly used as a marker for malignancies, cardiac
diseases, and hemolysis. Four cross-sectional studies reported correlation coefficients of serum LDH levels to
disease severity, pooling resulted in a correlation coefficient of 0.51 (95% CI: 0.38-0.62). Inspection of the funnel
plot revealed some asymmetry. This makes serum LDH a potential candidate as a biomarker for disease severity.
IL-18 is a member of the IL-1 family and induces production of INF-y by T cells. Furthermore,
it stimulates Th1 cells to produce IL-13, and synergistically with IL-12 stimulates the production of IgE
and Th2 cytokines.19-21 Meta-analysis of cross-sectional studies reporting IL-18 as a marker for disease
severity, showed a strong pooled correlation coefficient of 0.68 (95% CI: 0.15-0.91). The funnel plot
showed asymmetry, but since only four cross-sectional studies reported IL-18 it is hard to distinguish
chance from real asymmetry, making the interpretation of a funnel plot rather unreliable. Only one longitudinal
study reported a significant correlation between serum IL-18 levels, and disease severity.22 We conclude
that serum IL-18 might be a possible biomarker for disease severity, but requires further investigation.
Serum soluble CD30 levels have been investigated for use in several immune mediated inflamma-
tory diseases. Correlation coefficients of serum CD30 levels with disease severity in AD ranged widely, from
an inversed correlation (-0.74) to a very strong correlation (0.96). Pooling the data resulted in a correlation
coefficient of 0.39 (95% CI -0.21-0.77), with a fairly asymmetric funnel plot. Serum vitamin D has also been
studied as a biomarker in AD. Although some studies showed promising data regarding an inversed correla-
tion with disease severity, there was a wide range of correlation coefficients (0.12 to -0.88). Meta-analysis
resulted in a pooled correlation of -0.32 (95% CI -0.64-0.09). Visual inspection of the funnel plot revealed
asymmetry. We conclude that CD30, nor vitamin D are suitable as biomarkers for disease severity in AD.
Biomarkers found to show good correlation to disease severity, but studied only in small
numbers of studies include serum levels of IL-2R, IL-4R, and IL-31. The remaining biomark-
ers have been reported in even smaller patient series and show variable or inconclusive results.
DISCUSSION

Chapter 2
30
2In search of an objective biomarker for disease severity, this review aimed to synthesize results from all
available publications, not limited to studies focusing on the identification of a biomarker. A meta-analysis
of both longitudinal and cross-sectional studies revealed that currently serum TARC levels perform best
as an objective biomarker for disease severity, showing strong pooled correlation coefficients in both lon-
gitudinal and cross-sectional studies. Although serum sE-selectin was reported by only four longitudinal
studies, it showed a moderate correlation to disease severity and might also be a good candidate as a
biomarker for disease severity. Meta-analysis of cross sectional studies reporting serum levels of CTACK,
MDC, LDH and IL-18 showed that these markers are potentially good biomarkers for disease severity.
However, these biomarkers were less frequently studied in longitudinal studies, and additional data is needed
to determine their usability in the follow-up of AD patients. Although total serum IgE was found the most
frequently studied biomarker, we conclude that it is not an appropriate biomarker for longitudinal studies.
Limitations of this study are the occurrence of potential selection- and publication bias. The initial
search yielded 222 relevant publications reporting on 93 different biomarkers. Only 16 percent of lon-
gitudinal studies, and 57 percent of cross-sectional studies provided sufficient data for inclusion in our
meta-analysis. The occurrence of selection bias in the results of the meta-analyses is therefore inevita-
ble. Funnel plot asymmetry was present in a fairly large number of the meta-analysed biomarkers, indi-
cating publication bias. Publication bias may have caused overestimation of the correlation coefficients of
the biomarkers reported in this paper. Publication of biomarker data might be influenced by the direction
and statistical significance of the correlation between a biomarker and disease severity, as non-significant
study outcomes might be less likely published. Although we did not limit our search on language, it was
not possible to retrieve data from 110 non-English publications. In addition, 176 out of 908 publications
selected for screening were not available at our institutions. Despite these caveats, our synthesis of the
disparate and prolific literature has yielded interesting new insights into several promising biomarkers.
Most studies included in this review reported on one, or only a limited number of biomarkers.
Because AD is known to be a highly heterogeneous disease and different clinical phenotypes have been
described, we hypothesized that it may be useful to simultaneously investigate a panel of biomarkers. From
our own experience we know e.g. that a small subset of patients with severe AD have serum TARC levels
in the normal range. These patients may represent a distinct immunological subtype for which biomarkers
other than TARC may have additional value. Indeed, we recently reported that a combination of serum bio-
markers shows a better correlation with disease severity compared to single biomarkers in AD patients.23
We conclude that serum TARC is the most reliable biomarker currently available. Serum TARC
levels have been determined in relatively large numbers of patients from different studies, showing pooled
correlation coefficients of 0.60 (95% CI: 0.48-0.70) and 0.64 (95% CI: 0.57-0.70) in longitudinal and
cross-sectional studies, respectively. Additional biomarkers that could prove useful but require additional
research include serum CTACK, serum sE-selectin, serum MDC, serum LDH and serum IL-18.
SUPPLEMENTARY DATA

Biomarkers for atopic dermatitis: a systematic review and meta-analysis
31
3
2See http://www.dermatologyutrecht.nl/index.php/9-public/115-thijs
REFERENCES
1. Mancini AJ, Kaulback K, Chamlin SL. The socioeconomic impact of atopic dermatitis in the United States: A systematic
review. Pediatric dermatology 2008; 25:1-6.
2. Flohr C. Atopic dermatitis diagnostic criteria and outcome measures for clinical trials: still a mess. J Invest Dermatol
2011; 131:557-9.
3. Charman CR, Venn AJ, Williams HC. Measurement of body surface area involvement in atopic eczema: an impossible
task? Br J Dermatol 1999; 140:109-11.
4. Charman C, Chambers C, Williams H. Measuring atopic dermatitis severity in randomized controlled clinical trials: What
exactly are we measuring? Journal of Investigative Dermatology 2003; 120:932-41.
5. Schmitt J, Langan S, Stamm T, Williams HC. Core Outcome Domains for Controlled Trials and Clinical Recordkeeping
in Eczema: International Multiperspective Delphi Consensus Process. Journal of Investigative Dermatology 2011;
131:623-30.
6. Moher D, Liberati A, Tetzlaff J, Altman DG. Preferred Reporting Items for Systematic Reviews and Meta-Analyses: The
PRISMA Statement. Journal of Clinical Epidemiology 2009; 62:1006-12.
7. Hanifin JM, Rajka G. Diagnostic features of atopic dermatitis. Acta Derm.Venereol. 1980; 92:44-7.
8. Williams HC, Burney PGJ, Hay RJ, Archer CB, Shipley MJ, Hunter JJA, et al. The Uk Working Party Diagnostic-Criteria for
Atopic-Dermatitis .1. Derivation of A Minimum Set of Discriminators for Atopic-Dermatitis. British Journal of Dermatology
1994; 131:383-96.
9. Stewart A. Basic Statistics and Epidemiology: A Practical Guide; 2010.
10. Viechtbauer W. Conducting meta-analyses in R with the metafor package. . Journal of Statistical Software 2010; 36:1-
48.
11. Jackson D, Turner R, Rhodes K, Viechtbauer W. Methods for calculating confidence and credible intervals for the residual
between-study variance in random effects meta-regression models. BMC Med Res Methodol 2014; 14:103.
12. Higgins JP, Thompson SG. Quantifying heterogeneity in a meta-analysis. Stat Med 2002; 21:1539-58.
13. Sterne JA, Egger M, Smith GD. Systematic reviews in health care: Investigating and dealing with publication and other
biases in meta-analysis. BMJ 2001; 323:101-5.
14. Imai T, Nagira M, Takagi S, Kakizaki M, Nishimura M, Wang J, et al. Selective recruitment of CCR4-bearing Th2 cells to-
ward antigen-presenting cells by the CC chemokines thymus and activation-regulated chemokine and macrophage-de-
rived chemokine. Int Immunol 1999; 11:81-8.
15. Homey B, Alenius H, Muller A, Soto H, Bowman EP, Yuan W, et al. CCL27-CCR10 interactions regulate T cell-mediated
skin inflammation. Nat Med 2002; 8:157-65.
16. Rossiter H, van Reijsen F, Mudde GC, Kalthoff F, Bruijnzeel-Koomen CA, Picker LJ, et al. Skin disease-related T cells bind

Chapter 2
32
2 to endothelial selectins: expression of cutaneous lymphocyte antigen (CLA) predicts E-selectin but not P-selectin binding.
Eur J Immunol 1994; 24:205-10.
17. Juhlin L, Venge P. Eosinophilic cationic protein (ECP) in skin disorders. Acta Derm Venereol 1991; 71:495-501.
18. Vestergaard C, Yoneyama H, Murai M, Nakamura K, Tamaki K, Terashima Y, et al. Overproduction of Th2-specific chemo-
kines in NC/Nga mice exhibiting atopic dermatitis-like lesions. J Clin Invest 1999; 104:1097-105.
19. Hata H, Yoshimoto T, Hayashi N, Hada T, Nakanishi K. IL-18 together with anti-CD3 antibody induces human Th1 cells to
produce Th1- and Th2-cytokines and IL-8. Int Immunol 2004; 16:1733-9.
20. Hoshino T, Wiltrout RH, Young HA. IL-18 is a potent coinducer of IL-13 in NK and T cells: a new potential role for IL-18
in modulating the immune response. J Immunol 1999; 162:5070-7.
21. Hoshino T, Yagita H, Ortaldo JR, Wiltrout RH, Young HA. In vivo administration of IL-18 can induce IgE production
through Th2 cytokine induction and up-regulation of CD40 ligand (CD154) expression on CD4+ T cells. Eur J Immunol
2000; 30:1998-2006.
22. Kou K, Aihara M, Matsunaga T, Chen H, Taguri M, Morita S, et al. Association of serum interleukin-18 and other biomark-
ers with disease severity in adults with atopic dermatitis. Arch Dermatol Res 2012; 304.
23. Thijs JL, Nierkens S, Herath A, Bruijnzeel-Koomen CA, Knol EF, Giovannone B, et al. A panel of biomarkers for disease
severity in atopic dermatitis. Clin Exp Allergy 2015; 45:698-701.
A complete list of references to all 222 publications can be found in the supplementary data file.

Biomarkers for atopic dermatitis: a systematic review and meta-analysis
33
3
2

3

A panel of biomarkers for disease severity in atopic dermatitis
Judith L. Thijs1, Stefan Nierkens2, Athula Herath3, Carla A.F.M. Bruijnzeel-Koomen1, Edward F. Knol1,4, Bar-
bara Giovannone1, Marjolein S. de Bruin-Weller1 and DirkJan Hijnen1
1. Department of Dermatology and Allergology, University Medical Center Utrecht, The Netherlands
2. U-DAIR and Laboratory of Translational Immunology, University Medical Center Utrecht, The Netherlands
3. MedImmune Biotech, Cambridge, UK
4. Department of Immunology, University Medical Center Utrecht, The Netherlands
Clinical and Experimental Allergy 2015 Mar;45(3):698-701.
Chapter 3
36
3
To the editor,
A large number of biomarkers have been found to correlate with disease severity in atopic dermatitis (AD).
The most frequently reported serum biomarkers for disease severity in AD include eosinophilic cationic protein
(ECP), total IgE, soluble interleukin-2 receptor (sIL-2R), and thymus and activation-regulated chemokine
(TARC/CCL17). In a systemic review on serum biomarkers for disease severity in AD we found that TARC
showed the best correlation to disease severity, with weighted mean r-values of 0.51 and 0.63 in longitudinal
and cross-sectional studies, respectively.1
Serum TARC levels show a strong correlation to disease severity in the follow-up of individual
patients. Patients with similar disease severity scores, however, show varying TARC levels in cross-sectional
cohorts of patients, consequently showing low correlation between TARC and disease severity. AD is known
to be a highly heterogeneous disease and these low correlations may be the result of this heterogeneity.
None of the individual (serological) biomarkers that have been studied previously were found to show a
better correlation with disease severity than TARC. Therefore, the aim of this study was to explore if a panel of
biomarkers shows a better correlation with disease severity compared to individual biomarkers.
We included seventeen patients (six male and 11 female), mean age 33 years with moderate to severe
AD (SASSAD range: 20-54; BSA range: 24-100%) that were admitted to the hospital after exacerbation
of eczema. Patients were diagnosed with AD according to the criteria of Hanifin and Rajka.2 All patients
showed elevated total IgE levels (range: 275-76942 IU/mL; mean: 19006 IU/mL). Fifteen patients were also
diagnosed with allergic asthma and/or allergic rhinitis. Disease severity was assessed using the Six Area Six
Sign Atopic Dermatitis (SASSAD) score, which has been shown to have a good inter-observer agreement.3 In
addition, body surface area (BSA) involvement was determined. All patients were treated with potent topical
corticosteroids (class III, European classification system). Patients using oral immunosuppressive medications
were not included. Serum samples were obtained at admission to the hospital and after about two weeks of
treatment (mean interval: 12.8 days). The protocols of this study were approved by the Institutional Review
Board of the University Medical Center Utrecht (Utrecht, The Netherlands), adhering to the Declaration of
Helsinki Principles.
Cytokine analyses were performed using a multiplex platform, as described previously.4
Measurements were performed in undiluted samples, except for RANTES, PARC, TARC, and sE-selectin
(1:100). Data was analyzed by 5-parametric curve fitting using Bio-Plex Manager software, version 6.1
(Biorad, Hercules, CA). Multiplex immunoassays were in-house validated and show an intra- and inter assay
variability of less than 5% and 20%, respectively, and recovery values of spikes proteins in serum of 99-
102%.
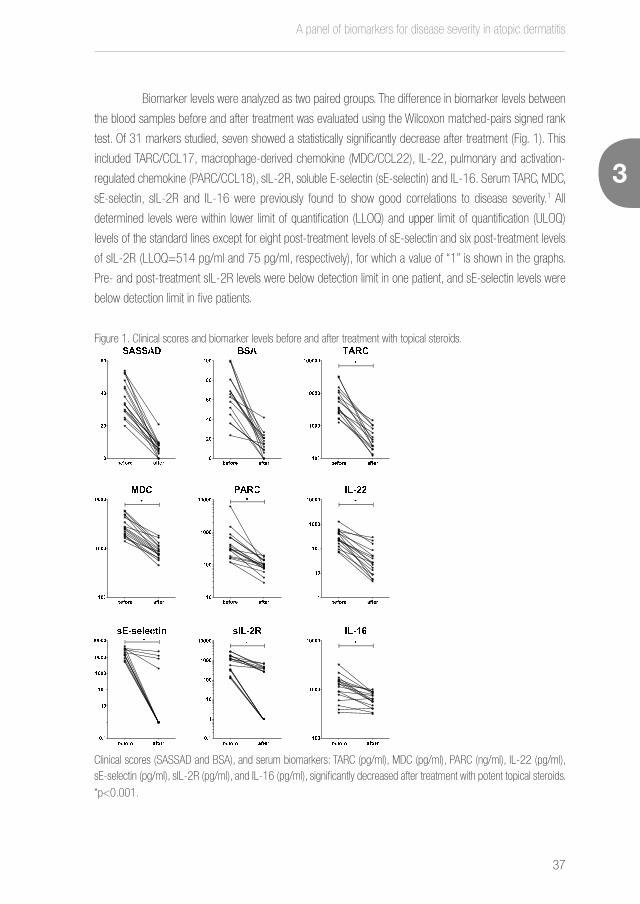
All patients showed significant clinical improvement after treatment with potent topical steroids. SASSAD
scores decreased from 36.9 at baseline to 8.0 after two weeks of treatment. BSA involvement decreased
from 65.4% at baseline to 18.5% after treatment (Fig. 1).
A panel of biomarkers for disease severity in atopic dermatitis
37
3
Biomarker levels were analyzed as two paired groups. The difference in biomarker levels between
the blood samples before and after treatment was evaluated using the Wilcoxon matched-pairs signed rank
test. Of 31 markers studied, seven showed a statistically significantly decrease after treatment (Fig. 1). This
included TARC/CCL17, macrophage-derived chemokine (MDC/CCL22), IL-22, pulmonary and activation-
regulated chemokine (PARC/CCL18), sIL-2R, soluble E-selectin (sE-selectin) and IL-16. Serum TARC, MDC,
sE-selectin, sIL-2R and IL-16 were previously found to show good correlations to disease severity.1 All
determined levels were within lower limit of quantification (LLOQ) and upper limit of quantification (ULOQ)
levels of the standard lines except for eight post-treatment levels of sE-selectin and six post-treatment levels
of sIL-2R (LLOQ=514 pg/ml and 75 pg/ml, respectively), for which a value of “1” is shown in the graphs.
Pre- and post-treatment sIL-2R levels were below detection limit in one patient, and sE-selectin levels were
below detection limit in five patients.
Figure 1. Clinical scores and biomarker levels before and after treatment with topical steroids.
Clinical scores (SASSAD and BSA), and serum biomarkers: TARC (pg/ml), MDC (pg/ml), PARC (ng/ml), IL-22 (pg/ml), sE-selectin (pg/ml), sIL-2R (pg/ml), and IL-16 (pg/ml), significantly decreased after treatment with potent topical steroids.
*p<0.001.

Chapter 3
38
3
Stepwise regression analysis with leave one out cross validation was used to assess the best combination of
biomarkers to predict disease severity. The analysis was carried out using the R statistical package, Version
3.1. To find the best predictor of disease severity (SASSAD score) a linear combination was explored, using
the pre-treatment levels of TARC, MDC, PARC, IL-22, sE-selectin, sIL-2R and IL-16. This established an
equation (SASSAD= -39.89 - 6.95 * sex male + 1.78 * log(TARC) + 9.12 * log(PARC) + 4.52 * log(IL-22)
- 2.51 * log(sIL-2R)) for predicting disease severity. This five-parameter multivariate signature containing
demographic characteristics of gender (sex), and the four molecular mediators of TARC, PARC, IL-22, sIL-2R
showed a correlation coefficient of 0.856 (Fig. 2), whereas the correlation coefficient to disease severity for
the individual biomarkers ranged from 0.415 to 0.742. This confirms our hypothesis that a panel of biomark-
ers shows a better correlation to disease severity compared to individual biomarkers.
Figure 2. The relationship between the five-parameter signature score and SASSAD score. AD is a highly heterogeneous disease.
In search of a molecular predictor for disease severity, we have systematically assessed the predictivity of disease severity using a collection of mediators in blood. The five-parameter multivariate signature containing demographic characteristics of gender (sex), and four molecular mediators (TARC, PARC, IL-22, sIL-2R) robustly predicts the SASSAD score. The mathematical relationship between the SASSAD and the five-parameter signature can be denoted by: SASSAD= -39.89 - 6.95 * sex male + 1.78 * log(TARC) + 9.12 * log(PARC) + 4.52 * log(IL-22) - 2.51 * log(sIL-2R).
A panel of biomarkers for disease severity in atopic dermatitis
39
3
From our experience we know that some patients with severe AD have serum TARC levels in the normal
range, and on the other hand some patients present with mild to moderate disease and high TARC levels.
These patients may represent a subset for which TARC as a single biomarker is not suitable. These outliers
contribute to the moderate correlations between TARC levels and disease severity in previous publications.5
These preliminary observations emphasize that not only clinically, but also on serum biomarker level, AD is a
heterogeneous disease. The use of a multivariate biomarker signature to predict disease severity seems to
overcome this problem as shown here.
The biomarkers included in our panel (TARC, PARC, IL-22 and sIL-2R) are involved in inflammation
and have been found to play a role in the pathogenesis of AD. TARC and PARC are members of the CC
chemokine family and are involved in the recruitment of T cells into the skin.6 sIL-2R is synthesized and
secreted by T cells, sIL-2R levels reflect the activation state of the T cells in the skin.6 IL-22 is a member of
the IL-10 family. IL-22 induces keratinocyte proliferation resulting in acanthosis, one of the histopathological
hallmarks of AD.7 We recently showed production of IL-22 by both CD4+ and CD8+ T cells isolated from
the skin of AD patients.8 In vivo experiments using cultured human keratinocytes have shown that IL-22
downregulates filaggrin expression and affects expression of profilaggrin processing enzymes, contributing
to epidermal barrier dysfunction in AD.9 Taken together, all four biomarkers play an important role in the
pathogenesis of AD. Expression of these biomarkers in skin is reflected by their serum levels and the
combination of their serum levels comprises a signature that reflects disease severity in AD patients. In
addition, this is the first study that shows correlation between serum IL-22 levels and treatment effect in AD
patients.
In conclusion, we found that a combination of serum biomarkers demonstrates a better correlation with
disease severity compared to a single biomarker in AD patients. Although confirmation of our results in larger
cohorts of patients is needed, it shows that using a panel of biomarkers may be necessary in a multifactorial,
complex disease such as AD. With the strong predictive value of biomarkers in treatment of atopic disease
with biologicals, the introduction of biologics in the treatment of AD and the lack of consensus on the use of
disease severity measures, we believe that these preliminary data are promising and warrant further studies
that explore the use of a panel of biomarkers as a disease severity measurement and possibly treatment
predictive tool. In addition, we showed that serum IL-22 levels correlate with disease activity in AD patients.
These findings further support a role for the IL-22 pathway in AD.

Chapter 3
40
3
REFERENCES
1. Thijs J, Krastev T, Weidinger S, Buckens CF, de Bruin-Weller M, Bruijnzeel-Koomen C, et al. Biomarkers for atopic derma-
titis: a systematic review and meta-analysis. Curr Opin Allergy Clin Immunol 2015; 15:453-60.
2. Hanifin JM, Rajka G. Diagnostic Features of Atopic-Dermatitis. Acta Derm Venereol 1980:44-7.
3. Charman CR, Venn AJ, Williams HC. Reliability testing of the Six Area, Six Sign Atopic Dermatitis severity score. Br J
Dermatol 2002; 146:1057-60.
4. de Jager W, te Velthuis H, Prakken BJ, Kuis W, Rijkers GT. Simultaneous detection of 15 human cytokines in a single
sample of stimulated peripheral blood mononuclear cells. Clin Diagn Lab Immunol 2003; 10:133-9.
5. Landheer J, de Bruin-Weller M, Boonacker C, Hijnen D, Bruijnzeel-Koomen C, Rockmann H. Utility of serum thymus and
activation-regulated chemokine as a biomarker for monitoring of atopic dermatitis severity. J Am Acad Dermatol 2014;
71:1160-6.
6. Walker C, Kagi MK, Ingold P, Braun P, Blaser K, Bruijnzeel-Koomen CA, et al. Atopic dermatitis: correlation of peripheral
blood T cell activation, eosinophilia and serum factors with clinical severity. Clin Exp Allergy 1993; 23:145-53.
7. Zheng Y, Danilenko DM, Valdez P, Kasman I, Eastham-Anderson J, Wu J, et al. Interleukin-22, a T(H)17 cytokine, mediates
IL-23-induced dermal inflammation and acanthosis. Nature 2007; 445:648-51.
8. Hijnen D, Knol EF, Gent YY, Giovannone B, Beijn SJ, Kupper TS, et al. CD8(+) T cells in the lesional skin of atopic der-
matitis and psoriasis patients are an important source of IFN-gamma, IL-13, IL-17, and IL-22. J Invest Dermatol 2013;
133:973-9.
9. Gutowska-Owsiak D, Schaupp AL, Salimi M, Taylor S, Ogg GS. Interleukin-22 downregulates filaggrin expression and
affects expression of profilaggrin processing enzymes. Br J Dermatol 2011; 165:492-8.

A panel of biomarkers for disease severity in atopic dermatitis
41
3

EASI p-EASI: Utilising a combination of serum biomarkers offers an objective measurement tool for disease severity in atopic dermatitis patients
4

EASI p-EASI: Utilising a combination of serum biomarkers offers an objective measurement tool for disease severity in atopic dermatitis patients
43
5
4EASI p-EASI: Utilising a combination of serum biomarkers offers an objective
measurement tool for disease severity in atopic dermatitis patients
Judith L. Thijs1,2, Julia Drylewicz2, Renée Fiechter1,2, Ian Strickland3, Matthew A. Sleeman3, Athula Herath3,
Richard D. May3, Carla A.F.M. Bruijnzeel-Koomen1, Edward F. Knol1,2, Barbara Giovannone1, Marjolein S. de
Bruin-Weller1, Stefan Nierkens2,4, DirkJan Hijnen1,2
1. Department of Dermatology and Allergology, University Medical Center Utrecht, The Netherlands
2. Laboratory of Translational Immunology, Utrecht, The Netherlands
3. MedImmune, Granta Park, Cambridge, CB21 6GH, United Kingdom
4. U-DAIR, University Medical Center Utrecht, The Netherlands
Accepted for publication as a letter to the editor in the Journal of Allergy and Clinical Immunology
Chapter 4
44
EASI p-EASI: Utilising a combination of serum biomarkers offers an objective measurement tool for disease severity in atopic dermatitis patients
4
ABSTRACT
Background:
Serum biomarkers offer an objective outcome measure for disease severity in atopic dermatitis (AD).
Assessing disease severity with a single biomarker may not be sufficient in a complex and heterogeneous
disease such as AD. We hypothesized that a combination of biomarkers is more suitable for assessing
disease severity than a single biomarker.
Methods:
In a retrospective cohort of 193 AD patients, 147 serum biomarkers were measured to identify biomarkers
that correlated with disease severity. Based on the findings in this retrospective cohort we selected ten
biomarkers for validation in a prospective cohort of 65 AD patients. During a treatment period with topical
steroids of two months, disease severity was assessed by the Eczema Area and Severity Index (EASI) and
serum biomarkers were measured. Fourteen psoriasis vulgaris patients and 26 non-atopic subjects were
included as controls.
Results:
In the retrospective cohort, IL-18, IL-22, IL-31, TARC, MDC, PARC, sIL-2R, sE-selectin, SDF-1α and I-309
showed correlation coefficients of >0.30 to disease severity. In the prospective cohort, all patients showed
significantly decreasing EASI scores during treatment. Serum biomarkers IL-18, IL-22, I-309, MDC, PARC,
sE-selectin, sIL-2R and TARC also significantly decreased upon treatment. Linear mixed model analyses in
55 randomly selected patients from the prospective cohort revealed an optimal combination of TARC, IL-22
and sIL-2R as a predictor of EASI scores. This model was validated in the ten remaining patients and showed
a correct prediction of EASI scores in 90% of the cases (sensitivity: 100%, specificity: 88.9%).
Conclusion:
Combining serum biomarkers TARC, IL-22 and sIL-2R as a signature offers an objective measurement tool
for disease severity in AD patients.

EASI p-EASI: Utilising a combination of serum biomarkers offers an objective measurement tool for disease severity in atopic dermatitis patients
45
5
4
INTRODUCTION
Atopic dermatitis (AD) is recognized as one of the most common chronic inflammatory skin diseases
worldwide, associated with a high socio-economic impact.1-4 In recent years, there has been an increasing
number of clinical trials evaluating new treatments for AD, with biologics in particular generating promising
results.5 However, the comparability of study outcomes remains challenging, as different clinician-rated
outcome measures are used and these show high intra- and inter-observer differences.6-8
In the present study we propose the use of serological biomarkers as objective and reliable out-
come measures of disease severity. A recent meta-analysis identified serum thymus and activation-regulated
chemokine (TARC/CCL17) as the best biomarker currently available for assessing disease severity in AD.9
Although TARC strongly correlates with disease activity in individual patients during follow-up, TARC levels
vary between patients within cross-sectional cohorts of patients that have similar disease severity scores.10
The variation in TARC levels between patients may be the result of the large number of biologic pathways
involved in the pathogenesis of AD. The use of a panel of several biomarkers from different biologic pathways,
representing different phenotypes/endotypes, may overcome this problem. Indeed, we have recently shown
that a combination of biomarkers, including serum TARC, pulmonary and activation-regulated chemokine
(PARC/CCL18), IL-22 and sIL-2R showed a correlation coefficient of 0.86 with disease severity, whereas
the correlation coefficient to disease severity for the individual biomarkers ranged from 0.42 to 0.74.11 Even
though this combination was identified in a small pilot study, it demonstrated that the use of a combination
of biomarkers may improve correlation with disease severity in a multifactorial, complex disease such as AD.
The aim of the current study therefore was to validate the use of a combination of biomarkers for disease
severity in AD patients during treatment with topical steroids.
Chapter 4
46
EASI p-EASI: Utilising a combination of serum biomarkers offers an objective measurement tool for disease severity in atopic dermatitis patients
4
METHODS
Study design
This study was conducted in two steps: (i) potential new serum biomarkers that correlated with disease sever-
ity were identified in a retrospective cohort of 193 moderate to severe AD patients, next (ii) this combination
of severity biomarkers was validated in a prospective cohort of 65 AD patients treated with topical steroids.
The protocols used in this study were approved by the Institutional Review Board of the University Medical
Center Utrecht, adhering to the Declaration of Helsinki Principles.
Patients and samples
We analyzed the correlation between serum biomarker expression levels and disease severity measured by the Six
area, six sign atopic dermatitis (SASSAD) severity score12 in 193 moderate to severe AD patients, as defined by the
criteria of Hanifin and Raijka,13 from a previously published study.14 All patients were treated with topical steroids,
patients using oral immunosuppressive drugs or UV-therapy within three months before baseline were excluded.
To validate the use of a combination of biomarkers, a prospective cohort of 65 adult AD patients was
recruited. Sample size was calculated using correlation coefficients from a previous study,11 using a Fisher’s z-test
for Pearson correlation in SAS version 9.2 (SAS Institute,Cary,NC,USA). To compute the sample size we used the
following parameters: one-sided, α=0.05, and power=0.8, resulting in a required sample size of 60 patients.
During the first visit (t0), serum was collected and disease severity was assessed by the Eczema
Area and Severity Index (EASI).15 All clinicians were trained and experienced in using EASI. Additionally, we
included Patient-Oriented Eczema Measure (POEM),16 and visual analogue scale (VAS) for pruritus.17 At t0,
all patients were instructed by specialized nurses to use potent topical steroids (European classification class
III: fluticasone furoate, mometasone furoate or betamethasone dipropionate) according to the fingertip unit.18
During a second visit (t1), after three weeks, blood was collected, EASI, POEM and VAS pruritis
were assessed, and patients were instructed to taper the frequency of topical corticosteroid application.
Assessment of disease severity and collection of serum was repeated after 6 to 12 weeks (t2) of treatment.
The outline of the study protocol is summarized in Figure 1.
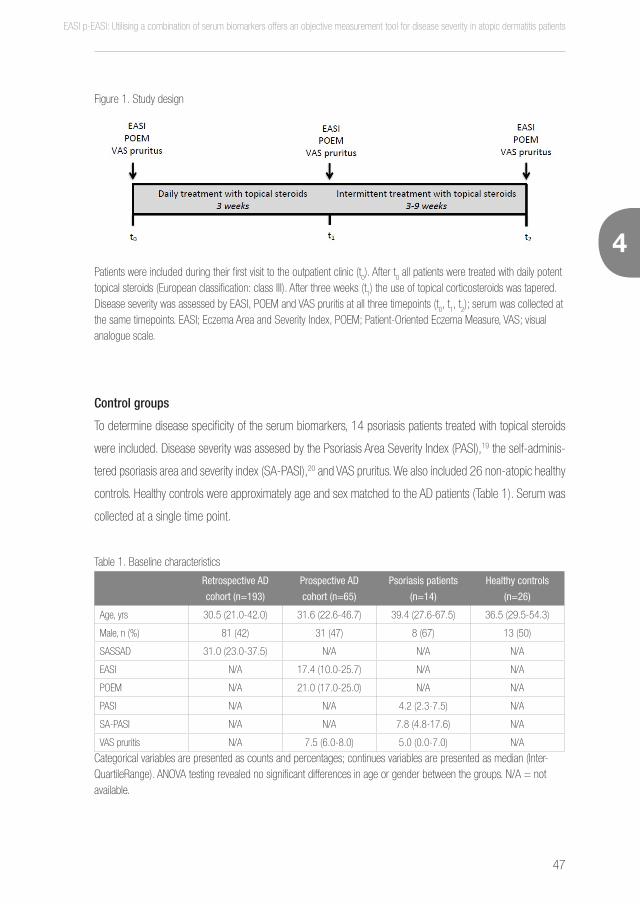
EASI p-EASI: Utilising a combination of serum biomarkers offers an objective measurement tool for disease severity in atopic dermatitis patients
47
5
4
Figure 1. Study design
Patients were included during their first visit to the outpatient clinic (t0). After t
0 all patients were treated with daily potent
topical steroids (European classification: class III). After three weeks (t1) the use of topical corticosteroids was tapered.
Disease severity was assessed by EASI, POEM and VAS pruritis at all three timepoints (t0, t
1, t
2); serum was collected at
the same timepoints. EASI; Eczema Area and Severity Index, POEM; Patient-Oriented Eczema Measure, VAS; visual analogue scale.
Control groups
To determine disease specificity of the serum biomarkers, 14 psoriasis patients treated with topical steroids
were included. Disease severity was assesed by the Psoriasis Area Severity Index (PASI),19 the self-adminis-
tered psoriasis area and severity index (SA-PASI),20 and VAS pruritus. We also included 26 non-atopic healthy
controls. Healthy controls were approximately age and sex matched to the AD patients (Table 1). Serum was
collected at a single time point.
Table 1. Baseline characteristics
Retrospective AD
cohort (n=193)
Prospective AD
cohort (n=65)
Psoriasis patients
(n=14)
Healthy controls
(n=26)
Age, yrs 30.5 (21.0-42.0) 31.6 (22.6-46.7) 39.4 (27.6-67.5) 36.5 (29.5-54.3)
Male, n (%) 81 (42) 31 (47) 8 (67) 13 (50)
SASSAD 31.0 (23.0-37.5) N/A N/A N/A
EASI N/A 17.4 (10.0-25.7) N/A N/A
POEM N/A 21.0 (17.0-25.0) N/A N/A
PASI N/A N/A 4.2 (2.3-7.5) N/A
SA-PASI N/A N/A 7.8 (4.8-17.6) N/A
VAS pruritis N/A 7.5 (6.0-8.0) 5.0 (0.0-7.0) N/A
Categorical variables are presented as counts and percentages; continues variables are presented as median (Inter-QuartileRange). ANOVA testing revealed no significant differences in age or gender between the groups. N/A = not available.
Chapter 4
48
EASI p-EASI: Utilising a combination of serum biomarkers offers an objective measurement tool for disease severity in atopic dermatitis patients
4
Serum biomarkers
In the retrospective cohort consisting of 193 AD patients, 147 serum biomarkers were measured by Luminex
analysis (Table S1) as previously described.14 Total IgE levels were determined using ImmunoCAP (Thermo
Fisher, Uppsala, Sweden) according to the manufacturer’s instructions. Periostin and DPP4 levels were mea-
sured using in-house ELISA-based assays (Abbott Diagnostics, Abbott Park, IL, USA and R&D Systems,
Minneapolis, MN ,USA respectively).
In the 65 AD patients that comprised the prospective validation cohort, the biomarkers TARC,
PARC, IL-22, sIL-2R, sE-selectin, IL-18, T Lymphocyte-Secreted Protein I-309 (I-309/CCL1), macro-
phage-derived chemokine (MDC/CCL22), and stromal cell-derived factor-1α (SDF-1α/CXCL12) were
measured. For technical reasons S100A12 could not be measured in the prospective AD cohort and was
therefore not included. Because serum IL-31 levels have previously been related to pruritis in AD, we also
included IL-31. Biomarkers were also measured in psoriasis and healthy control samples.
Statistical analysis
All variables measured in patients from the retrospective cohort were normalised by log-transformation.
Pearson correlation coefficients were used to assess the correlation between SASSAD and biomarkers.
P-values were adjusted for multiple testing by adjusting the false discovery rate using the Benjamini-Hoch-
berg procedure.
In the prospective validation cohort and control groups, serum levels of TARC, PARC, MDC and
sE-selectin were normalised by log-transformation. Differences in biomarker levels between groups were
compared with ANOVA. Linear mixed models were used to model the change over time of biomarkers after
treatment initiation. This model generalizes the fixed effect regression models by taking into account cor-
relation between measurements in longitudinal data. We investigated the effects of the different biomarkers
during treatment using piecewise linear mixed models. For all AD patients, two slopes were considered: one
for the first treatment period (between t0 and t
1) and one for the second treatment period (between t
1 and t
2).
Time for the slope’s change (t = 22 days) was based on the median duration of the first treatment period.
Correlation between individual baseline values and the subsequent slopes was handled through the unstruc-
tured covariance matrix of random effects. Models were adjusted for age and gender. The EASI prediction
model was built using the Akaike Information Criteria which quantifies the quality of the fit to the data and
correct for the number of parameters in the model. A total of 55 randomly selected patients were used to
define the best model which was validated using the remaining 10 AD patients by comparing the predicted
EASI scores with the measured ones. EASI scores were classified as mild (1.0-7.0), moderate (7.1-21.0)
or severe (>21.1).21 Sensitivity and specificity were calculated to describe the predictive capacity of the
EASI p-EASI: Utilising a combination of serum biomarkers offers an objective measurement tool for disease severity in atopic dermatitis patients
49
5
4
model. We defined false positive as a predicted EASI score classifying a higher disease severity than the
observed EASI scores, and false negative as a predicted EASI scores classifying a lower disease severity than
the observed EASI scores. To test the robustness of our findings, we repeated the above analysis five times:
random selection of 55 AD patients to build the model and use of the 10 remaining AD patients for validation.
P-values <0.05 were considered statistically significant. All statistical analyses were conducted using SAS
version 9.4 (SAS Institute, Cary, NC, USA) and Prism (version 6;Graphpad).
RESULTS
Identification of new biomarkers for disease severity in AD
A total of 193 AD patients (median 30.5 years InterQuartileRange (IQR) 21.0-42.0, median SASSAD 31.0,
IQR 23.0-37.5) were included in the retrospective cohort (Table 1). A significant correlation with SASSAD
was found for 32 out of 147 serum biomarkers (Table 2; for a complete list of biomarkers see Table S1).
Serum TARC levels showed the strongest correlation with disease severity (r=0.40, p<0.01). Biomarkers
that significantly correlated with disease severity and had correlation coefficients higher than 0.30 (TARC,
PARC, IL-22, sIL-2R, IL-18, I-309, MDC, sE-selectin, and SDF-1α) were considered meaningful22 and
included in the prospective study.
A total of 147 biomarkers were measured in the serum of 193 AD patients. 32 biomarkers
showed a significant correlation with disease severity measured by SASSAD. Biomarkers marked in bold
show correlation coefficients higher than 0.30, and were selected to the panel of biomarkers measured in
the prospective AD cohort.
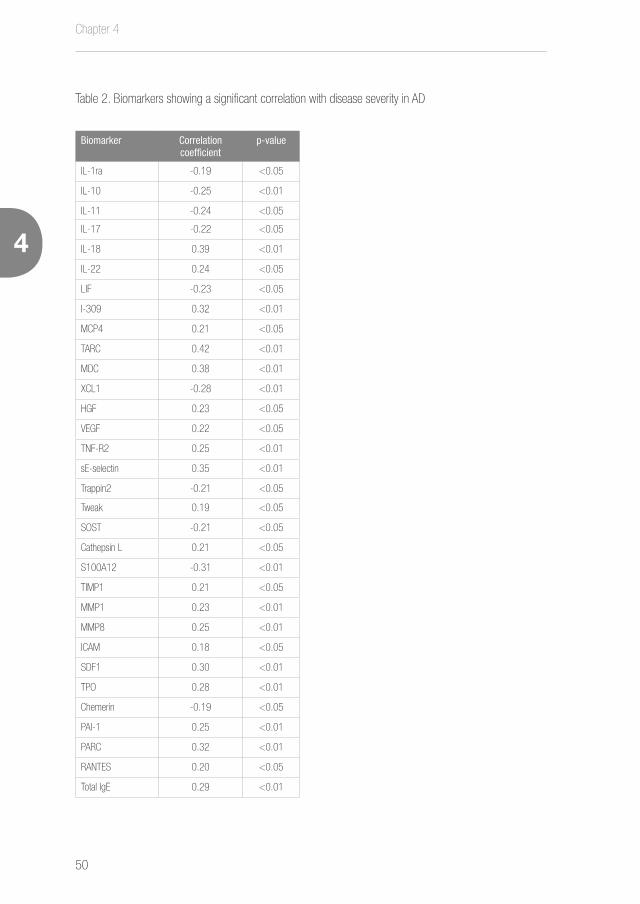
Chapter 4
50
EASI p-EASI: Utilising a combination of serum biomarkers offers an objective measurement tool for disease severity in atopic dermatitis patients
4
Table 2. Biomarkers showing a significant correlation with disease severity in AD
Biomarker Correlation coefficient
p-value
IL-1ra -0.19 <0.05
IL-10 -0.25 <0.01
IL-11 -0.24 <0.05
IL-17 -0.22 <0.05
IL-18 0.39 <0.01
IL-22 0.24 <0.05
LIF -0.23 <0.05
I-309 0.32 <0.01
MCP4 0.21 <0.05
TARC 0.42 <0.01
MDC 0.38 <0.01
XCL1 -0.28 <0.01
HGF 0.23 <0.05
VEGF 0.22 <0.05
TNF-R2 0.25 <0.01
sE-selectin 0.35 <0.01
Trappin2 -0.21 <0.05
Tweak 0.19 <0.05
SOST -0.21 <0.05
Cathepsin L 0.21 <0.05
S100A12 -0.31 <0.01
TIMP1 0.21 <0.05
MMP1 0.23 <0.01
MMP8 0.25 <0.01
ICAM 0.18 <0.05
SDF1 0.30 <0.01
TPO 0.28 <0.01
Chemerin -0.19 <0.05
PAI-1 0.25 <0.01
PARC 0.32 <0.01
RANTES 0.20 <0.05
Total IgE 0.29 <0.01
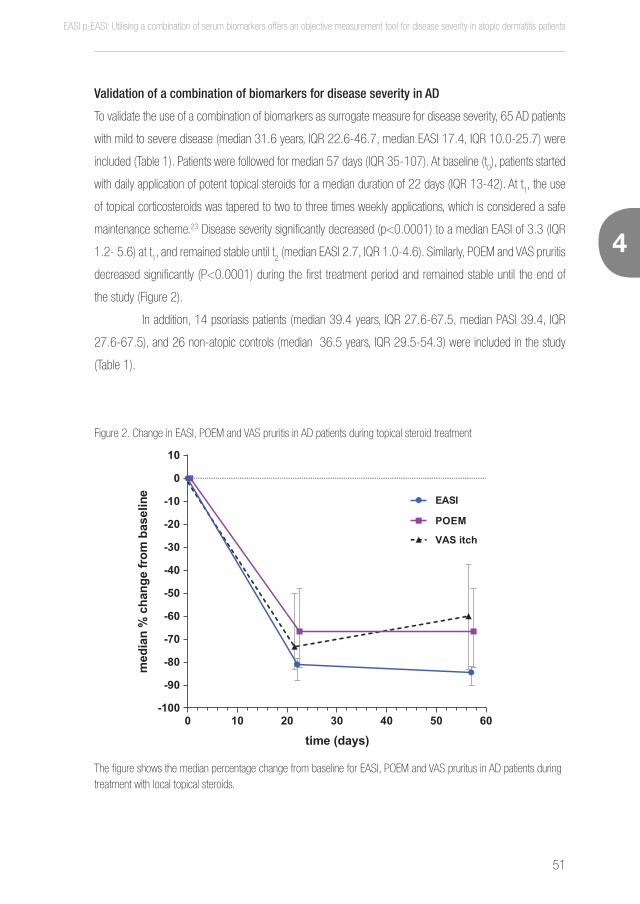
EASI p-EASI: Utilising a combination of serum biomarkers offers an objective measurement tool for disease severity in atopic dermatitis patients
51
5
4
Validation of a combination of biomarkers for disease severity in AD
To validate the use of a combination of biomarkers as surrogate measure for disease severity, 65 AD patients
with mild to severe disease (median 31.6 years, IQR 22.6-46.7, median EASI 17.4, IQR 10.0-25.7) were
included (Table 1). Patients were followed for median 57 days (IQR 35-107). At baseline (t0), patients started
with daily application of potent topical steroids for a median duration of 22 days (IQR 13-42). At t1, the use
of topical corticosteroids was tapered to two to three times weekly applications, which is considered a safe
maintenance scheme.23 Disease severity significantly decreased (p<0.0001) to a median EASI of 3.3 (IQR
1.2- 5.6) at t1, and remained stable until t
2 (median EASI 2.7, IQR 1.0-4.6). Similarly, POEM and VAS pruritis
decreased significantly (P<0.0001) during the first treatment period and remained stable until the end of
the study (Figure 2).
In addition, 14 psoriasis patients (median 39.4 years, IQR 27.6-67.5, median PASI 39.4, IQR
27.6-67.5), and 26 non-atopic controls (median 36.5 years, IQR 29.5-54.3) were included in the study
(Table 1).
Figure 2. Change in EASI, POEM and VAS pruritis in AD patients during topical steroid treatment
The figure shows the median percentage change from baseline for EASI, POEM and VAS pruritus in AD patients during treatment with local topical steroids.
0 10 20 30 40 50 60-100
-90
-80
-70
-60
-50
-40
-30
-20
-10
0
10
time (days)
med
ian
%ch
ange
from
base
line EASI
POEM
VAS itch
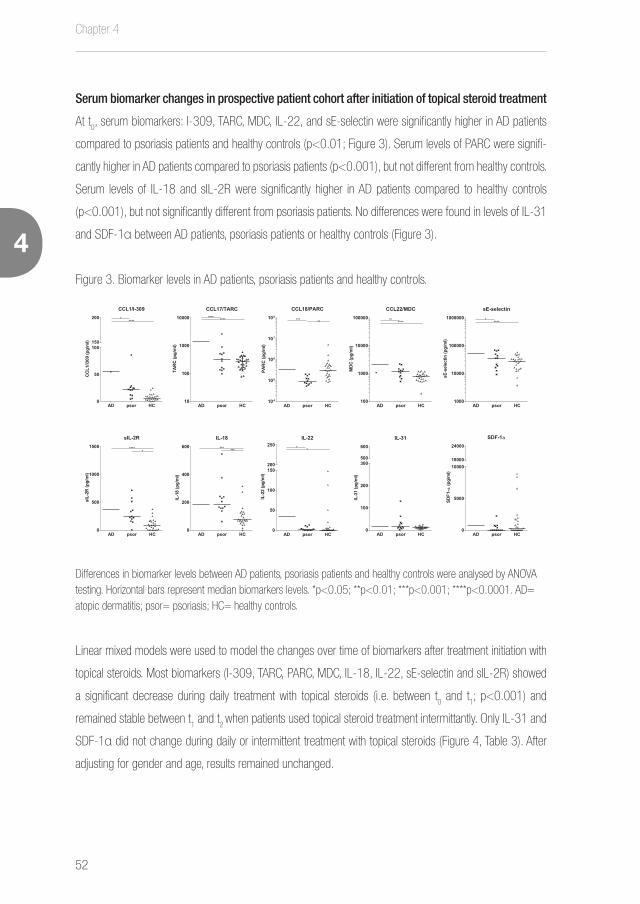
Chapter 4
52
EASI p-EASI: Utilising a combination of serum biomarkers offers an objective measurement tool for disease severity in atopic dermatitis patients
4
Serum biomarker changes in prospective patient cohort after initiation of topical steroid treatment
At t0, serum biomarkers: I-309, TARC, MDC, IL-22, and sE-selectin were significantly higher in AD patients
compared to psoriasis patients and healthy controls (p<0.01; Figure 3). Serum levels of PARC were signifi-
cantly higher in AD patients compared to psoriasis patients (p<0.001), but not different from healthy controls.
Serum levels of IL-18 and sIL-2R were significantly higher in AD patients compared to healthy controls
(p<0.001), but not significantly different from psoriasis patients. No differences were found in levels of IL-31
and SDF-1α between AD patients, psoriasis patients or healthy controls (Figure 3).
Figure 3. Biomarker levels in AD patients, psoriasis patients and healthy controls.
AD psor HC0
50
100150
200
CCL1/I-309
CC
L1/I3
09(p
g/m
l)
*****
AD psor HC0
200
400
600
IL-18
IL-1
8(p
g/m
l)
*** ***
AD psor HC0
50
100
150200
250IL-22
IL-2
2(p
g/m
l)
* *
AD psor HC0
100
200
300500
600
IL-31
IL-3
1(p
g/m
l)
AD psor HC0
5000
1000018000
24000
SDF-1a
SDF1
- a(p
g/m
l)
AD psor HC0
500
1000
1500
sIL-2R
sIL-
2R(p
g/m
l)
*****
AD psor HC10
100
1000
10000
CCL17/TARC
TAR
C(p
g/m
l)
**** ****
AD psor HC104
105
106
107
108
CCL18/PARC
PAR
C(p
g/m
l)
*** **
AD psor HC100
1000
10000
100000
CCL22/MDC
MDC
(pg/
ml)
** ****
AD psor HC1000
10000
100000
1000000
sE-selectin
sE-s
elec
tin(p
g/m
l)
* ****
Differences in biomarker levels between AD patients, psoriasis patients and healthy controls were analysed by ANOVA testing. Horizontal bars represent median biomarkers levels. *p<0.05; **p<0.01; ***p<0.001; ****p<0.0001. AD= atopic dermatitis; psor= psoriasis; HC= healthy controls.
Linear mixed models were used to model the changes over time of biomarkers after treatment initiation with
topical steroids. Most biomarkers (I-309, TARC, PARC, MDC, IL-18, IL-22, sE-selectin and sIL-2R) showed
a significant decrease during daily treatment with topical steroids (i.e. between t0 and t
1; p<0.001) and
remained stable between t1 and t
2 when patients used topical steroid treatment intermittantly. Only IL-31 and
SDF-1α did not change during daily or intermittent treatment with topical steroids (Figure 4, Table 3). After
adjusting for gender and age, results remained unchanged.

EASI p-EASI: Utilising a combination of serum biomarkers offers an objective measurement tool for disease severity in atopic dermatitis patients
53
5
4
Table 3. Changes over time of biomarkers after treatment initiation
Biomarker level at baseline Estimate (95%CI) P-value
I-309 (pg/ml) 77.57 (58.60, 96.53)
Log TARC (pg/ml) 3.12 (3.01, 3.22)
Log PARC (pg/ml) 5.46 (5.34, 5.58)
IL-18 (pg/ml) 178.13 (155.57, 200.68)
IL-22 (pg/ml) 59.58 (41.05, 78.11)
IL-31 (pg/ml) 40.13 (19.15, 61.11)
Log MDC (pg/ml) 3.29 (3.23, 3.36)
sIL-2R (pg/ml) 403.75 (342.04, 465.46)
Log sE-selectin (pg/ml) 4.68 (4.62, 4.74)
SDF-1α (pg/ml) 7971.95 (1744.21, 14200.00)
Change/week (between t0 and t1)
I-309 (pg/ml) -16.12 (-22.16, -10.07) <.0001
Log TARC (pg/ml) -0.13 (-0.16, -0.10) <.0001
Log PARC (pg/ml) -0.10 (-0.14, -0.06) <.0001
IL-18 (pg/ml) -14.26 (-20.53, -7.98) <.0001
IL-22 (pg/ml) -13.68 (-18.51, -8.85) <.0001
IL-31 (pg/ml) -1.76 (-6.68, 3.15) 0.47
Log MDC (pg/ml) -0.09 (-0.11, -0.06) <.0001
sIL-2R (pg/ml) -57.55 (-76.38, -38.71) <.0001
Log sE-selectin (pg/ml) -0.07 (-0.09, -0.05) <.0001
SDF-1α (pg/ml) -344.35 (-3730.94, 3042.25) 0.84
Change/week (between t1 and t2)
I-309 (pg/ml) -0.10 (-1.45, 1.24) 0.87
Log TARC (pg/ml) 0.001 (-0.008, 0.009) 0.80
Log PARC (pg/ml) 0.01 (-0.00, 0.02) 0.05
IL-18 (pg/ml) -0.23 (-1.85, 1.39) 0.77
IL-22 (pg/ml) -13.68 (-18.51, -8.85) <.0001
IL-31 (pg/ml) -1.76 (-6.68, 3.15) 0.47
Log MDC (pg/ml) -0.09 (-0.11, -0.06) <.0001
sIL-2R (pg/ml) -57.55 (-76.38, -38.71) <.0001
Log sE-selectin (pg/ml) -0.07 (-0.09, -0.05) <.0001
SDF-1α (pg/ml) 904.40 (10.08, 1798.73) 0.06
Linear mixed models were used to model the changes over time of biomarkers after treatment initiation with topical steroids. The
biomarkers I-309, TARC, PARC, IL-18, IL-22, MDC, sE-selectin and sIL-2R showed a significant decrease during daily treatment with
topical steroids (between t0 and t
1) and then remained at stable levels during intermittent treatment with topical steroids (between t
1
and t2). The biomarkers (IL-31 and SDF1α) did not change during daily or intermittent treatment with topical steroids.
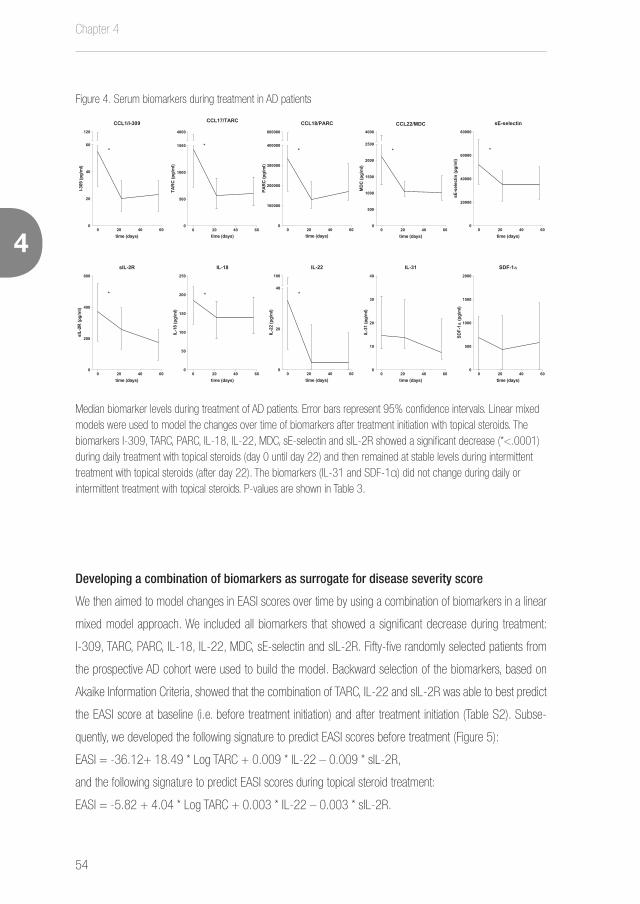
Chapter 4
54
EASI p-EASI: Utilising a combination of serum biomarkers offers an objective measurement tool for disease severity in atopic dermatitis patients
4
Figure 4. Serum biomarkers during treatment in AD patients
0 20 40 600
20
40
60
120
CCL1/I-309
time (days)
I-309
(pg/
ml)
*
0 20 40 600
500
1000
1500
4000
CCL17/TARC
time (days)
TAR
C(p
g/m
l)
*
0 20 40 600
100000
200000
300000
400000
800000
CCL18/PARC
time (days)
PAR
C(p
g/m
l)
*
0 20 40 600
500
1000
1500
2000
2500
4000
CCL22/MDC
time (days)
MDC
(pg/
ml)
*
0 20 40 600
50
100
150
200
250
IL-18
time (days)
IL-1
8(p
g/m
l)
*
0 20 40 600
20
40
100
IL-22
time (days)
IL-2
2(p
g/m
l)
*
0 20 40 600
10
20
30
40
IL-31
time (days)
IL-3
1(p
g/m
l)
0 20 40 600
500
1000
1500
2000
SDF-1a
time (days)
SDF-
1a(p
g/m
l)
0 20 40 600
20000
40000
60000
80000
sE-selectin
time (days)
sE-s
elec
tin(p
g/m
l)
*
0 20 40 600
200
400
600
sIL-2R
time (days)
sIL-
2R(p
g/m
l)
*
Median biomarker levels during treatment of AD patients. Error bars represent 95% confidence intervals. Linear mixed models were used to model the changes over time of biomarkers after treatment initiation with topical steroids. The biomarkers I-309, TARC, PARC, IL-18, IL-22, MDC, sE-selectin and sIL-2R showed a significant decrease (*<.0001) during daily treatment with topical steroids (day 0 until day 22) and then remained at stable levels during intermittent treatment with topical steroids (after day 22). The biomarkers (IL-31 and SDF-1α) did not change during daily or intermittent treatment with topical steroids. P-values are shown in Table 3.
Developing a combination of biomarkers as surrogate for disease severity score
We then aimed to model changes in EASI scores over time by using a combination of biomarkers in a linear
mixed model approach. We included all biomarkers that showed a significant decrease during treatment:
I-309, TARC, PARC, IL-18, IL-22, MDC, sE-selectin and sIL-2R. Fifty-five randomly selected patients from
the prospective AD cohort were used to build the model. Backward selection of the biomarkers, based on
Akaike Information Criteria, showed that the combination of TARC, IL-22 and sIL-2R was able to best predict
the EASI score at baseline (i.e. before treatment initiation) and after treatment initiation (Table S2). Subse-
quently, we developed the following signature to predict EASI scores before treatment (Figure 5):
EASI = -36.12+ 18.49 * Log TARC + 0.009 * IL-22 – 0.009 * sIL-2R,
and the following signature to predict EASI scores during topical steroid treatment:
EASI = -5.82 + 4.04 * Log TARC + 0.003 * IL-22 – 0.003 * sIL-2R.
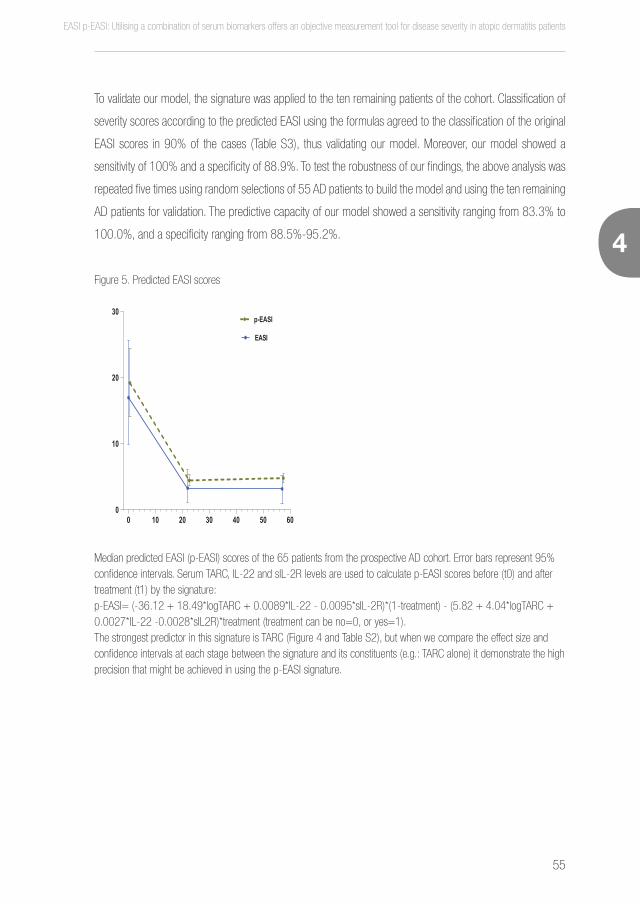
EASI p-EASI: Utilising a combination of serum biomarkers offers an objective measurement tool for disease severity in atopic dermatitis patients
55
5
4
To validate our model, the signature was applied to the ten remaining patients of the cohort. Classification of
severity scores according to the predicted EASI using the formulas agreed to the classification of the original
EASI scores in 90% of the cases (Table S3), thus validating our model. Moreover, our model showed a
sensitivity of 100% and a specificity of 88.9%. To test the robustness of our findings, the above analysis was
repeated five times using random selections of 55 AD patients to build the model and using the ten remaining
AD patients for validation. The predictive capacity of our model showed a sensitivity ranging from 83.3% to
100.0%, and a specificity ranging from 88.5%-95.2%.
Figure 5. Predicted EASI scores
0 10 20 30 40 50 600
10
20
30
time (days)
p-EASI
EASI
Median predicted EASI (p-EASI) scores of the 65 patients from the prospective AD cohort. Error bars represent 95% confidence intervals. Serum TARC, IL-22 and sIL-2R levels are used to calculate p-EASI scores before (t0) and after treatment (t1) by the signature: p-EASI= (-36.12 + 18.49*logTARC + 0.0089*IL-22 - 0.0095*sIL-2R)*(1-treatment) - (5.82 + 4.04*logTARC + 0.0027*IL-22 -0.0028*sIL2R)*treatment (treatment can be no=0, or yes=1). The strongest predictor in this signature is TARC (Figure 4 and Table S2), but when we compare the effect size and confidence intervals at each stage between the signature and its constituents (e.g.: TARC alone) it demonstrate the high precision that might be achieved in using the p-EASI signature.
Chapter 4
56
EASI p-EASI: Utilising a combination of serum biomarkers offers an objective measurement tool for disease severity in atopic dermatitis patients
4
DISCUSSION
We have recently shown in a pilot study that a combination of serum biomarkers, including TARC, PARC,
IL-22, sIL-2R and gender correlated with disease severity.11 In the current study we optimized and validated
this combination of biomarkers in larger patient populations, and showed that a combination of three serum
biomarkers: TARC, IL-22 and sIL-2R predicted disease severity with high precision.
Reliably assessing disease severity in AD patients is a real challenge. Shortcomings of existing
clinician rated severity measures have encouraged investigators to develop new, more robust outcome
measures that have been used in AD studies.7 A systematic review on validity and reliability of the 20 most
commonly used clinician rated severity measures for AD showed that only the severity measures EASI,
SCORAD and POEM performed adequately.24 To address these deficiencies in reporting, experts in the field
have established the Harmonizing Outcome Measurements in Eczema (HOME) initiative, an attempt to ensure
that investigators employ a core set of outcome measures to enhance comparability between studies. The
HOME initiative recently recommended the use of EASI and POEM as core outcome instruments for mea-
suring disease severity and symptoms in AD.25, 26 Although assessing EASI is relatively simple, inter-observer
variability remains a problem, as was recently highlighted by Zhao et al.8
In addition to clinician rated severity measures, a large variety of plasma and serum biomarkers
has been assessed for their suitabilty to predict disease severity. Serum biomarkers have the advantage of
being objective and less time consuming than clinician rated severity measures. In a recent review on bio-
markers for disease severity in AD, we found that over 100 biomarkers have been reported, and that currently
serum TARC levels perform best as objective biomarker for disease severity.9 However, these studies only
included a single biomarker for the assessment of disease severity. We hypothesized that a combination of
biomarkers may be more suitable than a single biomarker in a highly heterogeneous and complex disease
with multiple biological pathways involved in its pathogenesis. Indeed, the current study shows that combining
multiple biomarkers in a linear mixed model improves prediction of disease severity compared to a model that
only includes serum TARC levels. The combination of serum biomarkers TARC, IL-22, and sIL-2R predicts
disease severity in AD patients treated with topical steroids with high precision.
The biomarkers included in our signature: TARC, IL-22 and sIL-2R, are involved in inflammation
and have been previously described in the pathogenesis of AD. TARC, a member of the CC chemokine family,
is produced by dendritic cells and involved in the recruitment of T cells into the skin.27 IL-2R is expressed
on the T cell surface after stimulation with IL-2.28, 29 sIL-2R is released into the serum, and sIL-2R levels
have been found to reflect the activation state of the T cells in skin.30 In a recent meta-analysis we reported
that sIL-2R levels showed good correlation to disease severity, however it should be noted that only small
EASI p-EASI: Utilising a combination of serum biomarkers offers an objective measurement tool for disease severity in atopic dermatitis patients
57
5
4
patient cohorts have been used in the reviewed studies.9 In the current study, using significantly larger patient
cohorts, we confirmed that sIL-2R is a good biomarker for disease severity. IL-22 is less well known as a
biomarker for disease severity in AD, although it has been recognized to play a role in the pathogenesis of
AD.31-34 IL-22 has previously been reported to induce keratinocyte proliferation, and downregulate filaggrin
expression, in a similar way to IL-4 and IL-13, thereby contributing to epidermal barrier dysfunction and
perhaps increase S. aureus infections associated with AD.31 Interestingly, Noda and colleagues showed that
IL-22 expression was higher in skin of Asian AD patients compared with skin of European American AD pa-
tients.35 This may indicate that the Th-22 axis plays a more important role in Asians with AD. This strengthens
our hypothesis that a combination of biomarkers covering multiple biological pathways, is more suitable for
follow-up of disease severity than a single biomarker.
In contrast to our pilot study,11 serum PARC levels and gender are not included in the current signa-
ture. Although PARC levels highly correlate with disease severity, PARC showed no added value over TARC in
a panel of biomarkers for disease severity and therefore was not a component of our signature. This might be
explained by the high correlation between serum PARC and serum TARC levels. The presence of gender in the
previously published signature was required in the smaller patient population of the pilot study, but adjustment
on gender was not required in the well-balanced, gender matched patient populations of the current studies.11
IL-31 has been associated with itch in AD.36 Indeed, a recent phase II trial studying the effects of a
monoclonal antibody targeting the IL-31 receptor A (IL-31RA) showed a strong decrease of itch.37 IL-31 lev-
els did not correlate to disease severity in our retrospective cohort, however, pruritis was not determined in this
cohort. Since VAS pruritis was part of the clinical assesment in our prospective validation cohort we also included
IL-31. Pruritis scores significanlty decreased in AD patients during treatment (Figure 2), however, serum IL-31
levels did not show a corresponding decrease (Figure 4). Raap et al. found that serum IL-31 levels correlated
to disease severity,38 however, several other studies failed to confirm these findings.39-41 Kim et al. found that IL-
31 mRNA expression is higher in biopsies from AD patients with high pruritus scores compared to patients with
low prutitus scores,42 suggesting that measurement of IL-31 in skin may be a more relevant measure for itch.
Our group has recently shown that AD patients can be divided into four subgroups
with distinct serum biomarker profiles, conforming the biological heterogeneity of AD.14 Al-
though different combinations of biomarkers may be optimal for these subgroups, the aim
of the current research was to develop a surrogate severity biomarker for all AD patients.
To avoid selection bias we included all analytes that were available in our MultiPlex Facility in the
retrospective study cohort. Research in our laboratory focusses on chronic inflammatory diseases, which
may have resulted in a bias to inflammation related biomarkers available for multiplex analysis. Advances
in high-scale proteomics have led to the possibility of measuring over 1000 analytes in small amounts of

Chapter 4
58
EASI p-EASI: Utilising a combination of serum biomarkers offers an objective measurement tool for disease severity in atopic dermatitis patients
4
serum.43 Including these techniques in future studies may identify new biomarkers for disease severity in AD.
To make a combination of biomarkers suitable for clinical use, simplicity and ease of inter-
pretation is key. Levels of TARC, IL-22 and sIL-2R should not be interpreted separately, rather it is the
combination of these biomarkers as a signature that reflects the disease activity. Combining levels of bio-
markers in an algorithm coupled to the electronic patient’s file provides a single, easy-to-interpret value.
Since the algorithm was developed to predict EASI scores, we named this outcome measure the pre-
dicted-EASI (p-EASI). In contrast to EASI, the p-EASI provides an objective outcome measure that is not
subjected to intra- and inter-rater variability. Currently, the HOME initiative recommends to use of a core
outcome set to measure disease severity in AD clinical trials. This core outcome set comprises of four
domains: clinician reported signs, patient reported symptoms, quality of life, and long term control. We
believe that adding an objective serum biomarker combination, like the p-EASI, to this core outcome set
will highly improve outcome measures in AD. With the increasing number of clinical trials evaluating new
biological agents for the treatment of AD, the comparability of study outcomes is of major importance.5
A core strength of the current study is its design, including a retrospective cohort for the dis-
covery of new biomarkers and a prospective cohort to validate our findings. Although correlation of serum
biomarkers with disease severity has been investigated in many studies, most of these studies only included
biomarker measurements on a single timepoint.9 By including multiple timepoints in the present study, we
were able to investigate the changes of biomarkers during treatment. The resulting combination of biomakers
has high specificity and sensitivity, demonstrating a very good ability to predict EASI scores. A high specificity
and sensitivity was also found during repeated analyses by randomly selecting ten patients for validation
of the model, which demonstrates the robustness of our model based on a combination of biomarkers.
In the current study, biomarkers were detected and validated in cohorts of patients treat-
ed with topical steroids only, therefore it is of interest to see if the p-EASI biomarker signature is equally
strong in predicting disease severity in patients treated with other drugs such as cyclosporin A, metho-
trexate or azathioprine. Another limitation of the current study is the usage of different clinician rated out-
come measures in the retrospective and prospective cohorts, SASSAD and EASI respectively, however,
both scores have been shown to be highly correlated.44 Moreover, the model presented in the current
study was based on EASI scores, as recommended by HOME for measuring disease severity in AD.25
In conclusion, we have invented a biomarker signature (p-EASI) consisting of TARC, IL-22 and
sIL-2R which provides a reliable and objective measure for disease severity in AD patients. We believe that
the use of a combination of serum biomarkers will highly improve precision measurement of outcomes and
improve comparability of current and future treatments in AD.

EASI p-EASI: Utilising a combination of serum biomarkers offers an objective measurement tool for disease severity in atopic dermatitis patients
59
5
4
SUPPLEMENTARY DATA
See http://www.dermatologyutrecht.nl/index.php/9-public/115-thijs
REFERENCES
1. Deckers IA, McLean S, Linssen S, Mommers M, van Schayck CP, Sheikh A. Investigating international time trends in the
incidence and prevalence of atopic eczema 1990-2010: a systematic review of epidemiological studies. PLoS One
2012; 7:e39803.
2. Williams H, Stewart A, von Mutius E, Cookson W, Anderson HR, International Study of A, et al. Is eczema really on the
increase worldwide? J Allergy Clin Immunol 2008; 121:947-54 e15.
3. Simpson EL, Bieber T, Eckert L, Wu R, Ardeleanu M, Graham NM, et al. Patient burden of moderate to severe atopic
dermatitis (AD): Insights from a phase 2b clinical trial of dupilumab in adults. J Am Acad Dermatol 2016; 74:491-8.
4. Zuberbier T, Lotvall J, Simoens S, Subramanian SV, Church MK. Economic burden of inadequate management of allergic
diseases in the European Union: a GA(2) LEN review. Allergy 2014; 69:1275-9.
5. Boyman O, Kaegi C, Akdis M, Bavbek S, Bossios A, Chatzipetrou A, et al. EAACI IG Biologicals task force paper on the
use of biologic agents in allergic disorders. Allergy 2015; 70:727-54.
6. Charman CR, Venn AJ, Williams HC. Measurement of body surface area involvement in atopic eczema: an impossible
task? Br J Dermatol 1999; 140:109-11.
7. Flohr C. Atopic dermatitis diagnostic criteria and outcome measures for clinical trials: still a mess. J Invest Dermatol
2011; 131:557-9.
8. Zhao CY, Tran AQ, Lazo-Dizon JP, Kim J, Daniel BS, Venugopal SS, et al. A pilot comparison study of four clinician-rated
atopic dermatitis severity scales. Br J Dermatol 2015; 173:488-97.
9. Thijs J, Krastev T, Weidinger S, Buckens CF, de Bruin-Weller M, Bruijnzeel-Koomen C, et al. Biomarkers for atopic
dermatitis: a systematic review and meta-analysis. Curr Opin Allergy Clin Immunol 2015; 15:453-60.
10. Landheer J, de Bruin-Weller M, Boonacker C, Hijnen D, Bruijnzeel-Koomen C, Rockmann H. Utility of serum thymus and
activation-regulated chemokine as a biomarker for monitoring of atopic dermatitis severity. J Am Acad Dermatol 2014;
71:1160-6.
11. Thijs JL, Nierkens S, Herath A, Bruijnzeel-Koomen CA, Knol EF, Giovannone B, et al. A panel of biomarkers for disease
severity in atopic dermatitis. Clin Exp Allergy 2015; 45:698-701.
12. Berth-Jones J. Six area, six sign atopic dermatitis (SASSAD) severity score: a simple system for monitoring disease
activity in atopic dermatitis. Br J Dermatol 1996; 135 Suppl 48:25-30.
13. Hanifin JM, Rajka G. Diagnostic Features of Atopic-Dermatitis. Acta Derm Venereol 1980:44-7.

Chapter 4
60
EASI p-EASI: Utilising a combination of serum biomarkers offers an objective measurement tool for disease severity in atopic dermatitis patients
4
14. Thijs JL, Strickland I, Bruijnzeel-Koomen CAF, Nierkens S, Giovannone B, Csomor E, Sellman BR, Mustelin T, Sleeman
MA, de Bruin-Weller MS, Herath A, Drylewicz J, May RD, Hijnen DJ. Moving towards endotypes in atopic dermatitis:
identification of patient clusters based on serum biomarker analysis. Journal of Allergy and Clinical Immunology in press.
15. Hanifin JM, Thurston M, Omoto M, Cherill R, Tofte SJ, Graeber M. The eczema area and severity index (EASI): assess-
ment of reliability in atopic dermatitis. EASI Evaluator Group. Exp Dermatol 2001; 10:11-8.
16. Charman CR, Venn AJ, Williams HC. The patient-oriented eczema measure: development and initial validation of a new
tool for measuring atopic eczema severity from the patients’ perspective. Arch Dermatol 2004; 140:1513-9.
17. Phan NQ, Blome C, Fritz F, Gerss J, Reich A, Ebata T, et al. Assessment of pruritus intensity: prospective study on validity
and reliability of the visual analogue scale, numerical rating scale and verbal rating scale in 471 patients with chronic
pruritus. Acta Derm Venereol 2012; 92:502-7.
18. Long CC, Finlay AY. The finger-tip unit--a new practical measure. Clin Exp Dermatol 1991; 16:444-7.
19. Fredriksson T, Pettersson U. Severe psoriasis--oral therapy with a new retinoid. Dermatologica 1978; 157:238-44.
20. Feldman SR, Fleischer AB, Jr., Reboussin DM, Rapp SR, Exum ML, Clark AR, et al. The self-administered psoriasis area
and severity index is valid and reliable. J Invest Dermatol 1996; 106:183-6.
21. Leshem YA, Hajar T, Hanifin JM, Simpson EL. What the Eczema Area and Severity Index score tells us about the severity
of atopic dermatitis: an interpretability study. Br J Dermatol 2015; 172:1353-7.
22. Hinkle DE WW, Jurs SG. Applied Statistics for the Behavioral Sciences. 5th ed. Boston: Houghton Mifflin; 2003.
23. Drake LA, Dinehart SM, Farmer ER, Goltz RW, Graham GF, Hordinsky MK, et al. Guidelines of care for the use of topical
glucocorticosteroids. American Academy of Dermatology. J Am Acad Dermatol 1996; 35:615-9.
24. Schmitt J, Langan S, Williams HC, European Dermato-Epidemiology N. What are the best outcome measurements for
atopic eczema? A systematic review. J Allergy Clin Immunol 2007; 120:1389-98.
25. Schmitt J, Spuls PI, Thomas KS, Simpson E, Furue M, Deckert S, et al. The Harmonising Outcome Measures for Eczema
(HOME) statement to assess clinical signs of atopic eczema in trials. J Allergy Clin Immunol 2014; 134:800-7.
26. Chalmers JR, Simpson E, Apfelbacher CJ, Thomas KS, von Kobyletzki L, Schmitt J, et al. Report from the fourth inter-
national consensus meeting to harmonize core outcome measures for atopic eczema/dermatitis clinical trials (HOME
initiative). Br J Dermatol 2016; 175:69-79.
27. Imai T, Nagira M, Takagi S, Kakizaki M, Nishimura M, Wang J, et al. Selective recruitment of CCR4-bearing Th2 cells to-
ward antigen-presenting cells by the CC chemokines thymus and activation-regulated chemokine and macrophage-de-
rived chemokine. Int Immunol 1999; 11:81-8.
28. Rubin LA, Nelson DL. The soluble interleukin-2 receptor: biology, function, and clinical application. Ann Intern Med
1990; 113:619-27.
29. Gaulton GN, Williamson P. Interleukin-2 and the interleukin-2 receptor complex. Chem Immunol 1994; 59:91-114.
30. Walker C, Kagi MK, Ingold P, Braun P, Blaser K, Bruijnzeel-Koomen CA, et al. Atopic dermatitis: correlation of peripheral
blood T cell activation, eosinophilia and serum factors with clinical severity. Clin Exp Allergy 1993; 23:145-53.
31. Gutowska-Owsiak D, Schaupp AL, Salimi M, Taylor S, Ogg GS. Interleukin-22 downregulates filaggrin expression and

EASI p-EASI: Utilising a combination of serum biomarkers offers an objective measurement tool for disease severity in atopic dermatitis patients
61
5
4
affects expression of profilaggrin processing enzymes. Br J Dermatol 2011; 165:492-8.
32. Hayashida S, Uchi H, Takeuchi S, Esaki H, Moroi Y, Furue M. Significant correlation of serum IL-22 levels with CCL17
levels in atopic dermatitis. J Dermatol Sci 2011; 61:78-9.
33. Nograles KE, Zaba LC, Shemer A, Fuentes-Duculan J, Cardinale I, Kikuchi T, et al. IL-22-producing “T22” T cells account
for upregulated IL-22 in atopic dermatitis despite reduced IL-17-producing TH17 T cells. J Allergy Clin Immunol 2009;
123:1244-52 e2.
34. Hijnen D, Knol EF, Gent YY, Giovannone B, Beijn SJ, Kupper TS, et al. CD8(+) T cells in the lesional skin of atopic der-
matitis and psoriasis patients are an important source of IFN-gamma, IL-13, IL-17, and IL-22. J Invest Dermatol 2013;
133:973-9.
35. Noda S, Suarez-Farinas M, Ungar B, Kim SJ, de Guzman Strong C, Xu H, et al. The Asian atopic dermatitis phenotype
combines features of atopic dermatitis and psoriasis with increased TH17 polarization. J Allergy Clin Immunol 2015;
136:1254-64.
36. Mollanazar NK, Smith PK, Yosipovitch G. Mediators of Chronic Pruritus in Atopic Dermatitis: Getting the Itch Out? Clin Rev
Allergy Immunol 2016; 51:263-92.
37. Nemoto O, Furue M, Nakagawa H, Shiramoto M, Hanada R, Matsuki S, et al. The first trial of CIM331, a humanized
antihuman interleukin-31 receptor A antibody, in healthy volunteers and patients with atopic dermatitis to evaluate safety,
tolerability and pharmacokinetics of a single dose in a randomized, double-blind, placebo-controlled study. Br J Derma-
tol 2016; 174:296-304.
38. Raap U, Wichmann K, Bruder M, Stander S, Wedi B, Kapp A, et al. Correlation of IL-31 serum levels with severity of
atopic dermatitis. J Allergy Clin Immunol 2008; 122:421-3.
39. Kyoya M, Kawakami T, Soma Y. Serum thymus and activation-regulated chemokine (TARC) and interleukin-31 levels as
biomarkers for monitoring in adult atopic dermatitis. J Dermatol Sci 2014; 75:204-7.
40. Cheon BR, Shin JE, Kim YJ, Shim JW, Kim DS, Jung HL, et al. Relationship between serum 25-hydroxyvitamin D and
interleukin-31 levels, and the severity of atopic dermatitis in children. Korean J Pediatr 2015; 58:96-101.
41. Nygaard U, Hvid M, Johansen C, Buchner M, Folster-Holst R, Deleuran M, et al. TSLP, IL-31, IL-33 and sST2 are new
biomarkers in endophenotypic profiling of adult and childhood atopic dermatitis. J Eur Acad Dermatol Venereol 2016;
30:1930-8.
42. Kim S, Kim HJ, Yang HS, Kim E, Huh IS, Yang JM. IL-31 Serum Protein and Tissue mRNA Levels in Patients with Atopic
Dermatitis. Ann Dermatol 2011; 23:468-73.
43. Gold L, Walker JJ, Wilcox SK, Williams S. Advances in human proteomics at high scale with the SOMAscan proteomics
platform. New Biotechnology 2012; 29:543-9.
44. Yang HJ, Jeon YH, Pyun BY. Evaluation of patient’s subjective severity using various scoring system in Korean children
with atopic dermatitis. Asian Pac J Allergy Immunol 2010; 28:130-5.

Levels of serum TARC, IL-22 and sIL-2R predict disease severity in atopic dermatitis patients treated with Cyclosporin A
5
Levels of serum TARC, IL-22 and sIL-2R predict disease severity in atopic dermatitis patients treated with Cyclosporin A
63
5
Levels of serum TARC, IL-22 and sIL-2R predict disease severity in atopic dermatitis patients treated with Cyclosporin A
Judith L. Thijs1,2, Julia Drylewicz2, Carla A.F.M. Bruijnzeel-Koomen1, Barbara Giovannone1,2, Edward F.
Knol1,2, Marjolein S. de Bruin-Weller1, Stefan Nierkens2,3, DirkJan Hijnen1,2
1. Department of Dermatology and Allergology, University Medical Center Utrecht, The Netherlands
2. Laboratory of Translational Immunology, Utrecht, The Netherlands
3. U-DAIR, University Medical Center Utrecht, The Netherlands
Submitted

Chapter 5
64
Levels of serum TARC, IL-22 and sIL-2R predict disease severity in atopic dermatitis patients treated with Cyclosporin A
5
CAPSULE SUMMARY
A biomarker signature consisting of serum biomarkers TARC, IL-22 and sIL-2R, adequately predicts disease
severity in AD patients treated with CsA. This formula will improve comparability of study outcomes in future
clinical trials.
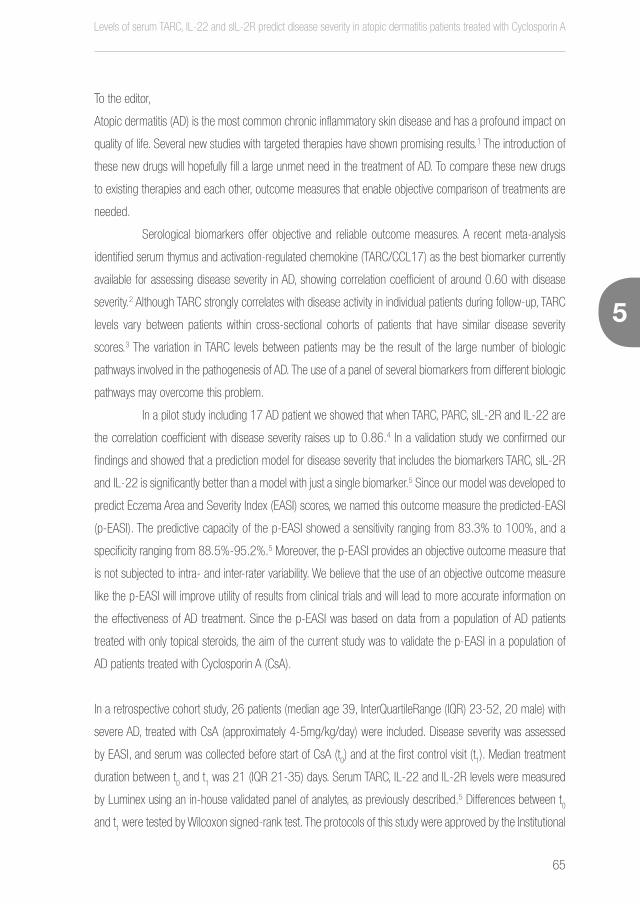
Levels of serum TARC, IL-22 and sIL-2R predict disease severity in atopic dermatitis patients treated with Cyclosporin A
65
5
To the editor,
Atopic dermatitis (AD) is the most common chronic inflammatory skin disease and has a profound impact on
quality of life. Several new studies with targeted therapies have shown promising results.1 The introduction of
these new drugs will hopefully fill a large unmet need in the treatment of AD. To compare these new drugs
to existing therapies and each other, outcome measures that enable objective comparison of treatments are
needed.
Serological biomarkers offer objective and reliable outcome measures. A recent meta-analysis
identified serum thymus and activation-regulated chemokine (TARC/CCL17) as the best biomarker currently
available for assessing disease severity in AD, showing correlation coefficient of around 0.60 with disease
severity.2 Although TARC strongly correlates with disease activity in individual patients during follow-up, TARC
levels vary between patients within cross-sectional cohorts of patients that have similar disease severity
scores.3 The variation in TARC levels between patients may be the result of the large number of biologic
pathways involved in the pathogenesis of AD. The use of a panel of several biomarkers from different biologic
pathways may overcome this problem.
In a pilot study including 17 AD patient we showed that when TARC, PARC, sIL-2R and IL-22 are
the correlation coefficient with disease severity raises up to 0.86.4 In a validation study we confirmed our
findings and showed that a prediction model for disease severity that includes the biomarkers TARC, sIL-2R
and IL-22 is significantly better than a model with just a single biomarker.5 Since our model was developed to
predict Eczema Area and Severity Index (EASI) scores, we named this outcome measure the predicted-EASI
(p-EASI). The predictive capacity of the p-EASI showed a sensitivity ranging from 83.3% to 100%, and a
specificity ranging from 88.5%-95.2%.5 Moreover, the p-EASI provides an objective outcome measure that
is not subjected to intra- and inter-rater variability. We believe that the use of an objective outcome measure
like the p-EASI will improve utility of results from clinical trials and will lead to more accurate information on
the effectiveness of AD treatment. Since the p-EASI was based on data from a population of AD patients
treated with only topical steroids, the aim of the current study was to validate the p-EASI in a population of
AD patients treated with Cyclosporin A (CsA).
In a retrospective cohort study, 26 patients (median age 39, InterQuartileRange (IQR) 23-52, 20 male) with
severe AD, treated with CsA (approximately 4-5mg/kg/day) were included. Disease severity was assessed
by EASI, and serum was collected before start of CsA (t0) and at the first control visit (t
1). Median treatment
duration between t0 and t
1 was 21 (IQR 21-35) days. Serum TARC, IL-22 and IL-2R levels were measured
by Luminex using an in-house validated panel of analytes, as previously described.5 Differences between t0
and t1 were tested by Wilcoxon signed-rank test. The protocols of this study were approved by the Institutional

Chapter 5
66
Levels of serum TARC, IL-22 and sIL-2R predict disease severity in atopic dermatitis patients treated with Cyclosporin A
5
Review Board of the University Medical Center Utrecht, the Netherlands, adhering to the Declaration of
Helsinki Principles.
During treatment, median EASI scores showed a significant decrease from 16.5 (IQR 11.5-28.4) at t0 to 4.9
(0.2-7.6) at t1 (p<0.0001, Figure 1). Median serum TARC levels significantly decreased (p<0.0001) from
1480.0 pg/ml (IQR 872.3-2883.0) to 479.6 pg/ml (IQR 312.2-1404.0). Although serum IL-22 and sIL-
2R levels did not correlate with EASI scores, median serum IL-22 and sIL-2R levels did significantly decrease
during CsA treatment from 28.9 pg/ml (IQR 3.9-72.0) and 331.6 pg/ml (IQR 153.8-514.2), to 8.6 pg/ml
(IQR 1.4-19.6) and 220.5 pg/ml (IQR 161.0-348.6), respectively (p<0.0001, Figure 1).
For the validation of the biomarker signature, EASI scores were binned into mild (≤7), moderate
(>7 and ≤21), severe (>21 and ≤50), and very severe (>50).6 Serum biomarker levels were used to predict
EASI scores by the previously published formula5: (-36.12+18.49*logTARC+0.009*IL-22-0.009*sIL-
2R)*(1-treatment)+(-5.82+4.04*logTARC+0.003*IL-22-0.003*sIL-2R)*treatment, in which treatment can
be either No=0, or Yes=1 (Table 1). The p-EASI scores using the formula were in agreement with the
clinician reported score in 73% of the cases. The formula showed a sensitivity of 82.6% and a specificity of
88.4% and is therefore considered a good predictor of disease severity.
Figure 1. Disease severity and serum biomarkers significantly decrease during treatment.
EASI scores significantly decreased during treatment with CsA. Serum levels of TARC, IL-22 and sIL-2R For
EASI scores significantly decreased during treatment with CsA. Serum levels of TARC, IL-22 and sIL-2R showed a simi-lar significant decrease during CsA treatment. Differences in EASI score and serum biomarker levels between t
0 and t
1
were tested by Wilcoxon signed-rank test. ****p<0.0001.
t0 EASI t1 EASI0
10
20
30
40
50
60
70
EASI
EASI
****
t0 t110
100
1000
10000
TARC
TAR
C(p
g/m
l)
****
t0 t10
50
100
150
200
500
IL-22
IL-2
2(p
g/m
l)
****
t0 t10
500
1000
1500
2000
sIL-2R
sIL-
2R(p
g/m
l)
****
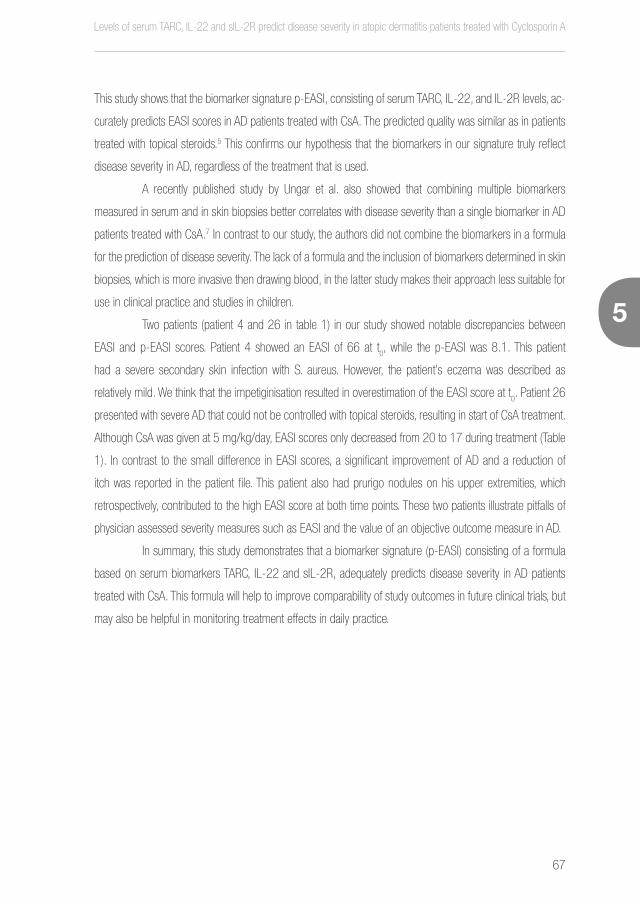
Levels of serum TARC, IL-22 and sIL-2R predict disease severity in atopic dermatitis patients treated with Cyclosporin A
67
5
This study shows that the biomarker signature p-EASI, consisting of serum TARC, IL-22, and IL-2R levels, ac-
curately predicts EASI scores in AD patients treated with CsA. The predicted quality was similar as in patients
treated with topical steroids.5 This confirms our hypothesis that the biomarkers in our signature truly reflect
disease severity in AD, regardless of the treatment that is used.
A recently published study by Ungar et al. also showed that combining multiple biomarkers
measured in serum and in skin biopsies better correlates with disease severity than a single biomarker in AD
patients treated with CsA.7 In contrast to our study, the authors did not combine the biomarkers in a formula
for the prediction of disease severity. The lack of a formula and the inclusion of biomarkers determined in skin
biopsies, which is more invasive then drawing blood, in the latter study makes their approach less suitable for
use in clinical practice and studies in children.
Two patients (patient 4 and 26 in table 1) in our study showed notable discrepancies between
EASI and p-EASI scores. Patient 4 showed an EASI of 66 at t0, while the p-EASI was 8.1. This patient
had a severe secondary skin infection with S. aureus. However, the patient’s eczema was described as
relatively mild. We think that the impetiginisation resulted in overestimation of the EASI score at t0. Patient 26
presented with severe AD that could not be controlled with topical steroids, resulting in start of CsA treatment.
Although CsA was given at 5 mg/kg/day, EASI scores only decreased from 20 to 17 during treatment (Table
1). In contrast to the small difference in EASI scores, a significant improvement of AD and a reduction of
itch was reported in the patient file. This patient also had prurigo nodules on his upper extremities, which
retrospectively, contributed to the high EASI score at both time points. These two patients illustrate pitfalls of
physician assessed severity measures such as EASI and the value of an objective outcome measure in AD.
In summary, this study demonstrates that a biomarker signature (p-EASI) consisting of a formula
based on serum biomarkers TARC, IL-22 and sIL-2R, adequately predicts disease severity in AD patients
treated with CsA. This formula will help to improve comparability of study outcomes in future clinical trials, but
may also be helpful in monitoring treatment effects in daily practice.
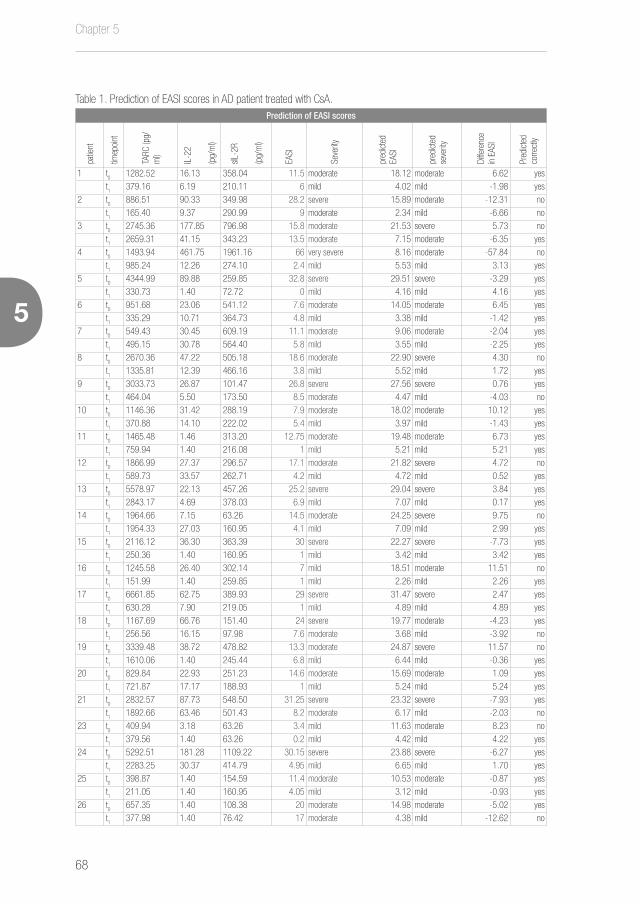
Chapter 5
68
Levels of serum TARC, IL-22 and sIL-2R predict disease severity in atopic dermatitis patients treated with Cyclosporin A
5
Table 1. Prediction of EASI scores in AD patient treated with CsA.Prediction of EASI scores
patie
nt
timep
oint
TARC
(pg/
ml)
IL-2
2
(pg/
ml)
sIL-2
R
(pg/
ml)
EASI
Seve
rity
pred
icted
EA
SI
pred
icted
se
verit
y
Diffe
renc
e in
EAS
I
Pred
icted
co
rrect
ly
1 t0
1282.52 16.13 358.04 11.5 moderate 18.12 moderate 6.62 yes
t1
379.16 6.19 210.11 6 mild 4.02 mild -1.98 yes
2 t0
886.51 90.33 349.98 28.2 severe 15.89 moderate -12.31 no
t1
165.40 9.37 290.99 9 moderate 2.34 mild -6.66 no
3 t0
2745.36 177.85 796.98 15.8 moderate 21.53 severe 5.73 no
t1
2659.31 41.15 343.23 13.5 moderate 7.15 moderate -6.35 yes
4 t0
1493.94 461.75 1961.16 66 very severe 8.16 moderate -57.84 no
t1
985.24 12.26 274.10 2.4 mild 5.53 mild 3.13 yes
5 t0
4344.99 89.88 259.85 32.8 severe 29.51 severe -3.29 yes
t1
330.73 1.40 72.72 0 mild 4.16 mild 4.16 yes
6 t0
951.68 23.06 541.12 7.6 moderate 14.05 moderate 6.45 yes
t1
335.29 10.71 364.73 4.8 mild 3.38 mild -1.42 yes
7 t0
549.43 30.45 609.19 11.1 moderate 9.06 moderate -2.04 yes
t1
495.15 30.78 564.40 5.8 mild 3.55 mild -2.25 yes
8 t0
2670.36 47.22 505.18 18.6 moderate 22.90 severe 4.30 no
t1
1335.81 12.39 466.16 3.8 mild 5.52 mild 1.72 yes
9 t0
3033.73 26.87 101.47 26.8 severe 27.56 severe 0.76 yes
t1
464.04 5.50 173.50 8.5 moderate 4.47 mild -4.03 no
10 t0
1146.36 31.42 288.19 7.9 moderate 18.02 moderate 10.12 yes
t1
370.88 14.10 222.02 5.4 mild 3.97 mild -1.43 yes
11 t0
1465.48 1.46 313.20 12.75 moderate 19.48 moderate 6.73 yes
t1
759.94 1.40 216.08 1 mild 5.21 mild 5.21 yes
12 t0
1866.99 27.37 296.57 17.1 moderate 21.82 severe 4.72 no
t1
589.73 33.57 262.71 4.2 mild 4.72 mild 0.52 yes
13 t0
5578.97 22.13 457.26 25.2 severe 29.04 severe 3.84 yes
t1
2843.17 4.69 378.03 6.9 mild 7.07 mild 0.17 yes
14 t0
1964.66 7.15 63.26 14.5 moderate 24.25 severe 9.75 no
t1
1954.33 27.03 160.95 4.1 mild 7.09 mild 2.99 yes
15 t0
2116.12 36.30 363.39 30 severe 22.27 severe -7.73 yes
t1
250.36 1.40 160.95 1 mild 3.42 mild 3.42 yes
16 t0
1245.58 26.40 302.14 7 mild 18.51 moderate 11.51 no
t1
151.99 1.40 259.85 1 mild 2.26 mild 2.26 yes
17 t0
6661.85 62.75 389.93 29 severe 31.47 severe 2.47 yes
t1
630.28 7.90 219.05 1 mild 4.89 mild 4.89 yes
18 t0
1167.69 66.76 151.40 24 severe 19.77 moderate -4.23 yes
t1
256.56 16.15 97.98 7.6 moderate 3.68 mild -3.92 no
19 t0
3339.48 38.72 478.82 13.3 moderate 24.87 severe 11.57 no
t1
1610.06 1.40 245.44 6.8 mild 6.44 mild -0.36 yes
20 t0
829.84 22.93 251.23 14.6 moderate 15.69 moderate 1.09 yes
t1
721.87 17.17 188.93 1 mild 5.24 mild 5.24 yes
21 t0
2832.57 87.73 548.50 31.25 severe 23.32 severe -7.93 yes
t1
1892.66 63.46 501.43 8.2 moderate 6.17 mild -2.03 no
23 t0
409.94 3.18 63.26 3.4 mild 11.63 moderate 8.23 no
t1
379.56 1.40 63.26 0.2 mild 4.42 mild 4.22 yes
24 t0
5292.51 181.28 1109.22 30.15 severe 23.88 severe -6.27 yes
t1
2283.25 30.37 414.79 4.95 mild 6.65 mild 1.70 yes
25 t0
398.87 1.40 154.59 11.4 moderate 10.53 moderate -0.87 yes
t1
211.05 1.40 160.95 4.05 mild 3.12 mild -0.93 yes
26 t0
657.35 1.40 108.38 20 moderate 14.98 moderate -5.02 yes
t1
377.98 1.40 76.42 17 moderate 4.38 mild -12.62 no

Levels of serum TARC, IL-22 and sIL-2R predict disease severity in atopic dermatitis patients treated with Cyclosporin A
69
5
Serum TARC, IL-22 and sIL2R levels in serum of AD patients are used to predict EASI scores before treatment (t0)
and after treatment (t1) by the formula EASI= (-36.12+18.49*logTARC+0.009*IL-22-0.009*sIL-2R)*(1-treatment)-
(5.82+4.04*logTARC+0.003*IL-22-0.003*sIL2R)*treatment, in which treatment can be either No=0, or Yes=1. Both EASI and predicted EASI scores are classified as mild (1.0-7.0), moderate (7.1-21.0) or severe (>21.1). Sensitivity and specificity were determined for the model to describe the predictive capacity of the model. We defined false positive as a predicted EASI score classifying a higher disease severity than the observed EASI scores and false negative as a
predicted EASI scores classifying a lower disease severity than the observed EASI scores.

Chapter 5
70
Levels of serum TARC, IL-22 and sIL-2R predict disease severity in atopic dermatitis patients treated with Cyclosporin A
5
REFERENCES
1. Simpson EL, Bieber T, Guttman-Yassky E, Beck LA, Blauvelt A, Cork MJ, et al. Two Phase 3 Trials of Dupilumab versus
Placebo in Atopic Dermatitis. N Engl J Med 2016.
2. Thijs J, Krastev T, Weidinger S, Buckens CF, de Bruin-Weller M, Bruijnzeel-Koomen C, et al. Biomarkers for atopic
dermatitis: a systematic review and meta-analysis. Curr Opin Allergy Clin Immunol 2015; 15:453-60.
3. Landheer J, de Bruin-Weller M, Boonacker C, Hijnen D, Bruijnzeel-Koomen C, Rockmann H. Utility of serum thymus and
activation-regulated chemokine as a biomarker for monitoring of atopic dermatitis severity. J Am Acad Dermatol 2014;
71:1160-6.
4. Thijs JL, Nierkens S, Herath A, Bruijnzeel-Koomen CA, Knol EF, Giovannone B, et al. A panel of biomarkers for disease
severity in atopic dermatitis. Clin Exp Allergy 2015; 45:698-701.
5. Thijs JL DJ, Fiechter R, Strickland I, Sleeman MA, Herath A, May RD, Bruijnzeel-Koomen CAFM, Knol EF, Giovannone B,
de Bruin-Weller MS, Nierkens S, Hijnen DJ. EASI p-EASI: Utilising a combination of serum biomarkers offers an objective
measurement tool for disease severity in atopic dermatitis patients. Accepted for publication in the Journal of Allergy and
Clinical Immunology 2017.
6. Leshem YA, Hajar T, Hanifin JM, Simpson EL. What the Eczema Area and Severity Index score tells us about the severity
of atopic dermatitis: an interpretability study. Br J Dermatol 2015; 172:1353-7.
7. Ungar B, Garcet S, Gonzalez J, Dhingra N, da Rosa JC, Shemer A, et al. An integrated model of atopic dermatitis bio-
markers highlights the systemic nature of the disease. J Invest Dermatol 2016.

Levels of serum TARC, IL-22 and sIL-2R predict disease severity in atopic dermatitis patients treated with Cyclosporin A
71
5

6

Immunoglobulin free light chains in adult atopic dermatitis patients
Judith L. Thijs1, Karen Knipping2,3, Carla A.F.M. Bruijnzeel-Koomen1, Johan Garssen2,3, Marjolein S. de Bru-
in-Weller 1, DirkJan Hijnen1
1. Department of Dermatology and Allergology, University Medical Center Utrecht, The Netherlands
2. Nutricia Research, Utrecht, The Netherlands
3. Utrecht Institute for Pharmaceutical Sciences, Faculty of Science, Utrecht University, The Netherlands
Clinical Translational Allergy 2016 Dec 6;6:44.
Chapter 6
74
6
ABSTRACT
Background:
Total IgE levels are often postulated as a biomarker for disease severity in atopic dermatitis (AD). But al-
though total IgE levels are increased in the majority of AD patients, total IgE levels do not correlate to disease
severity during short-term follow-up. During the synthesis of immunoglobulins, free light chains (Ig-FLCs) are
produced in excess over heavy chains. In comparison with IgE molecules, Ig-FLCs have a very short serum
half-life. Therefore, Ig-FLCs might be more suitable as a biomarker for disease severity during follow-up.
Recent studies showed increased serum levels of kappa Ig-FLCs in infants with AD, correlating with disease
severity. The aim of this study was to investigate serum kappa Ig-FLC levels in adults with AD, and their
correlation to disease severity.
Methods:
Serum kappa If-FLC and total IgE levels were measured in 82 moderate to severe AD patients and 49
non-atopic controls. Blood was collected from patients before start of treatment with potent topical steroids
(European classification: III-IV). 32 patients were treated during a clinical admission, and in this subpopulation
a second blood sample was taken after two weeks of treatment. Clinical severity was determined by SASSAD
and a panel of serum biomarkers, including TARC.
Results:
Serum kappa Ig-FLCs levels in adult AD patients were not increased compared to non-atopic controls.
Moreover, we observed no correlation between kappa Ig-FLC serum levels and disease severity determined
by SASSAD and a panel of serum biomarkers, including TARC. Serum kappa Ig-FLC levels did also not
decrease during treatment.
Conclusion:
There are no differences in serum kappa Ig-FLC levels between adult patients suffering from moderate to
severe AD compared to non-atopic controls. Moreover, serum levels of kappa Ig-FLCs cannot be used as a
biomarker for disease severity in adult AD.
Immunoglobulin free light chains in adult atopic dermatitis patients
75
6
INTRODUCTION
Atopic dermatitis (AD) is the most common chronic inflammatory skin disease worldwide.1 The pathogenesis
of AD is multifactorial and involves genetic, immunologic and environmental factors.2 The role of total IgE
in the pathogenesis of AD is controversial. Although the majority of AD patients have highly increased total
IgE levels, these levels do not correlate with disease severity.3 During the synthesis of immunoglobulins, light
chains are produced in excess over heavy chains.4,5 Whereas the serum half-life of IgE molecules is two
days, the serum half-life of immunoglobulin free light chains (Ig-FLCs) is only two to three hours.6 Considering
the relapsing and remitting course of AD, this might make Ig-FLCs levels more suitable as a biomarker for
disease severity than total IgE. Ig-FLCs have long been considered meaningless spillover from production
of immunoglobulins. However, recent data suggest that Ig-FLCs might convey various biological activities.4,5
Interestingly, increased levels of kappa Ig-FLCs were found in the serum of infants with severe AD compared
to infants without AD.5,6 Moreover, in a cohort of children with severe AD, levels of Ig-FLCs correlated with
disease activity.5
These reports prompted us to investigate the role of serum kappa Ig-FLCs in adult AD. In this
study, serum levels of kappa Ig-FLCs did not differ significantly between adult AD patients and non-atopic
controls. In addition, both kappa Ig-FLC and total IgE levels did not correlate to disease severity.
METHODS
Patients and controls
In a retrospective cohort study, 82 patients (50 female;16-65 years) with moderate to severe AD visiting
the UMC Utrecht were included. Patients were diagnosed according to the criteria of Hanifin and Rajka.7
Disease severity was assessed using the Six Area Six Sign Atopic Dermatitis (SASSAD) score (median 21,
IQR: 11-32), and Body Surface Area (BSA)( median 33%, IQR: 17-53). After blood was taken, all patients
were treated with potent topical steroids (European classification: III-IV), 32/82 were treated during a clinical
admission. Patients using oral immunosuppressive medications were excluded. A total of 49 age- and sex-
matched non-atopic controls (25 female; age 22-66 years) that did not suffer from any skin disease were
included. From the 32 patients that were admitted to the clinic, a second blood sample was taken after a
median interval of 11.5 days (IQR: 9.0-13.8). Protocols of this study were approved by the Institutional
Review Board of the UMC Utrecht, adhering to the Declaration of Helsinki Principles.
Chapter 6
76
6
Serum kappa Ig-FLC & total IgE
A fully automated customized kappa Ig-FLC research assay based on ELISA technology was developed
(Phadia Thermo Fisher, Uppsala, Sweden) for the Phadia 250® instrument. Kappa Ig-FLC values ≥19.4 µg/
ml were considered elevated.8 A fully automated allergy-testing system (Phadia Thermo Fisher) was used for
measurements of total IgE.9
Serum biomarkers for disease severity
In addition to clinical severity determined by SASSAD and BSA, disease severity of the 32 admitted patients
was assessed by a recently described panel of serum biomarkers.10 Therefore, serum levels of thymus
and activation-regulated chemokine (TARC/CCL17), pulmonary and activation-regulated chemokine (PARC/
CCL18), sIL-2R and IL-22 were measured using Multiplex immunoassays at the MultiPlex Core Facility of the
Laboratory for Translational Immunology (UMC Utrecht, The Netherlands) as described previously.11
Statistical analysis
SASSAD, BSA, and serum biomarker levels were normalized by log-transformation. Statistical comparisons
were performed using Pearson correlations, Wilcoxon matched-pairs signed rank tests, and unpaired two
tailed t-tests. Prism (version 6; GraphPad) was used for statistical analysis.
RESULTS
Kappa Ig-FLC
Kappa Ig-FLCs levels in AD patients (n=82) did not significantly differ from kappa Ig-FLCs levels in non-atop-
ic controls (n=49) (median: 23.63 µg/ml, IQR: 16.45-30.43, versus 15.66 µg/ml, IQR: 10.95-21.38)(Fig.
1A). Kappa Ig-FLC concentrations slightly decreased to 16.20 µg/ml (median, IQR: 10.00-24.00) after
treatment in the 32 admitted patients, although this was not statistically significant (Wilcoxon matched-pair
signed rank test)(Fig. 1B). Kappa Ig-FLC levels measured before treatment did not correlate to disease se-
verity measured by SASSAD (r=0.12, p=0.30) and BSA (r=-0.05, p=0.65). Kappa Ig-FLC levels did also
not correlate to serum TARC (r=0.19, p=0.30) or any other serum biomarker (data not shown).
Total IgE levels
Total IgE levels were significantly higher in AD patients (median: 2702.00 kU/L, IQR: 921.3-8579) than in
non-atopic controls (median: 34.05 kU/L, IQR: 12.90-75.05)(Fig. 1A). Total IgE levels did not change after
treatment (Fig. 1B). Total IgE levels did not correlate to kappa Ig-FLC levels (r=0.15, p=0.18) (data not shown).

Immunoglobulin free light chains in adult atopic dermatitis patients
77
6
Disease severity
All 32 patients that were treated during a clinical admission, showed significant improvement. SASSAD de-
creased from 33.0 (median, IQR: 28-44) to 9.0 (median, IQR: 5-16); BSA decreased from 54% (median,
IQR: 36-69) to 15.0% (median, IQR: 3.8-23.3) (Fig. 1C). Serum TARC, PARC, sIL-2R and IL-22 levels
significantly decreased in all 32 patients (Fig. 1C).
Figure 1. Serum kappa Ig-FLC and total IgE levels in AD patients and non-atopic controls.
A: A Students’ t-test showed no significant differences between the levels of kappa Ig-FLCs in AD patients (n=82; (me-dian: 23.63 µg/ml, IQR: 16.45-30.43) compared to non-atopic controls (n=49; 15.66 µg/ml, IQR: 10.95-21.38). Total IgE levels in AD patients (median: 2702.00 kU/L, IQR: 921.3-8579) were significantly higher compared to non-atopic controls (median: 34.05 kU/L, IQR: 12.90-75.05), according to a students’ t-test (p= 0,0001). B-C: Kappa Ig-FLC concentrations showed a small non-significant decrease from 23.63 µg/ml to 16.20 µg/ml (median) after treat-ment (p=0.17). No significant changes were observed between total IgE levels before and after treatment (p=0.22) (B). Disease severity measured by SASSAD and BSA, significantly decreased during a clinical admission and treatment with topical steroids (n=32). Levels of serum biomarkers TARC, PARC, sIL-2R, and IL-22 also significantly decreased. (C). Data were analyzed using a Wilcoxon matched-pairs signed rank test.
Chapter 6
78
6
DISCUSSION
This study shows that there are no differences between kappa Ig-FLC levels in adult AD patients and
non-atopic controls. In addition, we found no correlation between kappa Ig-FLCs levels and disease severity,
BSA or serum biomarker levels.
Previous studies have suggested a role for Ig-FLCs in the pathophysiology of allergic dis-
eases. Serum levels of Ig-FLCs were found to be upregulated in allergic and non-allergic rhinitis 12, 13,
and an Ig-FLC antagonist was found to abrogate airway obstruction, hyper responsiveness, and pulmo-
nary inflammation in murine model of asthma.14 Serum kappa Ig-FLCs levels were shown to be signifi-
cantly increased in children with AD compared to normal controls.5, 6 Moreover, a correlation of kappa
Ig-FLCs to disease severity was shown in children with severe AD.5 In contrast to our a priori hypothe-
sis, these findings were not reproducible in adult AD patients. Although kappa Ig-FLCs may play a role
in AD in children, in the current research no evidence for Ig-FLC involvement in adult AD was found.
Remarkably, two healthy controls showed high serum kappa Ig-FLC levels (94.0 and
180.9 µg/ml, respectively). Although these high levels may be the result of the presence of anoth-
er, non-atopic disease, these subjects were apparently healthy and reported no medical conditions.
Elevated serum Ig-FLC levels have been shown in multiple myeloma,15 systemic lupus erythemato-
sus,16 and rheumatoid arthritis patients,17 and were also reported shortly after marathon running.18
Total IgE levels were analyzed in addition to serum kappa Ig-FLC. Total IgE did not decrease during
treatment and is therefore not suitable as a biomarker for monitoring disease severity. Contrary to IgE, serum
TARC, PARC, sIL-2R and IL-22 levels significantly decreased during treatment (Fig. 1C). This confirms previous
reports, showing that these biomarkers reflect disease severity in AD patients.10 Considering the heterogeneous
character of AD, with multiple immunologic pathways playing a role, we have previously suggested to use a
panel of biomarkers, including the above mentioned.10 This panel may be able to cover multiple immunologic
pathways, and may be more suitable for assessing disease severity in AD compared to a single biomarker.
In conclusion, this study shows that there are no differences in serum kappa Ig-FLC levels be-
tween adult patients suffering from moderate to severe AD compared to non-atopic controls. Moreover,
serum kappa Ig-FLC levels do not correlate with disease severity determined by clinical outcome measures
or serum biomarkers. Additionally, serum kappa Ig-FLC levels do not decrease during effective treatment of
AD.

Immunoglobulin free light chains in adult atopic dermatitis patients
79
6
REFERENCES
1. Garmhausen D, Hagemann T, Bieber T, Dimitriou I, Fimmers R, Diepgen T, et al. Characterization of different courses of
atopic dermatitis in adolescent and adult patients. Allergy 2013; 68:498-506.
2. Eyerich K, Novak N. Immunology of atopic eczema: overcoming the Th1/Th2 paradigm. Allergy 2013; 68:974-82.
3. Thijs J, Krastev T, Weidinger S, Buckens CF, de Bruin-Weller M, Bruijnzeel-Koomen C, et al. Biomarkers for atopic derma-
titis: a systematic review and meta-analysis. Curr Opin Allergy Clin Immunol 2015; 15:453-60.
4. Thio M, Blokhuis BR, Nijkamp FP, Redegeld FA. Free immunoglobulin light chains: a novel target in the therapy of inflam-
matory diseases. Trends Pharmacol Sci 2008; 29:170-4.
5. Kayserova J, Capkova S, Skalicka A, Vernerova E, Polouckova A, Malinova V, et al. Serum immunoglobulin free light chains
in severe forms of atopic dermatitis. Scand J Immunol 2010; 71:312-6.
6. Schouten B, van Esch BC, van Thuijl AO, Blokhuis BR, Groot Kormelink T, Hofman GA, et al. Contribution of IgE and immu-
noglobulin free light chain in the allergic reaction to cow’s milk proteins. J Allergy Clin Immunol 2010; 125:1308-14.
7. Hanifin JM, Rajka G. Diagnostic Features of Atopic-Dermatitis. Acta Derm Venereol 1980:44-7.
8. Katzmann JA, Clark RJ, Abraham RS, Bryant S, Lymp JF, Bradwell AR, et al. Serum reference intervals and diagnostic
ranges for free kappa and free lambda immunoglobulin light chains: relative sensitivity for detection of monoclonal light
chains. Clin Chem 2002; 48:1437-44.
9. Bousquet J, Chanez P, Chanal I, Michel FB. Comparison between Rast and Pharmacia Cap System - a New Automated
Specific Ige Assay. Journal of Allergy and Clinical Immunology 1990; 85:1039-43.
10. Thijs JL, Nierkens S, Herath A, Bruijnzeel-Koomen CA, Knol EF, Giovannone B, et al. A panel of biomarkers for disease
severity in atopic dermatitis. Clin Exp Allergy 2015; 45:698-701.
11. de Jager W, te Velthuis H, Prakken BJ, Kuis W, Rijkers GT. Simultaneous detection of 15 human cytokines in a single
sample of stimulated peripheral blood mononuclear cells. Clin Diagn Lab Immunol 2003; 10:133-9.
12. Powe DG, Groot Kormelink T, Sisson M, Blokhuis BJ, Kramer MF, Jones NS, et al. Evidence for the involvement of free light
chain immunoglobulins in allergic and nonallergic rhinitis. J Allergy Clin Immunol 2010; 125:139-45 e1-3.
13. Meng C, Sha J, Li L, An L, Zhu X, Meng X, et al. The expression and significance of immunoglobulin free light chain in the
patients with allergic rhinitis and nonallergic rhinitis. Am J Rhinol Allergy 2014; 28:302-7.
14. Kraneveld AD, Kool M, van Houwelingen AH, Roholl P, Solomon A, Postma DS, et al. Elicitation of allergic asthma by
immunoglobulin free light chains. Proc Natl Acad Sci U S A 2005; 102:1578-83.
15. Drayson M, Tang LX, Drew R, Mead GP, Carr-Smith H, Bradwell AR. Serum free light-chain measurements for identifying
and monitoring patients with nonsecretory multiple myeloma. Blood 2001; 97:2900-2.
16. Draborg AH, Lydolph MC, Westergaard M, Olesen Larsen S, Nielsen CT, Duus K, et al. Elevated Concentrations of Serum
Immunoglobulin Free Light Chains in Systemic Lupus Erythematosus Patients in Relation to Disease Activity, Inflammatory

Chapter 6
80
6
Status, B Cell Activity and Epstein-Barr Virus Antibodies. PLoS One 2015; 10:e0138753.
17. Deng X, Crowson CS, Rajkumar SV, Dispenzieri A, Larson DR, Therneau TM, et al. Elevation of serum immunoglobulin free
light chains during the preclinical period of rheumatoid arthritis. J Rheumatol 2015; 42:181-7.
18. Campbell JP, Eijsvogels TM, Wang Y, Hopman MT, Jacobs JF. Assessment of serum free light chain levels in healthy adults
immediately after marathon running. Clin Chem Lab Med 2015.

Immunoglobulin free light chains in adult atopic dermatitis patients
81
6

IIPART
BIOMARKERS ENABLING
PRECISION MEDICINE IN
ATOPIC DERMATITIS

Chapter 7
84
7 7

Serum biomarker profiles suggest that atopic dermatitis is a systemic disease
85
7
Serum biomarker profiles suggest that atopic dermatitis is a systemic disease
Judith L. Thijs1,4* , Ian Strickland2*, Carla A.F. M. Bruijnzeel-Koomen 1, Stefan Nierkens4, Barbara Giovan-
none1,4, Edward F. Knol1,4, Eszter Csomor2 Ph.D., Bret R. Sellman3, Tomas Mustelin3, Matthew A. Sleeman2,
Marjolein S. de Bruin-Weller1, Athula Herath2, Julia Drylewicz4, Richard D. May2#, and DirkJan Hijnen1,4#
1. Department of Dermatology and Allergology, University Medical Center Utrecht, the Netherlands.
2. MedImmune, Granta Park, Cambridge, CB21 6GH, UK.
3. MedImmune, Gaithersburg, MD, 20878, USA.
4. Laboratory of Translational Immunology, University Medical Center Utrecht, The Netherlands.
*,# These authors contributed equally to this work
Submitted

Chapter 7
86
7
CAPSULE SUMMARY
By using a purely data-driven analysis we have shown that biomarker expression profiles of AD patients are
clearly different from healthy controls, confirming the presence of systemic inflammation in AD patients and
supporting the hypothesis that AD is a systemic disorder.
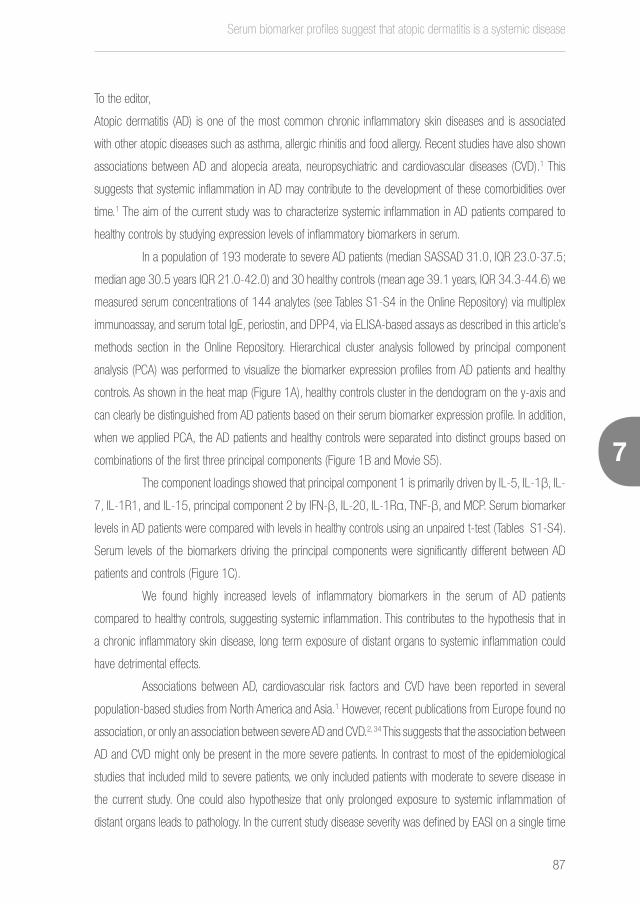
Serum biomarker profiles suggest that atopic dermatitis is a systemic disease
87
7
To the editor,
Atopic dermatitis (AD) is one of the most common chronic inflammatory skin diseases and is associated
with other atopic diseases such as asthma, allergic rhinitis and food allergy. Recent studies have also shown
associations between AD and alopecia areata, neuropsychiatric and cardiovascular diseases (CVD).1 This
suggests that systemic inflammation in AD may contribute to the development of these comorbidities over
time.1 The aim of the current study was to characterize systemic inflammation in AD patients compared to
healthy controls by studying expression levels of inflammatory biomarkers in serum.
In a population of 193 moderate to severe AD patients (median SASSAD 31.0, IQR 23.0-37.5;
median age 30.5 years IQR 21.0-42.0) and 30 healthy controls (mean age 39.1 years, IQR 34.3-44.6) we
measured serum concentrations of 144 analytes (see Tables S1-S4 in the Online Repository) via multiplex
immunoassay, and serum total IgE, periostin, and DPP4, via ELISA-based assays as described in this article’s
methods section in the Online Repository. Hierarchical cluster analysis followed by principal component
analysis (PCA) was performed to visualize the biomarker expression profiles from AD patients and healthy
controls. As shown in the heat map (Figure 1A), healthy controls cluster in the dendogram on the y-axis and
can clearly be distinguished from AD patients based on their serum biomarker expression profile. In addition,
when we applied PCA, the AD patients and healthy controls were separated into distinct groups based on
combinations of the first three principal components (Figure 1B and Movie S5).
The component loadings showed that principal component 1 is primarily driven by IL-5, IL-1β, IL-
7, IL-1R1, and IL-15, principal component 2 by IFN-β, IL-20, IL-1Rα, TNF-β, and MCP. Serum biomarker
levels in AD patients were compared with levels in healthy controls using an unpaired t-test (Tables S1-S4).
Serum levels of the biomarkers driving the principal components were significantly different between AD
patients and controls (Figure 1C).
We found highly increased levels of inflammatory biomarkers in the serum of AD patients
compared to healthy controls, suggesting systemic inflammation. This contributes to the hypothesis that in
a chronic inflammatory skin disease, long term exposure of distant organs to systemic inflammation could
have detrimental effects.
Associations between AD, cardiovascular risk factors and CVD have been reported in several
population-based studies from North America and Asia.1 However, recent publications from Europe found no
association, or only an association between severe AD and CVD.2, 34 This suggests that the association between
AD and CVD might only be present in the more severe patients. In contrast to most of the epidemiological
studies that included mild to severe patients, we only included patients with moderate to severe disease in
the current study. One could also hypothesize that only prolonged exposure to systemic inflammation of
distant organs leads to pathology. In the current study disease severity was defined by EASI on a single time
Chapter 7
88
7
point, and long term disease severity was not taken into account. To study effects of (long term) systemic
inflammation on distant organs we would prefer to use multiple measurements of disease severity over a
longer period of time rather than a single measurement.
The association between adult AD and CVD, would be consistent with a recent study that showed
the occurrence of severe CVD and metabolic abnormalities in a mouse model of severe dermatitis resulting
from persistent release of IL-1 family cytokines from the skin.5 Interestingly, both skin and systemic pathologies
were ameliorated by treatment with anti–IL-1α- and anti–IL-1β neutralizing antibodies. The present study is
the first study to show that serum IL-1Rα, IL-1β and IL-1R1 levels in AD patients are significantly increased
in AD patients compared to healthy controls (Figure 1C and see Tables S1-S4). Taken together, these data
support the concept that circulating IL-1s derived from inflammatory skin lesions, could affect distant organs,
including the heart and cause cardiovascular comorbidities.5, 6
Interestingly, IL-5, one of the key drivers of type 2 eosinophilic inflammation was found to be one
of the key drivers in differentiating AD patients from healthy controls. Previously, treatment with a humanized
monoclonal anti-IL-5 antibody (mepolizumab) failed to demonstrate clinical efficacy in early phase AD trials.7
It was hypothesized that in these studies, treatment with anti-IL-5 may have been too short to reduce
eosinophils in the skin and have clinical efficacy. In asthma, mepolizumab has been shown effective in a
subset of patients with severe, steroid refractory, eosinophilic asthma. Further studies will be required to
understand the interrelationship between skin and lung inflammation.
This study has, for the first time, demonstrated elevated serum IL-7 levels in AD patients, as
compared to controls. IL-7 is known to be produced by a number of cell types including keratinocytes and
has been shown to be essential for T cell development, survival and proliferation of memory and naive T cells
and Th17 cells.8, 9 Transgenic mice constitutively expressing IL-7 develop severe dermatitis, and massive
infiltration of T cells in the dermis.10 In addition, a polymorphism in the IL-7R gene leading to enhanced
IL-7 bioactivity, was genetically associated to AD susceptibility.11 Critically, the same IL-7R polymorphism is
associated with higher risk of type I diabetes, rheumatoid arthritis, sarcoidosis, multiple sclerosis, and asthma.
These findings make the IL-7 axis interesting as a therapeutic target for AD, but also highlight that skin derived
IL-7 could be involved in distant organ pathologies.
In conclusion, we have shown that biomarker expression profiles in moderate to severe AD pa-
tients are clearly different from healthy controls, which confirms the presence of systemic inflammation in AD
patients and supports the hypothesis that AD is a systemic disorder. More mechanistic studies are needed
to prove that systemic inflammation indeed contributes to comorbidities like asthma and cardiovascular
diseases in AD patients.

Serum biomarker profiles suggest that atopic dermatitis is a systemic disease
89
7
Figure 1. Unsupervised clustering of serum biomarker expression and principal component analysis of moderate and severe AD patients versus healthy controls.
A. Hierarchical cluster analysis. Mean serum biomarker levels are displayed across the y-axis. Healthy controls (n=30) and AD patients (n=193) are displayed across the x-axis. The heat-map reveals clear differences between biomarker expression profiles from healthy controls and AD patients.
−1 −0.5 0 0.5 1Value
Color Key
ykl40mmp1saa1c5aparctimp1icamadiponectinsCD14nap2rantesvcambdnfrbp4acecatskim1il31pd1trappin2gal9il27mip3bpf4ang2ang1apelindkk1tweakplgfvegfr1il29scfsil2rateckmcp4eselegfmifmmp8pselgal3sdf1apai1chemeringdf15taciresistincatltpoleptinscd163brakadipsinil16il18bpail1r2il1r4mmp3mcsfeotaxin3fgfbil23il3il6il10osmblcil1raifnbgcp2il8tnfbmcp3ifnglair1tnfaeporlifil1ail11il26il2il20gmcsfngfil17lightxcl1sostil21il9il13tslpil7il1bil5il1r1il15il12il25trem1migil33il37il4eotaxins100a8tnfr1gcsfopgctacks100a12mcp1lap.tgfbopnmip1amip3atotal.igetarcmdcil22i309tie2ifnafasil18endoglinvegfhgftnfr2sscfrmip1bena78mcp2ip10itacmmp9elastasempifcatbgal1faslcystcslpi
healthy controls
atopic dermatitis
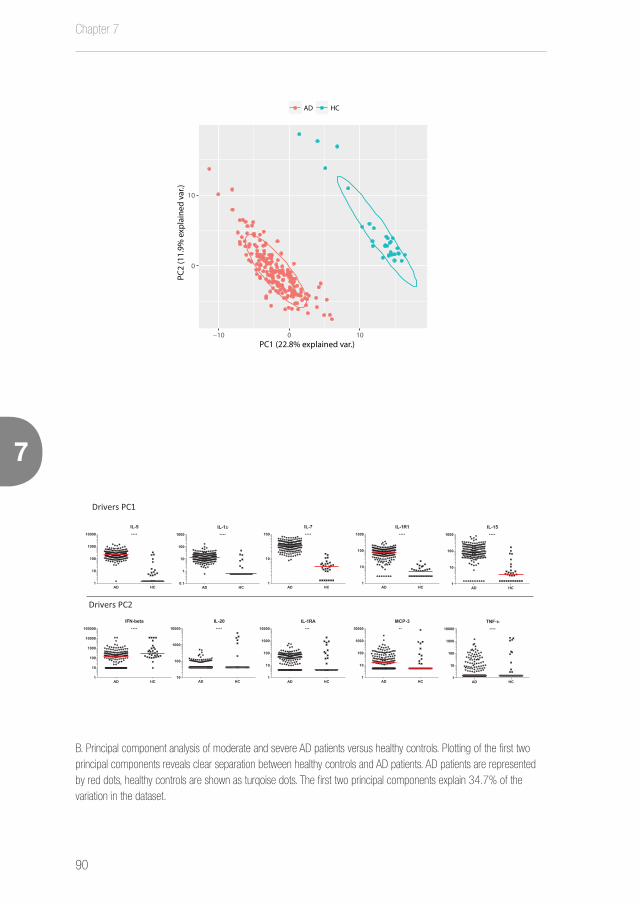
Chapter 7
90
7
B. Principal component analysis of moderate and severe AD patients versus healthy controls. Plotting of the first two principal components reveals clear separation between healthy controls and AD patients. AD patients are represented by red dots, healthy controls are shown as turqoise dots. The first two principal components explain 34.7% of the variation in the dataset.
0
10
−10 0 10PC1 (22.8% explained var.)
PC2
(11.
9% e
xpla
ined
var
.)
AD HC
AD HC1
10
100
1000
10000
IL-5****
AD HC0.1
1
10
100
1000
IL-1b****
AD HC1
10
100
IL-7****
AD HC1
10
100
1000
IL-1R1****
AD HC1
10
100
1000
10000
100000
IFN-beta****
AD HC10
100
1000
10000
IL-20****
AD HC1
10
100
1000
10000
IL-1RA***
AD HC1
10
100
1000
10000
TNF-b****
AD HC1
10
100
1000
10000
MCP-3**
Drivers PC1
Drivers PC2
AD HC1
10
100
1000
IL-15****

Serum biomarker profiles suggest that atopic dermatitis is a systemic disease
91
7
C. AD patients can be distinguished from healthy controls based on the serum biomarkers that drive each princi-pal component. Differences in serum biomarker levels were tested using an unpaired t-test (*P<0.05;**P<0.01; ***P<0.001; ****P<0.0001). All driving biomarkers are significantly different between AD patients and healthy controls. Serum biomarker levels are shown in pg/ml on the Y-axes, red lines represent the median serum levels. Serum sam-ples with analyte levels that were out of range were replaced by upper or lower limits of quantification.
SUPPLEMENTARY DATA
See http://www.dermatologyutrecht.nl/index.php/9-public/115-thijs
REFERENCES
1. Brunner PM, Silverberg JI, Guttman-Yassky E, Paller AS, Kabashima K, Amagai M, et al. Increasing Comorbidities Sug-
gest that Atopic Dermatitis Is a Systemic Disorder. Journal of Investigative Dermatology 2017; 137:18-25.
2. Andersen YM, Egeberg A, Gislason GH, Hansen PR, Skov L, Thyssen JP. Risk of myocardial infarction, ischemic stroke,
and cardiovascular death in patients with atopic dermatitis. J Allergy Clin Immunol 2016; 138:310-2 e3.
3. Standl M, Tesch F, Baurecht H, Rodriguez E, Muller-Nurasyid M, Gieger C, et al. Association of Atopic Dermatitis with
Cardiovascular Risk Factors and Diseases. J Invest Dermatol 2017; 137:1074-81.
4. Thyssen JP, Skov L, Hamann CR, Gislason GH, Egeberg A. Assessment of major comorbidities in adults with atopic
dermatitis using the Charlson comorbidity index. J Am Acad Dermatol 2017.
5. Yamanaka K, Nakanishi T, Saito H, Maruyama J, Isoda K, Yokochi A, et al. Persistent release of IL-1s from skin is asso-
ciated with systemic cardio-vascular disease, emaciation and systemic amyloidosis: the potential of anti-IL-1 therapy for
systemic inflammatory diseases. PLoS One 2014; 9:e104479.
6. Boehncke WH, Boehncke S, Tobin AM, Kirby B. The ‘psoriatic march’: a concept of how severe psoriasis may drive
cardiovascular comorbidity. Exp Dermatol 2011; 20:303-7.
7. Oldhoff JM, Darsow U, Werfel T, Katzer K, Wulf A, Laifaoui J, et al. Anti-IL-5 recombinant humanized monoclonal anti-
body (mepolizumab) for the treatment of atopic dermatitis. Allergy 2005; 60:693-6.
8. Heufler C, Topar G, Grasseger A, Stanzl U, Koch F, Romani N, et al. Interleukin-7 Is Produced by Murine and Human
Keratinocytes. Journal of Experimental Medicine 1993; 178:1109-14.
9. Mazzucchelli RI, Riva A, Durum SK. The human IL-7 receptor gene: deletions, polymorphisms and mutations. Semin
Immunol 2012; 24:225-30.
10. Uehira M, Matsuda H, Hikita I, Sakata T, Fujiwara H, Nishimoto H. The Development of Dermatitis Infiltrated by Gam-

Moving towards endotypes in atopic dermatitis: identification of patient clusters based on serum biomarker analysis
8
Moving towards endotypes in atopic dermatitis: identification of patient clusters based on serum biomarker analysis
93
8
Moving towards endotypes in atopic dermatitis: identification of patient clusters based on serum biomarker analysis
Judith L. Thijs1,4*, Ian Strickland2*, Carla A.F. M. Bruijnzeel-Koomen1, Stefan Nierkens4,
Barbara Giovannone1,4, Edward F. Knol1,4, Eszter Csomor2, Bret R. Sellman3, Tomas Mustelin3, Mat-
thew A. Sleeman2, Marjolein S. de Bruin-Weller1, Athula Herath2, Julia Drylewicz4,
Richard D. May2#, DirkJan Hijnen1,4#
1. Department of Dermatology and Allergology, University Medical Center Utrecht, the Netherlands
2. MedImmune, Granta Park, Cambridge, CB21 6GH, UK
3. MedImmune, Gaithersburg, MD, 20878, USA
4. Laboratory of Translational Immunology, University Medical Center Utrecht, The Netherlands
*,# These authors contributed equally to this work
Accepted for publication in the Journal of Allergy and Clinical Immunology
Chapter 8
94
Moving towards endotypes in atopic dermatitis: identification of patient clusters based on serum biomarker analysis
8
ABSTRACT
Background:
Atopic dermatitis (AD) is a complex, chronic, inflammatory skin disease with a diverse clinical presentation. It
is however unclear whether this diversity exists at a biological level.
Objective:
To test the hypothesis that AD is heterogeneous at the biological level of individual inflammatory mediators.
Methods:
Serum from 193 moderate to severe adult AD patients (geomean (95%CI) SASSAD of 22.3 (21.3, 23.3)
and 39.1 (37.5, 40.9) respectively) and 30 non-AD healthy controls was analysed for 147 serum mediators,
total IgE and 130 allergen specific IgEs. Population heterogeneity was assessed by principal component
analysis (PCA) followed by unsupervised k-means cluster analysis of the principal components.
Results:
AD patients showed pronounced evidence of inflammation compared to healthy controls. PCA of AD serum
data revealed the presence of four potential AD patient clusters. Fifty-seven principal components (PCs)
described approximately 90% of the variance. Unsupervised k-means cluster analysis of the 57 largest PCs
delivered 4 distinct clusters of AD patients. Cluster 1 had high SASSAD and BSA with the highest levels of
PARC, TIMP-1 and sCD14. Cluster 2 had low SASSAD with the lowest levels of IFN-α, TIMP-1 and VEGF.
Cluster 3 had high SASSAD with the lowest levels of IFN-β, IL-1 and epithelial cytokines. Cluster 4 had low
SASSAD but highest levels of inflammatory markers: IL-1, IL-4, IL-13 and TSLP.
Conclusion:
AD is a heterogeneous disease both clinically and biologically. Four distinct AD patient clusters have been
identified that could represent endotypes with unique biological mechanisms. Elucidation of these endotypes
warrants further investigation and will require future intervention trials with specific agents such as biologics.
Moving towards endotypes in atopic dermatitis: identification of patient clusters based on serum biomarker analysis
95
8
INTRODUCTION
Atopic dermatitis (AD) is the most common inflammatory skin disease worldwide. The underlying pathological
mechanisms are incompletely described and AD presents clinically with a broad range of features. Different
clinical AD phenotypes have been described that are based on characteristics such as age of onset, or the
presence of other atopic diseases such as allergic rhinitis and asthma.1, 2 Despite efforts to better understand
AD pathogenesis through defining phenotypical subsets, for example patients with intrinsic as compared
to those with extrinsic AD,3, 4 AD pathogenesis remains poorly understood. Indeed it is hypothesised that
AD cannot be explained by one mechanism alone; this hypothesis also suggests that it is unlikely that
newly developed biological drugs that target highly specific biological axes of the immune or skin barrier
development systems will be effective in all AD patients. Consistent with this thinking recent clinical trials with
the anti-IL4Rα monoclonal antibody dupilumab have been very encouraging, but it is clear that this treatment
is not equally effective in all patients, and that an alternative therapeutic approach will be required in some
patients. Indeed, in the recently published phase 3 dupilumab trials the primary outcome of reduction in IGA
to 0 or 1 occurred in 38% of patients.5 In the exciting future of personalised healthcare it is critical to be able
to provide the right drug to the right patient. Hence, it is essential to gain better insight into the heterogeneous
nature of the disease at the biological level. We hypothesised that the heterogeneity in AD could be described
via differential serum biomarker profiles and set out to test this using a broad Luminex panel assessed in a
large 200-patient cohort of moderate and severe AD patients. When these data were subjected to principal
component analysis (PCA) followed by unsupervised cluster analysis, we were able to identify four patient
clusters with distinct serum biomarker profiles and overlapping clinical phenotypes that may represent distinct
disease endotypes.
Chapter 8
96
Moving towards endotypes in atopic dermatitis: identification of patient clusters based on serum biomarker analysis
8
METHODS
Study design
We hypothesised that AD is heterogeneous at the biological level of individual serum inflammatory mediators.
To test this hypothesis we measured 147 analytes in the serum of 200 moderate to severe AD patients
and 30 non-atopic dermatitis healthy controls via Luminex-based multiplex immunoassays, total IgE and
allergen-specific IgEs (ISAC) were also assessed. Clinical characteristics were extracted from the patients’
electronic files. Principal component analysis (PCA) of the serum biomarker data (including total IgE) followed
by unsupervised k-means cluster analysis was used to identify heterogeneous patient clusters. ISAC data
was not included in PCA analysis since it was comprised of semi-quantitative data only (detailed methods
related to measurement of serum mediators and statistical analysis are available in the Methods section in
this article’s Online Repository).
Patients and controls
The rule of thumb adopted for sizing populations for multivariate principal components is five times the
number of independent variables measured.6 The number of independent variables mentioned above is
the number of unique variables that are not correlating to any other variable. Our experience from asthma
research suggests7 that analytes are often highly correlated; extrapolating this suggested that within 150
analytes there are likely to be about 20 unique independent variables. Following the guidance above, the
required sample size was 100 (5*20) moderate, and 100 severe patients.
From a biobank of over 1000 AD patients, 200 patients who were all treated with only topical
corticosteroids, were selected. To select patients they were first grouped based on the Six Area, Six Sign
Atopic Dermatitis (SASSAD) severity score8 into six groups; moderate patients with SASSAD scores ranging
from (i) 15-20 (ii) 21-25 (iii) 26-30 and severe patients with SASSAD scores ranging from (i) 31-35 (ii)
36-40 (iii) >40. Then, as previous analysis revealed that gender and age were factors of interest in AD9, the
six groups were normalised on sex and age prior to final selection. Final selection included equal numbers
from each of the six SASSAD groups. Thirty healthy controls without a previous history of AD, allergic asthma
or allergic rhinoconjunctivitis, and approximately age and sex matched to the AD patients, were recruited from
UMC Utrecht and included in the study.
All AD patients were diagnosed with AD according to the criteria of Hanifin and Rajka.10 However,
AD patients present with a wide spectrum of clinical features that can vary considerably between individuals.
From our observations in the clinic we have the impression that there are two mutually exclusive subsets
of patients; patients with a predominantly chronic lichenified eczema, and patients with a predominantly
Moving towards endotypes in atopic dermatitis: identification of patient clusters based on serum biomarker analysis
97
8
erythematous eczema. In order to correlate clusters with clinical features, we labelled patients as chronic
lichenified eczema or erythematous eczema.
The protocols of this study were approved by the Institutional Review Board of the University
Medical Center Utrecht (Utrecht, The Netherlands), adhering to the Declaration of Helsinki Principles.
RESULTS
Patient demographics, clinical characteristics and serum biomarker profiles
From the 200 serum samples, seven were different time points from the same individuals and hence were
not included in the final patient selection. Therefore a total of 193 moderate to severe AD patients were
studied, made up of 95 moderate and 98 severe patients. Thirty adult controls with no history of AD, allergic
asthma or allergic rhinitis were also recruited for the study, although they were older than the AD patients
(geomean (95%CI) age of 39.1 (34.3, 44.6) years versus 30.6 (28.3, 33.2) years for moderate and 31.1
(28.5,34.0) years for severe patients). Moderate AD patients had a lower SASSAD and lower median body
surface area (BSA) involvement than severe AD patients (geomean (95%CI) SASSAD 22.3 (21.3, 23.3)
versus 39.1 (37.5, 40.9), respectively and median (Q1, Q3) BSA of 33% (21, 48) versus 54% (39, 72),
respectively). All AD patients had elevated levels of serum TARC compared to healthy controls (median (Q1,
Q3) of 3950 (2104-8944) pg/mL in severe AD, 1505 (654, 3200) pg/mL in moderate AD and 97 (68,
137) pg/mL in controls). Patient characteristics are summarised in Table 1.
For all patients and healthy controls, serum concentrations of 147 analytes were determined
via multiplex immunoassay. Serum total and specific IgEs, periostin, DPP4, anti-Staphylococcus aureus
alpha toxin IgG levels were also measured. A bioassay was used to measure the neutralising ability of
Staphylococcus aureus alpha toxin antibodies in AD and healthy control serum. For technical reasons, IL-
19, GRO-α and SR-PSOX could not be measured in healthy controls. In AD patients, all analytes were
detectable (Tables S2-S7). In serum of healthy controls, IL-3, leukaemia inhibitory factor (LIF), eotaxin,
I309, and macrophage colony-stimulating factor (M-CSF) were undetectable (Tables S2-S7). In general AD
patients had a clearly different serum biomarker profile from healthy controls with large upregulation of key
inflammatory biomarker families in AD versus control including Th2, epithelial and IL-1 family cytokines as
well as total IgE and specific IgEs (Tables S4-S8).
Principal component analysis and unsupervised cluster analysis reveals four clusters of AD patients
To test the hypothesis that AD was biologically heterogeneous we performed PCA on the Box-Cox transformed
serum biomarker dataset which revealed the likely presence of four clusters (Fig 1A). Summation of the
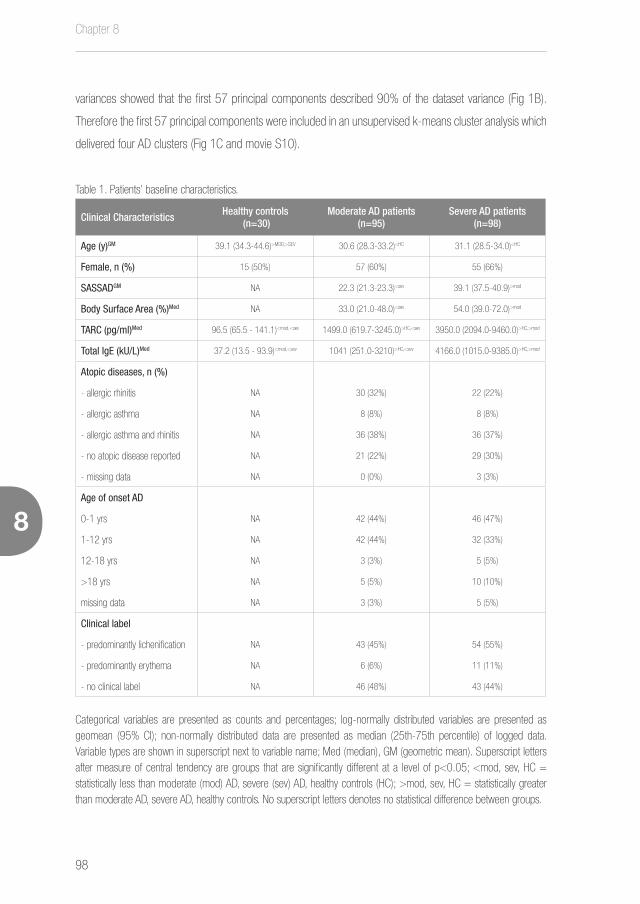
Chapter 8
98
Moving towards endotypes in atopic dermatitis: identification of patient clusters based on serum biomarker analysis
8
variances showed that the first 57 principal components described 90% of the dataset variance (Fig 1B).
Therefore the first 57 principal components were included in an unsupervised k-means cluster analysis which
delivered four AD clusters (Fig 1C and movie S10).
Table 1. Patients’ baseline characteristics.
Clinical Characteristics Healthy controls (n=30)
Moderate AD patients (n=95)
Severe AD patients (n=98)
Age (y)GM 39.1 (34.3-44.6)>MOD,>SEV 30.6 (28.3-33.2)<HC 31.1 (28.5-34.0)<HC
Female, n (%) 15 (50%) 57 (60%) 55 (66%)
SASSADGM NA 22.3 (21.3-23.3)<sev 39.1 (37.5-40.9)>mod
Body Surface Area (%)Med NA 33.0 (21.0-48.0)<sev 54.0 (39.0-72.0)>mod
TARC (pg/ml)Med 96.5 (65.5 - 141.1)<mod,<sev 1499.0 (619.7-3245.0)>HC,<sev 3950.0 (2094.0-9460.0)>HC,>mod
Total IgE (kU/L)Med 37.2 (13.5 - 93.9)<mod,<sev 1041 (251.0-3210)>HC,<sev 4166.0 (1015.0-9385.0)>HC,>mod
Atopic diseases, n (%)
- allergic rhinitis NA 30 (32%) 22 (22%)
- allergic asthma NA 8 (8%) 8 (8%)
- allergic asthma and rhinitis NA 36 (38%) 36 (37%)
- no atopic disease reported NA 21 (22%) 29 (30%)
- missing data NA 0 (0%) 3 (3%)
Age of onset AD
0-1 yrs NA 42 (44%) 46 (47%)
1-12 yrs NA 42 (44%) 32 (33%)
12-18 yrs NA 3 (3%) 5 (5%)
>18 yrs NA 5 (5%) 10 (10%)
missing data NA 3 (3%) 5 (5%)
Clinical label
- predominantly lichenification NA 43 (45%) 54 (55%)
- predominantly erythema NA 6 (6%) 11 (11%)
- no clinical label NA 46 (48%) 43 (44%)
Categorical variables are presented as counts and percentages; log-normally distributed variables are presented as geomean (95% CI); non-normally distributed data are presented as median (25th-75th percentile) of logged data. Variable types are shown in superscript next to variable name; Med (median), GM (geometric mean). Superscript letters after measure of central tendency are groups that are significantly different at a level of p<0.05; <mod, sev, HC = statistically less than moderate (mod) AD, severe (sev) AD, healthy controls (HC); >mod, sev, HC = statistically greater than moderate AD, severe AD, healthy controls. No superscript letters denotes no statistical difference between groups.
Moving towards endotypes in atopic dermatitis: identification of patient clusters based on serum biomarker analysis
99
8
Characterisation of AD clusters
AD cluster membership, or control status, was added back to the complete dataset and all variables were
compared by cluster versus the healthy controls. Clinical characteristics (not included in the clusters analysis)
were analysed between the four clusters and are shown in Table 2. Averages of serum analytes per cluster
were calculated and tabulated to characterise the clusters (Table S2 and S3). As expected more frequent
sensitization to allergen components measured by ISAC was seen in AD patients compared to healthy
controls (Table S8). However, no clear differences in sensitization patterns were observed between the patient
clusters (Table S9). Measurement of anti-S. aureus alpha toxin IgG was used as a systemic marker of AD
patient S. aureus exposure, however this showed no difference between clusters. Total IgE levels did also not
show any significant differences between the four clusters (Table S3). Key characteristics, both clinical and
serum profiles, for each AD cluster are described below.
Cluster 1 (high SASSAD/BSA, PARC/TIMP-1/sCD14 high) represented 23% of the AD population
and was 59% female. Cluster 1 patients had a geomean (95%CI) age of 31.2 (27.7, 35.1) years and,
alongside cluster 3, the highest severity score. Cluster 1 geomean (95%CI) SASSAD was 35.3 (31.9, 39.0),
which was greater than clusters 2 and 4, and cluster 1 median (Q1,Q3) BSA score was 54 (40.4, 69), which
was greater than clusters 2 and 3. Cluster 1 was uniquely defined by having the highest levels of PARC, TARC
and TIMP-1 (both greater than clusters 2, 3, 4 and healthy controls) and was distinguished from clusters 2,
3 and 4 by having the highest level of sCD14 (Table S2). Clinically cluster 1, alongside cluster 3, had the
highest incidence of asthma (54% vs 53%, respectively) which was greater than that in clusters 2 and 4
(43% vs 36%, respectively) although cluster 1 was unique in having the highest incidence of asthma and
rhinitis (47% vs 38%, 38%, 32%, respectively). Cluster 1 patients had a similar frequency of erythematous
phenotype to cluster 4 (15% vs 19%, respectively) which was above that observed in clusters 2 and 3 (8 and
4%, respectively). Cluster 1 patients also shared with cluster 4 patients the highest frequency of infant onset
AD (57% vs 56%, respectively) which surpassed those in clusters 2 and 3 (45% and 42%, respectively)
(Table 2).
Cluster 2 (low SASSAD, IFN-α/TIMP-1/VEGF low) represented 29% of the AD population and
was 56% female. Cluster 2 patients were younger than cluster 3 patients with a geomean age (95%CI) of
28.1 (25.3, 31.1) years and, alongside cluster 4, the lowest severity score. Cluster 2 geomean (95%CI)
SASSAD was 25.5 (23.2, 28) which was lower than both clusters 1 and 3, and cluster 2 median BSA (Q1,
Q3) was 36 (24, 54) which was less than cluster 1 (Table 2). Cluster 2 was uniquely defined by having the
lowest levels of TIMP-1 (lower than clusters 1,3,4 and healthy controls), VEGF and IFN-α (lower than clusters
1, 3, 4, but higher than healthy controls). Clinically cluster 2 patients had a similar frequency of lichenified
phenotype as cluster 3 (74% vs 76%, respectively) which was above that observed in clusters 1 and 4 (60%
Chapter 8
100
Moving towards endotypes in atopic dermatitis: identification of patient clusters based on serum biomarker analysis
8
and 43%, respectively). Cluster 2 patients also had the highest frequency of childhood onset AD (47%) which
surpassed those in clusters 1, 3 and 4 (36%, 43% and 30%, respectively).
Cluster 3 (high SASSAD, IFN-β/IL-1/epithelial cytokine low) was the largest cluster, representing
33% of the AD population, and was 53% female. Cluster 3 patients were older than both cluster 2 and 4
patients with a geomean (95% CI) age of 35.0 (31.4, 39.0) years. Cluster 3, alongside cluster 1, had the
highest severity score. Cluster 3 geomean (95% CI) SASSAD was 32.1 (29.7, 34.8), which was higher than
both clusters 2 and 4. Cluster 3 median BSA (Q1, Q3) was 40.5 (27, 54) which was less than cluster 1.
Cluster 3 was uniquely defined by having the lowest levels of IFN-β, IL-1Ra, IL-26, MIG (all less than control
and clusters 1, 2, 4), eotaxin, IL-1β, IL-1R1, IL-4, IL-9, IL-12, IL-15, IL-21, IL-25, IL-33, TREM1, TSLP
(all more than controls but less than clusters 1,2,4), CTACK, IL-1α, Gro-α, IL-19, IL-37 (all less than clusters
1, 2, 4). Clinically, cluster 3 patients had the lowest frequency of erythematous phenotype (4% vs 15%,
8%, 19%, respectively) as well as, together with cluster 4, the highest frequency of adult onset AD (12%
vs 5%, 4%, 11%, respectively) (Table 2). Cluster 3 patients also had the highest frequency of comorbid
asthma alone (15% vs 7%, 6%, 4% respectively) as well as, together with cluster 1, the highest frequency
of comorbid asthma alone or with rhinitis (53% vs 54%, 43%, 36%, respectively) (Table 2).
Cluster 4 (female predominant, low SASSAD, IL-1/4/13 and TSLP high) represented 15% of
the AD population and was the most female predominant group (68%). Cluster 4 patients were younger
than cluster 3 patients with a geomean (95% CI) age of 27.4 (23.3, 32.1) years and, alongside cluster 2,
the lowest severity score. Cluster 4 geomean (95% CI) SASSAD was 25.8 (22.4, 29.7) which was lower
than both clusters 1 and 3 and cluster 4 median BSA (Q1, Q3) was 43.5 (33, 55). Cluster 4 was uniquely
defined as profoundly inflamed by having the highest levels of BLC, elastase, eotaxin, EPOR, FGF-b, GCP-2,
GM-CSF, IFN-γ, IL-1α, IL-1β, IL-1Ra, IL-1R1, IL-4, IL-8, IL-9, IL-11, IL-13, IL-15, IL-17, IL-19, IL-20,
IL-21, IL-37, LAIR1, LIGHT, MCP-3, MIP-1α, NGF, SOST, sVEGF-R1, TNF-α, TNF-β, TREM-1, TSLP, XCL-1
(all more than clusters 1,2,3 and healthy controls), GRO-α, IFN-β, IL-2, PLGF (all more than clusters 1,2,3)
(Table S2). Clinically, cluster 4 patients had the highest frequency of erythematous phenotype (19% vs 15%,
8%, 4%, respectively). Cluster 4 patients also had the lowest frequency of comorbid asthma (36% vs 54%,
43% and 53%, respectively) and the highest frequency of no comorbid asthma or rhinitis (36% vs 23%,
26% and 20%, respectively) (Table 2).
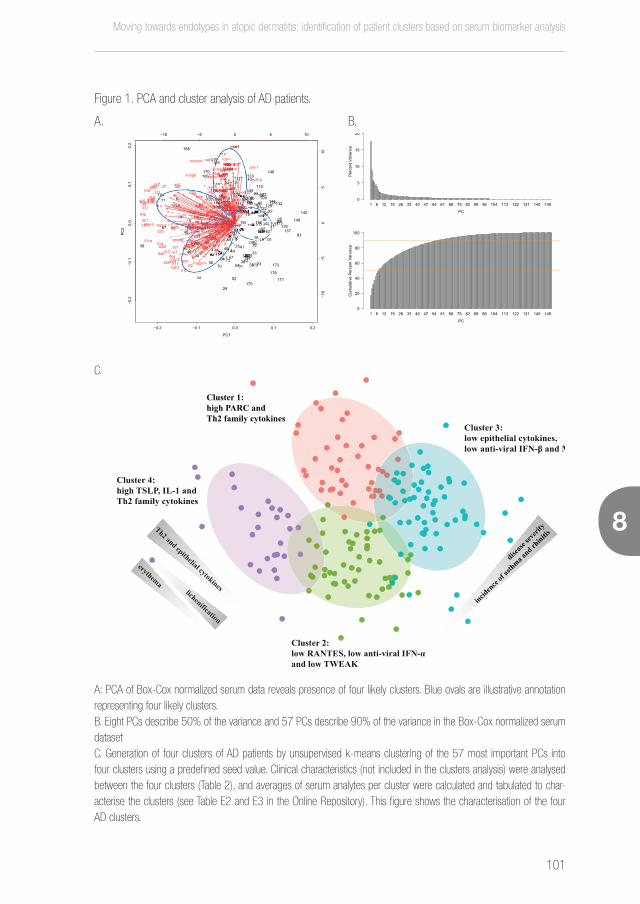
Moving towards endotypes in atopic dermatitis: identification of patient clusters based on serum biomarker analysis
101
8
Figure 1. PCA and cluster analysis of AD patients.
A.
−0.2 −0.1 0.0 0.1 0.2
−0.2
−0.1
0.0
0.1
0.2
PC1
PC
2
12
3 5
6
8
9
1011 12
1314
15
16
17
18
19
2021
22
23
24
25
26
27
28
29
30
31
3334
35
36
37
38
39
40 41
4243 44
45
46
47
48
49
50
51
52
5354
55
5657
58
5960
61
62
63
64
65
66
67
68 69
70
71
72
7475
76
7778
79
80
8182
83
84
8586
87
88
8990
9192
9394
95
9697
98
99
100
101
102
103
104
105
106107
108
109
110
111
112
113114
115
116117
118
119
120
121
122
123
124125
126
127
128
129
130
131
132
133134
135
136
137
138
139
140
141
142
143
144
145
146
147
148
149
150
151
152
153154 155
156
157
158159
160
161
162163
164
165
166
167
168
169
170
171
172 173
174
175
176
177
178
179 180181
182
183
184
186
187188
189
190191
192
193
−10 −5 0 5 10
−10
−50
510
anti.at.igg
pct.at.lysis.neutdpp4
periostin
total.ige
ace
adiponectin
adipsinang1
ang2
apelinbdnf
blc
brak
c5a
catb
catl
cat-s
chemerin
ctack
cystc dkk1
egf
elastase
ena78
endoglin
eotaxin
eotaxin3epo-r
eselfas
faslfgfb
gal1
gal3
gal9
gcp2
gcsf
gdf15
gmcsf
gro-a
hgfi309
icam
ifna
ifnbifng
il10
il11
il12il13il15
il16
il17
il18
il18bpa
il19
il1a
il1b
il1r1
il1r2
il1r4il1ra
il2
il20
il21
il22
il23
il25
il26
il27
il29 il3.
il31
il33
il37il4il5
il6
il7
il8
il9 ip10
itac.117.dq
kim1lair1
lap-tgfb
leptin
liflight
mcp1
mcp2
mcp3
mcp4
mcsf
mdc
mifmig
mip1a
mip1b
mip3a
mip3b
mmp1
mmp3
mmp8
mmp9mpif
nap2
ngf opg
opn
osm
pai-1parc
pd1 pf4plgf
p-sel
rantesrbp4
resistin
s100a12
s100a8
saa1
scd14
scd163
scf
sdf1a
sil2ra
slpi
sost
srpsox
sscfrtaci
tarc
teck
tie2
timp1
tnfa
tnfb
tnfr1
tnfr2
tpo
trappin2
trem1
tslp
tweak
vcam.92.dq
vegf
vegfr1
xcl1
ykl40
84
8888888888888888888888887777777777777777
88
3
1
116117
119999999999999999999999999999999999999999999
122222222000000000000000000000000000000
125
134
133333333333333333333333333333333333335
6112222222222222200000000002000000000
138
111111111111111111
8151
111111111111111111111111111111552
1
11111
165
1677777777122222222222222212
77777777779 80181
188
18911
1ut3 t
pe1e1
per ti3636111100011363636sssssttttttttttttt11iossssssssss11111111111333333333333333333111133333322222222000022002222220000i
al.i1111111g111111l.i
a
adiponeeeeeeeeeeeeeeeeeeeeeeeeeeeeeecccccccccccccccccccc99po899p88dip88d11a
cccccccccccccccccccccccccccccc555555a catl
s11
cut 25882
eeeeeeeeeeeeeee g777777777777777777777777777777777777777777777777777777 n00in800n00
eueu3333ee333u3euu3333ee3333cceueueueu
54
dcatlcatl
icam
a55aa11fn1100if00 5n0000877eeeeee777777777777
222222222222222222222888888888888888888882222222228st222ttttttttttttttttstteueeue
mp18
388819 l8888l8888dogdo18181818eendend9999
nap2
aaaaaaaaotaotaotaootaotaootaotottotaottotatottotatott
parc
nnnnnnnnnnnnnnnnnnnnttttttttttttttttttttttttttes 134rgdf1gdf1134
gg cacacacassgggg
sc 14165165 nnparcparc165165165165
s1212s e2
gg2211gg21gg
1111i
11122228822stt2
p114141
fr100nf00tn885050888gg
00
tp848
3434 o
k33k3322
vvvvvvvvvvvvvvvvvvvvvvvvvvvvvvvvvvcccccccccccccccccccam.92.dq138138aa mmmm88
gggggggggggggggggggggggggggggggggggggggggggg77777777777777777777777777f11
ykl40ccee.92.. 2.138138138138cccc1111111eeee3333333 mmmm888
3 5
6
9
28
3945
107
118
1111111111111112713333333333333333333333333333300000000000000000000000000000000000000000000000000000000107107
15
18888888888888888888888888888888844444444444444444444444444444444444444444444444444444444
111t a111pct.a11
sin
bdnf
bbbbbbbbbbbbbbbbbbbbbbbbbbbbbbbbbbbbbbbblc
sin
f
asta157157elasta99157157stas
faff s
g9
gal3ppss
2
hgi33333333300000009999999
il16didi
18iiiiiiiiill1
il18bpa55157157555il18bpa551818
77bastt5757575a157571577 tt
331818
il7
ip10
citacitacitacitaccpapa
hhhheeeeeeeehhhssssssssiiiiiiiinnnnnnnnnnnnnnnnnnnnnssssssssiiiiiiiinnnnnnnnnnnnnssssssiiiiiiiinnnnnnnnnnnnnnnnnnssssssiiiiiiiinnnnnnnnnnneeeeennnnnnnnnnnnnnnnnnnnnnnnnnnnnnnnnnnnnnnnnnnnnnnnn
mc.11.11m1171171171111
mmmmmmmmmmmmmmmmmmaaaaaaaaaaaaaaaadddipppppppppppppppppppppaaaaaaaaaaaaaaaadddippppppppppppp1111115555555111555551115555511155555 pspspppppppppppssssssssssssssssssadipsadipsd pd pddddddddiiiiiiiiiiiiddddiiiiiiiiiiiii555555555555555555555555555555555555555555555555555555 ppppppppppppssspppssspppppppspppsssschchssssssssssssssssssssssssssssssssssssssssssssssssssssssssssssssssssssssssss
m11811m111mip3a1818m118118ip3a88ip3a
pppp555555555555555555555555555555555555555555555dd5555 ppppppppppppppppppppppppppppppppppppppppppppppppppppppppppppppppppppppppppppppppppppppppppppppppppp
p semcpmcp11711711
s77
t99gg99999
tnfr2ffaaff ssssip1p1
veg33egfr133
88
031333333999999999999999999999999999999999999
8888
555555555555555555555 0319315111t lyyyyyyyyy1555555555555555555555555555551888888888888888888888888888888888888888888888888888899151118888at19191111a1919111 33eli11
ppppppppppppppppelineeeeeeee33333333333333333333333333333333333333333333333333333999999999999999999999999999999999999993333333333333333333333333333333333333333333399999999999999999999999999een9999 1ppppppppppppppppppppppppppppppppp
11 3e33nn 3nene0000n..........nnnnnnnnnnnnnnnnnne....ne..........nnnnnnnne....ne
8
rrrrrrrrrrrrrrr222222222222222222222222222222222222222222222ill111111111111111111111111111111111111111111111111111111111111rrrrrrrrrrrrrrrrrrrrrrrrrrrrrrrrrrr2222222lllllllllllllllllllllll55555555555537733555555555555555888888888888883338888888888888833388888888888888833aaaaaaannnnn7777777777777777777777777777777777777777777777777777777777aaaaaa7777777aaaaaaaaaaaaaaaaaaaaaaaaaaaaaaaaaaaaaaaaaaaaaaaaaaaaaaaaaaaaaaaaaaaaaaaaaaaaaaaaaaaaaaaaaaaaaaaaaaaaaaaaaaaaaaaaaa777777777777777777777777777777888888888888777773337777n7777777888333 ttt777777777777777777777777777ys7777777c7777777777788777733337777777ss88883333333777777777777777777777777777777777777777777777777777777777777777777777777777777777777777777777777777777777777777777777777777777777 2277777777777777777777777777777777777777777777777777777777777777777777777777777777777777777777777777777777777777777777777777777777777777777777777777777777777777777777777777777777777777777777777777777777777777777777777777777777777777777777777777777777777777777777777777777777777777777777777777777777777777777777777777777777777777777777777777777777777777777777777777777777777777777777777777777777777ysysyss777yyyyyysyyyysyss777777777777cccyyyyccyyyy777777777777777777777777777777.........nnnnnnnnnnne....ne.........nnnnnnnnnnne....nenenenm9mmmmmmmmmmm9999999999999999999999999999999999999999999999nn99999999999 1nen0000ee000000010000100000000ccccccccccccccccccpp1111mccccccccccccccccccccccccccccccccccccccccmcccccccccccccccccccccccccccc1000111000000000000777777111111aaaaaaaaaaaaaaaaaaaaaaaaaaaaaaaaaaaaaaaaaaaaaaaaaaaa1111111111111 00nnn000000nnn10nenne0000000000nn11111111111111111111111111111111111111111111111111111111
mmmmmmmmmmmmmmmmmmmmmmmmmmmmmmmmmmmmmmmmmmmmmmmmmmmmmmmmmmip8118ee11e inin
ttttttttttttttttoooooooooooooooooooooooooooooooooooooootttoooooooooooooooooooooooooooooooooooooottttttttttooooooooooooooooooooooooo77777777777777777777777777777777777777777777777777777777777777777777777777777777777777777777777777777777oooooooooooooooooooooooooo777777777777777777777777777777777777777777777777777777777777777777777777777oooooooooooo7777777777777777777777777777777777777777777777777777777777777777777777777777777777777777777777777777777777777777777777777777777777777777777777777777777777777777777777777777777777777777777777777777777777777777777777777777777777777777el44
saaaaaaaaaaaaaaaaaaaaaaaaaaaaaaaaaaaaaaaaaaaaaaaaaaaaaapppppppppppppppppppppppppppppppppppppppppppppaaaaaaaaaaaaaaaaaaaaaaaaaaaaaaaaaaaaaaaaaaaaaaapppppppppppppppppppppppppmmmmmmmmmmmmmmmmmmmmmmmmmmmmmmmmmmmmmmmmmmmmmaaaaaaaaaaaaaaaaaaaaaaaaaaaaaaaaaaaaaaaaaaaaaaaaaaaaaaaaaaaaaaaaaaaaaaaaaaapppppppppppppppppppppppppppppppppppppeaaaaaaaaaaaaaaaaaaaaaappeaaaaaaaaaaaaaaaaaaaaaaaaaaaaaaaaaaaaaaaaaaaaaaaaaaaaapppppppppppppppppppppppppppppppeaaaaaaaaaaaaaaaaape
3333tt iiyyyyyyyyyyyyyyyyyyyyyyyyyyyyy88888888888888888888888888888888888888888888888888888888888838888888888888888888888888888888888888888888388888888888888888888888888888888888888888838888888888888888888888883888888888888888888888888888888888888883888888888888888888888888888888888883888888888883888888888888888888888888888888888888888888888888888888888333333sssss83333333ccccccccccccssssssssssss8888888333333333333333 eeeeeecccccccccccccccccccccccccccccccccccccccc..........................................3388838883883883888888888838883883883888888888833333333ccsss8888888833333333333333cccc................pppppp333mmmmmmmmm333333yyyyyyyyyyyyyyyyyyyy8888888888888888888888888888888888888888888888888888888888888888888888888888888888888888888888888888888888888888888888888888888888888888888888888888888888888888888888888888888888888888888888888888888888888888888888888888888888888888 ssssssss88333333 eeeeeeeemccccccccccccccccccccccccccccccccccccccpppmcccccccccccccccccccccccppccccccppcccccc3333333333333333333333333333333333333333333333333311111111111111113333333ccccpppppppppppppppppppppppp111111111111111111111111111111111111111111111111111111111111111111111111111111111111111111111111111111111111ii8333388333883833333888888888888888 ssssssssssssssssssssssssssssssssssssssssssssssssssssssssssssssssssssssssss333333333333333333333333333333333333333333333333333333333333333333333333333388888888888888888888888888888333333333333331111eeeeeeeeeeeeeeeeeeeee11111111111111111111111111111111111111111111111111111111111111111111111111111111111111111111111111111111111111111111111111111111111111111111111111111
558888 c00c00c5050888888ll5500l55511888881118888888881115050505iiii505505555
e2ii11inin111505088885050888
ppppeppnnnnnnnnnnnnnnnnnnnnnnnnnnnnnnnnnnnnn99999999999999999999999999999ppppppppppnn99pppppppppppppppppppppp
aa1111aaaaaaaaaaaaaaaaaaaaaaaaaaaaaaaaaaaaaaaaaaaaaaaaaaaaaaaaaaaaaaaaaaaaaaaaaaaaaaaaa1111aaaaaaaaaaaaaaaaaaaaaaaaaaaaaaaaaaaaaaaaaaaaaaaaaaaaaaaaaaaaaaaaa11111111111111111111111111111111111111111111aaaaaaaaaaaaaaaaaaaaa11111111111111111111111111111111111111111 k3322333322030333220000828282822222000000088111182822282220000000000000008811110000000000010100000010100000011222222e2222e8282
iinn88888282828282828288888888
2
8
11111111111111
111111111111111111111113
16
17
19
2161621
24262424
3077
34
358837
40000000000000000000000000000000000000000111111111111111111111111114346
47
48
566666
58
59666666666666666666666666666666666666666666666666666666666660
6288
63
111111111111
65
6666666666666666666666666666622
68 69777777777777777777777777777777777777777777771
7466
941549 63
g14
rrrrrrrrraaaaaakctac66k6ck66ack
55ota55ta5959xin399ax n5959ota2121ot662121666666666eeeeeeeeeeeeeeeeeeeeeeeeeeeeeeeeeeeeeeeeeeeeeeeeeppo2o2o2211r12211rfaslf
g2227272222fg22f 222222popo22221122111122111al943a4
gagcsal9al9 f
ng
0000000000000000000000000000
3771r43737l1r433iiiiiiiiiiiilll1r4
00
iiiiiiiil23po-po-r1rr11rr26868lkk
il29ffasasffff 37474l3337733
l633il633i
i11eeeeeeeeeeeeeeeeeekkeeeeeemeeeeemeeeeeeeeee ii11
lifcp3g
mip31311p31mip b77777b777777b
9ggmmmmmmmmmmmmm7777111177
gf opgosm0022000
65pd1
6565pd1 pff4444444444444444444447700777
94494111111111111111111111111111111111111111111111111111111111111111111111111111111111111144444444444444444444444444444p99
1222a1266200666622727sssssssssssssssssssssssssssssssssssssssss1111111111111066666666sssss 20022ss 00 2 2222ee666622226666666f22727277ff 2272727272222ff2222 bb20202021112211i00iiiiiiiiiiiiiiiiiiiiiiiiillllllll2lllllll2smsm27272727l2l2l2l2000llll
s100a888s100a888s10 8ackackil2l26666il226666il226666il2l2686868687788272768686868l2l268686868lkkk
111111671717174747474474747447447444444444444444447777777
s 2rraaaaaaaaaaaaaaaaaaaaaakkkkkkkkkkaaaaaaaaaaaaaaaaaaaaakggggggggggggggggggggggggggggggggggggggggggggkkkkkkkkkkkkkkkeeeeeeeeeeeeeeeeeeeeeekkkkkkkkkkkkkkkkkkkkeeeeeeeeeeeeeeeeeeeeeeeeeeeeeeeeeeeeeeeer11a191
slpi
x9
ttttttttttttttttttttttttttttttttttttnlilifffffaff
tnnnnnnnnnnnnnnnnnnnnnnnnnnnnnnnnfffffffffffffffffffffffffffffffffffffb
ti rappin2
18
9666666666163 1
77777nti.at77nti.at7nnnnnnnnnnnnnnti at77ttttttttttttttttttttttttttttttttttttttiii at i767 aaaaaaaaaaaaaaaaaaaaaaaaaaaaaaaaaaa 41111111666666666666666666666666666 nnnnnn1111111111111111111111111111111111111111inn11n11nnnnnnnnnnnnnnnnnnnnnnnnnnn111111111111111111111111111111111111111111111nnnn
asaseeeeeeeeeeeeeeeegggggggggggggggggggggggggggggggggggggggggggggggggggg
il22 il3133il3133il31
dq1dq1dq11q11
6666666666666im11919666966666666666666666666666666666666eeeee9999999999999999999999999999999999999999999999999999999999999999999999999999999999999999999999999999999999999999999999999999999999999999999999999999999999999999999999999999999999999999999996666666666666666666666666666666666666666666666666666666999999999999999999999999999999999999999999999999999999999999999999999999999999999999999999999999999999999999999999mmmmmmmme6666666666666666666666666666666666666666666666666666666666666666666666666666666666666666666666666666666666666666666666666eeeeeeeeeeeeeeeeeeeeeeeeeeeeeeeeeeeeeeeeeeeeeeeeeeeeeeeeeeemmmmmmmmmmmmmmmmmmmmmmmmmmmmmmmmmmeeeeeeeeeeeeeeeeeeeemmeeeeeeeeeeeeeeeeeeemmeeeeeeeeeennnnnnnn ii1111mmmmmmmmmmmmmmmmmmmmmmmmmmmmmmmmmmmmmmmmmmmmmmmmmmmmmmmmmmmmmmmm11111111111111111111111111111111111111111111111111111111111111111111111111111111111111111111111111111111111111111111111111111111111111111111111111111111111111111111111111111111111mmmmmmmmmmmmmmmmmmmmmmmm111111111111111111111111111111
mcp217.d17.d777777
mmmmmmmmmmmmmmmmmmmmmmmmmmmmmmmmmmmmmmmmmmmmmmmmmmmmmmmmmmmmmmmmmmmmmmmmmmmmmmmmmmcccccccccccccccccccccccccsssssssssssssssssssssssnnnnnnnnnnnnnnnnnnnnniiiiiiiiiiiiiiiiiiiiillllllllll2222222222222222222222iiiiiiiii 222222222222222f
ipi
mp9g777g666ggg777777777777777777777777777777776666777777777777766ggggg77777777777777666666666666666777777766666666666777777766666666666777777766666666gggggggggggggggggggggggg76666666666666666666666666666666666666666666666666666666666666666666666666666676666666666666666666666666666666666666666666gggggggggg7666666666666667666666666667666666666666766666666666ggggggggggggggggggggggggggggggggggggggggggggggggggggggggggggggggggggggggggggggggggggggggg7666666666666766666666676666666667666666666ggggggggggggggggggggggggggggg7676 aaaaaaaaaaaaaaaaaaaaaaaaaaaaaaaaaaaaaaaaaaaanangggggggggggggggggggggggggggggggggggggggggggggggffff
d1
pp77
aaaaaaaaaaaaaaaaaaaannaaaaaan11141141414aaaaaaaaaaaaaaaaaanaaaaaaaaaaaaaan1111111111111111111114a11111414144anaana141414411aaaaaanaaaan1414144141sssssssssssssssssssss77777777777ss2222ffff777777777777777777777777777777777777777ffffffffffffffffffffffffffrgggggggggggggggg666666666666666666666666666666666666666666666666666666666666666666ps313mpmpgggggg6666666 op9p9x99nnnnnnnnnnnnnngggggggggggggggaaaaaaaaaaaaaaaaaaaaaaaaaaaaaaaaaaaaaaaaaaaaaaaaaaaaaaaaaaggggggggggggggaaaaaaaaaaaaaaaaaaaaaaaaaaaaaaaaaaaaaaaaaaaaaaaaaaaaaaaaaaaaaaaaaaaaaaaaaaaaaaaaaaaaaaaaaannnnnnnnnnnnnnnnnnnnnnnnnnnnnnnnnnnnnnnnnnnaaaaaaaaaaaaaaaaaaaaaaaaaaaaaaaaaaaaaaaaaaaaaaaaaaannnnnnnnnnnnnnnnnnnnnnnnnnnnaaaaaaaaaaaaaaaaaaaaaaaaaaaaaaaaaaaaannnnnnnnnnnnnnnaaaaaaaaaaaaaaaaaaaaaaaaaaaaannnnnnnn
8
9311911119iildddq11dq11dq1dq11qdd4dddd
elp4p4dd
50
55
7777777777777777777777777777777777777777777777777777777777777777777799999999999999999999999999999999999999999999999999999999999999999
82 888888885555555555555555555555555555555555555555555555555555555555555555555590
9999999999999999999999999999999999999999999999999999999999999999999999999111111111111111111111111111111111111111111111111111111111966666666 99999999999999999999999999999888888888888888888888888888888888888888888888888555555555555555555555555555555555588888888888888888888888888855555555555555
11111111111111111111111110
102104
1058888108828296962
11111
2
14115
1222222222222222222222222222222222222222222222222222222222222222222222222222222222222122
12
11111111111111111111111111333333333333333333333333333333333333333333333333333333333333333333333333331111111119999999999999999999999999999999999999999999
14244
822
11151151555553531155155156
605555
1618888
16255555555
7655
18211186111122
1
192
pp48482222166488488p
at1111ca11 tb44bppppppppppppippppppppppppppppppppppppppppppppppppp f6333333333ppppppppppp
66 125
121111111111111111164888888888888888888888888888888666666666666666666666666666666666666666688888866666666116666666666966 11111111114444444444444466666666666666666666666666666666666666666666666666666666666666666666666666666666666666666666666666666666666666666666666666666666666666
8888888888888888888888888888888888888881119999999999999999999999900000000000000000000008888888811111111111111888888881111111111111666666696669
1
d44666644pp1414112121211144441111111dp11111166111111111d446666446666666p666614466666d466666688888888888888888888888888888888888888888888888888888888888888888888888888888888888888888888888888888888888888888888888888888888888888888888888888888888888888888888888888888888888888888888888888888888888888888888888888888888888888888888888811111111111111111111111111111111111111111111111111111111111111111111111111111111111111111111111111111
00k1999999999999999999999999999999999999999999999999999999990000000000000000000000000000000000000000000000000000000000000000000000000999999999999999999999999999999999000000000000000000000000000000000000000000000000011k99111111111111111111111111111111111kkkkkkkkkkkkkkkk111111155588888888888888888811111111111111888888888888888888888888888111111111111888888888888888888888888888888888888888888888888888888888888888888888888888888888888888888888888888888888888888888888888888888888888888888888888888888888888888888888888888888888888888888888888888888888888kkkkkkkkkkkkkkk1111111111119991111111111111111111111111111111111111111111111111111111111111111111111111111111111111111111fffffffff666666661111111188888888888eeeeeeeeeeeeeeeeeeeeeeeeeee888888888888888888888888888888888888888888888888888888888888888888888888888888888888888888888888888888888888888118888888888222888888888888888888888888888888888888888888888888888888888888888888888888888888888888888888888888888888888888888888888888888888888888888888888888888888888888888888888888888888888888888888888888888888888888888888888888888888888888888888888888888888888888eeee888888888888888888888888888888888888888888888888888888888888888888888888888
2288888888888888888888888888888888888888888888888888888888888888888888888881111666666666991111111166666661111111111116666666666666661111111111rr666666
111188888888888888888888888888888888888888881111111111111111111118888888888888888888888118888888888888888881111111111188888888888888888888888888888888888881111111111111888888888888888888111111111888888888888888888888888888888888888888888888888888888888888888888888888888888888888888888888888888888888888888888888888888888888888888888888888888888888888888888888888888888888888888888888888
55555555555555555555555555555555555555555555555555555555555555555555555555555555555555111111111111111111111111111944444444444444444444444444444444444444444444444111111111111111111111111111
5499 11601111111111111111111111111111111111111111111111111111111111111 55111163333333333333333333333333333333333333333333333333333333333333333333333333333444
ccccccccccccccccccccccccccccccccccccccccccccccccccccc11ccccccccccccccccccccccccc
44411111111111111111111111111111111111111111111111111111111111444444444444444444444444
666666666666666666666666666
C.
A: PCA of Box-Cox normalized serum data reveals presence of four likely clusters. Blue ovals are illustrative annotation representing four likely clusters. B. Eight PCs describe 50% of the variance and 57 PCs describe 90% of the variance in the Box-Cox normalized serum dataset C. Generation of four clusters of AD patients by unsupervised k-means clustering of the 57 most important PCs into four clusters using a predefined seed value. Clinical characteristics (not included in the clusters analysis) were analysed between the four clusters (Table 2), and averages of serum analytes per cluster were calculated and tabulated to char-acterise the clusters (see Table E2 and E3 in the Online Repository). This figure shows the characterisation of the four AD clusters.
1 6 12 19 26 33 40 47 54 61 68 75 82 89 96 104 113 122 131 140 149
PC
Perc
ent V
aria
nce
0
5
10
15
20
1 6 12 19 26 33 40 47 54 61 68 75 82 89 96 104 113 122 131 140 149
PC
Cum
ulat
ive
Perc
ent V
aria
nce
0
20
40
60
80
100
Cluster 3:low epithelial cytokines, low anti-viral IFN-β and MIG
Cluster 2:low RANTES, low anti-viral IFN-α and low TWEAK
Cluster 4:high TSLP, IL-1 andTh2 family cytokines
Cluster 1:high PARC and Th2 family cytokines
Th2 and epithelial cytokineslichenification
dise
ase se
verity
i
nciden
ce of
asthma a
nd rhinitis
erythema
B.
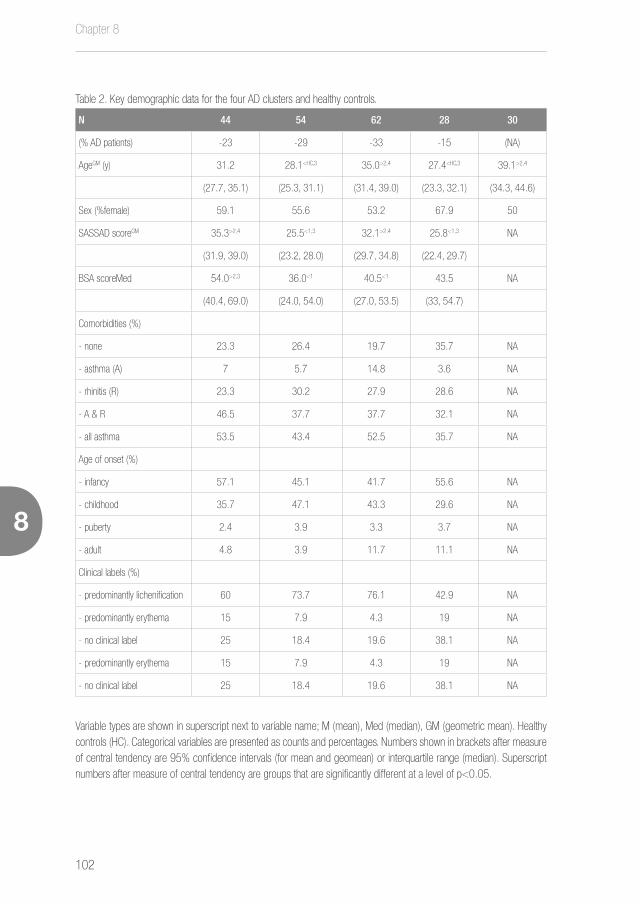
Chapter 8
102
Moving towards endotypes in atopic dermatitis: identification of patient clusters based on serum biomarker analysis
8
Table 2. Key demographic data for the four AD clusters and healthy controls.
N 44 54 62 28 30
(% AD patients) -23 -29 -33 -15 (NA)
AgeGM (y) 31.2 28.1<HC,3 35.0>2,4 27.4<HC,3 39.1>2,4
(27.7, 35.1) (25.3, 31.1) (31.4, 39.0) (23.3, 32.1) (34.3, 44.6)
Sex (%female) 59.1 55.6 53.2 67.9 50
SASSAD scoreGM 35.3>2,4 25.5<1,3 32.1>2,4 25.8<1,3 NA
(31.9, 39.0) (23.2, 28.0) (29.7, 34.8) (22.4, 29.7)
BSA scoreMed 54.0>2,3 36.0<1 40.5<1 43.5 NA
(40.4, 69.0) (24.0, 54.0) (27.0, 53.5) (33, 54.7)
Comorbidities (%)
- none 23.3 26.4 19.7 35.7 NA
- asthma (A) 7 5.7 14.8 3.6 NA
- rhinitis (R) 23.3 30.2 27.9 28.6 NA
- A & R 46.5 37.7 37.7 32.1 NA
- all asthma 53.5 43.4 52.5 35.7 NA
Age of onset (%)
- infancy 57.1 45.1 41.7 55.6 NA
- childhood 35.7 47.1 43.3 29.6 NA
- puberty 2.4 3.9 3.3 3.7 NA
- adult 4.8 3.9 11.7 11.1 NA
Clinical labels (%)
- predominantly lichenification 60 73.7 76.1 42.9 NA
- predominantly erythema 15 7.9 4.3 19 NA
- no clinical label 25 18.4 19.6 38.1 NA
- predominantly erythema 15 7.9 4.3 19 NA
- no clinical label 25 18.4 19.6 38.1 NA
Variable types are shown in superscript next to variable name; M (mean), Med (median), GM (geometric mean). Healthy controls (HC). Categorical variables are presented as counts and percentages. Numbers shown in brackets after measure of central tendency are 95% confidence intervals (for mean and geomean) or interquartile range (median). Superscript numbers after measure of central tendency are groups that are significantly different at a level of p<0.05.
Moving towards endotypes in atopic dermatitis: identification of patient clusters based on serum biomarker analysis
103
8
DISCUSSION
Atopic dermatitis is recognized as a complex and highly heterogeneous disease, characterised by a diverse
clinical manifestation, but little work has been performed to characterise the biological differences underlying
this clinical heterogeneity. Classically, clinical characteristics such as disease severity, age of onset, and the
presence of atopic comorbidities are used to divide AD into different disease phenotypes.2 However, these
phenotypical characteristics do not seem to relate to specific disease mechanisms and have not yet given
us new insights in the underlying pathology of disease. It has become increasingly clear that AD is not only
heterogeneous based on clinical characteristics, but that different underlying pathophysiological processes
are found in different subgroups of patients.11, 12 The primary goals of our study were firstly to test whether
AD is heterogeneous at the level of the serum biomarker profile and then to describe this heterogeneity and
its relationship to clinical presentation.
To the best of our knowledge, this is the first study that classifies AD patients on serum biomarker
based clusters. We used a purely data-driven approach to cluster serum biomarker profiles in a population
of moderate to severe AD patients. This approach revealed four distinct clusters of AD patients, showing
that adult AD truly is a heterogeneous disorder. Each cluster has a distinct profile of soluble mediators
that together may indicate these clusters are driven by distinct, as yet unidentified, underlying pathways.
Classification based on subgroups defined by distinct functional or pathophysiological mechanisms is termed
endotyping.13, 14 The four distinct patient clusters that we identified in this study could represent endotypes
that have unique biology driving the pathogenesis of disease. Further biological studies and interventional
trials will be needed to confirm the endotype of each cluster. However, it is hoped that endotypes could be
used to target specific therapies in future clinical trials and daily practice.
Each cluster in our analysis is characterised by certain serum biomarkers and clinical characteristics
which are significantly differentially expressed. Two of the clusters, 1 and 3 (SASSADs of 35 and 32), were
relatively more severe than clusters 2 and 4 (SASSADs of 25 and 26). Of the more severe clusters, cluster 1
was delineated from the others by having the highest levels of PARC, TARC, TIMP-1 and sCD14. In contrast,
cluster 3 was defined by the lowest levels of host-defence associated molecules including IFN-β and MIG,
IL-1 family members IL-1α and IL-1β, Th2 cytokines IL-4 and IL-9, as well as the key immune initiating
epithelial cytokines, IL-25, IL-33 and TSLP. Of the less severe clusters, cluster 2 was defined by having the
lowest levels of TIMP-1, VEGF and IFN-α whereas cluster 4 was defined by being female predominant (68%)
and having the highest levels of multiple inflammatory cytokines including the IL-1 family, Th2 cytokines IL-4,
IL-9, IL-13 and the epithelial cytokine TSLP.
Moving beyond individual cluster differentiating patterns of mediator expression there were also
Chapter 8
104
Moving towards endotypes in atopic dermatitis: identification of patient clusters based on serum biomarker analysis
8
interesting commonalities across the clusters (Figure 1C). Patients in cluster 1 and 4, representing 48%
of patients, showed particularly high Th2-cytokine levels and an erythematous skin phenotype, and would
hypothetically represent ideal patients for Th2 targeting drugs that are currently being tested, including the
anti-IL-4Rα antibody dupilumab, and anti-IL-13 antibodies Lebrikizumab and Tralokinumab (NCT02755649,
NCT02340234, NCT02347176).15-17 Moreover, given the recent success of dupilumab in AD trials,
the biomarker expression of these two clusters could directly relate to the underlying pathophysiological
processes in these patients.
Clusters 2 and 3, representing 52% of the patients, share a Th2-cytokine low and pauci-
inflammatory mediator state (analogous to that seen in Th2-low asthma)18 as well as presenting with a greater
frequency of lichenified skin phenotype. These clusters would hypothetically represent patient groups that
are not ideal for Th2 targeting drugs and that a more comprehensive biological characterisation of disease
mechanisms in these patients will be required to allow generation of more tailored therapeutics.
The statistically non-significant association of an erythematous skin with a strong epithelial
cytokine and Th2 phenotype, and the association of a lichenified skin with a weak epithelial cytokine and
Th2 phenotype, is intriguing and could imply a mechanistic link (Figure 1C). Whether this mechanistic
link is real or simply represents biomarkers of an as yet unidentified biological mechanism remains to be
elucidated. Similarly, understanding how the underlying biology of patients in clusters 2 and 3 could drive the
lichenification process needs further investigation.
Taken together the clusters found in our study, approximately 48% “Th2 high” and 52% “Th2
low”, are consistent with recent phase 3 data from dupilumab in AD5 demonstrating that 62% patients did
not achieve the primary endpoint of reduction in IGA and would support the use of biomarkers to identify
optimal dupilumab responders in future trials. Whilst, both clusters 1 and 4 have high Th2 cytokines, they
can be clearly differentiated from each other through high expression of PARC and TSLP respectively. This
might indicate a pathophysiological process in cluster 4 in which the higher levels of TSLP could drive a more
pruritic phenotype.19 Thus, patients in cluster 4 could represent those patients that would respond best to new
anti-TSLP biologics currently being tested.
The identification of phenotypes, leading to hypothetical endotypes, based on cluster analyses of
immune mediators has been demonstrated in other diseases including asthma,7, 20, 21 COPD7 and chronic
rhinosinusitis.22 If such endotyping can be confirmed with interventional studies it will prove useful with
the introduction of new targeted therapies, since patients with different endotypes may respond differently
to the same treatment. Sub-grouping patients based on a serum biomarker and blood eosinophils has
already been proven to be useful in asthma, where anti-IL-13 therapy appears to be most effective in the
specific subgroup of patients with high serum levels of periostin.23, 24 Similarly, quantifying blood eosinophils

Moving towards endotypes in atopic dermatitis: identification of patient clusters based on serum biomarker analysis
105
8
in asthmatics has facilitated the identification of those patients that best respond to IL-5 axis targeting drugs,
such as Benralizumab.25 The ability to endotype AD patients may contribute to precision medicine by allowing
treatment to be tailored for individual patients.14 This would not only be beneficial for patients, but would also
reduce health-care costs.26 We expect that biomarker analyses may become essential in all clinical trials, to
enable a better selection of patient populations and optimize therapy.
Data presented in this study also confirms that there is systemic inflammation in AD patients,
supporting the hypothesis that AD is a systemic disorder. The high expression of many inflammatory cy-
tokines and chemokines in the serum of AD patients resulted in clear differences in biomarker expression
profiles between AD patients and healthy controls, as shown in Table S4 and S5. The concept of AD as a
systemic disorder was recently highlighted in a meta-analysis of data from the AD transcriptome.27 Given
that three population-based studies have shown an association between adult AD, cardiovascular disease,
and increased heart attacks28 systemic inflammation in AD may, as in psoriasis, contribute to cardiovascular
disease.29 The results of this study thus warrant further investigation. One limitation of this study is the inability
to identify a clear association between the four clusters and clinical characteristics other than severity scores
such as the presence of allergic asthma or rhinitis, and age of onset of the disease. The patients in this study
were selected solely on disease severity (SASSAD), sex and age, no other clinical characteristics peculiar to
AD were considered for selecting patients. Additionally detailed clinical characterisation was not available for
every patient. Therefore, the absence of an association between the clusters and other clinical characteristics
may be due to missing data or the consequence of the unbalanced presence of these clinical characteristics
across the hypothetical endotypes. It also highlights the significant challenges in identifying endotypes with
underlying pathophysiological mechanisms based on clinical features such as age of onset or the presence
of other atopic diseases. The fact that we could not find any clear differences in sensitization patterns based
on 150 specific IgE levels between the patient clusters strengthens this hypothesis. This would also be in
accordance with the findings of dupilumab trials in which treatment effects were found to be similar in both
intrinsic and extrinsic AD patient groups.3, 4
Additionally, the present study is retrospective, and its findings will need further validation of
the utility of serum biomarkers for clustering AD. The clusters that were identified in this study should be
confirmed in an independent patient population in a prospective study. Prospective studies including more
biomarkers may, we anticipate, reveal more subgroups of patients and give more insight into the association
with clinical characteristics. Also, a longitudinal study may provide us additional insights into the stability of
biomarkers in a patient over time. The current study focused on serum biomarkers, which may just represent
the down-stream effects of certain underlying pathways. Interventional clinical trials will help to confirm
whether the serum biomarkers associated with each cluster directly relate to a pathological mechanism

Chapter 8
106
Moving towards endotypes in atopic dermatitis: identification of patient clusters based on serum biomarker analysis
8
and thus confirm clusters as specific endotypes. In order to more precisely endotype patients and identify
underlying pathways, future studies should follow a multi-layer approach, integrating high throughput data
from genomics, transcriptomics, lipomics, and proteomics with extensive clinical data.
In summary, in a population of moderate to severe AD patients, we have identified four clearly differentiated
clusters, illustrating the heterogeneity of AD, at the molecular and phenotypic level. Each cluster is characterised
by a specific serum biomarker profile, implying that each of these clusters is driven by a distinct underlying
pathway and may represent endotypes. The identification of these endotypes through future interventional
studies with specific pathway neutralising agents could enable more specific targeting of the underlying
disease pathways and contribute to more personalized treatment strategies for AD patients in the future.

Moving towards endotypes in atopic dermatitis: identification of patient clusters based on serum biomarker analysis
107
8
SUPPLEMENTARY DATA
See http://www.dermatologyutrecht.nl/index.php/9-public/115-thijs
REFERENCES
1. Eyerich K, Novak N. Immunology of atopic eczema: overcoming the Th1/Th2 paradigm. Allergy 2013; 68:974-82.
2. Bieber T. Atopic dermatitis 2.0: from the clinical phenotype to the molecular taxonomy and stratified medicine. Allergy
2012; 67:1475-82.
3. Beck LA, Thaci D, Hamilton JD, Graham NM, Bieber T, Rocklin R, et al. Dupilumab treatment in adults with moderate-to-se-
vere atopic dermatitis. N Engl J Med 2014; 371:130-9.
4. Thaci D, Simpson EL, Beck LA, Bieber T, Blauvelt A, Papp K, et al. Efficacy and safety of dupilumab in adults with
moderate-to-severe atopic dermatitis inadequately controlled by topical treatments: a randomised, placebo-controlled,
dose-ranging phase 2b trial. Lancet 2016; 387:40-52.
5. Simpson EL, Bieber T, Guttman-Yassky E, Beck LA, Blauvelt A, Cork MJ, et al. Two Phase 3 Trials of Dupilumab versus
Placebo in Atopic Dermatitis. N Engl J Med 2016.
6. Hatcher L. A Step-by-Step Approach to Using the SAS® System for Factor Analysis and Structural Equation Modeling.
Cary, North Carolina: SAS Publishing; 1994.
7. Ghebre MA, Bafadhel M, Desai D, Cohen SE, Newbold P, Rapley L, et al. Biological clustering supports both “Dutch” and
“British” hypotheses of asthma and chronic obstructive pulmonary disease. J Allergy Clin Immunol 2015; 135:63-72.
8. Berth-Jones J. Six area, six sign atopic dermatitis (SASSAD) severity score: a simple system for monitoring disease activity
in atopic dermatitis. Br J Dermatol 1996; 135 Suppl 48:25-30.
9. Thijs JL, Nierkens S, Herath A, Bruijnzeel-Koomen CA, Knol EF, Giovannone B, et al. A panel of biomarkers for disease
severity in atopic dermatitis. Clin Exp Allergy 2015; 45:698-701.
10. Hanifin JM, Rajka G. Diagnostic Features of Atopic-Dermatitis. Acta Derm Venereol 1980:44-7.
11. Suarez-Farinas M, Dhingra N, Gittler J, Shemer A, Cardinale I, de Guzman Strong C, et al. Intrinsic atopic dermatitis shows
similar TH2 and higher TH17 immune activation compared with extrinsic atopic dermatitis. J Allergy Clin Immunol 2013;
132:361-70.
12. Noda S, Suarez-Farinas M, Ungar B, Kim SJ, de Guzman Strong C, Xu H, et al. The Asian atopic dermatitis phenotype
combines features of atopic dermatitis and psoriasis with increased TH17 polarization. J Allergy Clin Immunol 2015;
136:1254-64.
13. Lotvall J, Akdis CA, Bacharier LB, Bjermer L, Casale TB, Custovic A, et al. Asthma endotypes: a new approach to classifi-
cation of disease entities within the asthma syndrome. J Allergy Clin Immunol 2011; 127:355-60.

Chapter 8
108
Moving towards endotypes in atopic dermatitis: identification of patient clusters based on serum biomarker analysis
8
14. Muraro A, Lemanske RF, Jr., Hellings PW, Akdis CA, Bieber T, Casale TB, et al. Precision medicine in patients with allergic
diseases: Airway diseases and atopic dermatitis-PRACTALL document of the European Academy of Allergy and Clinical
Immunology and the American Academy of Allergy, Asthma & Immunology. J Allergy Clin Immunol 2016; 137:1347-58.
15. A Study to Assess the Efficacy and Safety of Dupilumab in Patients With Severe Atopic Dermatitis (AD) That Are Not
Controlled With Oral Cyclosporine A (CSA) or for Those Who Cannot Take Oral CSA Because it is Not Medically Advisable.]
Available from https://www.clinicaltrials.gov/ct2/show/NCT02755649.
16. A Study of Lebrikizumab in Patients With Persistent Moderate to Severe Atopic Dermatitis.] Available from https://www.
clinicaltrials.gov/ct2/show/NCT02340234.
17. Phase 2 Study to Evaluate the Efficacy and Safety of Tralokinumab in Adults With Atopic Dermatitis (D2213C00001).]
Available from https://www.clinicaltrials.gov/ct2/show/NCT02347176.
18. Fahy JV. Type 2 inflammation in asthma--present in most, absent in many. Nat Rev Immunol 2015; 15:57-65.
19. Wilson SR, The L, Batia LM, Beattie K, Katibah GE, McClain SP, et al. The epithelial cell-derived atopic dermatitis cytokine
TSLP activates neurons to induce itch. Cell 2013; 155:285-95.
20. Wu W, Bleecker E, Moore W, Busse WW, Castro M, Chung KF, et al. Unsupervised phenotyping of Severe Asthma Re-
search Program participants using expanded lung data. J Allergy Clin Immunol 2014; 133:1280-8.
21. Hinks TS, Brown T, Lau LC, Rupani H, Barber C, Elliott S, et al. Multidimensional endotyping in patients with severe asthma
reveals inflammatory heterogeneity in matrix metalloproteinases and chitinase 3-like protein 1. J Allergy Clin Immunol
2016; 138:61-75.
22. Tomassen P, Vandeplas G, Van Zele T, Cardell LO, Arebro J, Olze H, et al. Inflammatory endotypes of chronic rhinosinusitis
based on cluster analysis of biomarkers. J Allergy Clin Immunol 2016; 137:1449-56 e4.
23. Corren J, Lemanske RF, Hanania NA, Korenblat PE, Parsey MV, Arron JR, et al. Lebrikizumab treatment in adults with
asthma. N Engl J Med 2011; 365:1088-98.
24. Brightling CE, Chanez P, Leigh R, O’Byrne PM, Korn S, She D, et al. Efficacy and safety of tralokinumab in patients with
severe uncontrolled asthma: a randomised, double-blind, placebo-controlled, phase 2b trial. Lancet Respir Med 2015;
3:692-701.
25. Castro M, Wenzel SE, Bleecker ER, Pizzichini E, Kuna P, Busse WW, et al. Benralizumab, an anti-interleukin 5 receptor
alpha monoclonal antibody, versus placebo for uncontrolled eosinophilic asthma: a phase 2b randomised dose-ranging
study. Lancet Respir Med 2014; 2:879-90.
26. Jameson JL, Longo DL. Precision medicine--personalized, problematic, and promising. N Engl J Med 2015; 372:2229-
34.
27. Ewald DA, Malajian D, Krueger JG, Workman CT, Wang T, Tian S, et al. Meta-analysis derived atopic dermatitis (MADAD)
transcriptome defines a robust AD signature highlighting the involvement of atherosclerosis and lipid metabolism pathways.
BMC Med Genomics 2015; 8:60.

Moving towards endotypes in atopic dermatitis: identification of patient clusters based on serum biomarker analysis
109
8
28. Silverberg JI. Association between adult atopic dermatitis, cardiovascular disease, and increased heart attacks in three
population-based studies. Allergy 2015; 70:1300-8.
29. Rose S, Sheth NH, Baker JF, Ogdie A, Raper A, Saboury B, et al. A comparison of vascular inflammation in psoriasis,
rheumatoid arthritis, and healthy subjects by FDG-PET/CT: a pilot study. Am J Cardiovasc Dis 2013; 3:273-8.

9

Predicting therapy response to Mycophenolic acid using UGT1A9 genotyping:
Towards personalized medicine in atopic dermatitis
Judith L. Thijs1, Berthe A.M. van der Geest1, Jorien van der Schaft1, Marcel P. van den Broek2, Wouter O.
van Seggelen1, Carla A.F.M. Bruijnzeel-Koomen1, DirkJan Hijnen1, Ron H. van Schaik3,4, Marjolein S. de
Bruin-Weller1
1. Department of Dermatology and Allergology, University Medical Center Utrecht, the Netherlands
2. Department of Clinical Pharmacy, University Medical Center Utrecht, the Netherlands
3. Department of Clinical Chemistry and Haematology, University Medical Center Utrecht, the Netherlands
4. Department of Clinical Chemistry, Erasmus University Medical Center Rotterdam, the Netherlands
Journal of Dermatological Treatment 2016 Sep 13:1-4.
Chapter 9
112
9
ABSTRACT
Atopic dermatitis (AD) is a very common chronic inflammatory skin disease requiring long-term treatment.
Mycophenolic acid (MPA) is used off-label in treatment of patients with severe AD failing cyclosporin A treat-
ment, however clinical efficacy is observed in only half of the AD patients. In blood, MPA levels are known
to have a large inter individual variability. Low MPA exposure and increased enzyme activity correlates with
the presence of UGT1A9 polymorphisms. In this retrospective study, 65 adult AD patients treated with MPA
were classified as responder or non-responder to MPA treatment. UGT1A9 polymorphisms were determined
using PCR. A significantly higher number of UGT1A9 polymorphisms was found in the group that did not
respond to MPA treatment. Of the patients that carried a UGT1A9 polymorphism, 85.7% was non-responder
to MPA treatment. This implies that non-responsiveness in AD patients is more likely to occur in carriers of
a UGT1A9 polymorphism. In a binary logistic regression analysis the odds ratio was 8.65 (95% confidence
interval: 0.93 – 80.17). Our results show that UGT1A9 polymorphisms can be used to identify patients with
non-responsiveness to MPA. Patients with UGT1A9 polymorphisms might benefit from higher MPA dosage.
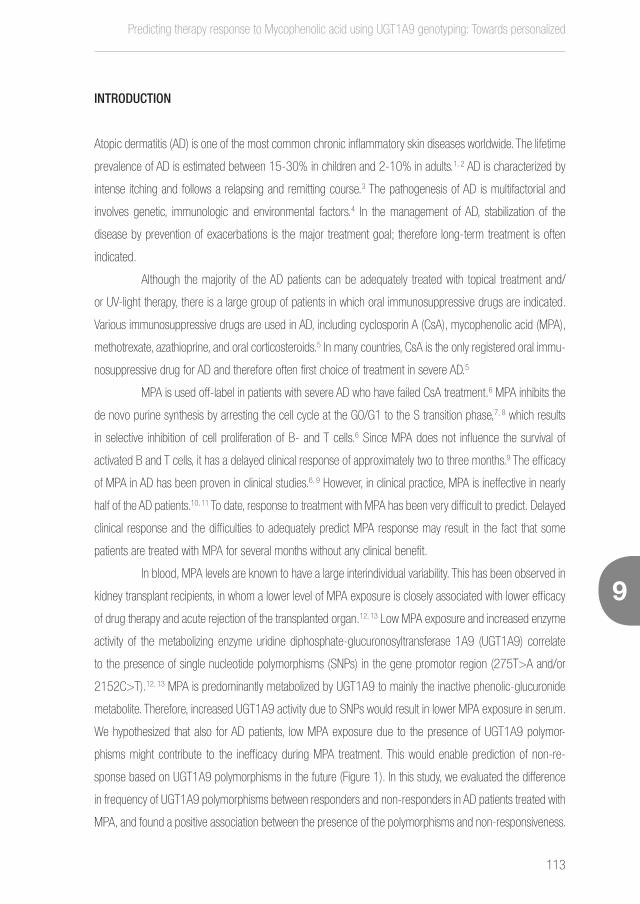
Predicting therapy response to Mycophenolic acid using UGT1A9 genotyping: Towards personalized
113
9
10
INTRODUCTION
Atopic dermatitis (AD) is one of the most common chronic inflammatory skin diseases worldwide. The lifetime
prevalence of AD is estimated between 15-30% in children and 2-10% in adults.1, 2 AD is characterized by
intense itching and follows a relapsing and remitting course.3 The pathogenesis of AD is multifactorial and
involves genetic, immunologic and environmental factors.4 In the management of AD, stabilization of the
disease by prevention of exacerbations is the major treatment goal; therefore long-term treatment is often
indicated.
Although the majority of the AD patients can be adequately treated with topical treatment and/
or UV-light therapy, there is a large group of patients in which oral immunosuppressive drugs are indicated.
Various immunosuppressive drugs are used in AD, including cyclosporin A (CsA), mycophenolic acid (MPA),
methotrexate, azathioprine, and oral corticosteroids.5 In many countries, CsA is the only registered oral immu-
nosuppressive drug for AD and therefore often first choice of treatment in severe AD.5
MPA is used off-label in patients with severe AD who have failed CsA treatment.6 MPA inhibits the
de novo purine synthesis by arresting the cell cycle at the G0/G1 to the S transition phase,7, 8 which results
in selective inhibition of cell proliferation of B- and T cells.6 Since MPA does not influence the survival of
activated B and T cells, it has a delayed clinical response of approximately two to three months.9 The efficacy
of MPA in AD has been proven in clinical studies.6, 9 However, in clinical practice, MPA is ineffective in nearly
half of the AD patients.10, 11 To date, response to treatment with MPA has been very difficult to predict. Delayed
clinical response and the difficulties to adequately predict MPA response may result in the fact that some
patients are treated with MPA for several months without any clinical benefit.
In blood, MPA levels are known to have a large interindividual variability. This has been observed in
kidney transplant recipients, in whom a lower level of MPA exposure is closely associated with lower efficacy
of drug therapy and acute rejection of the transplanted organ.12, 13 Low MPA exposure and increased enzyme
activity of the metabolizing enzyme uridine diphosphate-glucuronosyltransferase 1A9 (UGT1A9) correlate
to the presence of single nucleotide polymorphisms (SNPs) in the gene promotor region (275T>A and/or
2152C>T).12, 13 MPA is predominantly metabolized by UGT1A9 to mainly the inactive phenolic-glucuronide
metabolite. Therefore, increased UGT1A9 activity due to SNPs would result in lower MPA exposure in serum.
We hypothesized that also for AD patients, low MPA exposure due to the presence of UGT1A9 polymor-
phisms might contribute to the inefficacy during MPA treatment. This would enable prediction of non-re-
sponse based on UGT1A9 polymorphisms in the future (Figure 1). In this study, we evaluated the difference
in frequency of UGT1A9 polymorphisms between responders and non-responders in AD patients treated with
MPA, and found a positive association between the presence of the polymorphisms and non-responsiveness.

Chapter 9
114
9
Figure 1. Pharmacogenomics in AD patients treated with MPA.
Low MPA exposure and increased enzyme activity correlate to the presence of UGT1A9 polymorphisms. It is likely that these UGT1A9 polymorphisms occur in AD patients treated with MPA. We hypothesized that low MPA exposure due to the presence of UGT1A9 polymorphisms might contribute to the inefficacy during MPA treatment. This would enable prediction of non-response based on UGT1A9 polymorphisms in the future.
MATERIALS & METHODS
Study population
In a retrospective cohort study, 65 patients with severe AD treated with MPA 1440mg/day at the University
Medical Center Utrecht between January 1st 2004 and January 31st 2016 were included. Data were collect-
ed on March 15th 2016. Patients were diagnosed with AD according to the criteria of Hanifin and Rajka.14
The response to MPA treatment was assessed based on a 6-point Investigators’ Global Assessment (IGA).15
Patients were classified as responders in case the IGA decreased at least two points after minimal three
months of treatment, and as non-responder in case the decrease in IGA was less than two points.
The study was approved by the Institutional Review Board of the University Medical Center Utrecht, adhering
to the Declaration of Helsinki Principles.
Genotyping
The MagNA Pure LC system (Roche Diagnostics, Mannheim, Germany) was used to isolate genomic DNA
was isolated from 1 ml EDTA serum. UGT1A9 genotyping was performed using Taqman allelic discrimination
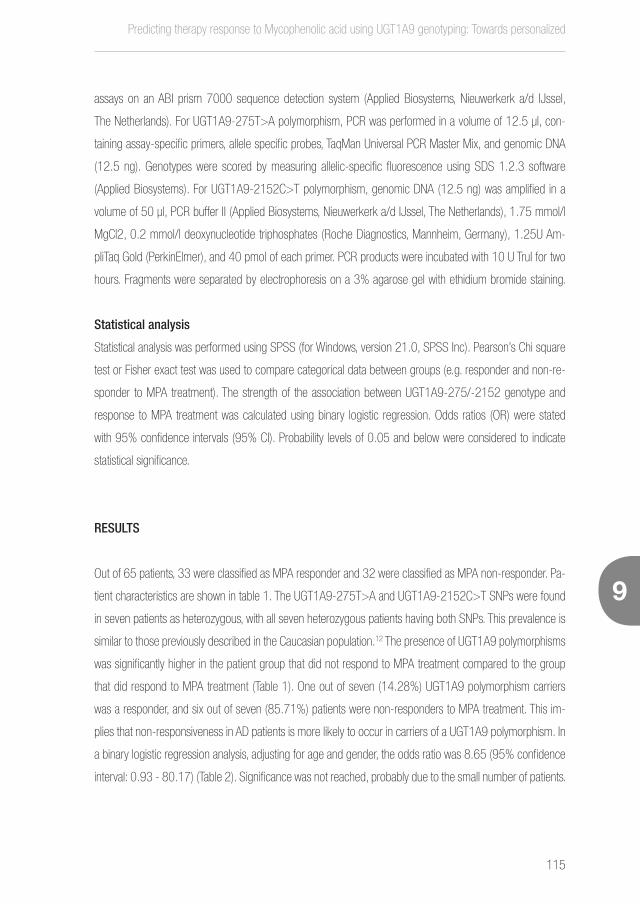
Predicting therapy response to Mycophenolic acid using UGT1A9 genotyping: Towards personalized
115
9
10
assays on an ABI prism 7000 sequence detection system (Applied Biosystems, Nieuwerkerk a/d IJssel,
The Netherlands). For UGT1A9-275T>A polymorphism, PCR was performed in a volume of 12.5 μl, con-
taining assay-specific primers, allele specific probes, TaqMan Universal PCR Master Mix, and genomic DNA
(12.5 ng). Genotypes were scored by measuring allelic-specific fluorescence using SDS 1.2.3 software
(Applied Biosystems). For UGT1A9-2152C>T polymorphism, genomic DNA (12.5 ng) was amplified in a
volume of 50 μl, PCR buffer II (Applied Biosystems, Nieuwerkerk a/d IJssel, The Netherlands), 1.75 mmol/l
MgCl2, 0.2 mmol/l deoxynucleotide triphosphates (Roche Diagnostics, Mannheim, Germany), 1.25U Am-
pliTaq Gold (PerkinElmer), and 40 pmol of each primer. PCR products were incubated with 10 U TruI for two
hours. Fragments were separated by electrophoresis on a 3% agarose gel with ethidium bromide staining.
Statistical analysis
Statistical analysis was performed using SPSS (for Windows, version 21.0, SPSS Inc). Pearson’s Chi square
test or Fisher exact test was used to compare categorical data between groups (e.g. responder and non-re-
sponder to MPA treatment). The strength of the association between UGT1A9-275/-2152 genotype and
response to MPA treatment was calculated using binary logistic regression. Odds ratios (OR) were stated
with 95% confidence intervals (95% CI). Probability levels of 0.05 and below were considered to indicate
statistical significance.
RESULTS
Out of 65 patients, 33 were classified as MPA responder and 32 were classified as MPA non-responder. Pa-
tient characteristics are shown in table 1. The UGT1A9-275T>A and UGT1A9-2152C>T SNPs were found
in seven patients as heterozygous, with all seven heterozygous patients having both SNPs. This prevalence is
similar to those previously described in the Caucasian population.12 The presence of UGT1A9 polymorphisms
was significantly higher in the patient group that did not respond to MPA treatment compared to the group
that did respond to MPA treatment (Table 1). One out of seven (14.28%) UGT1A9 polymorphism carriers
was a responder, and six out of seven (85.71%) patients were non-responders to MPA treatment. This im-
plies that non-responsiveness in AD patients is more likely to occur in carriers of a UGT1A9 polymorphism. In
a binary logistic regression analysis, adjusting for age and gender, the odds ratio was 8.65 (95% confidence
interval: 0.93 - 80.17) (Table 2). Significance was not reached, probably due to the small number of patients.
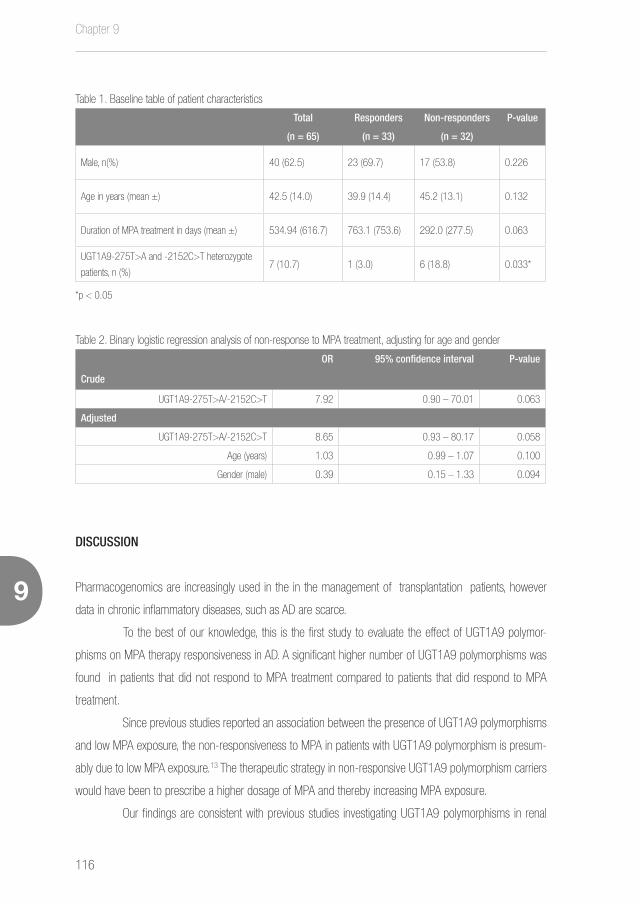
Chapter 9
116
9
Table 1. Baseline table of patient characteristics
Total
(n = 65)
Responders
(n = 33)
Non-responders
(n = 32)
P-value
Male, n(%) 40 (62.5) 23 (69.7) 17 (53.8) 0.226
Age in years (mean ±) 42.5 (14.0) 39.9 (14.4) 45.2 (13.1) 0.132
Duration of MPA treatment in days (mean ±) 534.94 (616.7) 763.1 (753.6) 292.0 (277.5) 0.063
UGT1A9-275T>A and -2152C>T heterozygote
patients, n (%)7 (10.7) 1 (3.0) 6 (18.8) 0.033*
*p < 0.05
Table 2. Binary logistic regression analysis of non-response to MPA treatment, adjusting for age and gender
OR 95% confidence interval P-value
Crude
UGT1A9-275T>A/-2152C>T 7.92 0.90 – 70.01 0.063
Adjusted
UGT1A9-275T>A/-2152C>T 8.65 0.93 – 80.17 0.058
Age (years) 1.03 0.99 – 1.07 0.100
Gender (male) 0.39 0.15 – 1.33 0.094
DISCUSSION
Pharmacogenomics are increasingly used in the in the management of transplantation patients, however
data in chronic inflammatory diseases, such as AD are scarce.
To the best of our knowledge, this is the first study to evaluate the effect of UGT1A9 polymor-
phisms on MPA therapy responsiveness in AD. A significant higher number of UGT1A9 polymorphisms was
found in patients that did not respond to MPA treatment compared to patients that did respond to MPA
treatment.
Since previous studies reported an association between the presence of UGT1A9 polymorphisms
and low MPA exposure, the non-responsiveness to MPA in patients with UGT1A9 polymorphism is presum-
ably due to low MPA exposure.13 The therapeutic strategy in non-responsive UGT1A9 polymorphism carriers
would have been to prescribe a higher dosage of MPA and thereby increasing MPA exposure.
Our findings are consistent with previous studies investigating UGT1A9 polymorphisms in renal
Predicting therapy response to Mycophenolic acid using UGT1A9 genotyping: Towards personalized
117
9
10
transplant patients, showing a statistically significantly higher rate of acute rejection of the graft in UGT1A9
heterozygous renal transplant recipients.13, 16
Remarkably, one out of seven patients with UGT1A9 polymorphisms, did respond adequately to
MPA treatment. A possible explanation is that this patient has an extra genetic polymorphism in UGT1A9,
resulting in an overall decrease of UGT1A9 activity, which would increase MPA exposure in contrary to ex-
pectations based on the -275 SNP, as this is described before in other studies.17, 18
Treatment options in patients with severe AD are very limited at this moment. CsA is often the drug
of first choice in these patients, however nearly half of the patients have to discontinue treatment due to side
effects and/or inefficacy.19 MPA is an interesting second choice treatment option in severe AD patients, as the
side effect profile seems to be better than most other oral immunosuppressive drugs used in AD.11, 20 How-
ever, previous studies have shown that around half of the AD patients do not respond to MPA.10, 11 Prediction
of treatment response to MPA in AD is very valuable, since treatment response can only be determined after
three to four months of treatment.
In conclusion, this study found an association between UGT1A9 polymorphisms and non-respon-
siveness to MPA treatment in severe AD patients. In the non-responder group, six out of 32 patients carried
a UGT1A9 polymorphism. This means that pre-treatment screening for UGT1A9 polymorphisms could have
identified 19% of the patients with non-responsiveness to MPA treatment. Although this is a relatively small
percentage, it does show the potential benefits of pharmacogenetic screening for UGT1A9 in AD. Future
research is needed to identify other SNPs and further optimize MPA treatment to ensure maximal efficacy with
minimal side effects. Although pharmacogenomics are scarcely used in dermatological research, it enables
“personalized medicine” by prescribing drugs based on the genetic makeup of an individual.

Chapter 9
118
9
REFERENCES
1. Bieber T. Atopic dermatitis. Ann Dermatol 2010; 22:125-37.
2. Asher MI, Montefort S, Bjorksten B, Lai CK, Strachan DP, Weiland SK, et al. Worldwide time trends in the prevalence of symptoms
of asthma, allergic rhinoconjunctivitis, and eczema in childhood: ISAAC Phases One and Three repeat multicountry cross-sectional
surveys. Lancet 2006; 368:733-43.
3. Garmhausen D, Hagemann T, Bieber T, Dimitriou I, Fimmers R, Diepgen T, et al. Characterization of different courses of atopic
dermatitis in adolescent and adult patients. Allergy 2013; 68:498-506.
4. Eyerich K, Novak N. Immunology of atopic eczema: overcoming the Th1/Th2 paradigm. Allergy 2013; 68:974-82.
5. Ring J, Alomar A, Bieber T, Deleuran M, Fink-Wagner A, Gelmetti C, et al. Guidelines for treatment of atopic eczema (atopic
dermatitis) Part II. J Eur Acad Dermatol Venereol 2012; 26:1176-93.
6. Sidbury R, Davis DM, Cohen DE, Cordoro KM, Berger TG, Bergman JN, et al. Guidelines of care for the management of atopic
dermatitis: section 3. Management and treatment with phototherapy and systemic agents. J Am Acad Dermatol 2014; 71:327-
49.
7. Cohn RG, Mirkovich A, Dunlap B, Burton P, Chiu SH, Eugui E, et al. Mycophenolic acid increases apoptosis, lysosomes and lipid
droplets in human lymphoid and monocytic cell lines. Transplantation 1999; 68:411-8.
8. Laliberte J, Yee A, Xiong Y, Mitchell BS. Effects of guanine nucleotide depletion on cell cycle progression in human T lymphocytes.
Blood 1998; 91:2896-904.
9. Haeck IM, Knol MJ, Ten Berge O, van Velsen SG, de Bruin-Weller MS, Bruijnzeel-Koomen CA. Enteric-coated mycophenolate
sodium versus cyclosporin A as long-term treatment in adult patients with severe atopic dermatitis: a randomized controlled trial.
J Am Acad Dermatol 2011; 64:1074-84.
10. Garritsen FM, Roekevisch E, van der Schaft J, Deinum J, Spuls PI, de Bruin-Weller MS. Ten years experience with oral immu-
nosuppressive treatment in adult patients with atopic dermatitis in two academic centres. J Eur Acad Dermatol Venereol 2015;
29:1905-12.
11. van der Schaft J, Politiek K, van den Reek JM, Kievit W, de Jong EM, Bruijnzeel-Koomen CA, et al. Drug survival for azathioprine
and enteric-coated mycophenolate sodium in a long-term daily practice cohort of adult patients with atopic dermatitis. Br J
Dermatol 2016.
12. Kuypers DR, Naesens M, Vermeire S, Vanrenterghem Y. The impact of uridine diphosphate-glucuronosyltransferase 1A9 (UG-
T1A9) gene promoter region single-nucleotide polymorphisms T-275A and C-2152T on early mycophenolic acid dose-interval
exposure in de novo renal allograft recipients. Clin Pharmacol Ther 2005; 78:351-61.
13. van Schaik RH, van Agteren M, de Fijter JW, Hartmann A, Schmidt J, Budde K, et al. UGT1A9 -275T>A/-2152C>T polymor-
phisms correlate with low MPA exposure and acute rejection in MMF/tacrolimus-treated kidney transplant patients. Clin Pharmacol
Ther 2009; 86:319-27.

Predicting therapy response to Mycophenolic acid using UGT1A9 genotyping: Towards personalized
119
9
10
14. Hanifin JM, Rajka G. Diagnostic Features of Atopic-Dermatitis. Acta Derm Venereol 1980:44-7.
15. Eichenfield LF, Lucky AW, Boguniewicz M, Langley RG, Cherill R, Marshall K, et al. Safety and efficacy of pimecrolimus (ASM
981) cream 1% in the treatment of mild and moderate atopic dermatitis in children and adolescents. J Am Acad Dermatol 2002;
46:495-504.
16. Kuypers DR, de Jonge H, Naesens M, de Loor H, Halewijck E, Dekens M, et al. Current target ranges of mycophenolic acid
exposure and drug-related adverse events: a 5-year, open-label, prospective, clinical follow-up study in renal allograft recipients.
Clin Ther 2008; 30:673-83.
17. Levesque E, Delage R, Benoit-Biancamano MO, Caron P, Bernard O, Couture F, et al. The impact of UGT1A8, UGT1A9, and
UGT2B7 genetic polymorphisms on the pharmacokinetic profile of mycophenolic acid after a single oral dose in healthy volun-
teers. Clin Pharmacol Ther 2007; 81:392-400.
18. Fukuda T, Goebel J, Cox S, Maseck D, Zhang K, Sherbotie JR, et al. UGT1A9, UGT2B7, and MRP2 genotypes can predict
mycophenolic acid pharmacokinetic variability in pediatric kidney transplant recipients. Ther Drug Monit 2012; 34:671-9.
19. van der Schaft J, Politiek K, van den Reek JM, Christoffers WA, Kievit W, de Jong EM, et al. Drug survival for ciclosporin A in a
long-term daily practice cohort of adult patients with atopic dermatitis. Br J Dermatol 2015; 172:1621-7.
20. Politiek K, van der Schaft J, Coenraads PJ, de Bruin-Weller MS, Schuttelaar ML. Drug survival for methotrexate in a daily practice
cohort of adult patients with severe atopic dermatitis. Br J Dermatol 2016; 174:201-3.


IIIPART
IMPROVING PRACTICAL
ASPECTS OF BIOMARKER
MEASUREMENT

10

New developments in biomarkers for atopic dermatitis
Judith L. Thijs, Wouter O. van Seggelen, Carla A.F.M. Bruijnzeel-Koomen, Marjolein S. de Bruin-Weller and
DirkJan Hijnen
Department of Dermatology and Allergology, University Medical Center Utrecht, the Netherlands
Journal of Clinical Medicine 2015 Mar 16;4(3):479-87.

Chapter 10
124
10
ABSTRACT
The application of biomarkers in medicine is evolving. Biomarkers do not only give us a better understanding
of pathogenesis, but also increase treatment efficacy and safety, further enabling more precise clinical care.
This paper focuses on the current use of biomarkers in atopic dermatitis, new developments and future
perspectives. Biomarkers can be used for many different purposes, including the objective determination of
disease severity, confirmation of clinical diagnosis, and to predict response to treatment. In atopic dermatitis,
many biomarkers have been investigated as a marker for disease severity. Currently serum thymus and
activation-regulated chemokine (TARC) is the superior biomarker for assessing disease severity. However,
we have recently shown that the use of a panel of serum biomarkers is more suitable for assessing disease
severity than an individual biomarker. In this overview, we will discuss alternative sources for biomarkers, such
as saliva and capillary blood, which can increase the user friendliness of biomarkers in atopic dermatitis.
Both methods offer simple, non-invasive and cost effective alternatives to venous blood. This provides great
translational and clinical potential. Biomarkers will play an increasingly important role in AD research and
personalized medicine. The use of biomarkers will enhance the efficacy of AD treatment by facilitating the
individualization of therapy targeting the patients’ specific biological signature and also by providing tools for
predicting and monitoring of therapeutic response.
New developments in biomarkers for atopic dermatitis
125
10
INTRODUCTION
The World Health Organization has defined a biomarker as “any substance, structure, or process
that can be measured in the body or its products and influence or predict the incidence of outcome or dis-
ease”.1 Biomarkers have been used in clinical practice for many years. For example, prostate-specific antigen
(PSA) is a commonly used biomarker and is used for the follow-up in prostate cancer, as well as serum cre-
atinine levels for diagnosing renal insufficiency.2, 3 Additionally, in the past decade rapid advances in genomic
and proteomic technologies have generated a plethora of candidate biomarkers ranging from antibodies,
microbes, DNA, RNA, lipids, metabolites to proteins.4
The application of biomarkers in medicine is evolving. Biomarkers do not only give us a better
understanding of pathogenesis, but also increase treatment efficacy and safety further enabling more precise
clinical care.
Biomarkers can be categorized in different types depending on their specific characteristics. They
can be used to identify the risk of developing a disease (screening biomarkers), to identify a disease (diagnostic
biomarker), predict disease progression (prognostic biomarker), mark a particular pharmacological response
(pharmacodynamic biomarkers), and for monitoring disease activity and clinical response to an intervention
or as a surrogate endpoint in clinical trials (severity biomarker).5 Moreover, biomarker based stratification may
identify clinically relevant subgroups and help to provide effective targeted therapies (predictive biomarker).6
This paper focuses on the current use of biomarkers in atopic dermatitis (AD), new developments
and future perspectives.
BIOMARKERS IN ATOPIC DERMATITIS
Diagnostic biomarker
Atopic dermatitis remains a clinical diagnosis without an objective and reliable biomarker to confirm the
diagnosis. Classically AD has been divided into two subtypes, intrinsic versus extrinsic. Patients with an in-
trinsic form show normal total IgE levels, without specific IgE and have also been termed non-atopic or
non-allergic dermatitis. Comparatively, patients with an extrinsic form of AD show high total IgE levels and
are often sensitized to multiple allergens.7 Since total serum IgE levels are not increased in about 20% of
AD patients, total serum IgE cannot be used as a diagnostic biomarker for all AD patients.7 Moreover, total
serum IgE levels are also increased in patients with other atopic diseases such as allergic rhinoconjunctivitis
and allergic asthma.8 Using a genomic profiling approach, Suárez-Farinas et al., recently showed common
Chapter 10
126
10
disease-defining features in patients with intrinsic and extrinsic AD.9 Interestingly, they found similar Th2 type
immune activation in intrinsic and extrinsic AD patients, suggesting that Th2 is not the only cause of high IgE
levels in patients with extrinsic AD.
Severity Biomarker
Patients with severe disease tend to have higher IgE levels, but there are also patients with severe eczema
that do not show increased IgE levels. Total serum IgE levels are therefore not a reliable biomarker for disease
severity.10 Other frequently reported serum biomarkers for disease severity in AD include eosinophilic cationic
protein (ECP),11 sIL-2R,12 and thymus and activation-regulated chemokine (TARC/CCL17).13 In a systemic
review on serum biomarkers for disease severity in AD we found that serum TARC levels showed the best
correlation to disease severity, with weighted mean r-values of 0.51 and 0.63 in longitudinal and cross-sec-
tional studies, respectively.14 However, we have shown that patients with severe AD can have serum TARC
levels in the normal range, and on the other hand patients with mild to moderate disease may express high
TARC levels.15 This might be explained by the large number of biological pathways involved in the pathogen-
esis of AD and the clinical heterogeneity.
Thus, we hypothesized that a combination of biomarkers can overcome these problems, by pro-
viding more information on different biological pathways and would be applicable to different phenotypical
subtypes and thereby correlate better to disease severity. We recently demonstrated that indeed a multivar-
iate signature including four serum biomarkers showed a correlation coefficient of 0.86 to disease severity
measured by the six area, six sign atopic dermatitis severity score (SASSAD).16 Although this was only a pilot
study in 17 patients, it showed that using a panel of biomarkers may be necessary in a multifactorial, complex
disease such as AD.17
Currently, there is no gold standard for measurement of disease severity in AD and more than 20
different composite indices have been described.18 The Harmonizing Outcome Measurements in Eczema
(HOME) initiative is working on a core set of outcome measures but currently there is no consensus (www.
homeforeczema.org). The ultimate goal from the perspective of evidence-based medicine is to achieve
worldwide consensus to consistently apply a single valid, reliable, and feasible instrument to measure disease
severity for AD. We suggest that the use of a panel of biomarkers can add important information or even
substitute clinical endpoints, and can be used in daily practice to track changes in disease activity and adapt
treatment accordingly. Moreover, the use of biomarkers as a surrogate endpoint in clinical trials will improve
comparisons across trials and facilitate meta analyses. With the recent introduction of the first biological for
AD19 further studies are needed to explore the use of a panel of biomarkers as a disease severity measure
and possibly treatment predictive tool.
New developments in biomarkers for atopic dermatitis
127
10
Predictive Biomarker
The introduction of novel agents and “targeted” therapies also drives the need for predictive bio-
markers. Because of disease heterogeneity, stratification of subgroups is essential in the de-
velopment of such a predictive tool. Biomarkers can be used to identify subgroups of patients
with shared “biological” characteristics, which are more likely to respond favorably to a given
therapy. Using stratification, targeted therapies can be assigned to different subgroups, making personalized
medicine possible.
ALTERNATIVE WAYS TO MEASURE BIOMARKERS
Blood is the most commonly used body fluid for biomarker measurements.20 However, collection of blood is
invasive and less suitable for use in the field because of the need for trained personnel. It is also less favored
in pediatric medicine, especially since atopic dermatitis usually presents in childhood. The same is true for
gene expression profiles determined in skin biopsies. Studies have identified specific molecular signatures
for AD patients,21 and changing expression profiles during therapy.19, 22 Although tissue biomarker expression
patterns may also be extremely helpful in stratification and the identification of new pathways involved in the
pathogenesis of AD, they require trained personnel and specialized labs.
We therefore explored alternatives for use in daily practice and longitudinal studies. Specifically
dried blood spots (DBS) and saliva as potential alternatives. DBS have been used for decades in screening
for inherited metabolic diseases in newborns 23 and can be obtained using a simple, minimally invasive, nearly
painless procedure that can be done by the patients themselves. Secondly, saliva is a mirror of the body’s
health as a wide spectrum of biomolecules is transported from the blood capillaries through the epithelium
of salivary glands.24 Salivary cortisol levels are for instance routinely used as a biomarker of psychological
stress. We have preliminary data showing that several inflammatory biomarkers can be measured in saliva
samples from AD patients. DBS and saliva may be used as an accurate non-invasive alternative to serum
measurements; both methods will subsequently be discussed.
Dried blood spots (DBS)
DBS are samples from drops of capillary whole blood collected from a finger stick and dried on filter paper.25
Filter paper was first used as a scientific tool in 1815 by the Swedish chemist Jöns Berzelius. Robert Guthrie
is widely credited as being the first to use blood dried on filter paper (so-called Guthrie cards) to diagnose
phenylketonuria in neonates in 1963.26 Since that time, filter paper has become a commonly used method

Chapter 10
128
10
of storing and transporting diverse specimens. Different aspects of the use of DBSs have been reviewed;
DBS used for newborn screening assays, for epidemiological studies, human immunodeficiency virus (HIV)
detection and monitoring, virology and drug assays.27, 28
Collection of a DBS is a relatively simple and minimally invasive, nearly painless procedure. The
participant’s finger is first wiped with alcohol. A sterile lancet is then used to puncture the skin. The first drop
of blood is dabbed, the subsequent four drops of blood are applied to filter paper. The paper is left to dry for
a few hours and then stored at room temperature or refrigerated before shipment to the laboratory.25, 26 Most
analytes remain stable for more than a week in filter paper when stored at room temperature.29
Sample processing is relatively easy and the requirements are minimal. To extract the analytes
from DBS, small discs are punched from the filter paper and eluted with a buffer. Current immunological es-
say technologies, like multiplex bead-based immunoassay and mass spectrometry, require only small volumes,
which provides the ability to measure multiple proteins and peptides from a single DBS sample.26 Chambers
et al. demonstrated that a panel of 40 proteins could be quantitatively extracted from DBS using highly-mul-
tiplexed mass spectrometry.30
The ease of sample collection, minimal training requirements, and self-applicability by the patient
at home are great advantages of DBS sampling. The minimal volume requirements, the stability of analytes
for months to years and the ease of sample processing offers practical and financial advantages, making DBS
also very suitable for storage in biobanks.31 Additionally, the low burden and minimally invasive procedure
is better suited for pediatric studies and also allows collection of multiple samples over time in longitudinal
study designs.31
Saliva
In humans, three major glands produce saliva: the parotid, submandibular and sublingual gland. Together
they produce over 90% of the total amount of saliva. Saliva is also produced by hundreds of small salivary
glands, spread throughout the oral cavity.32 Epithelial cells generate saliva and it is secreted via salivary ducts
into the oral cavity.
Salivary glands are highly permeable and are surrounded by capillaries. These characteristics
enable free exchange of molecules from blood to the acinus and therefore it is thought that biomarkers,
circulating in blood, can diffuse from blood to the acinar cells and eventually secreted in saliva 33. This makes
saliva an interesting source for the measurement of biomarkers using epigenetic, transcriptomic, proteomic
and metabolomic approaches34 Over the last decade, numerous studies have investigated biomarkers in sali-
va related to specific diseases. This includes studies on Sjögren’s syndrome, rheumatic-, cardiovascular-, and
periodontal diseases.33, 35-37 However, most of these studies need validation before clinical implementation.

New developments in biomarkers for atopic dermatitis
129
10
The main advantage of saliva over blood sampling is the non-invasive nature of collection, which
is particularly interesting for studies in children. Saliva sampling also facilitates and eases the collection of
multiple subsequent samples for disease monitoring and longitudinal study designs. Collection and handling
of saliva samples is relatively easy, does not require trained personnel and compared to blood, saliva samples
cannot clot. In addition, saliva is safer compared to blood regarding the risk of transmission of viruses, such
as HIV.33
Although saliva seems to be the ideal source for measuring biomarkers, there are many variables
regarding the collection and handling of samples.38 Moreover, the composition and protein concentrations in
saliva are influenced by many factors such as age, gender, hydration status, flow rate, time of sampling and
diet.39
In conclusion, saliva collection is simple and non-invasive and offers great opportunities. However,
sta dardization of the methods for collection and handling of saliva samples is required before introduction
in daily practice.

Chapter 10
130
10
CONCLUSIONS
In recent years, biomarkers have been a growing field of study in medicine. Technical advancements now
enable the measurement of many biomarkers in small volumes and have been illustrated to be extremely
useful in medicine. The application of biomarkers in AD offers great opportunities, both in daily clinical practice
as well as for research purposes.
Biomarkers offer reliable and objective outcome measures. Although serum TARC levels provide
an excellent adjunct to daily practice and clinical trials, there are limitations to the use of a single biomarker in
a complex disease such as AD. We are convinced that a panel of biomarkers will replace traditional outcome
measurements in the near future. This will result in clinical trials being more ‘comparable’, which will prove to
be essential with the introduction of biologicals in the treatment of AD.
The heterogeneous character of the disease and lack of clinical stratifiers makes AD highly suitable
for a biomarker based stratification. A panel of biomarkers can assess multiple molecular entities, and will
be more suitable for assessing disease severity in AD compared to an individual biomarker. Biomarker strat-
ification will identify subgroups of patients that will respond to treatment and enable tailoring of drugs to the
biological signature of individual patients, accelerating the translation of new medicine from bench to bedside
and can revolutionize AD therapy.
Alternative sources for biomarkers such as saliva and capillary blood can increase the user friendli-
ness of biomarkers in AD. Moreover, it will increase our understanding of the disease as they allow early sam-
pling, for example during an exacerbation. Both DBS and saliva offer simple, non-invasive and cost effective
alternatives to venipuncture.23, 40 The patients can complete collection procedures themselves and handling
procedures are relatively simple. This offers great translational and clinical potential, not only for adults but
also in pediatric populations. However, both methods need further validation.
In conclusion, biomarkers will play an increasingly important role in AD research and personalized
medicine. The use of biomarkers will enhance the efficacy of AD treatment by facilitating the individualization
of therapy targeting the patient’s specific biological signature and also by providing tools for predicting and
monitoring of therapeutic response.

New developments in biomarkers for atopic dermatitis
131
10
REFERENCES
1. WHO International Programme on Chemical Safety Biomarkers in Risk Assessment: Validity and Validation. http://www.
inchem.org/documents/ehc/ehc/ehc222.htm; 2001.].
2. Levey AS, Coresh J, Balk E, Kausz AT, Levin A, Steffes MW, et al. National Kidney Foundation practice guidelines for chronic
kidney disease: evaluation, classification, and stratification. Ann Intern Med 2003; 139:137-47.
3. Catalona WJ, Smith DS, Ratliff TL, Dodds KM, Coplen DE, Yuan JJ, et al. Measurement of prostate-specific antigen in
serum as a screening test for prostate cancer. N Engl J Med 1991; 324:1156-61.
4. Blumenberg M. Skinomics: past, present and future for diagnostic microarray studies in dermatology. Expert Rev Mol
Diagn 2013; 13:885-94.
5. Bieber T, Cork M, Reitamo S. Atopic dermatitis: a candidate for disease-modifying strategy. Allergy 2012; 67:969-75.
6. Frank R, Hargreaves R. Clinical biomarkers in drug discovery and development. Nat Rev Drug Discov 2003; 2:566-80.
7. Akdis CA, Akdis M. Immunological differences between intrinsic and extrinsic types of atopic dermatitis. Clin Exp Allergy
2003; 33:1618-21.
8. Levin AM, Mathias RA, Huang L, Roth LA, Daley D, Myers RA, et al. A meta-analysis of genome-wide association studies
for serum total IgE in diverse study populations. J Allergy Clin Immunol 2013; 131:1176-84.
9. Suarez-Farinas M, Dhingra N, Gittler J, Shemer A, Cardinale I, de Guzman Strong C, et al. Intrinsic atopic dermatitis shows
similar TH2 and higher TH17 immune activation compared with extrinsic atopic dermatitis. J Allergy Clin Immunol 2013;
132:361-70.
10. Eichenfield LF, Tom WL, Chamlin SL, Feldman SR, Hanifin JM, Simpson EL, et al. Guidelines of care for the management
of atopic dermatitis: section 1. Diagnosis and assessment of atopic dermatitis. J Am Acad Dermatol 2014; 70:338-51.
11. Czech W, Krutmann J, Schopf E, Kapp A. Serum eosinophil cationic protein (ECP) is a sensitive measure for disease activity
in atopic dermatitis. Br J Dermatol 1992; 126:351-5.
12. Kagi MK, Joller-Jemelka H, Wuthrich B. Correlation of eosinophils, eosinophil cationic protein and soluble interleukin-2
receptor with the clinical activity of atopic dermatitis. Dermatology 1992; 185:88-92.
13. Kakinuma T, Sugaya M, Nakamura K, Kaneko F, Wakugawa M, Matsushima K, et al. Thymus and activation-regulated
chemokine (TARC/CCL17) in mycosis fungoides: serum TARC levels reflect the disease activity of mycosis fungoides. J
Am Acad Dermatol 2003; 48:23-30.
14. Thijs J, Krastev T, Weidinger S, Buckens CF, de Bruin-Weller M, Bruijnzeel-Koomen C, et al. Biomarkers for atopic derma-
titis: a systematic review and meta-analysis. Curr Opin Allergy Clin Immunol 2015; 15:453-60.
15. Landheer J, de Bruin-Weller M, Boonacker C, Hijnen D, Bruijnzeel-Koomen C, Rockmann H. Utility of serum thymus and
activation-regulated chemokine as a biomarker for monitoring of atopic dermatitis severity. J Am Acad Dermatol 2014;
71:1160-6.

Chapter 10
132
10
16. Charman CR, Venn AJ, Williams HC. Reliability testing of the Six Area, Six Sign Atopic Dermatitis severity score. Br J
Dermatol 2002; 146:1057-60.
17. Thijs JL NS, Herath A, Bruijnzeel-Koomen CAFM, Giovanonne B, Knol E, de Bruin-Weller MS, Hijnen DJ. A panel of bio-
markers for disease severity in atopic dermatitis Clinical Experimental Allergy, accepted for publication.
18. Schmitt J, Langan S, Williams HC. What are the best outcome measurements for atopic eczema? A systematic review. J
Allergy Clin Immunol 2007; 120:1389-98.
19. Beck LA, Thaci D, Hamilton JD, Graham NM, Bieber T, Rocklin R, et al. Dupilumab treatment in adults with moderate-to-se-
vere atopic dermatitis. N Engl J Med 2014; 371:130-9.
20. Schulz BL, Cooper-White J, Punyadeera CK. Saliva proteome research: current status and future outlook. Crit Rev Biotech-
nol 2013; 33:246-59.
21. Quaranta M, Knapp B, Garzorz N, Mattii M, Pullabhatla V, Pennino D, et al. Intraindividual genome expression analysis
reveals a specific molecular signature of psoriasis and eczema. Sci Transl Med 2014; 6:244ra90.
22. Hamilton JD, Suarez-Farinas M, Dhingra N, Cardinale I, Li X, Kostic A, et al. Dupilumab improves the molecular signature
in skin of patients with moderate-to-severe atopic dermatitis. J Allergy Clin Immunol 2014; 134:1293-300.
23. Li W LM. Dried Blood Spots: Applications and Techniques: Wiley; 2014.
24. Topkas E, Keith P, Dimeski G, Cooper-White J, Punyadeera C. Evaluation of saliva collection devices for the analysis of
proteins. Clin Chim Acta 2012; 413:1066-70.
25. McDade TW. Development and validation of assay protocols for use with dried blood spot samples. Am J Hum Biol 2014;
26:1-9.
26. Lehmann S, Delaby C, Vialaret J, Ducos J, Hirtz C. Current and future use of “dried blood spot” analyses in clinical chemistry.
Clin Chem Lab Med 2013; 51:1897-909.
27. Smit PW, Elliott I, Peeling RW, Mabey D, Newton PN. An overview of the clinical use of filter paper in the diagnosis of tropical
diseases. Am J Trop Med Hyg 2014; 90:195-210.
28. McCann SJ, Gillingwater S, Keevil BG, Cooper DP, Morris MR. Measurement of total homocysteine in plasma and blood
spots using liquid chromatography-tandem mass spectrometry: comparison with the plasma Abbott IMx method. Ann Clin
Biochem 2003; 40:161-5.
29. Ostler MW, Porter JH, Buxton OM. Dried blood spot collection of health biomarkers to maximize participation in population
studies. J Vis Exp 2014:e50973.
30. Chambers AG, Percy AJ, Yang J, Camenzind AG, Borchers CH. Multiplexed quantitation of endogenous proteins in dried
blood spots by multiple reaction monitoring-mass spectrometry. Mol Cell Proteomics 2013; 12:781-91.
31. McDade TW, Williams S, Snodgrass JJ. What a drop can do: dried blood spots as a minimally invasive method for integrat-
ing biomarkers into population-based research. Demography 2007; 44:899-925.
32. Moore K DA, Agur A. . In: Clinically Oriented Anatomy: Lippincott Williams & Wilkins 2009.

New developments in biomarkers for atopic dermatitis
133
10
33. Yoshizawa JM, Schafer CA, Schafer JJ, Farrell JJ, Paster BJ, Wong DT. Salivary biomarkers: toward future clinical and
diagnostic utilities. Clin Microbiol Rev 2013; 26:781-91.
34. Bonne NJ, Wong DT. Salivary biomarker development using genomic, proteomic and metabolomic approaches. Genome
Med 2012; 4:82.
35. Tandon M, Gallo A, Jang SI, Illei GG, Alevizos I. Deep sequencing of short RNAs reveals novel microRNAs in minor salivary
glands of patients with Sjogren’s syndrome. Oral Dis 2012; 18:127-31.
36. Nagler RM, Salameh F, Reznick AZ, Livshits V, Nahir AM. Salivary gland involvement in rheumatoid arthritis and its relation-
ship to induced oxidative stress. Rheumatology (Oxford) 2003; 42:1234-41.
37. Mirzaii-Dizgah I, Agha-Hosseini F. Unstimulated whole saliva parathyroid hormone in postmenopausal women with xero-
stomia. J Contemp Dent Pract 2011; 12:196-9.
38. Williamson S, Munro C, Pickler R, Grap MJ, Elswick RK, Jr. Comparison of biomarkers in blood and saliva in healthy adults.
Nurs Res Pract 2012; 2012:246178.
39. Quintana M, Palicki O, Lucchi G, Ducoroy P, Chambon C, Salles C, et al. Inter-individual variability of protein patterns in saliva
of healthy adults. J Proteomics 2009; 72:822-30.
40. Liu J, Duan Y. Saliva: a potential media for disease diagnostics and monitoring. Oral Oncol 2012; 48:569-77.

Biomarkers detected in dried blood spots from atopic dermatitis patients strongly correlate with disease severity
11

Biomarkers detected in dried blood spots from atopic dermatitis patients strongly correlate with disease severity
135
11
11Biomarkers detected in dried blood spots from atopic dermatitis patients
strongly correlate with disease severity
Judith L. Thijs1,2, Renée Fiechter1, Barbara Giovannone1,2, Marjolein S. de Bruin-Weller1, Edward Knol1,2,
Carla A.F.M. Bruijnzeel-Koomen1, Julia Drylewicz3, Stefan Nierkens2,3*, DirkJan Hijnen1,2*
1. Department of Dermatology and Allergology, University Medical Center Utrecht, The Netherlands
2. Laboratory of Translational Immunology, University Medical Center Utrecht, The Netherlands
3. U-DAIR, University Medical Center Utrecht, The Netherlands
4. Bioinformatics core facility, Laboratory of Translational Immunology, Utrecht, The Netherlands
* These authors contributed equally to this work
Manuscript in preparation
Chapter 11
136
Biomarkers detected in dried blood spots from atopic dermatitis patients strongly correlate with disease severity
11
ABSTRACT
Background:
Serum biomarkers offer an objective outcome measure for disease severity in atopic dermatitis (AD). A
disadvantage of serum biomarkers is the need for a venipuncture. Dried blood spots (DBS) offer a convenient
alternative to venipuncture. DBS can be obtained using a minimally invasive finger prick performed by the
patients themselves. The aim of this study was to investigate if biomarkers determined in DBS offer a reliable
tool for the assessment of disease severity in AD.
Methods:
Sixty-five AD patients were treated with topical steroids and followed-up for 2 months. Additionally, 14
psoriasis patients and 26 non-atopic controls were included. Disease severity was assessed by EASI, POEM
and VAS pruritis. Biomarkers IL-18, IL-22, IL-31, TARC, PARC, MDC sIL-2R, sE-selectin, SDF-1α and I309
were measured in serum and DBS. Stability of TARC in DBS was studied during storage at room temperature,
-20 ̊C and after freeze/thawing.
Results:
Levels of I-309, TARC, PARC, and MDC in DBS were significantly higher in AD than in psoriasis and healthy
controls. TARC showed the strongest correlation with disease severity (r=0.68). Interestingly, levels of TARC
measured in DBS showed a stronger correlation with EASI than TARC levels measured in serum (r=0.58).
Linear mixed models showed that TARC, I-309, PARC, and MDC measured in DBS significantly decrease
during effective treatment. Storage at room temperature for 7 days, long-term storage at -80 ̊, and freeze/
thaw cycles did not influence TARC levels in DBS.
Discussion:
In this study we show that TARC level measured in DBS from AD patients highly correlate with disease severity
and significantly decrease during effective treatment with topical steroids.
Biomarkers detected in dried blood spots from atopic dermatitis patients strongly correlate with disease severity
137
11
INTRODUCTION
Atopic dermatitis (AD) is a chronic inflammatory skin disease, with a prevalence of 10-20% worldwide.1
AD is characterized by itch and a relapsing and remitting pattern, and greatly affects patients quality of
life. Assessment of disease severity in AD is essential for monitoring treatment effects and for comparison
of clinical trials investigating new compounds for AD treatment. Unfortunately, AD disease severity is as-
sessed by an array of time consuming clinical scoring measures that lack harmonization between trials and
centers . A systematic review of AD severity measurement tools found that 91% of AD clinical trials used
a severity measure, but less than a third of these scales had been previously published.2 In addition, the
validity and reliability of the 20 most commonly used severity measures for AD was assessed by Schmitt
et al., and found that only three of the measures performed adequately.3 To address these shortcomings
in AD severity reporting, experts in the field have established the Harmonizing Outcome Measurements in
Eczema (HOME) initiative, an attempt to ensure that investigators employ a core set of outcome measures
to enhance comparability between studies.4 We suggest that in addition to improvements in clinical outcome
reporting, an objective biomarker for disease severity would be of great value for clinical research in AD.
New potential biomarkers are generated by the discovery of novel cytokines and chemokines.
A large number of these serum biomarkers have been found to correlate with disease severity in AD. In
a meta-analysis on serum biomarkers for disease severity we found that serum TARC is the most reliable
biomarker currently available.5 Due to the complex pathogenesis of AD, a combination of several biomarkers
from different biological pathways may better correlate to disease severity than a single biomarker. Indeed,
we recently demonstrated that a multivariate signature consisting of TARC, IL-22, and sIL-2R shows a strong
correlation with disease severity in AD patients.6, 7
A disadvantage of the use of serum biomarkers is the need for a venipuncture that can only
be performed by trained personnel. Furthermore, this blood needs to be processed in a lab and must be
centrifuged within four hours of collection, which is costly, not practical and difficult to harmonise between
different centers in clinical trials. Dried blood spots (DBS) are a convenient alternative to venipuncture. DBS
can be obtained using a simple, minimally invasive, nearly painless procedure that can be done by the
patients themselves. DBS have been used for decades in screening for inherited metabolic diseases in
newborns.8 Measurement of cytokines and other inflammatory markers in DBS has been reported in several
studies.9-11 However, no studies measured biomarkers in DBS during follow-up in AD patients or investigated
their correlation with disease severity in AD. DBS may offer a simple and minimally invasive tool for objective
measurement of disease severity in AD, which can improve monitoring of patients and the comparison of
clinical trials. The aim of this study was to investigate if biomarkers determined in DBS offer a reliable tool for
the assessment of disease severity in AD.
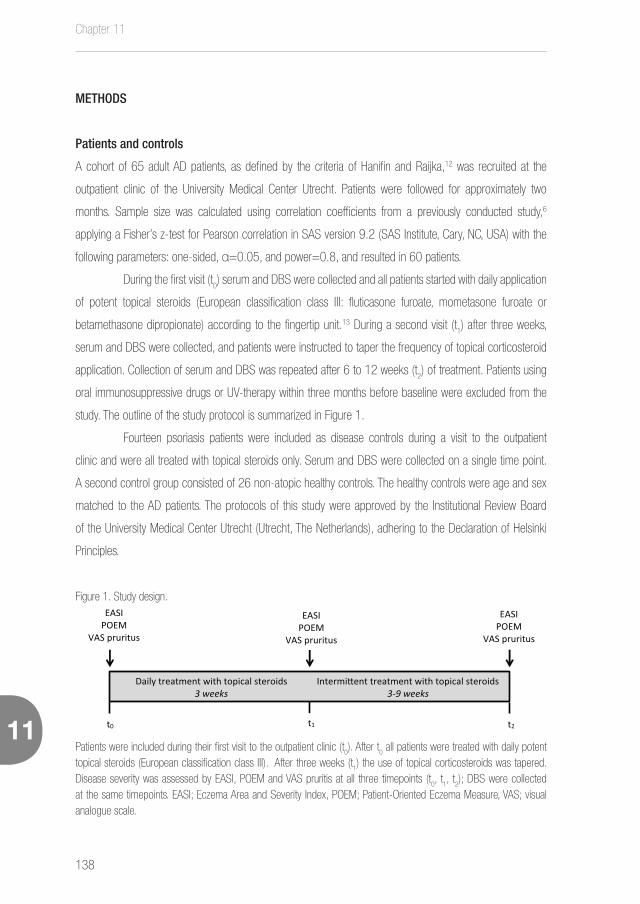
Chapter 11
138
Biomarkers detected in dried blood spots from atopic dermatitis patients strongly correlate with disease severity
11
METHODS
Patients and controls
A cohort of 65 adult AD patients, as defined by the criteria of Hanifin and Raijka,12 was recruited at the
outpatient clinic of the University Medical Center Utrecht. Patients were followed for approximately two
months. Sample size was calculated using correlation coefficients from a previously conducted study,6
applying a Fisher’s z-test for Pearson correlation in SAS version 9.2 (SAS Institute, Cary, NC, USA) with the
following parameters: one-sided, α=0.05, and power=0.8, and resulted in 60 patients.
During the first visit (t0) serum and DBS were collected and all patients started with daily application
of potent topical steroids (European classification class III: fluticasone furoate, mometasone furoate or
betamethasone dipropionate) according to the fingertip unit.13 During a second visit (t1) after three weeks,
serum and DBS were collected, and patients were instructed to taper the frequency of topical corticosteroid
application. Collection of serum and DBS was repeated after 6 to 12 weeks (t2) of treatment. Patients using
oral immunosuppressive drugs or UV-therapy within three months before baseline were excluded from the
study. The outline of the study protocol is summarized in Figure 1.
Fourteen psoriasis patients were included as disease controls during a visit to the outpatient
clinic and were all treated with topical steroids only. Serum and DBS were collected on a single time point.
A second control group consisted of 26 non-atopic healthy controls. The healthy controls were age and sex
matched to the AD patients. The protocols of this study were approved by the Institutional Review Board
of the University Medical Center Utrecht (Utrecht, The Netherlands), adhering to the Declaration of Helsinki
Principles.
Figure 1. Study design.
t0 t1 t2
Daily treatment with topical steroids 3 weeks
Intermi�ent treatment with topical steroids 3-9 weeks
EASI POEM
VAS pruritus
EASI POEM
VAS pruritus
EASI POEM
VAS pruritus
Patients were included during their first visit to the outpatient clinic (t0). After t
0 all patients were treated with daily potent
topical steroids (European classification class III). After three weeks (t1) the use of topical corticosteroids was tapered.
Disease severity was assessed by EASI, POEM and VAS pruritis at all three timepoints (t0, t
1, t
2); DBS were collected
at the same timepoints. EASI; Eczema Area and Severity Index, POEM; Patient-Oriented Eczema Measure, VAS; visual analogue scale.
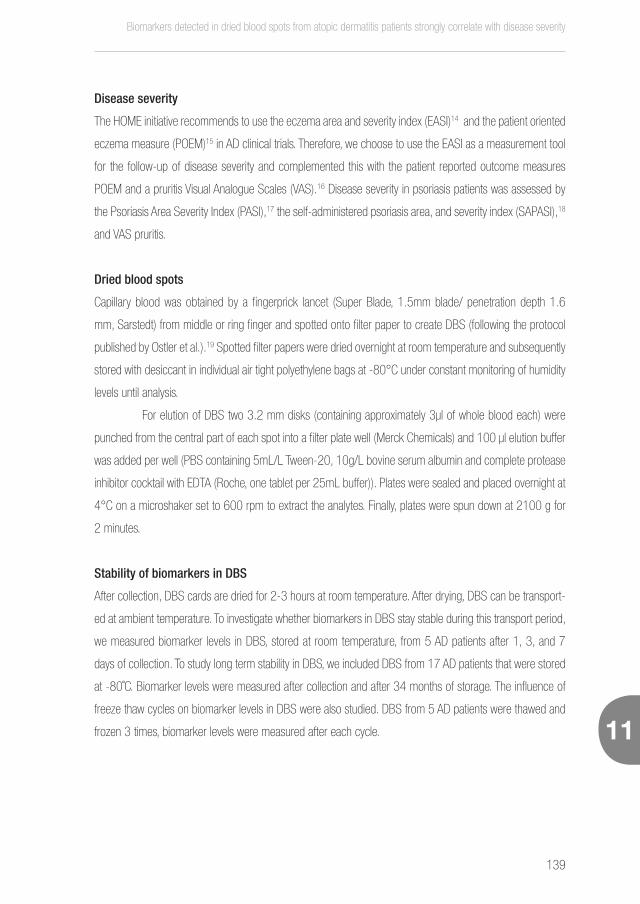
Biomarkers detected in dried blood spots from atopic dermatitis patients strongly correlate with disease severity
139
11
Disease severity
The HOME initiative recommends to use the eczema area and severity index (EASI)14 and the patient oriented
eczema measure (POEM)15 in AD clinical trials. Therefore, we choose to use the EASI as a measurement tool
for the follow-up of disease severity and complemented this with the patient reported outcome measures
POEM and a pruritis Visual Analogue Scales (VAS).16 Disease severity in psoriasis patients was assessed by
the Psoriasis Area Severity Index (PASI),17 the self-administered psoriasis area, and severity index (SAPASI),18
and VAS pruritis.
Dried blood spots
Capillary blood was obtained by a fingerprick lancet (Super Blade, 1.5mm blade/ penetration depth 1.6
mm, Sarstedt) from middle or ring finger and spotted onto filter paper to create DBS (following the protocol
published by Ostler et al.).19 Spotted filter papers were dried overnight at room temperature and subsequently
stored with desiccant in individual air tight polyethylene bags at -80°C under constant monitoring of humidity
levels until analysis.
For elution of DBS two 3.2 mm disks (containing approximately 3µl of whole blood each) were
punched from the central part of each spot into a filter plate well (Merck Chemicals) and 100 µl elution buffer
was added per well (PBS containing 5mL/L Tween-20, 10g/L bovine serum albumin and complete protease
inhibitor cocktail with EDTA (Roche, one tablet per 25mL buffer)). Plates were sealed and placed overnight at
4°C on a microshaker set to 600 rpm to extract the analytes. Finally, plates were spun down at 2100 g for
2 minutes.
Stability of biomarkers in DBS
After collection, DBS cards are dried for 2-3 hours at room temperature. After drying, DBS can be transport-
ed at ambient temperature. To investigate whether biomarkers in DBS stay stable during this transport period,
we measured biomarker levels in DBS, stored at room temperature, from 5 AD patients after 1, 3, and 7
days of collection. To study long term stability in DBS, we included DBS from 17 AD patients that were stored
at -80˚C. Biomarker levels were measured after collection and after 34 months of storage. The influence of
freeze thaw cycles on biomarker levels in DBS were also studied. DBS from 5 AD patients were thawed and
frozen 3 times, biomarker levels were measured after each cycle.
Chapter 11
140
Biomarkers detected in dried blood spots from atopic dermatitis patients strongly correlate with disease severity
11
Measurement of analytes in serum and DBS
A recently published study showed that the biomarkers TARC, MDC, PARC, IL-22, sE-selectin, sIL-2R, IL-
18, I-309, SDF-1α showed good correlation with disease severity when measured in serum.7 We therefore
measured these biomarkers both in serum and in the eluted DBS using a Luminex platform. Multiplex immu-
noassays were performed at the MultiPlex Core Facility of the Laboratory of Translational Immunology (UMC
Utrecht, The Netherlands) using an in-house validated panel of analytes as previously described.20
Statistical analysis
Patient demographics and sample characteristics were evaluated by an unpaired t-test. Analyte measure-
ments that were above or below the assay limits of detection were given values equivalent to the upper
and lower limits respectively. Biomarker concentrations of TARC, PARC, MDC and sE-selectin measured in
serum and DBS were normalized by log-transformation. Correlation coefficients were tested using a Pearson
correlation test. Levels of biomarkers between groups were compared with ANOVA. Linear mixed models
were used to model the change over time of biomarkers after treatment initiation. This kind of model gener-
alizes regression models by taking into account correlation between measurements in longitudinal data. We
investigated the effects of the different biomarkers on EASI scores using a piecewise linear mixed model. For
all AD patients, two slopes were considered: one for the first treatment period (between t0 and t
1) and one
for second treatment period (between t1 and t
2). The time for the slope’s change (t = 22 days) was based
on the median duration of the first treatment period. Correlation between individual baseline values and the
subsequent slopes was handled through the unstructured covariance matrix of random effects. Models were
adjusted for age and gender. To test if a combination of biomarkers improves prediction of EASI compared
to a single biomarker, an EASI prediction model was built using the Akaike Information Criteria (the lower the
better) which quantifies the quality of the fit to the data. The criteria were used to identify the model that best
described the behaviour of EASI within the AD patients. Differences in biomarker levels in the stability tests
were compared by a t-test in case of two measurements and by repeated measures ANOVA in case of more
than two measurements. P-values < 0.05 were considered statistically significant. All statistical analyses
were conducted using SAS version 9.4. (SAS Institute, Cary, North Carolina, USA) and Prism (version 6;
Graphpad).
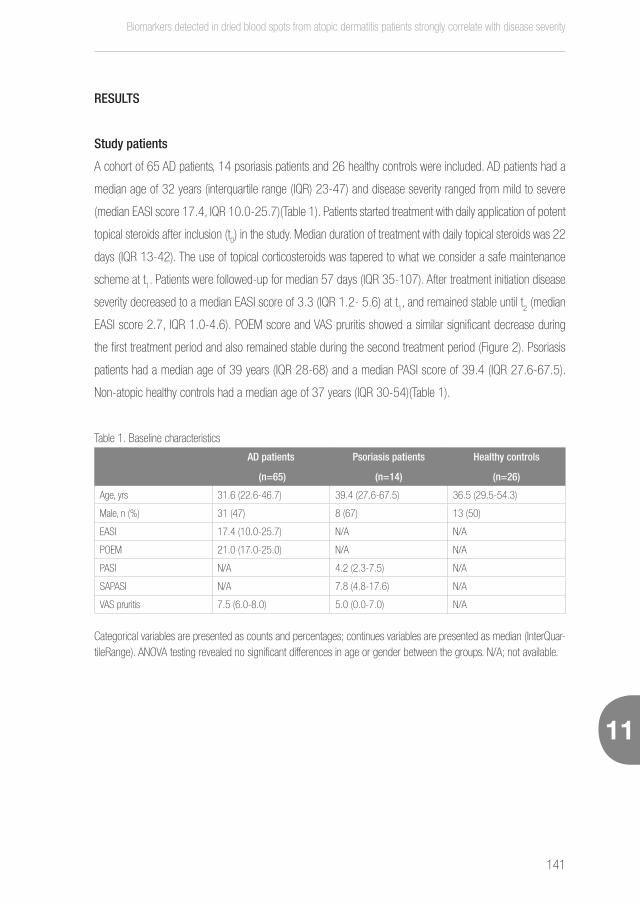
Biomarkers detected in dried blood spots from atopic dermatitis patients strongly correlate with disease severity
141
11
RESULTS
Study patients
A cohort of 65 AD patients, 14 psoriasis patients and 26 healthy controls were included. AD patients had a
median age of 32 years (interquartile range (IQR) 23-47) and disease severity ranged from mild to severe
(median EASI score 17.4, IQR 10.0-25.7)(Table 1). Patients started treatment with daily application of potent
topical steroids after inclusion (t0) in the study. Median duration of treatment with daily topical steroids was 22
days (IQR 13-42). The use of topical corticosteroids was tapered to what we consider a safe maintenance
scheme at t1. Patients were followed-up for median 57 days (IQR 35-107). After treatment initiation disease
severity decreased to a median EASI score of 3.3 (IQR 1.2- 5.6) at t1, and remained stable until t
2 (median
EASI score 2.7, IQR 1.0-4.6). POEM score and VAS pruritis showed a similar significant decrease during
the first treatment period and also remained stable during the second treatment period (Figure 2). Psoriasis
patients had a median age of 39 years (IQR 28-68) and a median PASI score of 39.4 (IQR 27.6-67.5).
Non-atopic healthy controls had a median age of 37 years (IQR 30-54)(Table 1).
Table 1. Baseline characteristics
AD patients
(n=65)
Psoriasis patients
(n=14)
Healthy controls
(n=26)
Age, yrs 31.6 (22.6-46.7) 39.4 (27.6-67.5) 36.5 (29.5-54.3)
Male, n (%) 31 (47) 8 (67) 13 (50)
EASI 17.4 (10.0-25.7) N/A N/A
POEM 21.0 (17.0-25.0) N/A N/A
PASI N/A 4.2 (2.3-7.5) N/A
SAPASI N/A 7.8 (4.8-17.6) N/A
VAS pruritis 7.5 (6.0-8.0) 5.0 (0.0-7.0) N/A
Categorical variables are presented as counts and percentages; continues variables are presented as median (InterQuar-tileRange). ANOVA testing revealed no significant differences in age or gender between the groups. N/A; not available.
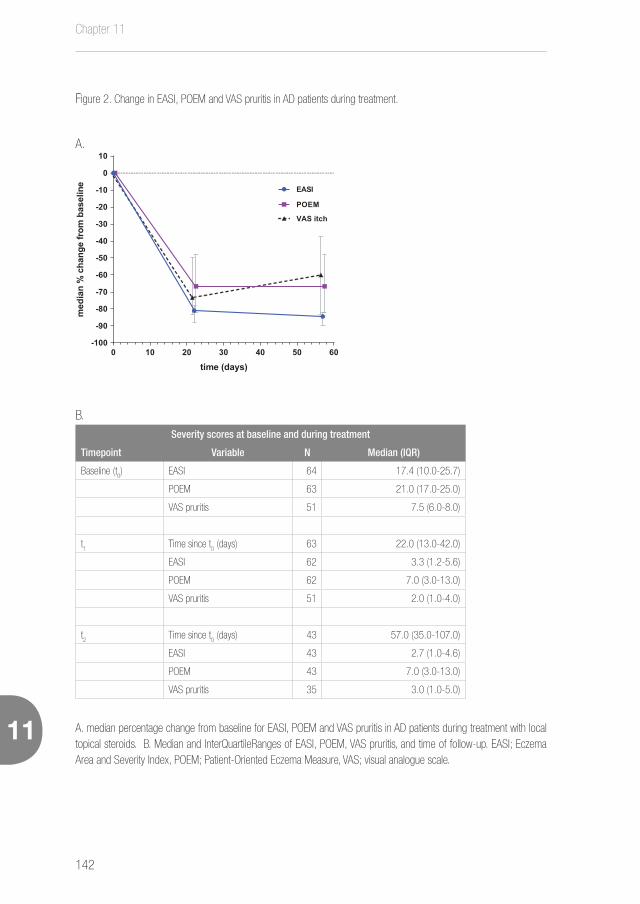
Chapter 11
142
Biomarkers detected in dried blood spots from atopic dermatitis patients strongly correlate with disease severity
11
Figure 2. Change in EASI, POEM and VAS pruritis in AD patients during treatment.
A.
0 10 20 30 40 50 60-100
-90
-80
-70
-60
-50
-40
-30
-20
-10
0
10
time (days)
med
ian
%ch
ange
from
base
line EASI
POEM
VAS itch
B.Severity scores at baseline and during treatment
Timepoint Variable N Median (IQR)
Baseline (t0) EASI 64 17.4 (10.0-25.7)
POEM 63 21.0 (17.0-25.0)
VAS pruritis 51 7.5 (6.0-8.0)
t1
Time since t0 (days) 63 22.0 (13.0-42.0)
EASI 62 3.3 (1.2-5.6)
POEM 62 7.0 (3.0-13.0)
VAS pruritis 51 2.0 (1.0-4.0)
t2
Time since t0 (days) 43 57.0 (35.0-107.0)
EASI 43 2.7 (1.0-4.6)
POEM 43 7.0 (3.0-13.0)
VAS pruritis 35 3.0 (1.0-5.0)
A. median percentage change from baseline for EASI, POEM and VAS pruritis in AD patients during treatment with local topical steroids. B. Median and InterQuartileRanges of EASI, POEM, VAS pruritis, and time of follow-up. EASI; Eczema Area and Severity Index, POEM; Patient-Oriented Eczema Measure, VAS; visual analogue scale.
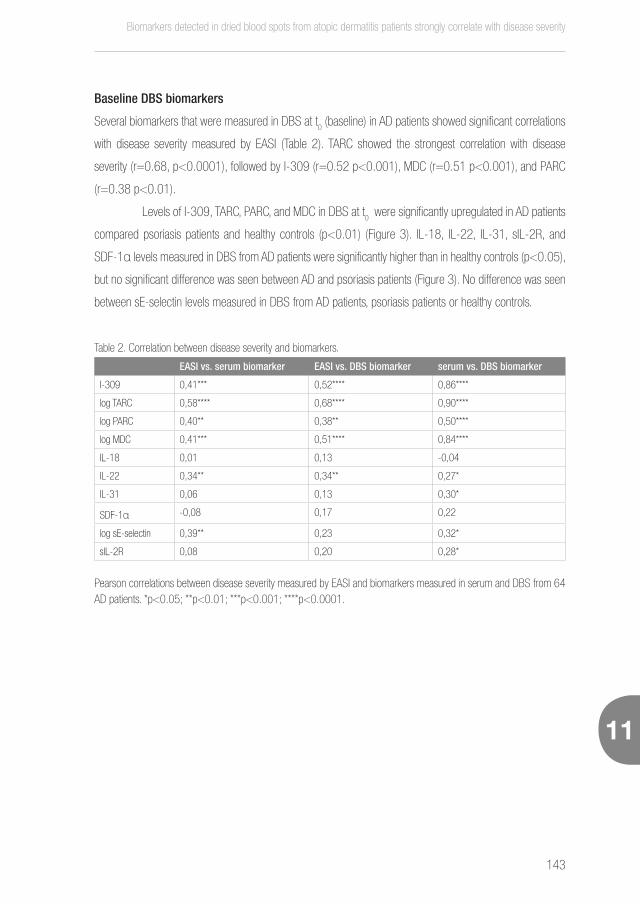
Biomarkers detected in dried blood spots from atopic dermatitis patients strongly correlate with disease severity
143
11
Baseline DBS biomarkers
Several biomarkers that were measured in DBS at t0 (baseline) in AD patients showed significant correlations
with disease severity measured by EASI (Table 2). TARC showed the strongest correlation with disease
severity (r=0.68, p<0.0001), followed by I-309 (r=0.52 p<0.001), MDC (r=0.51 p<0.001), and PARC
(r=0.38 p<0.01).
Levels of I-309, TARC, PARC, and MDC in DBS at t0 were significantly upregulated in AD patients
compared psoriasis patients and healthy controls (p<0.01) (Figure 3). IL-18, IL-22, IL-31, sIL-2R, and
SDF-1α levels measured in DBS from AD patients were significantly higher than in healthy controls (p<0.05),
but no significant difference was seen between AD and psoriasis patients (Figure 3). No difference was seen
between sE-selectin levels measured in DBS from AD patients, psoriasis patients or healthy controls.
Table 2. Correlation between disease severity and biomarkers.
EASI vs. serum biomarker EASI vs. DBS biomarker serum vs. DBS biomarker
I-309 0,41*** 0,52**** 0,86****
log TARC 0,58**** 0,68**** 0,90****
log PARC 0,40** 0,38** 0,50****
log MDC 0,41*** 0,51**** 0,84****
IL-18 0,01 0,13 -0,04
IL-22 0,34** 0,34** 0,27*
IL-31 0,06 0,13 0,30*
SDF-1α -0,08 0,17 0,22
log sE-selectin 0,39** 0,23 0,32*
sIL-2R 0,08 0,20 0,28*
Pearson correlations between disease severity measured by EASI and biomarkers measured in serum and DBS from 64 AD patients. *p<0.05; **p<0.01; ***p<0.001; ****p<0.0001.
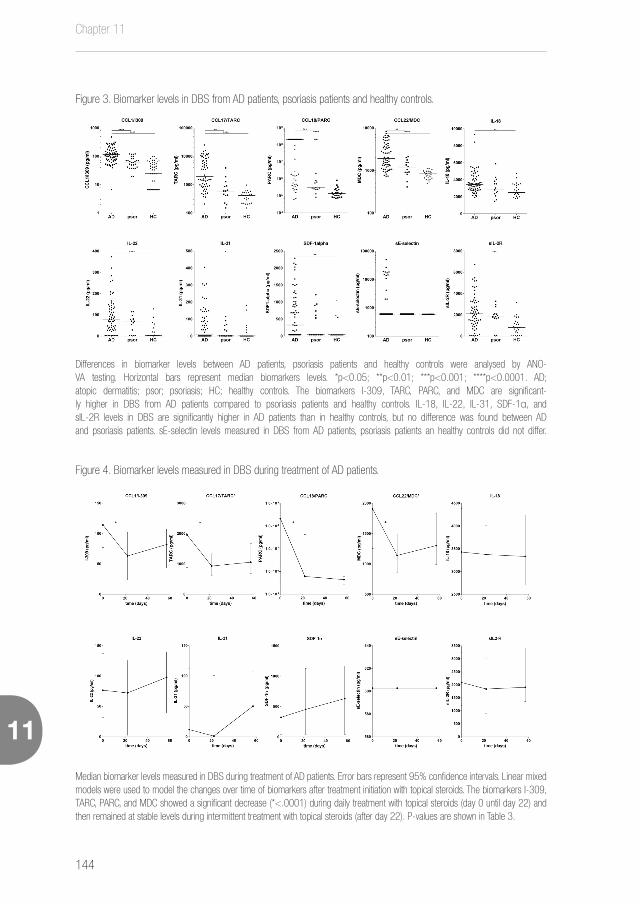
Chapter 11
144
Biomarkers detected in dried blood spots from atopic dermatitis patients strongly correlate with disease severity
11
Figure 3. Biomarker levels in DBS from AD patients, psoriasis patients and healthy controls.
Differences in biomarker levels between AD patients, psoriasis patients and healthy controls were analysed by ANO-VA testing. Horizontal bars represent median biomarkers levels. *p<0.05; **p<0.01; ***p<0.001; ****p<0.0001. AD; atopic dermatitis; psor; psoriasis; HC; healthy controls. The biomarkers I-309, TARC, PARC, and MDC are significant-ly higher in DBS from AD patients compared to psoriasis patients and healthy controls. IL-18, IL-22, IL-31, SDF-1α, and sIL-2R levels in DBS are significantly higher in AD patients than in healthy controls, but no difference was found between AD and psoriasis patients. sE-selectin levels measured in DBS from AD patients, psoriasis patients an healthy controls did not differ.
Figure 4. Biomarker levels measured in DBS during treatment of AD patients.
Median biomarker levels measured in DBS during treatment of AD patients. Error bars represent 95% confidence intervals. Linear mixed models were used to model the changes over time of biomarkers after treatment initiation with topical steroids. The biomarkers I-309, TARC, PARC, and MDC showed a significant decrease (*<.0001) during daily treatment with topical steroids (day 0 until day 22) and then remained at stable levels during intermittent treatment with topical steroids (after day 22). P-values are shown in Table 3.
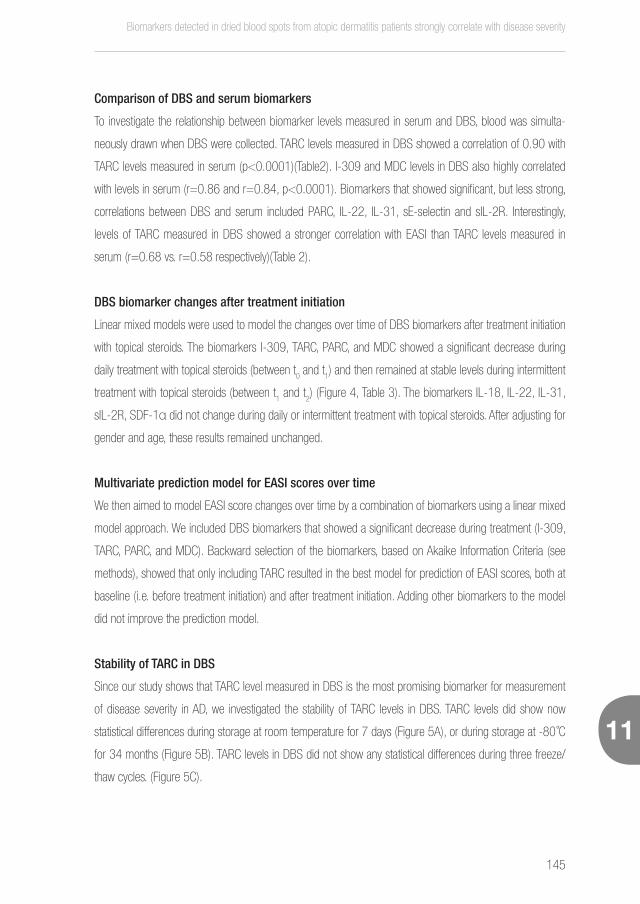
Biomarkers detected in dried blood spots from atopic dermatitis patients strongly correlate with disease severity
145
11
Comparison of DBS and serum biomarkers
To investigate the relationship between biomarker levels measured in serum and DBS, blood was simulta-
neously drawn when DBS were collected. TARC levels measured in DBS showed a correlation of 0.90 with
TARC levels measured in serum (p<0.0001)(Table2). I-309 and MDC levels in DBS also highly correlated
with levels in serum (r=0.86 and r=0.84, p<0.0001). Biomarkers that showed significant, but less strong,
correlations between DBS and serum included PARC, IL-22, IL-31, sE-selectin and sIL-2R. Interestingly,
levels of TARC measured in DBS showed a stronger correlation with EASI than TARC levels measured in
serum (r=0.68 vs. r=0.58 respectively)(Table 2).
DBS biomarker changes after treatment initiation
Linear mixed models were used to model the changes over time of DBS biomarkers after treatment initiation
with topical steroids. The biomarkers I-309, TARC, PARC, and MDC showed a significant decrease during
daily treatment with topical steroids (between t0 and t
1) and then remained at stable levels during intermittent
treatment with topical steroids (between t1 and t
2) (Figure 4, Table 3). The biomarkers IL-18, IL-22, IL-31,
sIL-2R, SDF-1α did not change during daily or intermittent treatment with topical steroids. After adjusting for
gender and age, these results remained unchanged.
Multivariate prediction model for EASI scores over time
We then aimed to model EASI score changes over time by a combination of biomarkers using a linear mixed
model approach. We included DBS biomarkers that showed a significant decrease during treatment (I-309,
TARC, PARC, and MDC). Backward selection of the biomarkers, based on Akaike Information Criteria (see
methods), showed that only including TARC resulted in the best model for prediction of EASI scores, both at
baseline (i.e. before treatment initiation) and after treatment initiation. Adding other biomarkers to the model
did not improve the prediction model.
Stability of TARC in DBS
Since our study shows that TARC level measured in DBS is the most promising biomarker for measurement
of disease severity in AD, we investigated the stability of TARC levels in DBS. TARC levels did show now
statistical differences during storage at room temperature for 7 days (Figure 5A), or during storage at -80 ̊C
for 34 months (Figure 5B). TARC levels in DBS did not show any statistical differences during three freeze/
thaw cycles. (Figure 5C).
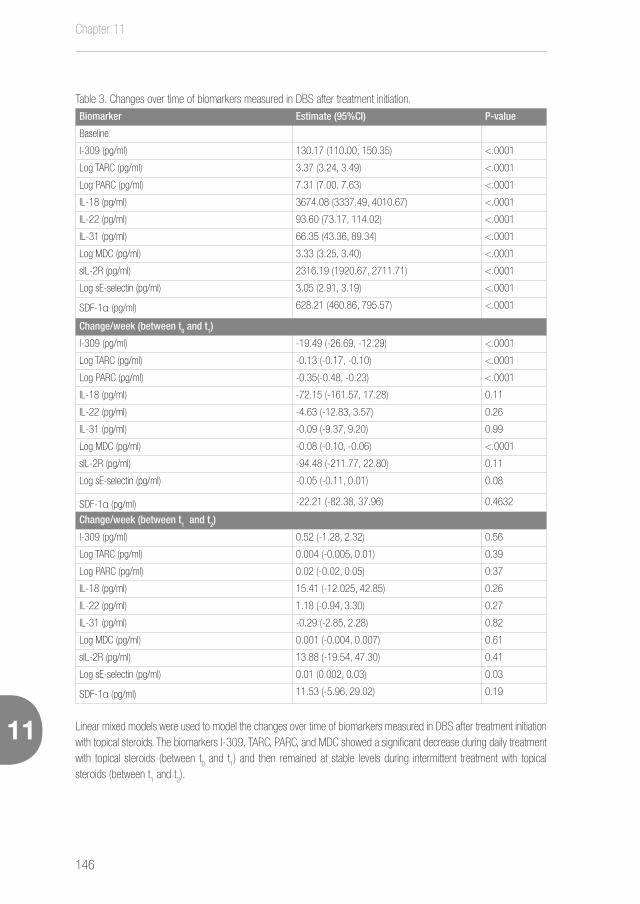
Chapter 11
146
Biomarkers detected in dried blood spots from atopic dermatitis patients strongly correlate with disease severity
11
Table 3. Changes over time of biomarkers measured in DBS after treatment initiation.
Biomarker Estimate (95%CI) P-value
Baseline
I-309 (pg/ml) 130.17 (110.00, 150.35) <.0001
Log TARC (pg/ml) 3.37 (3.24, 3.49) <.0001
Log PARC (pg/ml) 7.31 (7.00, 7.63) <.0001
IL-18 (pg/ml) 3674.08 (3337.49, 4010.67) <.0001
IL-22 (pg/ml) 93.60 (73.17, 114.02) <.0001
IL-31 (pg/ml) 66.35 (43.36, 89.34) <.0001
Log MDC (pg/ml) 3.33 (3.25, 3.40) <.0001
sIL-2R (pg/ml) 2316.19 (1920.67, 2711.71) <.0001
Log sE-selectin (pg/ml) 3.05 (2.91, 3.19) <.0001
SDF-1α (pg/ml) 628.21 (460.86, 795.57) <.0001
Change/week (between t0 and t1)
I-309 (pg/ml) -19.49 (-26.69, -12.29) <.0001
Log TARC (pg/ml) -0.13 (-0.17, -0.10) <.0001
Log PARC (pg/ml) -0.35(-0.48, -0.23) <.0001
IL-18 (pg/ml) -72.15 (-161.57, 17.28) 0.11
IL-22 (pg/ml) -4.63 (-12.83, 3.57) 0.26
IL-31 (pg/ml) -0.09 (-9.37, 9.20) 0.99
Log MDC (pg/ml) -0.08 (-0.10, -0.06) <.0001
sIL-2R (pg/ml) -94.48 (-211.77, 22.80) 0.11
Log sE-selectin (pg/ml) -0.05 (-0.11, 0.01) 0.08
SDF-1α (pg/ml) -22.21 (-82.38, 37.96) 0.4632
Change/week (between t1 and t2)
I-309 (pg/ml) 0.52 (-1.28, 2.32) 0.56
Log TARC (pg/ml) 0.004 (-0.005, 0.01) 0.39
Log PARC (pg/ml) 0.02 (-0.02, 0.05) 0.37
IL-18 (pg/ml) 15.41 (-12.025, 42.85) 0.26
IL-22 (pg/ml) 1.18 (-0.94, 3.30) 0.27
IL-31 (pg/ml) -0.29 (-2.85, 2.28) 0.82
Log MDC (pg/ml) 0.001 (-0.004, 0.007) 0.61
sIL-2R (pg/ml) 13.88 (-19.54, 47.30) 0.41
Log sE-selectin (pg/ml) 0.01 (0.002, 0.03) 0.03
SDF-1α (pg/ml) 11.53 (-5.96, 29.02) 0.19
Linear mixed models were used to model the changes over time of biomarkers measured in DBS after treatment initiation with topical steroids. The biomarkers I-309, TARC, PARC, and MDC showed a significant decrease during daily treatment with topical steroids (between t
0 and t
1) and then remained at stable levels during intermittent treatment with topical
steroids (between t1 and t
2).
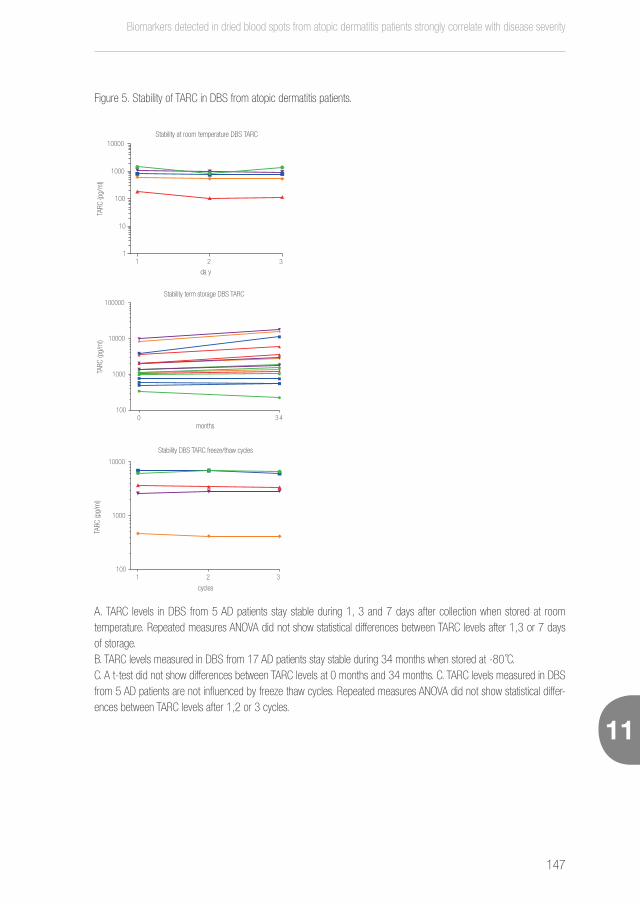
Biomarkers detected in dried blood spots from atopic dermatitis patients strongly correlate with disease severity
147
11
Figure 5. Stability of TARC in DBS from atopic dermatitis patients.
1 2 31
10
100
1000
10000
da y
Stability at room temperature DBS TARC
TARC
(pg/
ml)
A. TARC levels in DBS from 5 AD patients stay stable during 1, 3 and 7 days after collection when stored at room temperature. Repeated measures ANOVA did not show statistical differences between TARC levels after 1,3 or 7 days of storage. B. TARC levels measured in DBS from 17 AD patients stay stable during 34 months when stored at -80 ̊C.C. A t-test did not show differences between TARC levels at 0 months and 34 months. C. TARC levels measured in DBS from 5 AD patients are not influenced by freeze thaw cycles. Repeated measures ANOVA did not show statistical differ-ences between TARC levels after 1,2 or 3 cycles.
0 3 4100
1000
10000
100000Stability term storage DBS TARC
months
TARC
(pg/
ml)
1 2 3100
1000
10000
Stability DBS TARC freeze/thaw cycles
cycles
TARC
(pg/
ml)
Chapter 11
148
Biomarkers detected in dried blood spots from atopic dermatitis patients strongly correlate with disease severity
11
DISCUSSION
Biomarkers offer an objective alternative for the classically used physician assessed outcome measures
which are subject to inter- and intra-observer differences. Disadvantages of the use of serum biomarkers are
the need for a venipuncture, the processing in a lab and the challenges in harmonizing the logistics between
different labs. DBS offer a simple and minimally invasive alternative to venipuncture. In this study we show
that TARC levels measured in DBS from AD patients highly correlates with disease severity and significantly
decreases during effective treatment with topical steroids.
Robert Guthrie is widely credited as being the first to use blood dried on filter paper (so-called
Guthrie cards) to diagnose phenylketonuria in neonates in 1963.21 Since then, the use of filter paper for
storing and transporting diverse specimens has become a common method. In 2005, Skogstrand et al.11
were the first to measure cytokines in DBS using a multiplex immunoassay technology. Measurement of
cytokines in DBS by multiplex has been repeated in several publications in different fields of study.22-25
The current study is the first to measure cytokines and chemokines in DBS from AD patients by multiplex
immunoassay technology.
An advantage of DBS over venipuncture is the simple, minimally-invasive and nearly painless pro-
cedure. Trained personnel are needed for blood collection by venipuncture, whereas DBS can be performed
by patients themselves. The majority of adult patients prefers a small finger-prick over intravenous blood
draws.26, 27 DBS also require a very small amount of blood (±10 μL), which is advantageous in studies that
include newborns and infants. DBS are not only easier to collect, but also offer a huge simplification in storage
and transport, which makes harmonizing logistics between centers within a clinical trial much easier. After col-
lection, DBS cards are dried horizontally in a card rack at 2-3 hours at room temperature. After drying, DBS
can be transported at ambient temperature by regular mail, which reduces sample transportation and storage
costs. We have now shown that TARC levels in DBS stay stable when stored at room temperature up to 7
days after collection. Moreover, when DBS are stored at -80˚C TARC, levels remain stable up to 34 months
and are not influenced by freezing and thawing of the DBS. Earlier reports have shown that cytokine levels in
DBS remain stable up to 23 years when DBS are stored at -24˚C.11 Finally, DBS are safer to transport and
considered as non-regulated and exempt material, which allows shipping of DBS through mail or courier.28,
29 This makes TARC measured in DBS a very reliable and cost-effective biomarker for disease severity in AD.
Another advantage of DBS is the possibility to measure of drug concentrations, which is possible in
a range of drugs,30 including cyclosporin A,31-34 mycophenolic acid,35 and tacrolimus,34, 36, 37 drugs which are
frequently used in AD treatment.38 DBS can also be used to investigate the pharmacokinetics of new biologic
agents.39 Combining measurement of drug concentrations in DBS with disease severity biomarkers would

Biomarkers detected in dried blood spots from atopic dermatitis patients strongly correlate with disease severity
149
11
be ideal in clinical trials. Measurement of creatinine levels in DBS has also been described.37 Since decrease
in kidney function is one of the most common adverse effects in cyclosporin A treatment, measurement of
creatinine levels in DBS would be of great interest in the follow-up of AD patients treated with cyclosporin
A. Combining measurement of severity, CsA blood levels and creatinine levels in DBS can facilitate home
follow-up of patients through email or video consultations, replacing face-to-face consultations which saves
costs and time for patients.
In the current study TARC levels measured in DBS showed the strongest correlation with disease
severity measured by EASI. This is in accordance with literature on biomarkers measured in serum. A recent
meta-analysis found that serum TARC is the most reliable biomarker for disease severity in AD currently
available.5 In the current study, the biomarkers I-309, PARC and MDC in DBS also correlated with disease
severity and significantly decreased during effective treatment with topical steroids. However, including these
biomarkers in a linear mixed model analysis for prediction of EASI scores did not improve the model. This
is in contrast with results from studies on serum biomarkers, in which a panel including multiple biomarkers
better correlates with disease severity than a single biomarker.6, 7 We noticed that TARC levels measured in
DBS highly correlated with I-309, PARC and MDC levels measured in DBS (data not shown). These correla-
tions may explain why adding I-309, PARC or MDC into a prediction model adds no value to a model that
includes TARC.
Interestingly, TARC shows a stronger correlation with disease severity when measured in DBS
compared to serum. This may be explained by higher recovery levels in DBS than in serum due to measure-
ment of intracellular components in DBS, as was previously shown.40 The stronger correlation of TARC in DBS
might also be caused by different biomarker concentrations in capillary blood compared to venous blood,
which may lead to different biomarker concentrations when measured in finger-prick spotted DBS (capillary
blood) compared with traditional venous sampling.
A limitation of our study is the fact that we only measured a small amount of biomarkers in DBS,
which were selected based on their correlation with disease severity in serum. There might be other biomark-
ers that we did not measure in this study, but that do correlate with disease severity when measured in DBS.
In conclusion, we have shown that in a population of mild to severe AD patients TARC levels measured in DBS
highly correlate with disease severity and significantly decrease during effective treatment. DBS offer a simple
and minimally invasive method for measurement of biomarkers and provide a tool for objective severity
outcome measurements in AD that can easily be applied in clinical trials and daily practice.

Chapter 11
150
Biomarkers detected in dried blood spots from atopic dermatitis patients strongly correlate with disease severity
11
REFERENCES
1. Deckers IA, McLean S, Linssen S, Mommers M, van Schayck CP, Sheikh A. Investigating international time trends in the
incidence and prevalence of atopic eczema 1990-2010: a systematic review of epidemiological studies. PLoS One
2012; 7:e39803.
2. Charman C, Chambers C, Williams H. Measuring atopic dermatitis severity in randomized controlled clinical trials: what
exactly are we measuring? J Invest Dermatol 2003; 120:932-41.
3. Schmitt J, Langan S, Williams HC, European Dermato-Epidemiology N. What are the best outcome measurements for
atopic eczema? A systematic review. J Allergy Clin Immunol 2007; 120:1389-98.
4. Schmitt J, Langan S, Stamm T, Williams HC, Harmonizing Outcome Measurements in Eczema Delphi p. Core outcome do-
mains for controlled trials and clinical recordkeeping in eczema: international multiperspective Delphi consensus process.
J Invest Dermatol 2011; 131:623-30.
5. Thijs J, Krastev T, Weidinger S, Buckens CF, de Bruin-Weller M, Bruijnzeel-Koomen C, et al. Biomarkers for atopic derma-
titis: a systematic review and meta-analysis. Curr Opin Allergy Clin Immunol 2015; 15:453-60.
6. Thijs JL, Nierkens S, Herath A, Bruijnzeel-Koomen CA, Knol EF, Giovannone B, et al. A panel of biomarkers for disease
severity in atopic dermatitis. Clin Exp Allergy 2015; 45:698-701.
7. Thijs JL DJ, Fiechter R, Strickland I, Sleeman MA, Herath A, May RD, Bruijnzeel-Koomen CAFM, Knol EF, Giovannone B,
de Bruin-Weller MS, Nierkens S, Hijnen DJ. EASI p-EASI: Utilising a combination of serum biomarkers offers an objective
measurement tool for disease severity in atopic dermatitis patients. Journal of Allergy and Clinical Immunology Under
review.
8. Sood BG, Madan A, Saha S, Schendel D, Thorsen P, Skogstrand K, et al. Perinatal systemic inflammatory response syn-
drome and retinopathy of prematurity. Pediatr Res 2010; 67:394-400.
9. Miller EM, McDade TW. A highly sensitive immunoassay for interleukin-6 in dried blood spots. Am J Hum Biol 2012;
24:863-5.
10. Aabye MG, Eugen-Olsen J, Werlinrud AM, Holm LL, Tuuminen T, Ravn P, et al. A simple method to quantitate IP-10 in dried
blood and plasma spots. PLoS One 2012; 7:e39228.
11. Skogstrand K, Thorsen P, Norgaard-Pedersen B, Schendel DE, Sorensen LC, Hougaard DM. Simultaneous measurement
of 25 inflammatory markers and neurotrophins in neonatal dried blood spots by immunoassay with xMAP technology. Clin
Chem 2005; 51:1854-66.
12. Hanifin JM, Rajka G. Diagnostic Features of Atopic-Dermatitis. Acta Derm Venereol 1980:44-7.
13. Long CC, Finlay AY. The finger-tip unit--a new practical measure. Clin Exp Dermatol 1991; 16:444-7.
14. Hanifin JM, Thurston M, Omoto M, Cherill R, Tofte SJ, Graeber M. The eczema area and severity index (EASI): assessment
of reliability in atopic dermatitis. EASI Evaluator Group. Exp Dermatol 2001; 10:11-8.

Biomarkers detected in dried blood spots from atopic dermatitis patients strongly correlate with disease severity
151
11
15. Charman CR, Venn AJ, Williams HC. The patient-oriented eczema measure: development and initial validation of a new tool
for measuring atopic eczema severity from the patients’ perspective. Arch Dermatol 2004; 140:1513-9.
16. Phan NQ, Blome C, Fritz F, Gerss J, Reich A, Ebata T, et al. Assessment of pruritus intensity: prospective study on validity
and reliability of the visual analogue scale, numerical rating scale and verbal rating scale in 471 patients with chronic
pruritus. Acta Derm Venereol 2012; 92:502-7.
17. Fredriksson T, Pettersson U. Severe psoriasis--oral therapy with a new retinoid. Dermatologica 1978; 157:238-44.
18. Feldman SR, Fleischer AB, Jr., Reboussin DM, Rapp SR, Exum ML, Clark AR, et al. The self-administered psoriasis area
and severity index is valid and reliable. J Invest Dermatol 1996; 106:183-6.
19. Ostler MW, Porter JH, Buxton OM. Dried blood spot collection of health biomarkers to maximize participation in population
studies. J Vis Exp 2014:e50973.
20. Thijs JL SI, Bruijnzeel-Koomen CAF, Nierkens S, Giovannone B, Csomor E, Sellman BR, Mustelin T, Sleeman MA, de
Bruin-Weller MS, Herath A, Drylewicz J, May RD, Hijnen DJ. Moving towards endotypes in atopic dermatitis: identification
of patient clusters based on serum biomarker analysis. Journal of Allergy and Clinical Immunology in press.
21. Lehmann S, Delaby C, Vialaret J, Ducos J, Hirtz C. Current and future use of “dried blood spot” analyses in clinical chemistry.
Clin Chem Lab Med 2013; 51:1897-909.
22. Sood BG, Shankaran S, Schelonka RL, Saha S, Benjamin DK, Jr., Sanchez PJ, et al. Cytokine profiles of preterm neonates
with fungal and bacterial sepsis. Pediatr Res 2012; 72:212-20.
23. Andersen NJ, Mondal TK, Preissler MT, Freed BM, Stockinger S, Bell E, et al. Detection of immunoglobulin isotypes from
dried blood spots. J Immunol Methods 2014; 404:24-32.
24. Nielsen PR, Agerbo E, Skogstrand K, Hougaard DM, Meyer U, Mortensen PB. Neonatal levels of inflammatory markers and
later risk of schizophrenia. Biol Psychiatry 2015; 77:548-55.
25. Broadney MM, Chahal N, Michels KA, McLain AC, Ghassabian A, Lawrence DA, et al. Impact of parental obesity on neo-
natal markers of inflammation and immune response. Int J Obes (Lond) 2016.
26. Merton G, Jones K, Lee M, Johnston A, Holt DW. Accuracy of cyclosporin measurements made in capillary blood samples
obtained by skin puncture. Ther Drug Monit 2000; 22:594-8.
27. Woods K, Douketis JD, Schnurr T, Kinnon K, Powers P, Crowther MA. Patient preferences for capillary vs. venous INR
determination in an anticoagulation clinic: a randomized controlled trial. Thromb Res 2004; 114:161-5.
28. Federal Register. 49 CFR part 173 Shippers General Requirements for Shipments and packaging. Section 173.134(b)
2011.] Available from https://www.gpo.gov/fdsys/pkg/CFR-2011-title49-vol2/pdf/CFR-2011-title49-vol2-
sec173-134.pdf.
29. Guidance on regulations for the Transport of Infectious Substances 2015–2016.] Available from http://apps.who.int/iris/
bitstream/10665/149288/1/WHO_HSE_GCR_2015.2_eng.pdf?ua=1.
30. Sharma A, Jaiswal S, Shukla M, Lal J. Dried blood spots: concepts, present status, and future perspectives in bioanalysis.

Chapter 11
152
Biomarkers detected in dried blood spots from atopic dermatitis patients strongly correlate with disease severity
11
Drug Test Anal 2014; 6:399-414.
31. Lampe D, Scholz D, Prumke HJ, Blank W, Huller H. Capillary blood, dried on filter paper, as sample for monitoring cyclo-
sporin A concentrations. Clin Chem 1987; 33:1643-4.
32. Mohamed R, Mercolini L, Cuennet-Cosandey S, Chavent J, Raggi MA, Peyrou M. Validation of a dried blood spot LC-MS/
MS approach for cyclosporin A in cat blood: Comparison with a classical sample preparation. Journal of Pharmaceutical
and Biomedical Analysis 2012; 66:298-305.
33. Hinchliffe E, Adaway JE, Keevil BG. Simultaneous measurement of cyclosporin A and tacrolimus from dried blood spots by
ultra high performance liquid chromatography tandem mass spectrometry. J Chromatogr B Analyt Technol Biomed Life Sci
2012; 883-884:102-7.
34. Koster RA, Alffenaar JWC, Greijdanus B, Uges DRA. Fast LC-MS/MS analysis of tacrolimus, sirolimus, everolimus and
cyclosporin A in dried blood spots and the influence of the hematocrit and immunosuppressant concentration on recovery.
Talanta 2013; 115:47-54.
35. Heinig K, Bucheli F, Hartenbach R, Gajate-Perez A. Determination of mycophenolic acid and its phenyl glucuronide in
human plasma, ultrafiltrate, blood, DBS and dried plasma spots. Bioanalysis 2010; 2:1423-35.
36. Hoogtanders K, van der Heijden J, Christiaans M, Edelbroek P, van Hooff JP, Stolk LM. Therapeutic drug monitoring of
tacrolimus with the dried blood spot method. J Pharm Biomed Anal 2007; 44:658-64.
37. Koop DR, Bleyle LA, Munar M, Cherala G, Al-Uzri A. Analysis of tacrolimus and creatinine from a single dried blood spot
using liquid chromatography tandem mass spectrometry. Journal of Chromatography B-Analytical Technologies in the
Biomedical and Life Sciences 2013; 926:54-61.
38. Ring J, Alomar A, Bieber T, Deleuran M, Fink-Wagner A, Gelmetti C, et al. Guidelines for treatment of atopic eczema (atopic
dermatitis) Part II. J Eur Acad Dermatol Venereol 2012; 26:1176-93.
39. Burns D, Brunner L, Rajendran S, Johnson B, Ma M, Wang J. Validation of a Ligand Binding Assay Using Dried Blood Spot
Sampling. Aaps Journal 2013; 15:123-31.
40. Pennings JL, Siljee JE, Imholz S, Kuc S, de Vries A, Schielen PC, et al. Comparison of different blood collection, sample
matrix, and immunoassay methods in a prenatal screening setting. Dis Markers 2014; 2014:509821.

Biomarkers detected in dried blood spots from atopic dermatitis patients strongly correlate with disease severity
153
11

Chapter 12
154
12
12

General discussion
155
11
12
General discussion
Chapter 12
156
12
MAIN FINDINGS OF THIS THESIS
Biomarkers for disease severity in atopic dermatitis
• A meta-analysis including 222 studies showed that serum TARC level is the best biomarker for disease
severity currently available (chapter 2).
• Immunoglobulin free light chains have been shown to correlate with disease severity in paediatric AD.
However, they do not correlate with disease severity in adult AD (chapter 6).
• A pilot study in 17 AD patients showed that a combination of serum biomarkers is better in assessing
disease severity than a single biomarker (chapter 3).
• In a prospective cohort of 200 patients it was shown that combining serum TARC, IL-22 and sIL-2R
levels in an algorithm accurately predicts clinically measured disease severity (predicted EASI) in 90%
of AD patient treated with topical steroids (chapter 4).
• The p-EASI also predicts disease severity in patients treated with cyclosporin A (chapter 5).
• The p-EASI offers an objective outcome measure for disease severity in prospective AD studies (chapter
4 and 5).
Biomarkers enabling precision medicine in atopic dermatitis
• High expression levels of circulating inflammatory biomarkers suggest that AD is a systemic disease.
Recently described comorbidities may be the result of this systemic inflammation, and emphasize the
need for a multidisciplinary approach for optimal management of AD and its comorbidities (chapter 9).
• AD is a heterogeneous disease both clinically and biologically. We have identified four clusters of AD
patients based on specific serum biomarker profiles, implying that each of these clusters is driven by a
distinct underlying pathway and these clusters may represent different endotypes (chapter 7).
• UGT1A9 polymorphisms can be used to identify patients with non-responsiveness to mycophenolic
acid therapy, thereby showing the potential of pharmacodynamic biomarkers in AD (chapter 8).
Improving practical aspects of biomarker measur ement
• The biomarkers studied in this thesis are measured in serum. However, multiple other sources for bio-
marker measurement exist, for instance saliva and dried blood spots (chapter 10).
• A disadvantage of the use of serum biomarkers is the need for a venipuncture. TARC levels measured
in dried blood spots also highly correlate with disease severity and significantly decrease during effective
treatment. Therefore, dried blood spots may offer a simple and minimally invasive method for measure-
ment of biomarkers in AD (chapter 11).
General discussion
157
11
12
GENERAL DISCUSSION
Atopic dermatitis (AD) is one of the most common chronic inflammatory skin diseases worldwide. Living with
AD has a great impact on the quality of life of patients. The pathophysiology of AD is complex, and thought
to be the result of both genetic and environmental factors, resulting in immunologic and barrier dysfunctions.1
Many attempts have been made to define subsets of patients based on clinical characteristics. However,
the current characterization of AD patients might not adequately reflect the pathophysiologic diversity within
patients with AD.
Most patients with mild disease can be effectively treated with topical steroids, however, there is a
high unmet need in the treatment of patients with moderate to severe disease. In recent years, the number
of clinical trials evaluating biological agents targeting specific cytokines or cytokine receptors has steadily
increased, and may provide new, highly effective treatment options for AD in the near future.2 With the
increasing number of clinical trials evaluating these new drugs, comparability of study outcomes is of major
importance.
Technological advances now allow us to determine large numbers of biomarkers in small volumes
of body fluids. The figure below contains an overview of the different biomarker types, their clinical applica-
tions and sources. The increased use of biomarkers in AD research will result in objective outcome measures
that will allow better comparison of current and new treatments, furthermore biomarkers may enable better
characterization and stratification of AD patients, and a better understanding of the underlying pathomecha-
nisms, enabling precision medicine.
The research presented in this thesis focuses on biomarkers for monitoring clinical disease sever-
ity and biomarkers for stratification of pathophysiological mechanisms, measured in serum and dried blood
spots of patients with AD.
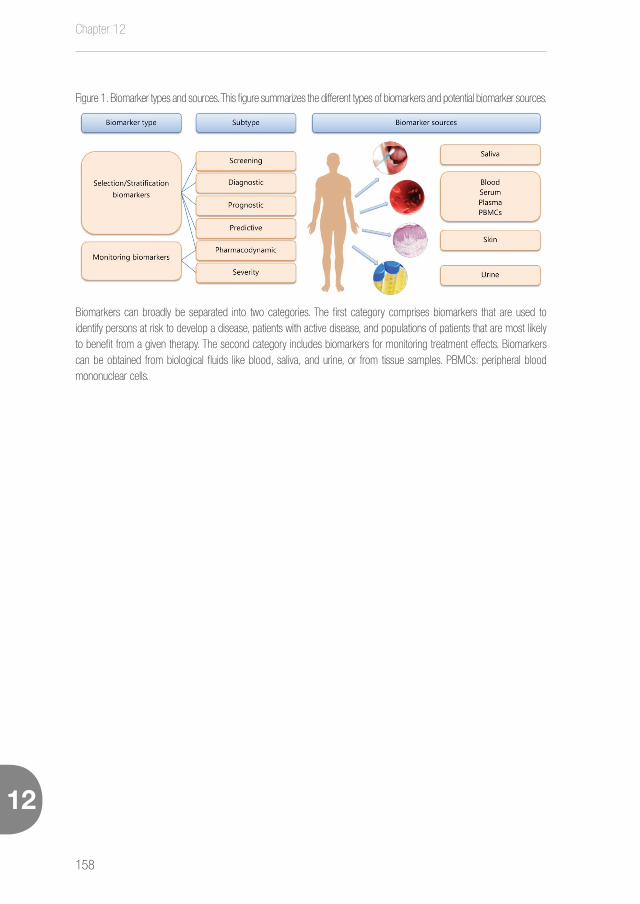
Chapter 12
158
12
Figure 1. Biomarker types and sources. This figure summarizes the different types of biomarkers and potential biomarker sources.
Biomarkers can broadly be separated into two categories. The first category comprises biomarkers that are used to identify persons at risk to develop a disease, patients with active disease, and populations of patients that are most likely to benefit from a given therapy. The second category includes biomarkers for monitoring treatment effects. Biomarkers can be obtained from biological fluids like blood, saliva, and urine, or from tissue samples. PBMCs: peripheral blood mononuclear cells.
General discussion
159
11
12
BIOMARKERS FOR DISEASE SEVERITY IN ATOPIC DERMATITIS
Atopic dermatitis (AD) is one of the most common chronic inflammatory skin disease worldwide with a high
burden of disease, and socio-economic impact.3-6 Although most AD patients with mild disease can be
effectively treated with topical steroids, there is a high unmet need in the treatment of patients with moderate
to severe disease. In recent years, the number of clinical trials evaluating biological agents targeting specific
pathways and mechanisms in AD has steadily increased and may provide new treatment options for AD in
the near future that could considerably improve patients’ quality of life.2 With the increasing number of clinical
trials evaluating these new biological agents, the comparability of study outcomes is of major importance.
Over 50 different clinical outcome measures for disease severity have been described in AD.7 A
systematic review on validity and reliability of the 20 most commonly used clinician rated severity measures
for AD showed that only three severity measures performed adequately.8 To address these shortcomings in
reporting, experts in the field have established the Harmonizing Outcome Measurements in Eczema (HOME)
initiative, an attempt to ensure that investigators employ a core set of clinical outcome measures to enhance
comparability between studies. The HOME initiative recently recommended the use of the Eczema Area and
Severity Index (EASI) and the Patient Oriented Eczema Measure (POEM) as core outcome instruments for
measuring disease severity and symptoms in AD.9, 10 A shortcoming of clinician rated severity measures is
the subjective judgment of categories and domains rated by the physician. Therefore, subjectivity of clinician
rated severity measures is inevitable, which leads to inter- and intra-observer variations as was confirmed
by several studies.8, 11, 12 We hypothesized that the use of objective serum biomarkers may replace clinician
rated severity measures. We think that a combination of objective serum biomarkers and patient-reported
outcomes, will highly improve outcome measures in AD and comparability of studies.
In a meta-analysis examining the correlation of biomarkers with disease severity in AD patients,
we included and critically appraised a total of 222 articles, reporting on 115 different biomarkers in a total
of 30.063 patients (chapter 2). We found that serum thymus and activation‐regulated chemokine (TARC/
CCL17) levels currently perform best as objective biomarker for disease severity. TARC is a member of the
CC chemokine group and is mainly produced by dendritic cells, although some have suggested that endo-
thelial cells and keratinocytes may also produce TARC.13, 14 TARC is a ligand for CCR4 and plays a role in the
recruitment of CCR4 expressing T cells into the skin.15
The meta-analysis in chapter 2 also taught us that severity biomarkers should not be studied on
a single time point only, but also longitudinally. The reason for that is demonstrated by serum total IgE, which
is the most commonly measured biomarker in AD trials. Meta-analysis of studies investigating the correlation
of total IgE with disease severity showed a moderate correlation when measured on a cross-sectional time
Chapter 12
160
12
point. However, there is no correlation of total IgE with disease severity in longitudinal cohort studies. Thus,
when studying biomarkers for disease severity, a longitudinal study design that includes at least two time
points is essential.
A biomarker of potential interest for disease severity in AD is immunoglobulin free light chain (Ig-
FLC) level measured in serum. Ig-FLC was not included as a biomarker in the meta-analysis in chapter 2,
due to the fact that it’s measured in only two studies. Both studies found increased levels of kappa Ig-FLCs
in the serum of infants with severe AD compared to infants without AD.16, 17 Moreover, levels of Ig-FLCs cor-
related with disease activity in children with severe AD.16 To study Ig-FLCs in adult AD, we measured serum
Ig-FLC levels in 82 moderate to severe AD patients and 49 non-atopic controls (chapter 6). No differences
in serum kappa Ig-FLC levels between adult AD patients and non-atopic controls were found. Serum kappa
Ig-FLC levels did not correlate with disease severity determined by he Six Area Six Sign Atopic Dermatitis
(SASSAD) score or by serum TARC levels. Out of 82 patients, 32 were treated during a clinical admission, in
this subpopulation a second blood sample was taken after two weeks of treatment. These patients showed
a significant reduction in disease severity, but did not show a decrease in serum kappa Ig-FLC levels. This
makes serum kappa Ig-FLC levels not suitable as a biomarker for disease severity in adult patient with AD.
The absence of a correlation between serum Ig-FLC levels and disease severity, does not rule out
a role for Ig-FLCs in the pathogenesis of AD. It has been shown that mast cell-bound Ig-FLC are capable to
bind antigen in vitro, and that antigen-specific Ig-FLCs play a role in eliciting inflammatory responses leading
to contact sensitivity, asthma, IBD, and food allergy in mice.17-20 Although serum Ig-FLC levels are not elevat-
ed in adult AD, they theoretically may play a role in antigen presentation in AD.
IgE responses were thought to be of major importance in the pathogenesis of AD. However, ele-
vated serum IgE levels may also be an epi-phenomenon that reflects the underlying atopic constitution which
is present in the majority of AD patients. This would mean that IgE responses are not directly connected to
the pathophysiology of the chronic and relapsing course of AD, explaining our observations that both total
IgE and kappa Ig-FLC serum levels do not reflect disease severity in AD during follow-up.
Combining multiple biomarkers for the assessment of disease severity in atopic dermatitis
In chapter 2 we showed that serum TARC levels currently performs best as an objective biomarker for
measuring disease severity in AD. The majority of studies included in the meta-analysis that measured serum
TARC levels were cross-sectional cohort studies, only a few studies had a longitudinal design. From experi-
ence in daily practice we know that serum TARC levels show a strong correlation with disease severity in the
follow-up of individual patients.21 However, patients with similar disease severity scores, can show varying
serum TARC levels in cross-sectional cohorts of patients, consequently showing a relatively low correlation
General discussion
161
11
12
between serum TARC and disease severity.21 Although serum TARC level performs relatively good, and is
currently the best performing biomarker available for assessing disease severity in AD, the correlation with
disease severity is not strong enough to replace clinical outcome scores.
Since AD is a complex disease, with a large number of biologic pathways involved in its patho-
genesis, we hypothesized that the use of a combination of biomarkers from different biologic pathways would
better reflect disease activity than a single biomarker.
To test this hypothesis, we performed a pilot study with 17 AD patients with an exacerbation of
AD (chapter 3). All patients were effectively treated with potent topical steroids only, resulting in a significant
decrease of disease severity measured by SASSAD, which was our standard for disease severity measure-
ment at time of this pilot study. Based on the findings in our meta-analysis on biomarkers for disease severity
in AD (chapter 2), a selection of serum biomarkers was measured at admission to our inpatient clinic and
after two weeks of treatment at discharge. Of 31 markers studied, seven of these showed a statistically
significant decrease after treatment. These included TARC, macrophage-derived chemokine (MDC/CCL22),
IL-22, pulmonary and activation-regulated chemokine (PARC/CCL18), sIL-2R, sE-selectin and IL-16. To
assess whether a combination of markers showed a stronger correlation with disease severity, we performed
a stepwise regression analysis with leave one out cross validation. Since the study comprised of 17 randomly
selected patients, the demographic characteristics gender and age were not well balanced and therefore
included as variables in the analysis. This led to the construction of a five-parameter multivariate signature
containing demographic characteristics of gender (sex), and the four serum biomarkers TARC, PARC, IL-22,
sIL-2R. This combination of biomarkers showed a correlation coefficient of 0.86, whereas the correlation
coefficient to disease severity for the individual biomarkers ranged from 0.42 to 0.74. This confirmed our
hypothesis that a combination of biomarkers shows a better correlation with disease severity compared to
individual biomarkers.
Creating a new gold standard for outcome measures in atopic dermatitis
In chapter 3, we learned that a combination of biomarkers performs better than a single biomarker as
outcome measure for disease severity in AD. As a follow-up of these findings we conducted a larger and
prospective study to validate our findings, and create a new (objective) gold standard for outcome measured
in AD (chapter 4). The study in chapter 4 contained two steps: (i) potential new serum biomarkers that cor-
related with disease severity were identified in a retrospective cohort of 193 moderate to severe AD patients,
next (ii) this combination of severity biomarkers was validated in a prospective cohort of 65 AD patients
treated with topical steroids
Step one of the study described in chapter 4 included a retrospective cohort consisting of 193

Chapter 12
162
12
moderate to severe AD patients, in which 150 serum biomarkers were measured. A significant correlation
with SASSAD was found for 32 out of 147 serum biomarkers. Serum TARC levels showed the strongest
correlation with disease severity (r=0.40, p<0.01). Other biomarkers that significantly correlated with dis-
ease severity and had correlation coefficients higher than 0.30 (, PARC, IL-22, sIL-2R, IL-18, I-309/CCL1,
MDC/CCL22, sE-selectin, and SDF-1α) were included in the next step of the study in which we validated our
findings in a prospective AD cohort. The correlation between the biomarkers and disease severity is rather
low in comparison with the findings in our meta-analysis (chapter 2), this is probably due to the high number
of different assessors that scored disease severity.
Step two of the study conducted in chapter 4 included a prospective cohort consisting of 65 pa-
tients, in which disease severity was assessed by EASI, POEM and VAS pruritis, and serum biomarkers were
measured at three timepoints during a two-month treatment period with topical steroids only. All 65 patients
showed significantly decreasing EASI, POEM and VAS pruritis scores during treatment. Serum biomarkers IL-
18, IL-22, I309, MDC, PARC, sE-selectin, sIL-2R and TARC also significantly decreased. Linear mixed model
analyses revealed an optimal combination of TARC, IL-22 and sIL-2R as predictor of EASI scores. This model
was repeatedly tested in ten randomly selected patients out of the 65 patients in the cohort and showed a
correct prediction of EASI scores in 90% of the cases (sensitivity of 100% and specificity of 88.9%) thereby
validating our model.
Interestingly, there were several patients in which clinician rated disease severity (EASI) decreased,
but TARC levels stayed more or less stable. In these patients, the biomarker IL-22 and/or sIL-2R decreased
similarly with EASI. This confirms our hypothesis that a combination of biomarkers that covers multiple
pathways involved in the pathogenesis of AD is better for the assessment of disease severity than a single
biomarker, since not all pathways seem to be equally important in all patients.
In contrast to our pilot study (chapter 3, n=17 patients), serum PARC levels and gender are not included in
the model constructed in chapter 4 (n=65 patients). Although PARC levels highly correlated with disease se-
verity, adding PARC did not improve the model. A possible explanation for this can be the correlation between
serum PARC and serum TARC levels (r=0.43). Both PARC and TARC are members of the cc chemokine
family,15, 22 and may represent overexpression in the same biological pathway. The presence of gender as an
item in the model generated in the pilot study was probably the result of a gender misbalance in the relatively
small patient population.
Another variation between the studies in chapter 3 and 4 is the usage of different clinician rated
outcome measures. At the time that we conducted the pilot study (chapter 3), SASSAD was used as a
standard measure for disease severity of AD in our hospital. Shortly after this study, the HOME initiative
recommended the use of the EASI for measuring disease severity in AD. 9 Therefore, the eventual model
General discussion
163
11
12
for predicting disease severity, as presented in chapter 4, was based on EASI scores. Although the use of
different clinician rated outcome measures is not ideal, SASSAD and EASI scores have been shown to be
highly correlated to each other (r=0.86).23
We showed that a combination of biomarkers is more suitable for follow-up of disease severity
than a single biomarker, since a combination of biomarkers can cover multiple biological pathways. The
biomarkers included in our model (TARC, IL-22 and sIL-2R) are indeed all involved in inflammation and are
known to play a role in the pathogenesis of AD. Although the biomarkers I-309, PARC, MDC, IL-18 and s-E-
selectin were not included in the model, they did show a significant decrease during treatment, and are also
thought to play a role in the pathogenesis of AD. TARC, PARC and MDC are members of the CC chemokine
family and involved in the recruitment of T cells into the skin.15 TARC is mainly produced by dendritic cells
in the dermis,13 whereas PARC is produced by epidermal Langerhans cells and by dendritic cells in the
dermis.22 MDC is also produced by dendritic cells, but CD3+ T lymphocytes in lesional AD skin has also been
shown to express MDC.24
I-309 is another chemokine that has shown to be upregulated in patients with AD. I-309 is
expressed mainly on dendritic cells, mast cells and endothelial cells of the dermis.25 I-309 is the ligand to
CCR8, which promotes the recruitment of T cells and Langerhans cell–like DCs in vitro.25 sE-selectin, an
adhesion molecule expressed on activated endothelial cells, is also involved in the recruitement of immune
cells into the skin. sE-selectin promotes migration of CD4+ and CD8+ T cells and is able to recruit neutrophils
and monocytes.26, 27 The infiltrate of immune cells in lesional AD skin mainly consists of T cells.
IL-18, a member of the IL-1 family, is produced by several immune cells, including monocytes,28
dendritic cells, macrophages,29 and keratinocytes,30 and is known to stimulate T cells to produce Th2
cytokines.31 sIL-2R, synthesized and secreted by T cells, was found to reflect the activation state of the T
cells in skin.32 In our meta-analysis on biomarkers for disease severity (chapter 2) we reported that sIL-2R
levels show good correlation to disease severity, although only studied in small numbers of patients. We now
confirmed in a higher number of AD patients that sIL-2R is indeed a good biomarker for disease severity.
IL-22 has less been studied as biomarker for disease severity, but has been recognized to play a role in
the pathogenesis of AD. IL-22 induces keratinocyte proliferation resulting in acanthosis, a histopathological
feature of AD. It was recently shown that IL-22 is produced by both CD4+ and CD8+ T cells isolated from
lesional skin of AD patients,33 and that IL-22 is upregulated in AD skin compared with psoriasis lesions and
healthy skin.34 In vivo experiments using cultured human keratinocytes have shown that IL-22 downregulates
filaggrin expression contributing to epidermal barrier dysfunction in AD.35 Barrier dysfunction might result in
S. aureus infiltration into the epidermis, which was shown to be correlated with increased expression of IL-
22.36 Mechanistic studies in mice have shown that sIL-22 stimulated keratinocytes produce Th2 cytokines,
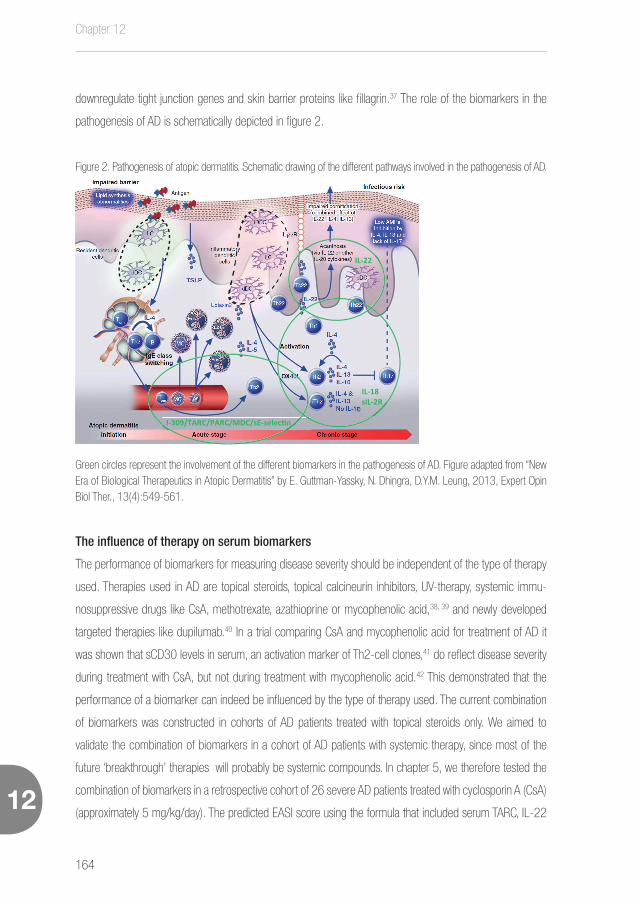
Chapter 12
164
12
downregulate tight junction genes and skin barrier proteins like fillagrin.37 The role of the biomarkers in the
pathogenesis of AD is schematically depicted in figure 2.
Figure 2. Pathogenesis of atopic dermatitis. Schematic drawing of the different pathways involved in the pathogenesis of AD.
I-309/TARC/PARC/MDC/sE-selec�n
IL-18 sIL-2R
IL-22
Green circles represent the involvement of the different biomarkers in the pathogenesis of AD. Figure adapted from “New Era of Biological Therapeutics in Atopic Dermatitis” by E. Guttman-Yassky, N. Dhingra, D.Y.M. Leung, 2013, Expert Opin Biol Ther., 13(4):549-561.
The influence of therapy on serum biomarkers
The performance of biomarkers for measuring disease severity should be independent of the type of therapy
used. Therapies used in AD are topical steroids, topical calcineurin inhibitors, UV-therapy, systemic immu-
nosuppressive drugs like CsA, methotrexate, azathioprine or mycophenolic acid,38, 39 and newly developed
targeted therapies like dupilumab.40 In a trial comparing CsA and mycophenolic acid for treatment of AD it
was shown that sCD30 levels in serum, an activation marker of Th2-cell clones,41 do reflect disease severity
during treatment with CsA, but not during treatment with mycophenolic acid.42 This demonstrated that the
performance of a biomarker can indeed be influenced by the type of therapy used. The current combination
of biomarkers was constructed in cohorts of AD patients treated with topical steroids only. We aimed to
validate the combination of biomarkers in a cohort of AD patients with systemic therapy, since most of the
future ‘breakthrough’ therapies will probably be systemic compounds. In chapter 5, we therefore tested the
combination of biomarkers in a retrospective cohort of 26 severe AD patients treated with cyclosporin A (CsA)
(approximately 5 mg/kg/day). The predicted EASI score using the formula that included serum TARC, IL-22
General discussion
165
11
12
and sIL-2R levels was in agreement with the clinician reported score in 73% of the cases. The combination of
biomarkers showed a sensitivity of 82.6% and a specificity of 88.4% and was therefore qualified as a good
predictor of disease severity. The lower sensitivity and specificity of the model between patients treated with
CsA (chapter 5) compared to patients treated with local topical steroids (chapter 4) is probably due to the dif-
ferent physicians scoring disease severity. In chapter 4, disease severity was assessed by a selected number
of trained physicians regularly filling out EASI scores. The validation of the model in patients treated with CsA
in chapter 5 was based on data from daily practice, in which over 20 physicians with different levels of expe-
rience rated severity using the EASI. This leads to more inter individual variation in EASI scores, consequently
resulting in a lower sensitivity and specificity of the biomarker model. This again highlights the shortcomings
of physician assessed outcomes that will always be subject to inter rater variability, and emphasizes the need
for an objective outcome measures in AD.
Biomarker for itch
In addition to a biomarker model for assessment of disease severity, we sought to identify a biomarker
for objective measurement of itch. Itch is an important characteristic of AD and has a great impact on the
quality of life of patients. Although several questionnaires for measuring itch have been developed, there are
no objective tools available to measure itch. IL-31 has been associated with pruritus in AD, and might be a
potential biomarker for itch.43 To investigate this, we analyzed serum IL-31 levels and measured pruritus using
a visual analogue scale (VAS) in the prospective patient cohort as described in chapter 4. Pruritus scores
significantly decreased during treatment (Figure 3), but serum IL-31 levels did not show a corresponding
decrease. Raap et al. found that serum IL-31 levels correlated to disease severity,44 however, this was a
cross-sectional study that only included 37 AD patients. A longitudinal study by Kyoya et al. showed no sig-
nificant decrease of serum IL-31 levels during effective treatment of AD with topical steroids.45 And a recent
cross-sectional study of Nygaard et al. that included 163 adults and children with AD, was unable to confirm
the correlation between serum IL-31 and disease severity.46 Kim et al. found that IL-31 mRNA expression is
higher in biopsies from AD patients with high pruritus scores compared to patients with low pruritus scores,47
suggesting that measurement of IL-31 in skin may be a more relevant measure for itch. Although IL-31
expression patterns in skin biopsies may also be extremely helpful in stratification, skin biopsies are invasive,
require trained personnel and specialized labs. Measurement of IL-31 in skin is therefore not suitable as an
objective marker for itch in AD.
Disease severity biomarkers in children with atopic dermatitis
Since the prevalence of AD is highest during childhood, applicability of the biomarker signature in the

Chapter 12
166
12
pediatric AD population is of great interest. A clear difference between childhood and adult AD is the clinical
presentation. In newborns, AD presents generally acute, with facial lesions and lesions the extensor surfaces
of the limbs. From age 1–2 years onwards, skin lesions are more polymorphous and particularly seen in
the flexural folds. Lesions in adults are often more lichenified and excoriated, and can be present all over
the body. Adults can also have solitary chronic hand eczema or present with prurigo-like lesions.48 The
differences in clinical presentations during life, raises the question whether the biomarker signature for the
assessment of disease severity in AD, as presented in chapter 3, 4 and 5, that was based on data from
adult AD patients, is applicable in children with AD. Future studies to investigate the performance of our
biomarker signature consisting of TARC, sIL-2R and IL-22 are needed to answer this question, however, one
can speculate on the possible outcome of such studies based on what is known on the performance of the
individual biomarkers in pediatric AD in literature.
In 2003, Leung et al. were the first to show that serum TARC does not only correlate with disease
severity in adult AD, but also correlates with disease severity in children with AD with (age ranging from 0.6 to
4.2 years).49 These findings were confirmed by Song et al. in a big cross-sectional study that included 260
children with both intrinsic and extrinsic AD (mean age 4.9 years).50 That serum TARC does not only correlate
in cross-sectional cohorts of children with AD, but also decreases during effective treatment was shown by
Fujisawa et al. in 2009.51 Interestingly, both Song et al. and Fujisawa et al. showed that serum TARC levels
are negatively correlated with age.50, 51 This means that TARC levels are higher in very young children, which
is probably due to a higher body surface area/blood volume rate in young children. In chapter 4, we have
shown that biomarker levels in adult AD patients are not influenced by age.
Serum sIL-2R levels were shown to be upregulated in children with AD compared to healthy controls by
Matsumota et al.52 Just as serum TARC levels, serum sIL-2R levels were significantly lower in children aged
10-15 years compared to children that were 1-5 years.52 Serum sIL-2R was shown to correlate with disease
severity in children with AD by two independent studies. Frezzolini et al. studied serum sIL-2R in 25 children
with AD, aged 2-8 years, and showed a positive correlation with disease severity measured by SCORing
Atopic Dermatitis (SCORAD).53 Halmerbauer et al. studied serum sIL-2R levels in 20 children with AD, with a
mean age of 13.7 years, and showed a correlation with disease severity, but also showed that serum sIL-2R
decreases during treatment with prednisolone therapy.54
There have been no studies on serum IL-22 levels in children with AD. However, the differences
between T-cell subsets in blood of paediatric and adult AD patients was recently studied by Czarnowicki et
al. in 19 children with AD, with a mean age of 25 months, and 42 adult AD patients.55 AD onset in children
was found to be Th2-dominated, while adult AD extended to additional Th subsets, particularly Th22.55 The
relative absence of Th22 subset in paediatric AD might be explained by the difference in clinical presentation

General discussion
167
11
12
between children and adults with AD. While children have more acute lesions with erythema and dryness,
adults with long-standing disease have marked thickening or lichenification of lesions. IL-22 is known to
induce epidermal hyperplasia,56 which supports a role for IL-22 in disease chronicity and not in disease initi-
ation. Therefore, the performance of serum IL-22 as a biomarker for disease severity might not be as good
in children as in adults.
A biomarker signature for assessment of disease severity in children with AD would be of great
value. However, findings from literature suggest that that are differences in serum biomarker levels between
adults and children. While serum TARC and sIL-2R are shown to be suitable as a biomarker in pediatric AD,
they were also found to be age dependent. Whether serum IL-22 can function as a biomarker in pediatric
AD, especially in young children, needs to be further elucidated. Future studies that study multiple biomarkers
and incorporate the variable age into a biomarker signature for assessment of disease severity in paediatric
AD are needed.
In summary, we showed that a combination of serum biomarkers TARC, IL-22 and sIL-2R offers
an objective and reliable outcome measure in adult AD.
Valorisation
To make a combination of biomarkers suitable for routine use, simplicity and ease of interpretation is key. We
think that serum TARC, IL-22 and sIL-2R levels should not be interpreted separately by the clinician because
it is the combination of these biomarkers that reflects the disease activity. Combining levels of biomarkers
in an algorithm results in a single value that is comparable to EASI and therefore easy to interpret. Since
the algorithm was developed to predict EASI scores, we named this outcome measure the predicted-EASI
(p-EASI). In contrast to EASI, the p-EASI provides an objective outcome measure that is not subjected to
intra- and inter-rater variability.
Currently the HOME initiative recommends to use of a core outcome set to measure disease
severity in AD clinical trials. This core outcome set comprises of four domains: 1. Clinician reported signs,
2. Patient reported symptoms, 3. Quality of Life, and 4. Long term control. We believe that replacing clinician
reported signs with an algorithm based on a serum biomarker combination, like the p-EASI, in this core
outcome set will highly improve outcome measures in AD. With the increasing number of clinical trials
evaluating new biological agents for the treatment of AD, the comparability of study outcomes is of major
importance.
The development of a commercially available assay kit for measuring of TARC, sIL-2R and IL-22,
coupled to the p-EASI algorithm, would enhance the use of the p-EASI in future clinical trials. Such a kit will
provide a convenient and simple tool for objective outcome measures that can be applied in future clinical trials.

Chapter 12
168
12
Future studies
In our studies we mainly included Caucasian patients. Recently it was shown that skin of Asian AD patients
express higher levels of IL-22 than Caucasian patients. If the p-EASI is also valid for use in Asian patients
needs further investigation.
Ideally, disease severity should be rated by a limited number of trained clinicians, to minimize
inter- and intra-variability of the EASI scores. Secondly, the p-EASI should be validated in a cohort of patients
treated with new biologics. The recently published phase II and III trials testing the IL-4Rα targeting antibody
dupilumab have shown promising results. Both EASI scores and serum TARC levels showed a significant
reduction in AD patients treated with dupilumab. The patient cohorts from these studies would offer an ideal
population for validation of the p-EASI. This validation should also include comparison of the performance
of TARC alone with the performance of the p-EASI. After validation in these cohorts, the p-EASI is ready for
application in future clinical trials testing new biological drugs for AD. A final step would be the application of
the p-EASI in daily practice, eventually replacing clinician reported outcomes. Separate studies following the
same steps are needed to develop and validate a biomarker signature for disease severity in paediatric AD.
General discussion
169
11
12
ATOPIC DERMATITIS IS A SYSTEMIC DISEASE
In chapter 9 we showed that levels of many inflammatory cytokines and chemokines in the serum of AD pa-
tients are highly increased compared to healthy controls, resulting in clear differences in biomarker expression
profiles. The presence of inflammatory cytokines in the circulation of AD patients, may have effect on distant
organs and contribute to other systemic diseases. Recent studies have also shown associations between AD
and alopecia areata, neuropsychiatric and cardiovascular diseases (CVD).57
The association between adult AD and CVD, would be consistent with a recent study that showed
the occurrence of severe CVD and metabolic abnormalities in a mouse model of severe dermatitis resulting
from persistent release of IL-1 family cytokines from the skin.58 Interestingly, these pathologies were ame-
liorated by combination treatment with anti–IL-1α- and anti–IL-1β neutralizing antibodies. In chapter 7 we
are the first to show that serum IL-1Rα, IL-1β and IL-1R1 levels are significantly different in AD compared
to healthy controls. This supports the concept of an inflammatory skin march,58, 59 in which spilled-over IL-1s
from inflamed skin end up into the circulation, thereby affecting distant organs and causing cardiovascular
changes. Whether serum levels of IL-1s decrease during treatment, and the subsequent effect on cardiovas-
cular risk factors, is unknown and has yet to be studied.
In chapter 9 we also show that IL-7 serum levels in AD patients are significantly higher than levels
in controls. IL-7 is produced by keratinocytes60 and is essential for T cell development, survival and prolifer-
ation of memory and naive T cells and Th17 cells.61 Transgenic mice constitutively expressing IL-7 develop
severe dermatitis, characterized by massive infiltration of γδ T cells in the dermal lesion.61 In addition, a
polymorphism in the IL-7R gene that lead to enhanced IL-7 bioactivity, was genetically associated to suscep-
tibility to AD.62-64 The same IL-7R polymorphism is associated with higher risk of type I diabetes,65 rheumatoid
arthritis,66 sarcoidosis,67 multiple sclerosis68 and asthma.69 These findings make the IL-7 axis interesting as a
therapeutic target in AD, but also highlight the link between systemic diseases and AD.
Taken together, our study confirms the presence of systemic inflammation in AD patients and
supports the hypothesis that AD is a systemic disorder.
Valorisation
It is known that patients with AD have a higher incidence of allergic asthma, rhinitis and food allergy. Evidence
for a higher incidence of other comorbidities in AD, like rheumatoid arthritis and cardiovascular diseases, is
raising. This emphasizes the need for a multidisciplinary approach for optimal management of AD and its
comorbidities. Examination of AD patients should not be limited to the skin, but should include screening
for comorbidities like asthma, allergic rhinitis, eye involvement, and food allergy. This might need to be ex-

Chapter 12
170
12
tended with screening for rheumatoid arthritis, inflammatory bowel diseases, and cardiovascular risk factors
and diseases. Early detection of comorbid conditions or even identification of patients at risk of developing
comorbidities, can reduce or prevent burden of disease and save future costs of care.
Future studies
The presence of an association between AD and cardiovascular diseases have been shown in epidemio-
logic studies, however, this does not prove causality. Mechanistic studies are needed to reveal mechanisms
of disease associations. Research on the concept of an inflammatory skin march should not be limited to
mouse models, but should also include humans to determine if shedding of IL-1s from inflamed skin really
are biologically active and indeed affects distant organs. A first step would be to investigate if circulating IL-1
levels decrease after effective treatment of skin inflammation.
It has been often hypothesized that impairment of the epidermal barrier is the main pathologic
condition responsible for the atopic march. It has however become more and more clear that immunologic
abnormalities are of major importance in the development of AD. It would be interesting to study if intervention
of these immunologic abnormalities (e.g. with dupilumab) on a very young age can halt the inflammatory skin
march and prevent the development of comorbidities by resetting the immune system.
General discussion
171
11
12
ATOPIC DERMATITIS: A HETEROGENEOUS DISEASE
AD is recognized to be a complex and highly heterogeneous disease, characterized by a diverse clinical
manifestation.1 Classically, clinical characteristics such as age of onset, persistence of disease after child-
hood, and the presence of atopy and presence of other atopic diseases such as allergic rhinitis and asthma
are used to divide AD into different disease phenotypes.70 However, these phenotypical characteristics do
not seem to relate to specific disease mechanisms and have not yet given us new insights in the underlying
pathology of disease.
It has become increasingly clear that AD is not only heterogeneous based on clinical charac-
teristics, but that different underlying pathophysiological processes can be seen in different subgroups of
patients. Serum total IgE was one of the first immunological parameters used for subgrouping of AD, dividing
the disease into non-IgE-associated or ’intrinsic’ and IgE-associated or ’extrinsic’ AD. Other immunological
parameters that can subgroup AD are the presence of specific IgE (sIgE) and eosinophilia.71 The strongest
genetic association with AD has been shown for loss-of-function mutations in the filaggrin gene (FLG). How-
ever, only about one third of the AD patients are carrier of a FLG mutation.72
Due to this heterogeneity, it is unlikely that newly developed biological drugs that target specific
components of the immune system will be effective in all AD patients. To be able to provide the right drug
to the right patient, it is essential to gain better insight into the heterogeneous character of the disease. One
as yet unexplored approach to this would be to classify patients by endotypes. Endotypes are defined as ‘‘a
subtype of a condition, which is defined by a distinct functional or pathophysiological mechanism’’.73 Instead
of stratifying patients into clinical phenotypes, we propose, to stratify patients into endotypes based on distinct
functional or pathophysiological mechanisms (Fig. 3). We suggest that endotyping AD patients will result in
better understanding of the underlying pathomechanisms thereby enabling more targeted, and therefore
more efficient, treatments for individual patients, a step towards precision medicine.
Serum biomarker based patient clusters: a first step towards endotypes in AD
In chapter 7 we showed that by analyzing 150 serum biomarkers in an unbiased, data-driven approach,
patients could be assigned to four distinct clusters. Each cluster was characterised by a specific serum.

Chapter 12
172
12
Biomarker profi le, implying that each of these clusters is driven by a distinct underlying immunopathological
pathway and may represent endotypes with different biological mechanisms. Interestingly, patients in clus-
ter 1 and 4, representing about half of the patients with moderate to severe AD that were included in this
study, showed particularly high Th2-cytokine levels (including IL-4, IL-5, and IL-13). These patients would
hypothetically represent ideal patients for Th2 targeting drugs that are currently being tested, including the
anti-IL-4Rα antibody dupilumab, and anti-IL-13 antibodies lebrikizumab and tralokinumab.74-76 Whilst, both
clusters 1 and 4 have high Th2 cytokines compared to clusters 2 and 3, the elevation of Th2 cytokines is
most pronounced in cluster 4. Furthermore, cluster 1 can be differentiated from each cluster by a very high
expression of PARC . PARC is a chemokine secreted by monocytes and dendritic cells and is involved in the
recruitment of CC chemokine receptor 4 expressing memory T cells.77-79 CCR4 is preferentially expressed on
CLA+CD4+ T cells, which are known to dominate the cell infi ltrate in lesional skin of AD patients.80
Figure 3. Schematic representation of the umbrella term ‘atopic dermatitis’.
Key clinical features such as age of onset, response to treatment, severity, skin infections, the presence of (atopic) comorbid-ities, can be used to classify AD patients into associated phenotypes. Whereas a phenotype is based on observable clinical characteristics, an endotype is a subtype of AD defi ned by a distinct pathophysiological mechanism. In order to endotype patients and identify underlying pathways, studies should follow a multi-layer approach, integrating high-throughput data from genomics, transcriptomics, lipomics, and proteomics. Linking of endotypes to clinical phenotypes and to endotype specifi c biomarkers are crucial, because phenotypes and biomarkers are more accessible to clinicians than endotypes are.

General discussion
173
11
12
The high expression of PARC makes patients in cluster 1 an interesting population for treatment with mogam-
ulizumab, a humanized immunoglobulin monoclonal antibody that targets CCR4. Mogamulizumab was origi-
nally developed for treatment of T-cell leukemia-lymphoma and cutaneous T-cell lymphoma, and is currently
being tested in phase I and II clinical trials.81 Interestingly, cluster 4 shows high expression of TSLP compared
to cluster 1, this might indicate a pathophysiological mechanism in cluster 4 in which TSLP activates dendritic
cells that prime naive T cells towards a Th2 phenotype.82 Thus, patients in cluster 4 could represent those
patients that that would respond to new anti-TSLP biologics currently being tested.
The other two clusters shared a relatively low Th2-cytokine profile and were characterized by a
relatively pauci-inflammatory mediator state (analogous to that seen in Th2-low asthma).83 These clusters
would hypothetically represent patient groups that are not ideal for Th2 targeting drugs. A more comprehen-
sive biological characterisation of disease mechanisms in these patients will be required to allow generation
of more tailored therapeutics. The findings from our study are consistent with recent phase 3 data from the
Th2 targeting drug dupilumab in AD, demonstrating that around half of the patients treated with dupilumab did
not achieve the primary endpoint of reduction in IGA.84 This emphasizes the need for biomarkers to identify
those patients that would most optimally respond to this treatment and even more important those that may
not.
To investigate whether the expression of biomarkers in the four clusters could be linked to specific
immunological pathways, we used a gene set enrichment analysis. This analysis is normally used for gene
expression data. Since we investigated serum biomarker levels and not gene expression in our study, we
coded the serum biomarkers by their gene names. Although we found clear differences in serum biomarkers
expression levels between clusters, we did not find pathways that were specifically expressed in certain
clusters. The pathway analysis showed that leukocyte- and dendritic cell migration pathways and chemotaxis
are expressed in all four clusters. Based on these findings, we concluded that certain pathways may be more
important in driving AD in certain patient clusters, leading to differences in serum biomarker expression, but
that there is no black and white difference between the pathways involved between the four clusters.
A Th2 cytokine that could be of therapeutic interest is IL-5. IL-5 is upregulated in cluster 1,
and particularly in cluster 4. It is a potent cytokine responsible for growth and differentiation of eosinophils
in the bone marrow,85 and stimulates the emigration from bone marrow into peripheral blood.86 A human-
ized monoclonal antibody that recognizes IL-5 (mepolizumab) in AD, explored in a previous study, failed to
demonstrate efficacy.87 In that study, eosinophil counts in blood significantly decreased, but no clinical suc-
cess was reached and the influx of tissue eosinophil numbers in the atopy patch test was not inhibited. How-
ever, four out of 18 patients treated with mepolizumab, did show a significant decrease in disease severity.
Moreover, only a minority of the patients had a peripheral blood eosinophilia at baseline. And maybe even of
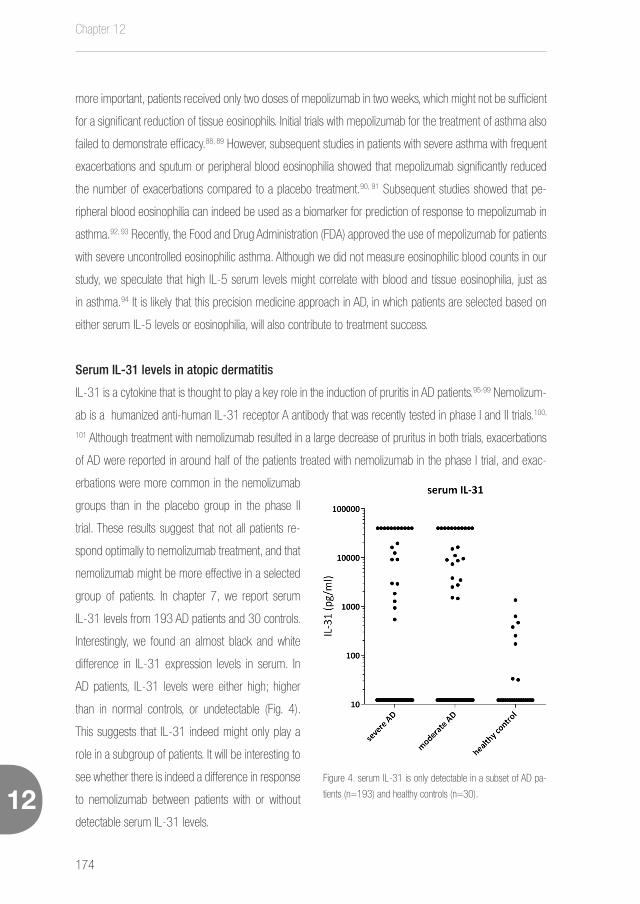
Chapter 12
174
12
more important, patients received only two doses of mepolizumab in two weeks, which might not be sufficient
for a significant reduction of tissue eosinophils. Initial trials with mepolizumab for the treatment of asthma also
failed to demonstrate efficacy.88, 89 However, subsequent studies in patients with severe asthma with frequent
exacerbations and sputum or peripheral blood eosinophilia showed that mepolizumab significantly reduced
the number of exacerbations compared to a placebo treatment.90, 91 Subsequent studies showed that pe-
ripheral blood eosinophilia can indeed be used as a biomarker for prediction of response to mepolizumab in
asthma.92, 93 Recently, the Food and Drug Administration (FDA) approved the use of mepolizumab for patients
with severe uncontrolled eosinophilic asthma. Although we did not measure eosinophilic blood counts in our
study, we speculate that high IL-5 serum levels might correlate with blood and tissue eosinophilia, just as
in asthma.94 It is likely that this precision medicine approach in AD, in which patients are selected based on
either serum IL-5 levels or eosinophilia, will also contribute to treatment success.
Serum IL-31 levels in atopic dermatitis
IL-31 is a cytokine that is thought to play a key role in the induction of pruritis in AD patients.95-99 Nemolizum-
ab is a humanized anti-human IL-31 receptor A antibody that was recently tested in phase I and II trials.100,
101 Although treatment with nemolizumab resulted in a large decrease of pruritus in both trials, exacerbations
of AD were reported in around half of the patients treated with nemolizumab in the phase I trial, and exac-
erbations were more common in the nemolizumab
groups than in the placebo group in the phase II
trial. These results suggest that not all patients re-
spond optimally to nemolizumab treatment, and that
nemolizumab might be more effective in a selected
group of patients. In chapter 7, we report serum
IL-31 levels from 193 AD patients and 30 controls.
Interestingly, we found an almost black and white
difference in IL-31 expression levels in serum. In
AD patients, IL-31 levels were either high; higher
than in normal controls, or undetectable (Fig. 4).
This suggests that IL-31 indeed might only play a
role in a subgroup of patients. It will be interesting to
see whether there is indeed a difference in response
to nemolizumab between patients with or without
detectable serum IL-31 levels.
Figure 4. serum IL-31 is only detectable in a subset of AD pa-
tients (n=193) and healthy controls (n=30).
General discussion
175
11
12
The link between phenotypes and endotypes
Patients with extrinsic AD have high serum IgE levels. Allergen penetration into the skin has been suggested
to result in IgE mediated mast cell activation and release of pro-inflammatory mediators such as histamine
and Th2 cytokines IL-4 and IL-13.102 Other important cell types in the skin that bear IgE receptors and can
contribute to IgE-mediated immune response are epidermal Langerhans cells and inflammatory dendritic epi-
dermal cells.103 Through IgE binding, these cells can take up allergens and activate Th2 cells to produce IL-4
and IL-13.103 Therefore, extrinsic AD has been related to Th2 cytokine pathway activation.102 Remarkably, we
did not find any differences in total IgE levels between the four clusters as described in chapter 7. Neither did
we find a relationship between total serum IgE levels and levels of Th2 cytokines, or differences between the
clusters and biomarkers related to severity including TARC, IL-22 and sIL-2R. We also investigated the pres-
ence of other atopic comorbidities. Although, cluster 1 and 3 showed a slightly higher prevalence of allergic
asthma and rhinitis, we could not find any clear differences in sensitization patterns based on 150 specific
IgE levels between the patient clusters. In conclusion, the Th2 high and low clusters found in our study do not
seem to be related to atopic constitution. These findings are in concordance with a recent study that showed
similar mRNA levels of Th2 cytokines IL-4, IL-5, and IL-13 in lesional skin of both intrinsic and extrinsic
AD patients.104 Moreover, treatment effects in dupilumab trials were found to be similar in both intrinsic and
extrinsic AD patient groups, and while disease severity significantly decreased within two weeks of treatment,
total serum IgE only started to decrease after 12 weeks of treatment with dupilumab.40, 105 The results from
these studies suggest that the link between Th2 type inflammation and atopic constitution that is classically
made, might not be as strong as has been assumed so far. The high levels of total IgE in serum as seen in
AD patients might just be an epiphenomenon reflecting strong Th2 activation in skin.
There have been many attempts to classify AD based on phenotypical characteristics like the
presence of atopic comorbidities.70 However, this has not yet lead to better understanding in the underlying
pathology of disease. We also investigated the relationship between phenotypical characteristics and the dif-
ferent patient clusters found. Next to the classically used characteristics like the presence of atopic comorbid-
ities and age of onset of the disease, we stratified patients into a subset with predominantly chronic lichenified
eczema, and another subset with a predominantly erythematous eczema. This classification is based on our
observations in the clinic from which we got the impression that there are two main subsets of patients; pa-
tients that have a predominantly chronic lichenified eczema, and a second group of patients that present with
a predominantly erythematous eczema. Whilst not reaching statistical significance, cluster 1 and 4, the most
Th2 skewed clusters, tended to have more erythematous skin, while cluster 2 and 3 tended to have a more
chronic lichenified skin. Thus, the implication is that a Th2 driven AD may result in a more erythematous skin
phenotype. Whether Th2 cytokines directly drive this erythematous phenotype or simply represent biomark-
Chapter 12
176
12
ers of an as yet unidentified biological mechanism remains to be elucidated. Similarly, understanding how the
underlying biology of patients in clusters 2 and 3 drives the lichenification process needs further investigation.
Interestingly, the keratinocyte proliferation inducing cytokine IL-22 was significantly higher in cluster 2 than in
the other clusters.106 Induced keratinocyte proliferation microscopically results in acanthosis, and may lead to
a more lichenified eczema phenotype.
Heterogeneity in children with atopic dermatitis
The four clusters described in chapter 7 were identified in adult patients with moderate to severe AD. There
have been no studies investigating endotypes of children with AD. Whether the endotypes that we found in
adult patients will also be present in children with AD is questionable. The clinical presentation of AD in child-
hood and adults is clearly different, as was described previously. These clinical differences, may be the result
of different endotypes presenting at different ages.
Another reason to consider the presence of different or additional endotypes in childhood, is the
fact that AD is transient in the majority of children with AD. Birth cohort studies have suggested that, in up to
70% of cases, AD greatly improves or resolves until late childhood.107, 108 One could speculate that resolving
childhood AD may represent an independent endotype of AD. However, several birth cohort studies have
shown that severity is one of the strongest risk factor for a non resolving AD.107, 108 Therefore, it could also
be the case that endotypes do not differ between adults and children with AD, but that children with resolving
disease suffer from a milder form of AD, irrespective the endotype they belong to. This theory would be in
agreement with our findings in chapter 7, in which we showed that disease severity does not influence cluster
membership of adult AD patients.
In chapter 7, we also showed that patients in two out of four clusters have particularly high levels
of Th2 cytokines (IL-4, IL-5, IL-13). Czarnowicki et al. recently showed that circulating skin-homing T cells
in children with AD (mean age 25 months) are predominantly Th2 type cells, in contrast with adults who also
showed increased Th1 and Th22 populations.55 In a subsequent study by the same group using the same
patient population, disproportionally higher T-cell than B-cell counts were found in skin lesions of pediatric
patients compared to adult patients with AD.109 Data from these studies suggest that Th2 activation plays a
more important role in children with AD, and that Th1 and Th22 activation may be influenced by immune
development and disease chronicity. This may suggest that the presence of Th2 high clusters might be even
more pronounced in paediatric AD than in adult AD.
General discussion
177
11
12
Valorisation
Endotypes may prove useful with the introduction of new targeted therapies, since patients with different en-
dotypes may respond differently to the same treatment. Sub-grouping patients based on a serum biomarker
and blood eosinophils has already been proven to be useful in asthma, where anti-IL-13 therapy appears
to be most effective in the specific subgroup of patients with high serum levels of periostin.110, 111 Similarly,
quantifying blood eosinophils in asthmatics has facilitated the identification of those patients that may best
respond to IL-5 axis targeting drugs, such as mepolizumab and benralizumab.93, 112 The ability to endotype
AD patients may contribute to precision medicine by allowing treatment to be tailored for individual patients.113
This would not only be beneficial for patients, but would also reduce health-care costs.114
Future studies
The patient clusters identified in our study need confirmation in an independent patient population in a pro-
spective study. The current study included 150 serum biomarkers. To avoid selection bias all analytes that
were available in our MultiPlex Facility were included in the study. However, research in our laboratory focuss-
es on chronic inflammatory diseases, which may have resulted in a bias to inflammation related biomarkers
available for multiplex analysis. Advances in high-scale proteomics have led to the possibility of measuring
over 1000 analytes in small amounts of serum.115 Including these techniques in future studies may identify
new biomarkers for endotyping AD. We also did not study gene expression in our patient population. It is
known that AD has a genetic predisposition, the strongest genetic risk factor for AD is a loss of function muta-
tion in the skin barrier gene encoding filaggrin (FLG).72 However, over half of the patient with AD do not carry
this mutation, and 60% of the carriers of a FLG mutation do not develop atopic disease.72 This highlights the
heterogeneous character of AD, making genetic profiling very interesting to include in future studies.
We were unable to identify a clear association between the four clusters and other clinical char-
acteristics like the presence of allergic asthma or rhinitis, or age of onset of the disease. Patients in our study
were selected solely on disease severity (SASSAD), sex and age, no other clinical characteristics peculiar to
AD were considered for selecting patients. Therefore, the absence of an association between the clusters and
other clinical characteristics may be the consequence of the unbalanced presence of these clinical charac-
teristics across the hypothetical endotypes. However, it also highlights the significant challenges in identifying
endotypes with underlying pathophysiological mechanisms based on clinical features such as age of onset
or the presence of other atopic diseases, and suggests that the Th2 high and Th2 low clusters found in our
study do not seem to be related to atopic constitution. The fact that we could not find any clear differences
in sensitization patterns based on 150 specific IgE levels between the patient clusters strengthens this hy-
pothesis. Future studies including detailed clinical data may be able to link clinical characteristics to specific

Chapter 12
178
12
endotypes.
Also, a longitudinal study may provide us additional insights into the stability of biomarkers in a
patient over time. Since AD follows a relapsing and remitting course, it might be possible that biomarker
profiles and corresponding endotypes vary over time, highlighting the need for a prospective study. To answer
the question whether paediatric endotypes show overlap with adult endotypes of AD, longitudinal studies with
follow-up during childhood and adult life are needed.
Interventional clinical trials will be the final step in the confirmation of the different endotypes.
Interventional clinical trials with drugs targeting a specific pathway will help to confirm whether the serum
biomarkers associated with each cluster directly relate to a pathological mechanism and thus confirm clusters
as specific endotypes.
General discussion
179
11
12
IMPROVING THE PERFORMANCE OF IMMUNOSUPPRESSIVE DRUGS USING PHARMACOGENOMIC
BIOMARKERS
The introduction of biologicals will provide new treatment options in AD that could considerably improve
patients’ quality of life.2 However, possible long-term side effects of these biologics are unknown,116 and
biologics still are relatively expensive. Clinicians will have to evaluate the risks, benefits, and costs accordingly.
We expect that even after the introduction of biologics in AD, classic immunosuppressive drugs will still be
used. Firstly, because the high costs of biologics will lead to strict reimbursement criteria. In the Netherlands,
the requirement for reimbursement for biologics in AD will probably include prior treatment with at least one
oral immunosuppressive drug such as CsA. Secondly, we know that in other chronic inflammatory diseases,
like psoriasis, Crohn’s disease and rheumatoid arthritis, immunosuppressive drugs are still regularly prescribed
although many biologics are available.117-119
Cyclosporin A is currently the only registered drug for the treatment of AD in the Netherlands.
Other drugs that are frequently prescribed (off-label) are azathioprine (AZA), methotrexate (MTX), tacrolimus,
and mycophenolic acid (MPA). Pharmacogenetic biomarkers may play a role in optimising the performance
of these drugs. In chapter 8 we studied the relationship between the presence of enzyme uridine diphos-
phate-glucuronosyltransferase 1A9 (UGT1A9) polymorphisms and response to MPA. The efficacy of MPA
in AD has been proven in clinical studies.120 However, in clinical practice, MPA is ineffective in nearly half of
the AD patients.121, 122 In blood, MPA levels are known to have a large inter-individual variability. Low MPA
exposure and increased enzyme activity has been shown to correlate with the presence of UGT1A9 poly-
morphisms in kidney transplant patients, leading to rejection of the transplanted kidney. We hypothesized that
also for AD patients, low MPA exposure due to the presence of UGT1A9 polymorphisms might contribute
to the inefficacy during MPA treatment. Indeed, in chapter 8 we retrospectively showed that pre-treatment
screening for UGT1A9 polymorphisms could have identified 19% of the patients with non-responsiveness to
MPA treatment. The therapeutic strategy in non-responsive UGT1A9 polymorphism carriers would have been
to prescribe a higher dosage of MPA, thereby increasing MPA exposure and possibly lead to better treatment
effect. This study shows the potential benefit of pharmacogenetic screening for UGT1A9 in AD. Prediction of
treatment response to MPA in AD is very valuable, since treatment response can only be determined after
three to four months of treatment.
Pharmacogenetic biomarkers can also be used to optimize the performance of other immuno-
suppressive drugs in the treatment of AD. Bioavailability and systemic clearance of the calcineurin inhibitor
CsA is also mainly controlled by the isoenzymes CYP3A4 and CYP3A5.123 Studies in renal transplant patients
showed that the presence of SNPs in CYP3A4 and CYP3A5 influences blood levels of CsA.124 Pharmacoge-
Chapter 12
180
12
netic testing of SNPs in CYP3A4 and CYP3A5 may also be of use in the treatment of patients with CsA and
needs further investigation.
The performance of tacrolimus, another (off label) calcineurin inhibitor for treatment of AD, can
also be personalized and optimized by pharmacogenetic testing.125 Tacrolimus is extensively metabolized by
CYP3A4 and CYP3A5. The presence of a C>T SNP in intron 6 of CYP3A4 is associated with intermediate or
poor tacrolimus metabolism, resulting in high tacrolimus blood levels. In addition, the carriage of CYP3A5*3
(slow metabolism) and CYP3A5*1 (fast metabolism) alleles also affects tacrolimus metabolism. Expression
analysis of SNPs in the genes for CYP3A4 and CYP3A5 enables classification of AD patients into poor, in-
termediate or extensive metabolizers of tacrolimus.121 This CYP3A4/CYP3A5 genotype cluster classification
can be used to tailor dosing of tacrolimus to the individual patient, and to avoid adverse effects.
Azathioprine is another second line drug that is prescribed off-label for treatment of AD. Just
as MPA, AZA shows a good clinical performance in only half of the patients.122 The performance of AZA
is mainly limited by discontinuation of treatment due to side effects, like gastro-intestinal symptoms and
increased transaminases.122 Studies in inflammatory bowel disease have shown that genetic polymorphisms
in thiopurine methyltransferase (TPMT) influences the metabolism of AZA.126 Genotyping of TPMT prior to the
start of AZA treatment allows identification of those at increased risk for adverse events.126 During treatment,
monitoring of the AZA metabolites 6-thioguanine nucleotides (6-TGN) and 6-methylmercaptopurine ribonu-
cleotides (6-MMPN) can be used for the risk assessment of myelotoxicity and liver toxicity.126 Azathioprine
is another second line drug that is prescribed off-label for treatment of AD. Just as MPA, AZA shows a good
clinical performance in only half of the patients.122 The performance of AZA is mainly limited by discontinua-
tion of treatment due to side effects, like gastoro-intestinal symptoms and increased transaminases.122 During
treatment, monitoring of the AZA metabolites 6-thioguanine nucleotides (6-TGN) and 6-methylmercaptopu-
rine ribonucleotides (6-MMPN) can be used for the risk assessment of myelotoxicity and liver toxicity.126
Valorisation
Although pharmacogenomics are currently scarcely used in dermatologic treatment, it also contributes to
more “personalized medicine” by enabling prescription of drugs based on the genetic makeup of an indi-
vidual. Pharmacogenetic profiling of patients prior to the start of oral immunosuppressive therapy can highly
improve therapy outcome by preventing adverse effects and non-responsiveness to treatment (Figure 4).
This will not only lead to a decrease in the burden of patients, but will also decrease costs.

General discussion
181
11
12
Future studies
To further optimize MPA treatment future research is needed to identify other SNPs and to prospectively study
the relationship between UGT1A9 polymorphisms, MPA blood levels and treatment effect to ensure maximal
effi cacy with minimal side effects.
The relationship between CYP3A4 and CYP3A5 and response to CsA therapy has not yet been
studied in AD patients. Although non-effectiveness is less relevant in patients treated with CsA (±20%),
identifi cation of poor metabolizers of CsA would be of interest, since side effects are the major cause for
discontinuation of CsA treatment in AD patients (±30%).127, 128 In AD patients treated with AZA, evaluation of
the TPMT genotype status and monitoring of 6-TGN and 6-MMPN is of great interest. Pharmacogenomic
profi ling may help identifying those patients to identify at risk of developing severe side effects such as sup-
pression of the bone marrow. Studies that monitor 6-TGN during AZA treatment will give us more insight in
the therapeutic range that is needed for effective treatment of AD.
Figure 5. Pharmacogenomics in atopic dermatitis.
Pharmacogenomics have been defi ned as the study of variability in drug response caused by heredity. Pharmacogenomic research explores the effect of pharmacokinetics, pharmacodynamics, effi cacy, and safety of drug treatments in relation to genome variations. Genetic variations, like single-nucleotide polymorphisms (SNPs), genetic copy number variations, and genomic insertions and deletions can infl uence the response of a patient to a specifi c drug and can be used as biomarkers.

Chapter 12
182
12
IMPROVING PRACTICAL ASPECTS OF BIOMARKER MEASUREMENT
Biomarkers measured in serum of AD patients are the main focus of the studies presented in this thesis.
A disadvantage of serum biomarkers in the need for a venipuncture that can only be performed by trained
personnel. Furthermore, this blood needs to be processed in a lab and must be centrifuged within four hours
of collection, which is costly and not practical. Serum biomarkers are also less favored in pediatric medicine,
especially since AD usually presents in childhood. We explored alternatives sources for biomarker measure-
ment that can be used in both research and daily practice.
Dried blood spots (DBS) might represent a convenient alternative to venipuncture. Dried blood
spots can be obtained using a simple, minimally invasive, nearly painless procedure that can be done by the
patients themselves. DBS can be easily stored and shipped at room temperature until storage in a freezer.
Dried blood spots have been used for decades in screening for inherited metabolic diseases in newborns.129
In chapter 11, we investigated if biomarkers determined in DBS offer a reliable tool for the assessment of
disease severity in AD. Comparison of biomarkers measured in DBS and serum, revealed a very strong
correlation between concentrations of TARC (CCL17), I-309 (CCL1) and MDC (CCL22) levels in DBS and
serum. Interestingly, TARC showed a stronger correlation with disease severity when measured in DBS com-
pared to serum (r=0.68 vs. r= 0.58 respectively).
A higher recovery level of biomarkers in DBS than in serum has previously been shown.130 The
higher recovery levels in DBS are probably due to different biomarker concentrations in capillary blood
compared to venous blood. Dried blood spots are composed of capillary (whole) blood and contain all blood
cells and platelets, which hold many inflammatory analytes, while serum is the fluid remaining after blood
coagulation and contains no blood cells or platelets. It has been shown that platelets from patients with AD
contain high levels of TARC.131 Platelets probably lyse when spotted on filter paper, consequently releasing
their content, which can be measured in eluted samples. This may contribute to the strong correlation be-
tween DBS TARC and disease severity.
In serum, we showed that a combination of the biomarkers TARC, sIL-2R and IL-22 performs
better in assessing disease severity than a single biomarker (chapter 3 and 4). Levels of sIL-2R and IL-22
measured in DBS only weakly correlated with disease severity and did not decrease during effective treat-
ment with topical steroids. Therefore, sIL-2R and IL-22 measured in DBS are not suitable as a biomarker
for disease severity. The differences between sIL-2R and IL-22 in serum and DBS may be explained by the
effect that spotting onto filter paper could have on analytes; analytes might bind to the paper or undergo
structural changes during DBS formation.72, 132 We did find other biomarkers, besides TARC, in DBS that cor-
related with disease severity and significantly decreases during treatment: I-309, PARC and MDC. However,
General discussion
183
11
12
including these biomarkers in a linear mixed model analysis for prediction of EASI scores did not improve the
model. We noticed that TARC levels measured in DBS highly correlated with I-309, PARC and MDC levels
measured in DBS. These correlations may explain why adding I-309, PARC or MDC into a prediction model
adds no value to a model that includes TARC.
In chapter 11, the stability of biomarkers in DBS was also demonstrated. Levels of TARC mea-
sured in DBS stayed stable irrespective of the amount of days (1, 3 or 7 days) left at room temperature be-
fore storing at -20 ̊C. TARC levels in DBS stored over two years at -80 ̊C remained stable as well. A previous
study showed that cytokine levels in DBS remain stable up to 23 years when stored at -24˚C.133 Moreover,
we showed that TARC levels in DBS are detectable in equal concentrations regardless of repeated freeze/
thaw cycles.
The easy collection and stability of DBS offer a huge simplification in storage and transport. The
stability of DBS at room temperature reduces sample transportation and storage costs. Dried blood spots
are safer to transport and considered as non-regulated and exempt material, which allows shipping of DBS
through mail or courier.134 The long term stability of biomarkers in DBS and small volume, makes DBS ideal
for biobanking and multi-center trials.
In conclusion, DBS offer a offer a simple and minimally invasive and low-cost method for mea-
surement of a selection of biomarkers and provide a tool for objective severity outcome measurements in AD
that can easily be applied in clinical trials and daily practice.
Valorisation
We showed that TARC measured in DBS offers an objective assessment of disease severity in AD. Combining
TARC measurement in DBS with a patient oriented outcome measure like POEM, offers a reliable tool for
monitoring disease activity and burden of disease in AD.
Disease severity assessment by physicians during consultations in the hospital, can be replaced
by DBS biomarkers and patient assessed outcomes. This facilitates distant monitoring of patients, reducing
the number of face-to-face consultations and saving costs and time for patients and society.
Patients treated with oral immunosuppressive drugs regularly visit the hospital for to monitoring of
side effects and laboratory testing. The frequency of these visits can be reduced by the use of DBS. Mea-
surement of drug concentrations in DBS is possible in a range of drugs,135 including CsA,136-139 mycophenolic
acid,140 and tacrolimus,139, 141, 142 drugs which are frequently prescribed in AD treatment.143 Measurement of
creatinine levels in DBS has also been described.142 Since decrease in kidney function is one of the most
common adverse effects in CsA treatment, measurement of creatinine levels in DBS can be very interesting
for the follow-up of AD patients treated with CsA. Combining measurement of drug concentrations in DBS

Chapter 12
184
12
with disease severity biomarkers would be ideal for home follow-up and can improve patient care by individ-
ually adjusting dosages, but would also be of great interest in clinical trials.
Future studies
Dried blood spots offer an interesting tool for studying early changes in biomarker profile during a flare of AD.
If a patient experiences a flare, it happens quite often that by the time the patient attends for an appointment,
the flare has subsided or have passed into a chronic severe state of disease. If patients are instructed to col-
lect DBS in the first days of a flare, a lag period between flare commencement and time to be able to consult
primary care physician can be avoided. Biomarker profiles measured in DBS during early flare stages might
identification novel pathways that contribute to disease pathogenesis and flaring of AD.
General discussion
185
11
12
FUTURE PERSPECTIVES
We think that the increased application of biomarkers in AD research will result in better characterization
and stratification of patients, and will give a better understanding of the underlying pathomechanisms in AD.
Furthermore, it will result in objective outcome measures that will allow better comparison of current and
new treatments. We hypothesize that in the near future, patients with AD will be stratified based on biomarker
expression levels in body fluids (blood/saliva/tears), and tissue (biopsies/skin strips), on genetic variants, or
combined biomarker expression patterns (composite biomarker scores). With many new targeted therapies
currently investigated in phase I to III clinical trials, biomarkers will lead to better identification of patients that
can benefit from these highly specific, but expensive new treatments. In addition to a role for biomarkers in
new treatments, the use of pharmacogenomic biomarkers, can highly improve effectivity of currently used oral
immunosuppressive drugs in AD. Measurement of biomarkers in alternative sources , such as DBS, facilitates
distant monitoring, which is more convenient for patients and reduces healthcare costs. We believe that the
application of biomarkers in AD is essential in moving forward to predictive, personalized, preventive, and
participatory medicine.
Chapter 12
186
12
REFERENCES
1. Eyerich K, Novak N. Immunology of atopic eczema: overcoming the Th1/Th2 paradigm. Allergy 2013; 68:974-82.
2. Boyman O, Kaegi C, Akdis M, Bavbek S, Bossios A, Chatzipetrou A, et al. EAACI IG Biologicals task force paper on the use
of biologic agents in allergic disorders. Allergy 2015; 70:727-54.
3. Williams H, Stewart A, von Mutius E, Cookson W, Anderson HR. Is eczema really on the increase worldwide? J Allergy Clin
Immunol 2008; 121:947-54 e15.
4. Deckers IA, McLean S, Linssen S, Mommers M, van Schayck CP, Sheikh A. Investigating international time trends in the
incidence and prevalence of atopic eczema 1990-2010: a systematic review of epidemiological studies. PLoS One 2012;
7:e39803.
5. Zuberbier T, Lotvall J, Simoens S, Subramanian SV, Church MK. Economic burden of inadequate management of allergic
diseases in the European Union: a GA(2) LEN review. Allergy 2014; 69:1275-9.
6. Simpson EL, Bieber T, Eckert L, Wu R, Ardeleanu M, Graham NM, et al. Patient burden of moderate to severe atopic
dermatitis (AD): Insights from a phase 2b clinical trial of dupilumab in adults. J Am Acad Dermatol 2016; 74:491-8.
7. Charman C, Chambers C, Williams H. Measuring atopic dermatitis severity in randomized controlled clinical trials: what
exactly are we measuring? J Invest Dermatol 2003; 120:932-41.
8. Schmitt J, Langan S, Williams HC. What are the best outcome measurements for atopic eczema? A systematic review. J
Allergy Clin Immunol 2007; 120:1389-98.
9. Schmitt J, Spuls PI, Thomas KS, Simpson E, Furue M, Deckert S, et al. The Harmonising Outcome Measures for Eczema
(HOME) statement to assess clinical signs of atopic eczema in trials. J Allergy Clin Immunol 2014; 134:800-7.
10. Chalmers JR, Simpson E, Apfelbacher CJ, Thomas KS, von Kobyletzki L, Schmitt J, et al. Report from the fourth inter-
national consensus meeting to harmonize core outcome measures for atopic eczema/dermatitis clinical trials (HOME
initiative). Br J Dermatol 2016; 175:69-79.
11. Charman CR, Venn AJ, Williams HC. Measurement of body surface area involvement in atopic eczema: an impossible task?
Br J Dermatol 1999; 140:109-11.
12. Zhao CY, Tran AQ, Lazo-Dizon JP, Kim J, Daniel BS, Venugopal SS, et al. A pilot comparison study of four clinician-rated
atopic dermatitis severity scales. Br J Dermatol 2015; 173:488-97.
13. Kakinuma T, Nakamura K, Wakugawa M, Mitsui H, Tada Y, Saeki H, et al. Thymus and activation-regulated chemokine in
atopic dermatitis: Serum thymus and activation-regulated chemokine level is closely related with disease activity. J Allergy
Clin Immunol 2001; 107:535-41.
14. Zheng X, Nakamura K, Furukawa H, Nishibu A, Takahashi M, Tojo M, et al. Demonstration of TARC and CCR4 mRNA
expression and distribution using in situ RT-PCR in the lesional skin of atopic dermatitis. J Dermatol 2003; 30:26-32.
15. Imai T, Nagira M, Takagi S, Kakizaki M, Nishimura M, Wang J, et al. Selective recruitment of CCR4-bearing Th2 cells toward

General discussion
187
11
12
antigen-presenting cells by the CC chemokines thymus and activation-regulated chemokine and macrophage-derived
chemokine. Int Immunol 1999; 11:81-8.
16. Kayserova J, Capkova S, Skalicka A, Vernerova E, Polouckova A, Malinova V, et al. Serum immunoglobulin free light chains
in severe forms of atopic dermatitis. Scand J Immunol 2010; 71:312-6.
17. Schouten B, van Esch BC, van Thuijl AO, Blokhuis BR, Groot Kormelink T, Hofman GA, et al. Contribution of IgE and immu-
noglobulin free light chain in the allergic reaction to cow’s milk proteins. J Allergy Clin Immunol 2010; 125:1308-14.
18. Rijnierse A, Redegeld FA, Blokhuis BR, Van der Heijden MW, Te Velde AA, Pronk I, et al. Ig-free light chains play a crucial
role in murine mast cell-dependent colitis and are associated with human inflammatory bowel diseases. J Immunol 2010;
185:653-9.
19. Kraneveld AD, Kool M, van Houwelingen AH, Roholl P, Solomon A, Postma DS, et al. Elicitation of allergic asthma by
immunoglobulin free light chains. Proc Natl Acad Sci U S A 2005; 102:1578-83.
20. Redegeld FA, van der Heijden MW, Kool M, Heijdra BM, Garssen J, Kraneveld AD, et al. Immunoglobulin-free light chains
elicit immediate hypersensitivity-like responses. Nat Med 2002; 8:694-701.
21. Landheer J, de Bruin-Weller M, Boonacker C, Hijnen D, Bruijnzeel-Koomen C, Rockmann H. Utility of serum thymus and
activation-regulated chemokine as a biomarker for monitoring of atopic dermatitis severity. J Am Acad Dermatol 2014;
71:1160-6.
22. Pivarcsi A, Gombert M, Dieu-Nosjean MC, Lauerma A, Kubitza R, Meller S, et al. CC chemokine ligand 18, an atopic der-
matitis-associated and dendritic cell-derived chemokine, is regulated by staphylococcal products and allergen exposure. J
Immunol 2004; 173:5810-7.
23. Yang HJ, Jeon YH, Pyun BY. Evaluation of patient’s subjective severity using various scoring system in Korean children with
atopic dermatitis. Asian Pac J Allergy Immunol 2010; 28:130-5.
24. Galli G, Chantry D, Annunziato F, Romagnani P, Cosmi L, Lazzeri E, et al. Macrophage-derived chemokine production by
activated human T cells in vitro and in vivo: preferential association with the production of type 2 cytokines. Eur J Immunol
2000; 30:204-10.
25. Gombert M, Dieu-Nosjean MC, Winterberg F, Bunemann E, Kubitza RC, Da Cunha L, et al. CCL1-CCR8 interactions: an
axis mediating the recruitment of T cells and Langerhans-type dendritic cells to sites of atopic skin inflammation. J Immunol
2005; 174:5082-91.
26. Morita H, Kitano Y, Kawasaki N. Elevation of serum-soluble E-selectin in atopic dermatitis. J Dermatol Sci 1995; 10:145-
50.
27. Wolkerstorfer A, Laan MP, Savelkoul HF, Neijens HJ, Mulder PG, Oudesluys-Murphy AM, et al. Soluble E-selectin, other
markers of inflammation and disease severity in children with atopic dermatitis. Br J Dermatol 1998; 138:431-5.
28. Ushio S, Namba M, Okura T, Hattori K, Nukada Y, Akita K, et al. Cloning of the cDNA for human IFN-gamma-inducing factor,
expression in Escherichia coli, and studies on the biologic activities of the protein. J Immunol 1996; 156:4274-9.

Chapter 12
188
12
29. Stoll S, Jonuleit H, Schmitt E, Muller G, Yamauchi H, Kurimoto M, et al. Production of functional IL-18 by different subtypes
of murine and human dendritic cells (DC): DC-derived IL-18 enhances IL-12-dependent Th1 development. Eur J Immunol
1998; 28:3231-9.
30. Stoll S, Muller G, Kurimoto M, Saloga J, Tanimoto T, Yamauchi H, et al. Production of IL-18 (IFN-gamma-inducing factor)
messenger RNA and functional protein by murine keratinocytes. J Immunol 1997; 159:298-302.
31. Hoshino T, Yagita H, Ortaldo JR, Wiltrout RH, Young HA. In vivo administration of IL-18 can induce IgE production through
Th2 cytokine induction and up-regulation of CD40 ligand (CD154) expression on CD4(+) T cells. European Journal of
Immunology 2000; 30:1998-2006.
32. Walker C, Kagi MK, Ingold P, Braun P, Blaser K, Bruijnzeel-Koomen CA, et al. Atopic dermatitis: correlation of peripheral
blood T cell activation, eosinophilia and serum factors with clinical severity. Clin Exp Allergy 1993; 23:145-53.
33. Hijnen D, Knol EF, Gent YY, Giovannone B, Beijn SJ, Kupper TS, et al. CD8(+) T cells in the lesional skin of atopic der-
matitis and psoriasis patients are an important source of IFN-gamma, IL-13, IL-17, and IL-22. J Invest Dermatol 2013;
133:973-9.
34. Nograles KE, Zaba LC, Shemer A, Fuentes-Duculan J, Cardinale I, Kikuchi T, et al. IL-22-producing “T22” T cells account
for upregulated IL-22 in atopic dermatitis despite reduced IL-17-producing TH17 T cells. J Allergy Clin Immunol 2009;
123:1244-52 e2.
35. Gutowska-Owsiak D, Schaupp AL, Salimi M, Taylor S, Ogg GS. Interleukin-22 downregulates filaggrin expression and
affects expression of profilaggrin processing enzymes. Br J Dermatol 2011; 165:492-8.
36. Nakatsuji T, Chen TH, Two AM, Chun KA, Narala S, Geha RS, et al. Staphylococcus aureus Exploits Epidermal Barrier
Defects in Atopic Dermatitis to Trigger Cytokine Expression. J Invest Dermatol 2016; 136:2192-200.
37. Lou H, Lu J, Choi EB, Oh MH, Jeong M, Barmettler S, et al. Expression of IL-22 in the Skin Causes Th2-Biased Immunity,
Epidermal Barrier Dysfunction, and Pruritus via Stimulating Epithelial Th2 Cytokines and the GRP Pathway. J Immunol
2017.
38. Ring J, Alomar A, Bieber T, Deleuran M, Fink-Wagner A, Gelmetti C, et al. Guidelines for treatment of atopic eczema (atopic
dermatitis) Part II. J Eur Acad Dermatol Venereol 2012; 26:1176-93.
39. Ring J, Alomar A, Bieber T, Deleuran M, Fink-Wagner A, Gelmetti C, et al. Guidelines for treatment of atopic eczema (atopic
dermatitis) part I. J Eur Acad Dermatol Venereol 2012; 26:1045-60.
40. Beck LA, Thaci D, Hamilton JD, Graham NM, Bieber T, Rocklin R, et al. Dupilumab treatment in adults with moderate-to-se-
vere atopic dermatitis. N Engl J Med 2014; 371:130-9.
41. DElios MM, Romagnani P, Scaletti C, Annunziato F, Manghetti M, Mavilia C, et al. In vivo CD30 expression in human
diseases with predominant activation of Th2-like T cells. Journal of Leukocyte Biology 1997; 61:539-44.
42. Kwakkel-van Erp JM, Haeck IM, Paantjens AW, van de Graaf EA, van Ginkel WG, Knol MJ, et al. Differential usefulness of
biomarkers thymus and activation-regulated chemokine and soluble CD30 during enteric coated mycophenolate sodium

General discussion
189
11
12
and cyclosporine therapy in atopic dermatitis. J Am Acad Dermatol 2010; 63:e70-2.
43. Mollanazar NK, Smith PK, Yosipovitch G. Mediators of Chronic Pruritus in Atopic Dermatitis: Getting the Itch Out? Clin Rev
Allergy Immunol 2016; 51:263-92.
44. Raap U, Wichmann K, Bruder M, Stander S, Wedi B, Kapp A, et al. Correlation of IL-31 serum levels with severity of atopic
dermatitis. J Allergy Clin Immunol 2008; 122:421-3.
45. Kyoya M, Kawakami T, Soma Y. Serum thymus and activation-regulated chemokine (TARC) and interleukin-31 levels as
biomarkers for monitoring in adult atopic dermatitis. J Dermatol Sci 2014; 75:204-7.
46. Nygaard U, Hvid M, Johansen C, Buchner M, Folster-Holst R, Deleuran M, et al. TSLP, IL-31, IL-33 and sST2 are new
biomarkers in endophenotypic profiling of adult and childhood atopic dermatitis. J Eur Acad Dermatol Venereol 2016;
30:1930-8.
47. Kim S, Kim HJ, Yang HS, Kim E, Huh IS, Yang JM. IL-31 Serum Protein and Tissue mRNA Levels in Patients with Atopic
Dermatitis. Ann Dermatol 2011; 23:468-73.
48. Weidinger S, Novak N. Atopic dermatitis. Lancet 2016; 387:1109-22.
49. Leung TF, Ma KC, Hon KL, Lam CW, Wan H, Li CY, et al. Serum concentration of macrophage-derived chemokine may
be a useful inflammatory marker for assessing severity of atopic dermatitis in infants and young children. Pediatr Allergy
Immunol 2003; 14:296-301.
50. Song TW, Sohn MH, Kim ES, Kim KW, Kim KE. Increased serum thymus and activation-regulated chemokine and cutane-
ous T cell-attracting chemokine levels in children with atopic dermatitis. Clin Exp Allergy 2006; 36:346-51.
51. Fujisawa T, Nagao M, Hiraguchi Y, Katsumata H, Nishimori H, Iguchi K, et al. Serum measurement of thymus and acti-
vation-regulated chemokine/CCL17 in children with atopic dermatitis: elevated normal levels in infancy and age-specific
analysis in atopic dermatitis. Pediatr Allergy Immunol 2009; 20:633-41.
52. Matsumoto T, Miike T, Yamaguchi K, Murakami M, Kawabe T, Yodoi J. Serum levels of soluble IL-2 receptor, IL-4 and
IgE-binding factors in childhood allergic diseases. Clin Exp Immunol 1991; 85:288-92.
53. Frezzolini A, Paradisi M, Ruffelli M, Cadoni S, De Pita O. Soluble CD30 in pediatric patients with atopic dermatitis. Allergy
1997; 52:106-9.
54. Halmerbauer G, Frischer T, Koller DY. Monitoring of disease activity by measurement of inflammatory markers in atopic
dermatitis in childhood. Allergy 1997; 52:765-9.
55. Czarnowicki T, Esaki H, Gonzalez J, Malajian D, Shemer A, Noda S, et al. Early pediatric atopic dermatitis shows only a
cutaneous lymphocyte antigen (CLA) 1 T(H)2/T(H)1 cell imbalance, whereas adults acquire CLA1(+) T(H)22/T(C)22 cell
subsets. Journal of Allergy and Clinical Immunology 2015; 136:941-+.
56. Boniface K, Bernard FX, Garcia M, Gurney AL, Lecron JC, Morel F. IL-22 inhibits epidermal differentiation and induces
proinflammatory gene expression and migration of human keratinocytes. J Immunol 2005; 174:3695-702.
57. Brunner PM, Silverberg JI, Guttman-Yassky E, Paller AS, Kabashima K, Amagai M, et al. Increasing Comorbidities Suggest

Chapter 12
190
12
that Atopic Dermatitis Is a Systemic Disorder. Journal of Investigative Dermatology 2017; 137:18-25.
58. Yamanaka K, Nakanishi T, Saito H, Maruyama J, Isoda K, Yokochi A, et al. Persistent release of IL-1s from skin is associated
with systemic cardio-vascular disease, emaciation and systemic amyloidosis: the potential of anti-IL-1 therapy for systemic
inflammatory diseases. PLoS One 2014; 9:e104479.
59. Boehncke WH, Boehncke S, Tobin AM, Kirby B. The ‘psoriatic march’: a concept of how severe psoriasis may drive car-
diovascular comorbidity. Exp Dermatol 2011; 20:303-7.
60. Heufler C, Topar G, Grasseger A, Stanzl U, Koch F, Romani N, et al. Interleukin-7 Is Produced by Murine and Human
Keratinocytes. Journal of Experimental Medicine 1993; 178:1109-14.
61. Mazzucchelli RI, Riva A, Durum SK. The human IL-7 receptor gene: deletions, polymorphisms and mutations. Semin
Immunol 2012; 24:225-30.
62. Hoffjan S, Beygo J, Akkad DA, Parwez Q, Petrasch-Parwez E, Epplen JT. Analysis of variation in the IL7RA and IL2RA
genes in atopic dermatitis. Journal of Dermatological Science 2009; 55:138-40.
63. Paternoster L, Standl M, Waage J, Baurecht H, Hotze M, Strachan DP, et al. Multi-ancestry genome-wide association study
of 21,000 cases and 95,000 controls identifies new risk loci for atopic dermatitis. Nature Genetics 2015; 47:1449-+.
64. Lundstrom W, Highfill S, Walsh ST, Beq S, Morse E, Kockum I, et al. Soluble IL7Ralpha potentiates IL-7 bioactivity and
promotes autoimmunity. Proc Natl Acad Sci U S A 2013; 110:E1761-70.
65. Todd JA, Walker NM, Cooper JD, Smyth DJ, Downes K, Plagnol V, et al. Robust associations of four new chromosome
regions from genome-wide analyses of type 1 diabetes. Nat Genet 2007; 39:857-64.
66. O’Doherty C, Alloza I, Rooney M, Vandenbroeck K. IL7RA polymorphisms and chronic inflammatory arthropathies. Tissue
Antigens 2009; 74:429-31.
67. Heron M, Grutters JC, Van Moorsel CH, Ruven HJ, Kazemier KM, Claessen AM, et al. Effect of variation in ITGAE on risk of
sarcoidosis, CD103 expression, and chest radiography. Clin Immunol 2009; 133:117-25.
68. Gregory SG, Schmidt S, Seth P, Oksenberg JR, Hart J, Prokop A, et al. Interleukin 7 receptor alpha chain (IL7R) shows
allelic and functional association with multiple sclerosis. Nat Genet 2007; 39:1083-91.
69. Kurz T, Hoffjan S, Hayes MG, Schneider D, Nicolae R, Heinzmann A, et al. Fine mapping and positional candidate studies
on chromosome 5p13 identify multiple asthma susceptibility loci. J Allergy Clin Immunol 2006; 118:396-402.
70. Bieber T. Atopic dermatitis 2.0: from the clinical phenotype to the molecular taxonomy and stratified medicine. Allergy
2012; 67:1475-82.
71. Bieber T, Cork M, Reitamo S. Atopic dermatitis: a candidate for disease-modifying strategy. Allergy 2012; 67:969-75.
72. Irvine AD, McLean WH, Leung DY. Filaggrin mutations associated with skin and allergic diseases. N Engl J Med 2011;
365:1315-27.
73. Lotvall J, Akdis CA, Bacharier LB, Bjermer L, Casale TB, Custovic A, et al. Asthma endotypes: A new approach to classifi-
cation of disease entities within the asthma syndrome. Journal of Allergy and Clinical Immunology 2011; 127:355-60.

General discussion
191
11
12
74. A Study to Assess the Efficacy and Safety of Dupilumab in Patients With Severe Atopic Dermatitis (AD) That Are Not
Controlled With Oral Cyclosporine A (CSA) or for Those Who Cannot Take Oral CSA Because it is Not Medically Advisable.]
Available from https://www.clinicaltrials.gov/ct2/show/NCT02755649.
75. A Study to Evaluate the Safety of Lebrikizumab Compared to Topical Corticosteroids in Adult Patients With Atopic Derma-
titis.] Available from https://clinicaltrials.gov/ct2/show/NCT02465606: Hoffmann-La Roche.
76. Phase 2 Study to Evaluate the Efficacy and Safety of Tralokinumab in Adults With Atopic Dermatitis (D2213C00001).]
Available from https://www.clinicaltrials.gov/ct2/show/NCT02347176.
77. Adema GJ, Hartgers F, Verstraten R, deVries E, Marland G, Menon S, et al. A dendritic-cell-derived C-C chemokine that
preferentially attracts naive T cells. Nature 1997; 387:713-7.
78. Gunther C, Bello-Fernandez C, Kopp T, Kund J, Carballido-Perrig N, Hinteregger S, et al. CCL18 is expressed in atopic
dermatitis and mediates skin homing of human memory T cells. J Immunol 2005; 174:1723-8.
79. Chenivesse C, Chang Y, Azzaoui I, Ait Yahia S, Morales O, Ple C, et al. Pulmonary CCL18 recruits human regulatory T cells.
J Immunol 2012; 189:128-37.
80. Wakugawa M, Nakamura K, Kakinuma T, Onai N, Matsushima K, Tamaki K. CC chemokine receptor 4 expression on
peripheral blood CD4(+) T cells reflects disease activity of atopic dermatitis. Journal of Investigative Dermatology 2001;
117:188-96.
81. Ogura M, Ishida T, Hatake K, Taniwaki M, Ando K, Tobinai K, et al. Multicenter Phase II Study of Mogamulizumab ( KW-
0761), a Defucosylated Anti-CC Chemokine Receptor 4 Antibody, in Patients With Relapsed Peripheral T-Cell Lymphoma
and Cutaneous T-Cell Lymphoma. Journal of Clinical Oncology 2014; 32:1157-+.
82. Soumelis V, Reche PA, Kanzler H, Yuan W, Edward G, Homey B, et al. Human epithelial cells trigger dendritic cell mediated
allergic inflammation by producing TSLP. Nat Immunol 2002; 3:673-80.
83. Fahy JV. Type 2 inflammation in asthma--present in most, absent in many. Nat Rev Immunol 2015; 15:57-65.
84. Simpson EL, Bieber T, Guttman-Yassky E, Beck LA, Blauvelt A, Cork MJ, et al. Two Phase 3 Trials of Dupilumab versus
Placebo in Atopic Dermatitis. N Engl J Med 2016.
85. Sanderson CJ. Interleukin-5, eosinophils, and disease. Blood 1992; 79:3101-9.
86. Collins PD, Marleau S, Griffiths-Johnson DA, Jose PJ, Williams TJ. Cooperation between interleukin-5 and the chemokine
eotaxin to induce eosinophil accumulation in vivo. J Exp Med 1995; 182:1169-74.
87. Oldhoff JM, Darsow U, Werfel T, Katzer K, Wulf A, Laifaoui J, et al. Anti-IL-5 recombinant humanized monoclonal antibody
(mepolizumab) for the treatment of atopic dermatitis. Allergy 2005; 60:693-6.
88. Flood-Page P, Swenson C, Faiferman I, Matthews J, Williams M, Brannick L, et al. A study to evaluate safety and efficacy
of mepolizumab in patients with moderate persistent asthma. Am J Respir Crit Care Med 2007; 176:1062-71.
89. Leckie MJ, ten Brinke A, Khan J, Diamant Z, O’Connor BJ, Walls CM, et al. Effects of an interleukin-5 blocking monoclonal
antibody on eosinophils, airway hyper-responsiveness, and the late asthmatic response. Lancet 2000; 356:2144-8.

Chapter 12
192
12
90. Nair P, Pizzichini MM, Kjarsgaard M, Inman MD, Efthimiadis A, Pizzichini E, et al. Mepolizumab for prednisone-dependent
asthma with sputum eosinophilia. N Engl J Med 2009; 360:985-93.
91. Ortega H, Chupp G, Bardin P, Bourdin A, Garcia G, Hartley B, et al. The role of mepolizumab in atopic and nonatopic severe
asthma with persistent eosinophilia. Eur Respir J 2014; 44:239-41.
92. Ortega HG, Liu MC, Pavord ID, Brusselle GG, FitzGerald JM, Chetta A, et al. Mepolizumab treatment in patients with severe
eosinophilic asthma. N Engl J Med 2014; 371:1198-207.
93. Pavord ID, Korn S, Howarth P, Bleecker ER, Buhl R, Keene ON, et al. Mepolizumab for severe eosinophilic asthma
(DREAM): a multicentre, double-blind, placebo-controlled trial. Lancet 2012; 380:651-9.
94. Walker C, Bode E, Boer L, Hansel TT, Blaser K, Virchow JC. Allergic and Nonallergic Asthmatics Have Distinct Patterns of
T-Cell Activation and Cytokine Production in Peripheral-Blood and Bronchoalveolar Lavage. American Review of Respira-
tory Disease 1992; 146:109-15.
95. Bilsborough J, Leung DYM, Maurer M, Howell M, Boguniewcz M, Yao L, et al. IL-31 is associated with cutaneous lym-
phocyte antigen-positive skin homing T cells in patients with atopic dermatitis. Journal of Allergy and Clinical Immunology
2006; 117:418-25.
96. Cevikbas F, Wang XD, Akiyama T, Kempkes C, Savinko T, Antal A, et al. A sensory neuron-expressed IL-31 receptor me-
diates T helper cell-dependent itch: Involvement of TRPV1 and TRPA1. Journal of Allergy and Clinical Immunology 2014;
133:448-+.
97. Nobbe S, Dziunycz P, Muhleisen B, Bilsborough J, Dillon SR, French LE, et al. IL-31 Expression by Inflammatory Cells is
Preferentially Elevated in Atopic Dermatitis. Acta Dermato-Venereologica 2012; 92:24-8.
98. Sonkoly E, Muller A, Lauerma AI, Pivarcsi A, Soto H, Kemeny L, et al. IL-31: A new link between T cells and pruritus in
atopic skin inflammation. Journal of Allergy and Clinical Immunology 2006; 117:411-7.
99. Szegedi K, Kremer AE, Kezic S, Teunissen MBM, Bos JD, Luiten RM, et al. Increased frequencies of IL-31-producing T
cells are found in chronic atopic dermatitis skin. Experimental Dermatology 2012; 21:431-6.
100. Nemoto O, Furue M, Nakagawa H, Shiramoto M, Hanada R, Matsuki S, et al. The first trial of CIM331, a humanized
antihuman interleukin-31 receptor A antibody, in healthy volunteers and patients with atopic dermatitis to evaluate safety,
tolerability and pharmacokinetics of a single dose in a randomized, double-blind, placebo-controlled study. Br J Dermatol
2016; 174:296-304.
101. Ruzicka T, Hanifin JM, Furue M, Pulka G, Mlynarczyk I, Wollenberg A, et al. Anti-Interleukin-31 Receptor A Antibody for
Atopic Dermatitis. N Engl J Med 2017; 376:826-35.
102. Leung DY, Guttman-Yassky E. Deciphering the complexities of atopic dermatitis: shifting paradigms in treatment approach-
es. J Allergy Clin Immunol 2014; 134:769-79.
103. Novak N, Valenta R, Bohle B, Laffer S, Haberstok J, Kraft S, et al. FcepsilonRI engagement of Langerhans cell-like dendritic
cells and inflammatory dendritic epidermal cell-like dendritic cells induces chemotactic signals and different T-cell pheno-

General discussion
193
11
12
types in vitro. J Allergy Clin Immunol 2004; 113:949-57.
104. Suarez-Farinas M, Dhingra N, Gittler J, Shemer A, Cardinale I, de Guzman Strong C, et al. Intrinsic atopic dermatitis shows
similar TH2 and higher TH17 immune activation compared with extrinsic atopic dermatitis. J Allergy Clin Immunol 2013;
132:361-70.
105. Thaci D, Simpson EL, Beck LA, Bieber T, Blauvelt A, Papp K, et al. Efficacy and safety of dupilumab in adults with
moderate-to-severe atopic dermatitis inadequately controlled by topical treatments: a randomised, placebo-controlled,
dose-ranging phase 2b trial. Lancet 2016; 387:40-52.
106. Zheng Y, Danilenko DM, Valdez P, Kasman I, Eastham-Anderson J, Wu J, et al. Interleukin-22, a T(H)17 cytokine, mediates
IL-23-induced dermal inflammation and acanthosis. Nature 2007; 445:648-51.
107. Hua TC, Hwang CY, Chen YJ, Chu SY, Chen CC, Lee DD, et al. The natural course of early-onset atopic dermatitis in Taiwan:
a population-based cohort study. British Journal of Dermatology 2014; 170:130-5.
108. Illi S, von Mutius E, Lau S, Nickel R, Gruber C, Niggemann B, et al. The natural course of atopic dermatitis from birth to age
7 years and the association with asthma. Journal of Allergy and Clinical Immunology 2004; 113:925-31.
109. Czarnowicki T, Esaki H, Gonzalez J, Renert-Yuval Y, Brunner P, Oliva M, et al. Alterations in B-cell subsets in pediatric
patients with early atopic dermatitis. J Allergy Clin Immunol 2016.
110. Corren J, Lemanske RF, Hanania NA, Korenblat PE, Parsey MV, Arron JR, et al. Lebrikizumab treatment in adults with
asthma. N Engl J Med 2011; 365:1088-98.
111. Brightling CE, Chanez P, Leigh R, O’Byrne PM, Korn S, She D, et al. Efficacy and safety of tralokinumab in patients with
severe uncontrolled asthma: a randomised, double-blind, placebo-controlled, phase 2b trial. Lancet Respir Med 2015;
3:692-701.
112. Castro M, Wenzel SE, Bleecker ER, Pizzichini E, Kuna P, Busse WW, et al. Benralizumab, an anti-interleukin 5 receptor
alpha monoclonal antibody, versus placebo for uncontrolled eosinophilic asthma: a phase 2b randomised dose-ranging
study. Lancet Respir Med 2014; 2:879-90.
113. Muraro A, Lemanske RF, Jr., Hellings PW, Akdis CA, Bieber T, Casale TB, et al. Precision medicine in patients with allergic
diseases: Airway diseases and atopic dermatitis-PRACTALL document of the European Academy of Allergy and Clinical
Immunology and the American Academy of Allergy, Asthma & Immunology. J Allergy Clin Immunol 2016; 137:1347-58.
114. Jameson JL, Longo DL. Precision medicine--personalized, problematic, and promising. N Engl J Med 2015; 372:2229-
34.
115. Gold L, Walker JJ, Wilcox SK, Williams S. Advances in human proteomics at high scale with the SOMAscan proteomics
platform. New Biotechnology 2012; 29:543-9.
116. Bremmer MS, Bremmer SF, Baig-Lewis S, Simpson EL. Are biologics safe in the treatment of atopic dermatitis? A review
with a focus on immediate hypersensitivity reactions. J Am Acad Dermatol 2009; 61:666-76.
117. van der Valk ME, van Oijen MG, Ammerlaan M, Siersema PD, Oldenburg B. Crohn’s disease patients treated with adalim-

Chapter 12
194
12
umab benefit from co-treatment with immunomodulators. Gut 2012; 61:324-5.
118. Gomollon F, Dignass A, Annese V, Tilg H, Van Assche G, Lindsay JO, et al. 3rd European Evidence-based Consensus on
the Diagnosis and Management of Crohn’s Disease 2016: Part 1: Diagnosis and Medical Management. J Crohns Colitis
2017; 11:3-25.
119. Singh JA, Saag KG, Bridges SL, Jr., Akl EA, Bannuru RR, Sullivan MC, et al. 2015 American College of Rheumatology
Guideline for the Treatment of Rheumatoid Arthritis. Arthritis Rheumatol 2016; 68:1-26.
120. Sidbury R, Davis DM, Cohen DE, Cordoro KM, Berger TG, Bergman JN, et al. Guidelines of care for the management of
atopic dermatitis: section 3. Management and treatment with phototherapy and systemic agents. J Am Acad Dermatol
2014; 71:327-49.
121. Garritsen FM, Roekevisch E, van der Schaft J, Deinum J, Spuls PI, de Bruin-Weller MS. Ten years experience with oral im-
munosuppressive treatment in adult patients with atopic dermatitis in two academic centres. J Eur Acad Dermatol Venereol
2015; 29:1905-12.
122. van der Schaft J, Politiek K, van den Reek JM, Kievit W, de Jong EM, Bruijnzeel-Koomen CA, et al. Drug survival for
azathioprine and enteric-coated mycophenolate sodium in a long-term daily practice cohort of adult patients with atopic
dermatitis. Br J Dermatol 2016.
123. de Jonge H, Kuypers DR. Pharmacogenetics in solid organ transplantation: current status and future directions. Transplant
Rev (Orlando) 2008; 22:6-20.
124. Elens L, Hesselink DA, Bouamar R, Budde K, de Fijter JW, De Meyer M, et al. Impact of POR*28 on the pharmacokinetics
of tacrolimus and cyclosporine A in renal transplant patients. Ther Drug Monit 2014; 36:71-9.
125. van der Schaft J, van Schaik RH, van Zuilen AD, Hijnen DJ, Berg MT, van den Broek MP, et al. First experience with ex-
tended release tacrolimus in the treatment of adult patients with severe, difficult to treat atopic dermatitis: Clinical efficacy,
safety and dose finding. J Dermatol Sci 2016; 81:66-8.
126. Bloomfeld RS BS, Levine ME, Carroll S. Thiopurine methyltransferase activity is correlated with azathioprine metabolite
levels in inflammatory bowel disease patients in clinical gastroenterology practice. Journal of Applied Research 2004; 6:5.
127. van der Schaft J, Politiek K, van den Reek JM, Christoffers WA, Kievit W, de Jong EM, et al. Drug survival for ciclosporin
A in a long-term daily practice cohort of adult patients with atopic dermatitis. Br J Dermatol 2015; 172:1621-7.
128. Hijnen DJ, ten Berge O, Timmer-de Mik L, Bruijnzeel-Koomen CA, de Bruin-Weller MS. Efficacy and safety of long-term
treatment with cyclosporin A for atopic dermatitis. J Eur Acad Dermatol Venereol 2007; 21:85-9.
129. Sood BG, Madan A, Saha S, Schendel D, Thorsen P, Skogstrand K, et al. Perinatal Systemic Inflammatory Response
Syndrome and Retinopathy of Prematurity. Pediatric Research 2010; 67:394-400.
130. Pennings JL, Siljee JE, Imholz S, Kuc S, de Vries A, Schielen PC, et al. Comparison of different blood collection, sample
matrix, and immunoassay methods in a prenatal screening setting. Dis Markers 2014; 2014:509821.
131. Fujisawa T, Fujisawa R, Kato Y, Nakayama T, Morita A, Katsumata H, et al. Presence of high contents of thymus and

General discussion
195
11
12
activation-regulated chemokine in platelets and elevated plasma levels of thymus and activation-regulated chemokine and
macrophage-derived chemokine in patients with atopic dermatitis. J Allergy Clin Immunol 2002; 110:139-46.
132. Koster RA, Alffenaar JW, Greijdanus B, Uges DR. Fast LC-MS/MS analysis of tacrolimus, sirolimus, everolimus and cyc-
losporin A in dried blood spots and the influence of the hematocrit and immunosuppressant concentration on recovery.
Talanta 2013; 115:47-54.
133. Skogstrand K, Thorsen P, Norgaard-Pedersen B, Schendel DE, Sorensen LC, Hougaard DM. Simultaneous measurement
of 25 inflammatory markers and neurotrophins in neonatal dried blood spots by immunoassay with xMAP technology. Clin
Chem 2005; 51:1854-66.
134. Federal Register. 49 CFR part 173 Shippers General Requirements for Shipments and packaging. Section 173.134(b)
2011.] Available from https://www.gpo.gov/fdsys/pkg/CFR-2011-title49-vol2/pdf/CFR-2011-title49-vol2-
sec173-134.pdf.
135. Sharma A, Jaiswal S, Shukla M, Lal J. Dried blood spots: concepts, present status, and future perspectives in bioanalysis.
Drug Test Anal 2014; 6:399-414.
136. Lampe D, Scholz D, Prumke HJ, Blank W, Huller H. Capillary blood, dried on filter paper, as sample for monitoring cyclo-
sporin A concentrations. Clin Chem 1987; 33:1643-4.
137. Mohamed R, Mercolini L, Cuennet-Cosandey S, Chavent J, Raggi MA, Peyrou M. Validation of a dried blood spot LC-MS/
MS approach for cyclosporin A in cat blood: Comparison with a classical sample preparation. Journal of Pharmaceutical
and Biomedical Analysis 2012; 66:298-305.
138. Hinchliffe E, Adaway JE, Keevil BG. Simultaneous measurement of cyclosporin A and tacrolimus from dried blood spots by
ultra high performance liquid chromatography tandem mass spectrometry. J Chromatogr B Analyt Technol Biomed Life Sci
2012; 883-884:102-7.
139. Koster RA, Alffenaar JWC, Greijdanus B, Uges DRA. Fast LC-MS/MS analysis of tacrolimus, sirolimus, everolimus and
cyclosporin A in dried blood spots and the influence of the hematocrit and immunosuppressant concentration on recovery.
Talanta 2013; 115:47-54.
140. Heinig K, Bucheli F, Hartenbach R, Gajate-Perez A. Determination of mycophenolic acid and its phenyl glucuronide in
human plasma, ultrafiltrate, blood, DBS and dried plasma spots. Bioanalysis 2010; 2:1423-35.
141. Hoogtanders K, van der Heijden J, Christiaans M, Edelbroek P, van Hooff JP, Stolk LM. Therapeutic drug monitoring of
tacrolimus with the dried blood spot method. J Pharm Biomed Anal 2007; 44:658-64.
142. Koop DR, Bleyle LA, Munar M, Cherala G, Al-Uzri A. Analysis of tacrolimus and creatinine from a single dried blood spot
using liquid chromatography tandem mass spectrometry. Journal of Chromatography B-Analytical Technologies in the
Biomedical and Life Sciences 2013; 926:54-61.
143. Ring J, Alomar A, Bieber T, Deleuran M, Fink-Wagner A, Gelmetti C, et al. Guidelines for treatment of atopic eczema (atopic
dermatitis) Part II. J Eur Acad Dermatol Venereol 2012; 26:1176-93.

Chapter 13
19613
13

Nederlandse samenvatting
197 13
Nederlandse samenvatting
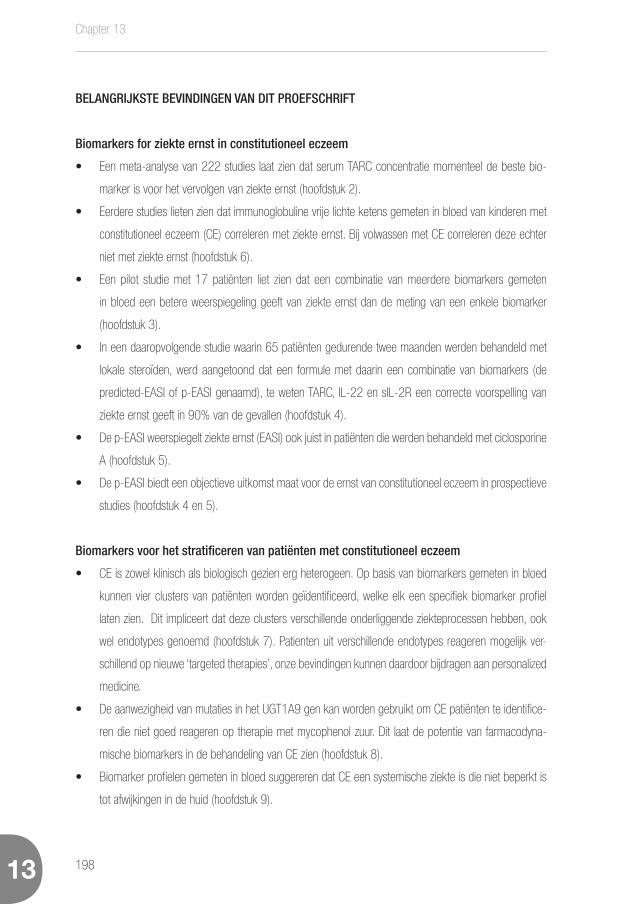
Chapter 13
19813
BELANGRIJKSTE BEVINDINGEN VAN DIT PROEFSCHRIFT
Biomarkers for ziekte ernst in constitutioneel eczeem
• Een meta-analyse van 222 studies laat zien dat serum TARC concentratie momenteel de beste bio-
marker is voor het vervolgen van ziekte ernst (hoofdstuk 2).
• Eerdere studies lieten zien dat immunoglobuline vrije lichte ketens gemeten in bloed van kinderen met
constitutioneel eczeem (CE) correleren met ziekte ernst. Bij volwassen met CE correleren deze echter
niet met ziekte ernst (hoofdstuk 6).
• Een pilot studie met 17 patiënten liet zien dat een combinatie van meerdere biomarkers gemeten
in bloed een betere weerspiegeling geeft van ziekte ernst dan de meting van een enkele biomarker
(hoofdstuk 3).
• In een daaropvolgende studie waarin 65 patiënten gedurende twee maanden werden behandeld met
lokale steroïden, werd aangetoond dat een formule met daarin een combinatie van biomarkers (de
predicted-EASI of p-EASI genaamd), te weten TARC, IL-22 en sIL-2R een correcte voorspelling van
ziekte ernst geeft in 90% van de gevallen (hoofdstuk 4).
• De p-EASI weerspiegelt ziekte ernst (EASI) ook juist in patiënten die werden behandeld met ciclosporine
A (hoofdstuk 5).
• De p-EASI biedt een objectieve uitkomst maat voor de ernst van constitutioneel eczeem in prospectieve
studies (hoofdstuk 4 en 5).
Biomarkers voor het stratificeren van patiënten met constitutioneel eczeem
• CE is zowel klinisch als biologisch gezien erg heterogeen. Op basis van biomarkers gemeten in bloed
kunnen vier clusters van patiënten worden geïdentificeerd, welke elk een specifiek biomarker profiel
laten zien. Dit impliceert dat deze clusters verschillende onderliggende ziekteprocessen hebben, ook
wel endotypes genoemd (hoofdstuk 7). Patienten uit verschillende endotypes reageren mogelijk ver-
schillend op nieuwe ‘targeted therapies’, onze bevindingen kunnen daardoor bijdragen aan personalized
medicine.
• De aanwezigheid van mutaties in het UGT1A9 gen kan worden gebruikt om CE patiënten te identifice-
ren die niet goed reageren op therapie met mycophenol zuur. Dit laat de potentie van farmacodyna-
mische biomarkers in de behandeling van CE zien (hoofdstuk 8).
• Biomarker profielen gemeten in bloed suggereren dat CE een systemische ziekte is die niet beperkt is
tot afwijkingen in de huid (hoofdstuk 9).

Nederlandse samenvatting
199 13
Alternatieve bronnen voor het meten van biomarkers
• De meeste biomarkers worden gemeten in veneus bloed. Er bestaan echter nog andere interessante
bronnen waarin biomarkers gemeten kunnen worden, zoals speeksel of dried blood spots (hoofdstuk
10).
• Een nadeel van het meten van biomarkers in veneus bloed is de noodzaak voor een venapunctie.
TARC waardes gemeten in dried blood spots geven een goede weerspiegeling van ziekte ernst. Dried
blood spots bieden een simpel en minimaal invasief alternatief voor het meten van biomarkers in CE
(hoofdstuk 11).

Chapter 13
20013
NEDERLANDSE SAMENVATTING
Constitutioneel eczeem (CE) is een van de meest voorkomende chronische ontstekingsziekten van de huid
wereldwijd. Het hebben van CE heeft een grote impact op de kwaliteit van leven van patiënten. In het
complexe ontstaansmechanisme van CE spelen zowel genetische- als omgevingsfactoren een rol, welke
uiteindelijk leiden tot afwijkingen in het afweersysteem en een verminderde huid barrière. Er zijn veel pogingen
gedaan om CE patiënten te karakteriseren op basis van klinische kenmerken, zoals bijvoorbeeld de leeftijd
waarop de ziekte is ontstaan, of de aanwezigheid van andere atopische ziekten zoals astma en hooikoorts.
Deze indeling geeft echter geen goede weerspiegeling van de verschillende onderliggende processen die
ten grondslag liggen aan CE.
Het merendeel van de patiënten kan goed worden behandeld met hormoonzalven, echter, er
is een groot tekort aan behandelopties voor patiënten met matig tot ernstig CE. In de afgelopen jaren zijn
veel nieuwe medicijnen ontwikkeld die aangrijpen of specifieke cytokines of cytokine receptoren die een rol
spelen in de pathogenese van CE. De resultaten van de eerste studies met deze medicijnen zijn veelbelovend
en bieden hopelijk goede behandelopties voor patiënten met matig en ernstig CE in de nabije toekomst.
Dit proefschrift focust op biomarkers voor CE. Biomarkers zijn karakteristieke biologische eigen-
schappen die gemeten kunnen worden in het menselijk lichaam (bijvoorbeeld in het bloed of in de urine).
Biomarkers kunnen onder andere van belang kunnen zijn bij het diagnosticeren van ziektes, het volgen van
het ziekte activiteit of het voorspellen van het effect van behandelingen. Voorbeelden van bekende biomarker
zijn lichaamstemperatuur voor het vaststellen van koorts, en CRP gemeten in bloed voor het vervolgen van
infectie.
In dit proefschrift staat de zoektocht naar biomarkers voor het vervolgen van ziekte ernst, en
biomarkers voor het groeperen van patiënten op basis van onderliggende ziekte processen bij CE centraal.
Biomarkers voor het vervolgen van ziekte ernst in constitutioneel eczeem
In de dagelijkse dermatologische praktijk wordt de ernst van CE meestal “gemeten” doordat er in het hoofd
van de behandelaar een integratie is van het klinische beeld en de anamnese (jeuk, zichtbaarheid, effect
op kwaliteit van leven, etc.). Op basis van de integratie van die gegevens worden in samenspraak met de
patiënt beslissingen genomen over de behandeling. In wetenschappelijke studies is het echter wenselijk een
kwantitatieve maat te hebben, zodat het effect van behandeling kan worden onderzocht op basis van harde
getallen. In het eczeemonderzoek wordt historisch gezien de ernst van CE gemeten op basis van scoresys-
temen zoals SCORAD, SASSAD, of EASI, die worden ingevuld door de behandelend arts of verpleegkundige.
Deze score systemen houden rekening met de mate van roodheid, schilfering, lichenificatie, krabeffecten en
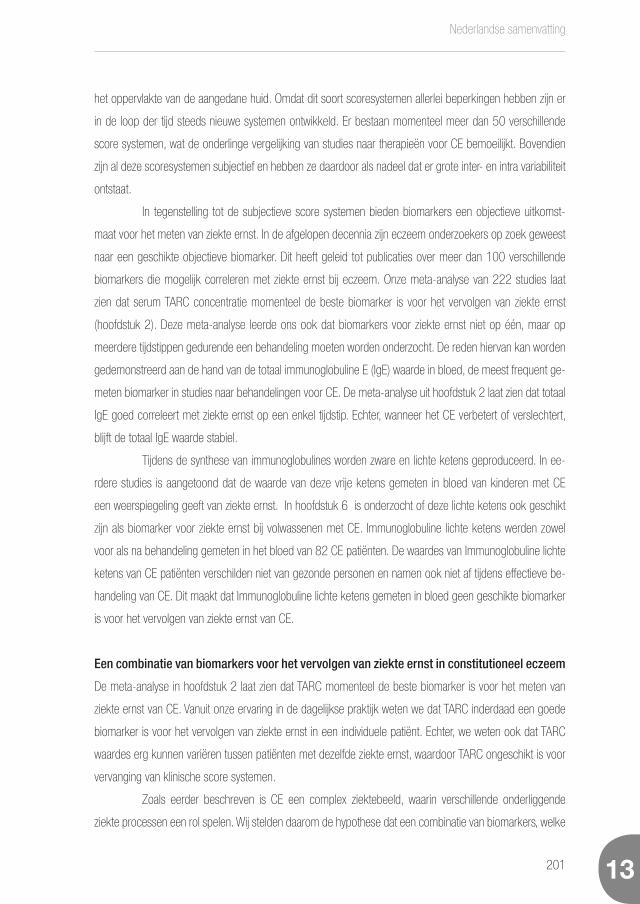
Nederlandse samenvatting
201 13
het oppervlakte van de aangedane huid. Omdat dit soort scoresystemen allerlei beperkingen hebben zijn er
in de loop der tijd steeds nieuwe systemen ontwikkeld. Er bestaan momenteel meer dan 50 verschillende
score systemen, wat de onderlinge vergelijking van studies naar therapieën voor CE bemoeilijkt. Bovendien
zijn al deze scoresystemen subjectief en hebben ze daardoor als nadeel dat er grote inter- en intra variabiliteit
ontstaat.
In tegenstelling tot de subjectieve score systemen bieden biomarkers een objectieve uitkomst-
maat voor het meten van ziekte ernst. In de afgelopen decennia zijn eczeem onderzoekers op zoek geweest
naar een geschikte objectieve biomarker. Dit heeft geleid tot publicaties over meer dan 100 verschillende
biomarkers die mogelijk correleren met ziekte ernst bij eczeem. Onze meta-analyse van 222 studies laat
zien dat serum TARC concentratie momenteel de beste biomarker is voor het vervolgen van ziekte ernst
(hoofdstuk 2). Deze meta-analyse leerde ons ook dat biomarkers voor ziekte ernst niet op één, maar op
meerdere tijdstippen gedurende een behandeling moeten worden onderzocht. De reden hiervan kan worden
gedemonstreerd aan de hand van de totaal immunoglobuline E (IgE) waarde in bloed, de meest frequent ge-
meten biomarker in studies naar behandelingen voor CE. De meta-analyse uit hoofdstuk 2 laat zien dat totaal
IgE goed correleert met ziekte ernst op een enkel tijdstip. Echter, wanneer het CE verbetert of verslechtert,
blijft de totaal IgE waarde stabiel.
Tijdens de synthese van immunoglobulines worden zware en lichte ketens geproduceerd. In ee-
rdere studies is aangetoond dat de waarde van deze vrije ketens gemeten in bloed van kinderen met CE
een weerspiegeling geeft van ziekte ernst. In hoofdstuk 6 is onderzocht of deze lichte ketens ook geschikt
zijn als biomarker voor ziekte ernst bij volwassenen met CE. Immunoglobuline lichte ketens werden zowel
voor als na behandeling gemeten in het bloed van 82 CE patiënten. De waardes van Immunoglobuline lichte
ketens van CE patiënten verschilden niet van gezonde personen en namen ook niet af tijdens effectieve be-
handeling van CE. Dit maakt dat Immunoglobuline lichte ketens gemeten in bloed geen geschikte biomarker
is voor het vervolgen van ziekte ernst van CE.
Een combinatie van biomarkers voor het vervolgen van ziekte ernst in constitutioneel eczeem
De meta-analyse in hoofdstuk 2 laat zien dat TARC momenteel de beste biomarker is voor het meten van
ziekte ernst van CE. Vanuit onze ervaring in de dagelijkse praktijk weten we dat TARC inderdaad een goede
biomarker is voor het vervolgen van ziekte ernst in een individuele patiënt. Echter, we weten ook dat TARC
waardes erg kunnen variëren tussen patiënten met dezelfde ziekte ernst, waardoor TARC ongeschikt is voor
vervanging van klinische score systemen.
Zoals eerder beschreven is CE een complex ziektebeeld, waarin verschillende onderliggende
ziekte processen een rol spelen. Wij stelden daarom de hypothese dat een combinatie van biomarkers, welke
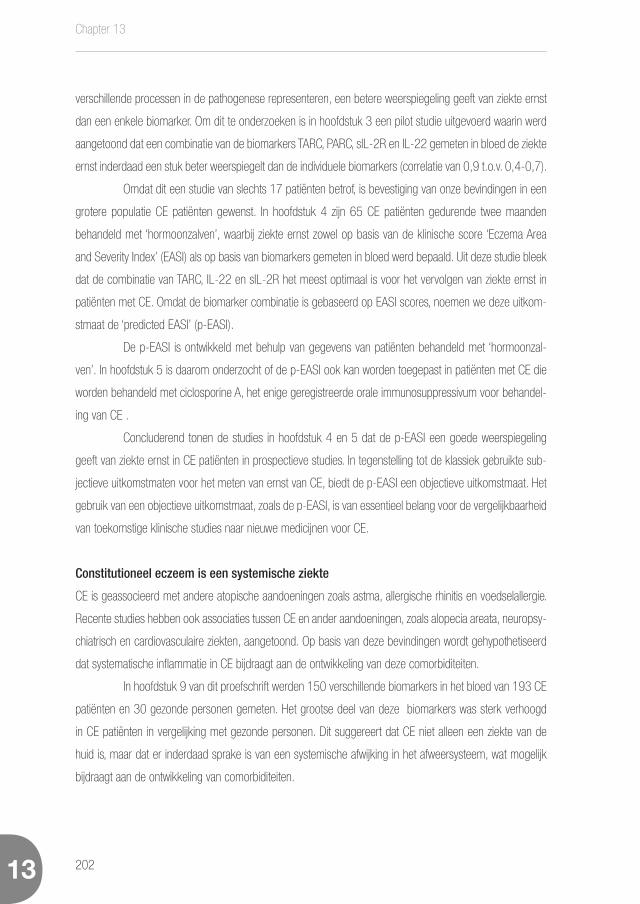
Chapter 13
20213
verschillende processen in de pathogenese representeren, een betere weerspiegeling geeft van ziekte ernst
dan een enkele biomarker. Om dit te onderzoeken is in hoofdstuk 3 een pilot studie uitgevoerd waarin werd
aangetoond dat een combinatie van de biomarkers TARC, PARC, sIL-2R en IL-22 gemeten in bloed de ziekte
ernst inderdaad een stuk beter weerspiegelt dan de individuele biomarkers (correlatie van 0,9 t.o.v. 0,4-0,7).
Omdat dit een studie van slechts 17 patiënten betrof, is bevestiging van onze bevindingen in een
grotere populatie CE patiënten gewenst. In hoofdstuk 4 zijn 65 CE patiënten gedurende twee maanden
behandeld met ‘hormoonzalven’, waarbij ziekte ernst zowel op basis van de klinische score ‘Eczema Area
and Severity Index’ (EASI) als op basis van biomarkers gemeten in bloed werd bepaald. Uit deze studie bleek
dat de combinatie van TARC, IL-22 en sIL-2R het meest optimaal is voor het vervolgen van ziekte ernst in
patiënten met CE. Omdat de biomarker combinatie is gebaseerd op EASI scores, noemen we deze uitkom-
stmaat de ‘predicted EASI’ (p-EASI).
De p-EASI is ontwikkeld met behulp van gegevens van patiënten behandeld met ‘hormoonzal-
ven’. In hoofdstuk 5 is daarom onderzocht of de p-EASI ook kan worden toegepast in patiënten met CE die
worden behandeld met ciclosporine A, het enige geregistreerde orale immunosuppressivum voor behandel-
ing van CE .
Concluderend tonen de studies in hoofdstuk 4 en 5 dat de p-EASI een goede weerspiegeling
geeft van ziekte ernst in CE patiënten in prospectieve studies. In tegenstelling tot de klassiek gebruikte sub-
jectieve uitkomstmaten voor het meten van ernst van CE, biedt de p-EASI een objectieve uitkomstmaat. Het
gebruik van een objectieve uitkomstmaat, zoals de p-EASI, is van essentieel belang voor de vergelijkbaarheid
van toekomstige klinische studies naar nieuwe medicijnen voor CE.
Constitutioneel eczeem is een systemische ziekte
CE is geassocieerd met andere atopische aandoeningen zoals astma, allergische rhinitis en voedselallergie.
Recente studies hebben ook associaties tussen CE en ander aandoeningen, zoals alopecia areata, neuropsy-
chiatrisch en cardiovasculaire ziekten, aangetoond. Op basis van deze bevindingen wordt gehypothetiseerd
dat systematische inflammatie in CE bijdraagt aan de ontwikkeling van deze comorbiditeiten.
In hoofdstuk 9 van dit proefschrift werden 150 verschillende biomarkers in het bloed van 193 CE
patiënten en 30 gezonde personen gemeten. Het grootse deel van deze biomarkers was sterk verhoogd
in CE patiënten in vergelijking met gezonde personen. Dit suggereert dat CE niet alleen een ziekte van de
huid is, maar dat er inderdaad sprake is van een systemische afwijking in het afweersysteem, wat mogelijk
bijdraagt aan de ontwikkeling van comorbiditeiten.
Nederlandse samenvatting
203 13
Biomarkers om de prestatie van toekomstige therapieën te verbeteren
CE is, zoals eerder beschreven, een complexe en heterogene aandoening. Het indelen van patiënten op
basis van klinische eigenschappen, zoals het wel of niet hebben van astma, of de leeftijd waarop het eczeem
zich presenteerde, heeft tot nu toe niet geleid tot verbetering in de therapie van CE. Met het oog op nieuwe
‘targeted therapies’ is het belangrijk om beter inzicht te krijgen in de heterogeniteit van de ziekteprocessen
die ten grondslag liggen aan CE om zo de juiste patiënt met de juiste therapie te kunnen behandelen.
In hoofdstuk 7 van dit proefschrift is onderzocht of op basis van biomarkers gemeten in bloed,
onafhankelijk van de klinische kenmerken, verschillende patiënt groepen geïdentificeerd kunnen worden. In
een groep van 193 CE patiënten tonen we aan dat er op basis van 150 serum biomarkers vier duidelijk ver-
schillende patiënt clusters te onderscheiden zijn. De vier patiënt clusters hebben allen een specifiek biomark-
er profiel, wat er op zou kunnen wijzen dat deze vier clusters verschillende onderliggende ziekteprocessen
weerspiegelen, dit worden endotypes genoemd.
Een interessante bevinding in deze studie was het verschil in waardes van Th2 biomarkers tussen
de groepen. Zowel de waardes van IL-4 en IL-13 zijn significant hoger in twee van de vier patiënt groepen.
Theoretisch gezien zouden de patiënten uit de groepen met hoge Th2 biomarkers, ideale kandidaten zijn voor
behandelingen waarbij Th2 inflammatie wordt geremd. Momenteel worden diverse therapieën die gericht zijn
tegen Th2 inflammatie getest. Een van deze veelbelovende behandelingen is dupilumab, een anti-IL-4Rα
blokker: dit middel blokkeert de werking van de hierboven genoemde cytokines IL-4 en IL-13. Fase 3 stud-
ies hebben laten zien dat behandeling met dupilumab in ongeveer de helft van de CE patiënten zeer effectief
is. Deze resultaten komen overeen met onze bevinding dat ongeveer de helft van de CE patiënten uitgespro-
ken hoge Th2 biomarker waardes hebben. Naast de verschillen in IL-4 en IL-13 biomarkers, verschillen de
clusters ook in andere biomarkers die gerelateerd kunnen worden aan specifieke therapieën, zoals TSLP,
IL-5 en IL-31.
Samenvattend laat hoofdstuk 7 zien dat CE niet alleen op basis van klinische kenmerken erg
heterogeen is, maar ook op basis van biomarker profielen gemeten in bloed. Deze biomarker profielen
kunnen een weerspiegeling van onderliggende ziekte processen zijn, en zijn daarom mogelijk van belang bij
het selecteren van de juiste (nieuwe) therapie voor de juiste patiënt.
Chapter 13
20413
Farmacogenetische biomarkers om de prestatie van huidige therapieën te verbeteren
Farmacogenetica is de studie naar genetische verschillen in de opname en afbraak van medicijnen. Genmu-
taties kunnen afwijkingen veroorzaken in de mate waarin bepaalde enzymen medicijnen afbreken. Als een
genmutatie een verhoogde afbraak van een bepaald medicijn veroorzaakt, is de bloedspiegel van dit medicijn
lager en het medicijn daardoor minder effectief.
In hoofdstuk 9 van dit proefschrift werd retrospectief onderzocht of mutaties in het UGT1A9 gen
de effectiviteit van mycofenolzuur voor de behandeling van CE kunnen voorspellen. Van de patiënten waarbij
mycofenolzuur geen effect had op het CE, bleek 19% te kunnen worden geïdentificeerd aan de hand van
een UGT1A9 mutatie. In patiënten met een UGT1A9 mutatie kan mycofenolzuur hoger worden gedoseerd,
om zo toch een therapeutische spiegel en effectiviteit te behalen. UGT1A9 genmutaties kunnen worden
ingezet als farmacodynamische biomarker om de prestatie van mycofenolzuur voor de behandeling van CE
te verbeteren.
Verbetering van praktische aspecten van biomarker metingen
De studies in dit proefschrift richten zich met name op biomarkers gemeten in veneus bloed. Een nadeel
van bloed is de noodzaak van een veneuze bloedafname, welke alleen door getraind personeel kan worden
uitgevoerd. Ook moet het bloed binnen een uur worden verwerkt in het laboratorium, wat kostbaar en niet
in alle situaties praktisch is.
Dried blood spots (DBS) bieden een gebruiksvriendelijk alternatief voor veneuze bloedafname.
Een bekende toepassing van DBS is de hielprik bij pasgeborenen ter opsporing van metabole ziekten. Deze
vindt plaats in de thuissituatie en het verzamelde bloed kan via reguliere post worden verstuurd naar een
laboratorium voor analyse. Voor het verzamelen van DBS is slechts een kleine vingerprik nodig, welke door
de patiënt zelf kan worden uitgevoerd. DBS kunnen gemakkelijk worden opgeslagen en worden verstuurd
op kamertemperatuur. In hoofdstuk 11 hebben we aangetoond dat de biomarkers I-309, TARC, PARC en
MDC gemeten in DBS een goede weerspiegeling van ziekte ernst geven tijdens effectieve behandeling van
CE. Een interessante bevinding is dat TARC gemeten in DBS zelfs een betere weerspiegeling van ziekte
ernst geeft dan TARC gemeten in serum. In hoofdstuk 11 werd ook de stabiliteit van TARC gemeten in DBS
onderzocht: zowel vries/dooi cycli, opslag op kamertemperatuur en langdurige opslag bij -20 ̊C beïnvloedt
de TARC waarden gemeten in DBS niet.
Concluderend bieden DBS een praktisch en minimaal invasief alternatief voor het meten van
biomarkers in patiënten met CE.

Nederlandse samenvatting
205 13
Toekomstperspectief
De toepassing van biomarkers in CE maakt het objectief meten van ziekte ernst mogelijk, waardoor besta-
ande en toekomstige therapieën beter met elkaar vergeleken kunnen worden. Tevens zullen biomarkers in
toenemende mate een rol gaan spelen in het karakteriseren en stratificeren van CE patiënten. Dit kan in
belangrijke mate bijdragen aan het behandelen van de juiste patiënt met het juiste geneesmiddel en het
betaalbaar houden van de medische zorg. Voorts kunnen farmacodynamische biomarkers het therapeutische
effect van klassieke immunosuppressieve medicijnen flink gaan verbeteren. Het meten van biomarkers in
DBS maakt het mogelijk om patiënten van een afstand te ’monitoren’ in combinatie met eHealth applicaties,
wat de kwaliteit van zorg ten goede kan komen en kosten kan besparen. Concluderend kan worden gesteld
dat biomarkers essentieel zijn voor de verdere ontwikkeling, verbetering en personalisering van de behan-
deling van CE.

Chapter 13
20613

Nederlandse samenvatting
207 13
AppendicesAbbrevations
Contributing authors
Acknowledgements
List of publications
Curriculum vitae

208
LIST OF ABBREVATIONS
AD Atopic dermatitis
AIC Akaike Information Criteria
AZA Azathioprine
BSA Body surface area
CI Confidence interval
CNV Genetic copynumber variation
CsA Cyclosporin A
CTACK Cutaneous T-cell-attracting chemokine
DBS Dried blood spot
EASI Eczema Area Severity Index
ECP Eosinophil Cationic Protein
HC Healthy control
HOME Harmonizing Outcome Measurements in Eczema
IGA Investigators’ Global Assessment
Ig-FLC Immunoglobulin free light chain
IL Interleukin
IQR InterQuartileRange
I-309 T Lymphocyte-Secreted Protein I-309
LDH Lactate DeHydrogenase
LLOQ Lower limit of quantification
MDC Macrophage-derived chemokine

209
6-MMP 6-methylmercaptopurine ribonucleotides
MPA Mycophenolic acid
OR Odds ratio
PARC Pulmonary and activation-regulated chemokine
PASI Psoriasis Area Severity Index
p-EASI Predicted-EASI
POEM Patient-Oriented Eczema Measure
PC Principal component
PCA Principal component analysis
PRISMA Preferred Reporting Items of Systematic Reviews and Meta-Analyses
SA-PASI Self-administered psoriasis area and severity index
SASSAD Six Area Six Sign Atopic Dermatitis
SCORAD SCORing of Atopic Dermatitis
SDF-1α Stromal cell-derived factor-1α
SNP Single-nucleotide polymorphism
6-TGN 6-thioguanine nucleotides
UGT1A9 Uridine diphosphate-glucuronosyltransferase 1A9
ULOQ Upper limit of quantification
VAS Visual analogue scale
TARC Thymus and activation‐regulated chemokine
Th T helper
TSLP Thymic stromal lymphopoietin

210
LIST OF CO-AUTHORS
Marcel P.H. van den BroekDepartment of Clinical Pharmacy, University Medical Center Utrecht, the Netherlands
Constantinus F. BuckensDepartment of Radiology, University Medical Center Utrecht, Utrecht, the Netherlands
Marjolein S. de Bruin-Weller Department of Dermatology and Allergology, University Medical Center Utrecht, the Netherlands
Carla A.F.M. Bruijnzeel-Koomen Department of Dermatology and Allergology, University Medical Center Utrecht, the Netherlands
Eszter CsomorMedImmune Biotech, Cambridge, United Kingdom
Julia DrylewiczLaboratory of Translational Immunology, University Medical Center Utrecht, the Netherlands
Renée FiechterDepartment of Dermatology and Allergology, University Medical Center Utrecht, the Netherlands
Carsten Flohr Department of Paediatric Dermatology, St John’s Institute of Dermatology, Guy’s and St Thomas’ Hospitals NHS Foundation Trust and King’s College, London, United Kingdom
Johan GarssenNutricia Research, Utrecht, The NetherlandsUtrecht Institute for Pharmaceutical Sciences, Faculty of Science, Utrecht University, the Netherlands
Berthe A.M. van der Geest Department of Dermatology and Allergy, University Medical Center Utrecht, the Netherlands
Barbara Giovannone Department of Dermatology and Allergology, University Medical Center Utrecht, the Netherlands
Athula Herath MedImmune Biotech, Cambridge, United Kingdom
DirkJan HijnenDepartment of Dermatology and Allergology, University Medical Center Utrecht, the Netherlands
Karen KnippingNutricia Research, Utrecht, The NetherlandsUtrecht Institute for Pharmaceutical Sciences, Faculty of Science, Utrecht University, the Netherlands

211
Edward F. Knol Department of Dermatology and Allergology, University Medical Center Utrecht, the NetherlandsDepartment of Immunology, University Medical Center Utrecht, the Netherlands
Stefan Nierkens U-DAIR and Laboratory of Translational Immunology, University Medical Center Utrecht, the Netherlands
Todor Krastev Department of Dermatology and Allergy, University Medical Center Utrecht, the Netherlands
Amelia LacnaU-DAIR and Laboratory of Translational Immunology, University Medical Center Utrecht, the Netherlands
Richard D. MayMedImmune Biotech, Cambridge, United Kingdom
Tomas MustelinMedImmune Biotech, Cambridge, United Kingdom
Jorien van der SchaftDepartment of Dermatology and Allergy, University Medical Center Utrecht, the Netherlands
Ron H. van SchaikDepartment of Clinical Chemistry and Haematology, University Medical Center Utrecht, the NetherlandsDepartment of Clinical Chemistry, Erasmus University Medical Center Rotterdam, the Netherlands
Wouter O. van SeggelenDepartment of Dermatology and Allergy, University Medical Center Utrecht, the Netherlands
Bret R. SellmanMedImmune Biotech, Cambridge, United Kingdom
Matthew A. SleemanMedImmune Biotech, Cambridge, United Kingdom
Ian Strickland MedImmune Biotech, Cambridge, United Kingdom
Stephan Weidinger Department of Dermatology, Venereology and Allergy, University Hospital Schleswig-Holstein, Campus Kiel, Germany

212
DANKWOORD
Een proefschrift tot stand brengen doe je niet alleen. Daarom wil ik iedereen die, op welke wijze dan ook,
heeft bijgedragen aan het schrijven van dit proefschrift bedanken en onderstaande personen in het bijzonder.
Allereerst wil ik alle patiënten bedanken voor hun interesse en deelname aan de onderzoeken. De middagen
op de polikliniek lieten mij de noodzaak van het onderzoek naar constitutioneel eczeem zien, en maakte me
nieuwsgierig naar de onderliggende oorzaken.
Veel dank aan Carla Bruijnzeel-Koomen, mijn promotor. Carla, vanaf het moment dat ik als student binnen
kwam, gaf je me de kans om te laten zien wat ik kon. Het samen schrijven van een artikel voor het NtvG
en het meewerken aan de richtlijn constitutioneel eczeem waren de eerste opstapjes naar de start van mijn
promotie onderzoek. In de jaren daarna werkten je voortdurende passie en enthousiasme voor het onderzoek
aanstekelijk. Ook in het afgelopen jaar, waarin je helaas minder aanwezig kon zijn, bleef je onverminderd
enthousiast en betrokken. Ontzettend veel dank daarvoor.
Dan natuurlijk DirkJan Hijnen en Stefan Nierkens, copromotoren. Dirk, zonder jou was dit proefschrift er nooit
geweest. Vanaf mijn coschap dermatologie in het vierde studiejaar geneeskunde heb je laten zien hoe leuk de
dermatologie is. Tijdens mijn onderzoeksstages wist je me te enthousiasmeren voor een promotietraject en
me ervan te overtuigen dat dermatologie het allermooiste vak is. In de afgelopen jaren hebben we ontzettend
veel leuke dingen gedaan en veel gelachen. Ook bij tegenslagen bleef jij positief en optimistisch, en kon je
me, mede dankzij flink wat koffie en chocola, motiveren om door te gaan. Bedankt voor de mooie tijd!
Stefan, je ideeën, plannen, en enthousiasme lijken onuitputtelijk. Je ziet overal mogelijkheden en potentiële
projecten. De metingen die onder leiding van jou werden uitgevoerd op de luminex zijn essentieel geweest
voor de inhoud van dit proefschrift. Het DBS project heeft veel leuke en positieve reacties van zowel congres
publiek als patiënten opgeleverd. De afname van DBS zijn een duidelijke stap voorwaarts naar een meer
patiëntgerichte en -vriendelijke behandeling, welke tegelijkertijd ook een mooie toevoeging kunnen zijn aan
wetenschappelijk onderzoek.
Als er mogelijkheid voor een derde copromotor bestond, zou dit zeker Marjolein de Bruin-Weller zijn geweest.
Marjolein, jouw kennis en ervaring zijn onmisbaar geweest voor dit proefschrift. Ik heb ontzettend veel van je
geleerd tijdens de MES spreekuren op de polikliniek. Tijdens dit promotietraject was je nuchtere kijk op zaken

213
en praktische aanpak ontzettend waardevol.
Barbara, you were there since the start. Your curiosity about the mechanism of atopic dermatitis works
inspiring. Thanks for all your help in the lab and for all the fun we had together: Copenhagen was great,
AMC was horrible, and I will never forget all the hours that we literally spent on the floor (luckily still laughing)
working in the serumbank.
Edward, dank voor je immer aanwezige enthousiasme, je enorme kennis van de literatuur, de nuttige
toevoegingen bij researchbesprekingen en sparsessies als Dirk en ik er even niet uit kwamen.
Ian, Richard and Athula, it was a pleasure working with you. Ian, I think we made a great team writing the
prospective research protocol (It’s a pity it hasn’t been executed yet, but hey, that’s research too), and your
British humour could make my day! Richard, your precision and determination to write the best paper as
possible lead to a great JACI publication. Athula, your passion about statistics, and your patience to go over
and over it again to make Dirk and me understand, has been of great value for this thesis.
Lieve paranimfen, het verdedigen heb ik bij jullie alvast af kunnen kijken, nu is het mijn beurt. Irene, nu hebben
we toch echt wel bewezen dat die cola light werkt! Super leuk dat nu we toch echt al zeker 10 jaar niet
meer in Eindhoven wonen we elkaar toch vaak zien, samen wintersporten en elkaars paranimf kunnen zijn.
Jorien, hetzelfde huis, dezelfde hobbies, hetzelfde proefschrift onderwerp, gezellig dat we nu als AIOS ook
weer collega’s zijn! Ik hoop dat er in de toekomst nog veel gezamenlijke projecten, congressen, etentjes en
fietstochten volgen.
Renée en Berthe, als studenten hebben jullie hard gewerkt en zijn jullie uiteindelijk allebei co-auteur op een
publicatie. Bedankt voor alle hulp en samenwerking.
Julia, what should I have done without you? We tend not to think about the statistical analysis before the
start of a study. In the end statistical analyses turned out to be one of the greatest challenges in this thesis.
Thanks for all your help.
Kamergenootjes Jorien, Henrike, Wouter, Lieneke, Daphne en op de valreep ook nog een korte tijd Sarah,
Hannah en Mark. Dank voor al jullie gezelligheid en het geduld om mijn onderzoeks perikelen en R frustraties
aan te horen. Fijn om overdag te kunnen sparren over inhoudelijke zaken en vervolgens te gaan hardlopen

214
bij Willem, te borrelen op vrijdag of tochten te wielrennen in het weekend.
Parttime kamergenoten en andere onderzoekers Stans, Ans, Jos, Marieke, Mignon, Florine, Floor, Rob, Kitty,
Harmieke. Dank voor de gezellig koffie- en lunchpauzes, een welkome afwisseling van het computerwerk.
Ook wisten jullie me altijd weer uit te dagen voor een nieuwe sportieve activiteit! Ischa, dank voor al je regel-
en uitzoekwerk, en natuurlijk ons lotgenoten contact onder het genot van toch maar weer een blikje cola.
Jantine en Miranda, heerlijk om af en toe even binnen te lopen om te kletsen en een koekje te stelen, dank
voor jullie interesse en alle hulp!
Verpleegkundigen op D2 West, jullie hebben ontzettend veel dried blood spots afgenomen bij patiënten die
werden opgenomen op de afdeling, bedankt!
Arts-assistenten dermatologie, de afronding van dit proefschrift viel samen met de eerste maanden van de
opleiding. Bedankt voor de mogelijkheid om stiekem toch nog een maandje extra te kunnen onderzoeken.
Nu dit boekwerk af is zal ik een betere borrelaar zijn!
Alle stafleden en collega’s op de stafgang bedankt voor jullie interesse.
Ook de verpleegkundigen en dames van de poli allergologie wil ik bedanken voor de afgelopen jaren. We
hebben veel gelachen tijdens de poli’s, maar jullie hebben me ook veel geholpen met het afnemen van
vingerprikken, speeksel, het versturen van brieven en andere praktisch zaken.
Lieve vrienden en familie, bedankt voor jullie interesse, maar bovenal ook voor de afleiding naast het
onderzoek! Wat een geluk om zoveel lieve mensen om me heen te hebben. Eigenlijk teveel om op te
noemen, maar toch ik doe een poging.
Anette, vanaf groep 1 onafscheidelijk, aangevuld met Caroline vanaf de eerste klas. Wat hebben we veel
plezier gehad en mooie reizen gemaakt. Ik hoop dat er nog vele volgen!
Ook een proefschrift is niks zonder Felix! Lieve Hanneke, Jolien, Ella, Jessica, Marije, Else, Marloes, Fanny en
Renee. Wat begon in een roeiboot en zich doorzette op de wielrenfiets, leidde uiteindelijk tot een ijzersterke
vriendschap. Onze wekelijke etentjes werkten heerlijk relativerend en gaven me altijd weer energie voor de
rest van de week. Net voor de start van dit proefschrift gingen we samen naar Sri Lanka, tijdens onze tweede
lustrumreis naar Canada kon ik me opladen voor de laatste loodjes. Bedankt!
Paulien, Nicoline, Feline en Melanie, wat een geluk met zulke lieve huisgenootjes! Fijn dat we ook nu we
verder dan een trap van elkaar vandaan wonen elkaar nog steeds zien. Bedankt voor de kopjes thee, de

215
fietstochten en goede gesprekken.
Anna, fietsbuddy, geen betere manier om je hoofd leeg te maken dan zo hard mogelijk bergopwaarts fietsen,
en ook al ben je altijd sterker, ik blijf proberen je te verslaan!
Studiegenootjes vanaf dag 1, Marjolein, Carlijne, Monique, Mieke en Leontien. Coschappen scheppen een
band, en zeker als die in Maleisië zijn! Jullie snappen als geen ander hoe het is om in het ziekenhuis te
werken en te promoveren. Heerlijk om af en toe lekker te klagen, maar gelukkig doen we ook veel gezellige
en leuke dingen samen!
Ans, Wim, Karel, Willem en Leonie, ondanks dat het afgelopen jaar niet makkelijk was, bleven jullie
geïnteresseerd in mijn proefschrift. Bedankt voor jullie belangstelling!
Lieve opa, lieve oma. Wat was het bijzonder dat jullie bij mijn buluitreiking konden zijn. Dat jullie er ook
nu weer bij kunnen zijn, vind ik ontzettend speciaal. Zowel u, maar ook Maria en opa Sietsko, waren altijd
ontzettend geïnteresseerd in het onderzoek en het werk in het ziekenhuis, fijn dat ik dit met jullie allemaal
heb kunnen delen.
Lief broertje en zusje. Mir, bedankt voor het design van dit proefschrift, wat zijn de brains zonder de beauty?
Zonder jou had het er nooit zo mooi uitgezien. De laatste weken hebben we flink door moeten werken,
maar het is zeker de moeite waard geweest. Super bedankt voor je harde werk! Frits, dezelfde scholen,
universiteit, stad, studentenvereniging en hobby’s. Ik weet dat je graag in mijn voetsporen treedt. In het zeer
onwaarschijnlijke geval dat je ook gaat promoveren, hoop ik dat ik je evenveel afleiding kan geven als jij mij
gaf, bedankt voor de gezellige etentjes, fietstochten, spinning klasjes en ritjes heen- en weer naar het zuiden.
Lieve pap en mam, bedankt voor de onvoorwaardelijke steun in de afgelopen jaren. Dankzij jullie heb ik alle
kansen en mogelijkheden gekregen die ik me maar kon wensen. Bedankt voor alles!
Lieve Pieter, na de Kilimanjaro was dit onze tweede gezamenlijke tocht en hoogtepunt, ik hoop dat er nog
velen zullen volgen. Bedankt voor alles. Je weet het, 100.042 keer!
216
LIST OF PUBLICATIONS
This thesis
Thijs JL, Nierkens S, Herath A, Bruijnzeel-Koomen CAFM, Knol EF, Giovannone B, de Bruin-Weller MS, Hijnen
DJ. A panel of biomarkers for disease severity in atopic dermatitis. Clin Exp Allergy. 2015 Mar;45(3):698-
701.
Thijs JL, van Seggelen WO, Bruijnzeel-Koomen CAFM, de Bruin-Weller MS, Hijnen DJ. New Developments
in Biomarkers for Atopic Dermatitis. J Clin Med. 2015 Mar 16;4(3):479-87.
Thijs J, Krastev T, Weidinger S, Buckens CF, de Bruin-Weller M, Bruijnzeel-Koomen C, Flohr C, Hijnen DJ.
Biomarkers for atopic dermatitis: a systematic review and meta-analysis. Curr Opin Allergy Clin Immunol.
2015 Oct;15(5):453-60.
Thijs JL, Van Der Geest BA, Van Der Schaft J, Van Den Broek MP, Van Seggelen WO, Bruijnzeel-Koomen
CAFM, Hijnen DJ, Van Schaik RH, De Bruin-Weller MS. Predicting therapy response to mycophenolic acid
using UGT1A9 genotyping: towards personalized medicine in atopic dermatitis. J Dermatolog Treat. 2016
Sep 13:1-4.
Thijs JL, Knipping K, Bruijnzeel-Koomen CAFM, Garssen J, de Bruin-Weller MS, Hijnen DJ. Immunoglobulin
free light chains in adult atopic dermatitis patients do not correlate with disease severity. Clin Transl Allergy.
2016 Dec 6;6:44.
Thijs JL, Drylewicz J, Fiechter R, Strickland I, Sleeman MA, Herath A, May RD, Bruijnzeel-Koomen CAFM,
Knol EF, Giovannone B, de Bruin-Weller MS, Nierkens S, Hijnen DJ. EASI p-EASI: Utilising a combination of
serum biomarkers offers an objective measurement tool for disease severity in atopic dermatitis patients. J
Allergy Clin Immunol 2017. Accepted.
Thijs JL, Strickland I, Bruijnzeel-Koomen CAFM, Nierkens S, Giovannone B, Knol EF, Csomor E, Sellman BR,
Mustelin T, Sleeman MA, de Bruin-Weller MS, Herath A, Drylewicz J, May RD, Hijnen DJ. Moving towards
endotypes in atopic dermatitis: identification of patient clusters based on serum biomarker analysis. J Allergy
Clin Immunol 2017. Accepted.
217
Thijs JL, Strickland I, Bruijnzeel-Koomen CAFM, Nierkens S, Giovannone B, Knol EF, Csomor E, Sellman BR,
Mustelin T, Sleeman MA, de Bruin-Weller MS, Herath A, Drylewicz J, May RD, Hijnen DJ. Serum biomarker
profiles suggest that atopic dermatitis is a systemic disease. Under review.
Thijs JL, Drylewicz J, Bruijnzeel-Koomen CAFM, Giovannone B, Knol EF, de Bruin-Weller MS, Nierkens S,
Hijnen DJ. Levels of serum TARC, IL-22 and sIL-2R predict disease severity in atopic dermatitis patients
treated with Cyclosporin A. Under review.
Other publications
Thijs JL, Damoiseaux RA, Lucassen P, Pasmans SG, de Bruin-Weller M, Bruijnzeel-Koomen CAFM. Allergy
testing in atopic dermatitis: often unnecessary. Ned Tijdschr Geneeskd. 2013;157(12):A5652.
Thijs JL, Toonstra J, Hijnen DJ. Twee gevallen van acute gelokaliseerde exanthemateuze pustulose (ALEP).
Nederlands tijdschrift voor dermatologie en venereologie. 2014;4:195-199.
Garritsen FM, Thijs JL, Hijnen DJ, Bruijnzeel-Koomen CAFM, de Bruin-Weller MS. Constitutioneel eczeem bij
kinderen; Pathofysiologie, diagnostiek en behandeling. Praktische pediatrie. 2014;3:129-135.
Urbach C, Gordon NC, Strickland I, Lowne D, Joberty-Candotti C, May R, Herath A, Hijnen D, Thijs JL, Bruijn-
zeel-Koomen CA, Minter RR, Hollfelder F, Jermutus L. Combinatorial Screening Identifies Novel Promiscuous
Matrix Metalloproteinase Activities that Lead to Inhibition of the Therapeutic Target IL-13. Chem Biol. 2015
Nov 19;22(11):1442-52.
Thijs JL, de Bruin-Weller MS, Hijnen DJ. Current and Future Biomarkers in Atopic Dermatitis. Immunol Allergy
Clin North Am. 2017 Feb;37(1):51-61.
Thijs JL, Herath A, de Bruin-Weller MS, Hijnen D. Multiplex platform technology and bioinformatics are es-
sential for development of biomarkers in atopic dermatitis. J Allergy Clin Immunol. 2017 Mar;139(3):1065.

218
CURRICULUM VITAE
Judith werd geboren op 5 maart 1988 te Eindhoven. Na het behalen van haar atheneum diploma aan het
Christiaan Huygens College te Eindhoven in 2006, begon zij in datzelfde jaar met de studie rechtsgeleerdheid
aan de Universiteit van Utrecht. Na het succesvol afronden van haar propedeuse rechtsgeleerdheid werd
zij ingeloot voor de studie geneeskunde aan dezelfde universiteit. In jaar vier van haar studie heeft ze haar
coschap gynaecologie gelopen aan de University of Malaya in Kuala Lumpur, Maleisië. In de laatste twee
jaar van de opleiding heeft zij onder begeleiding van DirkJan Hijnen en Carla Bruijnzeel-Koomen onderzoek
gedaan naar constitutioneel eczeem op de afdeling Dermatologie/Allergologie. Na het behalen van haar
arts-examen in 2013, is zij aansluitend aangenomen als arts-onderzoeker op deze afdeling. De bevindingen
van haar onderzoek naar constitutioneel eczeem hebben geleid tot dit proefschrift. In 2017 is zij begonnen
met de opleiding tot dermatoloog in het UMC Utrecht onder leiding van Vigfús Sigurdsson.

219