Embed Size (px)
Citation preview
Page 1/21
Evaluation of Neonatal Cardiopulmonary andAnthropometric Indices: A Key Predictive ClinicalBiomarker for Neonatal Health StatusGideon T. Olowe
Delta State University, AbrakaSimon I Ovuakporaye
Delta State University, AbrakaBartholomew C. Nwogueze
Evangel UniversityMega O. Oyovwi ( [email protected] )
Achievers UniversityEmmanuel I. Odokuma
Delta State University, AbrakaVictor Emojevwe
University of Medical Sciences, Ondo,
Research Article
Keywords: Cardio-pulmonary, Anthropometry, Neonatal survival, Preterm neonates, Term neonates
Posted Date: October 12th, 2021
DOI: https://doi.org/10.21203/rs.3.rs-939470/v1
License: This work is licensed under a Creative Commons Attribution 4.0 International License. Read Full License

Page 2/21
Abstract
BackgroundNeonatal mortality has been reported as a major societal health menace across the globe. Hence, thisstudy, which adopted a hospital-based cross-sectional type of experimental research design, aimed atexamining the clinical indication of some selected cardiopulmonary and anthropometric indices as keypredictive clinical biomarkers for neonatal survival. The subjects were divided into three groups;experimental Group 1 consisted of 80 pre-term neonates within 28 weeks; experimental Group 2 consistedof 80 pre-term neonates within 33 weeks; and the control group, which consisted of 80 apparently healthy,term neonates. For each subject selected, cardio-pulmonary parameters and anthropometric variableswere obtained daily and compared. ANOVA, correlation coe�cients, and linear regression were used tocompare statistical measures. A discrimination accuracy test of previous records using cut pointsavailable from previous models was conducted for ease of estimating the possibility of neonatal survivalfrom assayed variables.
ResultsFollowing data collection, sorting, and analysis, the study found a statistically signi�cant decrease (p <0.05) in average systolic blood pressure (SBP) values of preterm neonates when compared with termneonates. This, however, was the reverse for DBP, which was proved to have increased in pretermneonates compared to term neonates. The study also observed a statistically signi�cant decrease (p <0.05) in RR and OSL levels of preterm neonates compared to term neonates.
ConclusionIn conclusion, cardiopulmonary and anthropometric status could be useful predictive biomarkers inclinical trials to provide insight into the extent of compromise in newborn health. This will help tominimize the death of neonates by ensuring a better treatment protocol/regimen is given. A corroborativestudy with an event-driven approach that assays more molecular or other non-physiological variables isrecommended.
1.0 IntroductionNeonatal period is the most vulnerable time as they face the highest risk of dying in their �rst month oflife, with the majority dying in the �rst week.1 Expanded body of evidence have shown that about 14million of the 130 million children born each year die within the �rst 28 days of life.2, 3
The �rst week accounts for three-quarters of neonatal deaths, with more than a quarter occurring withinthe �rst 24 hours.2 Neonatal deaths account for 40% of all deaths in children under the age of �ve
Page 3/21
worldwide.2 As a result, efforts in developed countries to meet the United Nations' development goals ofhalving childhood mortality by two-thirds by 2020 focused on reducing neonatal deaths.1
Childhood mortality is frequently used as a broad indicator of social development or a particular indicatorof a country's health conditions in this context. In the midst of this, child health programs, particularlyneonatal health, are frequently overlooked.1 Until early childhood, neonates' cardio-respiratory systems gothrough series of physiological changes. The cardiovascular and pulmonary anomalies are the mostcommon congenital abnormalities in newborns. 4 As a result of this, cardiovascular and respiratoryphysiology in neonates differ from that of older children and adults. Deaths in the NICU (neonatalintensive care unit) due to cardio-pulmonary pathologies are found to be the greatest in developing anddeveloped countries.5
Despite this, there has been little quanti�cation of predictive markers to predict neonatal survival andpredictors that can actually suggest the neonate's state of health in terms of the amount of treatmentthat should be given. As a result, physiological functions in neonates must be investigated as potentialtools for predicting neonatal survival using cardiopulmonary and anthropometric parameters. Thesemarkers include blood pressure, pulse rate, oxygen saturation level, and respiratory rate which are theregular cardio-pulmonary parameters in NICUs in developing countries, weight, length, and headcircumference are the regular anthropometric parameters6,5 in maternity clinics.
In this context, this study aimed at determining the changes in cardiopulmonary variables [SBP (SystolicBlood Pressure), DBP (Diastolic Blood Pressure), PR (Pulse Rate), RR (Respiratory Rate) and OSL (OxygenSaturation Level)] in term and pre-term neonates, investigating the changes in anthropometric parameters[Weight, Length, HC (Head Circumference)] in term and pre-term neonates, establishing a relationshipbetween cardiopulmonary and anthropometric variables in preterm and term neonates; and developing amultiple linear regression model from which neonatal survival can be predicted using cardio-pulmonaryand anthropometric parameters.
2.0 Materials And Methods2.1 Study Location: This study was conducted at the NICU, Central Hospital Warri, Delta State, Nigeria.Delta state occupies a land area of 16,842 square kilometers (6,503 square kilometers) between longitude50.00 and 60.45 East and latitude 50.0 and 60.30 North of the equator. With an approximatepopulation of 4,112.445 people (2,069,309 males and 2,043,136 females), it is a densely populated area.7
2.2 Study Population and Sample Size determination: The study population was derived from the totalnumber of neonates admitted in the NICU, Central Hospital Warri throughout the study duration. This wasestimated at 3,750 neonates; this value comprised those on admission throughout their neonatal periodand those discharged before they completed 28days of life for one reason or the other. From this number,a calculated sample was obtained using a single population proportion formula by considering p=50%,

Page 4/21
CI=95% and 5% margin of error. Finally, to compensate for non-response rate, 10% was added. Thus, toconduct this study a sample size of 240 was used
2.3 Study Design: A hospital-based cross-sectional type of experimental research design was adopted forthis study within the period of six (6) months. Data were obtained from a cross section of neonates onadmission in the NICU, Central Hospital Warri. The subjects were divided into three groups; ExperimentalGroup 1 consisting of 80 pre-term neonates within 28-32weeks, Experimental Group 2 consisting of 80pre-term neonates within 33-36weeks, and Control Group which consisted of 80 apparently healthy, termneonates. For each subject selected, cardio-pulmonary parameters (BP, PR, RR, and OSL) andAnthropometric variables (Weight, Length, and HC) were obtained daily and compared for changes acrossobtained data as earlier described in a previous study.3
2.4 Sampling Technique: Using the simple random sampling technique, preterm neonates’ of 28-36weeksgestation was drawn from the population of admitted neonates. As a rule, at least 10 events per potentialpredictor are required to build a prediction model. 31 Hence, the expected number of events was adequateto build a robust prediction model.
2.5 Eligibility Criterion: Only preterm neonates (28-36 weeks gestation) admitted into the NICU, CentralHospital Warri, Delta State were eligible to participate in the study. Neonates of mothers who are underintra-partum antibiotics as well as babies with prior antibiotic therapy for present illness were excludedfrom this study. Neonates with respiratory distress, who manifested signs with di�culty in breathing,were also excluded from this study.
2.6 Data Collection
2.6.1 Determination of Cardio-Pulmonary Parameters
Blood Pressure and Pulse Rate (PR)
Resting systolic and diastolic blood pressure were measured using the electronic sphygmomanometer(Omron Intelli sense M6 Comfort, Japan) with a neonatal blood pressure cuff that covered up to 40% ofthe preferred limb (right arm). The cuff was applied to the upper arm (left or right) of the neonate at alying position. 16 The heart rate was concomitantly recorded (in beats per minute) from thesphygmomanometer reading during blood pressure measurement. The neonates were required to rest in aquiet atmosphere for 30 minutes prior to assessment and recording as prescribed by. 9
Determination of Oxygen Saturation Level
Oxygen Saturation level was measured with a pulse oximetry device as earlier described by, 10 whichinvolves a non-invasive technique for measuring arterial oxygen saturation level. The device includes asensor that measures light absorption of haemoglobin and represents arterial oxygen saturation, SpO2. Itquanti�es the “Relative amount of light absorbed by oxyhemoglobin and deoxyhemoglobin”, comparing

Page 5/21
in any case the amount of light emitted. This comparison is then converted to a ratio and expressed inpercentage of SpO2.
Determination of Respiratory Rate (RR)
A person's respiratory rate is the number of breaths he or she takes per minute. This was measured in thenew-born when at rest by counting the number of breaths by counting how many times the chest rises inone minute as prescribed in a previous study. 11
2.6.2 Determination of Anthropometric Parameters
Weight, length, and head circumference were calculated using the methods de�ned by the AmericanCollege of Sports Medicine.12 Accordingly, all the anthropometric parameters were collected from theneonates in a supine position. The length and head circumference were measured with the aid of a�exible rubber measuring tape. For head circumference, the tape was wrapped snugly around thecircumference of the head from the most prominent part of the forehead (often 1-2 �ngers above theeyebrow) to the widest part of the back of the head. With the subject dressed in light clothes withoutshoes, shoulder relaxed, the arms hanged loosely, the heels and occiput in contact with the hard lying�oor, and the length was measured in centimeters from the head to the soles of the feet using ameasuring tape. Still dressed as above, the weights of subjects were measured in grams (g) using anelectronic weighing scale (Cardinal Scale Manufacturing Co., Webb Area, MO).To ensure speci�city, eachneonate was assessed three (3) times.2.7 Statistical Analysis
Statistical measure of Association (Correlation) was used to establish a relationship between measuredvariables. Con�dence levels for all statistical based calculations were set at p < 0.05. Were applicable,one-way ANOVA was used to check differences in mean between groups. All statistical tests wereautomated, using the graph pad prison (version 8.0).
3.0 Results
3.1 Changes in Cardiovascular status of Term and Pre-TermNeonatesThe changes in cardiovascular variables of term and pre-term neonates are shown in Table 1.Accordingly, pre-term of week 28-32 and Week 33-36 respectively revealed a signi�cant (p < 0.05)increased in blood pressure as indicated by increased SBP (mmHg) and DBP (mmHg) level withcorresponding decreased in PR (BPM) at week 28-32 when compared to term neonate. Notably, there wasan increase in PR of pre-term neonate (Week 33-36) as related to term neonate
Table 1: ANOVA Result for Changes in Cardiovascular status of Term and Pre-Term Neonates

Page 6/21
Parameters
Remark Term (Control)
Pre-Term (Exp.) ANOVA
(p-value)Week 28-32 Week 33-36
SBP (mmHg) 100.06±2.46 114.24±2.89* 99.30±2.11 0.0307 Signi�cant
DBP(mmHg)
78.16±0.98
80.01±1.61
83.13±1.31*
0.0041
Signi�cant
PR (BPM)
139.90 ± 4.18
121.10 ± 3.91
155.17±6.02*
0.0006
Signi�cant
SBP- Systolic Blood pressure. DBP-Diastolic blood pressure, PR-Pulse rate.* p < 0.05 signi�cant whencompared to the control
3.2 Changes in Anthropometric status of Term and Pre-Term NeonatesAs shown in Table. 2, one-way ANOVA followed by post-hoc test showed that pre-term of week 28-32 andWeek 33-36 respectively revealed a signi�cant (p < 0.05) decreased in neonatal weight (kg), length (cm)and HC (cm) when compared to term neonate throughout the period of the study.
Table 2
ANOVA Result for Changes in Anthropometric status of Term and Pre-Term NeonatesParameters Remark
Term (Control) Pre-Term (Exp.) ANOVA
(p-value)ANOVA
(p-value)
Week 28-32
Week 33-36
Birth Weight (Kg) 3.44±0.43 2.48±0.25 2.76±0.31 0.0017 Signi�cant
Length (cm) 50.6±7.23 42.9±6.81 48.8±9.16 0.0050 Signi�cant
Head Circumference(cm)
35.34±3.31 28.52±2.96 30.18±2.56 0.0012 Signi�cant
*p < 0.05 signi�cant when compared to the control

Page 7/21
3.3. Comparative Changes in pulmonary status of Term andPre-Term NeonatesAs shown in Fig. 1a-b, one-way ANOVA followed by post-hoc test showed that pre-term of week 28-32 andWeek 33-36 respectively revealed a signi�cant (p < 0.05) decreased in RR (Cycle/Min) (1a), and OSL (%)(1b) when compared to term neonate. However, pre-term of week 28-32 shows a highly signi�cant (p <0.05) decreased in RR and OSL when compared pre-term of Week 33-36. \
3.4 Relationship between Cardiovascular status in NeonatesPearson’s correlation coe�cient (R) between various neonatal cardiovascular measurements arepresented in Fig. 2. All of the neonatal cardiovascular parameters such as systolic blood pressure (SBP),Diastolic blood pressure (DBP), and pulse rate (PR) had a positive correlation between each parameters(p<0.05). The correlation coe�cient (R) value ranged from 0.16 to 1.00. The highest correlation wasobserved on both SBP (r=1.00), DBP (r=1.00), and PR (r=1.00).
3.5 Respiratory status in NeonatesPearson’s correlation coe�cient (R) between various neonatal respiratory measurements are presented inFig. 3. All of the neonatal respiratory parameters such as respiratory rate (RR), and oxygen saturationlevel (OSL) had a positive statistically signi�cant correlation between each parameters (p<0.05). RR, andOSL had a positive statistically signi�cant correlation when correlated with each other (p<0.05). Thecorrelation coe�cient (R) value ranged from 0.5 to 1.00. The highest correlation was observed on both RR(r=1.00), and OSL (r=1.00).
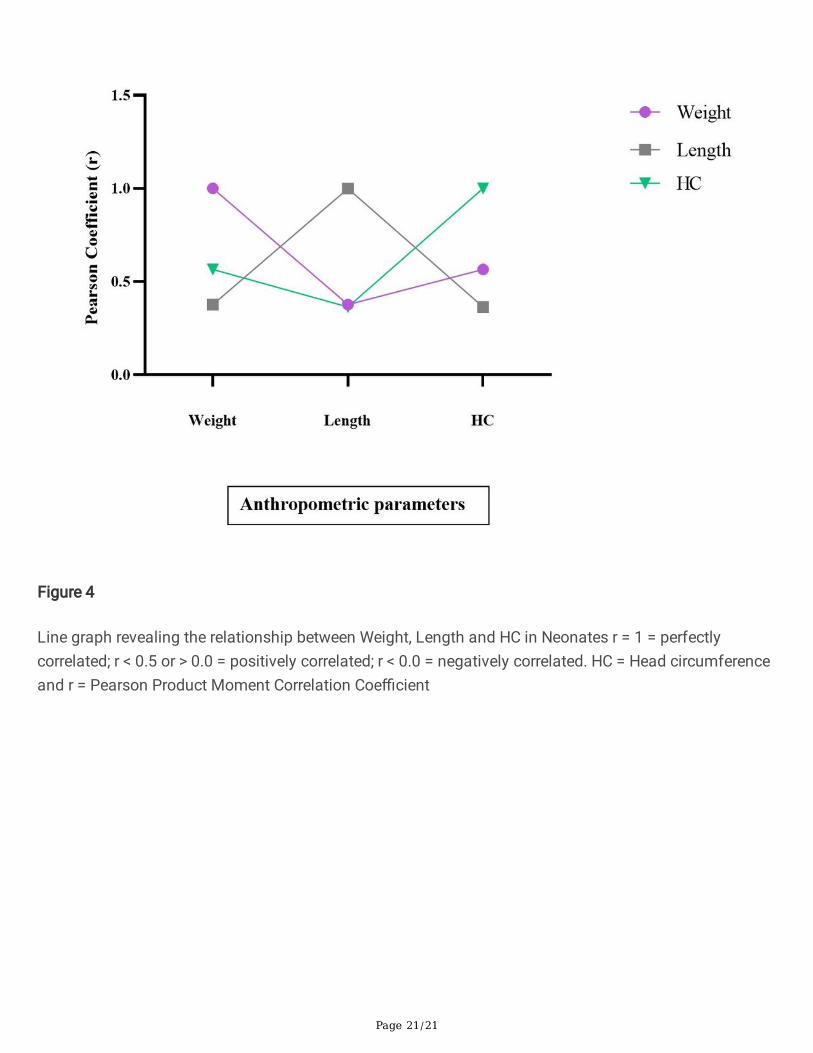
3.6 Relationship between Neonatal Anthropometric statusin NeonatesPearson’s correlation coe�cient (R) between various neonatal anthropometric measurements arepresented in Fig. 4. All of the anthropometric parameters such as birth weight (Kg), length (cm) and headcircumference (HC) from the neonates had a positive statistically signi�cant correlation between eachparameters (p<0.05). Weight, length and HC had a positive statistically signi�cant correlation whencorrelated with each of the anthropometric measurement (p<0.05). The correlation coe�cient (R) valueranged from 0.42 to 1.00. The highest correlation was observed on both BW (r=1.00), Length (r=1.00), andHC (r=1.00).
3.7 Prediction of RR from Neonatal cardiovascularParameters in Preterm Neonates using multiple linearregressionIn predicting or estimating RR from neonatal cardiovascular measurements in pre-term neonates, amultiple linear regression analyses were carried out and the report is shown in (Table 3). Notably, It was
Page 8/21
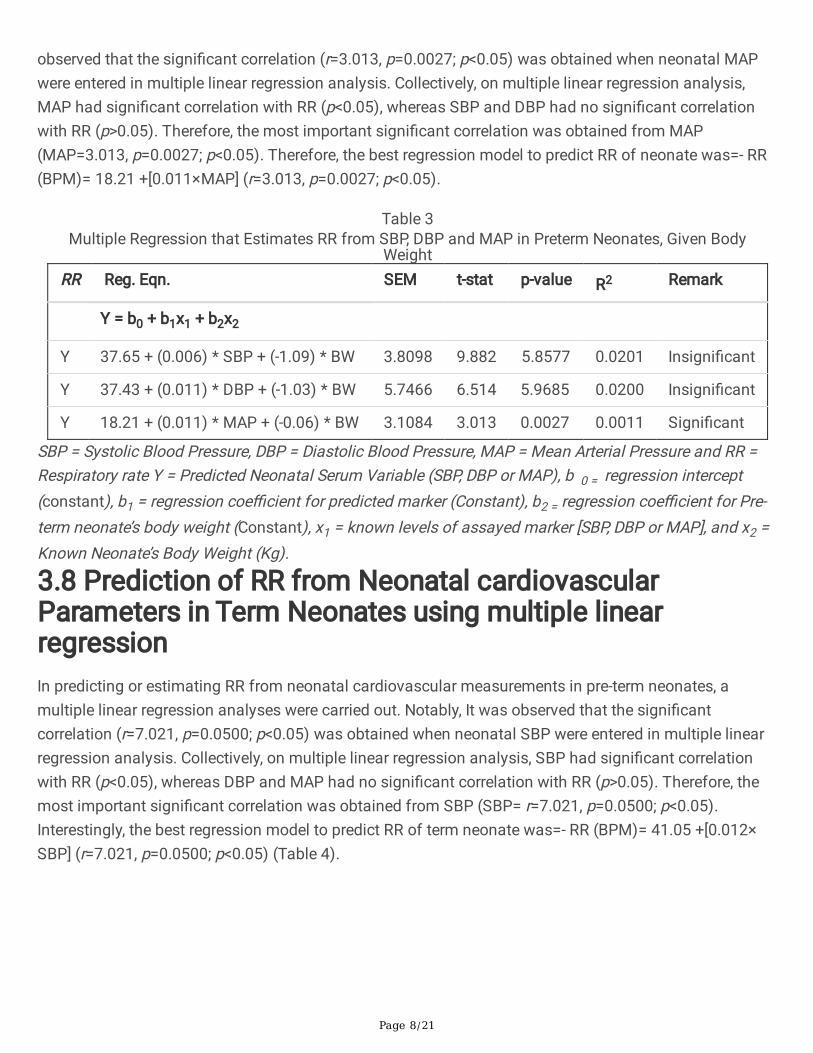
observed that the signi�cant correlation (r=3.013, p=0.0027; p<0.05) was obtained when neonatal MAPwere entered in multiple linear regression analysis. Collectively, on multiple linear regression analysis,MAP had signi�cant correlation with RR (p<0.05), whereas SBP and DBP had no signi�cant correlationwith RR (p>0.05). Therefore, the most important signi�cant correlation was obtained from MAP(MAP=3.013, p=0.0027; p<0.05). Therefore, the best regression model to predict RR of neonate was=- RR(BPM)= 18.21 +[0.011×MAP] (r=3.013, p=0.0027; p<0.05).
Table 3Multiple Regression that Estimates RR from SBP, DBP and MAP in Preterm Neonates, Given Body
WeightRR Reg. Eqn. SEM t-stat p-value R2 Remark
Y = b0 + b1x1 + b2x2
Y 37.65 + (0.006) * SBP + (-1.09) * BW 3.8098 9.882 5.8577 0.0201 Insigni�cant
Y 37.43 + (0.011) * DBP + (-1.03) * BW 5.7466 6.514 5.9685 0.0200 Insigni�cant
Y 18.21 + (0.011) * MAP + (-0.06) * BW 3.1084 3.013 0.0027 0.0011 Signi�cant
SBP = Systolic Blood Pressure, DBP = Diastolic Blood Pressure, MAP = Mean Arterial Pressure and RR =Respiratory rate Y = Predicted Neonatal Serum Variable (SBP, DBP or MAP), b 0 = regression intercept(constant), b1 = regression coe�cient for predicted marker (Constant), b2 = regression coe�cient for Pre-term neonate’s body weight (Constant), x1 = known levels of assayed marker [SBP, DBP or MAP], and x2 =Known Neonate’s Body Weight (Kg).
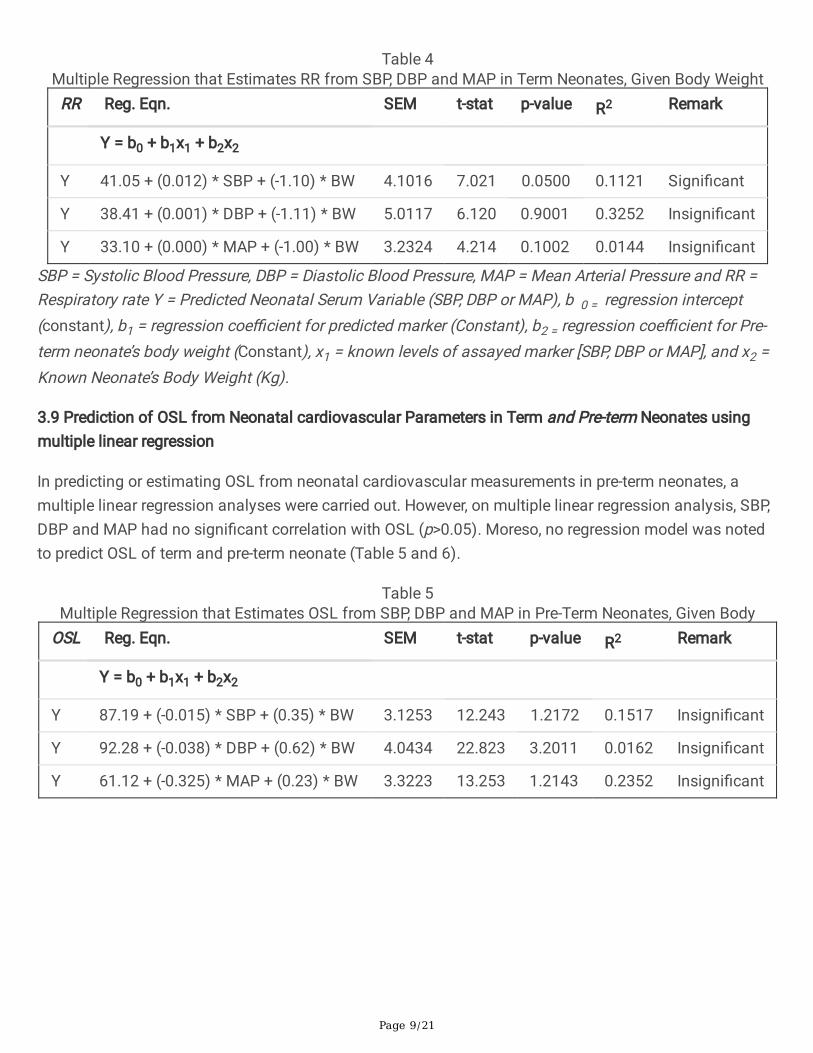
3.8 Prediction of RR from Neonatal cardiovascularParameters in Term Neonates using multiple linearregressionIn predicting or estimating RR from neonatal cardiovascular measurements in pre-term neonates, amultiple linear regression analyses were carried out. Notably, It was observed that the signi�cantcorrelation (r=7.021, p=0.0500; p<0.05) was obtained when neonatal SBP were entered in multiple linearregression analysis. Collectively, on multiple linear regression analysis, SBP had signi�cant correlationwith RR (p<0.05), whereas DBP and MAP had no signi�cant correlation with RR (p>0.05). Therefore, themost important signi�cant correlation was obtained from SBP (SBP= r=7.021, p=0.0500; p<0.05).Interestingly, the best regression model to predict RR of term neonate was=- RR (BPM)= 41.05 +[0.012×SBP] (r=7.021, p=0.0500; p<0.05) (Table 4).
Page 9/21
Table 4Multiple Regression that Estimates RR from SBP, DBP and MAP in Term Neonates, Given Body Weight
RR Reg. Eqn. SEM t-stat p-value R2 Remark
Y = b0 + b1x1 + b2x2
Y 41.05 + (0.012) * SBP + (-1.10) * BW 4.1016 7.021 0.0500 0.1121 Signi�cant
Y 38.41 + (0.001) * DBP + (-1.11) * BW 5.0117 6.120 0.9001 0.3252 Insigni�cant
Y 33.10 + (0.000) * MAP + (-1.00) * BW 3.2324 4.214 0.1002 0.0144 Insigni�cant
SBP = Systolic Blood Pressure, DBP = Diastolic Blood Pressure, MAP = Mean Arterial Pressure and RR =Respiratory rate Y = Predicted Neonatal Serum Variable (SBP, DBP or MAP), b 0 = regression intercept(constant), b1 = regression coe�cient for predicted marker (Constant), b2 = regression coe�cient for Pre-term neonate’s body weight (Constant), x1 = known levels of assayed marker [SBP, DBP or MAP], and x2 =Known Neonate’s Body Weight (Kg).
3.9 Prediction of OSL from Neonatal cardiovascular Parameters in Term and Pre-term Neonates usingmultiple linear regression
In predicting or estimating OSL from neonatal cardiovascular measurements in pre-term neonates, amultiple linear regression analyses were carried out. However, on multiple linear regression analysis, SBP,DBP and MAP had no signi�cant correlation with OSL (p>0.05). Moreso, no regression model was notedto predict OSL of term and pre-term neonate (Table 5 and 6).
Table 5Multiple Regression that Estimates OSL from SBP, DBP and MAP in Pre-Term Neonates, Given Body
OSL Reg. Eqn. SEM t-stat p-value R2 Remark
Y = b0 + b1x1 + b2x2
Y 87.19 + (-0.015) * SBP + (0.35) * BW 3.1253 12.243 1.2172 0.1517 Insigni�cant
Y 92.28 + (-0.038) * DBP + (0.62) * BW 4.0434 22.823 3.2011 0.0162 Insigni�cant
Y 61.12 + (-0.325) * MAP + (0.23) * BW 3.3223 13.253 1.2143 0.2352 Insigni�cant

Page 10/21
Table 6Multiple Regression that Estimates OSL from SBP, DBP and MAP in Term Neonates, Given Body WeightOSL Reg. Eqn. SEM t-stat p-value R2 Remark
Y = b0 + b1x1 + b2x2
Y 83.52 + (0.006) * SBP + (0.13) * BW 4.1232 11.224 0.2123 1.1321 Insigni�cant
Y 82.28 + (0.013) * DBP + (0.12) * BW 3.1221 10.122 0.4001 0.2262 Insigni�cant
Y 62.12 + (0.001) * MAP + (0.21) * BW 3.1224 9.232 0.2040 1.2522 Insigni�cant
SBP = Systolic Blood Pressure, DBP = Diastolic Blood Pressure, MAP = Mean Arterial Pressure and OSL =Oxygen Saturation Level; Y = Predicted Neonatal Serum Variable (SBP, DBP or MAP), b 0 = regressionintercept (constant), b1 = regression coe�cient for predicted marker (Constant), b2 = regression coe�cientfor Pre-term neonate’s body weight (Constant), x1 = known levels of assayed marker [SBP, DBP or MAP],and x2 = Known Neonate’s Body Weight (Kg). .
3.10 Prediction of OSL and RR from Neonatal pulmonary Parameters in Pre-Term Neonates usingmultiple linear regression
In predicting or estimating RR from neonatal pulmonary measurements in pre-term neonates, a multiplelinear regression analyses were carried out. It was observed that the signi�cant correlation (r=4.1760,p=0.0052; p<0.05) was obtained when neonatal OSL were entered in multiple linear regression analysis.Accordingly, on multiple linear regression analysis, OSL had signi�cant correlation with RR (p<0.05),whereas RR had no signi�cant correlation with OSL (p>0.05). Therefore, the most important signi�cantcorrelation was obtained from OSL (OSL= r=4.1760, p=0.0052; p<0.05). Interestingly, the best regressionmodel to predict RR of pre-term neonate was=- RR (BPM)= 99.44 +[0.018× OSL] (r=4.1760, p=0.0052;p<0.05) (Table 7).
Table 7Multiple Regression that Estimates OSL and RR in Pre-Term Neonates, Given Body Weight
OSL orRR
Reg. Eqn. SEM t-stat p-value
R2 Remark
Y = b0 + b1x1 + b2x2
Y (RR) 99.44 + (0.018) * OSL + (4.00)* BW
23.8130 4.1760 0.0052 0.0396 Signi�cant
Y (OSL) 102.46 + (-0.038) * RR + (3.97)* BW
8.5161 12.032 2.7922 0.0398 Insigni�cant
Pressure and OSL = Oxygen Saturation Level, RR = Respiratory Rate; Y = Predicted Neonatal SerumVariable (OSL or RR), b 0 = regression intercept (constant), b1 = regression coe�cient for predicted marker(Constant), b2 = regression coe�cient for Pre-term neonate’s body weight (Constant), x1 = known levels ofassayed marker [OSL or RR], and x2 = Known Neonate’s Body Weight (Kg).

Page 11/21
3.11 Prediction of OSL and RR from Neonatal pulmonary Parameters in Term Neonates using multiplelinear regression
In predicting or estimating RR from neonatal pulmonary measurements in term neonates, a multiplelinear regression analyses were carried out. It was observed that the signi�cant correlation (r=10.2529,p=00.0022; p<0.05) was obtained when neonatal OSL were entered in multiple linear regression analysis.Accordingly, on multiple linear regression analysis, OSL had signi�cant correlation with RR (p<0.05),whereas RR had no signi�cant correlation with OSL (p>0.05). Therefore, the most important signi�cantcorrelation was obtained from OSL (OSL= r=10.2529, p=00.0022; p<0.05). Interestingly, the bestregression model to predict RR of term neonate was=- RR (BPM)= 11046+[0.023× OSL] (r=10.2529,p=00.0022; p<0.05) (Table 8).
Table 8Multiple Regression that Estimates OSL and RR in Term Neonates, Given Body Weight
OSL orRR
Reg. Eqn. SEM t-stat p-value
R2 Remark
Y = b0 + b1x1 + b2x2
Y(OSL) 94.21 + (0.021) * RR + (3.01) *BW
18.3322 3.1244 0.1328 1.0103 Insigni�cant
Y(RR) 11046 + (0.023) * OSL + (1.01)* BW
10.2529 2.0125 0.0022 1.2633 Signi�cant
Pressure and OSL = Oxygen Saturation Level, RR = Respiratory Rate; Y = Predicted Neonatal SerumVariable (OSL or RR), b 0 = regression intercept (constant), b1 = regression coe�cient for predicted marker(Constant), b2 = regression coe�cient for Pre-term neonate’s body weight (Constant), x1 = known levels ofassayed marker [OSL or RR], and x2 = Known Neonate’s Body Weight (Kg).
3.12 Predictive Accuracy Measure of the Regression Model
Based on the predictive biomarkers of the regression model, the individual parameters (e.g. MAP andOSL) as indicated in model 1 had better predictive potential for pre-term neonate survival whereas thebest predictor for term neonate are SBP and OSL (Model 2) as statistically correlated with RR (Table 9).

Page 12/21
Table 9Regression Model Predictive AccuracyMeasurements for neonatal survival
MODEL 1:
Regression model for pre-term neonates
RR (BPM) = 18.21 + [0.011 × MAP] + (-0.06) x BW
RR (BPM) = 99.44 + [0.018 × OSL] + (4.00) x BW
MODEL 2:
Regression model for term neonates
RR (BPM) = 41.05 + [0.012 × SBP] + (1.10) x BW
RR (BPM) = 110.46 + [0.023 × OSL] + (1.01) x BW
4.0 DiscussionThis study evaluated neonatal cardiopulmonary and anthropometric status as key predictive clinicalbiomarkers for neonatal survival. It created a model that can be used to predict physiological variables interm and preterm neonates based on known variables. The chances of neonatal survival are high if itfalls within the normal range as de�ned by the World Health Organization (WHO) and low if it fallsoutside the normal range. The discussion thus centers around and highlights reports, both current andprevious, relating to the physiological changes in selected cardio-pulmonary and anthropometric healthindices of newborns within the �rst 28 days of extra-uterine life (neonates).
Blood pressure is classi�ed as “high” (HBP) when the mean SBP exceeds 120 mmHg or the DBP exceeds80 mmHg. 13 The average systolic and diastolic blood pressures of each participant neonate was withinnormal limits at baseline. This was expected as it was one of the selection criteria to exclude new bornbabies with any cardiovascular health complications and/or anomalies.
This study also showed a signi�cant decrease (p < 0.05) in average body weight of pre-term neonatescompared with term neonate. This could be due to intra-uterine growth. Thus term neonates might havegained more weights due to long period of stay in-utero as earlier explained by .14 Throughout themonitoring period, the drop in preterm newborn weight became more gradual when compared to the termneonates, as a signi�cant increase in average body weight was noticed at some period in the normal termneonate used in present study. Newborn infants whose developments in-utero occasioned by intrauterinegrowth restriction (IUGR) are usually small-for gestational-age (SGA), a body weight < 3rd centile.15 MostIUGR infants are the consequence of utero-placental insu�ciency that occurs during the third trimester.14
Consequently, the weight was affected so that the neonate appears wasted. These gestational insultsoften cause critical under-nutrition and impair musculoskeletal growth, resulting in a stunted neonate

Page 13/21
with reduced weight and length.14 Therefore the observed reduced body weight noted in preterm neonatesin this study could have been as a result of utero-placental insu�ciency also noted in an earlier study.15
Blood pressure is one of the commonest clinical methods of assessing circulatory status of humans. 16
In this study, the Systolic Blood Pressure (SBP) and Diastolic Blood Pressure (DBP) were assessed and acomparison was made in these values in term and preterm neonates. Accordingly, there was astatistically signi�cant increase (p < 0.05) in the blood pressure parameters (SBP and DBP) for pre-termcompared to term neonates. Thus, this current study deduced SBP as a key cardiovascular health markerwhich is revealed to be higher in preterm than term neonates. The DBP is apparently more crucial, andtherefore having this lowering ability is more bene�cial. Hence, modi�cation for the prevention andmanagement of high blood pressure is needed in preterm than term neonate. Considering all these,preterm neonates could be assumed to have a more chaotic (or less linear) cardiovascular functionbehavior than term neonates. The preterm neonates, who have no well-balanced sympathetic-parasympathetic systems, can also be considered “less healthy” within the concept of health anddisease. This logic is explained easily due to some intrinsic or extrinsic factors that must occur to justifydelivery before the term (<37 weeks of gestation). It is also expected that differences in age and thepresence or absence of co morbidities changes the results of the assayed variables (SBP and DBP) usedin assessing the standard cardiovascular patterns in this study. This �nding corroborate previous studyby. 17
The pulse rate (PR) signi�cantly affects cardiovascular function, and it is a vital marker for neonatalcardiovascular risk assessment. 9 In this study, the PR was seen to have signi�cantly increased (p < 0.05)in preterm than term neonates upon comparison. This depicts its immense bene�t in reducingcardiovascular risk in term than preterm babies. This �nding agrees with that from a similar study by 18
where there was no signi�cant difference in PR with time for term babies.
In clinical practice, preterm neonates are closely monitored for diseases and related complications. Aslong as the “low-risk” neonates born at term appear well, they are subjected to the bare minimum ofstandardized observations. 19 Unexpected diseases in term neonates, on the other hand, are normal andcan quickly become life-threatening shortly after birth. 20, 21,11
Tachypnea, a condition characterized by respiratory rate higher than normal (RR) is used a symptoms ofvarious diseases in the immediate neonatal period.22 Results from this study shows a statisticallysigni�cant increase in RR of preterm compared with term neonates. By implication, this is suggestive of ahigh risk factor for preterm babies, speci�cally in the respiratory system. The increased work of breathingseen in preterm neonates in this study may be attributed to mismatched pulmonary mechanics. It mayalso be due to increased airway resistance (Pressure/Volumetric Flow), decreased lung compliance(Volume/Pressure), or both as earlier explained by 23
Naturally, neonates undergo key physiologic changes during transition from intrauterine to extra-uterinelife.10 In most cases, this transition is smooth. About 5-10% reportedly requires breathing supports, and

Page 14/21
about 1% requires absolute resuscitation.10 The indications and timing of supplemental oxygen therapyto assist the newborn in this transition has been a matter of debate. 11 The 2010 International LiaisonCommittee on Resuscitation (ILCOR) recommendations states resuscitation can be initiated with room airor blended oxygen, but it should be guided by measurement of oxygen saturation using pulse oximetry.11
The target saturation was established to fall within the interquartile range of preductal saturationsmeasured in healthy term babies following vaginal birth at sea level. 11 In this current study, there was astatistically signi�cant decrease OSL in preterm neonates compared to term neonates (p < 0.01). Themean time taken for the pre-ductal saturation to reach 90% was 7.4 minutes and for post-ductal 9.5minutes. The mean time taken for equalization of pre and post- ductal saturation was 11.46 minutes withno signi�cant correlation with time. Furthermore, about 74% of the term neonates had equalization of preand post ductal SpO2 values over time. It is however shown that preterm neonates have lower SpO2values when compared to term neonates, and they take a longer time to attain SpO2 values of more than85%. 24 Furthermore, this study shows that the time taken for a preterm neonate to reach maximum SpO2delivery is more than that required for term neonates, corresponding to the explanation of on the subjectmatter. 24 This study also supports the hypothesis that preterm babies may have lower SpO2 comparedto term babies, and they take longer time to achieve normal saturation .25 It may be noted that theInternational Liaison Committee on Resuscitation (ILCOR) guidelines make no recommendations forusing different time cut offs for these neonates .26 However, we suggest that routine pulse oximetry isperformed on neonates until weeks after birth for proper monitoring of the cyanosis and relatedcondition.
In terms of anthropometric measurements, the current study found that birth weight, length, and headcircumference all correlated positively with neonate survival, which is consistent with earlier studies. 27, 3,
28, 29, 30,
Based on the predictive biomarkers of the regression model, the MAP and OSL had better predictivepotential for pre-term neonate survival whereas the best predictor for term neonate are SBP and OSLwhich are statistically correlated with RR as shown in the results. Interestingly, signi�cant correlation wasobserved for all the cardiopulmonary and anthropometric variables. Thus, all the parameters in this studyare reliable to predict neonatal survival. This study formulated regression modeling equations fromcardiopulmonary and anthropometric parameters to predict neonatal survival. Notably, statisticallysigni�cant regression equation was derived with MAP and OSL as independent variables in pretermneonates, while SBP and OSL are independent variables in term neonates. However, RR seems to be themost reliable dependent variable for both preterm and term neonates. The calculated RR within normallimit in both term and preterm neonates predicts a higher chance of survival, while calculated RR outsidenormal limits in both term and preterm neonates predicts lower chances of survival. To the best of ourknowledge, no research work has formulated a regression model predictive accuracy measurements forneonatal survival using a combination of neonatal cardiopulmonary and anthropometric parameters.Hence, this �nding could be useful by community health workers to provide insight into the extent of

Page 15/21
compromise in the newborn health. More so, prediction of neonatal cardiopulmonary and anthropometricstatus is crucial to ensuring better treatment protocol/regimen
ConclusionsThe study concluded that anthropometric measurements as well as cardiopulmonary indices are goodpredictors of neonatal survival. There was a decrease in RR and SpO2 in preterm neonates, indicatingincreased work of breathing and cyanosis, respectively. As a result, the knowledge of newborncardiopulmonary and anthropometric variables may be effective predictive markers for early discovery ofneonates that are at high risk of neonatal death, triggering earlier and more drastic care. A corroborativestudy with an event-driven approach that assays more molecular or other non-physiological variables isrecommended.
DeclarationsEthics approval and consent to participate
Ethical approval was sought from the “Ethics and Research Committee”, Central Hospital Warri (ProtocolNumber: CHW/ECC Vol 1/213) and the “Research, Ethics and Grant Committee”, Faculty of Basic MedicalSciences, Delta State University, Abraka, Nigeria (Reference Number: REC/FBMS/DELSU/20/79). Aninformed consent was obtained from mothers of neonates included in this study. All methods wereperformed in accordance to the guideline provided by the ethical committees
Consent for publication
Not required
Availability of data and materials
Data obtained from this study is available on request from the corresponding author and Olowe G.T.
Competing interests
The authors declare that there is no con�ict of interest of any form
Funding
The research was funded by the authors
Authors' Contributions
OSI and OEI conceptualised, designed and supervised the research, OGT and NBC conducted theresearch, OOM provided analytical tools and analyzed the data, EV prepared the manuscript, while allauthors read and approved the manuscript
Page 16/21
Acknowledgements
A Special thanks to all technical staff of the Department of Physiology, Delta state University, Abraka.
References1. Bhutta ZA, Hafeez A, Rizvi A, Ali N, Khan A, Ahmad F, Bhutta S, Hazir T, Zaidi A, Jafarey SN. “Maternal
and child health in Pakistan: challenges and opportunities”. The Lancet., 2019; 381: 3–5
2. Lawn JE, Cousens SN, Wilczynska K. “Estimating the causes of four million neonatal deaths in theyear”. International Journal of Epidemiology 2020; 35(3): 706–718
3. Tiruneh C, Teshome D. Prediction of Birth Weight by Using Neonatal Anthropometric Parameters atBirth in Finote Selam Hospital, Ethiopia. Pediatric Health Med Ther. 2021;12:259–267
4. Garne E, Haeusler M, Barisic I, Gjergja R, Stoll C, Clementi M. “Congenital diaphragmatic hernia:evaluation of prenatal diagnosis in 20 European regions. Ultrasound Obstet Gynecol 2012 19(4):329-333.
5. Pattinson R, Kerber K, Waiswa P, Day LT, Mussell F, Asiruddin SK., Blencowe H, Lawn JE. “Perinatalmortality audit: counting, accountability, and overcoming challenges in scaling up in low- andmiddle-income countries”. International Journal of Gynecology & Obstetrics 2019; 107 Suppl 1:S113-21, S121-2
�. Azevedo IG, Holanda NSO, Arrais NMR, Santos RTG, Araujo AGF, Pereira SA. Chest circumference infull-term newborns: how can it be predicted? BMC Pediatr. 2019;19(1):341
7. National Planning Commission [Nigeria]. 2012. Executive extract: Nutrition division adoption by theFederal Executive Council, 2012. Abuja, Nigeria: National Planning Commission.
�. Balogun JA, Obajuluwa BA, Olaogun MO, Abereoje OK, Oyeyemi AY, Adeodu OO, Balogun MO.“Anthropometric determinants of resting blood pressures and heart rates of Nigerian school children”.Annals of Tropical paediatric 1990; 10(4):425–431
9. Athanase DP, Charalambos V, Frederique T, Yi Z, Bruno P, Jacques B, Michel ES. “LongitudinalChanges in Mean and Pulse Pressure, and All-Cause Mortality: Data From 71,629 UntreatedNormotensive Individuals”. American Journal of Hypertension 2017; 30(11): 1093–1099
10. Baldwin, Dees E. Embryology and physiology of cardiovascular system. In: Avery’s Diseases of theNewborn 9th ed. Philadelphia: Elsevier Saunders 2012; 699713
11. Bancalari E, Claure N. Principles of respiratory monitoring and therapy. In: Avery’s Diseases of theNewborn 9th ed. Philadelphia: Elsevier Saunders 2012; 612–632
12. Garber CE, Blissmer B, Deschenes MR, Franklin BA, Lamonte MJ, Lee IM, Nieman DC, Swain DP.American College of Sports Medicine position stand. Quantity and quality of exercise for developingand maintaining cardiorespiratory, musculoskeletal, and neuromotor �tness in apparently healthyadults: guidance for prescribing exercise. Med Sci Sports Exerc. 2011;43(7):1334–59.
Page 17/21
13. Panel E. Executive summary of the clinical guidelines on the identi�cation, evaluation, and treatmentof overweight and obesity in adults and Neonates. Archives of Internal Medicine 2008; 158(8), 1855–1867.
14. Beattie RB, Johnson P. “Practical assessment of neonatal nutrition status beyond birthweight: animperative for the 1990s”. International Journal of Obstetrics and Gynecology 2004; 101: 842–846
15. Olsen IE, Richardson DK, Schmid CH, Ausman LM, Dwyer JT. ”The impact of early transfer bias in agrowth study among neonatal intensive care units”. Journal of Clinical Epidemiology 2013, 56(10):998–1005.
1�. Jones CM, Baker-Groberg SM, Cianchetti FA, Glynn JJ, Healy LD, Lam WY, Nelson JW, Parrish DC,Phillips KG, Scott-Drechsel DE, Tagge IJ, Zelaya JE, Hinds MT, McCarty OJ. Measurement science inthe circulatory system. Cell Mol Bioeng. 2014;7(1):1–14.
17. Huikuri HV, Makikällio TH, Perkiomaki J. “Measurement of heart rate variability by methods based onnonlinear dynamics”. J Electrocardiol 2013; 36: 95–99.
1�. Phillipos E, Solevåg AL, Pichler G, Aziz K, van Os S, O’Reilly M., et al. “Heart Rate AssessmentImmediately after Birth”. Neonatology 2016 109(2):130–138
19. Benitz WE. “Hospital stay for healthy term newborn infants”. American Academy of Pediatrics 2015;135(5): 948–953
20. Finer N N, Barrington KJ.. “Nitric oxide for respiratory failure in infants born at or near term”.Cochrane Database Syst Rev 2006; 4
21. Stoll BJ, Hansen NI, Sánchez PJ. “Early onset neonatal sepsis: the burden of group B Streptococcaland E. coli disease continues”. Journal of the American Academy of Pediatrics 2011; 128(2): 390
22. Reuter S, Moser C, Baack M. Respiratory distress in the newborn. Pediatrics in review 2014; 35(10),417–429
23. Ellwein Fix L, Khoury J, Moores RR, Jr Linkous L, Brandes M, Rozycki HJ. Theoretical open-loopmodel of respiratory mechanics in the extremely preterm infant. PloS one 2018;, 13(6), e0198425.
24. Harris A, Sendak MJ, Donham RT. “Changes in arterial oxygen saturation immediately after birth inthe human neonate”. J Pediatr 2016; 109(1):117–119
25. Dawson JA, Kamlin CO, Vento M, Wong C, Cole TJ, Donath SM, Davis PG. “De�ning the referencerange for oxygen saturation for infants after birth”. Pediatrics 2010; 125(6): e13401347
2�. Kattwinkel J, Perlman JM, Aziz K, Colby C, Fairchild K, Gallagher J, Hazinski MF.. “Part 15: neonatalresuscitation: 2010 American Heart Association Guidelines for Cardiopulmonary Resuscitation andEmergency Cardiovascular Care”. Circulation 2010; 122 (18): S909-19
27. Goto E. Meta-analysis: identi�cation of low birth weight by other anthropometric measurements atbirth in developing countries. J Epidemiol 2011; 21(5):354–362.
2�. Elizabeth NL, Christopher OG, Patrick K. Determining an anthropometric surrogate measure foridentifying low birth weight babies in Uganda: a hospital-based cross sectional study. BMC Pediatr2013; 13(1):1–7.

Page 18/21
29. Hadush MY, Berhe AH, Medhanyie AA. Foot length, chest and head circumference measurements indetection of low birth weight neonates in Mekelle, Ethiopia: a hospital based cross sectional study2017;17(1):1–8.
30. Chukwudi NK, Nwokeukwu HI, Adimorah GN. Use of a simple anthropometric measurement toidentify low-birth-weight infants in Enugu, Nigeria. Global Pediatric Health, 2018;5:2333794X18788174.
31. Eric V, Charles EM. “Relaxing the Rule of Ten Events per Variable in Logistic and Cox Regression”.American Journal of Epidemiology 2006; 165(6): 1–9
Figures
Figure 1
a-b. Comparative Changes in Respiratory Rates of Term and Pre-Term Neonates respiratory rate, RR (b)and oxygen saturation level, OSL (b). Bars represent the mean ± S.E.M (n = 80). One way ANOVA followedby Bonferroni’s post-hoc test revealed that there are signi�cant differences between various neonatalgroups. *-- = statistically signi�cant decrease in OSL among pre-term neonates 28-32 weeks gestationcompared to term (control) neonates at p-value < 0.05; #-- = statistically insigni�cant decrease in OSLamong pre-term neonates 33-36weeks gestation compared to term (control) neonates at p-value < 0.05

Page 19/21
Figure 2
Line graph revealing the relationship between SBP, DBP and PR in Neonates r = 1 = perfectly correlated; r <0.5 or > 0.0 = positively correlated; r < 0.0 = negatively correlated. SBP = Systolic Blood Pressure, DBP =Diastolic Blood Pressure, PR = Pulse Rate and r = Pearson Product Moment Correlation Coe�cient

Page 20/21
Figure 3
Line graph revealing the relationship between RR and OSL in Neonates. RR = Respiratory Rate, OSL =Oxygen Saturation Level, and r = Pearson Product Moment Correlation. Coe�cient r = 1 = perfectlycorrelated; r < 0.5 or > 0.0 = positively correlated; r < 0.0 = negatively correlated
Page 21/21
Figure 4
Line graph revealing the relationship between Weight, Length and HC in Neonates r = 1 = perfectlycorrelated; r < 0.5 or > 0.0 = positively correlated; r < 0.0 = negatively correlated. HC = Head circumferenceand r = Pearson Product Moment Correlation Coe�cient