Embed Size (px)
Citation preview
ESSENTIAL BIOLOGY G: ECOLOGY OPTION
1. Define the following terms:
Gross production
Net Production
2. Explain why gross production is always higher than net production.
3. Write the calculation used for determining gross production, net production and respiration.
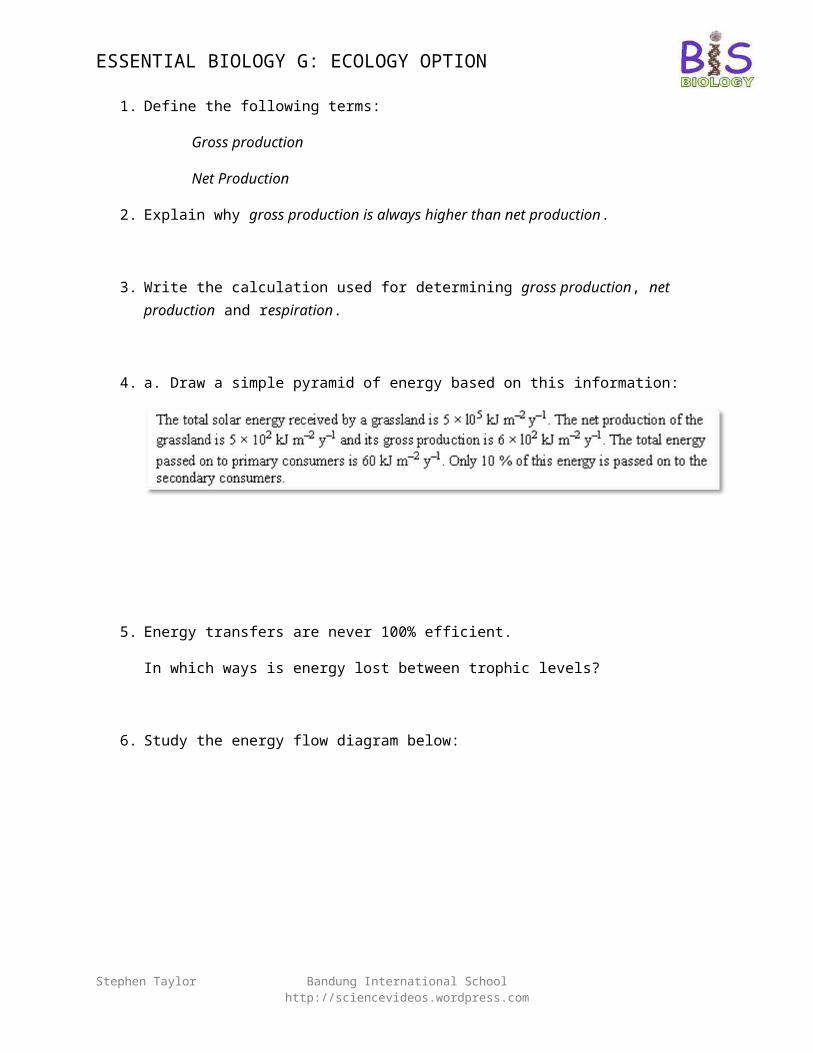
4. a. Draw a simple pyramid of energy based on this information:
5. Energy transfers are never 100% efficient.
In which ways is energy lost between trophic levels?
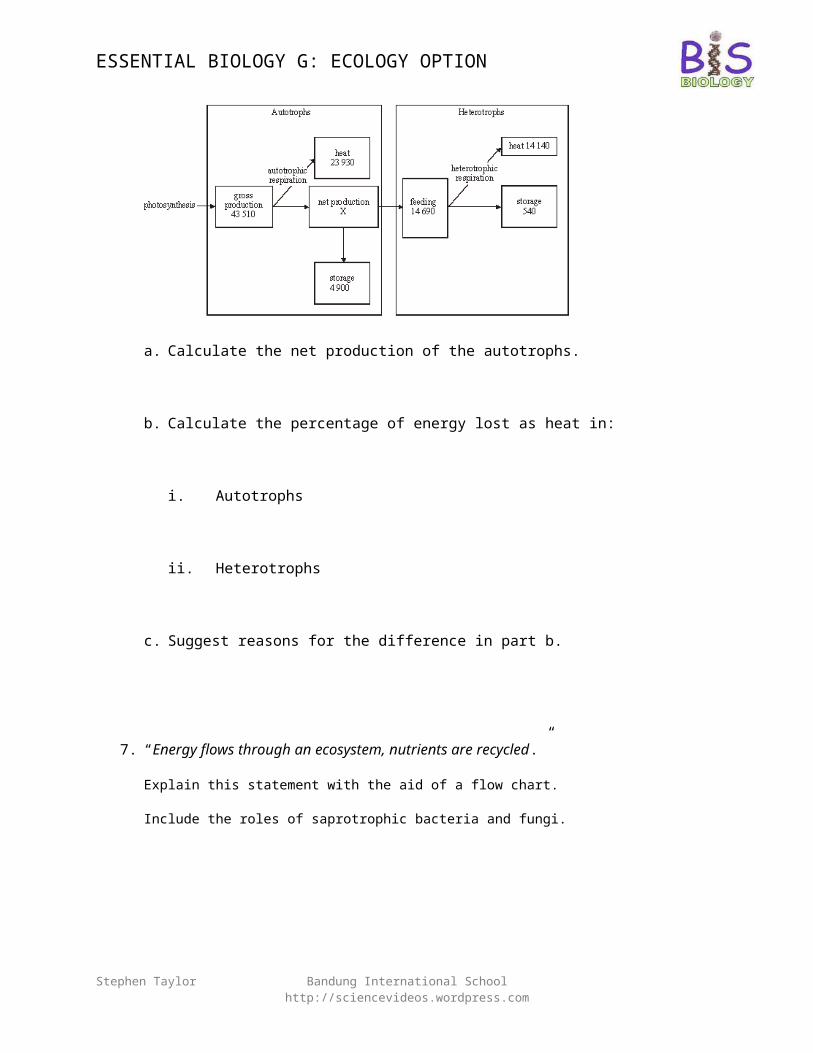
6. Study the energy flow diagram below:
Stephen Taylor Bandung International School http://sciencevideos.wordpress.com
ESSENTIAL BIOLOGY G: ECOLOGY OPTION
a. Calculate the net production of the autotrophs.
b. Calculate the percentage of energy lost as heat in:
i. Autotrophs
ii. Heterotrophs
c. Suggest reasons for the difference in part b.
7. “Energy flows through an ecosystem, nutrients are recycled.”
Explain this statement with the aid of a flow chart.
Include the roles of saprotrophic bacteria and fungi.
8. Define biomass.
Stephen Taylor Bandung International School http://sciencevideos.wordpress.com
ESSENTIAL BIOLOGY G: ECOLOGY OPTION
9. Suggest some reasons for studying the biomass of an ecosystem.
10. Outline one method for estimating the biomass of different trophic levels of an ecosystem.
How do researchers ensure both minimal impact and maximal reliability of results?
11. Explain why biomass is generally low at higher trophic levels.
12. Distinguish between primary and secondary succession, with two examples of each.
Primary succession
Secondary succession
13. Describe the effects of succession on the following factors:
Productivity
Biomass
Stephen Taylor Bandung International School http://sciencevideos.wordpress.com
ESSENTIAL BIOLOGY G: ECOLOGY OPTION
Biodiversity
14. In what ways do living organisms affect the abiotic environment in primary succession?
Soil composition & strength
Organic nutrients
Mineral Nutrients
Water uptake
15. Distinguish between biome and biosphere.
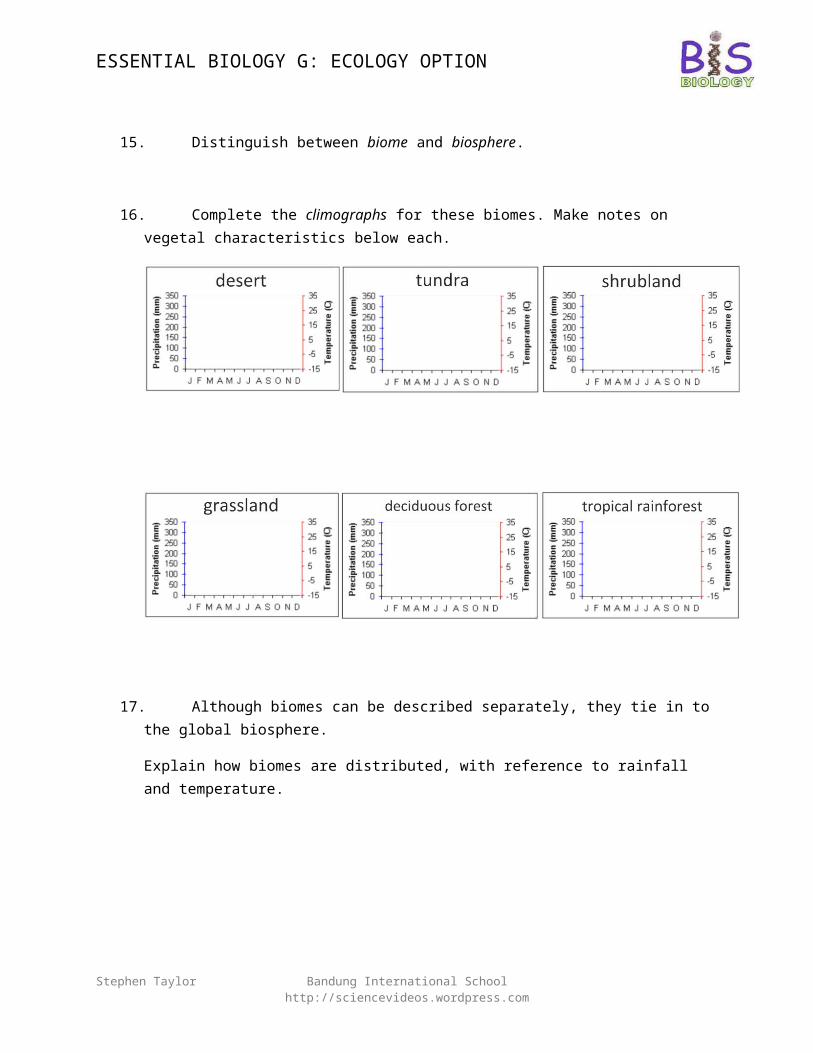
16. Complete the climographs for these biomes. Make notes on vegetal characteristics below each.
Stephen Taylor Bandung International School http://sciencevideos.wordpress.com
ESSENTIAL BIOLOGY G: ECOLOGY OPTION
17. Although biomes can be described separately, they tie in to the global biosphere.
Explain how biomes are distributed, with reference to rainfall and temperature.
18. Draw a box diagram to show the effects of natality, mortality, immigration and emigration on a population:
19. Under which conditions will a population:
a. Grow
b. Decline
20. In the space below, draw a population growth curve.
Annotate it to explain the exponential, transition and plateau phases and carrying capacity.
Stephen Taylor Bandung International School http://sciencevideos.wordpress.com
ESSENTIAL BIOLOGY G: ECOLOGY OPTION
21. What are three factors that set limits to population growth?
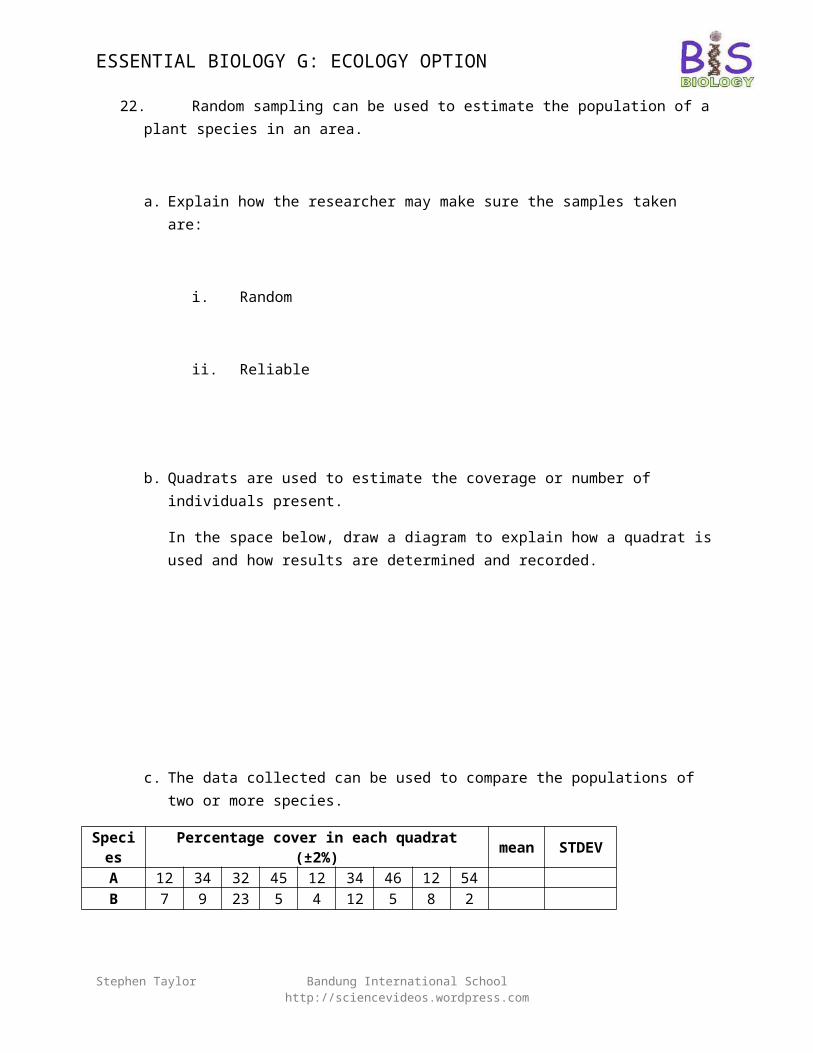
22. Random sampling can be used to estimate the population of a plant species in an area.
a. Explain how the researcher may make sure the samples taken are:
i. Random
ii. Reliable
b. Quadrats are used to estimate the coverage or number of individuals present.
In the space below, draw a diagram to explain how a quadrat is used and how results are determined and recorded.
c. The data collected can be used to compare the populations of two or more species.
Species Percentage cover in each quadrat (±2%) mean STDEVA 12 34 32 45 12 34 46 12 54B 7 9 23 5 4 12 5 8 2
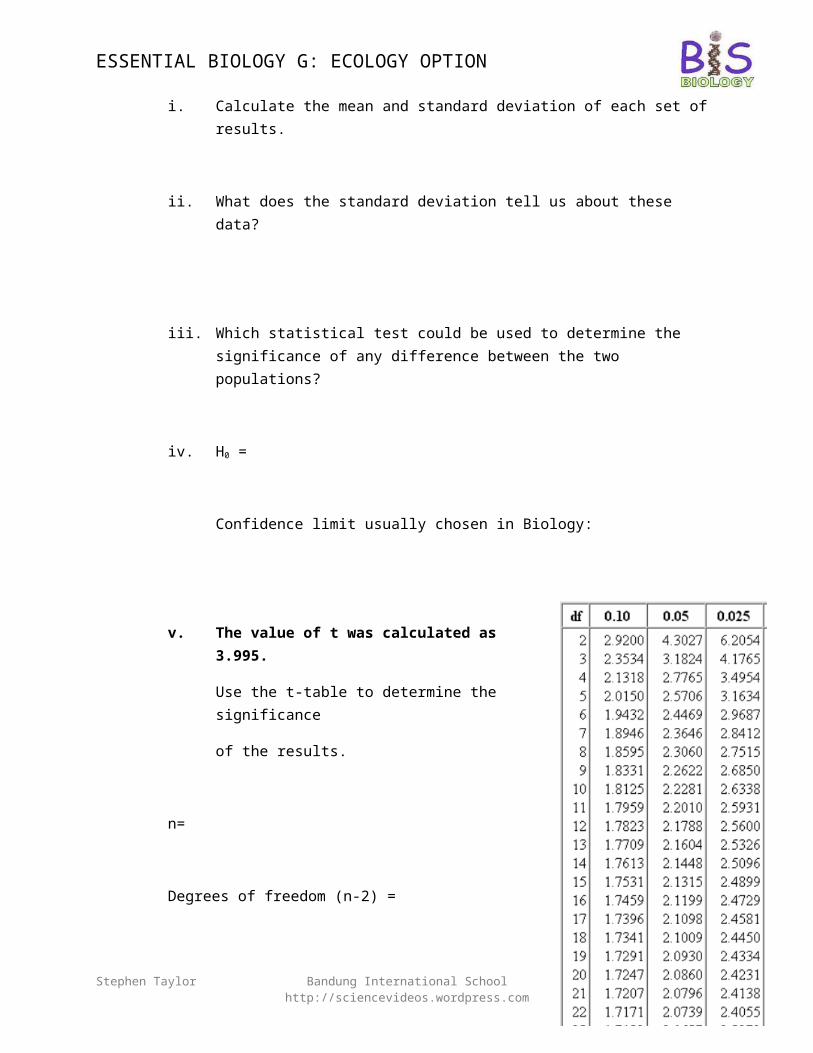
i. Calculate the mean and standard deviation of each set of results.
Stephen Taylor Bandung International School http://sciencevideos.wordpress.com
ESSENTIAL BIOLOGY G: ECOLOGY OPTION
ii. What does the standard deviation tell us about these data?
iii. Which statistical test could be used to determine the significance of any difference between the two populations?
iv. H0 =
Confidence limit usually chosen in Biology:
v. The value of t was calculated as 3.995.
Use the t-table to determine the significance
of the results.
n=
Degrees of freedom (n-2) =
Critical value =
Is ‘t’ greater than or less than the critical value?
Therefore reject/ accept H0.
Stephen Taylor Bandung International School http://sciencevideos.wordpress.com
ESSENTIAL BIOLOGY G: ECOLOGY OPTION
There is / is no significant difference in distribution of species
A and species B.
Can you also complete this using Excel?
23. What is the function of a transect?
24. Explain how a transect would be carried out to correlate the distribution of a species with and abiotic variable.
25. What is meant by the term “correlation does not necessarily imply causation”?
26. What is the function of Simpson’s Diversity Index?
27. Describe how Simpson’s Index could be used to compare two parts of a stream.
Stephen Taylor Bandung International School http://sciencevideos.wordpress.com
ESSENTIAL BIOLOGY G: ECOLOGY OPTION
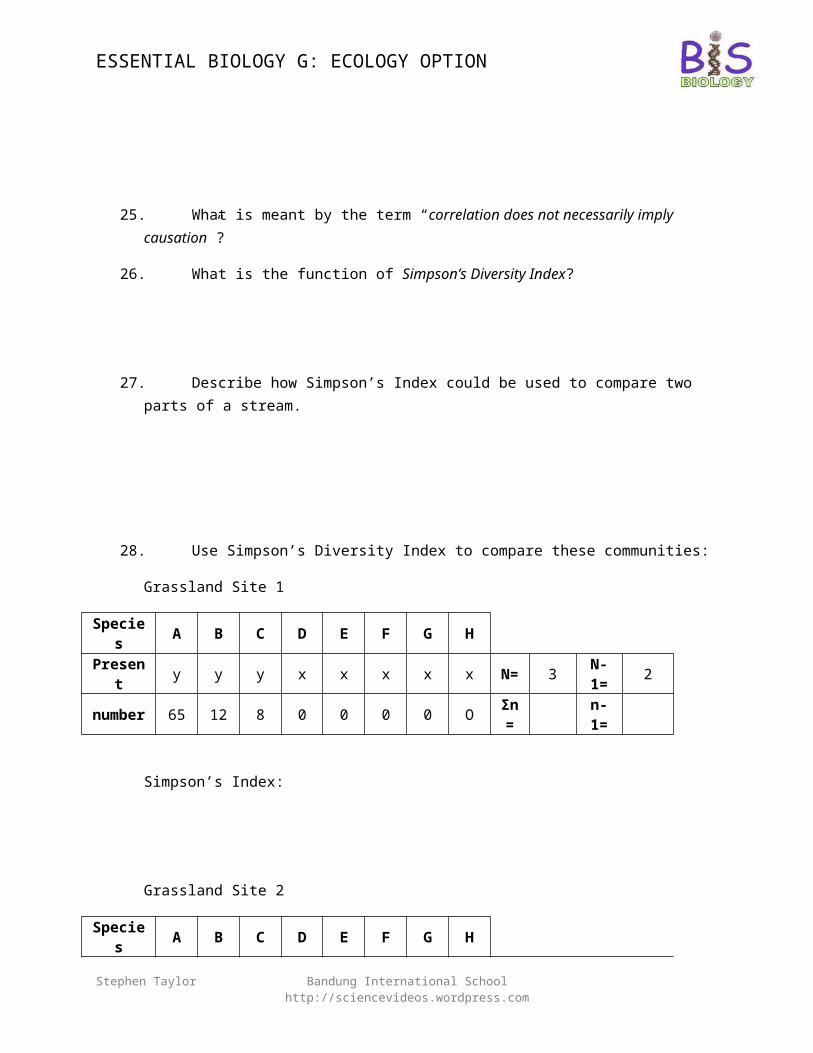
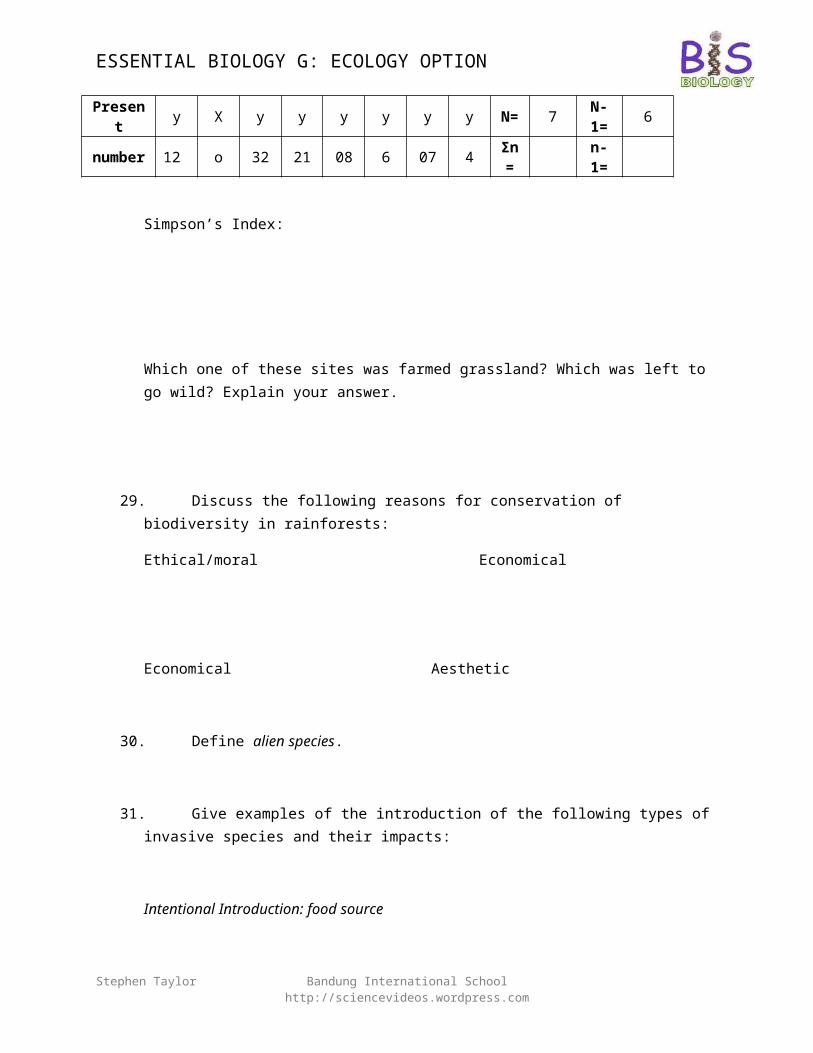
28. Use Simpson’s Diversity Index to compare these communities:
Grassland Site 1
Species A B C D E F G H
Present y y y x x x x x N= 3 N-1= 2
number 65 12 8 0 0 0 0 O Σn= n-1=
Simpson’s Index:
Grassland Site 2
Species A B C D E F G H
Present y X y y y y y y N= 7 N-1= 6
number 12 o 32 21 08 6 07 4 Σn= n-1=
Simpson’s Index:
Which one of these sites was farmed grassland? Which was left to go wild? Explain your answer.
29. Discuss the following reasons for conservation of biodiversity in rainforests:
Ethical/moral Economical
Economical Aesthetic
Stephen Taylor Bandung International School http://sciencevideos.wordpress.com
ESSENTIAL BIOLOGY G: ECOLOGY OPTION
30. Define alien species.
31. Give examples of the introduction of the following types of invasive species and their impacts:
Intentional Introduction: food source
Intentional Introduction: biological control
Accidental Introduction: human exploration
Accidental Introduction: shipping or globalization
32. How do alien species have the following impacts on ecosystems? Give examples.
Predation
Interspecific competition
Habitat destruction
Biological control
Extinction
33. Describe how RHDV has been used as biological control in Australia.
Stephen Taylor Bandung International School http://sciencevideos.wordpress.com
ESSENTIAL BIOLOGY G: ECOLOGY OPTION
34. Distinguish between bioaccumulation and biomagnification.
35. Using a diagram or flow-chart, describe the cause and consequences of one named example of biomagnification.
36. Outline some of the methods used to measure or estimate atmospheric carbon dioxide.
37. What is ozone and what is its function in the stratosphere.
38. Outline the effect of CFCs on the ozone layer.
39. Outline the effects of UV radiation on living tissues and biological productivity.
Stephen Taylor Bandung International School http://sciencevideos.wordpress.com
ESSENTIAL BIOLOGY G: ECOLOGY OPTION
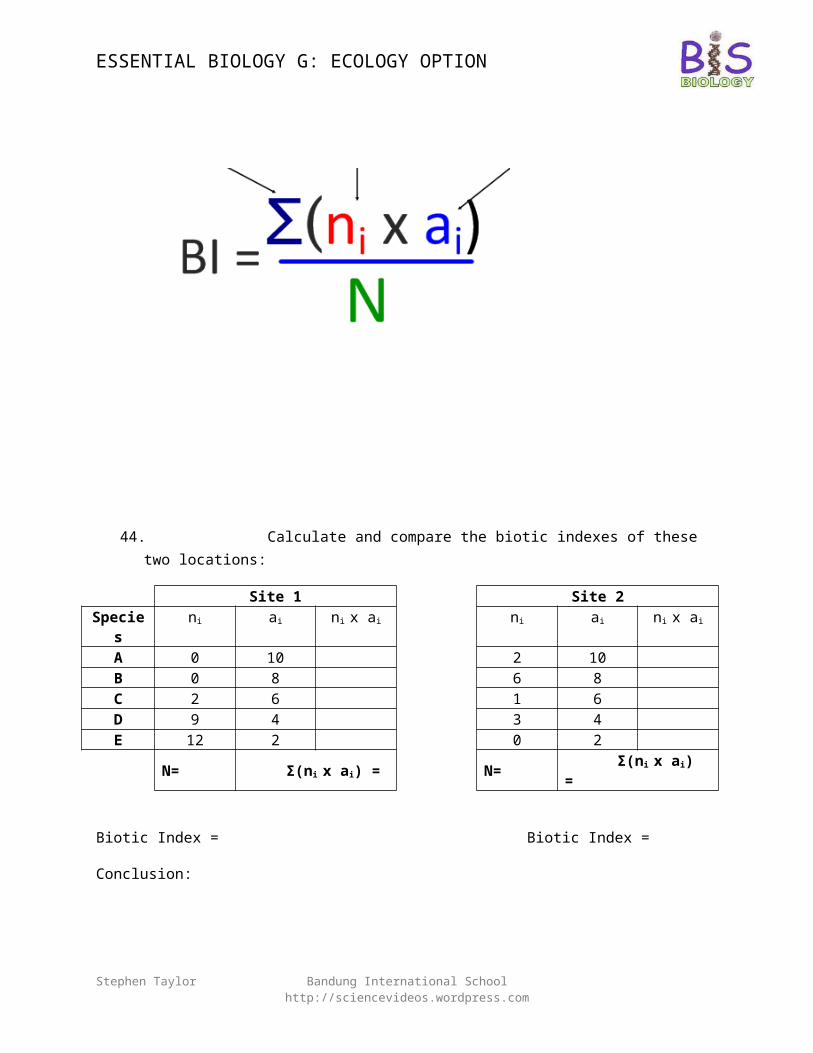
40. Define biotic index.
41. Outline how a tolerance rating can be applied to a species.
42. List some examples of freshwater invertebrate species which are indicators of:
a. Good water quality
b. Poor water quality
43. Annotate the equation below to show the components of a biotic index calculation.
Stephen Taylor Bandung International School http://sciencevideos.wordpress.com
ESSENTIAL BIOLOGY G: ECOLOGY OPTION
44. Calculate and compare the biotic indexes of these two locations:
Site 1 Site 2Species ni ai ni x ai ni ai ni x ai
A 0 10 2 10B 0 8 6 8C 2 6 1 6D 9 4 3 4E 12 2 0 2
N= Σ(ni x ai) = N= Σ(ni x ai) =
Biotic Index = Biotic Index =
Conclusion:
45. How does the application of a biotic index differ from a diversity index?
46. How might biotic and/or diversity index data be used in the monitoring of an ecosystem?
Stephen Taylor Bandung International School http://sciencevideos.wordpress.com
ESSENTIAL BIOLOGY G: ECOLOGY OPTION
47. Describe how the extinction of the dodo came about.
Event:
Effects:
Why was the dodo vulnerable?
Suggest some measures that could have been taken to prevent the extinction of the dodo.
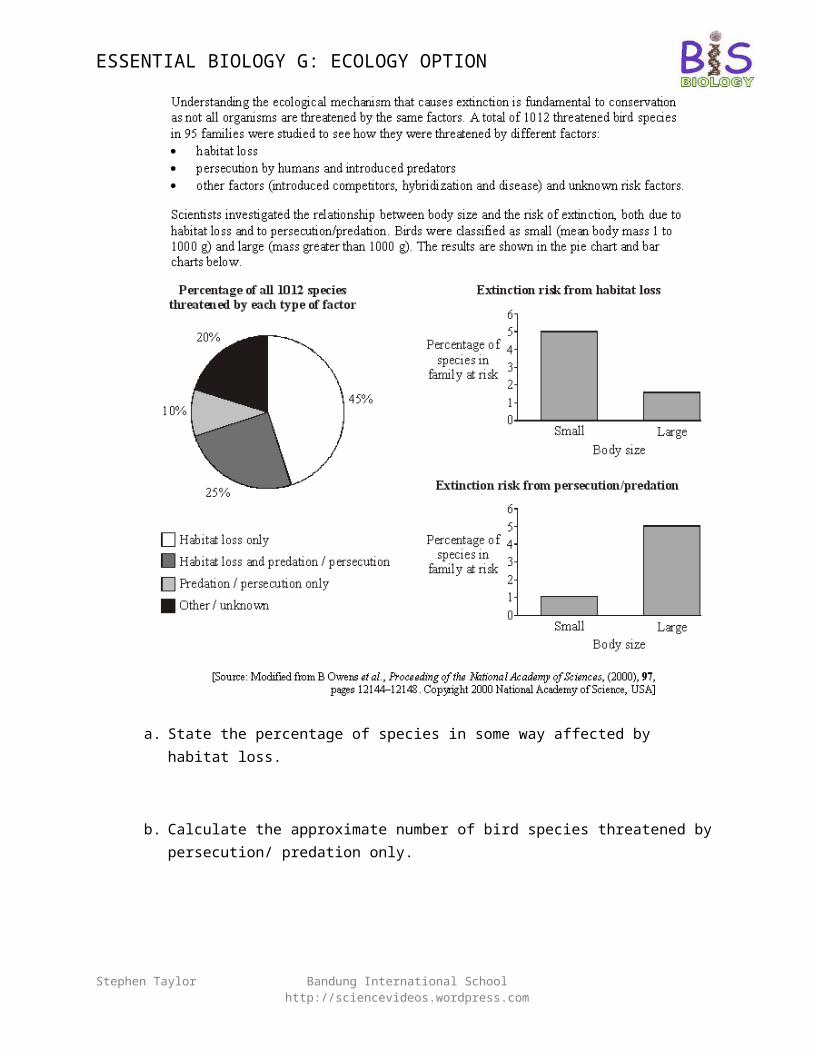
48. Complete the following Structured Data Analysis question:
Stephen Taylor Bandung International School http://sciencevideos.wordpress.com
ESSENTIAL BIOLOGY G: ECOLOGY OPTION
a. State the percentage of species in some way affected by habitat loss.
b. Calculate the approximate number of bird species threatened by persecution/ predation only.
c. State two factors that could have caused habitat loss.
Stephen Taylor Bandung International School http://sciencevideos.wordpress.com
ESSENTIAL BIOLOGY G: ECOLOGY OPTION
49. What is a nature reserve?
50. How do the following biogeographical features of nature reserves aid in species conservation? Give examples of species that can take advantage of each of these effects.
Size
Habitat corridors
Edge Effect
51. Explain how the edge effect can have a negative impact on reserves which are small in size.
52. What is active management with regard to conservation?
53. Which of the following qualify as active management strategies?
a. Culling invasive species
b. Leaving an area to grow wild
c. Fencing off an area to prevent poachers from gaining entry
d. Building new habitats
e. Replanting vegetation
Stephen Taylor Bandung International School http://sciencevideos.wordpress.com
ESSENTIAL BIOLOGY G: ECOLOGY OPTION
54. Using an Indonesian example, discuss how active management of a nature reserve has had a positive impact on biodiversity.
55. Distinguish between in-situ and ex-situ conservation of endangered species.
56. Complete the table to give the advantages and some plant and animal examples of in-situ and ex-situ conservation measures.
In-situ Ex-situ
Advantages
Plant examples
Animal examples
57. Outline how the following ex-situ methods can help in conservation of endangered species:
Seed banks
Botanic Gardens
Captive breeding
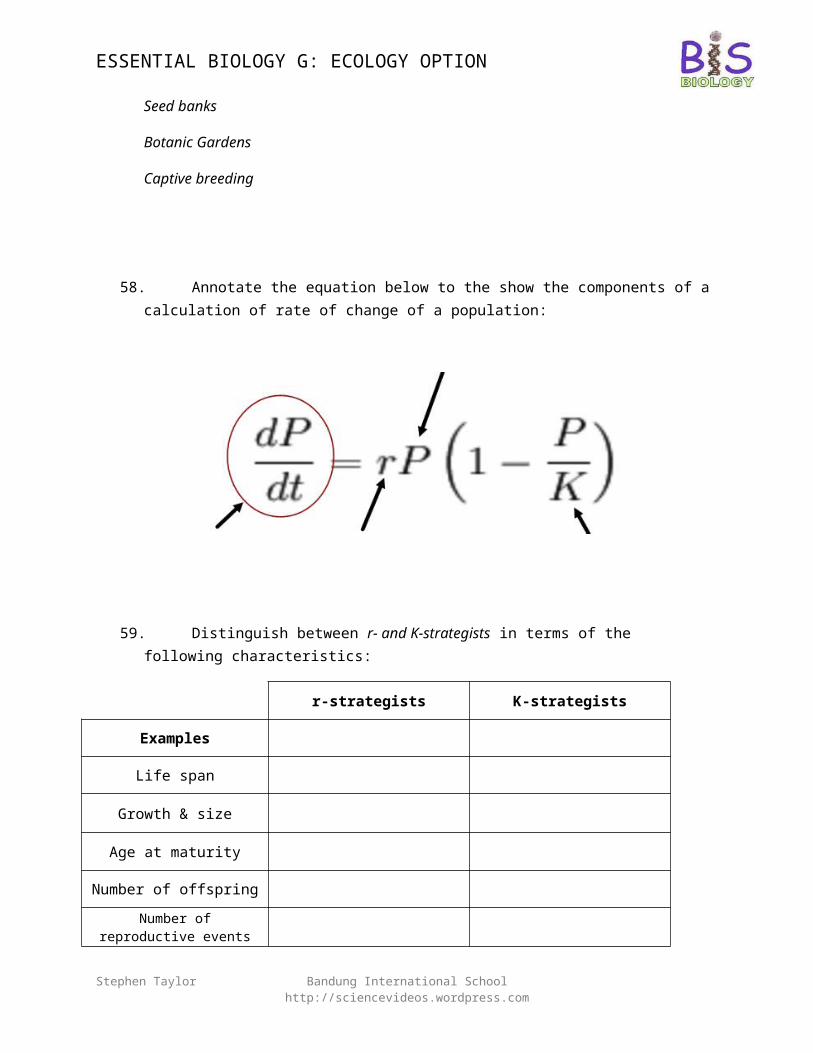
58. Annotate the equation below to the show the components of a calculation of rate of change of a population:
Stephen Taylor Bandung International School http://sciencevideos.wordpress.com
ESSENTIAL BIOLOGY G: ECOLOGY OPTION
59. Distinguish between r- and K-strategists in terms of the following characteristics:
r-strategists K-strategists
Examples
Life span
Growth & size
Age at maturity
Number of offspring
Number of reproductive events
Competition
Favoured environmental conditions
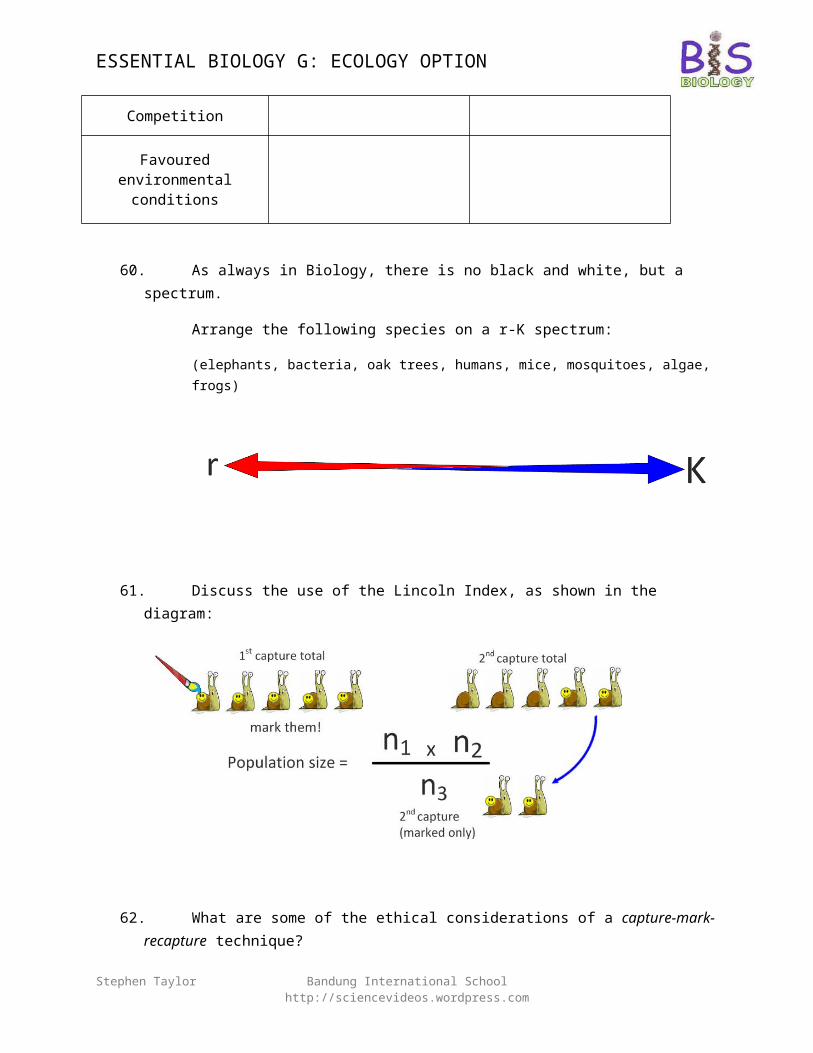
60. As always in Biology, there is no black and white, but a spectrum.
Arrange the following species on a r-K spectrum:
(elephants, bacteria, oak trees, humans, mice, mosquitoes, algae, frogs)
Stephen Taylor Bandung International School http://sciencevideos.wordpress.com
ESSENTIAL BIOLOGY G: ECOLOGY OPTION
61. Discuss the use of the Lincoln Index, as shown in the diagram:
62. What are some of the ethical considerations of a capture-mark-recapture technique?
63. What are some of the practical difficulties associated with a capture-mark-recapture
technique?
64. What is a commercial fish stock?
65. How can the following methods be used to estimate the size of commercial fish stocks?
Stephen Taylor Bandung International School http://sciencevideos.wordpress.com
ESSENTIAL BIOLOGY G: ECOLOGY OPTION
Fish catch data
Capture-Mark-Recapture
Echolocation or Satellite data
66. What are the ecological and economical impacts of overfishing?
67. When setting catch limits, which groups might be considered as stakeholders in the decision?
68. Answer this Structured Data Analysis question on fish catch data.
Stephen Taylor Bandung International School http://sciencevideos.wordpress.com
ESSENTIAL BIOLOGY G: ECOLOGY OPTION
a. Calculate the percentage of the world catch that came from the Atlantic in 1990.
b. Compare the Pacific and Atlantic data.
c. Suggest one reason in each case for the change in catch in the Indian and Atlantic oceans between 1980 and 1990.
Indian:
Atlantic:
69. Outline the concept of maximum sustainable yield.
70. How does the precautionary principle apply when setting international catch limits?
71. Discuss how the following international measures may aid the conservation of fish
Stephen Taylor Bandung International School http://sciencevideos.wordpress.com
ESSENTIAL BIOLOGY G: ECOLOGY OPTION
stocks:
International cooperation
Stakeholder identification and agreement
Independent research and monitoring
Mapping
Subsidies
Legalisation and enforcement
Education and awareness
Stephen Taylor Bandung International School http://sciencevideos.wordpress.com