Embed Size (px)
Citation preview
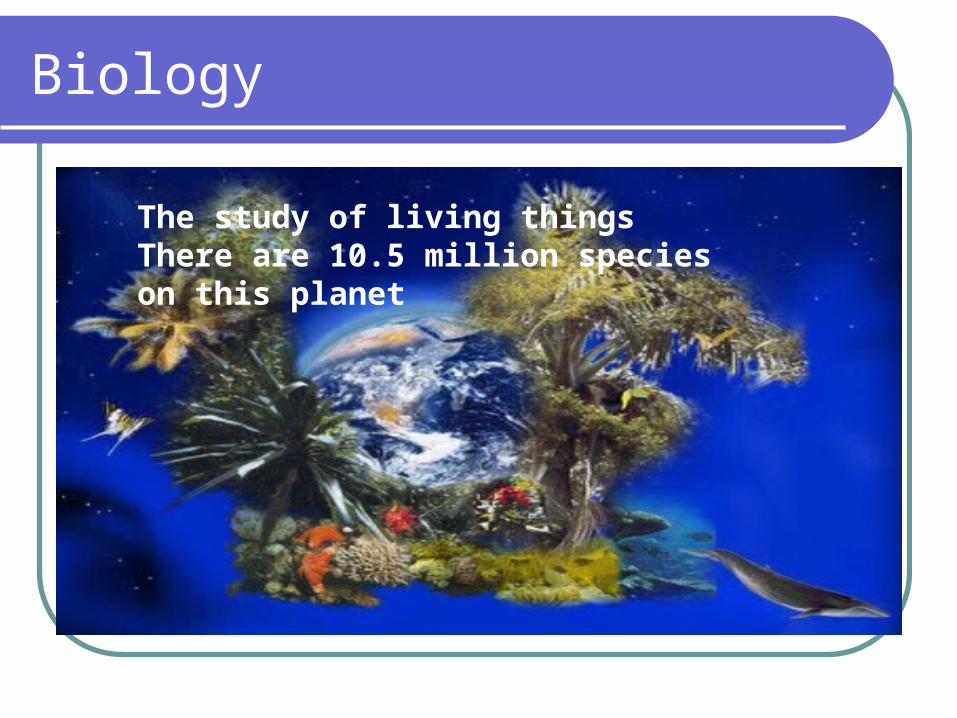
Biology
The study of living thingsThere are 10.5 million species on this planet

Branches of Biology
Biology, the study of life, has many aspects to it and many specializations within this broad field.

Molecular Level
Microbiology - the study of microscopic organisms (microorganisms) and their interactions with other living things
Biochemistry - the study of the chemical reactions required for life to exist and function, can also focus on the cellular level
Biotechnology - controversial branch of biology that studies the manipulation of living matter, including genetic modification
Bioengineering - the study of biology through the means of engineering with an emphasis on biotechnology.
Genetics - the study of genes and heredity.

Cellular Level
Cytology - the study of the cell as a complete unit, and the molecular and chemical interactions that occur within a living cell.
Histology - The study of cells and tissue, a microscopic branch of anatomy.
Neurobiology - the study of the nervous system, including anatomy, physiology, even pathology.
Immunology - the study of all how the body fights infection.
Virology - the study of viruses and some other virus-like agents, usually considered part of microbiology or pathology

Multicellular Level
Botany – the study of plants
Zoology - the study of animals and animal life, including classification, physiology, development, and behavior : Entomology, Ethology, Herpetology, Ichthyology, Mammology, Ornithology
Ethology - the study of animal behavior
Anatomy - the study of the animal form, structure, with an emphasis on human bodies
Physiology – the study of function of the structures
Developmental Biology - the study of the processes through which an organism develops, from zygote to full structure
Mycology – study of fungi

Population Level
Ecology - the study of the ecosystem with an emphasis on groups of species interact with other living and non-living elements.
Evolution or Evolutionary Biology - the study of the origin and decent of species over time
Conservation Biology - the study of the preservation, protection, or restoration of the natural environment, natural ecosystems,
Epidemiology - a major component of public health ,the study of factors affecting the health and illness of populations

Lab Techniques and Tools
Compound Microscope – more than one lens and uses light to magnify, 2-D , low resolution ( poor detail )
Magnification –power to increase size
Resolution –power to show detail

Binocular Microscope – also called a dissection microscope, light illuminated, used to look at larger objects that don’t fit on slides and light can’t pass through , 3-D.
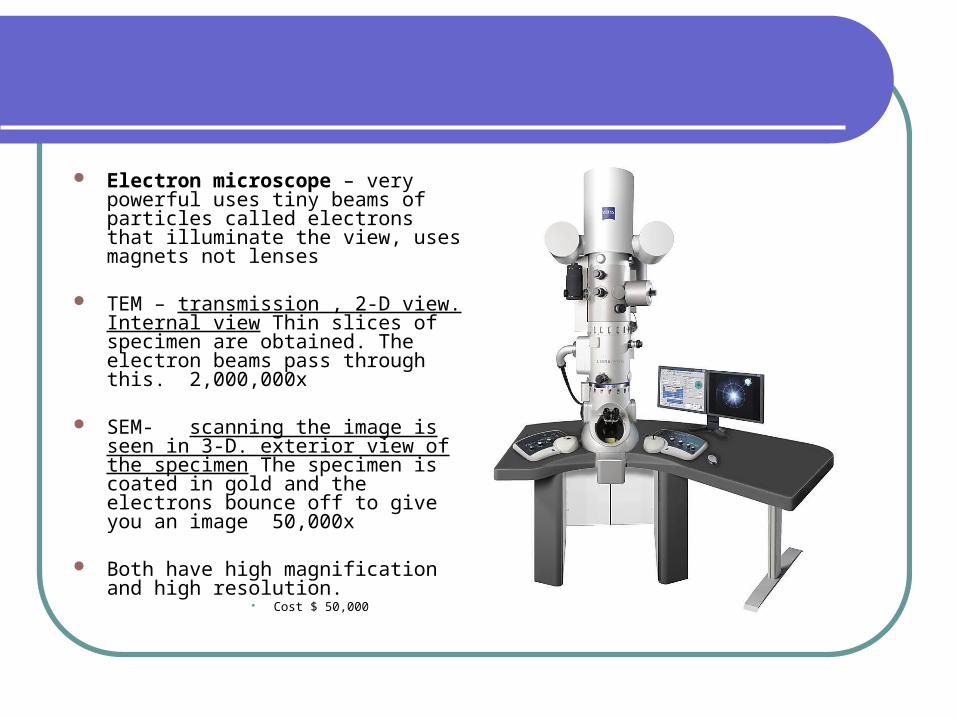
Electron microscope – very powerful uses tiny beams of particles called electrons that illuminate the view, uses magnets not lenses
TEM – transmission , 2-D view. Internal view Thin slices of specimen are obtained. The electron beams pass through this. 2,000,000x
SEM- scanning the image is seen in 3-D. exterior view of the specimen The specimen is coated in gold and the electrons bounce off to give you an image 50,000x
Both have high magnification and high resolution.
Cost $ 50,000

Which microscope is this from ?

Cell culture – use nutrient and petri dish to grow cells
Agar is the gel on the plate that holds the nutrients

Fractioning – many methods to separate components of a cell, virus, DNA
centrifuge – high speed spinning
Fastest 80,000 rpm

chromatography – involves passing a mixture (pigment) dissolved in a liquid through a stationary phase (paper)

gel electrophoresis – separates out components by size and charge
Using the Microscope
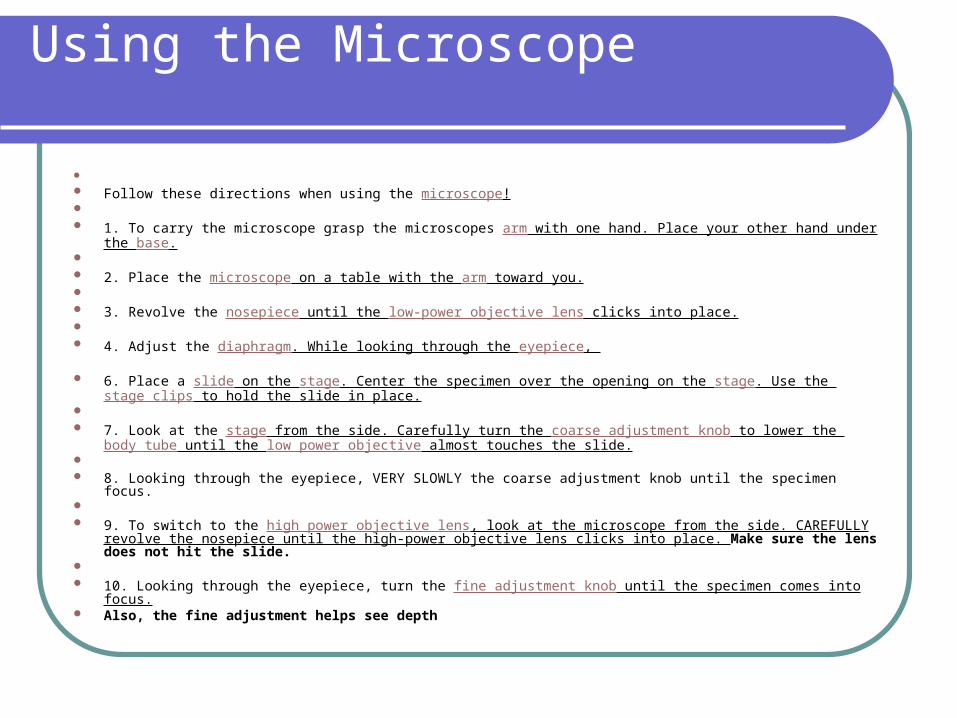
Follow these directions when using the microscope! 1. To carry the microscope grasp the microscopes arm with one hand. Place your other hand under the base. 2. Place the microscope on a table with the arm toward you. 3. Revolve the nosepiece until the low-power objective lens clicks into place. 4. Adjust the diaphragm. While looking through the eyepiece,
6. Place a slide on the stage. Center the specimen over the opening on the stage. Use the stage clips to hold the slide in place.
7. Look at the stage from the side. Carefully turn the coarse adjustment knob to lower the body tube until the
low power objective almost touches the slide. 8. Looking through the eyepiece, VERY SLOWLY the coarse adjustment knob until the specimen focus. 9. To switch to the high power objective lens, look at the microscope from the side. CAREFULLY revolve the
nosepiece until the high-power objective lens clicks into place. Make sure the lens does not hit the slide. 10. Looking through the eyepiece, turn the fine adjustment knob until the specimen comes into focus. Also, the fine adjustment helps see depth

Microscope Labs
Draw what you see don’t make up thingsUse a circle to represent the circle of the
eyepiece and Title what you are drawing and put down the level of magnification in use
Plant Cell
400x

Line vs Bar Graph
Independent variable x axis
Dependent variable y axis

How to Choose Which Type of Graph to Use? When to Use . . . . . . a Line graph. Line graphs are used to track changes over periods of time. When smaller change
s exist, line graphs are better to use than bar graphs. . . . a Bar Graph. Bar graphs are used to compare things between different groups or to track chang
es over time. However, when trying to measure change over time, bar graphs are best when the changes are larger.
Often Bar graphs are used when graphing a qualitative independent variable, but a line graph is most often used when the independent variable is quantitative.
Qualitative ?
Quantitative ?

Qualitative
Deals with descriptions. Data can be observed but not measured. Colors, textures, smells, tastes, appearance, beauty,
etc. Qualitative → Quality
Bar Graph ! They are useful for comparing quantities within or
among categories. describe the relationship of several variables at once.
Quantitative
Deals with numbers. Data which can be measured. Length, height, area, volume, weight,
speed, time, temperature, humidity, sound levels, cost, members, ages, etc.
Quantitative → Quantity
Line Graph !

Example Sophomore Class
data: friendly demeanors civic minded environmentalists positive school spirit angelic

Example 2: Sophomore Class
data: 215 students 15 girls, 250 boys 90% on honor roll 150 students
accelerated in mathematics
Deductive reasoning goes from the general to the specific.
Inductive reasoning goes from the specific to the general.

Deductive reasoning starts with a general rule, a premise, which we know to be true, or we accept it to be true for the circumstances. Then from that rule, we make a conclusion about something specific. Example:
All turtles have shells The animal I have captured is a turtle I conclude that the animal in my bag has a
shell

Inductive reasoning is making a conclusion based on a set of empirical data. Which is based on observation .If I observe that something is true many times, concluding that it will be true in all instances, is a use of inductive reasoning. Example:
All sheep that I've seen are white (specific)All sheep must be white (general) This example makes inductive reasoning
seem useless Why use it ?

Most scientific discoveries are made with use of inductive reasoning. A majority of mathematical discoveries come about from conclusions made with inductive reasoning, or observation. But the key word is "discovery." With induction something can be discovered but not proven.

Deductive Arguments are arguments that claim to provide complete support for the conclusion it’s the hypothesis accepted
If then statement
Inductive Arguments are arguments that claim to provide some, but not complete, support for the conclusion, it is always possible for the conclusion to be false even though the premises are true.


![gravesscience.zohosites.comgravesscience.zohosites.com/files/origin of species...The Origin of Species: The Beak of the Finch [NARRATOR:] Our planet has millions of species. Over beetles](https://img.pdfslide.us/doc/110x75/5afd57427f8b9a444f8d4c1a/of-speciesthe-origin-of-species-the-beak-of-the-finch-narrator-our-planet.jpg)