Embed Size (px)
Citation preview
BIOLOGY FIELD STUDY DAY 2-3 PRESENTATION
GROUP 4 HOON LING YIN
TAM KIN LOK WONG HEI LUNG
WONG KA YIU

T O P I CT O I N V E S T I G A T E T H E V A R I E T Y A N D P O P U L A T I O N S O F A N I M A L S P E C I E S U N D E R D I F F E R E N T W A T E R F L O W R A T E

I N D E P E N D E N T V A R I A B L E A N D M E T H O D S O F M E A S U R E M E N T
Water flow rate
• Measured by water flow meter
• 3 times, record reading and take average
• 4 localities with difference in water flow rate are selected for investigation

D E P E N D E N T V A R I A B L E A N D M E T H O D S O F M E A S U R E M E N T
•Number of species and population of each species in the selected areas.

D E P E N D E N T V A R I A B L E A N D M E T H O D S O F M E A S U R E M E N T
•Number of species and population of each species in the selected areas.
• 0.5m x 0.5m quadrat

D E P E N D E N T V A R I A B L E A N D M E T H O D S O F M E A S U R E M E N T
•Number of species and population of each species in the selected areas.
• 0.5m x 0.5m quadrat
• look for animals in the area included

D E P E N D E N T V A R I A B L E A N D M E T H O D S O F M E A S U R E M E N T
•Number of species and population of each species in the selected areas.
• 0.5m x 0.5m quadrat
• look for animals in the area included
• pick up small rocks from the bottom, and look for animals present on the rock surface or under the rock.

Use a brush pen to separate animals from the rock surface
D E P E N D E N T V A R I A B L E A N D M E T H O D S O F M E A S U R E M E N T

Use a brush pen to separate animals from the rock surface
• Hold animal captured in a plastic sorting tray for identification
D E P E N D E N T V A R I A B L E A N D M E T H O D S O F M E A S U R E M E N T

Use a brush pen to separate animals from the rock surface
• Hold animal captured in a plastic sorting tray for identification
• Release all of them to their original micro-habitats
D E P E N D E N T V A R I A B L E A N D M E T H O D S O F M E A S U R E M E N T

Use a brush pen to separate animals from the rock surface
• Hold animal captured in a plastic sorting tray for identification
• Release all of them to their original micro-habitats
• limited to 20 minutes -> comparable
D E P E N D E N T V A R I A B L E A N D M E T H O D S O F M E A S U R E M E N T

C O N T R O L L E D V A R I A B L E S A N D M E T H O D S T O C O N T R O L
•River bed substrate composition:
• Find places with similar bed substrate content

C O N T R O L L E D V A R I A B L E S A N D M E T H O D S T O C O N T R O L
•River bed substrate composition:
• Find places with similar bed substrate content
• Temperature
•Use a digital thermometer

C O N T R O L L E D V A R I A B L E S A N D M E T H O D S T O C O N T R O L
•River bed substrate composition:
• Find places with similar bed substrate content
• Temperature
•Use a digital thermometer
•Light intensity
•Use a light

C O N T R O L L E D V A R I A B L E S A N D M E T H O D S T O C O N T R O L
•River bed substrate composition:
• Find places with similar bed substrate content
• Temperature
•Use a digital thermometer
•Light intensity
•Use a light meter
•Water depth:
•Use a ruler

A S S U M P T I O N S A N D L I M I T A T I O N SAssumptions
•Water at the four localities has same pH
•20 minutes is representative enough for counting populations of animal species at a selected area

A S S U M P T I O N S A N D L I M I T A T I O N SAssumptions
•Water at the four localities has same pH
•20 minutes is representative enough for counting populations of animals at a selected area
Limitations
•The investigation was carried out at a specific time slot (daytime, winter), it may not represent the overall situation
•Apparatus not sensitive enough
○E.g. water flow meter
•Some animals were irritated during the investigation and escaped from the quadrat

R E S U L T SMayfly Nymph
Water penny
Large Stream Snail🐌

L O C A L I T Y A ( F A S T )
B ( M O D E R A T E )
C ( S L O W )
D ( V E R Y S L O W )
W A T E R F L O W R A T E ( M / S ) 0 . 4 9 0 . 2 0 0 . 1 0 0 . 0 4
R I V E R B E D S U B S T R A T E
C O M P O S I T I O NP E B B L E S P E B B L E S P E B B L E S P E B B L E S
T E M P E R A T U R E ( C ) 1 8 . 3 1 8 . 4 1 8 . 6 1 8 . 5
L I G H T I N T E N S I T Y
( L U X )1 6 0 1 0 1 6 4 0 0 1 6 0 0 0 1 6 2 1 0
W A T E R D E P T H ( C M ) 7 . 0 8 . 0 7 . 5 7 . 6
RESULTS

Locality A (Fast)
b (Moderate)
C (Slow)
d (Very slow)
large stream snail 7 9 7 3
Mayfly Nymph 0 2 2 3
water Skater 0 3 1 1
pond snail 0 0 1 0
water penny 1 3 0 0
Bee shrimp 0 0 0 2
Goby 0 0 0 1
Number of animals 8 17 11 10
Number of species 2 4 4 5
R E S U L T S
R E S U L T S
Species composition at site a13%
88%Large Stream SnailWater Penny
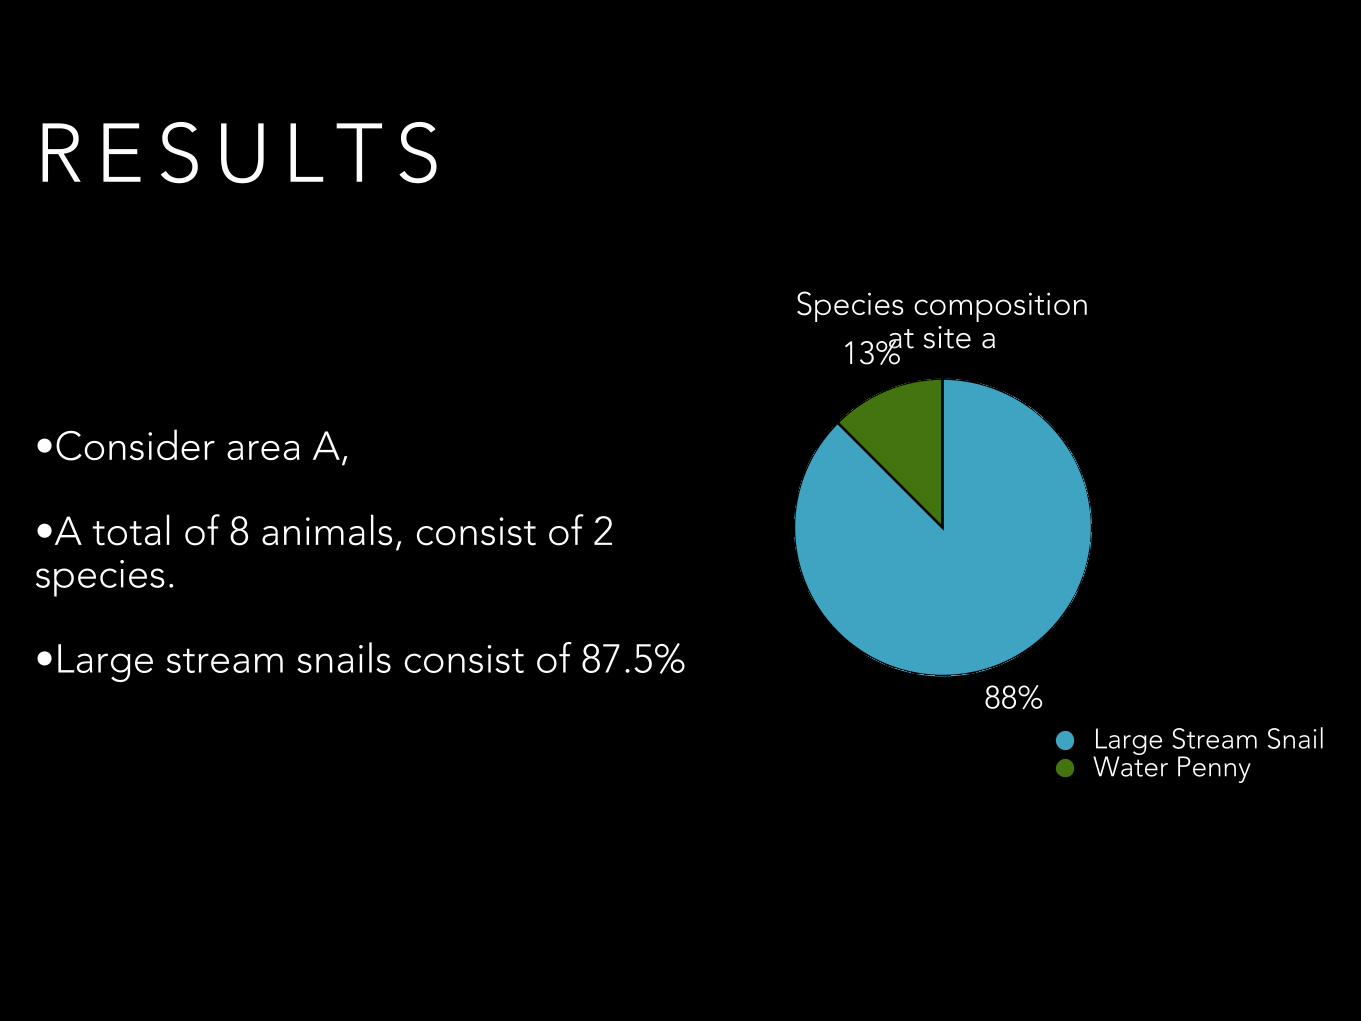
•Consider area A,
•A total of 8 animals, consist of 2 species.
•Large stream snails consist of 87.5%

R E S U L T S
•Consider area B,
•A total of 17 animals, consist of 4 species.
•Large stream snails consist of 52.9%
Species composition at site B
18%
12%
18%
53%
Large Stream SnailWater PennyMayfly NumphWater Skater

•Consider area C,
•A total of 11 animals, consist of 4 species.
•Large stream snails consist of 64% large stream snailmayfly nymphwater skaterpond snail
R E S U L T S

•Consider area D,
•A total of 10 animals, consist of 5 species.
•Large stream snails consist of 30%
Species composition at site D10%
20%
10%
30%
30%
Large Stream SnailMayfly NymphWater SkaterBee ShrimpGoby
R E S U L T S

A N A L Y S I S O F R E S U L T S
Species composition at site a
13%
88%
Large Stream SnailWater Penny
Species composition at site B
18%
12%
18%
53%
Large Stream SnailWater PennyMayfly NumphWater Skater
Large stream snailMayfly nymphWater skaterPond snail
Species composition at site D
10%
20%
10%30%
30%
Large Stream SnailMayfly NymphWater SkaterBee ShrimpGoby

A N A L Y S I S O F R E S U L T S
Number of animal species observed decreases with increasing water flow rate.
Effect of water flow rate on number of species
Num
ber o
f ani
mal
spe
cies
0
1
3
4
5
Water flow rate (m/s)0 0.13 0.25 0.38 0.5

A N A L Y S I S O F R E S U L T S
Number of animal species observed decreases with increasing water flow rate
• Possible reasons:
- various difficulties — difficult to capture fast-moving micro-organisms, easily shoved by water current to other regions, etc.
Effect of water flow rate on number of species
Num
ber o
f ani
mal
spe
cies
0
1
3
4
5
Water flow rate (m/s)0 0.13 0.25 0.38 0.5

- some have adaptive features for the fast, turbulent water
A N A L Y S I S O F R E S U L T SEffect of water flow rate on
number of species
Num
ber o
f ani
mal
spe
cies
0
1
3
4
5
Water flow rate (m/s)0 0.13 0.25 0.38 0.5

- some have adaptive features for the fast, turbulent water
- others can hardly compete with these animals
A N A L Y S I S O F R E S U L T SEffect of water flow rate on
number of species
Num
ber o
f ani
mal
spe
cies
0
1
3
4
5
Water flow rate (m/s)0 0.13 0.25 0.38 0.5

- some have adaptive features for the fast, turbulent water
- others can hardly compete with these animals
-> only animals with specific adaptive features survive in region with high water flow rate, leading to a smaller number of animal species present
A N A L Y S I S O F R E S U L T SEffect of water flow rate on
number of species
Num
ber o
f ani
mal
spe
cies
0
1
3
4
5
Water flow rate (m/s)0 0.13 0.25 0.38 0.5

A N A L Y S I S O F R E S U L T S
Adaptive features
streamlined or flattened
body
Smooth body
surface
muscular body or fins
with sucker-life structure
equipped with hooks
hiding under
shelters
large stream snail ✓ ✓ ☓ ✓ ☓ ✓
mayfly nymph ✓ ✓ ☓ ☓ ✓ ✓
Water skater ☓ ☓ ☓ ☓ ☓ ☓
Pond snail ✓ ✓ ☓ ✓ ☓ ✓
Water penny ✓ ✓ ☓ ✓ ☓ ✓
Bee shrimp ☓ ✓ ☓ ☓ ☓ ✓
Goby ✓ ✓ ✓ ☓ ☓ ☓

Number of animals increases by 112.5% from A to B, then decreases by 41.2% from B to D.
Relationship between water flow speed and
number of animals
Num
ber o
f ani
mal
s
0
4
9
13
17
Water flow rate (m/s)0.04 0.1 0.2 0.49
A N A L Y S I S O F R E S U L T S
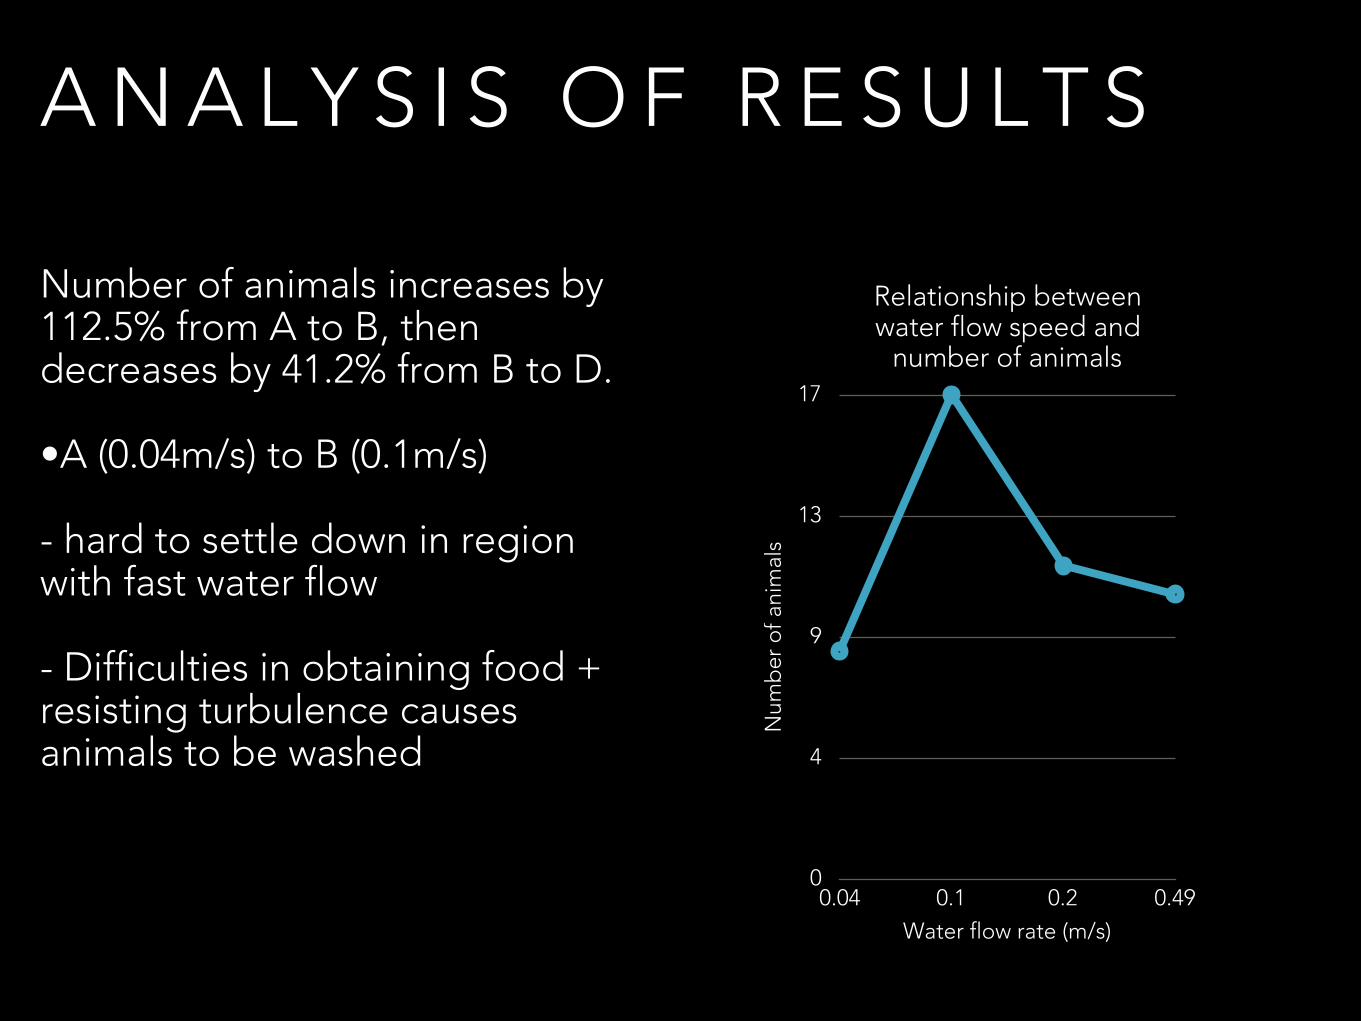
Number of animals increases by 112.5% from A to B, then decreases by 41.2% from B to D.
•A (0.04m/s) to B (0.1m/s)
- hard to settle down in region with fast water flow
- Difficulties in obtaining food + resisting turbulence causes animals to be washed
-> reduces number of animals in region A, and increases number of animals in region B.
Relationship between water flow speed and
number of animals
Num
ber o
f ani
mal
s
0
4
9
13
17
Water flow rate (m/s)0.04 0.1 0.2 0.49
A N A L Y S I S O F R E S U L T S

Form B to D
-Region B 's river flow rate > region C & D
A N A L Y S I S O F R E S U L T S
Relationship between water flow speed and
number of animals
Num
ber o
f ani
mal
s 0
4
9
13
17
Water flow rate (m/s)0.04 0.1 0.2 0.49

Form B to D
-Region B 's river flow rate > region C & D
-Region B = a more favourable micro-habitat for animals & adaptive features for fast-moving water.
-Larger animals ~ weaker against strong water flow
-Animals with the adaptive features can live in the region with moderate water flow without being preyed or washed away.
-Their population then becomes larger
A N A L Y S I S O F R E S U L T S
Relationship between water flow speed and
number of animals
Num
ber o
f ani
mal
s 0
4
9
13
17
Water flow rate (m/s)0.04 0.1 0.2 0.49

A N A L Y S I S O F R E S U L T S
1) slow water facilitates the growth of algae
2) bacteria on algae consume oxygen to decompose dead body of algae
3) some algae can be toxic
4) organic waste cannot be removed effectively
Result: smaller population of animals in regions C and D.

C O N C L U S I O N
While the most number of animal species populate in very slow running water (region D), region with moderate water flow (region B) has the largest number of animals.
A number of adaptive features are observed, allowing some animals to flourish in areas with fast and moderate water flow.
Actually, these observations are not solely caused by water flow, but many other interdependent variables, such as distribution of nutrients, presence of predator, etc.

Q & A S E S S I O N

This is the end of our presentation. Thank you for listening.