Embed Size (px)
Citation preview
Updates for 2012, Biology EOC Page 1
Copyright © October 2011 All rights reserved. Educational institutions within the State of Washington have permission to reproduce this document. All other individuals wishing to reproduce this document must contact OSPI.
SCIENCE Assessment
Updates for 2012
Biology End-of-Course (EOC)
Exam

Updates for 2012, Biology EOC Page 2
Copyright © October 2011 All rights reserved. Educational institutions within the State of Washington have permission to reproduce this document. All other individuals wishing to reproduce this document must contact OSPI.
Updates for 2012, Biology EOC Page 3
Copyright © October 2011 All rights reserved. Educational institutions within the State of Washington have permission to reproduce this document. All other individuals wishing to reproduce this document must contact OSPI.
Table of Contents Introduction .................................................................................................................................................. 4
End-of-Course Exam Development Information ........................................................................................... 4
Washington State K-12 Science Learning Standards ................................................................................ 4
Test and Item Specifications ..................................................................................................................... 4
Item Types ................................................................................................................................................. 5
Performance Level Descriptors ................................................................................................................. 5
Graduation Requirements ............................................................................................................................ 6
2012 Biology EOC Testing Window ............................................................................................................... 6
Major Changes in the 2012 Science Assessment .......................................................................................... 6
Resources for Educators ............................................................................................................................... 7
2011 Lessons Learned from Scoring Student Work .................................................................................. 7
Teacher Tool ............................................................................................................................................. 7
Sample Item Templates ............................................................................................................................ 7
New Samples for 2012 .................................................................................................................................. 8
Student Sample Pages ............................................................................................................................... 9
Teacher Answer Pages ............................................................................................................................ 28
Resources/Contact Information .................................................................................................................. 56

Updates for 2012, Biology EOC Page 4
Copyright © October 2011 All rights reserved. Educational institutions within the State of Washington have permission to reproduce this document. All other individuals wishing to reproduce this document must contact OSPI.
Introduction
Updates for 2012 contains pertinent information for Washington educators. This document includes a
summary of changes and new information in science assessment, links to resources for teachers, and
sample test items. Updates for 2012 has been customized into grade levels: Grade 5, Grade 8, and the
Biology End-of-Course Exam. The documents are available on
http://www.k12.wa.us/Science/EducatorResources.aspx
End-of-Course Exam Development Information
Washington State K-12 Science Learning Standards
In 2009, the K-12 Science Learning Standards were formally adopted. Along with the new standards, the
legislature provided direction for the redesign of the assessment system. The Measurements of Student
Progress (MSP) replaced the Washington Assessment of Student Learning (WASL) and assessed the new
science standards in grades 5 and 8 in the spring of 2011. A biology end-of-course (EOC) exam will
replace the High School Proficiency Exam (HSPE) in 2012.
View the Washington State K-12 Science Learning Standards at:
http://www.k12.wa.us/Science/Standards.aspx
Test and Item Specifications
The Test and Item Specifications provide guidelines for developing large-scale assessments based on the
Washington State K-12 Science Learning Standards. The science assessment includes systems, inquiry,
and application scenarios which reflect the cross-cutting concepts and abilities in the standards. Most
items in science assessments are connected to a scenario. Some stand-alone items also appear. Stand-
alone items are clearly marked for students on the assessment.
The test specifications provide a grade-level or course test map that delineates the type and number of
items. The document also provides a list of science vocabulary words that are necessary for the
purposes of the assessment.
The Test and Item Specifications are periodically updated. Included with each updated version of the
Test and Item Specifications will be a summary of the changes made since the previous version. The Test
and Item Specifications documents can be accessed through the following link:
http://www.k12.wa.us/Science/TestItemSpec.aspx.
Updates for 2012, Biology EOC Page 5
Copyright © October 2011 All rights reserved. Educational institutions within the State of Washington have permission to reproduce this document. All other individuals wishing to reproduce this document must contact OSPI.
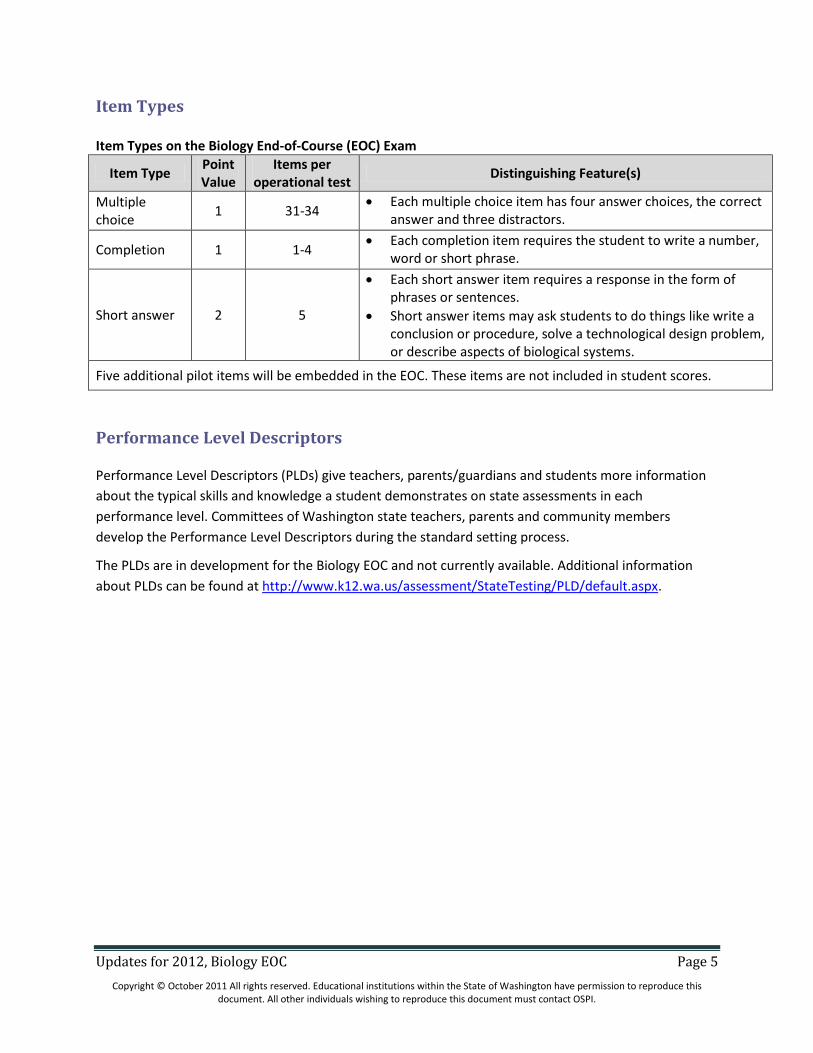
Item Types Item Types on the Biology End-of-Course (EOC) Exam
Item Type Point Value
Items per operational test
Distinguishing Feature(s)
Multiple choice
1 31-34 Each multiple choice item has four answer choices, the correct
answer and three distractors.
Completion 1 1-4 Each completion item requires the student to write a number,
word or short phrase.
Short answer 2 5
Each short answer item requires a response in the form of phrases or sentences.
Short answer items may ask students to do things like write a conclusion or procedure, solve a technological design problem, or describe aspects of biological systems.
Five additional pilot items will be embedded in the EOC. These items are not included in student scores.
Performance Level Descriptors
Performance Level Descriptors (PLDs) give teachers, parents/guardians and students more information
about the typical skills and knowledge a student demonstrates on state assessments in each
performance level. Committees of Washington state teachers, parents and community members
develop the Performance Level Descriptors during the standard setting process.
The PLDs are in development for the Biology EOC and not currently available. Additional information
about PLDs can be found at http://www.k12.wa.us/assessment/StateTesting/PLD/default.aspx.
Updates for 2012, Biology EOC Page 6
Copyright © October 2011 All rights reserved. Educational institutions within the State of Washington have permission to reproduce this document. All other individuals wishing to reproduce this document must contact OSPI.
Graduation Requirements
In spring 2012, all students taking a biology course will participate in an end-of-course exam as directed
by the 2010 Engrossed Substitute Senate Bill 6444, section 513 (3). Students in 10th grade who are not
in a biology course are also required to take the biology EOC because of the No Child Left Behind
requirement to assess science in high school.
House Bill 1410 defined science assessment and graduation requirements as:
Students in the classes of 2012, 2013 and 2014 are not required to pass a state science exam
for the purposes of graduation.
Beginning with the class of 2015, students are required to pass the biology EOC. Those students
can first take the biology EOC in spring 2012.
Refer to http://www.k12.wa.us/assessment/StateTesting/BiologyEnd-of-CourseExams.aspx for further
information.
2012 Biology EOC Testing Window
The 2012 biology EOC will be available from May 7 through June 15, 2012. The schedule for the
administration of the end-of-course exam is to be determined locally. Administration is to occur during
the last three weeks of the course. The exam may be administered in three 50 minute class settings, or
in a single session of approximately 150 minutes.
Refer to http://www.k12.wa.us/assessment/StateTesting/default.aspx for further information.
Major Changes in the 2012 Science Assessment
The 2012 biology EOC will assess content standards from the 2009 Washington State K-12 Science
Learning Standards. The exam will include items assessing standards from EALR 1 (Systems), EALR 2
(Inquiry), EALR 3 (Application) and the Life Science Domain of EALR 4. Scenarios will be in the context of
life science.
The Test and Item Specifications document found at http://www.k12.wa.us/Science/TestItemSpec.aspx
contains specific information about the format of the biology EOC.

Updates for 2012, Biology EOC Page 7
Copyright © October 2011 All rights reserved. Educational institutions within the State of Washington have permission to reproduce this document. All other individuals wishing to reproduce this document must contact OSPI.
Resources for Educators
Visit http://www.k12.wa.us/Science/EducatorResources.aspx for links to the documents listed in this
section. Check regularly for new resources.
2011 Lessons Learned from Scoring Student Work
The Science Assessment Team shares observations about student responses to items piloted in 2011 for
the Biology EOC in Lessons Learned from Scoring Student Work. The purpose of this document is to
provide teachers with insight into common misconceptions and errors that may keep students from
earning full credit on state assessment items.
2011 Lessons Learned from Scoring Student Work will be available in November and can be downloaded
at: http://www.k12.wa.us/Science/EducatorResources.aspx.
Teacher Tool
The Teacher Tool provides information about items on the previous year’s assessment. A brief
description of each item on the exam is provided as well as state-level performance data. The high
school information on the Teacher Tool is for items from the 2011 assessment which were based on the
previous standards.
The Teacher Tool is located at http://www.k12.wa.us/TeacherResourceTool2010-11/default.aspx.
Sample Item Templates
Templates of questions and the scoring rubrics for common short-answer items used on the Biology EOC
are available in the form of Word documents. The templates can be edited for use in classroom practice
by incorporating content from any science curriculum.
The templates can be downloaded at: http://www.k12.wa.us/Science/ItemTemplates.aspx
Updates for 2012, Biology EOC Page 8
Copyright © October 2011 All rights reserved. Educational institutions within the State of Washington have permission to reproduce this document. All other individuals wishing to reproduce this document must contact OSPI.
New Samples for 2012
The scenarios and items on pages 10-27 are samples that are aligned with the K-12 Science Learning
Standards. These items have not gone through the comprehensive review process that test items must
pass before placement on an actual state test. Teachers may still use these items as classroom
exercises, or informal checks for understanding, as teachers have the ability and choice to clarify any
questions about these items as students are working on them.
The Teacher Answer Pages (pages 28-55) provide the keys, rubrics, and sample student responses.
Printing tip: Print the student pages back-to-back, beginning with the cover sheet on page 9, to preserve
pagination.

Updates for 2012, Biology EOC Page 9
Copyright © October 2011 All rights reserved. Educational institutions within the State of Washington have permission to reproduce this document. All other individuals wishing to reproduce this document must contact OSPI.
Student Sample Pages
Student Name:____________________________________________
Updates 2012 Biology EOC—Student
Updates for 2012, Biology EOC Page 10
Copyright © October 2011 All rights reserved. Educational institutions within the State of Washington have permission to reproduce this document. All other individuals wishing to reproduce this document must contact OSPI.
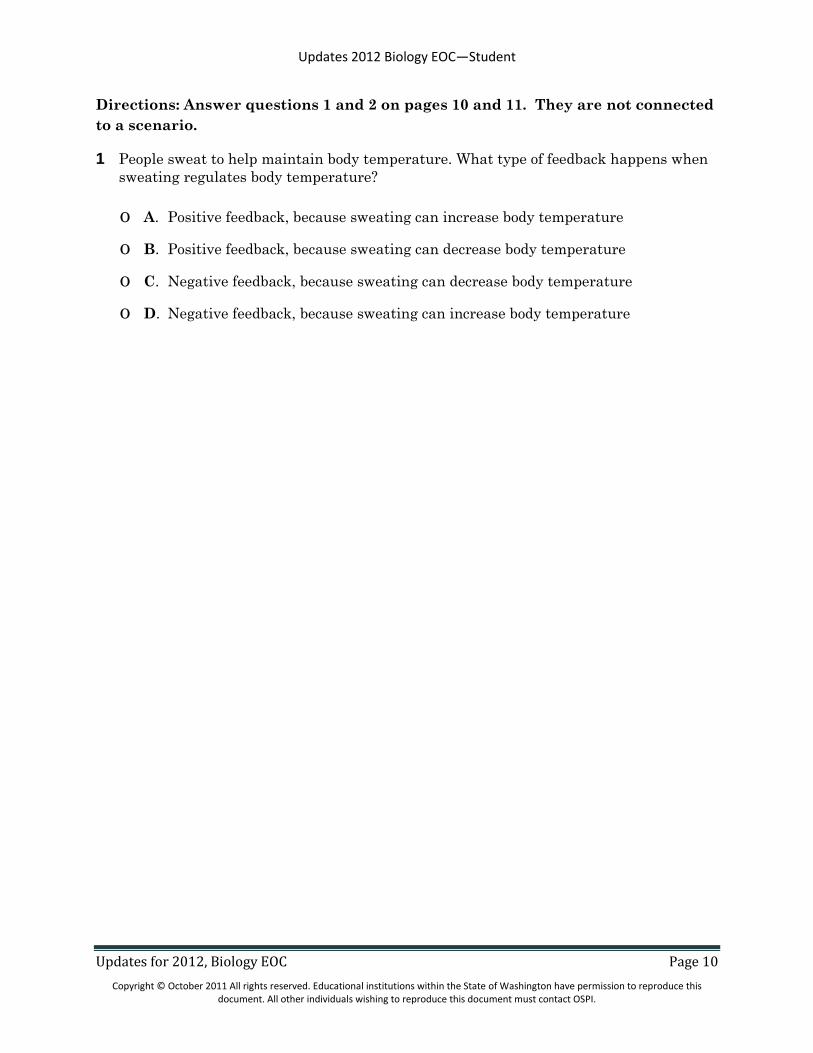
Directions: Answer questions 1 and 2 on pages 10 and 11. They are not connected
to a scenario.
1 People sweat to help maintain body temperature. What type of feedback happens when
sweating regulates body temperature?
o A. Positive feedback, because sweating can increase body temperature
o B. Positive feedback, because sweating can decrease body temperature
o C. Negative feedback, because sweating can decrease body temperature
o D. Negative feedback, because sweating can increase body temperature

Updates 2012 Biology EOC—Student
Updates for 2012, Biology EOC Page 11
Copyright © October 2011 All rights reserved. Educational institutions within the State of Washington have permission to reproduce this document. All other individuals wishing to reproduce this document must contact OSPI.
2 Plants use nitrogen to make proteins. What is present in the soil that makes nitrogen
directly available to plants?
o A. Air
o B. Water
o C. Sugars
o D. Bacteria
Updates 2012 Biology EOC—Student
Updates for 2012, Biology EOC Page 12
Copyright © October 2011 All rights reserved. Educational institutions within the State of Washington have permission to reproduce this document. All other individuals wishing to reproduce this document must contact OSPI.
Foaming Spuds
Directions: Use the following information to answer questions 3 through 6 on
pages 14 through 17.
Mike and Kelsey were studying how hydrogen peroxide (H2O2) in cells breaks down to form
water and oxygen. When this reaction happens, bubbles of oxygen gas are released,
producing foam. This reaction is described as follows:
A protein named catalase, found in all cells including potatoes, increases the rate of this
reaction. Mike and Kelsey used potato juice as the source of catalase to do the following
controlled experiment.
Question: What is the effect of the acidity of potato juice on the volume of foam produced
when hydrogen peroxide is added to potato juice?
Prediction: As the acidity of potato juice decreases (higher pH), the volume of foam
will increase.
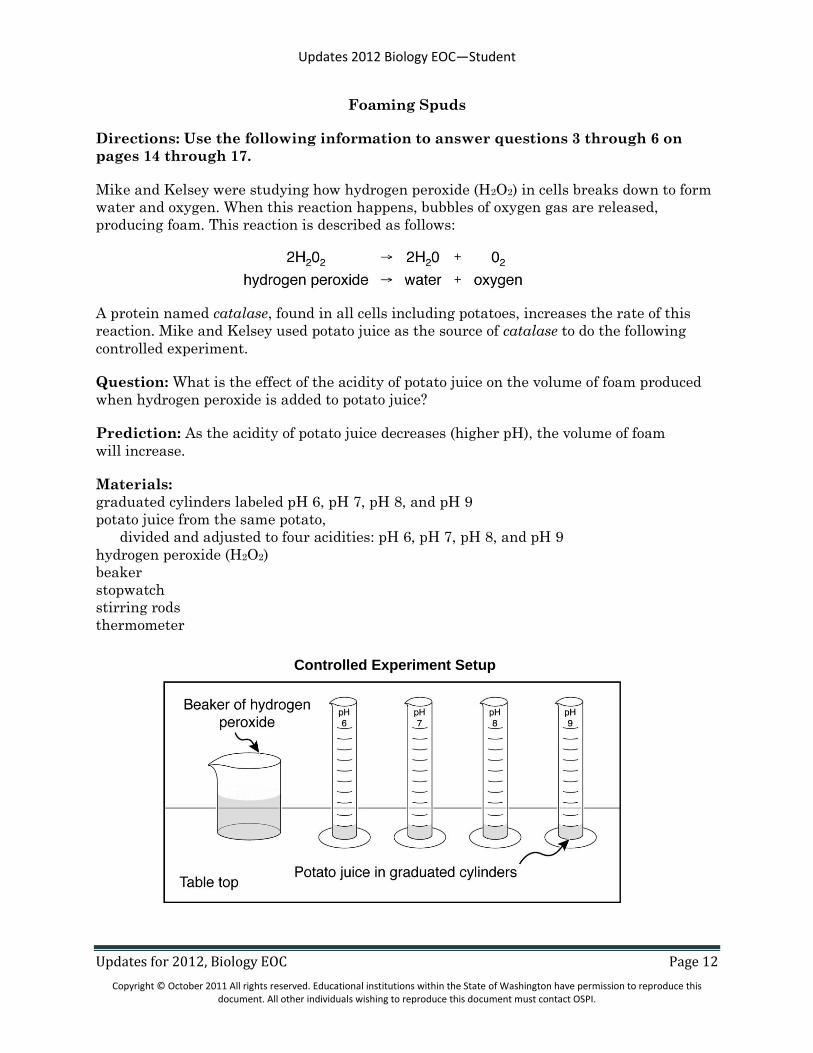
Materials:
graduated cylinders labeled pH 6, pH 7, pH 8, and pH 9
potato juice from the same potato,
divided and adjusted to four acidities: pH 6, pH 7, pH 8, and pH 9
hydrogen peroxide (H2O2)
beaker
stopwatch
stirring rods
thermometer
Controlled Experiment Setup

Updates 2012 Biology EOC—Student
Updates for 2012, Biology EOC Page 13
Copyright © October 2011 All rights reserved. Educational institutions within the State of Washington have permission to reproduce this document. All other individuals wishing to reproduce this document must contact OSPI.
Procedure:
1. Label four graduated cylinders, one for each acidity.
2. Put 10 milliliters of potato juice at pH 6 in the appropriately labeled cylinder.
3. Do the same for each of the other cylinders.
4. Monitor the room temperature to make sure the temperature remains the same
throughout the investigation.
5. Add 5 milliliters of hydrogen peroxide to each graduated cylinder, stir for two seconds.
Wait three minutes.
6. Measure and record the volume of foam in each graduated cylinder as Trial 1.
7. Clean all graduated cylinders and stirring rods.
8. Repeat steps 1 through 7 two times for Trials 2 and 3.
9. Calculate and record the average volume of foam for each acidity of potato juice.
Data:
Acidity of Potato Juice vs. Volume of Foam
Acidity of
Potato Juice
(pH)
Volume of Foam
(milliliters)
Trial 1 Trial 2 Trial 3 Average
6 22 25 25 24
7 32 38 36 35
8 41 42 42 42
9 32 29 30 30
Updates 2012 Biology EOC—Student
Updates for 2012, Biology EOC Page 14
Copyright © October 2011 All rights reserved. Educational institutions within the State of Washington have permission to reproduce this document. All other individuals wishing to reproduce this document must contact OSPI.
3 How could Mike and Kelsey be more certain the results of their experiment
are reliable?
o A. Test the reaction with other acidities of potato juice.
o B. Repeat the experiment the same way.
o C. Increase the volume of potato juice.
o D. Use a different type of plant juice.

Updates 2012 Biology EOC—Student
Updates for 2012, Biology EOC Page 15
Copyright © October 2011 All rights reserved. Educational institutions within the State of Washington have permission to reproduce this document. All other individuals wishing to reproduce this document must contact OSPI.
4 Write a conclusion for this controlled experiment.
In your conclusion, be sure to:
Answer the experimental question.
Include supporting data from the Acidity of Potato Juice vs. Volume of Foam table.
Explain how these data support your conclusion.
Provide a scientific explanation for the trend in the data.
Question: What is the effect of the acidity of potato juice on the volume of foam
produced when hydrogen peroxide is added to potato juice?
Conclusion:
Updates 2012 Biology EOC—Student
Updates for 2012, Biology EOC Page 16
Copyright © October 2011 All rights reserved. Educational institutions within the State of Washington have permission to reproduce this document. All other individuals wishing to reproduce this document must contact OSPI.
5 What did Mike and Kelsey do to make the results of their experiment valid?
o A. Recorded the volume of foam in milliliters.
o B. Calculated the average volume of foam for each acidity.
o C. Measured the volume of foam at each acidity three times.
o D. Waited three minutes before measuring the volume of foam.
Updates 2012 Biology EOC—Student
Updates for 2012, Biology EOC Page 17
Copyright © October 2011 All rights reserved. Educational institutions within the State of Washington have permission to reproduce this document. All other individuals wishing to reproduce this document must contact OSPI.
6 Plan a controlled experiment to answer the question in the box. You may use any
materials and equipment in your procedure.
Be sure your procedure includes:
logical steps to do the experiment
two controlled (kept the same) variables
one manipulated (independent) variable
one responding (dependent) variable
how often measurements should be
taken and recorded
Question: What is the effect of the temperature of potato juice on the time for
bubbling to stop after hydrogen peroxide is added?
Procedure:
Updates 2012 Biology EOC—Student
Updates for 2012, Biology EOC Page 18
Copyright © October 2011 All rights reserved. Educational institutions within the State of Washington have permission to reproduce this document. All other individuals wishing to reproduce this document must contact OSPI.
The Green Machine
Directions: Use the following information to answer questions 7 through 10 on
pages 19 through 21.
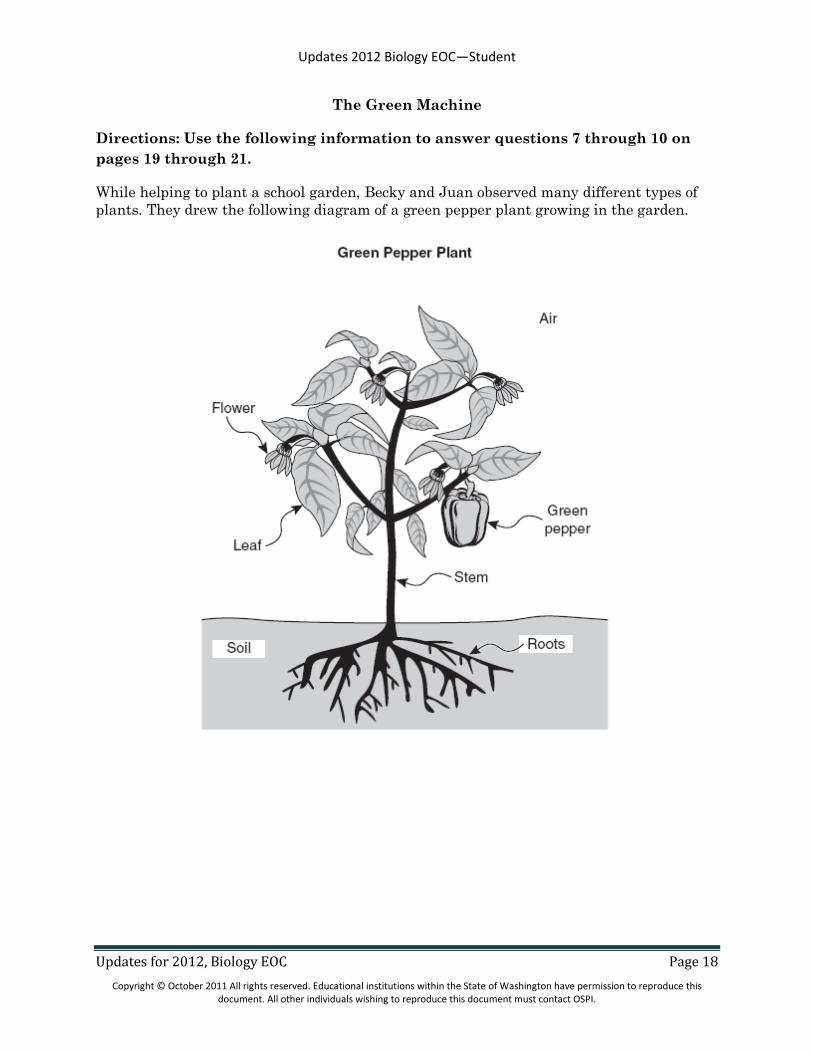
While helping to plant a school garden, Becky and Juan observed many different types of
plants. They drew the following diagram of a green pepper plant growing in the garden.

Updates 2012 Biology EOC—Student
Updates for 2012, Biology EOC Page 19
Copyright © October 2011 All rights reserved. Educational institutions within the State of Washington have permission to reproduce this document. All other individuals wishing to reproduce this document must contact OSPI.
7 The green pepper plant has proteins that control the process of making glucose. How
does the plant obtain these proteins?
o A. The plant makes the proteins using the instructions in DNA.
o B. The proteins are absorbed from the soil by the roots of the plant.
o C. The light energy changes molecules in the plant cell into proteins.
o D. The proteins are all present in the seed before germination occurs.
8 Becky and Juan want to increase the mass of food produced in the school garden. Which
of the following questions could lead to a possible solution to this problem?
o A. How much carbon dioxide do plants require?
o B. Which mineral nutrients do plants need?
o C. Which plants provide the most protein?
o D. Which plant seeds are largest?

Updates 2012 Biology EOC—Student
Updates for 2012, Biology EOC Page 20
Copyright © October 2011 All rights reserved. Educational institutions within the State of Washington have permission to reproduce this document. All other individuals wishing to reproduce this document must contact OSPI.
9 What is the role of cellular respiration in plants?
o A. To absorb carbon dioxide
o B. To release oxygen
o C. To produce ATP*
o D. To form glucose
Updates 2012 Biology EOC—Student
Updates for 2012, Biology EOC Page 21
Copyright © October 2011 All rights reserved. Educational institutions within the State of Washington have permission to reproduce this document. All other individuals wishing to reproduce this document must contact OSPI.
10 Becky and Juan used a greenhouse as a model of a garden ecosystem to predict effects of
amount of sunlight on green pepper production in a garden ecosystem.
Describe two ways the greenhouse model may lead to unreliable predictions about the
effects of amount of sunlight on green pepper production in a garden ecosystem.
In your description, be sure to:
Describe two differences that make a garden ecosystem more complex than
the greenhouse.
Describe how each difference could cause predictions about green pepper
production in a garden ecosystem to be unreliable.
One way:
Another way:
Updates 2012 Biology EOC—Student
Updates for 2012, Biology EOC Page 22
Copyright © October 2011 All rights reserved. Educational institutions within the State of Washington have permission to reproduce this document. All other individuals wishing to reproduce this document must contact OSPI.
The Birds and the Beaks
Directions: Use the following information to answer questions 11 through 13 on
page 23.
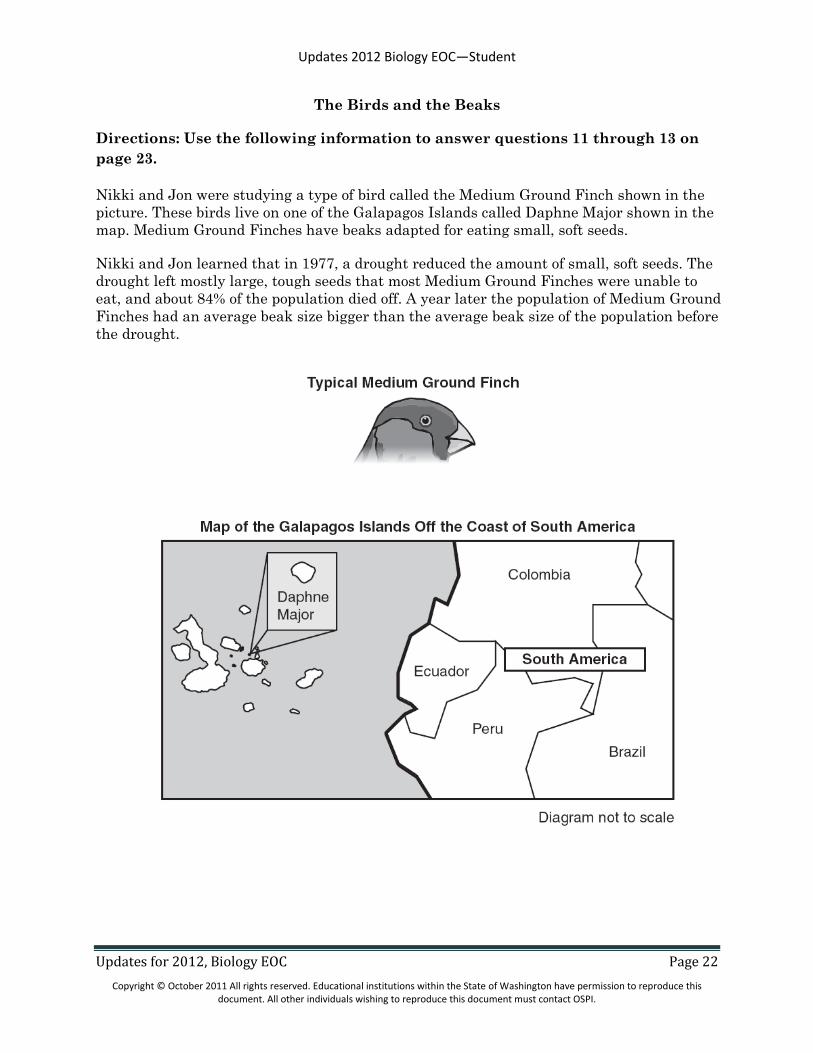
Nikki and Jon were studying a type of bird called the Medium Ground Finch shown in the
picture. These birds live on one of the Galapagos Islands called Daphne Major shown in the
map. Medium Ground Finches have beaks adapted for eating small, soft seeds.
Nikki and Jon learned that in 1977, a drought reduced the amount of small, soft seeds. The
drought left mostly large, tough seeds that most Medium Ground Finches were unable to
eat, and about 84% of the population died off. A year later the population of Medium Ground
Finches had an average beak size bigger than the average beak size of the population before
the drought.
Updates 2012 Biology EOC—Student
Updates for 2012, Biology EOC Page 23
Copyright © October 2011 All rights reserved. Educational institutions within the State of Washington have permission to reproduce this document. All other individuals wishing to reproduce this document must contact OSPI.
11 What caused the increase in the average beak size of the finch population after the
1977 drought?
o A. Finches’ beaks grew bigger because of the lack of water.
o B. Finches with small beaks were able to grow bigger beaks.
o C. Finches with bigger beaks were unable to leave the island.
o D. Finches with bigger beaks were able to survive and reproduce.
12 Scientists must be careful that their activities in an ecosystem do not introduce any new
organisms into that ecosystem. What might be an effect on the finch population of
Daphne Major if a new bird species were brought to the island?
o A. The finch population would decline due to reproduction.
o B. The finch population would increase due to adaptation.
o C. The finch population would decline due to competition.
o D. The finch population would increase due to predation.
13 Before the drought, Daphne Major had 720 finches living on 80 acres of land. What was
the population density of finches on Daphne Major?
Write your answer in the box.
___________________________ finches per acre
Updates 2012 Biology EOC—Student
Updates for 2012, Biology EOC Page 24
Copyright © October 2011 All rights reserved. Educational institutions within the State of Washington have permission to reproduce this document. All other individuals wishing to reproduce this document must contact OSPI.
Blueberry Blues
Directions: Use the following information to answer questions 14 through 17 on
pages 26 through 27.
José and Tasha noticed last year the blueberry plants in their neighborhood garden had
many flowers, but produced only three kilograms of berries. They wanted to change the
garden so the blueberry plants would produce more blueberries this summer. While making
the changes to the garden, José and Tasha documented the stages of their design process
as follows.
Problem: Change the neighborhood garden so the existing blueberry plants will produce
more blueberries.
Research the Problem: Research what blueberry plants need to grow, be healthy, and
produce berries.
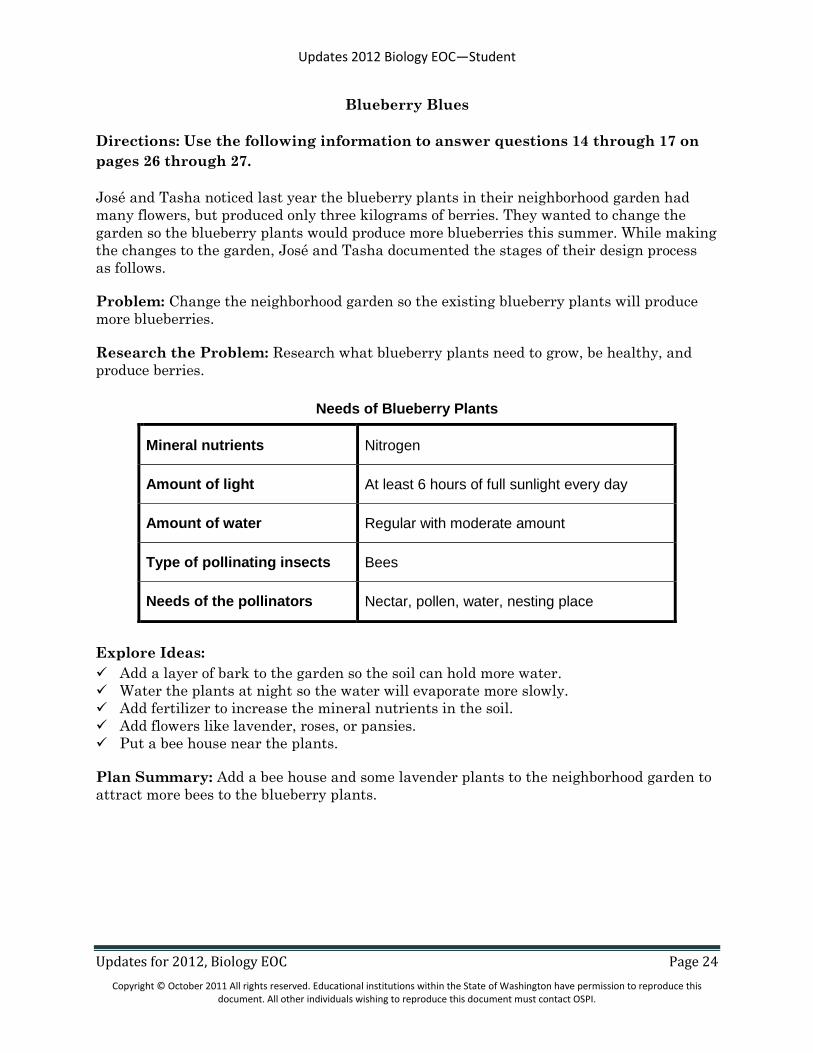
Needs of Blueberry Plants
Mineral nutrients Nitrogen
Amount of light At least 6 hours of full sunlight every day
Amount of water Regular with moderate amount
Type of pollinating insects Bees
Needs of the pollinators Nectar, pollen, water, nesting place
Explore Ideas:
Add a layer of bark to the garden so the soil can hold more water.
Water the plants at night so the water will evaporate more slowly.
Add fertilizer to increase the mineral nutrients in the soil.
Add flowers like lavender, roses, or pansies.
Put a bee house near the plants.
Plan Summary: Add a bee house and some lavender plants to the neighborhood garden to
attract more bees to the blueberry plants.
Updates 2012 Biology EOC—Student
Updates for 2012, Biology EOC Page 25
Copyright © October 2011 All rights reserved. Educational institutions within the State of Washington have permission to reproduce this document. All other individuals wishing to reproduce this document must contact OSPI.
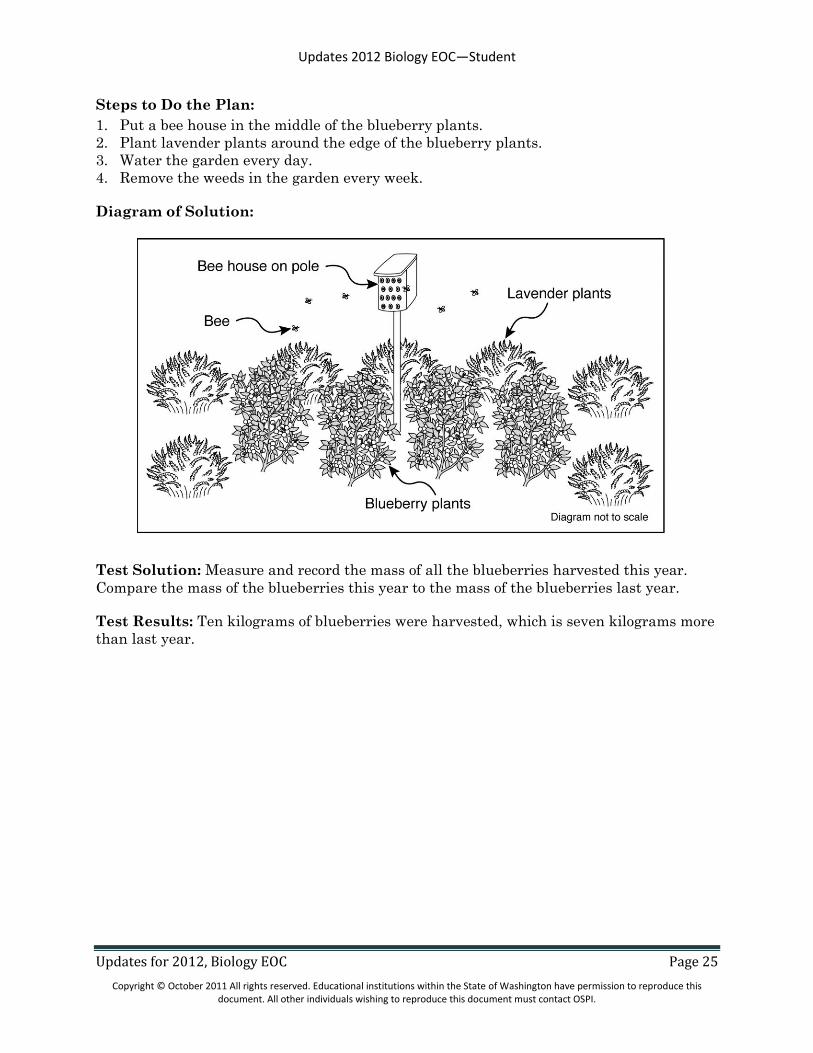
Steps to Do the Plan:
1. Put a bee house in the middle of the blueberry plants.
2. Plant lavender plants around the edge of the blueberry plants.
3. Water the garden every day.
4. Remove the weeds in the garden every week.
Diagram of Solution:
Test Solution: Measure and record the mass of all the blueberries harvested this year.
Compare the mass of the blueberries this year to the mass of the blueberries last year.
Test Results: Ten kilograms of blueberries were harvested, which is seven kilograms more
than last year.
Updates 2012 Biology EOC—Student
Updates for 2012, Biology EOC Page 26
Copyright © October 2011 All rights reserved. Educational institutions within the State of Washington have permission to reproduce this document. All other individuals wishing to reproduce this document must contact OSPI.
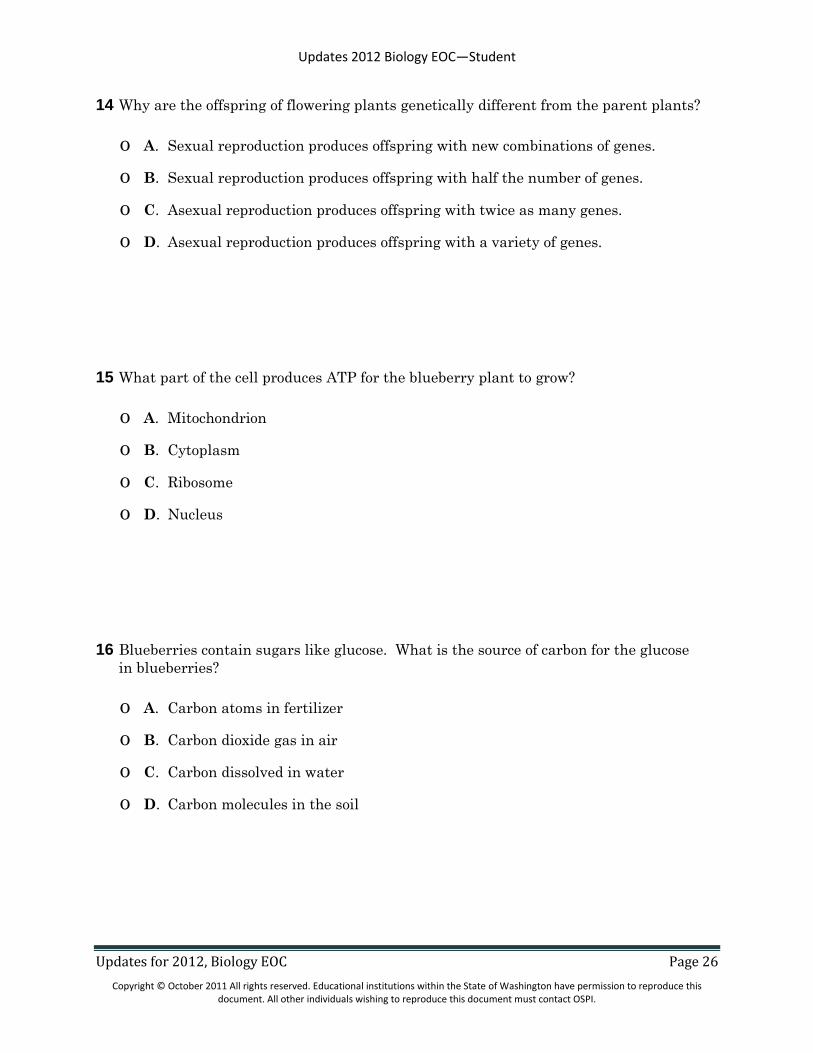
14 Why are the offspring of flowering plants genetically different from the parent plants?
o A. Sexual reproduction produces offspring with new combinations of genes.
o B. Sexual reproduction produces offspring with half the number of genes.
o C. Asexual reproduction produces offspring with twice as many genes.
o D. Asexual reproduction produces offspring with a variety of genes.
15 What part of the cell produces ATP for the blueberry plant to grow?
o A. Mitochondrion
o B. Cytoplasm
o C. Ribosome
o D. Nucleus
16 Blueberries contain sugars like glucose. What is the source of carbon for the glucose
in blueberries?
o A. Carbon atoms in fertilizer
o B. Carbon dioxide gas in air
o C. Carbon dissolved in water
o D. Carbon molecules in the soil
Updates 2012 Biology EOC—Student
Updates for 2012, Biology EOC Page 27
Copyright © October 2011 All rights reserved. Educational institutions within the State of Washington have permission to reproduce this document. All other individuals wishing to reproduce this document must contact OSPI.
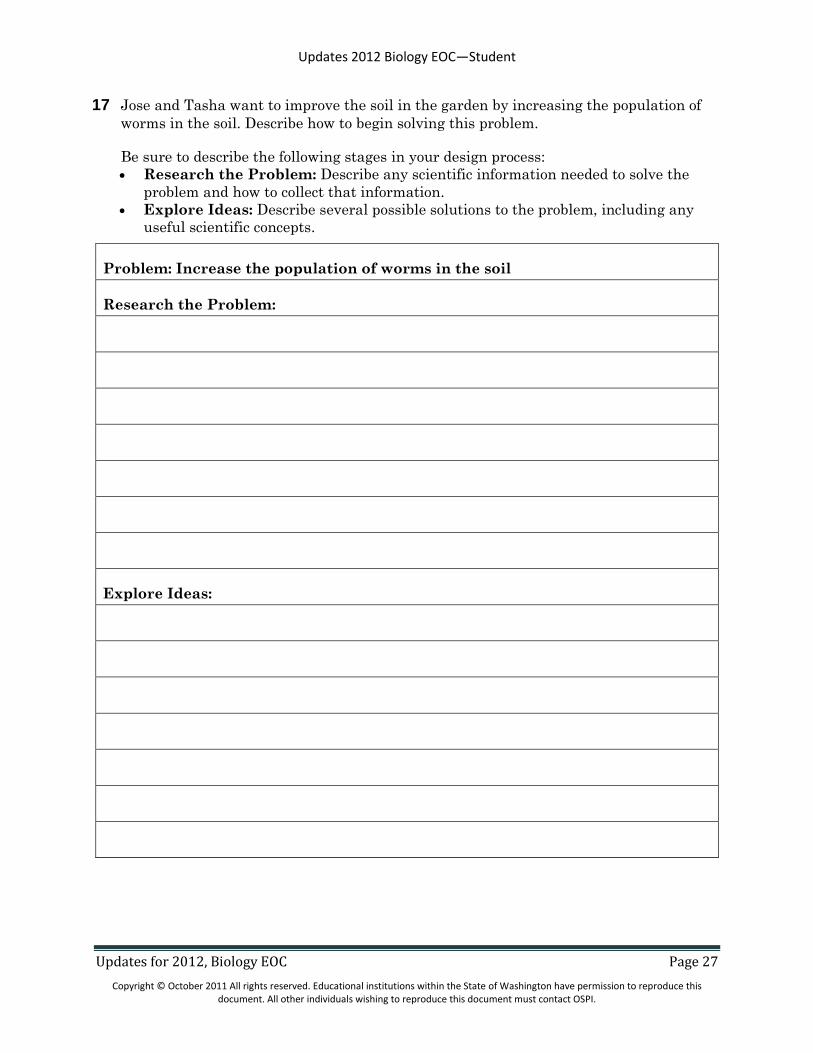
17 Jose and Tasha want to improve the soil in the garden by increasing the population of
worms in the soil. Describe how to begin solving this problem.
Be sure to describe the following stages in your design process:
Research the Problem: Describe any scientific information needed to solve the
problem and how to collect that information.
Explore Ideas: Describe several possible solutions to the problem, including any
useful scientific concepts.
Problem: Increase the population of worms in the soil
Research the Problem:
Explore Ideas:

Updates 2012 Biology EOC—Teacher
Updates for 2012, Biology EOC Page 28
Copyright © October 2011 All rights reserved. Educational institutions within the State of Washington have permission to reproduce this document. All other individuals wishing to reproduce this document must contact OSPI.
Teacher Answer Pages
The following pages provide:
An Answer Key Table for each scenario with:
o Item Specification text
o Item Specification code
For example: LS2A(2) is the second item specification for content standard LS2A.
o Correct answers for the multiple choice questions
o Cognitive level of the questions, based on Webb’s Depth of Knowledge*
Rubrics for completion and short-answer items (student words are in italics)
Annotated (scored) student responses for each of the short-answer items (student words are in
italics)
* See Appendix A of the Test and Item Specification document for more information about cognitive
levels.
Stand Alone Items
Answer Key Table
Title: Stand Alone Items Grade: Biology EOC
Description: Items not attached to a scenario
Item Description
Item Specification Text
Item Specification Code
Systems
Inq
uiry
Ap
plicatio
n
Structu
res &
Fun
ction
s
Ecosystem
s
Bio
logical
Evolu
tion
An
swe
r
Co
gnitive Level
1 Determine whether a given system involves positive feedback or negative feedback.
SYSA (2)
C 2
2 Describe the cycle of nitrogen through ecosystems. LS2A (3)
D 1

Updates 2012 Biology EOC—Teacher
Updates for 2012, Biology EOC Page 29
Copyright © October 2011 All rights reserved. Educational institutions within the State of Washington have permission to reproduce this document. All other individuals wishing to reproduce this document must contact OSPI.
Foaming Spuds Scenario
Answer Key Table
Title: Foaming Spuds Grade: Biology EOC
Description: An inquiry scenario of a controlled experiment in the context of life science
Item Description
Item Specification Text
Item Specification Code
Systems
Inq
uiry
Ap
plicatio
n
Structu
res &
Fun
ction
s
Ecosystem
s
Bio
logical
Evolu
tion
An
swe
r
Co
gnitive Level
3 Describe how to increase the reliability of the results of an investigation.
INQF
(3) B 1
4
Generate a logical conclusion that is supported by evidence from the investigation and/or provide a scientific reason to explain the trend in data given a description of and the results from a scientific investigation.
INQC
(1) SA 3
5 Evaluate an investigation in terms of validity. INQF
(1) D 2
6 Describe a plan to answer a given question for a controlled experiment.
INQB
(1) SA 3
Updates 2012 Biology EOC—Teacher
Updates for 2012, Biology EOC Page 30
Copyright © October 2011 All rights reserved. Educational institutions within the State of Washington have permission to reproduce this document. All other individuals wishing to reproduce this document must contact OSPI.
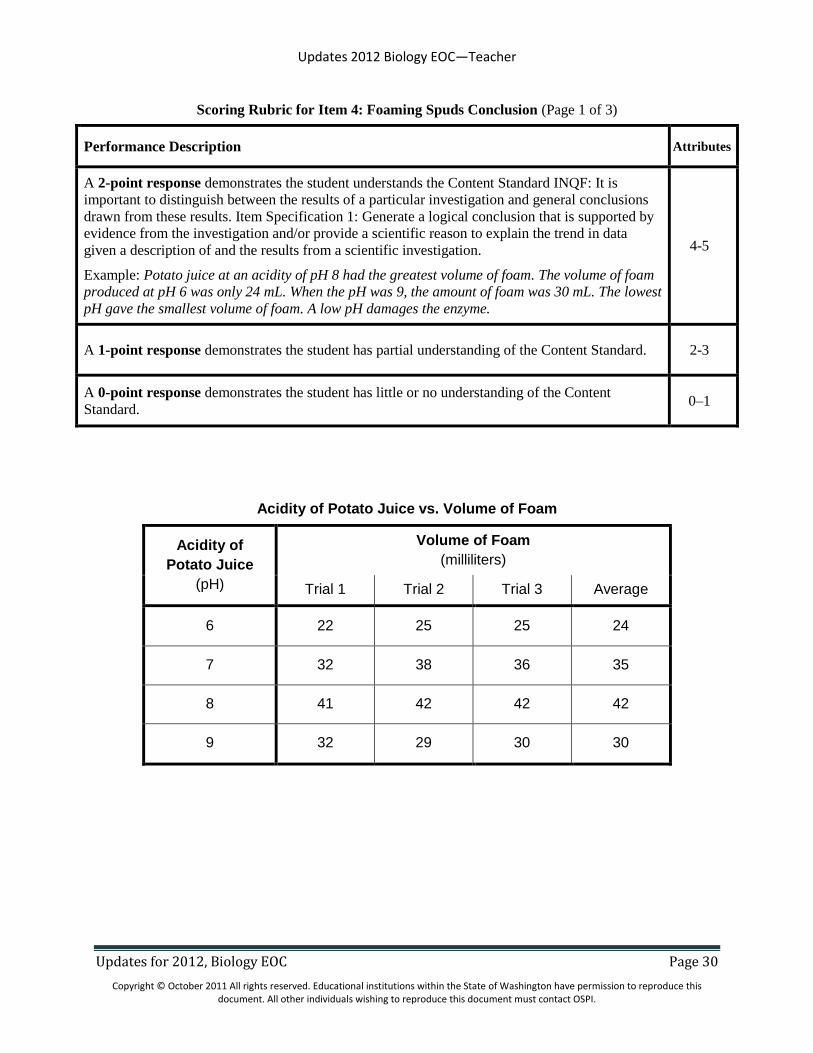
Scoring Rubric for Item 4: Foaming Spuds Conclusion (Page 1 of 3)
Performance Description Attributes
A 2-point response demonstrates the student understands the Content Standard INQF: It is
important to distinguish between the results of a particular investigation and general conclusions
drawn from these results. Item Specification 1: Generate a logical conclusion that is supported by
evidence from the investigation and/or provide a scientific reason to explain the trend in data
given a description of and the results from a scientific investigation.
Example: Potato juice at an acidity of pH 8 had the greatest volume of foam. The volume of foam
produced at pH 6 was only 24 mL. When the pH was 9, the amount of foam was 30 mL. The lowest
pH gave the smallest volume of foam. A low pH damages the enzyme.
4-5
A 1-point response demonstrates the student has partial understanding of the Content Standard. 2-3
A 0-point response demonstrates the student has little or no understanding of the Content
Standard. 0–1
Acidity of Potato Juice vs. Volume of Foam
Acidity of
Potato Juice
(pH)
Volume of Foam
(milliliters)
Trial 1 Trial 2 Trial 3 Average
6 22 25 25 24
7 32 38 36 35
8 41 42 42 42
9 32 29 30 30
Updates 2012 Biology EOC—Teacher
Updates for 2012, Biology EOC Page 31
Copyright © October 2011 All rights reserved. Educational institutions within the State of Washington have permission to reproduce this document. All other individuals wishing to reproduce this document must contact OSPI.
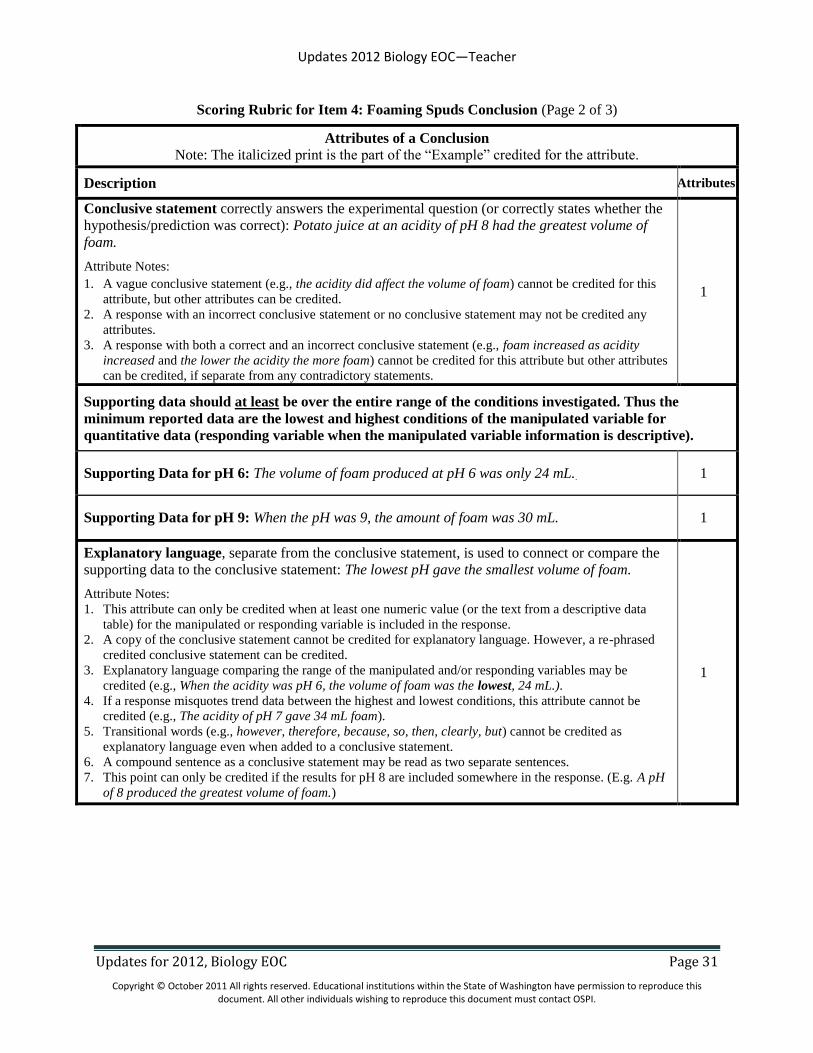
Scoring Rubric for Item 4: Foaming Spuds Conclusion (Page 2 of 3)
Attributes of a Conclusion
Note: The italicized print is the part of the “Example” credited for the attribute.
Description Attributes
Conclusive statement correctly answers the experimental question (or correctly states whether the
hypothesis/prediction was correct): Potato juice at an acidity of pH 8 had the greatest volume of
foam.
Attribute Notes:
1. A vague conclusive statement (e.g., the acidity did affect the volume of foam) cannot be credited for this
attribute, but other attributes can be credited.
2. A response with an incorrect conclusive statement or no conclusive statement may not be credited any
attributes. 3. A response with both a correct and an incorrect conclusive statement (e.g., foam increased as acidity
increased and the lower the acidity the more foam) cannot be credited for this attribute but other attributes
can be credited, if separate from any contradictory statements.
1
Supporting data should at least be over the entire range of the conditions investigated. Thus the
minimum reported data are the lowest and highest conditions of the manipulated variable for
quantitative data (responding variable when the manipulated variable information is descriptive).
Supporting Data for pH 6: The volume of foam produced at pH 6 was only 24 mL.. 1
Supporting Data for pH 9: When the pH was 9, the amount of foam was 30 mL. 1
Explanatory language, separate from the conclusive statement, is used to connect or compare the
supporting data to the conclusive statement: The lowest pH gave the smallest volume of foam.
Attribute Notes:
1. This attribute can only be credited when at least one numeric value (or the text from a descriptive data
table) for the manipulated or responding variable is included in the response.
2. A copy of the conclusive statement cannot be credited for explanatory language. However, a re-phrased
credited conclusive statement can be credited.
3. Explanatory language comparing the range of the manipulated and/or responding variables may be
credited (e.g., When the acidity was pH 6, the volume of foam was the lowest, 24 mL.).
4. If a response misquotes trend data between the highest and lowest conditions, this attribute cannot be
credited (e.g., The acidity of pH 7 gave 34 mL foam).
5. Transitional words (e.g., however, therefore, because, so, then, clearly, but) cannot be credited as
explanatory language even when added to a conclusive statement.
6. A compound sentence as a conclusive statement may be read as two separate sentences. 7. This point can only be credited if the results for pH 8 are included somewhere in the response. (E.g. A pH
of 8 produced the greatest volume of foam.)
1
Updates 2012 Biology EOC—Teacher
Updates for 2012, Biology EOC Page 32
Copyright © October 2011 All rights reserved. Educational institutions within the State of Washington have permission to reproduce this document. All other individuals wishing to reproduce this document must contact OSPI.
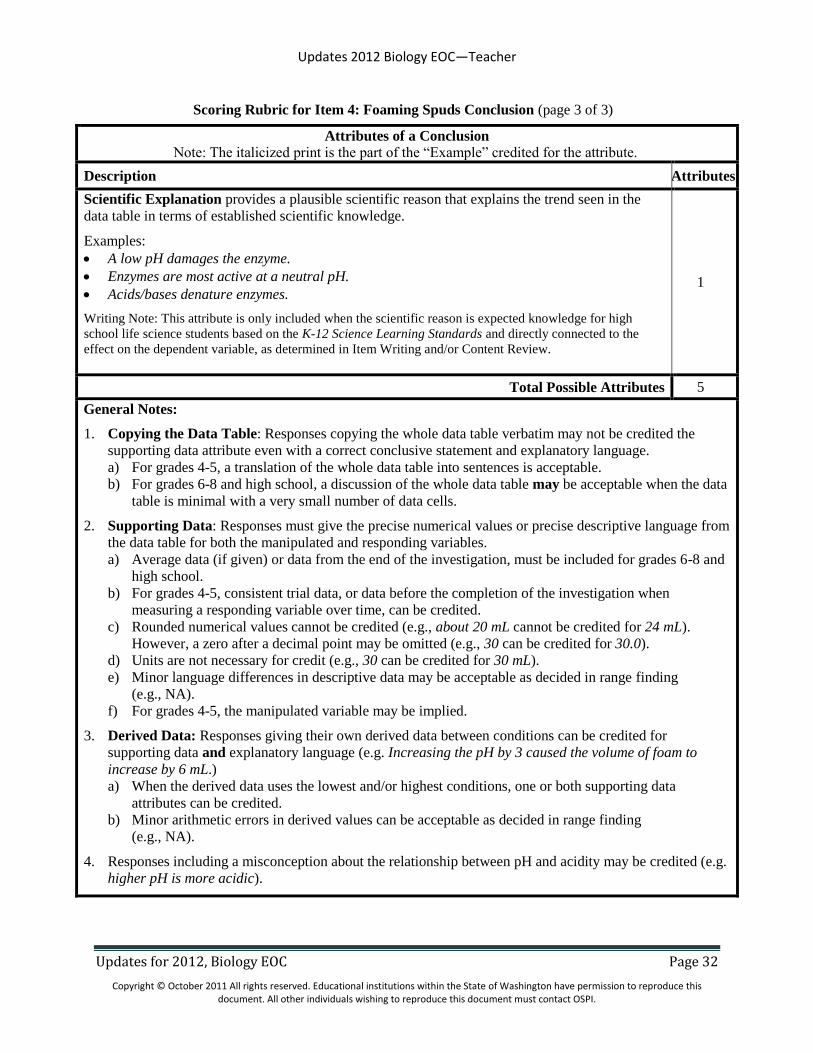
Scoring Rubric for Item 4: Foaming Spuds Conclusion (page 3 of 3)
Attributes of a Conclusion
Note: The italicized print is the part of the “Example” credited for the attribute.
Description Attributes
Scientific Explanation provides a plausible scientific reason that explains the trend seen in the
data table in terms of established scientific knowledge.
Examples:
A low pH damages the enzyme.
Enzymes are most active at a neutral pH.
Acids/bases denature enzymes.
Writing Note: This attribute is only included when the scientific reason is expected knowledge for high
school life science students based on the K-12 Science Learning Standards and directly connected to the
effect on the dependent variable, as determined in Item Writing and/or Content Review.
1
Total Possible Attributes 5
General Notes:
1. Copying the Data Table: Responses copying the whole data table verbatim may not be credited the
supporting data attribute even with a correct conclusive statement and explanatory language.
a) For grades 4-5, a translation of the whole data table into sentences is acceptable.
b) For grades 6-8 and high school, a discussion of the whole data table may be acceptable when the data
table is minimal with a very small number of data cells.
2. Supporting Data: Responses must give the precise numerical values or precise descriptive language from
the data table for both the manipulated and responding variables.
a) Average data (if given) or data from the end of the investigation, must be included for grades 6-8 and
high school.
b) For grades 4-5, consistent trial data, or data before the completion of the investigation when
measuring a responding variable over time, can be credited.
c) Rounded numerical values cannot be credited (e.g., about 20 mL cannot be credited for 24 mL).
However, a zero after a decimal point may be omitted (e.g., 30 can be credited for 30.0).
d) Units are not necessary for credit (e.g., 30 can be credited for 30 mL).
e) Minor language differences in descriptive data may be acceptable as decided in range finding
(e.g., NA).
f) For grades 4-5, the manipulated variable may be implied.
3. Derived Data: Responses giving their own derived data between conditions can be credited for
supporting data and explanatory language (e.g. Increasing the pH by 3 caused the volume of foam to
increase by 6 mL.)
a) When the derived data uses the lowest and/or highest conditions, one or both supporting data
attributes can be credited.
b) Minor arithmetic errors in derived values can be acceptable as decided in range finding
(e.g., NA).
4. Responses including a misconception about the relationship between pH and acidity may be credited (e.g.
higher pH is more acidic).
Updates 2012 Biology EOC—Teacher
Updates for 2012, Biology EOC Page 33
Copyright © October 2011 All rights reserved. Educational institutions within the State of Washington have permission to reproduce this document. All other individuals wishing to reproduce this document must contact OSPI.
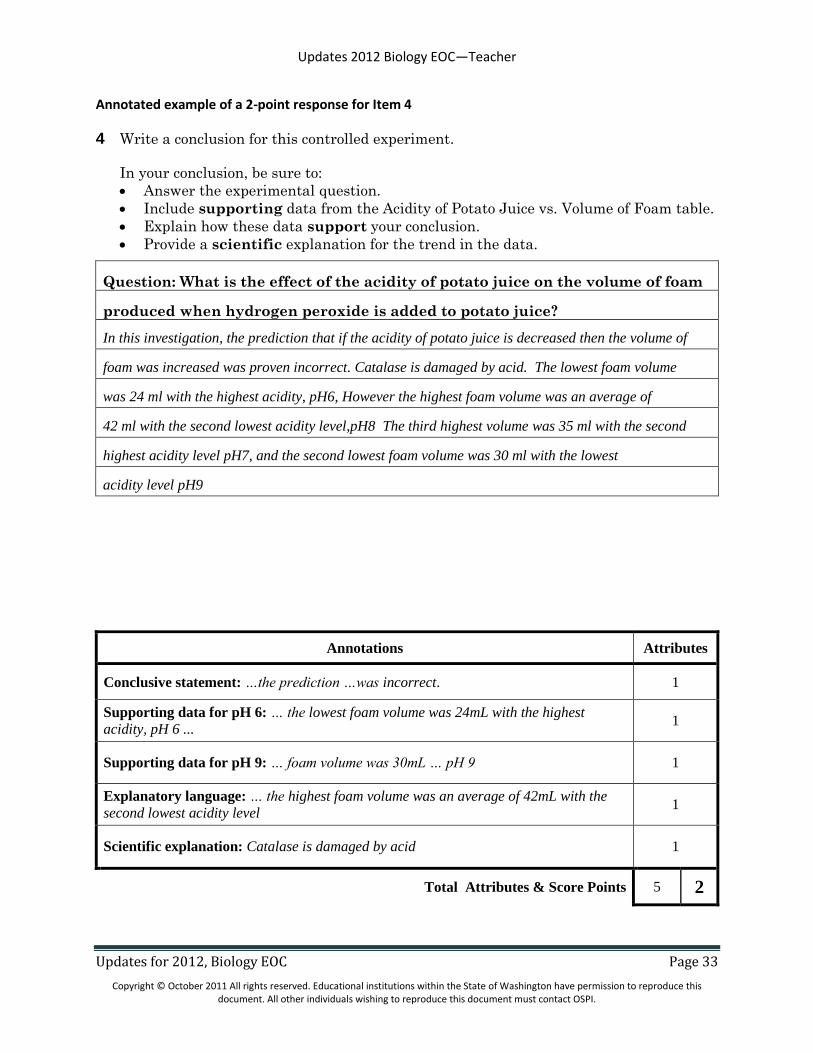
Annotated example of a 2-point response for Item 4
4 Write a conclusion for this controlled experiment.
In your conclusion, be sure to:
Answer the experimental question.
Include supporting data from the Acidity of Potato Juice vs. Volume of Foam table.
Explain how these data support your conclusion.
Provide a scientific explanation for the trend in the data.
Question: What is the effect of the acidity of potato juice on the volume of foam
produced when hydrogen peroxide is added to potato juice?
In this investigation, the prediction that if the acidity of potato juice is decreased then the volume of
foam was increased was proven incorrect. Catalase is damaged by acid. The lowest foam volume
was 24 ml with the highest acidity, pH6, However the highest foam volume was an average of
42 ml with the second lowest acidity level,pH8 The third highest volume was 35 ml with the second
highest acidity level pH7, and the second lowest foam volume was 30 ml with the lowest
acidity level pH9
Annotations Attributes
Conclusive statement: …the prediction …was incorrect. 1
Supporting data for pH 6: … the lowest foam volume was 24mL with the highest
acidity, pH 6 ... 1
Supporting data for pH 9: … foam volume was 30mL … pH 9 1
Explanatory language: … the highest foam volume was an average of 42mL with the
second lowest acidity level 1
Scientific explanation: Catalase is damaged by acid 1
Total Attributes & Score Points 5 2
Updates 2012 Biology EOC—Teacher
Updates for 2012, Biology EOC Page 34
Copyright © October 2011 All rights reserved. Educational institutions within the State of Washington have permission to reproduce this document. All other individuals wishing to reproduce this document must contact OSPI.
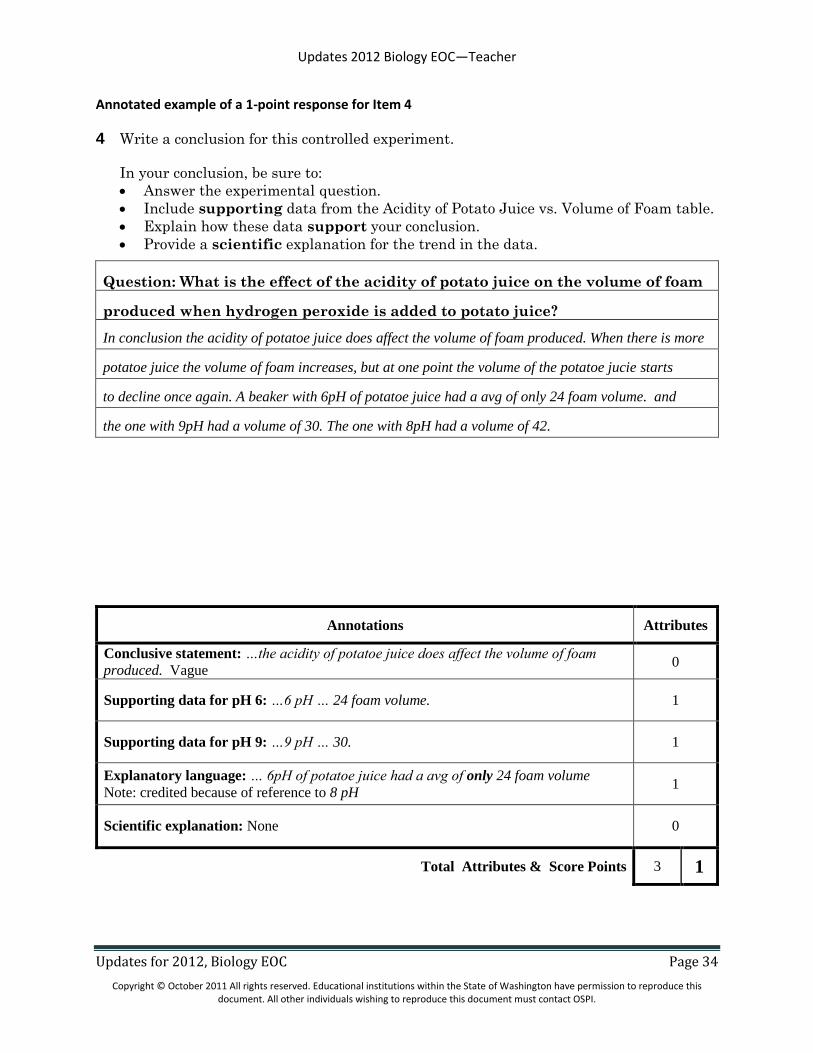
Annotated example of a 1-point response for Item 4
4 Write a conclusion for this controlled experiment.
In your conclusion, be sure to:
Answer the experimental question.
Include supporting data from the Acidity of Potato Juice vs. Volume of Foam table.
Explain how these data support your conclusion.
Provide a scientific explanation for the trend in the data.
Question: What is the effect of the acidity of potato juice on the volume of foam
produced when hydrogen peroxide is added to potato juice?
In conclusion the acidity of potatoe juice does affect the volume of foam produced. When there is more
potatoe juice the volume of foam increases, but at one point the volume of the potatoe jucie starts
to decline once again. A beaker with 6pH of potatoe juice had a avg of only 24 foam volume. and
the one with 9pH had a volume of 30. The one with 8pH had a volume of 42.
Annotations Attributes
Conclusive statement: …the acidity of potatoe juice does affect the volume of foam
produced. Vague 0
Supporting data for pH 6: …6 pH … 24 foam volume. 1
Supporting data for pH 9: …9 pH … 30. 1
Explanatory language: … 6pH of potatoe juice had a avg of only 24 foam volume
Note: credited because of reference to 8 pH 1
Scientific explanation: None 0
Total Attributes & Score Points 3 1
Updates 2012 Biology EOC—Teacher
Updates for 2012, Biology EOC Page 35
Copyright © October 2011 All rights reserved. Educational institutions within the State of Washington have permission to reproduce this document. All other individuals wishing to reproduce this document must contact OSPI.
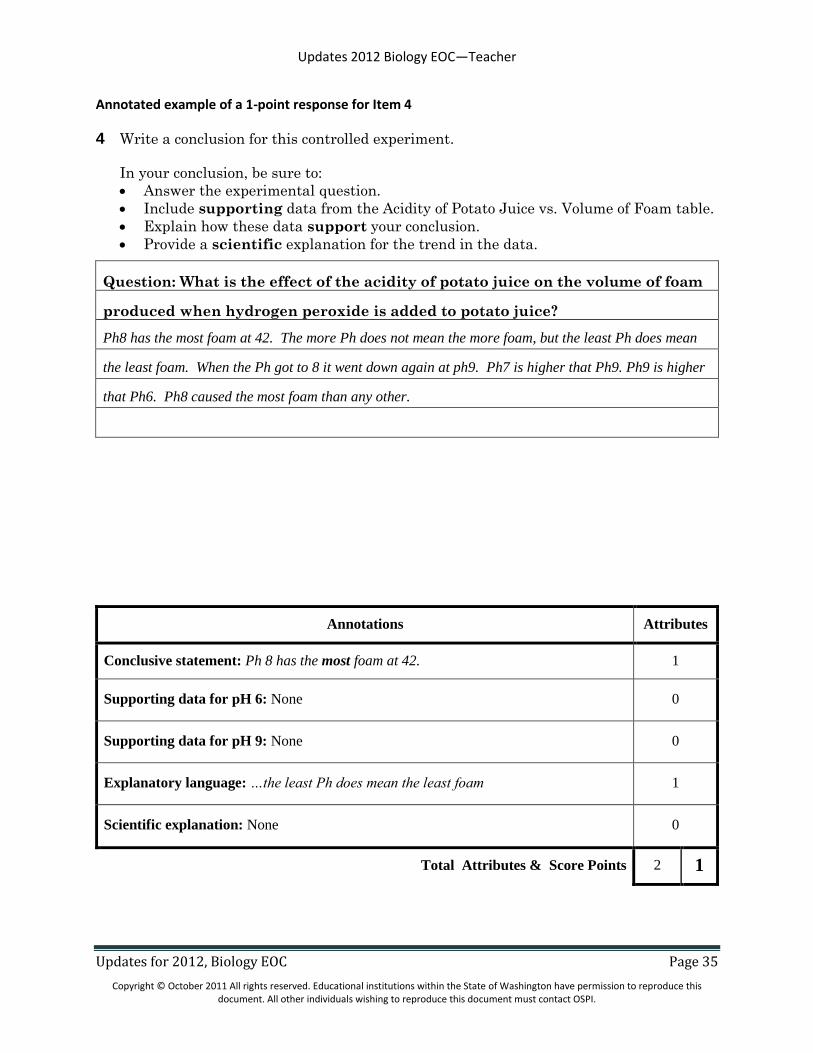
Annotated example of a 1-point response for Item 4
4 Write a conclusion for this controlled experiment.
In your conclusion, be sure to:
Answer the experimental question.
Include supporting data from the Acidity of Potato Juice vs. Volume of Foam table.
Explain how these data support your conclusion.
Provide a scientific explanation for the trend in the data.
Question: What is the effect of the acidity of potato juice on the volume of foam
produced when hydrogen peroxide is added to potato juice?
Ph8 has the most foam at 42. The more Ph does not mean the more foam, but the least Ph does mean
the least foam. When the Ph got to 8 it went down again at ph9. Ph7 is higher that Ph9. Ph9 is higher
that Ph6. Ph8 caused the most foam than any other.
Annotations Attributes
Conclusive statement: Ph 8 has the most foam at 42. 1
Supporting data for pH 6: None 0
Supporting data for pH 9: None 0
Explanatory language: …the least Ph does mean the least foam 1
Scientific explanation: None 0
Total Attributes & Score Points 2 1
Updates 2012 Biology EOC—Teacher
Updates for 2012, Biology EOC Page 36
Copyright © October 2011 All rights reserved. Educational institutions within the State of Washington have permission to reproduce this document. All other individuals wishing to reproduce this document must contact OSPI.
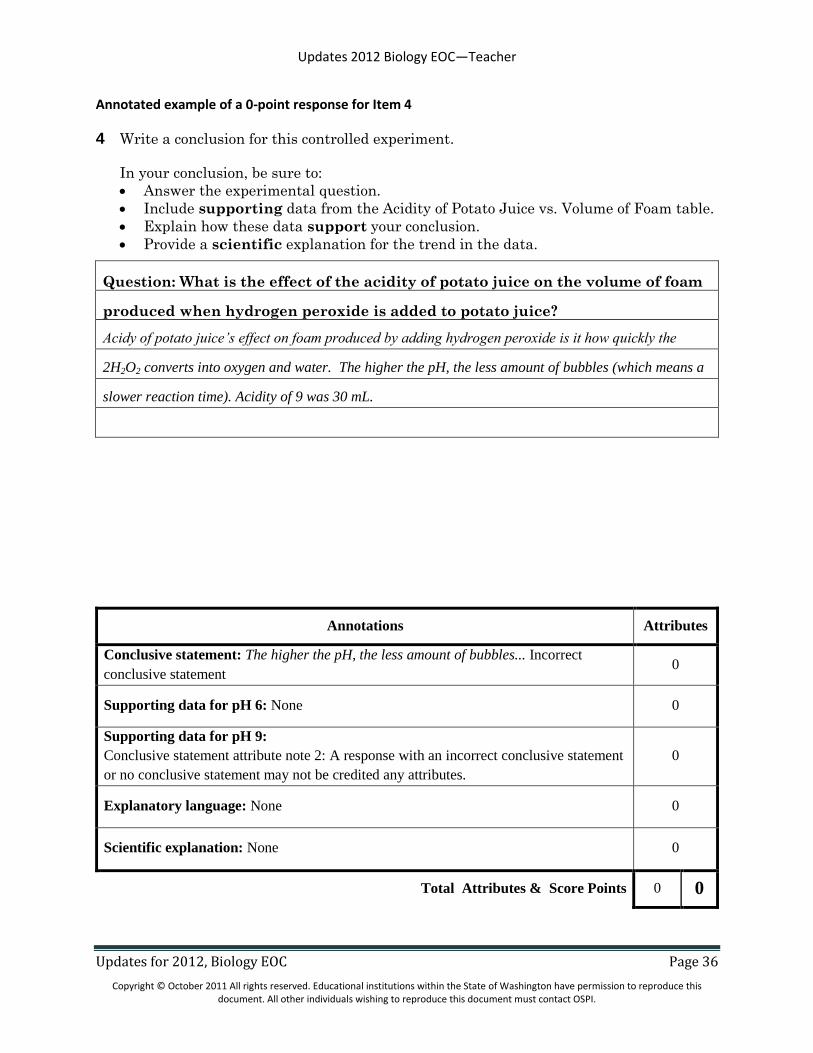
Annotated example of a 0-point response for Item 4
4 Write a conclusion for this controlled experiment.
In your conclusion, be sure to:
Answer the experimental question.
Include supporting data from the Acidity of Potato Juice vs. Volume of Foam table.
Explain how these data support your conclusion.
Provide a scientific explanation for the trend in the data.
Question: What is the effect of the acidity of potato juice on the volume of foam
produced when hydrogen peroxide is added to potato juice?
Acidy of potato juice’s effect on foam produced by adding hydrogen peroxide is it how quickly the
2H2O2 converts into oxygen and water. The higher the pH, the less amount of bubbles (which means a
slower reaction time). Acidity of 9 was 30 mL.
Annotations Attributes
Conclusive statement: The higher the pH, the less amount of bubbles... Incorrect
conclusive statement 0
Supporting data for pH 6: None 0
Supporting data for pH 9:
Conclusive statement attribute note 2: A response with an incorrect conclusive statement
or no conclusive statement may not be credited any attributes.
0
Explanatory language: None 0
Scientific explanation: None 0
Total Attributes & Score Points 0 0
Updates 2012 Biology EOC—Teacher
Updates for 2012, Biology EOC Page 37
Copyright © October 2011 All rights reserved. Educational institutions within the State of Washington have permission to reproduce this document. All other individuals wishing to reproduce this document must contact OSPI.
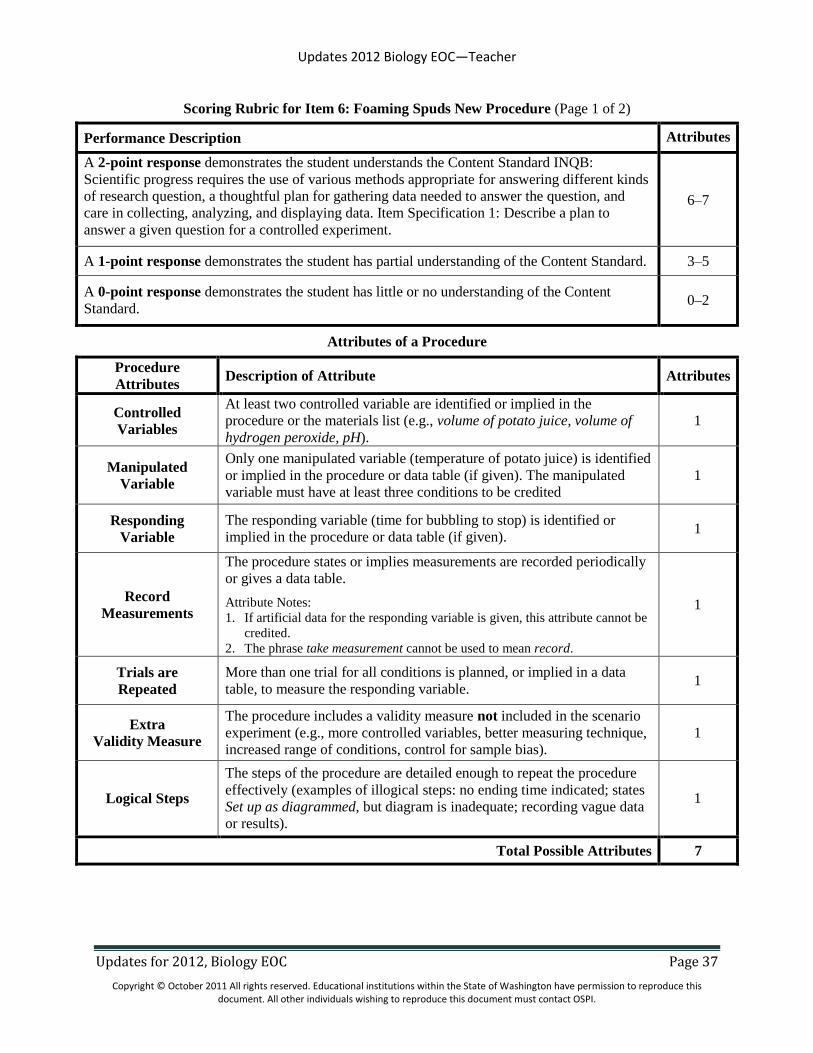
Scoring Rubric for Item 6: Foaming Spuds New Procedure (Page 1 of 2)
Performance Description Attributes
A 2-point response demonstrates the student understands the Content Standard INQB:
Scientific progress requires the use of various methods appropriate for answering different kinds
of research question, a thoughtful plan for gathering data needed to answer the question, and
care in collecting, analyzing, and displaying data. Item Specification 1: Describe a plan to
answer a given question for a controlled experiment.
6–7
A 1-point response demonstrates the student has partial understanding of the Content Standard. 3–5
A 0-point response demonstrates the student has little or no understanding of the Content
Standard. 0–2
Attributes of a Procedure
Procedure
Attributes Description of Attribute Attributes
Controlled
Variables
At least two controlled variable are identified or implied in the
procedure or the materials list (e.g., volume of potato juice, volume of
hydrogen peroxide, pH).
1
Manipulated
Variable
Only one manipulated variable (temperature of potato juice) is identified
or implied in the procedure or data table (if given). The manipulated
variable must have at least three conditions to be credited
1
Responding
Variable
The responding variable (time for bubbling to stop) is identified or
implied in the procedure or data table (if given). 1
Record
Measurements
The procedure states or implies measurements are recorded periodically
or gives a data table.
Attribute Notes:
1. If artificial data for the responding variable is given, this attribute cannot be
credited.
2. The phrase take measurement cannot be used to mean record.
1
Trials are
Repeated
More than one trial for all conditions is planned, or implied in a data
table, to measure the responding variable. 1
Extra
Validity Measure
The procedure includes a validity measure not included in the scenario
experiment (e.g., more controlled variables, better measuring technique,
increased range of conditions, control for sample bias).
1
Logical Steps
The steps of the procedure are detailed enough to repeat the procedure
effectively (examples of illogical steps: no ending time indicated; states
Set up as diagrammed, but diagram is inadequate; recording vague data
or results).
1
Total Possible Attributes 7
Updates 2012 Biology EOC—Teacher
Updates for 2012, Biology EOC Page 38
Copyright © October 2011 All rights reserved. Educational institutions within the State of Washington have permission to reproduce this document. All other individuals wishing to reproduce this document must contact OSPI.
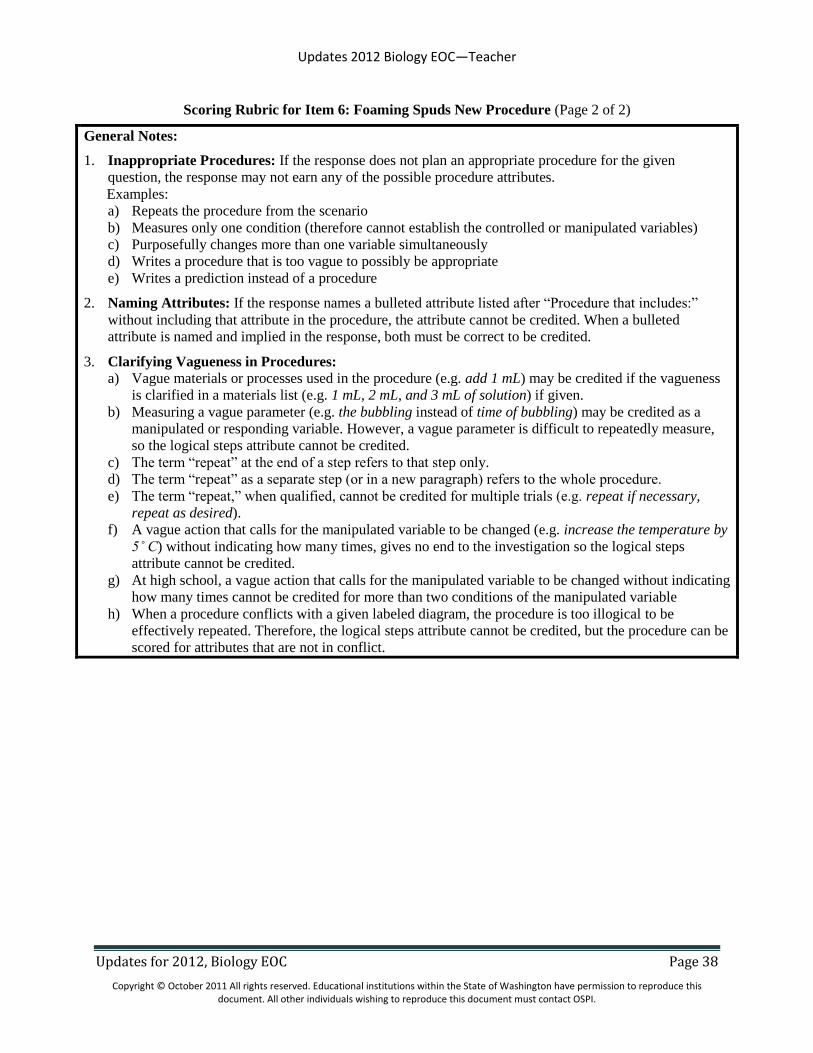
Scoring Rubric for Item 6: Foaming Spuds New Procedure (Page 2 of 2)
General Notes:
1. Inappropriate Procedures: If the response does not plan an appropriate procedure for the given
question, the response may not earn any of the possible procedure attributes.
Examples:
a) Repeats the procedure from the scenario
b) Measures only one condition (therefore cannot establish the controlled or manipulated variables)
c) Purposefully changes more than one variable simultaneously
d) Writes a procedure that is too vague to possibly be appropriate
e) Writes a prediction instead of a procedure
2. Naming Attributes: If the response names a bulleted attribute listed after “Procedure that includes:”
without including that attribute in the procedure, the attribute cannot be credited. When a bulleted
attribute is named and implied in the response, both must be correct to be credited.
3. Clarifying Vagueness in Procedures: a) Vague materials or processes used in the procedure (e.g. add 1 mL) may be credited if the vagueness
is clarified in a materials list (e.g. 1 mL, 2 mL, and 3 mL of solution) if given.
b) Measuring a vague parameter (e.g. the bubbling instead of time of bubbling) may be credited as a
manipulated or responding variable. However, a vague parameter is difficult to repeatedly measure,
so the logical steps attribute cannot be credited.
c) The term “repeat” at the end of a step refers to that step only.
d) The term “repeat” as a separate step (or in a new paragraph) refers to the whole procedure.
e) The term “repeat,” when qualified, cannot be credited for multiple trials (e.g. repeat if necessary,
repeat as desired).
f) A vague action that calls for the manipulated variable to be changed (e.g. increase the temperature by
5˚ C) without indicating how many times, gives no end to the investigation so the logical steps
attribute cannot be credited.
g) At high school, a vague action that calls for the manipulated variable to be changed without indicating
how many times cannot be credited for more than two conditions of the manipulated variable
h) When a procedure conflicts with a given labeled diagram, the procedure is too illogical to be
effectively repeated. Therefore, the logical steps attribute cannot be credited, but the procedure can be
scored for attributes that are not in conflict.

Updates 2012 Biology EOC—Teacher
Updates for 2012, Biology EOC Page 39
Copyright © October 2011 All rights reserved. Educational institutions within the State of Washington have permission to reproduce this document. All other individuals wishing to reproduce this document must contact OSPI.
Annotated example of a 2-point response to Item 6
6 Plan a controlled experiment to answer the question in the box. You may use any
materials and equipment in your procedure.
Be sure your procedure includes: logical steps to do the experiment
two controlled (kept the same) variables
one manipulated (independent) variable
one responding (dependent) variable
how often measurements should be
taken and recorded
Question: What is the effect of the temperature of potato juice on the time for
bubbling to stop after hydrogen peroxide is added?
Procedure: 1. Set up the graduated cylinders and put 10 millileters of room temperature potato
juice into beaker A.
2. Monitor the room temperature to make sure it stays the same throughout the experiment.
3. Add 5 milliliters of hydrogen peroxide to the cylinder, stir for two seconds, start timer.
4. Measure and record the time the mixture is bubbling.
5. Repeat steps 1-4 three more times only heat the potato juice to 72°F (label B) 82°F (label C) and
92°F (label D). Use the same thermometer for all temperatures
6. Clean all graduated cylinders. 7. Repeat steps 1-6 two times for Trials 2 and 3 to verify results
8. Calculate and record the average time the mixture bubbled for each temperature of potato juice.
Attribute Name Credit Annotation
Controlled
Variables 1
Step 1. ...put 10 milliliters of potato juice...
Step 3. Add 5 milliliters of hydrogen peroxide...
Manipulated
Variable 1
Four conditions:
Step 1. ... room temperature potato juice...
Step 5. 72oF...82
oF...92
oF
Responding
Variable 1 Step 4. Measure ... the time the mixture is bubbling.
Record
Measurements 1 Step 4. ... record the time the mixture is bubbling.
Trials are
Repeated 1 Step 7 Repeat steps 1-6 two times for Trials 2 and 3
Extra Validity Measure 1 Step 5. … Use the same thermometer for all temperatures
Logical Steps 1 The steps of the procedure are detailed enough to repeat the procedure
effectively.
Total Attributes 7 2 Score Points
Updates 2012 Biology EOC—Teacher
Updates for 2012, Biology EOC Page 40
Copyright © October 2011 All rights reserved. Educational institutions within the State of Washington have permission to reproduce this document. All other individuals wishing to reproduce this document must contact OSPI.
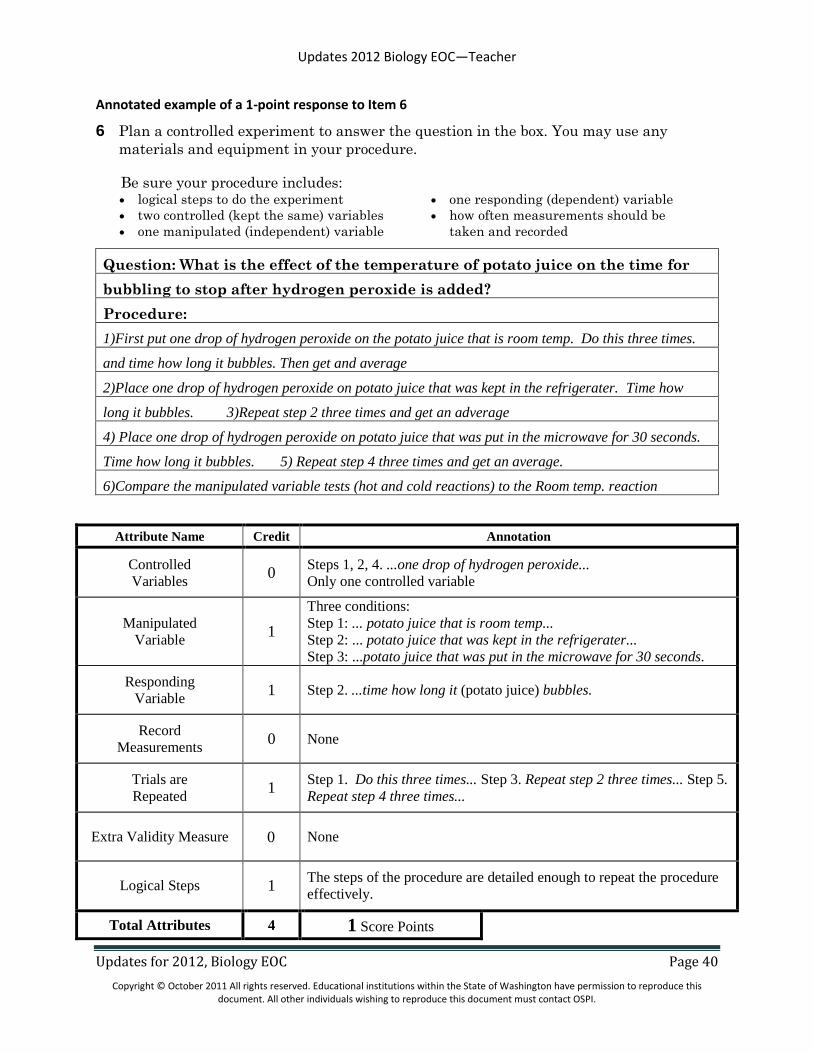
Annotated example of a 1-point response to Item 6
6 Plan a controlled experiment to answer the question in the box. You may use any
materials and equipment in your procedure.
Be sure your procedure includes: logical steps to do the experiment
two controlled (kept the same) variables
one manipulated (independent) variable
one responding (dependent) variable
how often measurements should be
taken and recorded
Question: What is the effect of the temperature of potato juice on the time for
bubbling to stop after hydrogen peroxide is added?
Procedure:
1)First put one drop of hydrogen peroxide on the potato juice that is room temp. Do this three times.
and time how long it bubbles. Then get and average
2)Place one drop of hydrogen peroxide on potato juice that was kept in the refrigerater. Time how
long it bubbles. 3)Repeat step 2 three times and get an adverage
4) Place one drop of hydrogen peroxide on potato juice that was put in the microwave for 30 seconds.
Time how long it bubbles. 5) Repeat step 4 three times and get an average.
6)Compare the manipulated variable tests (hot and cold reactions) to the Room temp. reaction
Attribute Name Credit Annotation
Controlled
Variables 0
Steps 1, 2, 4. ...one drop of hydrogen peroxide...
Only one controlled variable
Manipulated
Variable 1
Three conditions:
Step 1: ... potato juice that is room temp...
Step 2: ... potato juice that was kept in the refrigerater...
Step 3: ...potato juice that was put in the microwave for 30 seconds.
Responding
Variable 1 Step 2. ...time how long it (potato juice) bubbles.
Record
Measurements 0 None
Trials are
Repeated 1
Step 1. Do this three times... Step 3. Repeat step 2 three times... Step 5.
Repeat step 4 three times...
Extra Validity Measure 0 None
Logical Steps 1 The steps of the procedure are detailed enough to repeat the procedure
effectively.
Total Attributes 4 1 Score Points
Updates 2012 Biology EOC—Teacher
Updates for 2012, Biology EOC Page 41
Copyright © October 2011 All rights reserved. Educational institutions within the State of Washington have permission to reproduce this document. All other individuals wishing to reproduce this document must contact OSPI.
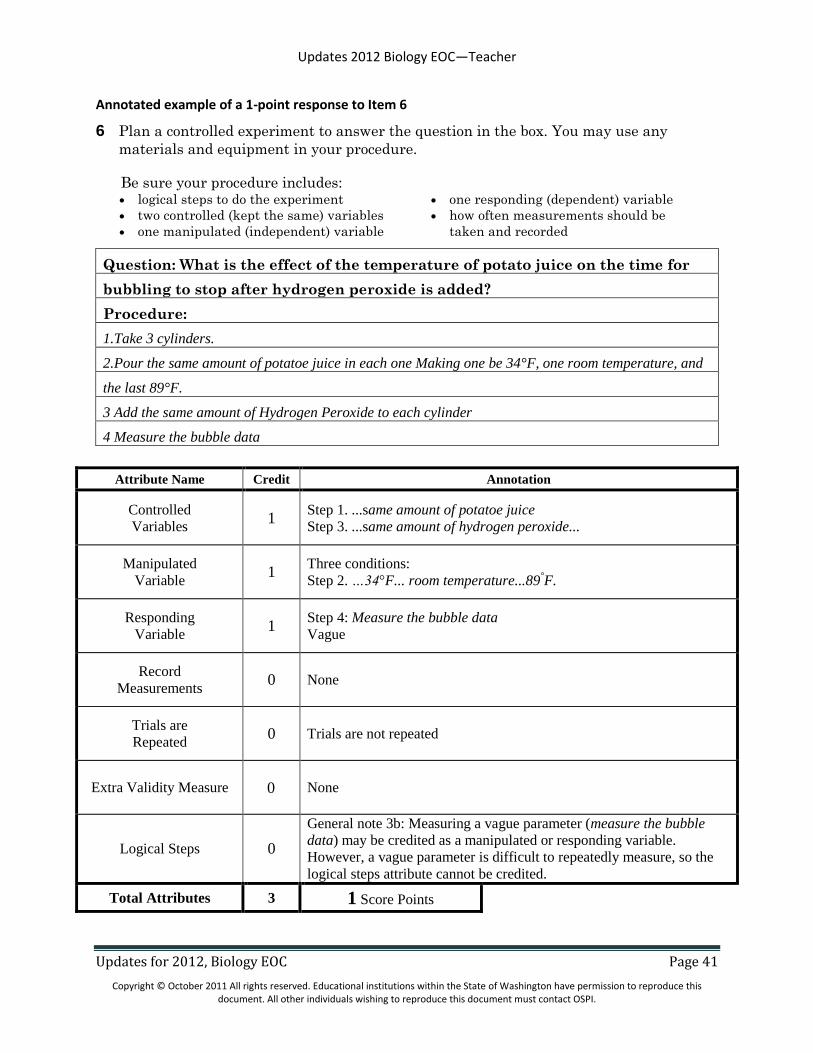
Annotated example of a 1-point response to Item 6
6 Plan a controlled experiment to answer the question in the box. You may use any
materials and equipment in your procedure.
Be sure your procedure includes: logical steps to do the experiment
two controlled (kept the same) variables
one manipulated (independent) variable
one responding (dependent) variable
how often measurements should be
taken and recorded
Question: What is the effect of the temperature of potato juice on the time for
bubbling to stop after hydrogen peroxide is added?
Procedure:
1.Take 3 cylinders.
2.Pour the same amount of potatoe juice in each one Making one be 34°F, one room temperature, and
the last 89°F.
3 Add the same amount of Hydrogen Peroxide to each cylinder
4 Measure the bubble data
Attribute Name Credit Annotation
Controlled
Variables 1
Step 1. ...same amount of potatoe juice
Step 3. ...same amount of hydrogen peroxide...
Manipulated
Variable 1
Three conditions:
Step 2. …34°F... room temperature...89°F.
Responding
Variable 1
Step 4: Measure the bubble data
Vague
Record
Measurements 0 None
Trials are
Repeated 0 Trials are not repeated
Extra Validity Measure 0 None
Logical Steps 0
General note 3b: Measuring a vague parameter (measure the bubble
data) may be credited as a manipulated or responding variable.
However, a vague parameter is difficult to repeatedly measure, so the
logical steps attribute cannot be credited.
Total Attributes 3 1 Score Points
Updates 2012 Biology EOC—Teacher
Updates for 2012, Biology EOC Page 42
Copyright © October 2011 All rights reserved. Educational institutions within the State of Washington have permission to reproduce this document. All other individuals wishing to reproduce this document must contact OSPI.
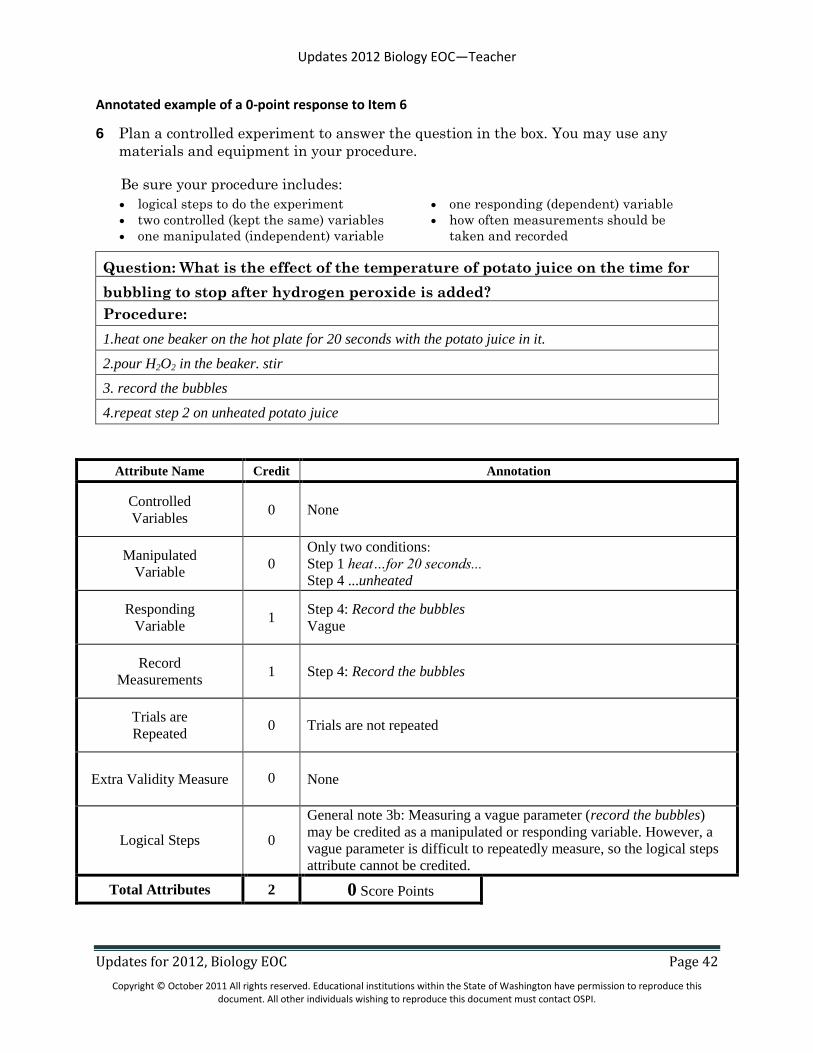
Annotated example of a 0-point response to Item 6
6 Plan a controlled experiment to answer the question in the box. You may use any
materials and equipment in your procedure.
Be sure your procedure includes:
logical steps to do the experiment
two controlled (kept the same) variables
one manipulated (independent) variable
one responding (dependent) variable
how often measurements should be
taken and recorded
Question: What is the effect of the temperature of potato juice on the time for
bubbling to stop after hydrogen peroxide is added?
Procedure:
1.heat one beaker on the hot plate for 20 seconds with the potato juice in it.
2.pour H2O2 in the beaker. stir
3. record the bubbles
4.repeat step 2 on unheated potato juice
Attribute Name Credit Annotation
Controlled
Variables 0 None
Manipulated
Variable 0
Only two conditions:
Step 1 heat…for 20 seconds...
Step 4 ...unheated
Responding
Variable 1
Step 4: Record the bubbles
Vague
Record
Measurements 1 Step 4: Record the bubbles
Trials are
Repeated 0 Trials are not repeated
Extra Validity Measure 0 None
Logical Steps 0
General note 3b: Measuring a vague parameter (record the bubbles)
may be credited as a manipulated or responding variable. However, a
vague parameter is difficult to repeatedly measure, so the logical steps
attribute cannot be credited.
Total Attributes 2 0 Score Points

Updates 2012 Biology EOC—Teacher
Updates for 2012, Biology EOC Page 43
Copyright © October 2011 All rights reserved. Educational institutions within the State of Washington have permission to reproduce this document. All other individuals wishing to reproduce this document must contact OSPI.
Green Machine Scenario
Answer Key Table
Title: Green Machine Grade: Biology EOC
Description: A systems scenario in the context of life science
Item Description
Item Specification Text
Item Specification Code
Systems
Inq
uiry
Ap
plicatio
n
Structu
res &
Fun
ction
s
Ecosystem
s
Bio
logical
Evolu
tion
An
swe
r
Co
gnitive Level
7 Describe the relationships among DNA, chromosomes, genes, amino acids, proteins, and/or traits.
LS1E (3)
A 1
8 Identify a question that scientists may investigate that is stimulated by the needs of society (e.g., medical research, global climate change).
APPA
(2) B 2
9
Describe cellular respiration as the process cells use to change the energy of glucose into energy in the form of ATP and/or the process that provides the energy source for most living organisms.
LS1B (1)
C 1
10 Predict the possible consequences of a change in a given complex system and/or describe why a simplified model may not be able to reliably predict those consequences.
SYSC (2)
SA 3
Updates 2012 Biology EOC—Teacher
Updates for 2012, Biology EOC Page 44
Copyright © October 2011 All rights reserved. Educational institutions within the State of Washington have permission to reproduce this document. All other individuals wishing to reproduce this document must contact OSPI.
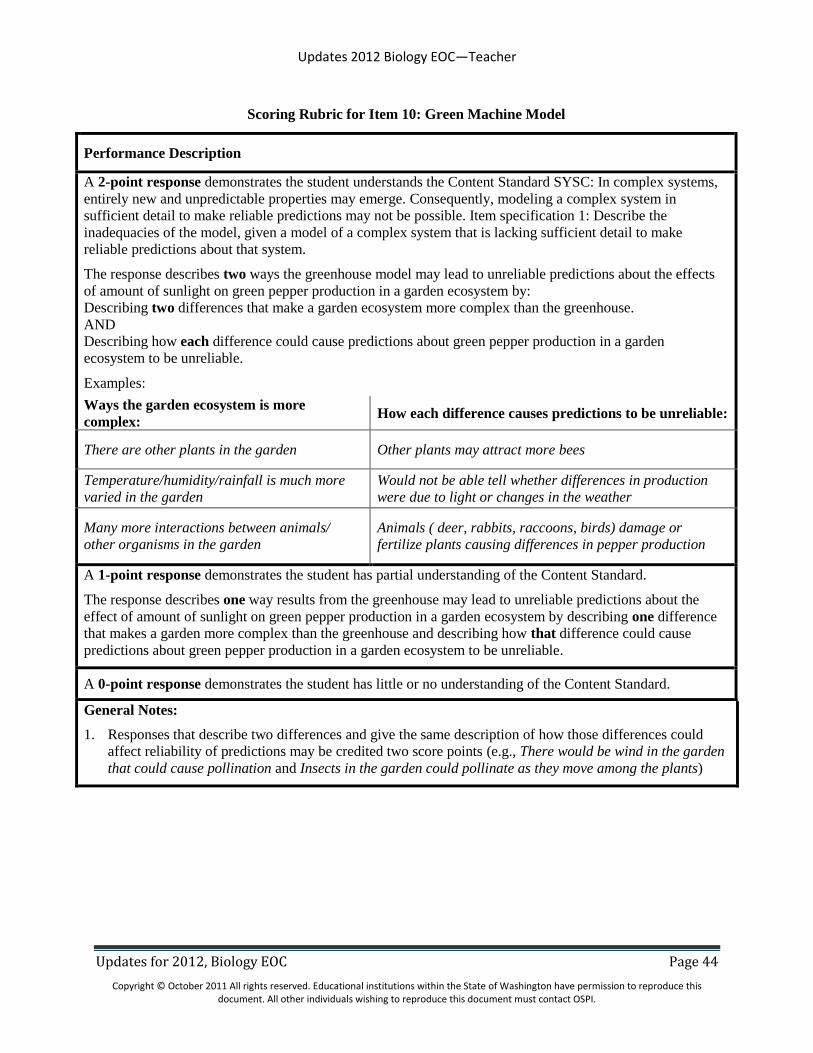
Scoring Rubric for Item 10: Green Machine Model
Performance Description
A 2-point response demonstrates the student understands the Content Standard SYSC: In complex systems,
entirely new and unpredictable properties may emerge. Consequently, modeling a complex system in
sufficient detail to make reliable predictions may not be possible. Item specification 1: Describe the
inadequacies of the model, given a model of a complex system that is lacking sufficient detail to make
reliable predictions about that system.
The response describes two ways the greenhouse model may lead to unreliable predictions about the effects
of amount of sunlight on green pepper production in a garden ecosystem by:
Describing two differences that make a garden ecosystem more complex than the greenhouse.
AND
Describing how each difference could cause predictions about green pepper production in a garden
ecosystem to be unreliable.
Examples:
Ways the garden ecosystem is more
complex: How each difference causes predictions to be unreliable:
There are other plants in the garden Other plants may attract more bees
Temperature/humidity/rainfall is much more
varied in the garden
Would not be able tell whether differences in production
were due to light or changes in the weather
Many more interactions between animals/
other organisms in the garden
Animals ( deer, rabbits, raccoons, birds) damage or
fertilize plants causing differences in pepper production
A 1-point response demonstrates the student has partial understanding of the Content Standard.
The response describes one way results from the greenhouse may lead to unreliable predictions about the
effect of amount of sunlight on green pepper production in a garden ecosystem by describing one difference
that makes a garden more complex than the greenhouse and describing how that difference could cause
predictions about green pepper production in a garden ecosystem to be unreliable.
A 0-point response demonstrates the student has little or no understanding of the Content Standard.
General Notes:
1. Responses that describe two differences and give the same description of how those differences could
affect reliability of predictions may be credited two score points (e.g., There would be wind in the garden
that could cause pollination and Insects in the garden could pollinate as they move among the plants)
Updates 2012 Biology EOC—Teacher
Updates for 2012, Biology EOC Page 45
Copyright © October 2011 All rights reserved. Educational institutions within the State of Washington have permission to reproduce this document. All other individuals wishing to reproduce this document must contact OSPI.
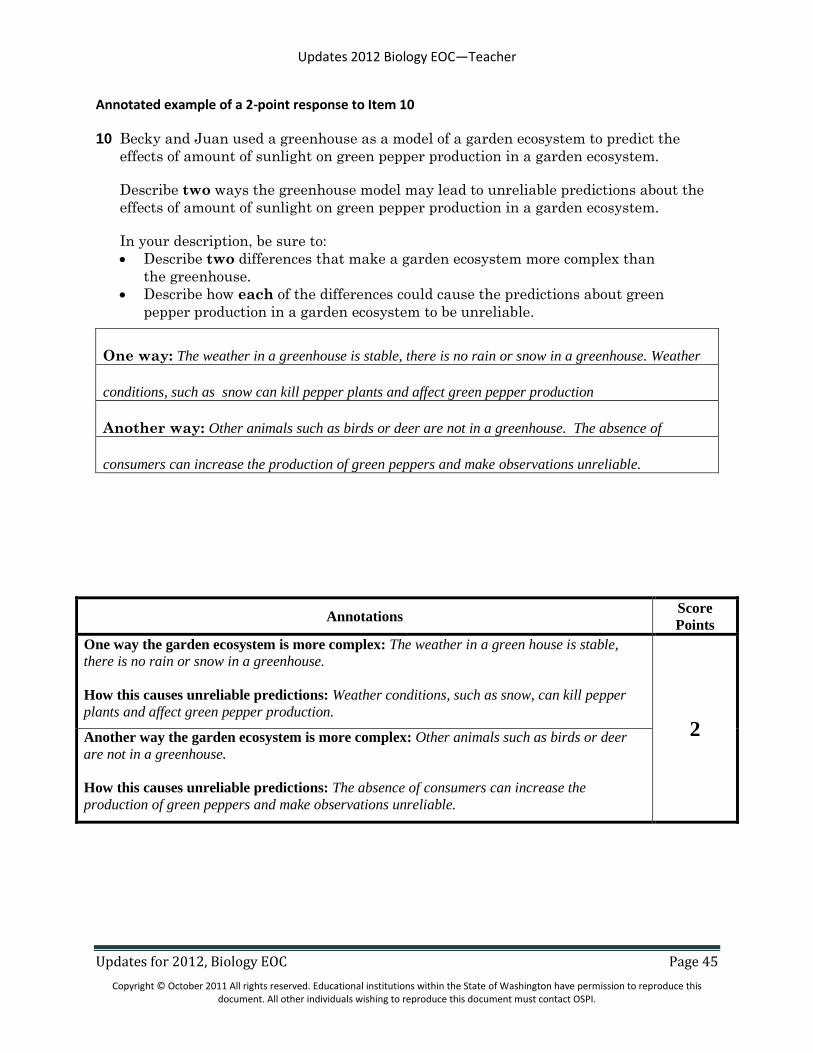
Annotated example of a 2-point response to Item 10
10 Becky and Juan used a greenhouse as a model of a garden ecosystem to predict the
effects of amount of sunlight on green pepper production in a garden ecosystem.
Describe two ways the greenhouse model may lead to unreliable predictions about the
effects of amount of sunlight on green pepper production in a garden ecosystem.
In your description, be sure to:
Describe two differences that make a garden ecosystem more complex than
the greenhouse.
Describe how each of the differences could cause the predictions about green
pepper production in a garden ecosystem to be unreliable.
One way: The weather in a greenhouse is stable, there is no rain or snow in a greenhouse. Weather
conditions, such as snow can kill pepper plants and affect green pepper production
Another way: Other animals such as birds or deer are not in a greenhouse. The absence of
consumers can increase the production of green peppers and make observations unreliable.
Annotations Score
Points
One way the garden ecosystem is more complex: The weather in a green house is stable,
there is no rain or snow in a greenhouse.
How this causes unreliable predictions: Weather conditions, such as snow, can kill pepper
plants and affect green pepper production.
2 Another way the garden ecosystem is more complex: Other animals such as birds or deer
are not in a greenhouse.
How this causes unreliable predictions: The absence of consumers can increase the
production of green peppers and make observations unreliable.

Updates 2012 Biology EOC—Teacher
Updates for 2012, Biology EOC Page 46
Copyright © October 2011 All rights reserved. Educational institutions within the State of Washington have permission to reproduce this document. All other individuals wishing to reproduce this document must contact OSPI.
Annotated example of a 1-point response to Item 10
10 Becky and Juan used a greenhouse as a model of a garden ecosystem to predict the
effects of amount of sunlight on green pepper production in a garden ecosystem.
Describe two ways the greenhouse model may lead to unreliable predictions about the
effects of amount of sunlight on green pepper production in a garden ecosystem.
In your description, be sure to:
Describe two differences that make a garden ecosystem more complex than
the greenhouse.
Describe how each of the differences could cause the predictions about green
pepper production in a garden ecosystem to be unreliable.
One way: A greenhouse tends to be warmer than a garden so they could predict a certain weather
type that might be different than were they live
Another way: In the greenhouse the pepper plants grow all they want and they don’t have to worry
about consumers so there might be more in the greenhouse than in the actual garden
Annotations Score
Points
One way the garden ecosystem is more complex: A greenhouse tends to be warmer...
How this causes unreliable predictions: None
1 Another way the garden ecosystem is more complex: In the greenhouse...don’t have to
worry about consumers....
How this causes unreliable predictions: ...might be more (peppers) in the greenhouse...
Updates 2012 Biology EOC—Teacher
Updates for 2012, Biology EOC Page 47
Copyright © October 2011 All rights reserved. Educational institutions within the State of Washington have permission to reproduce this document. All other individuals wishing to reproduce this document must contact OSPI.
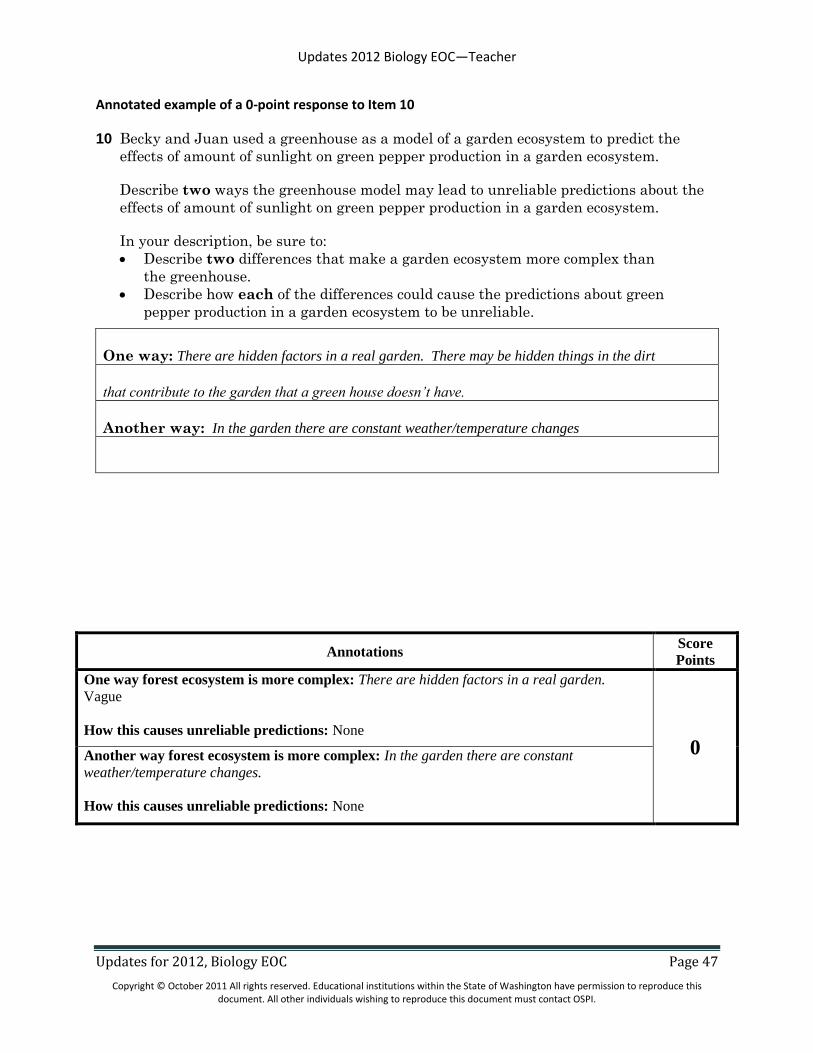
Annotated example of a 0-point response to Item 10
10 Becky and Juan used a greenhouse as a model of a garden ecosystem to predict the
effects of amount of sunlight on green pepper production in a garden ecosystem.
Describe two ways the greenhouse model may lead to unreliable predictions about the
effects of amount of sunlight on green pepper production in a garden ecosystem.
In your description, be sure to:
Describe two differences that make a garden ecosystem more complex than
the greenhouse.
Describe how each of the differences could cause the predictions about green
pepper production in a garden ecosystem to be unreliable.
One way: There are hidden factors in a real garden. There may be hidden things in the dirt
that contribute to the garden that a green house doesn’t have.
Another way: In the garden there are constant weather/temperature changes
Annotations Score
Points
One way forest ecosystem is more complex: There are hidden factors in a real garden.
Vague
How this causes unreliable predictions: None
0 Another way forest ecosystem is more complex: In the garden there are constant
weather/temperature changes.
How this causes unreliable predictions: None
Updates 2012 Biology EOC—Teacher
Updates for 2012, Biology EOC Page 48
Copyright © October 2011 All rights reserved. Educational institutions within the State of Washington have permission to reproduce this document. All other individuals wishing to reproduce this document must contact OSPI.
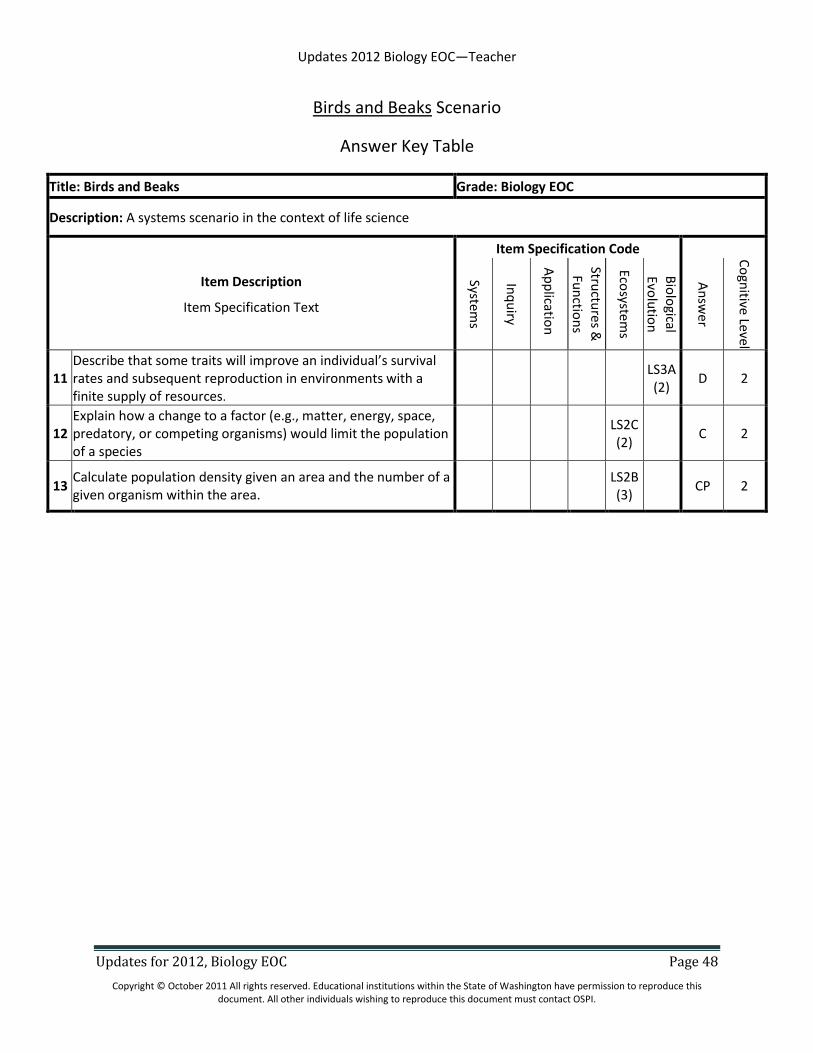
Birds and Beaks Scenario
Answer Key Table
Title: Birds and Beaks Grade: Biology EOC
Description: A systems scenario in the context of life science
Item Description
Item Specification Text
Item Specification Code
Systems
Inq
uiry
Ap
plicatio
n
Structu
res &
Fun
ction
s
Ecosystem
s
Bio
logical
Evolu
tion
An
swe
r
Co
gnitive Level
11 Describe that some traits will improve an individual’s survival rates and subsequent reproduction in environments with a finite supply of resources.
LS3A (2)
D 2
12 Explain how a change to a factor (e.g., matter, energy, space, predatory, or competing organisms) would limit the population of a species
LS2C (2)
C 2
13 Calculate population density given an area and the number of a given organism within the area.
LS2B (3)
CP 2

Updates 2012 Biology EOC—Teacher
Updates for 2012, Biology EOC Page 49
Copyright © October 2011 All rights reserved. Educational institutions within the State of Washington have permission to reproduce this document. All other individuals wishing to reproduce this document must contact OSPI.
Scoring Rubric for Item 13: Birds & Beaks Population Density
Performance Description
A 1-point response demonstrates the student understands the Content Standard LS2B: Living organisms have
the capacity to produce very large populations. Population density is the number of individuals of a particular
population living in a given amount of space. Item specification 3: Calculate population density given an area
and the number of a given organism within the area.
The response describes the population density of finches on Daphne Major by stating one of the following:
9
Nine
720/80
A 0-point response demonstrates the student has little or no understanding of the Content Standard.
General Notes:
1. None
Updates 2012 Biology EOC—Teacher
Updates for 2012, Biology EOC Page 50
Copyright © October 2011 All rights reserved. Educational institutions within the State of Washington have permission to reproduce this document. All other individuals wishing to reproduce this document must contact OSPI.
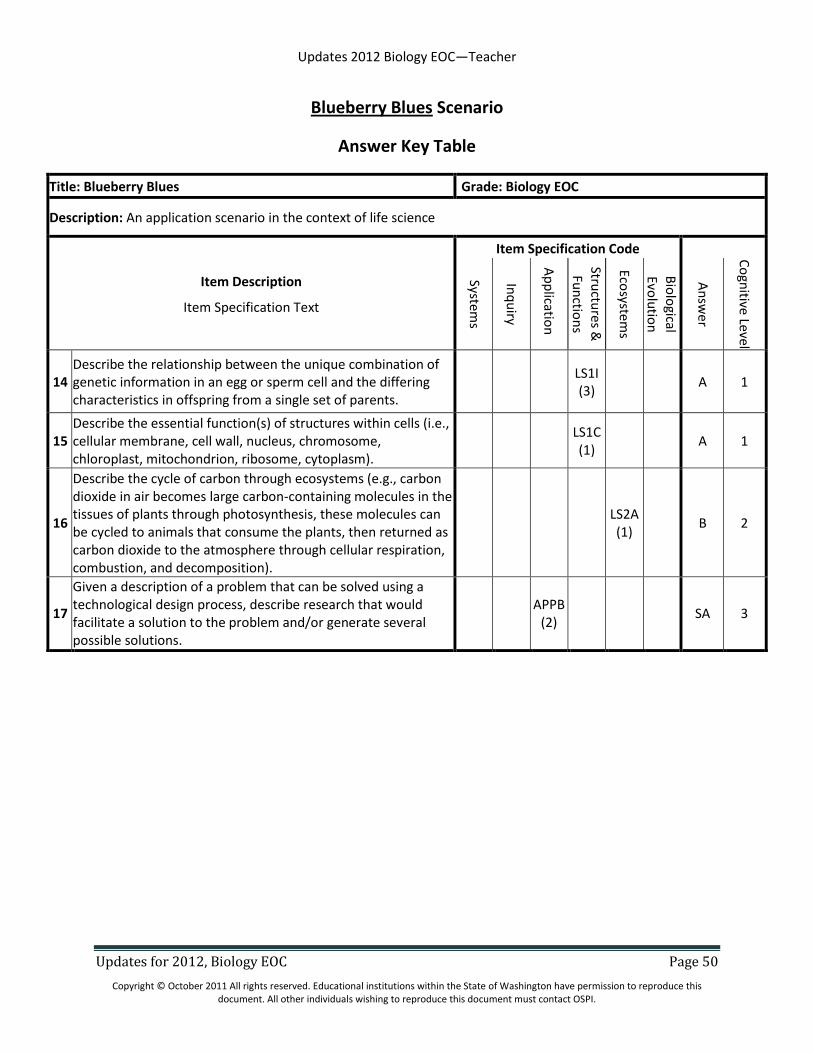
Blueberry Blues Scenario
Answer Key Table
Title: Blueberry Blues Grade: Biology EOC
Description: An application scenario in the context of life science
Item Description
Item Specification Text
Item Specification Code
Systems
Inq
uiry
Ap
plicatio
n
Structu
res &
Fun
ction
s
Ecosystem
s
Bio
logical
Evolu
tion
An
swe
r
Co
gnitive Level
14 Describe the relationship between the unique combination of genetic information in an egg or sperm cell and the differing characteristics in offspring from a single set of parents.
LS1I (3)
A 1
15 Describe the essential function(s) of structures within cells (i.e., cellular membrane, cell wall, nucleus, chromosome, chloroplast, mitochondrion, ribosome, cytoplasm).
LS1C (1)
A 1
16
Describe the cycle of carbon through ecosystems (e.g., carbon dioxide in air becomes large carbon-containing molecules in the tissues of plants through photosynthesis, these molecules can be cycled to animals that consume the plants, then returned as carbon dioxide to the atmosphere through cellular respiration, combustion, and decomposition).
LS2A (1)
B 2
17
Given a description of a problem that can be solved using a technological design process, describe research that would facilitate a solution to the problem and/or generate several possible solutions.
APPB
(2) SA 3
Updates 2012 Biology EOC—Teacher
Updates for 2012, Biology EOC Page 51
Copyright © October 2011 All rights reserved. Educational institutions within the State of Washington have permission to reproduce this document. All other individuals wishing to reproduce this document must contact OSPI.
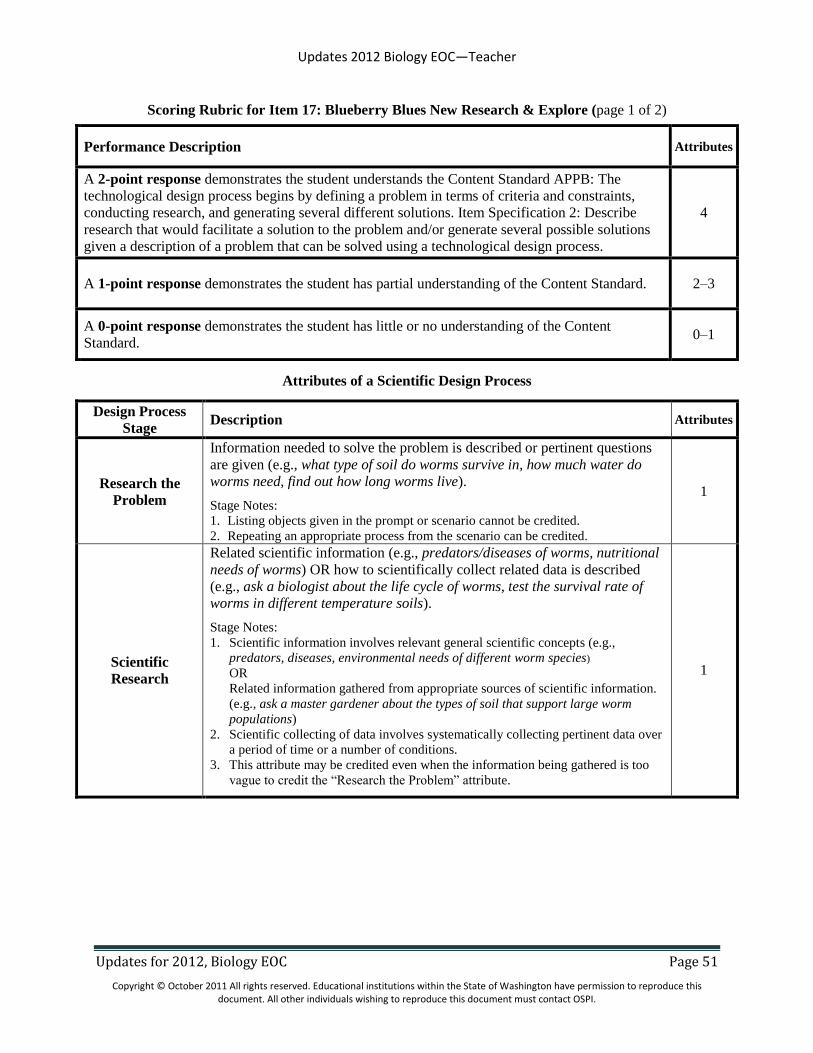
Scoring Rubric for Item 17: Blueberry Blues New Research & Explore (page 1 of 2)
Performance Description Attributes
A 2-point response demonstrates the student understands the Content Standard APPB: The
technological design process begins by defining a problem in terms of criteria and constraints,
conducting research, and generating several different solutions. Item Specification 2: Describe
research that would facilitate a solution to the problem and/or generate several possible solutions
given a description of a problem that can be solved using a technological design process.
4
A 1-point response demonstrates the student has partial understanding of the Content Standard. 2–3
A 0-point response demonstrates the student has little or no understanding of the Content
Standard. 0–1
Attributes of a Scientific Design Process
Design Process
Stage Description Attributes
Research the
Problem
Information needed to solve the problem is described or pertinent questions
are given (e.g., what type of soil do worms survive in, how much water do
worms need, find out how long worms live).
Stage Notes:
1. Listing objects given in the prompt or scenario cannot be credited.
2. Repeating an appropriate process from the scenario can be credited.
1
Scientific
Research
Related scientific information (e.g., predators/diseases of worms, nutritional
needs of worms) OR how to scientifically collect related data is described
(e.g., ask a biologist about the life cycle of worms, test the survival rate of
worms in different temperature soils).
Stage Notes:
1. Scientific information involves relevant general scientific concepts (e.g.,
predators, diseases, environmental needs of different worm species)
OR
Related information gathered from appropriate sources of scientific information.
(e.g., ask a master gardener about the types of soil that support large worm
populations)
2. Scientific collecting of data involves systematically collecting pertinent data over
a period of time or a number of conditions.
3. This attribute may be credited even when the information being gathered is too
vague to credit the “Research the Problem” attribute.
1
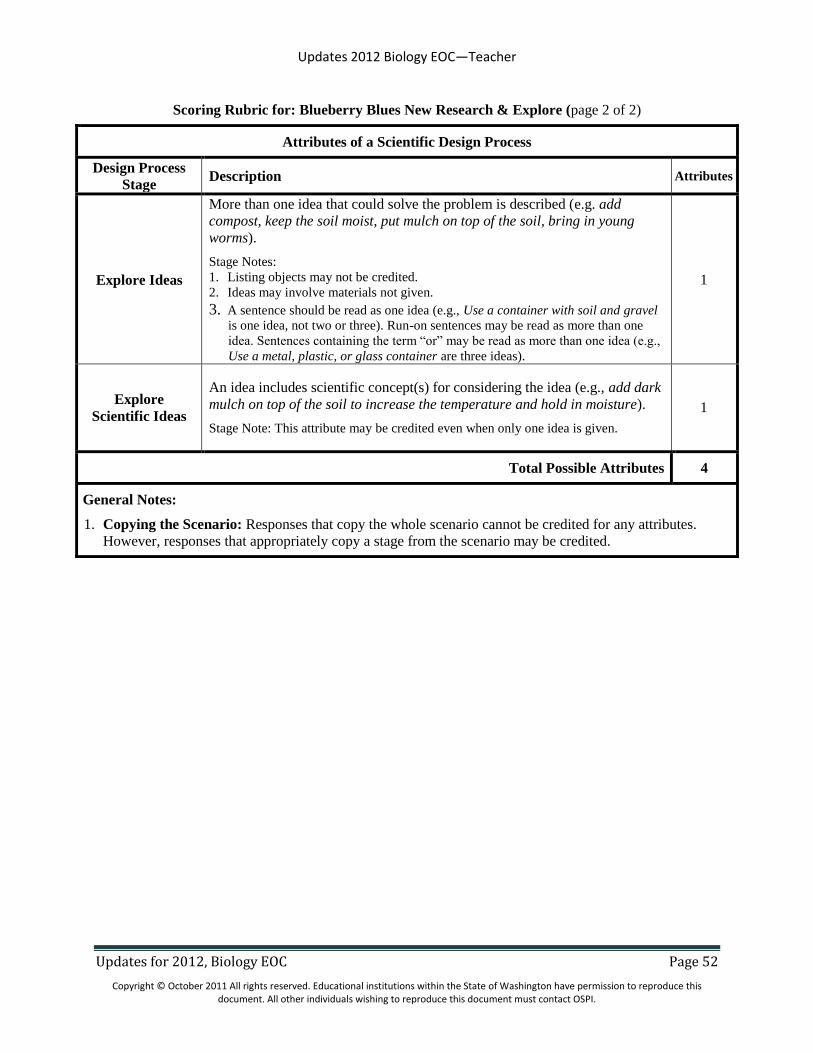
Updates 2012 Biology EOC—Teacher
Updates for 2012, Biology EOC Page 52
Copyright © October 2011 All rights reserved. Educational institutions within the State of Washington have permission to reproduce this document. All other individuals wishing to reproduce this document must contact OSPI.
Scoring Rubric for: Blueberry Blues New Research & Explore (page 2 of 2)
Attributes of a Scientific Design Process
Design Process
Stage Description Attributes
Explore Ideas
More than one idea that could solve the problem is described (e.g. add
compost, keep the soil moist, put mulch on top of the soil, bring in young
worms).
Stage Notes:
1. Listing objects may not be credited.
2. Ideas may involve materials not given.
3. A sentence should be read as one idea (e.g., Use a container with soil and gravel
is one idea, not two or three). Run-on sentences may be read as more than one
idea. Sentences containing the term “or” may be read as more than one idea (e.g.,
Use a metal, plastic, or glass container are three ideas).
1
Explore
Scientific Ideas
An idea includes scientific concept(s) for considering the idea (e.g., add dark
mulch on top of the soil to increase the temperature and hold in moisture).
Stage Note: This attribute may be credited even when only one idea is given.
1
Total Possible Attributes 4
General Notes:
1. Copying the Scenario: Responses that copy the whole scenario cannot be credited for any attributes.
However, responses that appropriately copy a stage from the scenario may be credited.

Updates 2012 Biology EOC—Teacher
Updates for 2012, Biology EOC Page 53
Copyright © October 2011 All rights reserved. Educational institutions within the State of Washington have permission to reproduce this document. All other individuals wishing to reproduce this document must contact OSPI.
Annotated example of a 2-point response to Item 17
17 Jose and Tasha want to improve the soil in the garden by increasing the population of
worms in the soil. Describe how to begin solving this problem.
Be sure to describe the following stages in your design process:
Research the Problem: Describe any scientific information needed to solve the
problem and how to collect that information.
Explore Ideas: Describe several possible solutions to the problem, including any
useful scientific concepts.
Problem: Increase the population of worms in the soil
Research the Problem:
What kind of worms are in the soil? Collect worms and ask science teacher what nutrients they need.
What is the best temperature? How much water is good for worms? Google worm environment
Explore Ideas:
Cover with black plastic to increase temperature. Count worms before and after putting down plastic
Add compost to the soil as food for worms
Attribute Name Credit Annotations
Research the
Problem 1
What kind of worms are in the soil? What is the best temperature?
How much water is good for worms
Scientific
Research 1 ... ask science teacher what nutrients they (worms) need
Explore Ideas 1 Cover with black plastic ...
Add compost to the soil as food for worms
Explore Scientific
Ideas 1 Cover with black plastic to increase temperature.
Total Attributes 4 2 Score Points
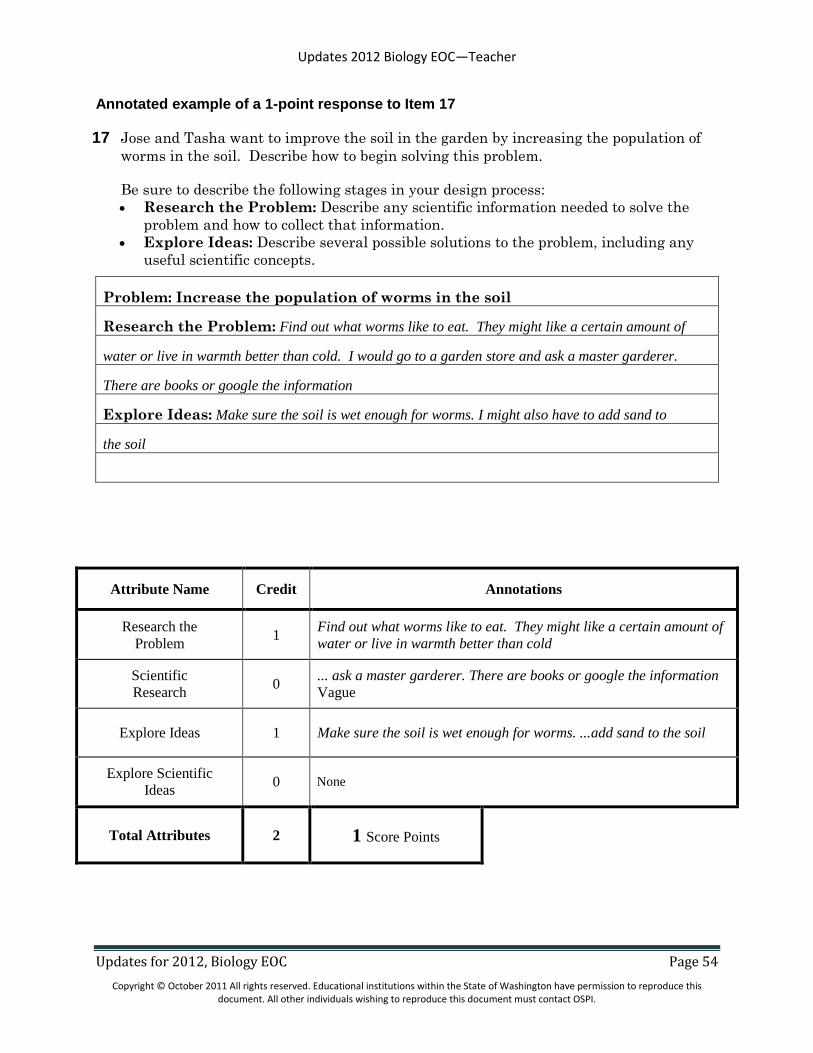
Updates 2012 Biology EOC—Teacher
Updates for 2012, Biology EOC Page 54
Copyright © October 2011 All rights reserved. Educational institutions within the State of Washington have permission to reproduce this document. All other individuals wishing to reproduce this document must contact OSPI.
Annotated example of a 1-point response to Item 17
17 Jose and Tasha want to improve the soil in the garden by increasing the population of
worms in the soil. Describe how to begin solving this problem.
Be sure to describe the following stages in your design process:
Research the Problem: Describe any scientific information needed to solve the
problem and how to collect that information.
Explore Ideas: Describe several possible solutions to the problem, including any
useful scientific concepts.
Problem: Increase the population of worms in the soil
Research the Problem: Find out what worms like to eat. They might like a certain amount of
water or live in warmth better than cold. I would go to a garden store and ask a master garderer.
There are books or google the information
Explore Ideas: Make sure the soil is wet enough for worms. I might also have to add sand to
the soil
Attribute Name Credit Annotations
Research the
Problem 1
Find out what worms like to eat. They might like a certain amount of
water or live in warmth better than cold
Scientific
Research 0
... ask a master garderer. There are books or google the information
Vague
Explore Ideas 1 Make sure the soil is wet enough for worms. ...add sand to the soil
Explore Scientific
Ideas 0 None
Total Attributes 2 1 Score Points
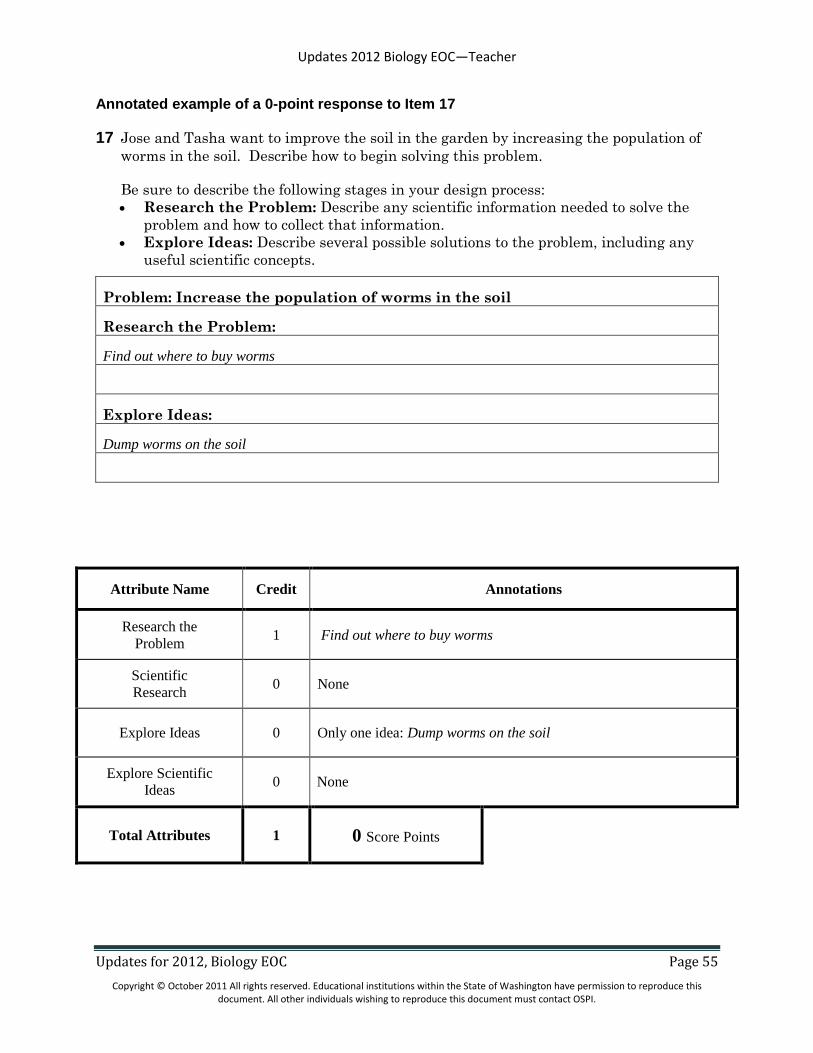
Updates 2012 Biology EOC—Teacher
Updates for 2012, Biology EOC Page 55
Copyright © October 2011 All rights reserved. Educational institutions within the State of Washington have permission to reproduce this document. All other individuals wishing to reproduce this document must contact OSPI.
Annotated example of a 0-point response to Item 17
17 Jose and Tasha want to improve the soil in the garden by increasing the population of
worms in the soil. Describe how to begin solving this problem.
Be sure to describe the following stages in your design process:
Research the Problem: Describe any scientific information needed to solve the
problem and how to collect that information.
Explore Ideas: Describe several possible solutions to the problem, including any
useful scientific concepts.
Problem: Increase the population of worms in the soil
Research the Problem:
Find out where to buy worms
Explore Ideas:
Dump worms on the soil
Attribute Name Credit Annotations
Research the
Problem 1 Find out where to buy worms
Scientific
Research 0 None
Explore Ideas 0 Only one idea: Dump worms on the soil
Explore Scientific
Ideas 0 None
Total Attributes 1 0 Score Points

Updates 2012 Biology EOC—Teacher
Updates for 2012, Biology EOC Page 56
Copyright © October 2011 All rights reserved. Educational institutions within the State of Washington have permission to reproduce this document. All other individuals wishing to reproduce this document must contact OSPI.
Get involved and keep informed:
SALT (Science Assessment Leadership Team)
Science educators in Washington are invited to participate on the Science Assessment Leadership Team
to provide content and grade-level expertise throughout the process of developing state tests. To get
more information and to join the team, please fill out the application located on our website:
http://www.k12.wa.us/Science/ProfDevelopment.aspx
PEPPER (PreSALTers Enthusiastically Providing Powerful Educational Resources)
Washington educators who want to receive periodic science assessment information and updates, and
notifications about meeting and workshop opportunities are invited to join the PEPPERs email
distribution list. To join, please send a request to [email protected].
Resources/Contact Information
Science Assessment Webpage:
http://www.k12.wa.us/science/
OSPI Moodle Server:
http://moodle.ospi.k12.wa.us/
Contact Information:
Elementary
Kara Monroe
OSPI Science Assessment Specialist
(360) 725-4979
Secondary
Linda Smith
OSPI Science Assessment Specialist
(360) 725-4989