Embed Size (px)
Citation preview
© RI 2016 Preliminary Examination 9648/01 [Turn over
Year 6 Preliminary Examination Higher 2
BIOLOGY 9648/01
Paper 1 Multiple Choice 27th September 2016
1 hour 15 min
Additional Materials: Multiple Choice Answer Sheet
READ THESE INSTRUCTIONS FIRST
Write in soft pencil. Do not use staples, paper clips, highlighters, glue or correction fluid. Write your name and shade your Index Number on the Answer Sheet in the spaces provided unless this has been done for you.
There are forty questions in this paper. Answer all questions. For each question there are four possible answers A, B, C, and D.
Choose the one you consider correct and record your choice in soft pencil on the separate Answer Sheet.
Read the instructions on the Answer Sheet very carefully.
Each correct answer will score one mark. A mark will not be deducted for a wrong answer. Any rough working should be done in this booklet. The use of an approved scientific calculator is expected, where appropriate.
(Erase all mistakes completely. Do not bend or fold the OMR Answer Sheet).
This document consists of 29 printed pages.
RI P1 1270
2
© RI 2016 Preliminary Examination 9648/01
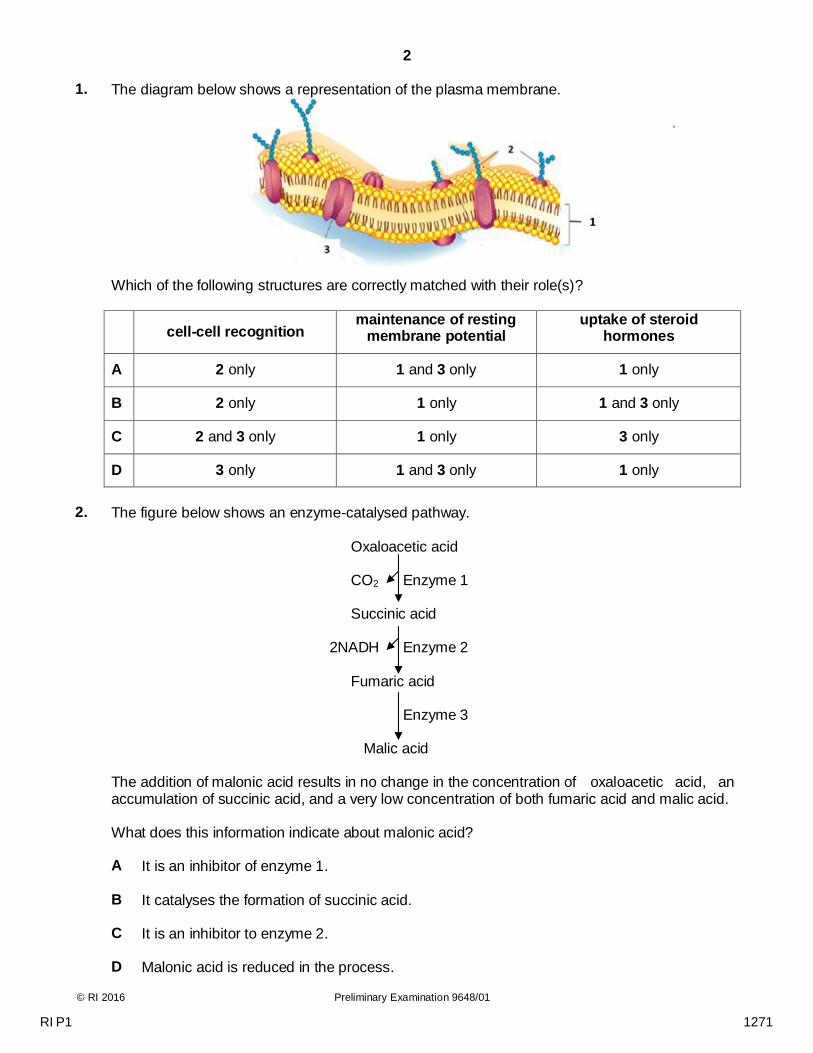
1. The diagram below shows a representation of the plasma membrane.
Which of the following structures are correctly matched with their role(s)?
cell-cell recognition maintenance of resting
membrane potential uptake of steroid
hormones
A 2 only 1 and 3 only 1 only
B 2 only 1 only 1 and 3 only
C 2 and 3 only 1 only 3 only
D 3 only 1 and 3 only 1 only
2. The figure below shows an enzyme-catalysed pathway.
Oxaloacetic acid
CO2 Enzyme 1
Succinic acid
2NADH Enzyme 2
Fumaric acid
Enzyme 3
Malic acid
The addition of malonic acid results in no change in the concentration of oxaloacetic acid, an accumulation of succinic acid, and a very low concentration of both fumaric acid and malic acid.
What does this information indicate about malonic acid?
A It is an inhibitor of enzyme 1.
B It catalyses the formation of succinic acid.
C It is an inhibitor to enzyme 2.
D Malonic acid is reduced in the process.
RI P1 1271
3
© RI 2016 Preliminary Examination 9648/01 [Turn over
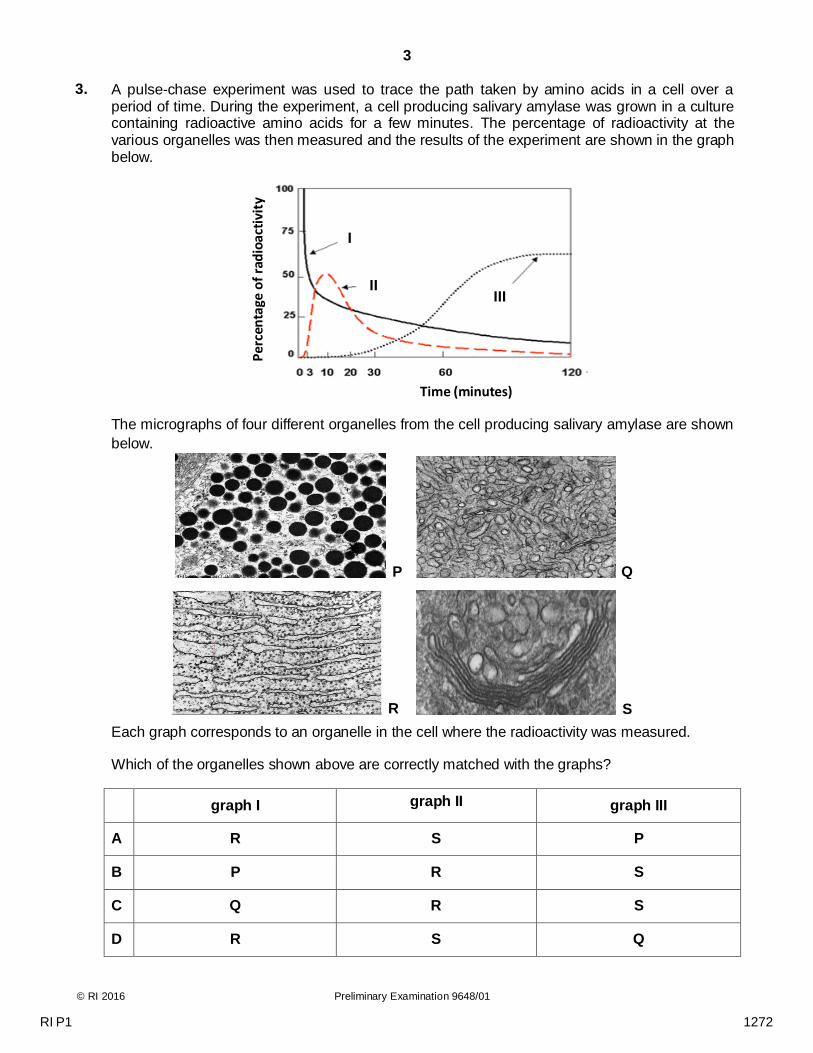
3. A pulse-chase experiment was used to trace the path taken by amino acids in a cell over aperiod of time. During the experiment, a cell producing salivary amylase was grown in a culturecontaining radioactive amino acids for a few minutes. The percentage of radioactivity at thevarious organelles was then measured and the results of the experiment are shown in the graphbelow.
The micrographs of four different organelles from the cell producing salivary amylase are shown
below.
Each graph corresponds to an organelle in the cell where the radioactivity was measured.
Which of the organelles shown above are correctly matched with the graphs?
graph I graph II graph III
A R S P
B P R S
C Q R S
D R S Q
S
Q
R
P
Per
cen
tage
of
rad
ioac
tivi
ty
I
II III
Time (minutes)
RI P1 1272
4
© RI 2016 Preliminary Examination 9648/01
4.
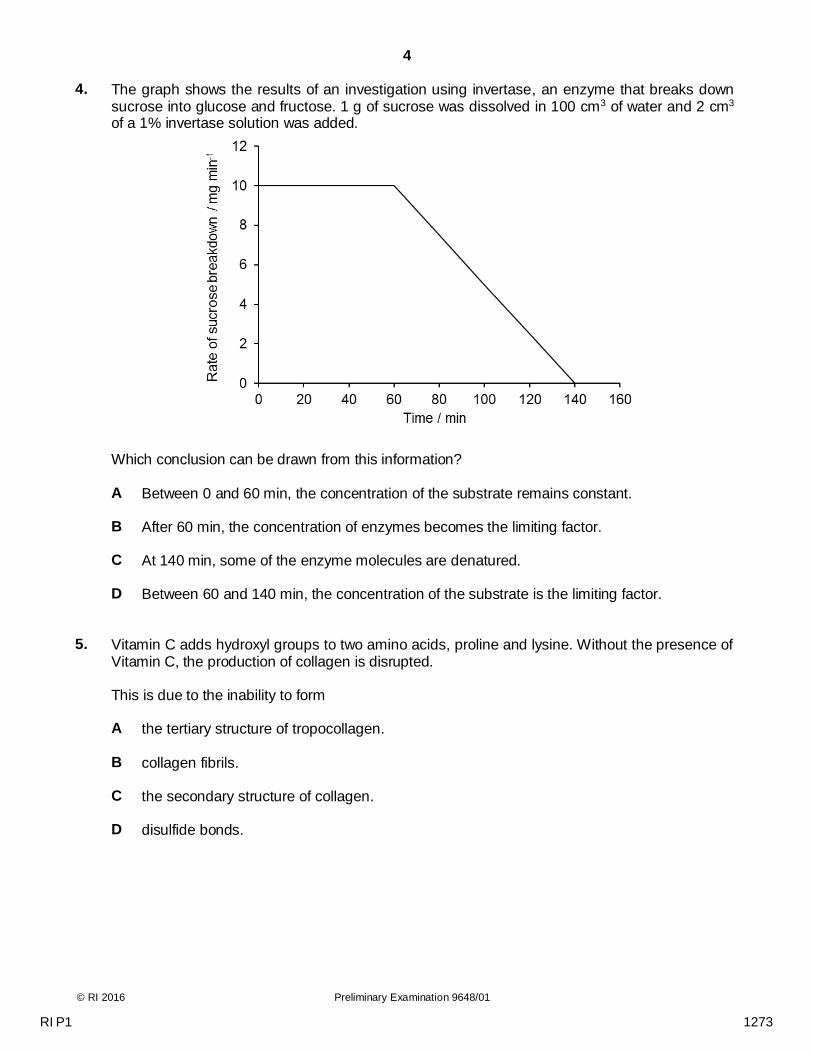
The graph shows the results of an investigation using invertase, an enzyme that breaks down sucrose into glucose and fructose. 1 g of sucrose was dissolved in 100 cm3 of water and 2 cm3 of a 1% invertase solution was added.
Which conclusion can be drawn from this information?
A Between 0 and 60 min, the concentration of the substrate remains constant.
B After 60 min, the concentration of enzymes becomes the limiting factor.
C At 140 min, some of the enzyme molecules are denatured.
D Between 60 and 140 min, the concentration of the substrate is the limiting factor. 5.
Vitamin C adds hydroxyl groups to two amino acids, proline and lysine. Without the presence of Vitamin C, the production of collagen is disrupted. This is due to the inability to form
A the tertiary structure of tropocollagen.
B collagen fibrils.
C the secondary structure of collagen.
D disulfide bonds.
RI P1 1273
5
© RI 2016 Preliminary Examination 9648/01 [Turn over
6.
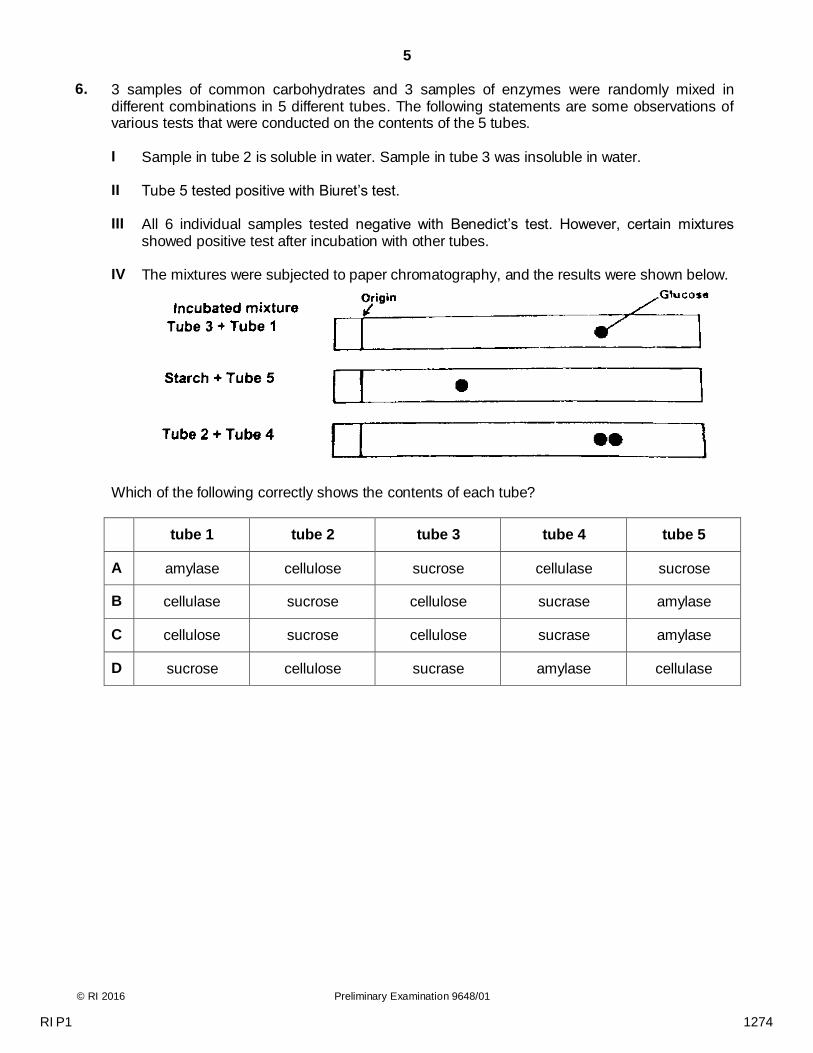
3 samples of common carbohydrates and 3 samples of enzymes were randomly mixed in different combinations in 5 different tubes. The following statements are some observations of various tests that were conducted on the contents of the 5 tubes.
I Sample in tube 2 is soluble in water. Sample in tube 3 was insoluble in water.
II Tube 5 tested positive with Biuret’s test.
III All 6 individual samples tested negative with Benedict’s test. However, certain mixtures showed positive test after incubation with other tubes.
IV The mixtures were subjected to paper chromatography, and the results were shown below.
Which of the following correctly shows the contents of each tube?
tube 1 tube 2 tube 3 tube 4 tube 5
A amylase cellulose sucrose cellulase sucrose
B cellulase sucrose cellulose sucrase amylase
C cellulose sucrose cellulose sucrase amylase
D sucrose cellulose sucrase amylase cellulase
RI P1 1274
6
© RI 2016 Preliminary Examination 9648/01
7.
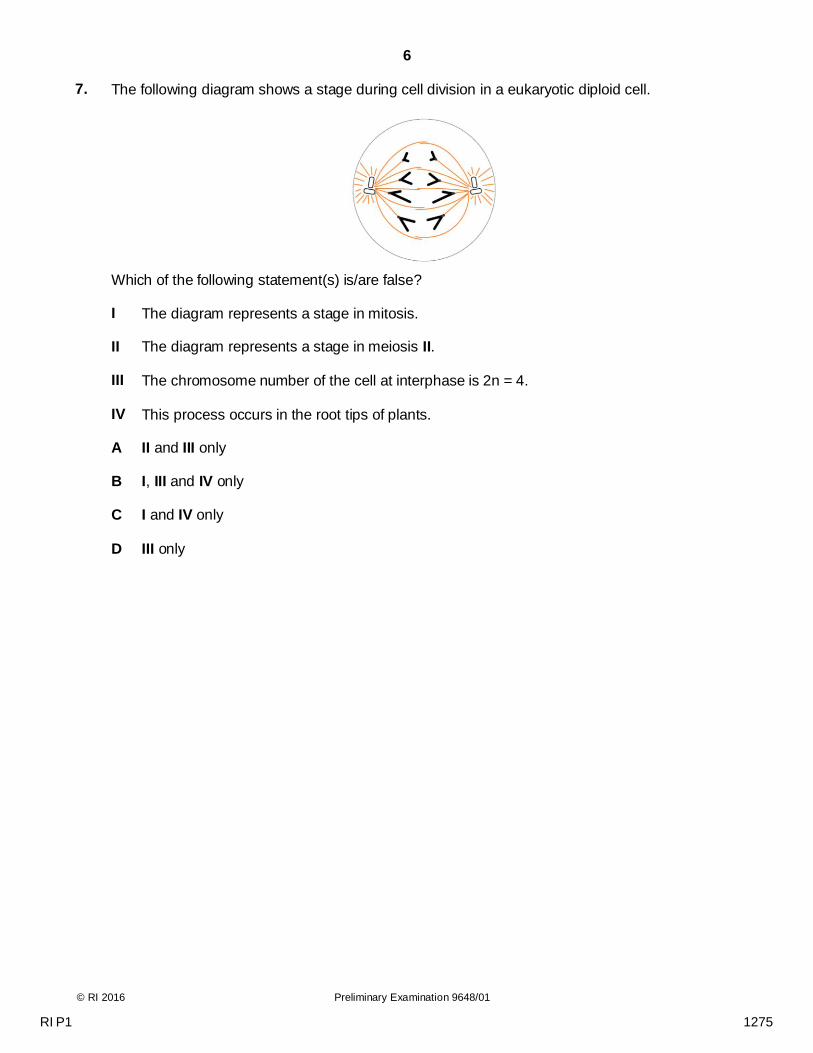
The following diagram shows a stage during cell division in a eukaryotic diploid cell.
Which of the following statement(s) is/are false? I The diagram represents a stage in mitosis.
II The diagram represents a stage in meiosis II.
III The chromosome number of the cell at interphase is 2n = 4.
IV This process occurs in the root tips of plants. A II and III only
B I, III and IV only
C I and IV only
D III only
RI P1 1275
7
© RI 2016 Preliminary Examination 9648/01 [Turn over
8.
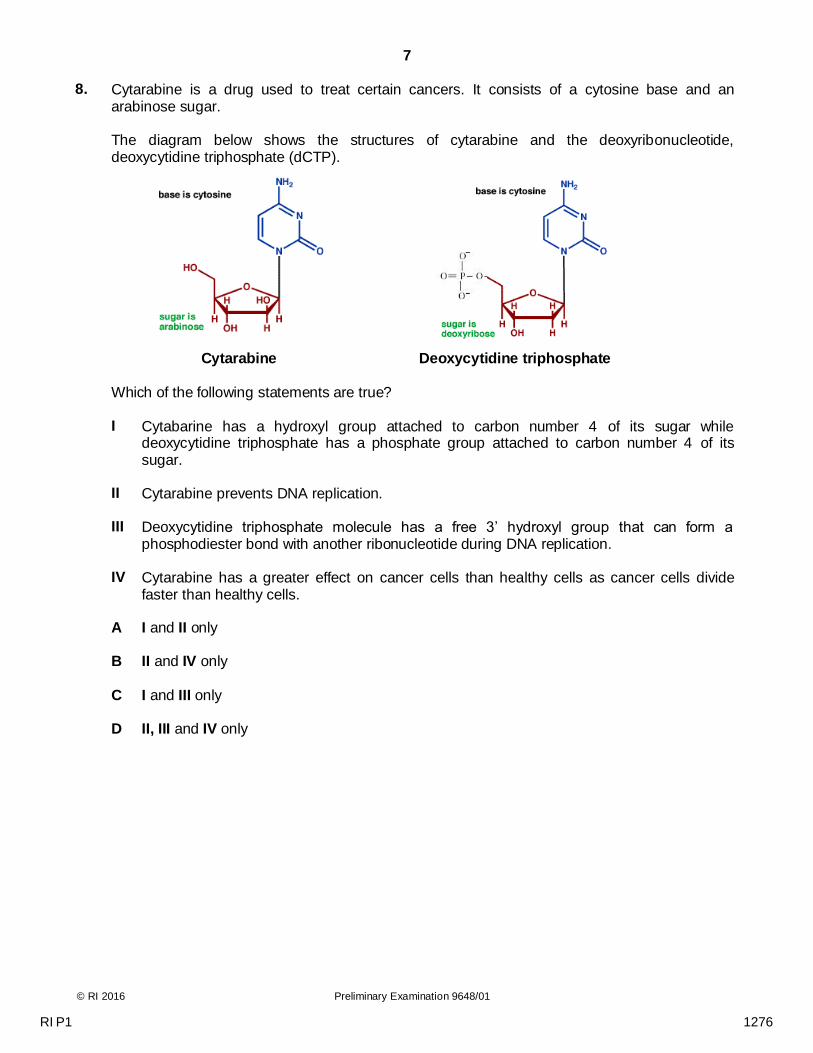
Cytarabine is a drug used to treat certain cancers. It consists of a cytosine base and an arabinose sugar. The diagram below shows the structures of cytarabine and the deoxyribonucleotide, deoxycytidine triphosphate (dCTP). Cytarabine Deoxycytidine triphosphate
Which of the following statements are true? I Cytabarine has a hydroxyl group attached to carbon number 4 of its sugar while
deoxycytidine triphosphate has a phosphate group attached to carbon number 4 of its sugar.
II Cytarabine prevents DNA replication.
III Deoxycytidine triphosphate molecule has a free 3’ hydroxyl group that can form a phosphodiester bond with another ribonucleotide during DNA replication.
IV Cytarabine has a greater effect on cancer cells than healthy cells as cancer cells divide faster than healthy cells.
A I and II only
B II and IV only
C I and III only
D II, III and IV only
RI P1 1276
8
© RI 2016 Preliminary Examination 9648/01
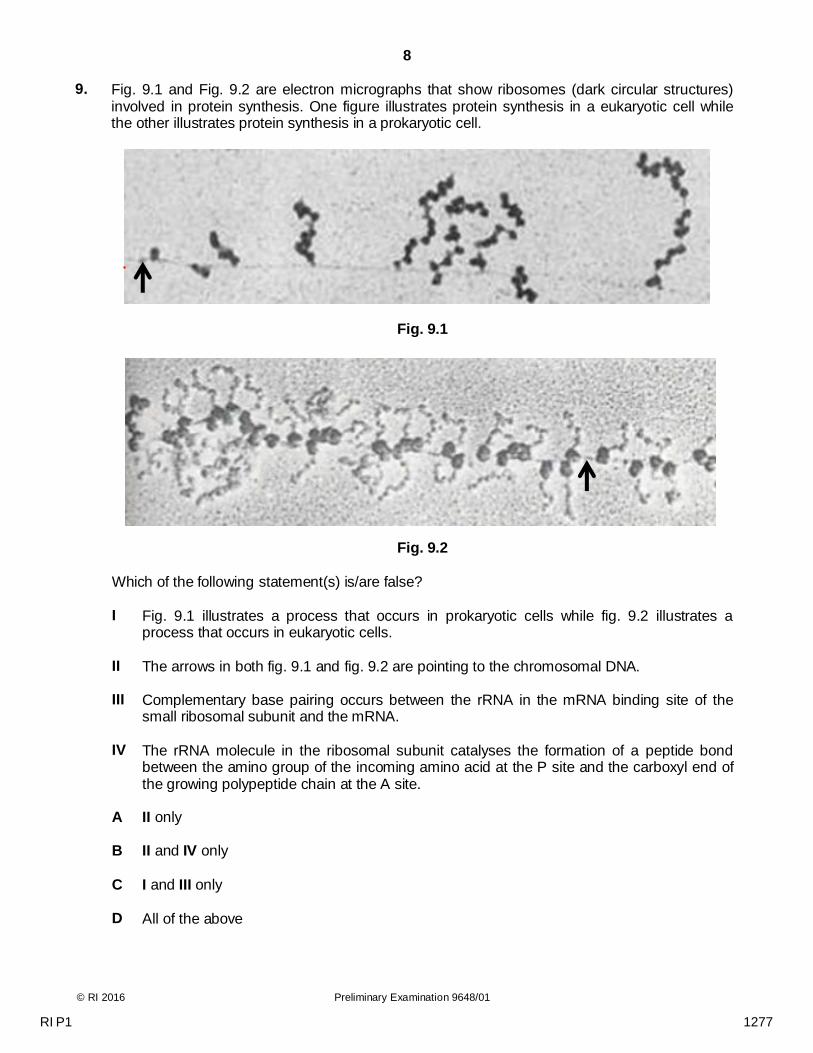
9.
Fig. 9.1 and Fig. 9.2 are electron micrographs that show ribosomes (dark circular structures) involved in protein synthesis. One figure illustrates protein synthesis in a eukaryotic cell while the other illustrates protein synthesis in a prokaryotic cell.
Fig. 9.1
Fig. 9.2
Which of the following statement(s) is/are false? I Fig. 9.1 illustrates a process that occurs in prokaryotic cells while fig. 9.2 illustrates a
process that occurs in eukaryotic cells.
II The arrows in both fig. 9.1 and fig. 9.2 are pointing to the chromosomal DNA.
III Complementary base pairing occurs between the rRNA in the mRNA binding site of the small ribosomal subunit and the mRNA.
IV The rRNA molecule in the ribosomal subunit catalyses the formation of a peptide bond between the amino group of the incoming amino acid at the P site and the carboxyl end of the growing polypeptide chain at the A site.
A II only
B II and IV only
C I and III only
D All of the above
RI P1 1277
9
© RI 2016 Preliminary Examination 9648/01 [Turn over
10.
Sickle cell anaemia is caused by a mutation in the gene that codes for the β-globin polypeptide
of haemoglobin. The sequence of bases below is a small section of the template strand of DNA for both the normal allele (HbA) and the sickle cell allele (HbS). HbA allele CTGACTCCTGAGGAGAAGTCT HbS allele CTGACTCCTGTGGAGAAGTCT
How will the mutation in the HbS allele result in the production of a non-functional β-globin
polypeptide? A The mRNA transcribed from the HbS allele will contain the codon CAC instead of the codon
CTC.
B All the amino acids coded for after the mutation will differ from those in the HbA protein.
C A tRNA molecule with the anticodon GUG will hydrogen bond to the altered codon on mRNA.
D The ribosome will be unable to continue translation of the HbS mRNA after the altered codon.
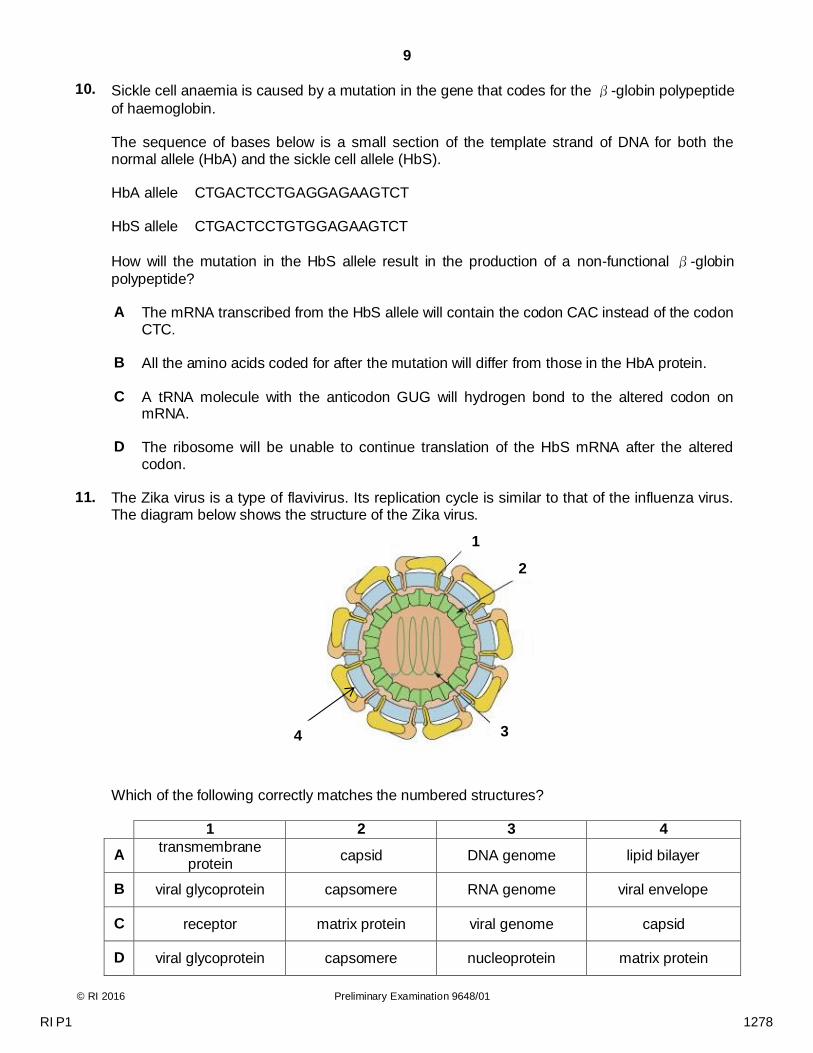
11.
The Zika virus is a type of flavivirus. Its replication cycle is similar to that of the influenza virus. The diagram below shows the structure of the Zika virus.
Which of the following correctly matches the numbered structures?
1 2 3 4
A
transmembrane protein
capsid DNA genome lipid bilayer
B viral glycoprotein capsomere RNA genome viral envelope
C receptor matrix protein viral genome capsid
D viral glycoprotein capsomere nucleoprotein matrix protein
1
2
3
4
RI P1 1278
10
© RI 2016 Preliminary Examination 9648/01
12.
During the replication cycle of the human immunodeficiency virus (HIV), the polyprotein that is produced is cleaved by a viral protease enzyme, producing several smaller peptides. This viral enzyme is the target of anti-HIV drugs. Which feature is essential for the success of these drugs?
A
A complex structure that inhibits many types of enzymes.
B
A molecule containing a heavy metal atom that is non-competitive inhibitor of enzymes.
C
A protein that can act as a competitive inhibitor of protease enzymes.
D A specific structure that inhibits only viral protease. 13.
Which of the following statement(s) concerning trp operon is/are true?
I A deletion mutation of the operator will lead to the constitutive production of tryptophan.
II There is one start and one stop codon in the mRNA of trp operon.
III The repressor is inactive in the presence of excess tryptophan.
IV The mRNA codes for 3 polypeptides involved in the synthesis of tryptophan. A I only
B I, II and III only
C II and III only
D I and IV only
RI P1 1279
11
© RI 2016 Preliminary Examination 9648/01 [Turn over
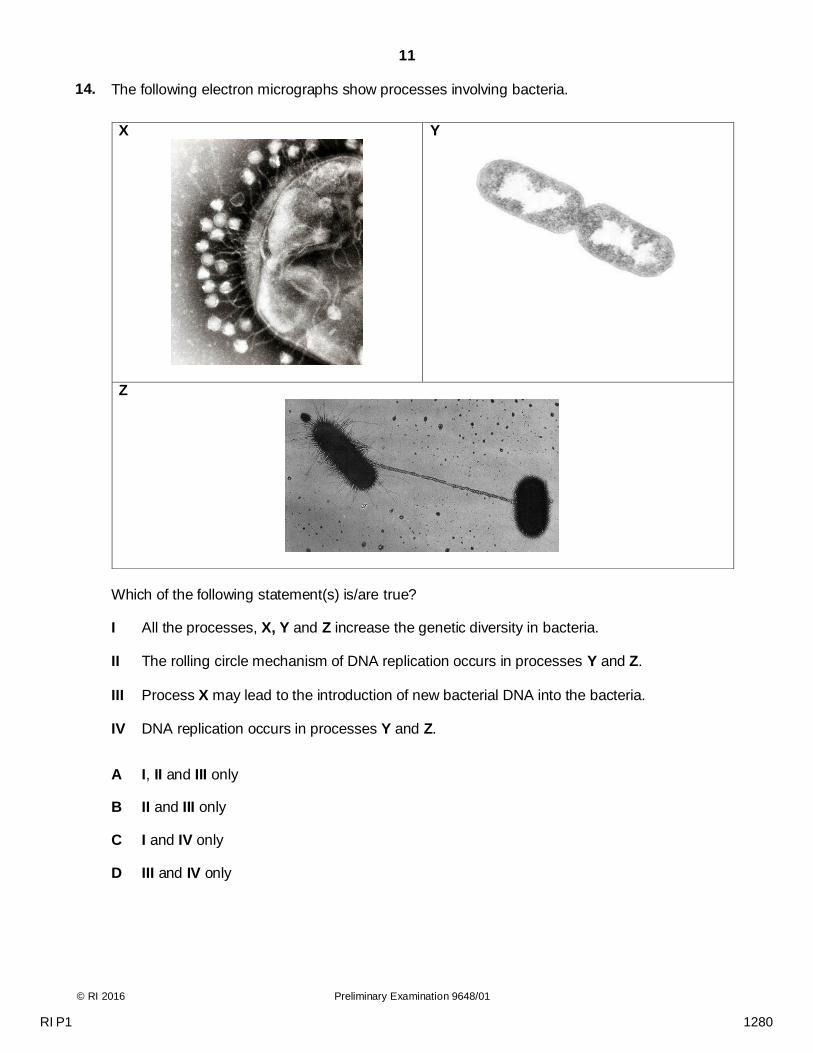
14. The following electron micrographs show processes involving bacteria.
X
Y
Z
Which of the following statement(s) is/are true?
I All the processes, X, Y and Z increase the genetic diversity in bacteria.
II The rolling circle mechanism of DNA replication occurs in processes Y and Z.
III Process X may lead to the introduction of new bacterial DNA into the bacteria.
IV DNA replication occurs in processes Y and Z.
A I, II and III only
B II and III only
C I and IV only
D III and IV only
RI P1 1280
12
© RI 2016 Preliminary Examination 9648/01
15. The following processes are different means by which gene expression can be regulated.
I amplification of a specific gene by rolling circle replication
II small effector molecules bound to activator protein controlling an inducible operon
III regulatory protein bound to control element causing spacer DNA to bend such that this regulatory protein interacts with TATA box directly
IV removal of acetyl groups from lysine residue of histones
Which of the above processes would result in the upregulation of gene expression?
A I and II only
B II and IV only
C I, II and III only
D All of the above
16.
BRCA1 and BRCA2 genes codes for gene products with DNA repair functions. Mutations in these two genes increase the risk of female breast cancer or ovarian cancer. It is observed that individuals who inherit mutations in BRCA1 and BRCA2 genes tend to develop breast or ovarian cancer at a younger age. Which of the following statements provides the best explanation for such observation?
A Both BRCA1 and BRCA2 genes are proto-oncogenes. When mutated, their non-functional protein products cannot repair damaged DNA.
B Other oncogenes may accumulate mutations quickly to form proto-oncogenes as there are no protein products to carry out DNA repair.
C Development of cancer is a multistep process that requires accumulation of mutations in more than 1 gene.
D Individuals have mutations in a copy of each tumour suppressor gene, BRCA1 and BRCA2. Thus less time is required for a single cell to acquire another loss-of-function mutation in the other copy of the tumour suppressor gene and a gain-in-function mutation in a proto-oncogene to become cancerous.
RI P1 1281
13
© RI 2016 Preliminary Examination 9648/01 [Turn over
17.
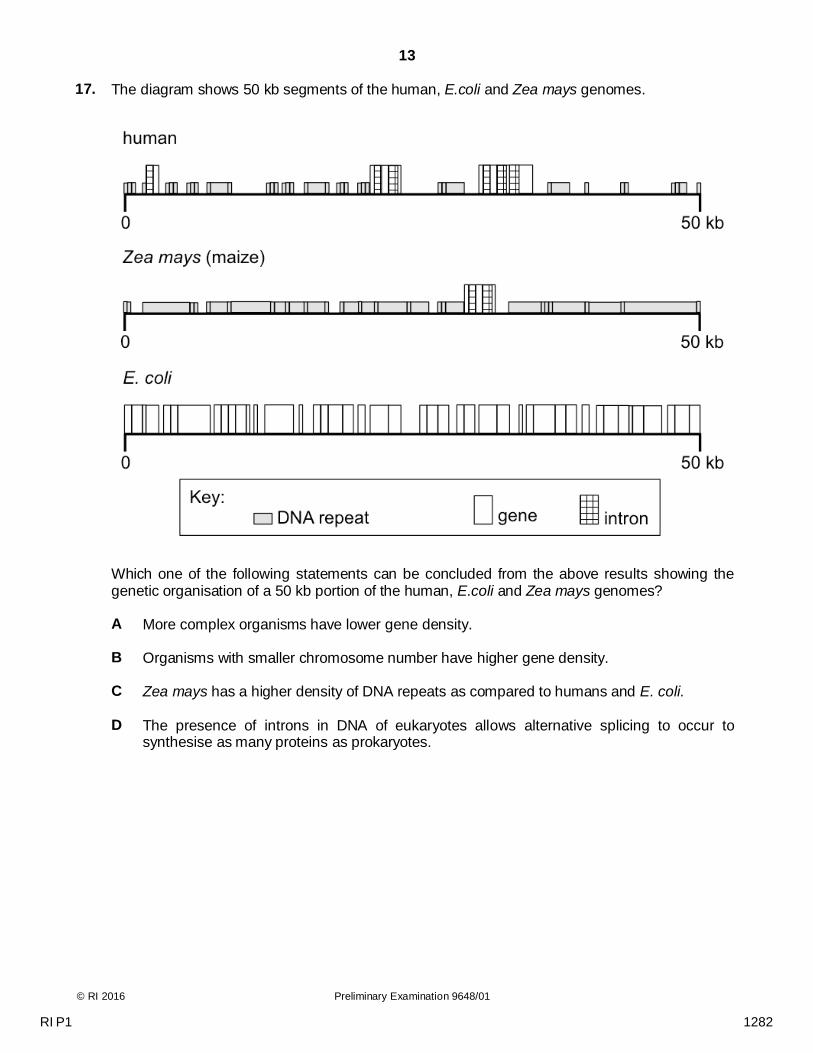
The diagram shows 50 kb segments of the human, E.coli and Zea mays genomes.
Which one of the following statements can be concluded from the above results showing the genetic organisation of a 50 kb portion of the human, E.coli and Zea mays genomes?
A More complex organisms have lower gene density.
B Organisms with smaller chromosome number have higher gene density.
C Zea mays has a higher density of DNA repeats as compared to humans and E. coli.
D The presence of introns in DNA of eukaryotes allows alternative splicing to occur to
synthesise as many proteins as prokaryotes.
RI P1 1282
14
© RI 2016 Preliminary Examination 9648/01
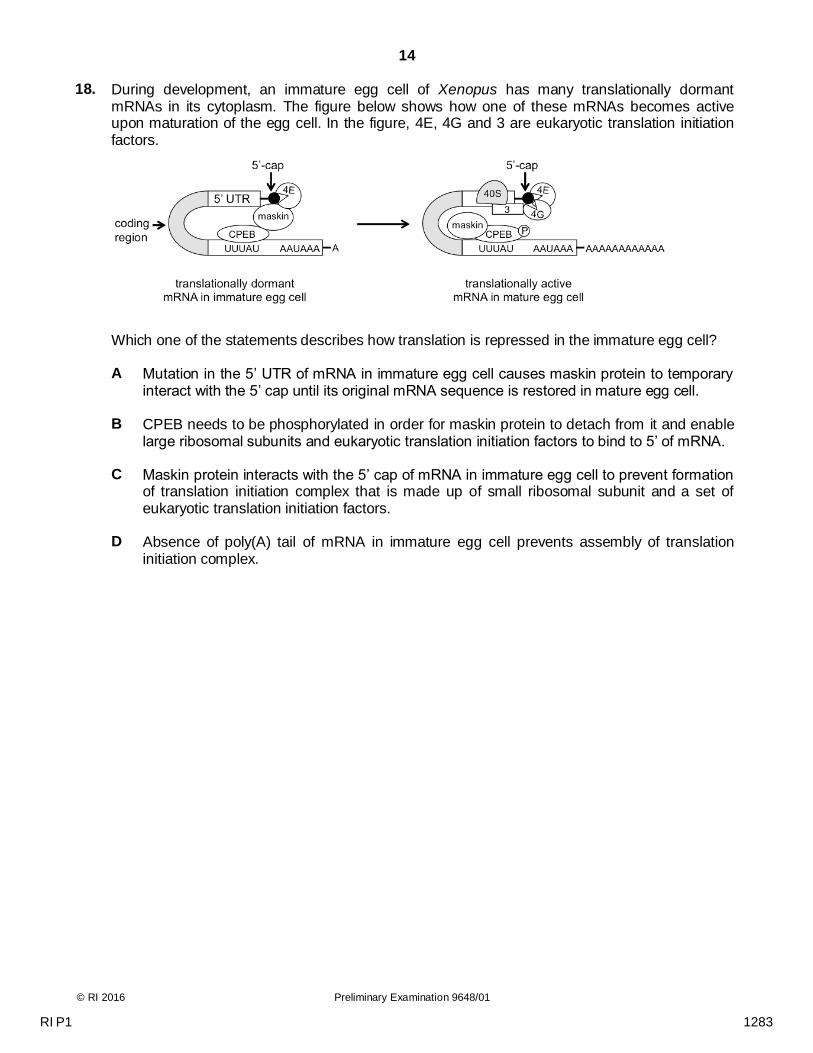
18.
During development, an immature egg cell of Xenopus has many translationally dormant mRNAs in its cytoplasm. The figure below shows how one of these mRNAs becomes active upon maturation of the egg cell. In the figure, 4E, 4G and 3 are eukaryotic translation initiation factors.
Which one of the statements describes how translation is repressed in the immature egg cell?
A Mutation in the 5’ UTR of mRNA in immature egg cell causes maskin protein to temporary interact with the 5’ cap until its original mRNA sequence is restored in mature egg cell.
B CPEB needs to be phosphorylated in order for maskin protein to detach from it and enable large ribosomal subunits and eukaryotic translation initiation factors to bind to 5’ of mRNA.
C Maskin protein interacts with the 5’ cap of mRNA in immature egg cell to prevent formation of translation initiation complex that is made up of small ribosomal subunit and a set of eukaryotic translation initiation factors.
D Absence of poly(A) tail of mRNA in immature egg cell prevents assembly of translation initiation complex.
RI P1 1283
15
© RI 2016 Preliminary Examination 9648/01 [Turn over
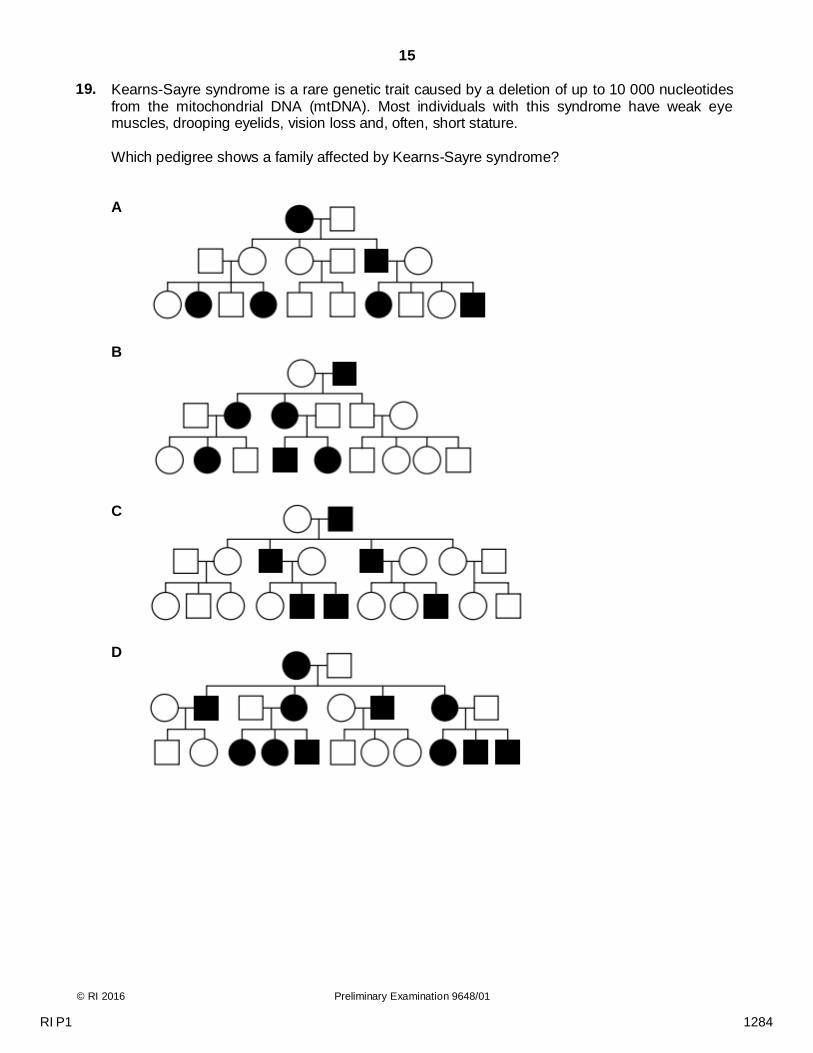
19.
Kearns-Sayre syndrome is a rare genetic trait caused by a deletion of up to 10 000 nucleotides from the mitochondrial DNA (mtDNA). Most individuals with this syndrome have weak eye muscles, drooping eyelids, vision loss and, often, short stature. Which pedigree shows a family affected by Kearns-Sayre syndrome?
A
B
C
D
RI P1 1284
16
© RI 2016 Preliminary Examination 9648/01
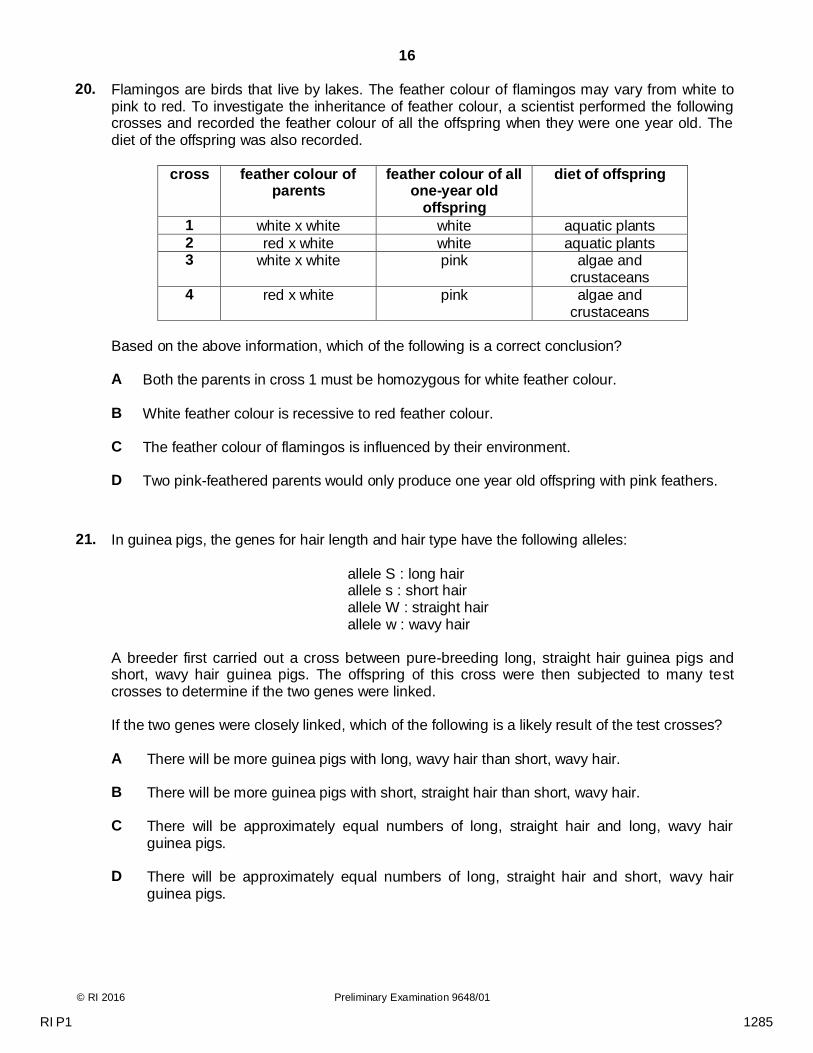
20.
Flamingos are birds that live by lakes. The feather colour of flamingos may vary from white to pink to red. To investigate the inheritance of feather colour, a scientist performed the following crosses and recorded the feather colour of all the offspring when they were one year old. The diet of the offspring was also recorded.
cross feather colour of parents
feather colour of all one-year old
offspring
diet of offspring
1 white x white white aquatic plants 2 red x white white aquatic plants 3 white x white pink algae and
crustaceans 4 red x white pink algae and
crustaceans Based on the above information, which of the following is a correct conclusion?
A
Both the parents in cross 1 must be homozygous for white feather colour.
B
White feather colour is recessive to red feather colour.
C
The feather colour of flamingos is influenced by their environment.
D Two pink-feathered parents would only produce one year old offspring with pink feathers.
21.
In guinea pigs, the genes for hair length and hair type have the following alleles:
allele S : long hair allele s : short hair allele W : straight hair allele w : wavy hair
A breeder first carried out a cross between pure-breeding long, straight hair guinea pigs and short, wavy hair guinea pigs. The offspring of this cross were then subjected to many test crosses to determine if the two genes were linked. If the two genes were closely linked, which of the following is a likely result of the test crosses?
A There will be more guinea pigs with long, wavy hair than short, wavy hair.
B There will be more guinea pigs with short, straight hair than short, wavy hair.
C There will be approximately equal numbers of long, straight hair and long, wavy hair
guinea pigs.
D There will be approximately equal numbers of long, straight hair and short, wavy hair guinea pigs.
RI P1 1285
17
© RI 2016 Preliminary Examination 9648/01 [Turn over
22.
In an experiment, chloroplast extracts were first treated with a chemical that ‘snatches’ away the electron that was accepted by the electron acceptor in photosystem I. The extracts were then treated with 2 hours of light and were provided with ample carbon dioxide and water.
Which of the following correctly shows the products that were formed after the experiment?
O2 ATP reduced NADP glucose
A + + – –
B – + + +
C + – – –
D – – + –
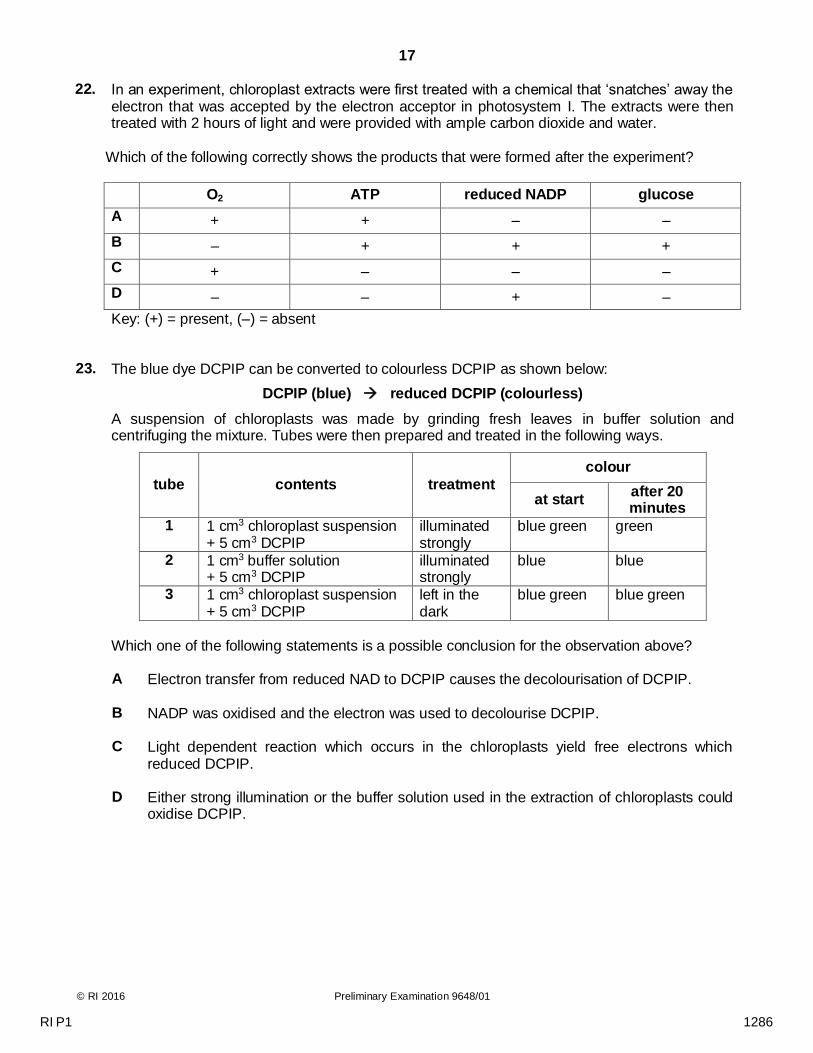
Key: (+) = present, (–) = absent 23.
The blue dye DCPIP can be converted to colourless DCPIP as shown below:
DCPIP (blue) reduced DCPIP (colourless)
A suspension of chloroplasts was made by grinding fresh leaves in buffer solution and centrifuging the mixture. Tubes were then prepared and treated in the following ways.
tube contents treatment
colour
at start after 20 minutes
1 1 cm3 chloroplast suspension + 5 cm3 DCPIP
illuminated strongly
blue green green
2 1 cm3 buffer solution + 5 cm3 DCPIP
illuminated strongly
blue blue
3 1 cm3 chloroplast suspension + 5 cm3 DCPIP
left in the dark
blue green blue green
Which one of the following statements is a possible conclusion for the observation above?
A
Electron transfer from reduced NAD to DCPIP causes the decolourisation of DCPIP.
B
NADP was oxidised and the electron was used to decolourise DCPIP.
C
Light dependent reaction which occurs in the chloroplasts yield free electrons which reduced DCPIP.
D
Either strong illumination or the buffer solution used in the extraction of chloroplasts could oxidise DCPIP.
RI P1 1286
18
© RI 2016 Preliminary Examination 9648/01
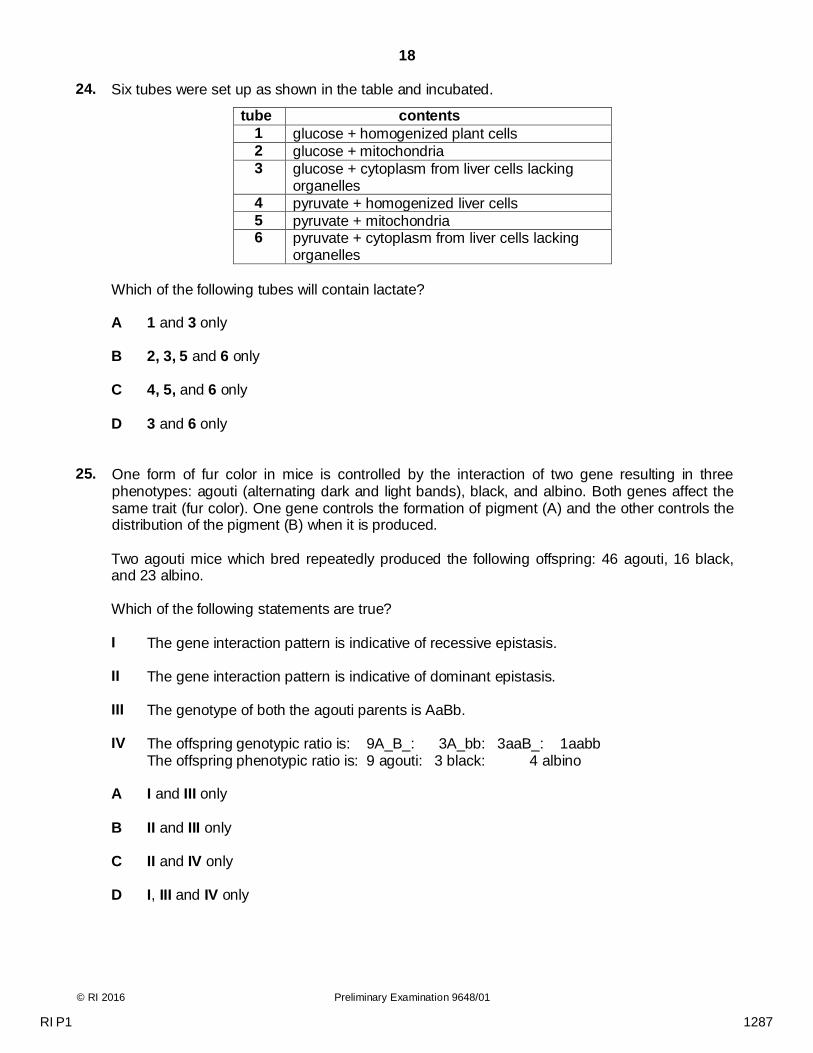
24.
Six tubes were set up as shown in the table and incubated.
tube contents
1 glucose + homogenized plant cells 2 glucose + mitochondria 3 glucose + cytoplasm from liver cells lacking
organelles 4 pyruvate + homogenized liver cells 5 pyruvate + mitochondria 6 pyruvate + cytoplasm from liver cells lacking
organelles
Which of the following tubes will contain lactate?
A 1 and 3 only
B 2, 3, 5 and 6 only
C 4, 5, and 6 only
D 3 and 6 only 25.
One form of fur color in mice is controlled by the interaction of two gene resulting in three phenotypes: agouti (alternating dark and light bands), black, and albino. Both genes affect the same trait (fur color). One gene controls the formation of pigment (A) and the other controls the distribution of the pigment (B) when it is produced. Two agouti mice which bred repeatedly produced the following offspring: 46 agouti, 16 black, and 23 albino. Which of the following statements are true?
I The gene interaction pattern is indicative of recessive epistasis.
II The gene interaction pattern is indicative of dominant epistasis.
III The genotype of both the agouti parents is AaBb.
IV The offspring genotypic ratio is: 9A_B_: 3A_bb: 3aaB_: 1aabb The offspring phenotypic ratio is: 9 agouti: 3 black: 4 albino
A I and III only
B II and III only
C II and IV only
D I, III and IV only
RI P1 1287
19
© RI 2016 Preliminary Examination 9648/01 [Turn over
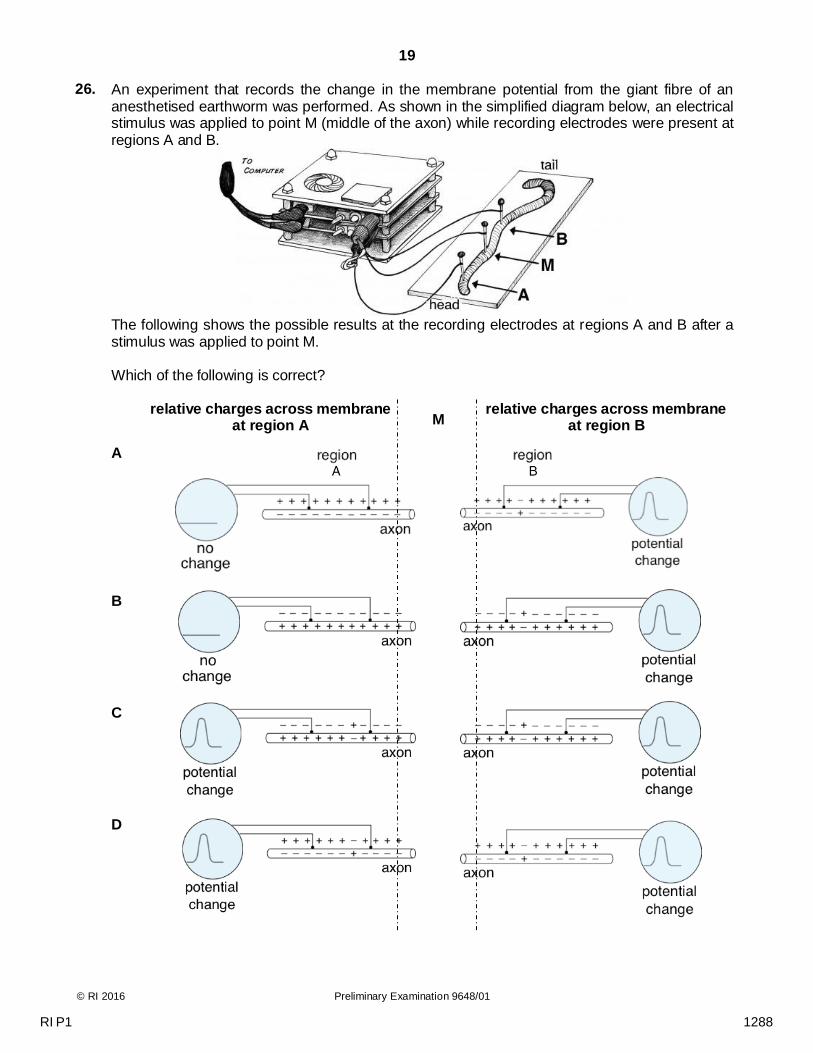
26.
An experiment that records the change in the membrane potential from the giant fibre of an anesthetised earthworm was performed. As shown in the simplified diagram below, an electrical stimulus was applied to point M (middle of the axon) while recording electrodes were present at regions A and B.
The following shows the possible results at the recording electrodes at regions A and B after a stimulus was applied to point M. Which of the following is correct?
relative charges across membrane
at region A M relative charges across membrane
at region B
A
B
C
D
RI P1 1288
20
© RI 2016 Preliminary Examination 9648/01
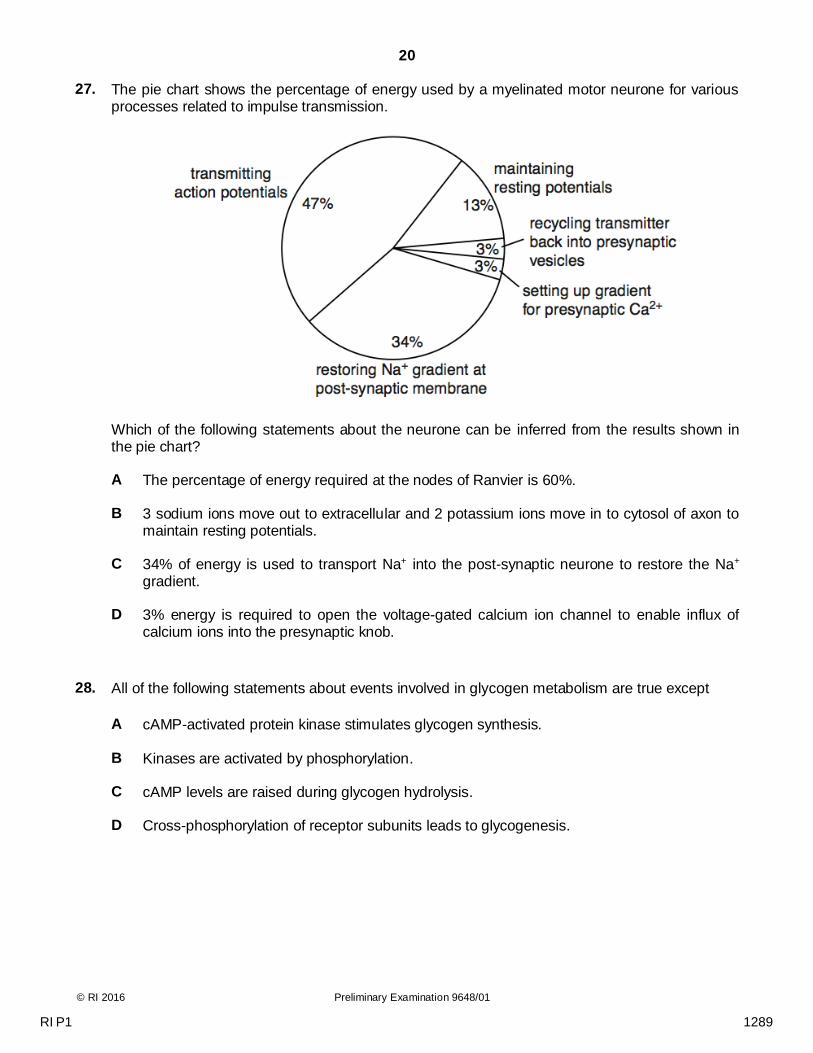
27.
The pie chart shows the percentage of energy used by a myelinated motor neurone for various processes related to impulse transmission.
Which of the following statements about the neurone can be inferred from the results shown in the pie chart?
A The percentage of energy required at the nodes of Ranvier is 60%.
B 3 sodium ions move out to extracellular and 2 potassium ions move in to cytosol of axon to maintain resting potentials.
C 34% of energy is used to transport Na+ into the post-synaptic neurone to restore the Na+ gradient.
D 3% energy is required to open the voltage-gated calcium ion channel to enable influx of calcium ions into the presynaptic knob.
28. All of the following statements about events involved in glycogen metabolism are true except
A cAMP-activated protein kinase stimulates glycogen synthesis.
B Kinases are activated by phosphorylation.
C cAMP levels are raised during glycogen hydrolysis.
D Cross-phosphorylation of receptor subunits leads to glycogenesis.
RI P1 1289
21
© RI 2016 Preliminary Examination 9648/01 [Turn over
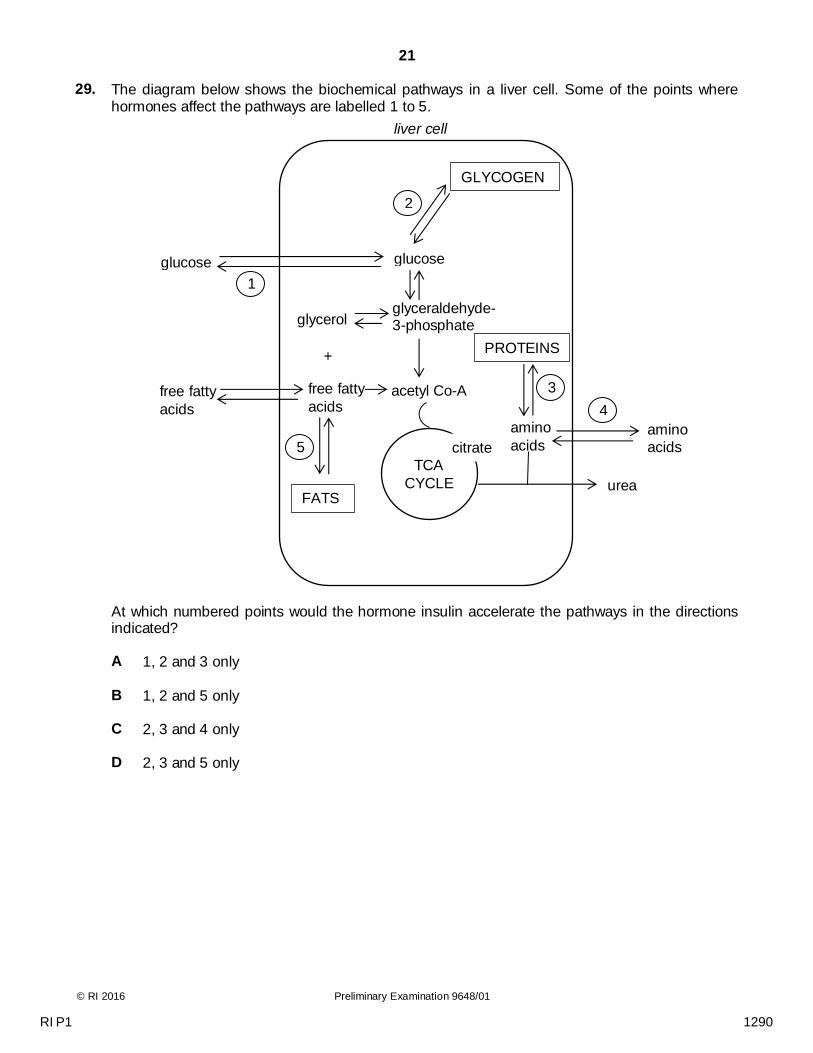
29.
The diagram below shows the biochemical pathways in a liver cell. Some of the points where hormones affect the pathways are labelled 1 to 5. At which numbered points would the hormone insulin accelerate the pathways in the directions indicated?
A 1, 2 and 3 only
B 1, 2 and 5 only
C 2, 3 and 4 only
D 2, 3 and 5 only
liver cell
glucose
free fatty
acids
glucose
glyceraldehyde-3-phosphate
acetyl Co-A
GLYCOGEN
free fatty
acids
FATS
citrate
TCA
CYCLE urea
amino
acids
PROTEINS
1
2
3
amino
acids
4
5
glycerol
+
RI P1 1290
22
© RI 2016 Preliminary Examination 9648/01
30. Which of the following statement(s) about receptor tyrosine kinases (RTKs) is/are true?
I The insulin receptors has a 7-pass transmembrane domain.
II RTKs can auto-phosphorylate tyrosine residues on other proteins.
III RTKs have transmembrane domains.
IV RTKs are subunits that can dimerise. A III and IV only
B II and IV only
C I, III and IV only
D All of the above 31.
Two areas of molecular biology that have received considerable attention in evolutionary studies are the genetic code and cytochrome C. Cytochrome C is an essential component of all respiratory electron transport chains.
Which statements lend evidence to the following 2 ideas?
Idea 1: All living organisms are related, and Idea 2: There is a single, rather than a multiple, origin of life?
1 The almost universal nature of the genetic code is a result of evolutionary convergence from
multiple lineages.
2 The sequence of amino acids in cytochrome C is similar in organisms that are from similar environments or with similar metabolic demands.
3 The majority of organisms have the same, or similar, amino acid sequences for cytochrome C.
4 When transferred into a very dissimilar organism, a gene coding for cytochrome C will lead to the expression of a protein that will function in the other organism.
A 1 and 2 only
B 2 and 3 only
C 3 and 4 only
D 1, 3 and 4 only
RI P1 1291
23
© RI 2016 Preliminary Examination 9648/01 [Turn over
32. Which of the following shows the correct sequence of events? I adaptation of a
population competition and
predation leading to natural selection
behavioural isolation
allopatric speciation
II adaptation of a population
competition and predation leading to
natural selection
physiological isolation
allopatric speciation
III competition and predation leading
to natural selection
physiological isolation
adaptation of isolated
populations
sympatric speciation
IV competition and predation leading
to natural selection
geographical isolation
adaptation of isolated
populations
allopatric speciation
A III only
B I and II only
C III and IV only
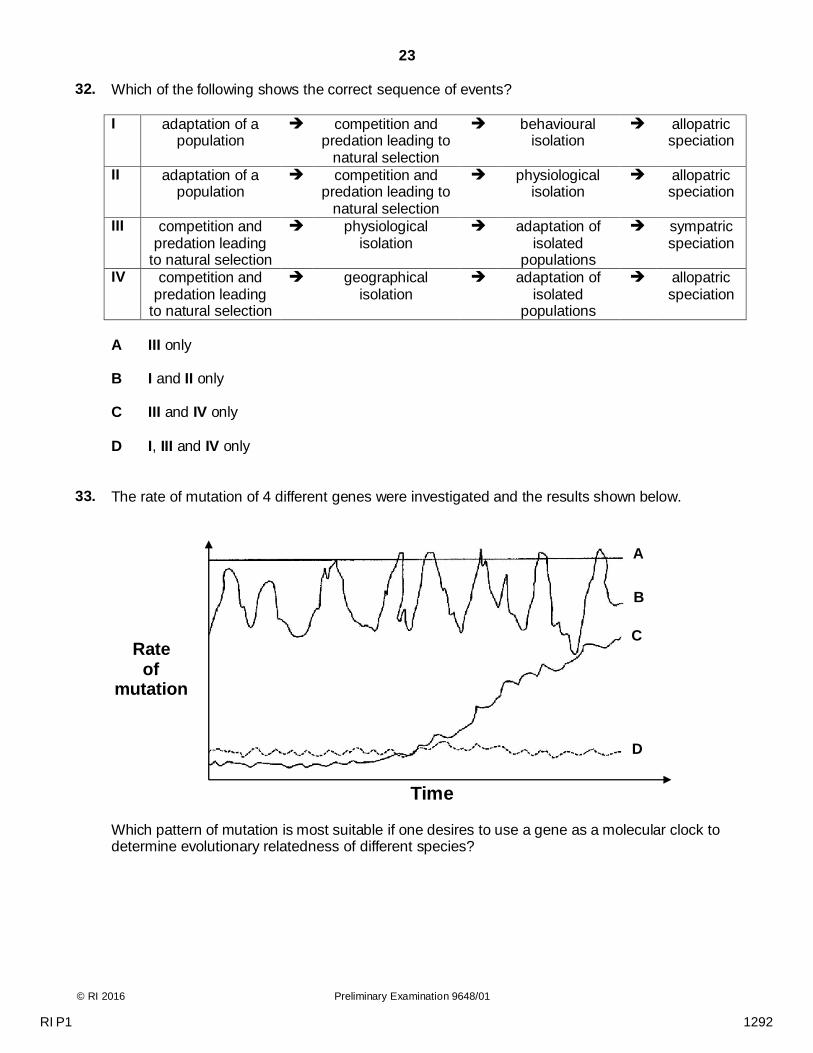
D I, III and IV only 33.
The rate of mutation of 4 different genes were investigated and the results shown below.
Which pattern of mutation is most suitable if one desires to use a gene as a molecular clock to determine evolutionary relatedness of different species?
Rate of
mutation
Time
A
B
C
D
RI P1 1292
24
© RI 2016 Preliminary Examination 9648/01
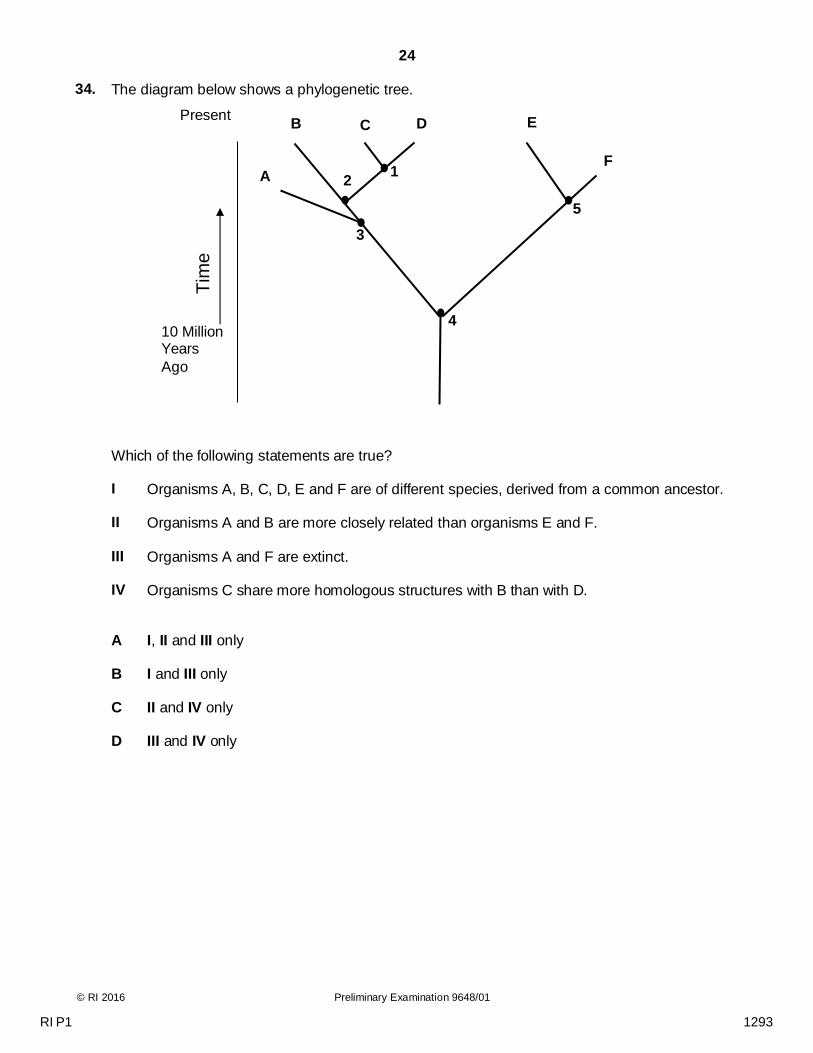
34. The diagram below shows a phylogenetic tree.
Which of the following statements are true?
I Organisms A, B, C, D, E and F are of different species, derived from a common ancestor.
II Organisms A and B are more closely related than organisms E and F.
III Organisms A and F are extinct.
IV Organisms C share more homologous structures with B than with D.
A I, II and III only
B I and III only
C II and IV only
D III and IV only
10 Million Years
Ago
Present
A
B C D
F 1
2
3
4
5 T
ime
E
RI P1 1293
25
© RI 2016 Preliminary Examination 9648/01 [Turn over
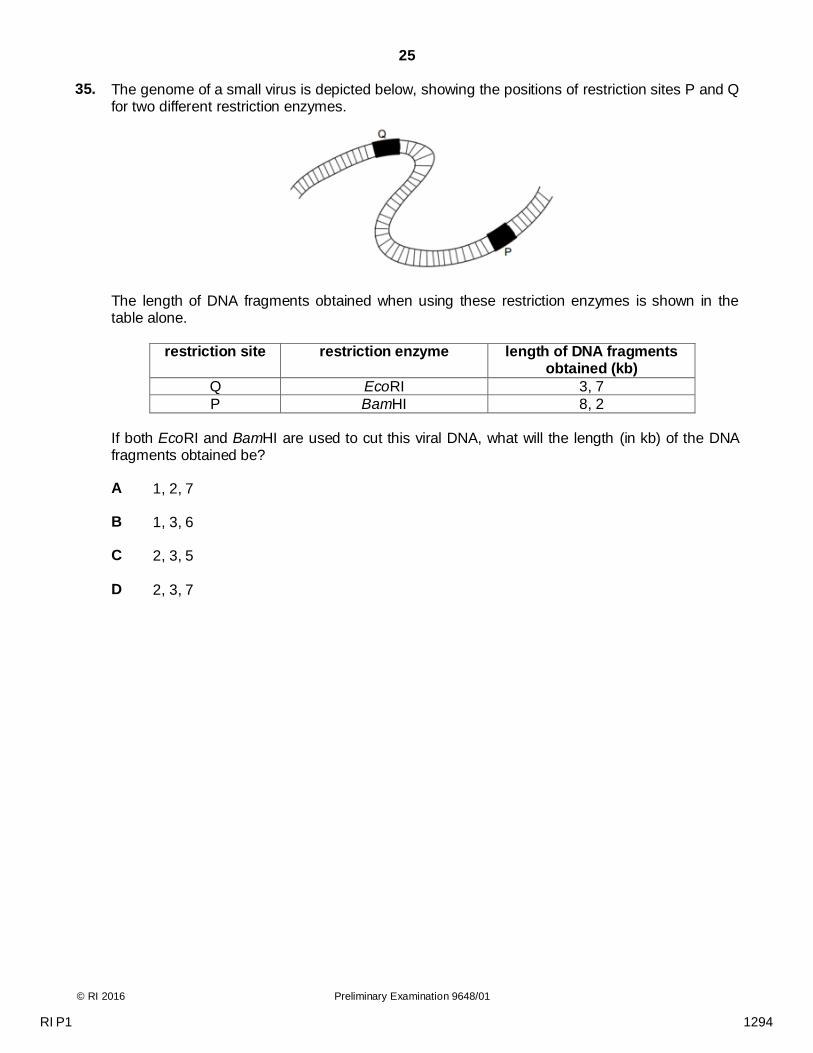
35.
The genome of a small virus is depicted below, showing the positions of restriction sites P and Q for two different restriction enzymes.
The length of DNA fragments obtained when using these restriction enzymes is shown in the table alone.
restriction site restriction enzyme length of DNA fragments obtained (kb)
Q EcoRI 3, 7
P BamHI 8, 2
If both EcoRI and BamHI are used to cut this viral DNA, what will the length (in kb) of the DNA fragments obtained be?
A 1, 2, 7
B 1, 3, 6
C 2, 3, 5
D 2, 3, 7
RI P1 1294
26
© RI 2016 Preliminary Examination 9648/01
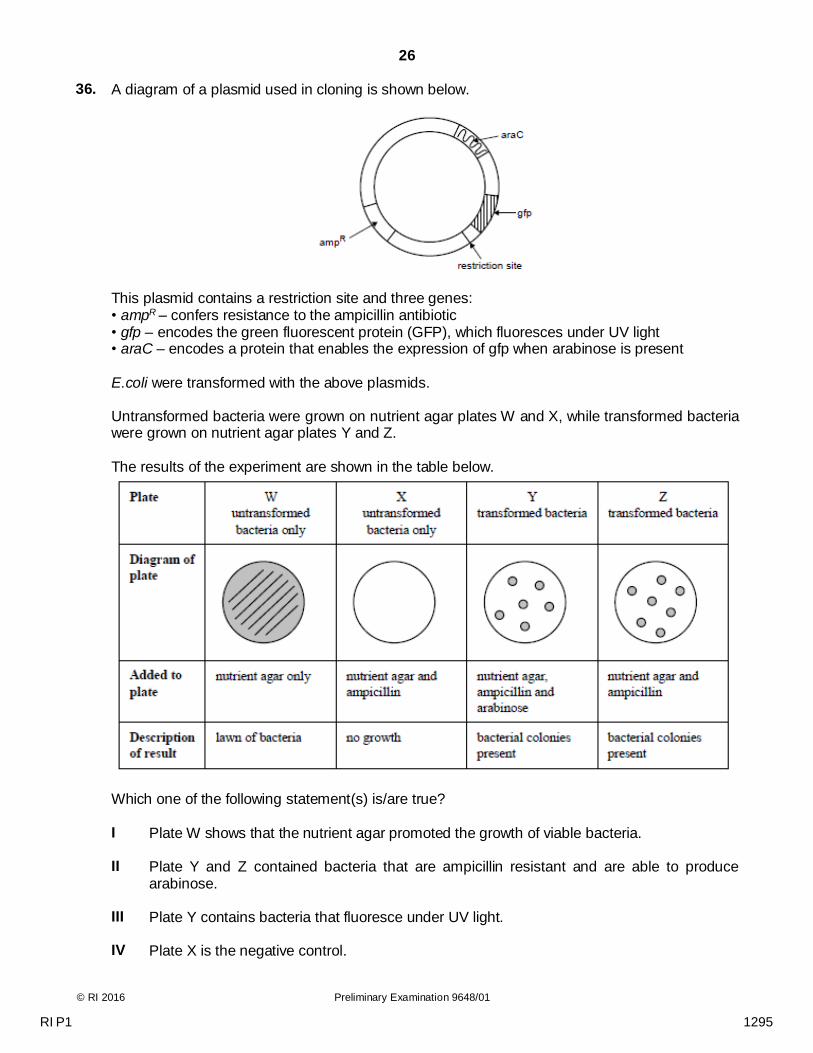
36.
A diagram of a plasmid used in cloning is shown below.
This plasmid contains a restriction site and three genes: • ampR – confers resistance to the ampicillin antibiotic • gfp – encodes the green fluorescent protein (GFP), which fluoresces under UV light • araC – encodes a protein that enables the expression of gfp when arabinose is present E.coli were transformed with the above plasmids. Untransformed bacteria were grown on nutrient agar plates W and X, while transformed bacteria were grown on nutrient agar plates Y and Z. The results of the experiment are shown in the table below.
Which one of the following statement(s) is/are true?
I Plate W shows that the nutrient agar promoted the growth of viable bacteria.
II Plate Y and Z contained bacteria that are ampicillin resistant and are able to produce
arabinose.
III Plate Y contains bacteria that fluoresce under UV light.
IV Plate X is the negative control.
RI P1 1295
27
© RI 2016 Preliminary Examination 9648/01 [Turn over
A III and IV only
B III only
C I, III and IV only
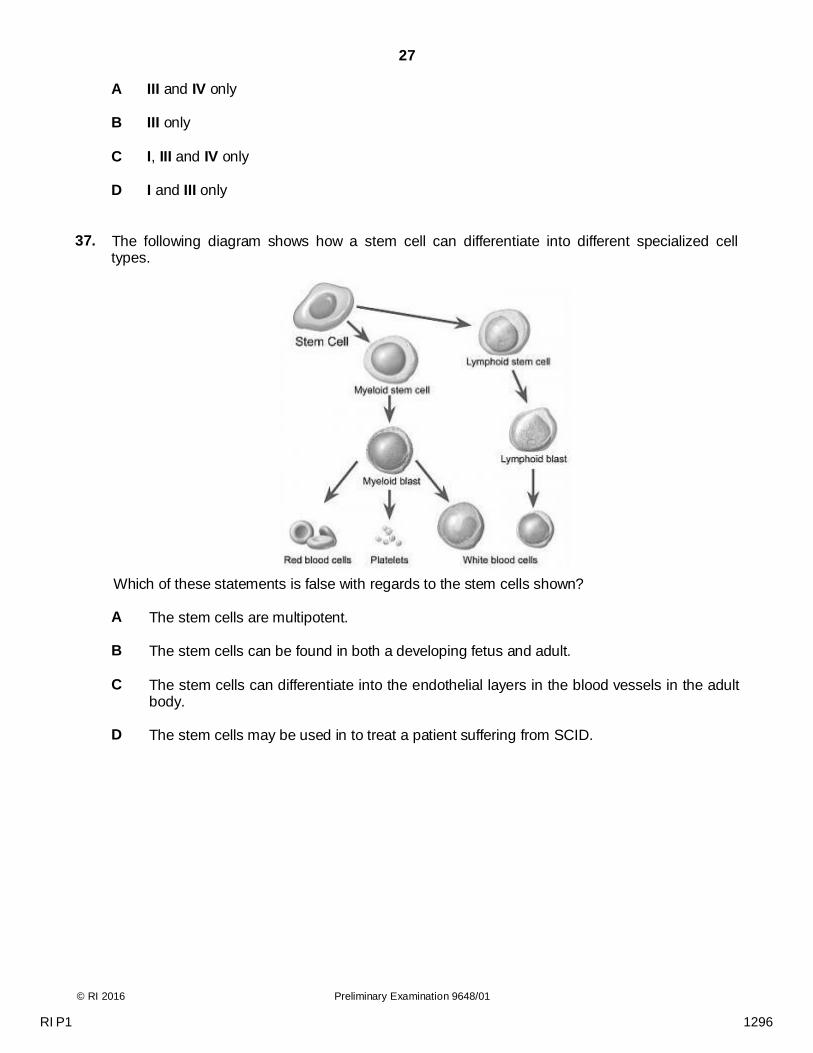
D I and III only 37.
The following diagram shows how a stem cell can differentiate into different specialized cell types.
Which of these statements is false with regards to the stem cells shown?
A The stem cells are multipotent.
B The stem cells can be found in both a developing fetus and adult.
C The stem cells can differentiate into the endothelial layers in the blood vessels in the adult body.
D The stem cells may be used in to treat a patient suffering from SCID.
RI P1 1296
28
© RI 2016 Preliminary Examination 9648/01
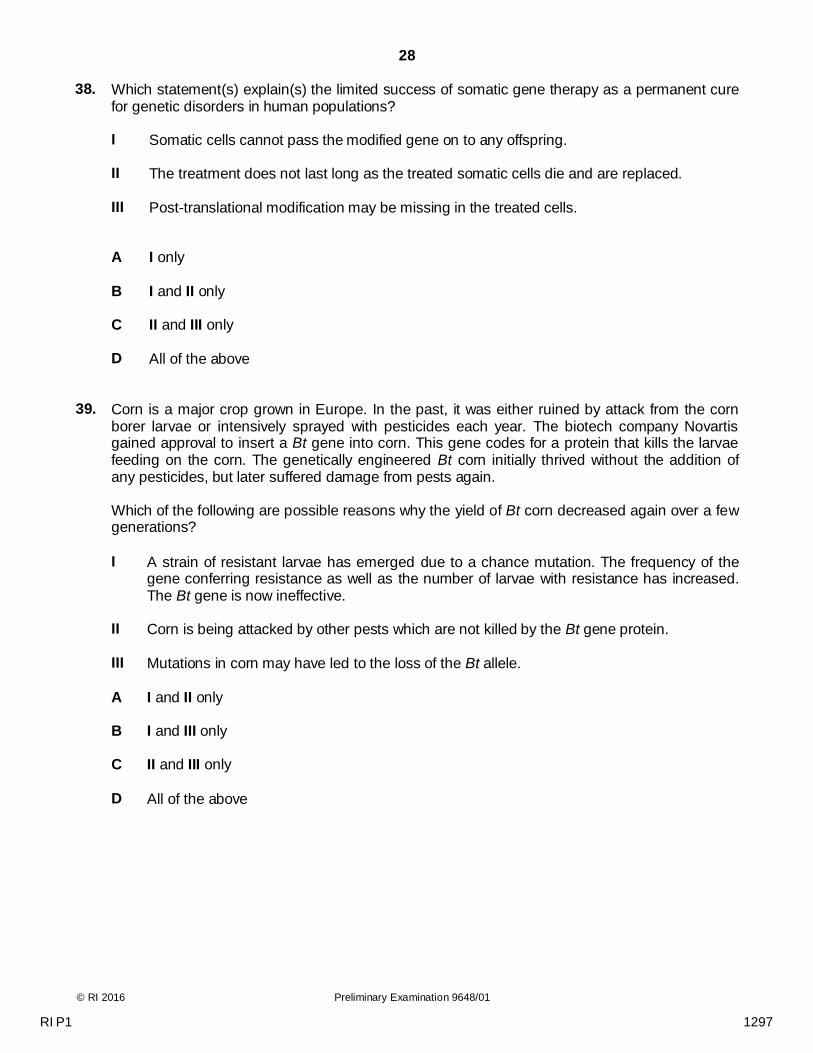
38.
Which statement(s) explain(s) the limited success of somatic gene therapy as a permanent cure for genetic disorders in human populations?
I Somatic cells cannot pass the modified gene on to any offspring.
II The treatment does not last long as the treated somatic cells die and are replaced.
III Post-translational modification may be missing in the treated cells.
A I only
B I and II only
C II and III only
D All of the above 39.
Corn is a major crop grown in Europe. In the past, it was either ruined by attack from the corn borer larvae or intensively sprayed with pesticides each year. The biotech company Novartis gained approval to insert a Bt gene into corn. This gene codes for a protein that kills the larvae feeding on the corn. The genetically engineered Bt corn initially thrived without the addition of any pesticides, but later suffered damage from pests again. Which of the following are possible reasons why the yield of Bt corn decreased again over a few generations?
I A strain of resistant larvae has emerged due to a chance mutation. The frequency of the gene conferring resistance as well as the number of larvae with resistance has increased. The Bt gene is now ineffective.
II Corn is being attacked by other pests which are not killed by the Bt gene protein.
III Mutations in corn may have led to the loss of the Bt allele. A I and II only
B I and III only
C II and III only
D All of the above
RI P1 1297
29
© RI 2016 Preliminary Examination 9648/01 [Turn over
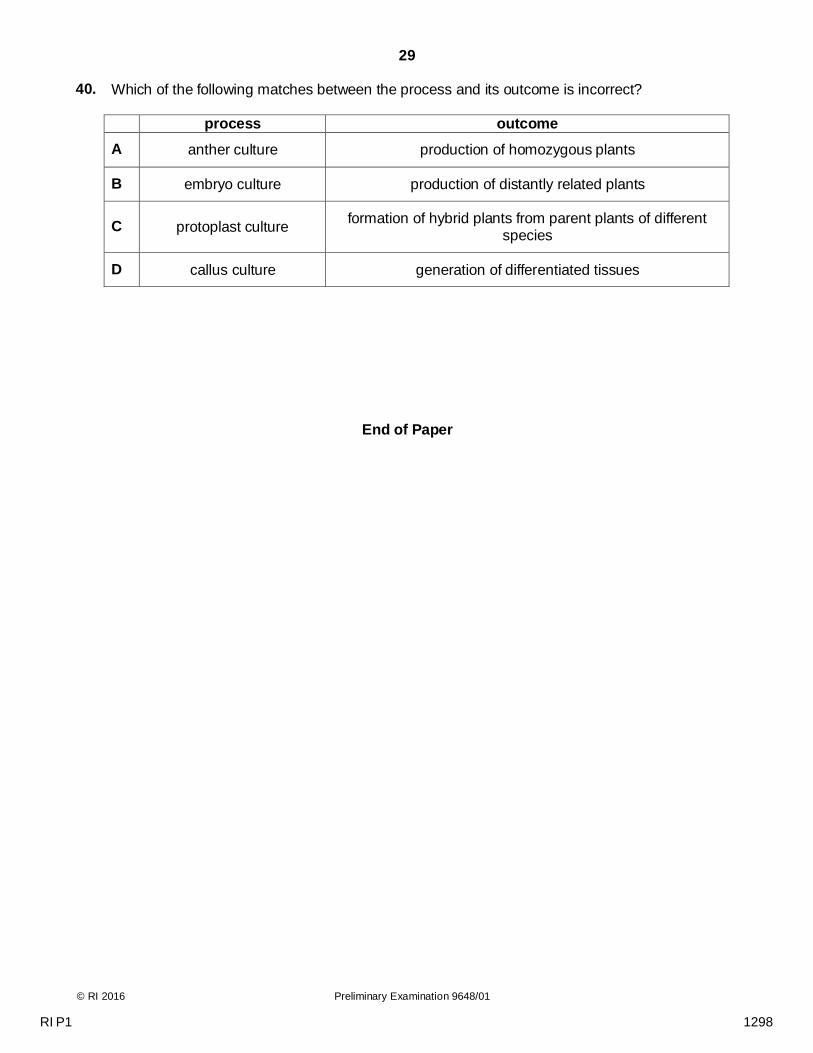
40.
Which of the following matches between the process and its outcome is incorrect?
process outcome
A anther culture production of homozygous plants
B embryo culture production of distantly related plants
C protoplast culture formation of hybrid plants from parent plants of different
species
D callus culture generation of differentiated tissues
End of Paper
RI P1 1298
© RI 2016 Preliminary Examination 9648/02
2016 Year 6 Preliminary Examination Higher 2
CANDIDATE NAME
CIVICS GROUP 1 6 S 0 3
INDEX NUMBER
BIOLOGY
Paper 2 Core Paper
Additional materials: Answer Paper
9648/02
15th September 2016
2 hours
READ THESE INSTRUCTIONS FIRST
Write your index number, CT group & name on all the work you hand in. Write in dark blue or black pen on both sides of the paper. You may use a soft pencil for any diagrams, graphs or rough working. Do not use staples, paper clips, highlighters, glue or correction fluid.
Section A
Answer all questions.
Section B
Answer one question.
At the end of the examination, hand in your essay SEPARATELY. The number of marks is given in brackets [ ] at the end of each question or part question.
For Examiner’s Use
Section A
1 /12
2 /10
3 /12
4 /13
5 /10
6 /12
7 /11
Section B
8 or 9 /20
Total /100
This document consists of 20 printed pages.
Raffles Institution Internal Examination
RI P2 1299
2
© RI 2016 Preliminary Examination 9648/02
For Examiner’s
Use
Section A
Answer all the questions in this section.
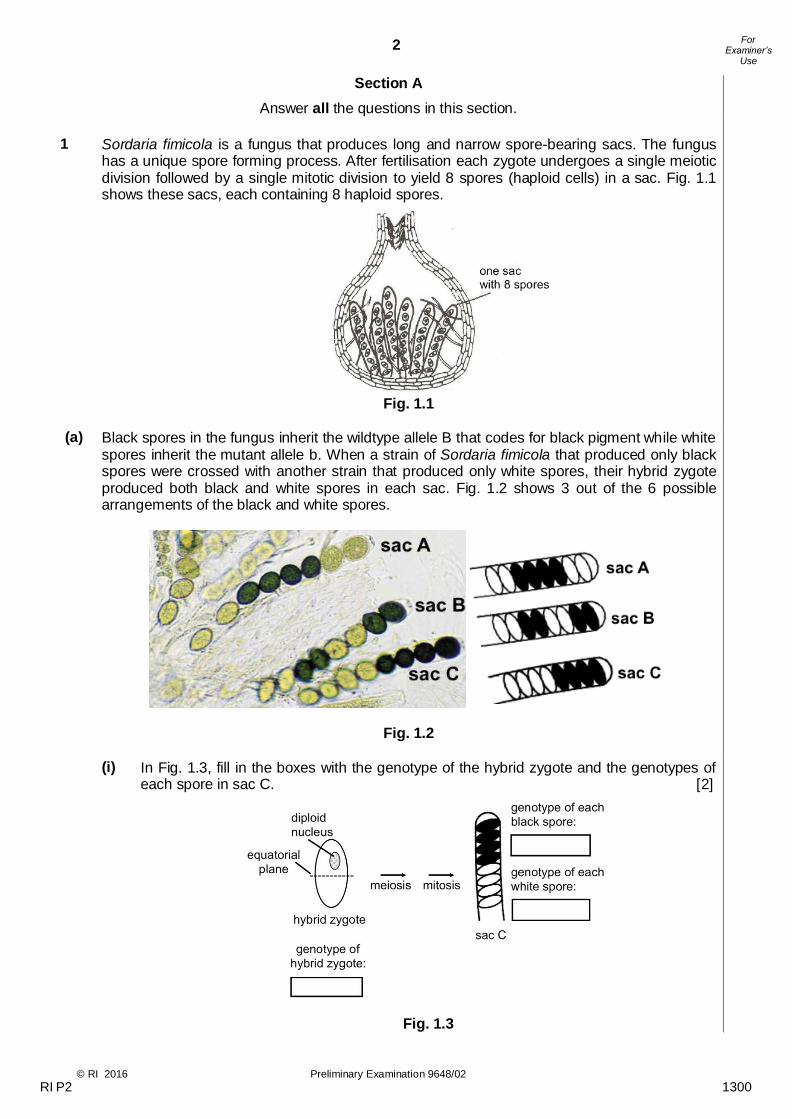
1 Sordaria fimicola is a fungus that produces long and narrow spore-bearing sacs. The fungus
has a unique spore forming process. After fertilisation each zygote undergoes a single meiotic division followed by a single mitotic division to yield 8 spores (haploid cells) in a sac. Fig. 1.1 shows these sacs, each containing 8 haploid spores.
Fig. 1.1
(a) Black spores in the fungus inherit the wildtype allele B that codes for black pigment while white spores inherit the mutant allele b. When a strain of Sordaria fimicola that produced only black spores were crossed with another strain that produced only white spores, their hybrid zygote produced both black and white spores in each sac. Fig. 1.2 shows 3 out of the 6 possible arrangements of the black and white spores.
Fig. 1.2
(i) In Fig. 1.3, fill in the boxes with the genotype of the hybrid zygote and the genotypes of each spore in sac C. [2]
Fig. 1.3
RI P2 1300
3
© RI 2016 Preliminary Examination 9648/02 [Turn over
For Examiner’s
Use
(ii) The arrangement of the black and white spores in a sac depends on whether crossing over occurred in the hybrid zygote. For instance, the arrangement of spores in sac C was the result of a hybrid zygote that did not undergo crossing over but the arrangement of spores in sac B was the result of a hybrid zygote that underwent crossing over. Fig. 1.4 shows a hybrid zygote that is undergoing meiosis to form sac B. In Fig. 1.4, draw the arrangement of chromosomes that contain alleles B/b at the end of prophase I of meiosis. Label your drawings clearly. [2]
Fig. 1.4
(iii) Explain how 4 haploid spores of alternating black and white spore arrangement were
formed due to meiosis.
…………...…………………………………………………………………………………………. …………...…………………………………………………………………………………………. …………...…………………………………………………………………………………………. …………...…………………………………………………………………………………………. …………………………………...…………………………………………………………………. …………………………………………………………………………………………………... [3]
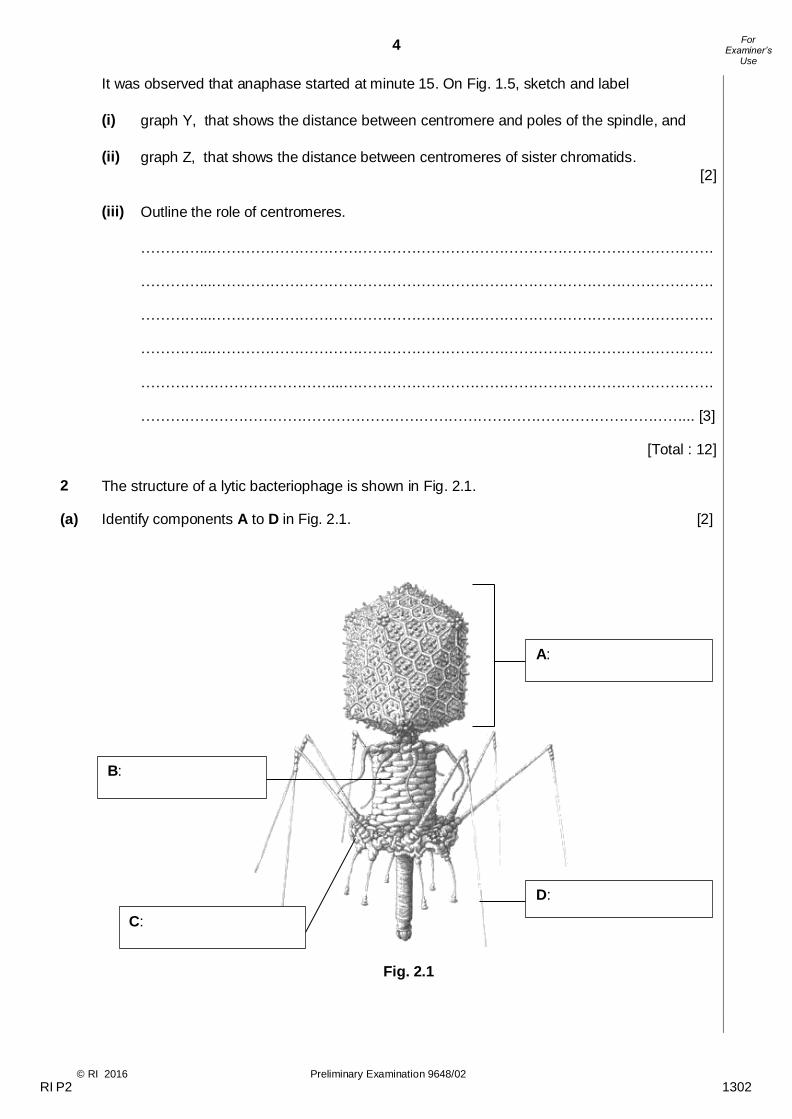
(b) Further studies of the spindle fibers in the spore-forming fungus were carried out during its
mitotic division. Fig. 1.5 is a graph showing the distance between poles of the spindle during mitosis.
Fig. 1.5
cell wall
RI P2 1301
4
© RI 2016 Preliminary Examination 9648/02
For Examiner’s
Use
It was observed that anaphase started at minute 15. On Fig. 1.5, sketch and label (i) graph Y, that shows the distance between centromere and poles of the spindle, and (ii) graph Z, that shows the distance between centromeres of sister chromatids. [2] (iii) Outline the role of centromeres.
…………...…………………………………………………………………………………………. …………...…………………………………………………………………………………………. …………...…………………………………………………………………………………………. …………...…………………………………………………………………………………………. …………………………………...…………………………………………………………………. …………………………………………………………………………………………………... [3]
[Total : 12] 2
(a)
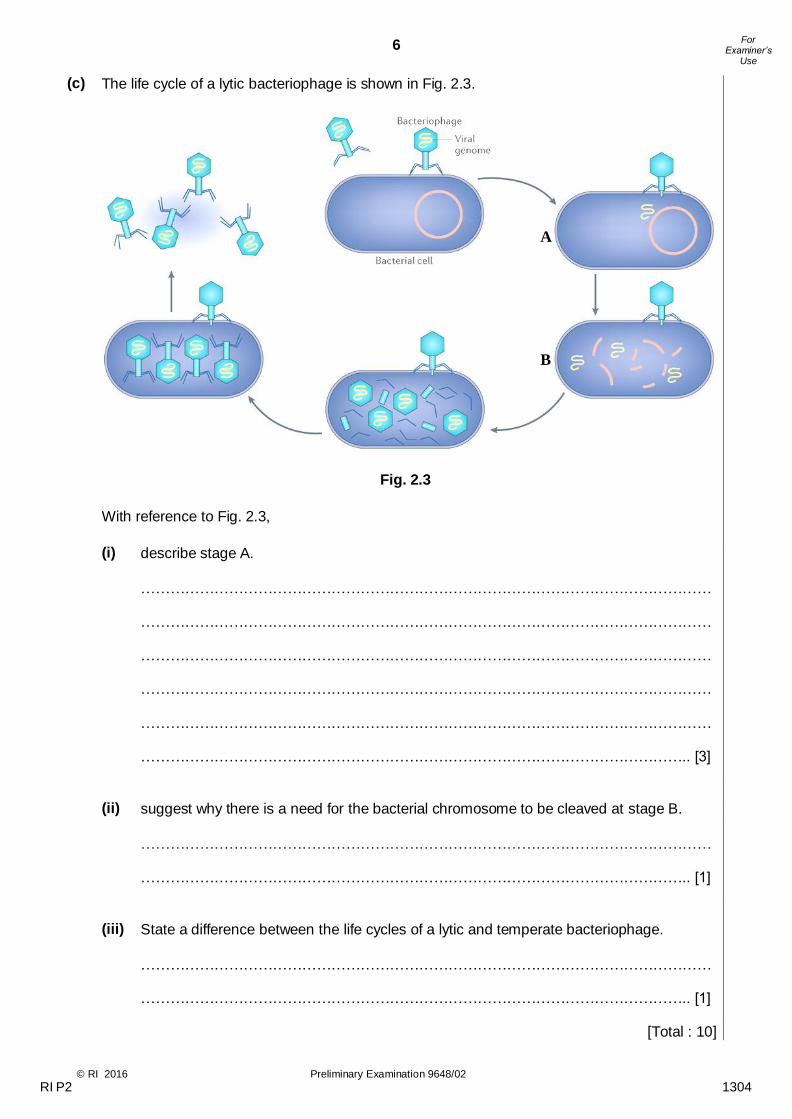
The structure of a lytic bacteriophage is shown in Fig. 2.1. Identify components A to D in Fig. 2.1. [2]
Fig. 2.1
A:
B:
C:
D:
RI P2 1302

5
© RI 2016 Preliminary Examination 9648/02 [Turn over
For Examiner’s
Use
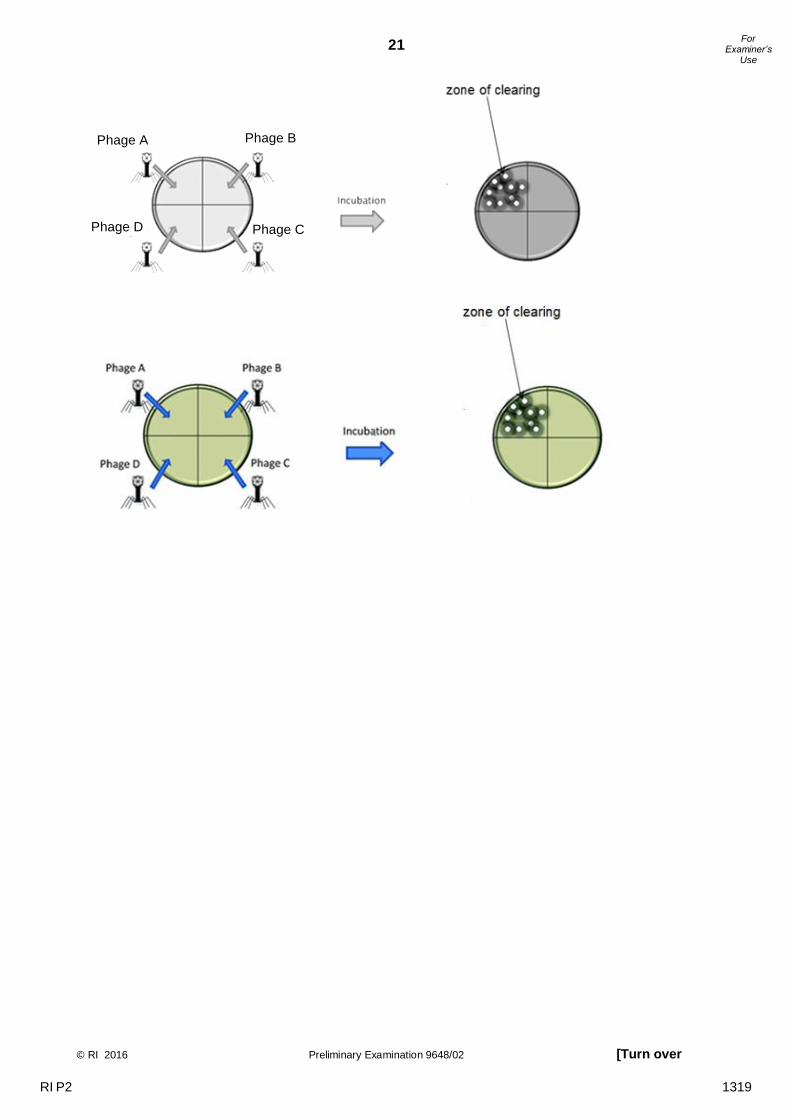
(b) A strain of bacteria was spread throughout growth media on a petri dish. Different types of lytic bacteriophages were then introduced as shown in Fig. 2.2. Areas where infected bacterial cells are lysed show up as zones of clearings.
Fig. 2.2
With reference to Fig. 2.2, (i) identify the bacteriophage(s) that did not undergo replication.
………………………………………………………………………………………………….. [1]
(ii) suggest why the identified bacteriophage(s) in (b)(i) could not undergo replication.
……………………………………………………………………………………………………… ……………………………………………………………………………………………………… ……………………………………………………………………………………………………… ………………………………………………………………………………………………….. [2]
RI P2 1303
6
© RI 2016 Preliminary Examination 9648/02
For Examiner’s
Use
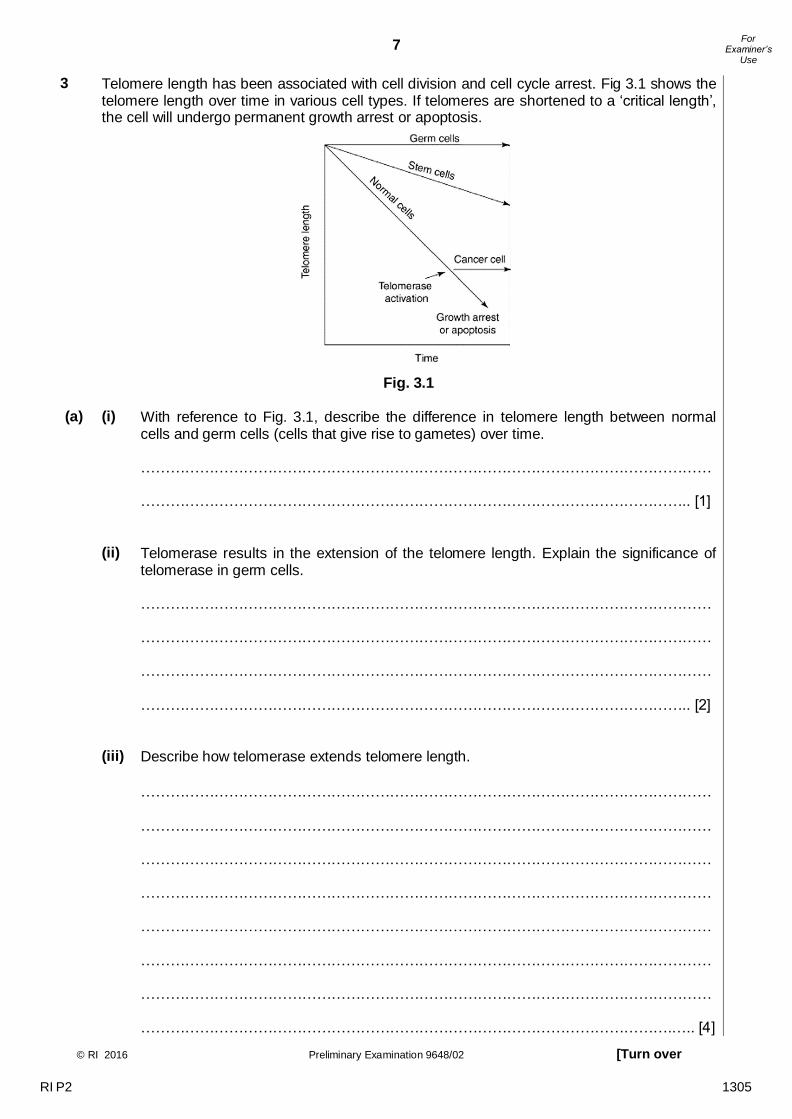
(c) The life cycle of a lytic bacteriophage is shown in Fig. 2.3.
Fig. 2.3
With reference to Fig. 2.3, (i) describe stage A.
……………………………………………………………………………………………………… ……………………………………………………………………………………………………… ……………………………………………………………………………………………………… ……………………………………………………………………………………………………… ……………………………………………………………………………………………………… ………………………………………………………………………………………………….. [3]
(ii) suggest why there is a need for the bacterial chromosome to be cleaved at stage B.
……………………………………………………………………………………………………… ………………………………………………………………………………………………….. [1]
(iii) State a difference between the life cycles of a lytic and temperate bacteriophage.
……………………………………………………………………………………………………… ………………………………………………………………………………………………….. [1]
[Total : 10]
A
B
RI P2 1304
7
© RI 2016 Preliminary Examination 9648/02 [Turn over
For Examiner’s
Use
3
Telomere length has been associated with cell division and cell cycle arrest. Fig 3.1 shows the telomere length over time in various cell types. If telomeres are shortened to a ‘critical length’, the cell will undergo permanent growth arrest or apoptosis.
Fig. 3.1
(a) (i) With reference to Fig. 3.1, describe the difference in telomere length between normal cells and germ cells (cells that give rise to gametes) over time.
……………………………………………………………………………………………………… ………………………………………………………………………………………………….. [1]
(ii) Telomerase results in the extension of the telomere length. Explain the significance of
telomerase in germ cells.
……………………………………………………………………………………………………… ……………………………………………………………………………………………………… ……………………………………………………………………………………………………… ………………………………………………………………………………………………….. [2]
(iii) Describe how telomerase extends telomere length.
……………………………………………………………………………………………………… ……………………………………………………………………………………………………… ……………………………………………………………………………………………………… ……………………………………………………………………………………………………… ……………………………………………………………………………………………………… ……………………………………………………………………………………………………… ……………………………………………………………………………………………………… ……………………………………………………………………………………………….….. [4]
RI P2 1305
8
© RI 2016 Preliminary Examination 9648/02
For Examiner’s
Use
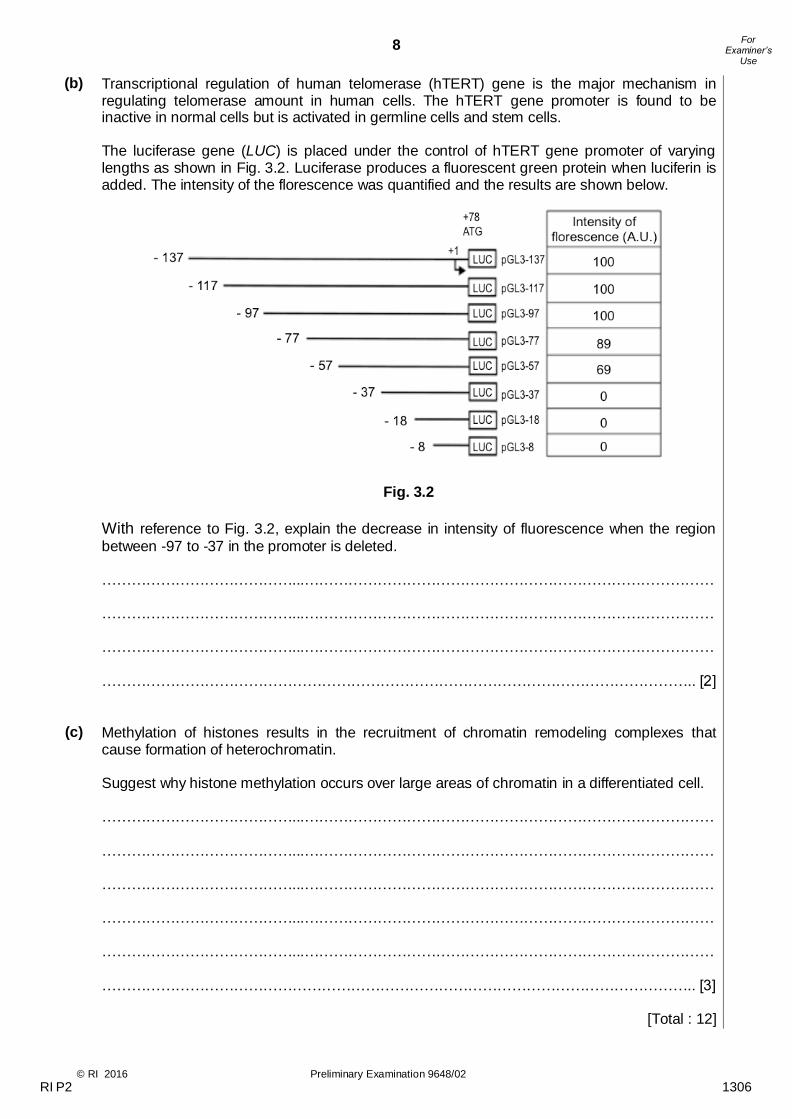
(b) Transcriptional regulation of human telomerase (hTERT) gene is the major mechanism in regulating telomerase amount in human cells. The hTERT gene promoter is found to be inactive in normal cells but is activated in germline cells and stem cells. The luciferase gene (LUC) is placed under the control of hTERT gene promoter of varying lengths as shown in Fig. 3.2. Luciferase produces a fluorescent green protein when luciferin is added. The intensity of the florescence was quantified and the results are shown below.
Fig. 3.2
With reference to Fig. 3.2, explain the decrease in intensity of fluorescence when the region
between -97 to -37 in the promoter is deleted.
…………………………………...………………………………………………………………………… …………………………………...………………………………………………………………………… …………………………………...………………………………………………………………………… ………………………………………………………………………………………………………….. [2]
(c) Methylation of histones results in the recruitment of chromatin remodeling complexes that
cause formation of heterochromatin. Suggest why histone methylation occurs over large areas of chromatin in a differentiated cell.
…………………………………...………………………………………………………………………… …………………………………...………………………………………………………………………… …………………………………...………………………………………………………………………… …………………………………...………………………………………………………………………… …………………………………...………………………………………………………………………… ………………………………………………………………………………………………………….. [3]
[Total : 12]
RI P2 1306
9
© RI 2016 Preliminary Examination 9648/02 [Turn over
For Examiner’s
Use
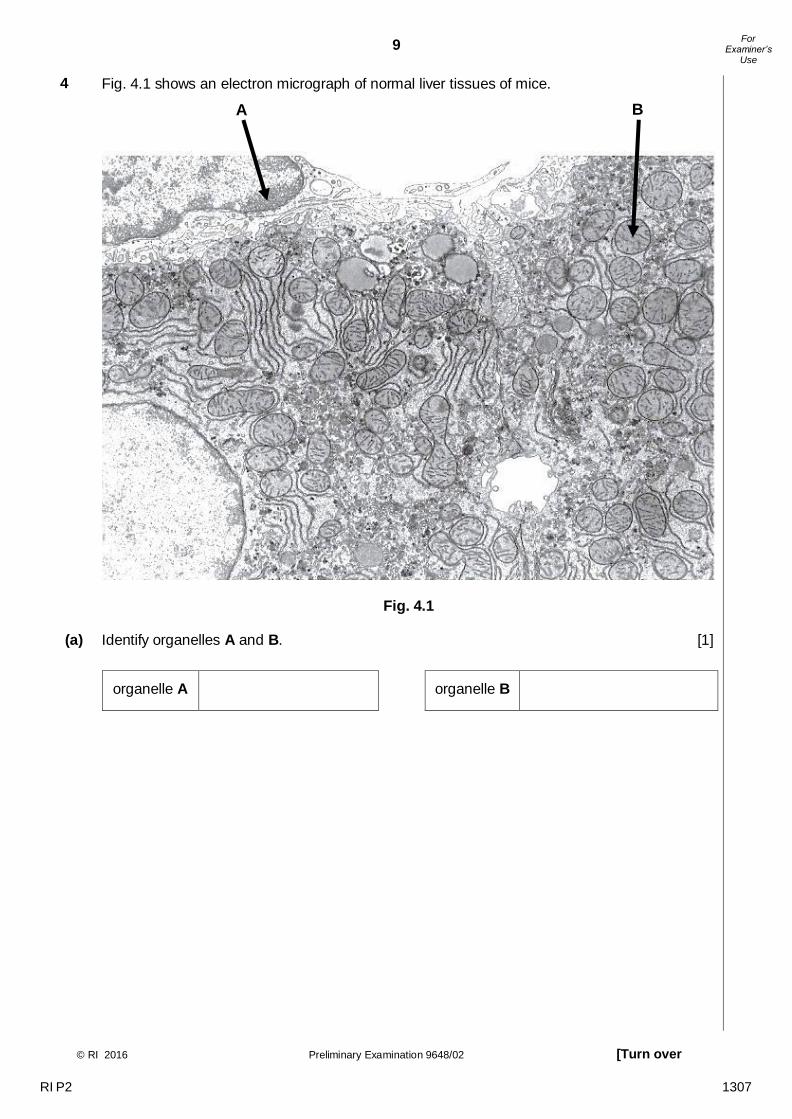
4 Fig. 4.1 shows an electron micrograph of normal liver tissues of mice.
Fig. 4.1
(a) Identify organelles A and B. [1]
organelle A
organelle B
A B
RI P2 1307
10
© RI 2016 Preliminary Examination 9648/02
For Examiner’s
Use
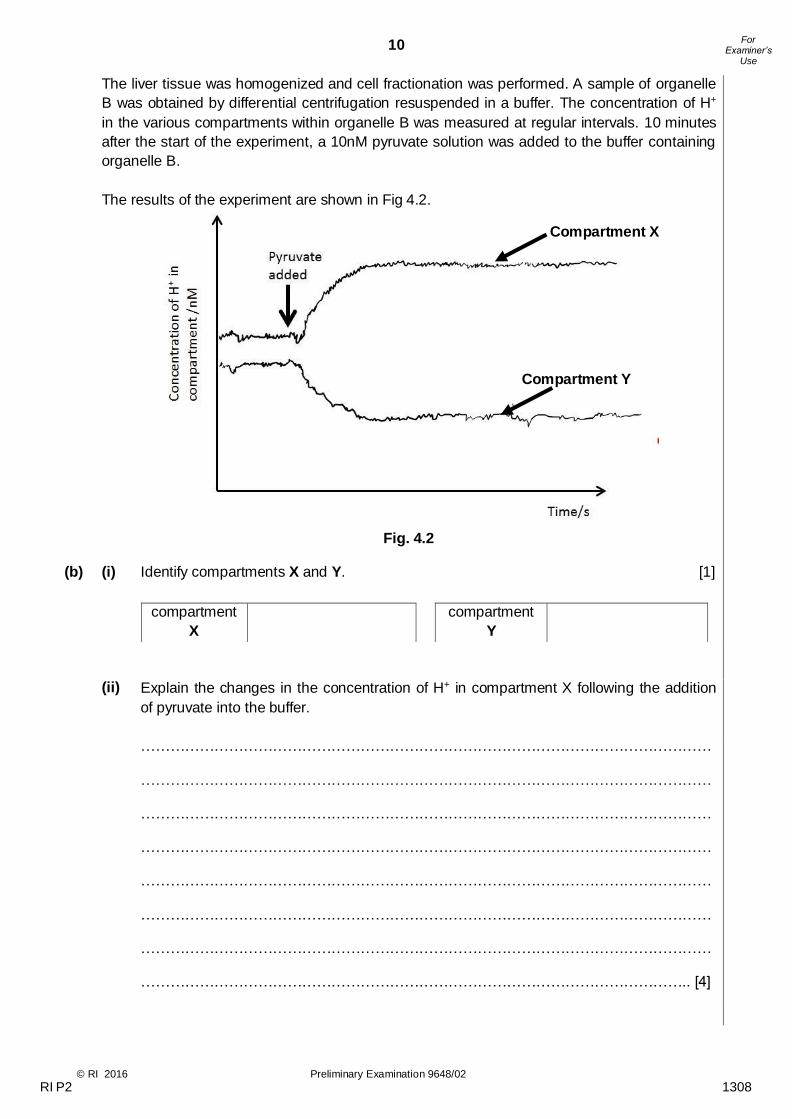
The liver tissue was homogenized and cell fractionation was performed. A sample of organelle
B was obtained by differential centrifugation resuspended in a buffer. The concentration of H+
in the various compartments within organelle B was measured at regular intervals. 10 minutes
after the start of the experiment, a 10nM pyruvate solution was added to the buffer containing
organelle B.
The results of the experiment are shown in Fig 4.2.
Fig. 4.2
(b) (i) Identify compartments X and Y. [1]
compartment
X
compartment
Y
(ii) Explain the changes in the concentration of H+ in compartment X following the addition
of pyruvate into the buffer.
……………………………………………………………………………………………………… ……………………………………………………………………………………………………… ……………………………………………………………………………………………………… ……………………………………………………………………………………………………… ……………………………………………………………………………………………………… ……………………………………………………………………………………………………… ……………………………………………………………………………………………………… ………………………………………………………………………………………………….. [4]
Compartment X
Compartment Y
RI P2 1308
11
© RI 2016 Preliminary Examination 9648/02 [Turn over
For Examiner’s
Use
(c) A metabolic poison, 2,4-dinitrochlorobenzene (2DNP), acts as a proton ionophore, an agent that can transport protons across biological membranes down a concentration gradient.
(i) The experiment was repeated in the presence of high concentration of 2DNP. Sketch on
Fig 4.2, a graph that shows the concentration of H+ in compartment Y in the presence of
2DNP. [1]
(ii) Explain the effect of 2DNP on ATP synthesis.
……………………………………………………………………………………………………… ……………………………………………………………………………………………………… ……………………………………………………………………………………………………… ……………………………………………………………………………………………………… ……………………………………………………………………………………………………… ……………………………………………………………………………………………………… …………………………………………………………………………………………………... [3]
(d) Compare the production of ATP in photophosphorylation and oxidative phosphorylation.
…………………………………...………………………………………………………………………… …………………………………...………………………………………………………………………… …………………………………...………………………………………………………………………… …………………………………...………………………………………………………………………… …………………………………...………………………………………………………………………… …………………………………...………………………………………………………………………… …………………………………...………………………………………………………………………… ………………………………………………………………………………………………………….. [3]
[Total : 13]
RI P2 1309
12
© RI 2016 Preliminary Examination 9648/02
For Examiner’s
Use
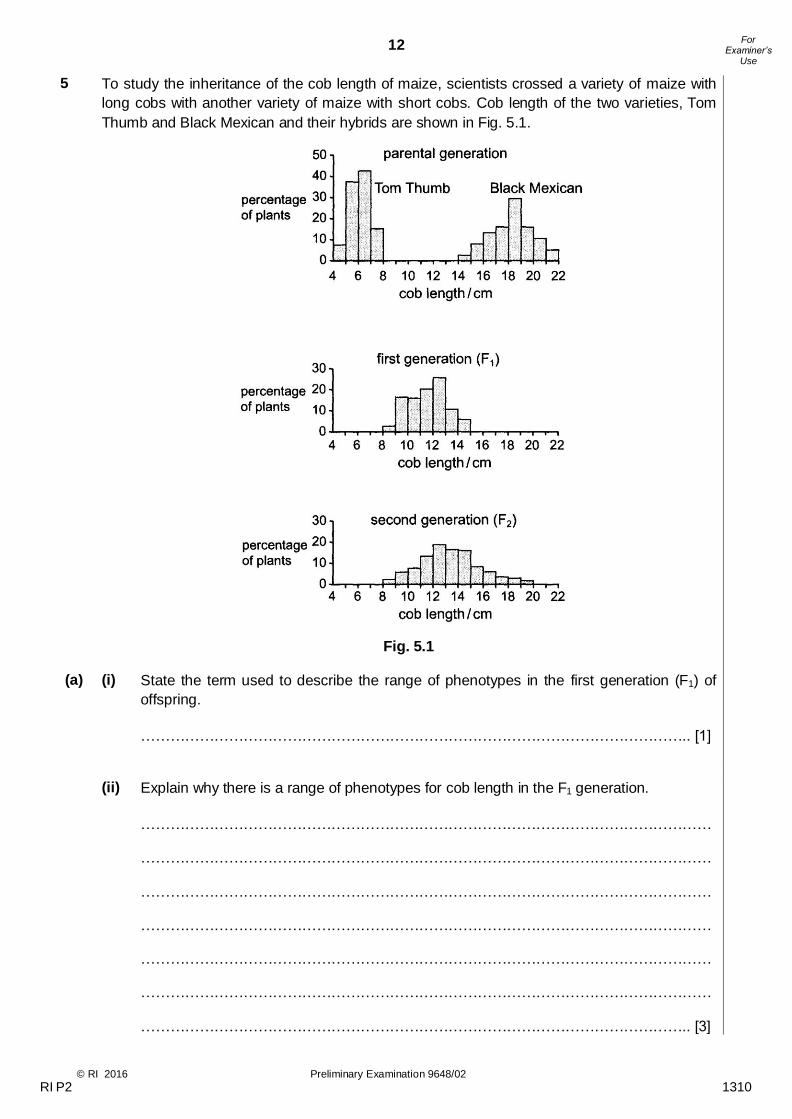
5 To study the inheritance of the cob length of maize, scientists crossed a variety of maize with
long cobs with another variety of maize with short cobs. Cob length of the two varieties, Tom
Thumb and Black Mexican and their hybrids are shown in Fig. 5.1.
Fig. 5.1
(a) (i) State the term used to describe the range of phenotypes in the first generation (F1) of
offspring.
………………………………………………………………………………………………….. [1]
(ii) Explain why there is a range of phenotypes for cob length in the F1 generation.
……………………………………………………………………………………………………… ……………………………………………………………………………………………………… ……………………………………………………………………………………………………… ……………………………………………………………………………………………………… ……………………………………………………………………………………………………… ……………………………………………………………………………………………………… ………………………………………………………………………………………………….. [3]
RI P2 1310
13
© RI 2016 Preliminary Examination 9648/02 [Turn over
For Examiner’s
Use
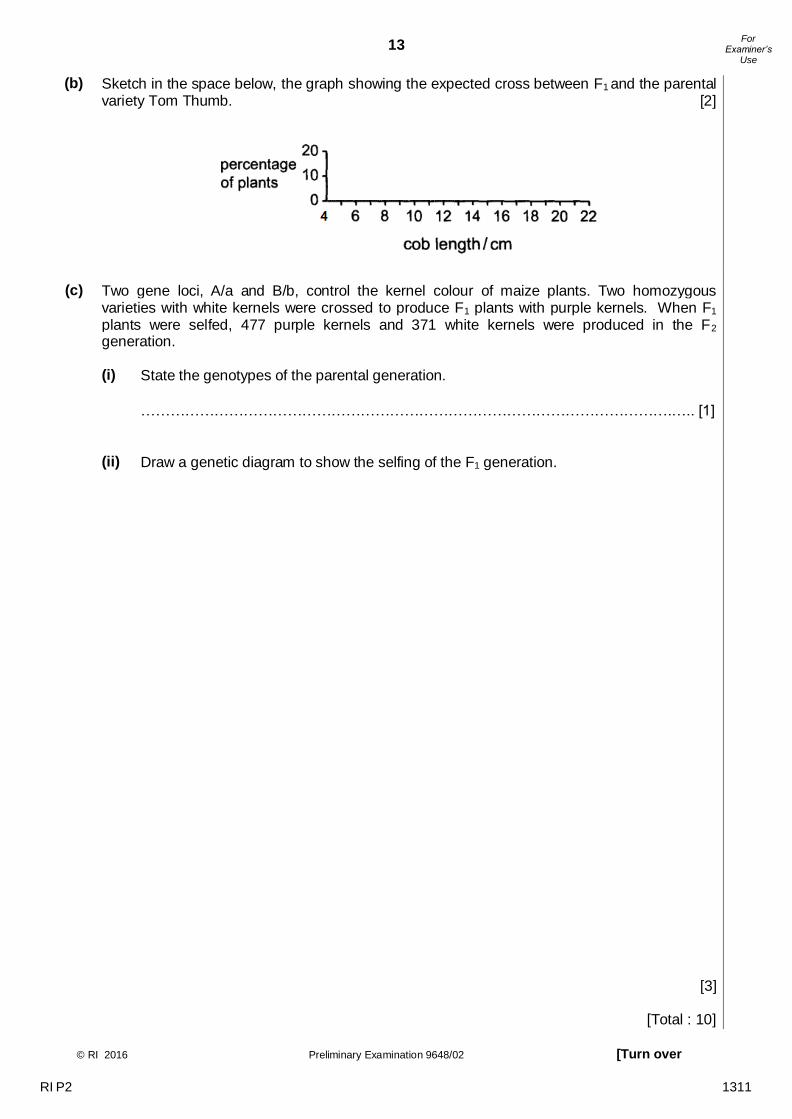
(b) Sketch in the space below, the graph showing the expected cross between F1 and the parental variety Tom Thumb. [2]
(c) Two gene loci, A/a and B/b, control the kernel colour of maize plants. Two homozygous
varieties with white kernels were crossed to produce F1 plants with purple kernels. When F1 plants were selfed, 477 purple kernels and 371 white kernels were produced in the F2 generation.
(i) State the genotypes of the parental generation.
……………………………………………………………………………………………….….. [1]
(ii) Draw a genetic diagram to show the selfing of the F1 generation.
[3]
[Total : 10]
RI P2 1311
14
© RI 2016 Preliminary Examination 9648/02
For Examiner’s
Use
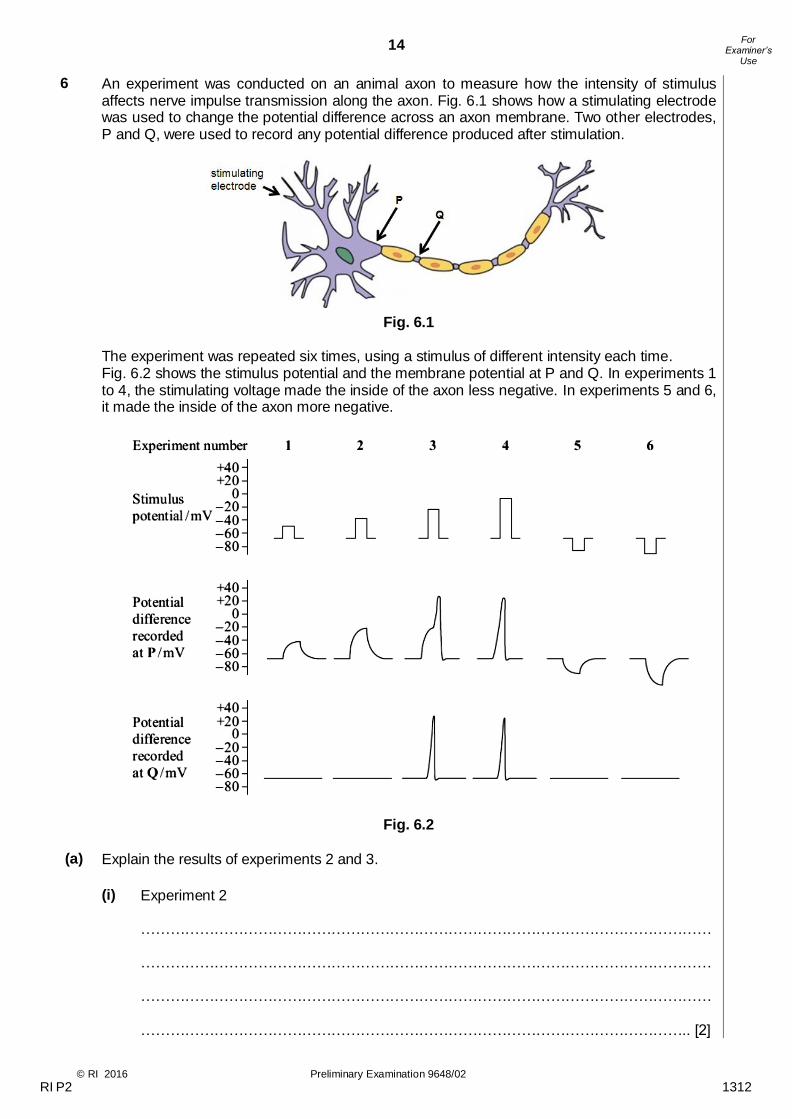
6 An experiment was conducted on an animal axon to measure how the intensity of stimulus affects nerve impulse transmission along the axon. Fig. 6.1 shows how a stimulating electrode was used to change the potential difference across an axon membrane. Two other electrodes, P and Q, were used to record any potential difference produced after stimulation.
Fig. 6.1
The experiment was repeated six times, using a stimulus of different intensity each time. Fig. 6.2 shows the stimulus potential and the membrane potential at P and Q. In experiments 1 to 4, the stimulating voltage made the inside of the axon less negative. In experiments 5 and 6, it made the inside of the axon more negative.
Fig. 6.2
(a) Explain the results of experiments 2 and 3.
(i) Experiment 2
……………………………………………………………………………………………………… ……………………………………………………………………………………………………… ……………………………………………………………………………………………………… ………………………………………………………………………………………………….. [2]
RI P2 1312
15
© RI 2016 Preliminary Examination 9648/02 [Turn over
For Examiner’s
Use
(ii) Experiment 3
……………………………………………………………………………………………………… ……………………………………………………………………………………………………… ……………………………………………………………………………………………………… ……………………………………………………………………………………………………… ……………………………………………………………………………………………………… ………………………………………………………………………………………………….. [3]
(b) Suggest one significance of the refractory period.
……………………………………………..……………………………………………………………… ………………………………………………………………………………………………………….. [1]
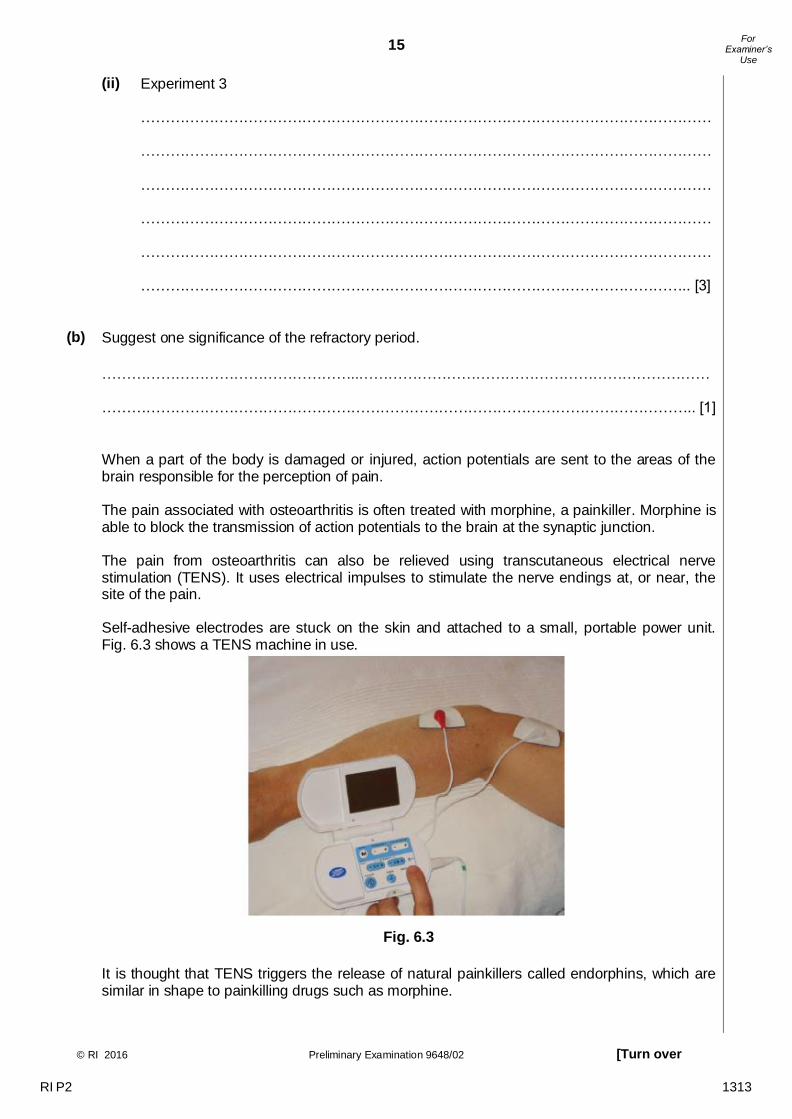
When a part of the body is damaged or injured, action potentials are sent to the areas of the
brain responsible for the perception of pain. The pain associated with osteoarthritis is often treated with morphine, a painkiller. Morphine is able to block the transmission of action potentials to the brain at the synaptic junction. The pain from osteoarthritis can also be relieved using transcutaneous electrical nerve stimulation (TENS). It uses electrical impulses to stimulate the nerve endings at, or near, the site of the pain. Self-adhesive electrodes are stuck on the skin and attached to a small, portable power unit. Fig. 6.3 shows a TENS machine in use.
Fig. 6.3
It is thought that TENS triggers the release of natural painkillers called endorphins, which are similar in shape to painkilling drugs such as morphine.
RI P2 1313

16
© RI 2016 Preliminary Examination 9648/02
For Examiner’s
Use
Fig. 6.4 shows synapses in a pain pathway from a damaged joint to the brain.
Fig. 6.4
(c) Using your knowledge of synaptic transmission and with reference to Fig. 6.4, describe how impulse from the TENS machine can help to reduce pain.
…………………………………...………………………………………………………………………… …………………………………...………………………………………………………………………… …………………………………...………………………………………………………………………… …………………………………...………………………………………………………………………… …………………………………...………………………………………………………………………… …………………………………...………………………………………………………………………… …………………………………...………………………………………………………………………… ………………………………………………………………………………………………………….. [4]
(d) The acetylcholine (ACh) receptor is a type of G-protein-linked receptor. When acetylcholine
binds to it, the receptor will activate an attached G protein. The activated G protein translocates along the cytoplasmic side of the membrane and activates a membrane-bound adenylyl cyclase. Explain the role of adenylyl cyclase in signal transduction that leads to a response in the postsynaptic neurone.
…………………………………...………………………………………………………………………… …………………………………...………………………………………………………………………… …………………………………...………………………………………………………………………… ………………………………………………………………………………………………………….. [2]
[Total : 12]
RI P2 1314
17
© RI 2016 Preliminary Examination 9648/02 [Turn over
For Examiner’s
Use
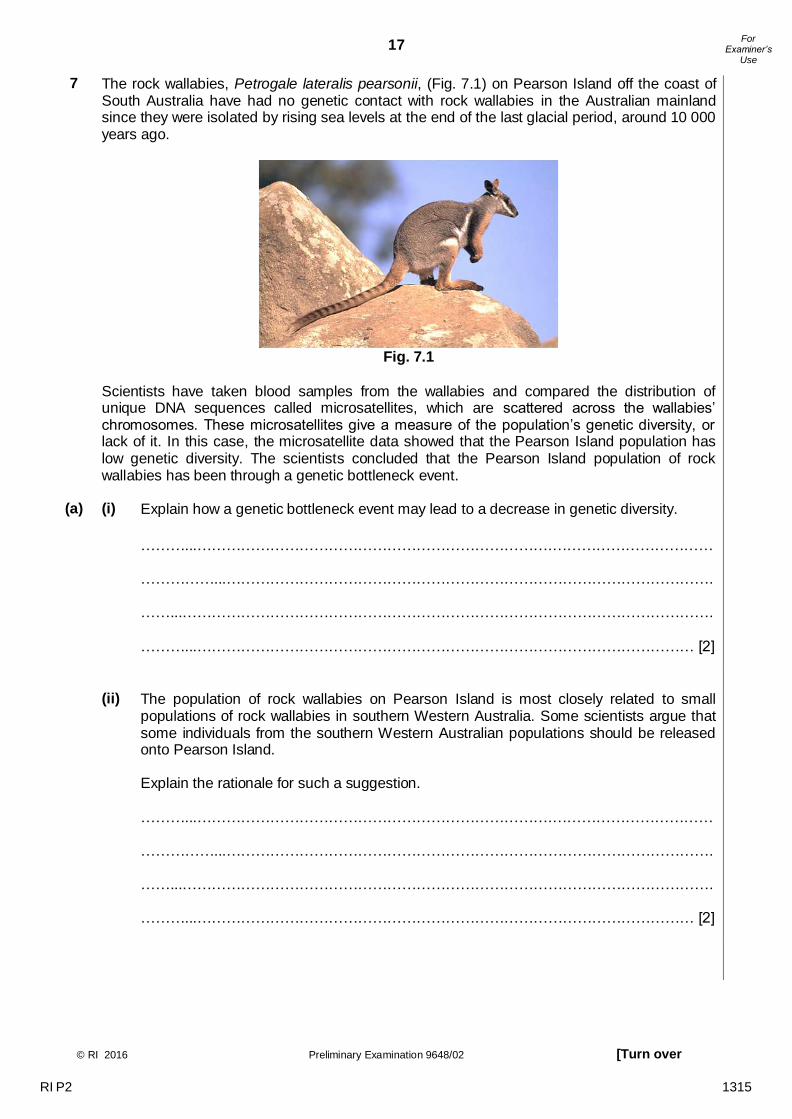
7 The rock wallabies, Petrogale lateralis pearsonii, (Fig. 7.1) on Pearson Island off the coast of South Australia have had no genetic contact with rock wallabies in the Australian mainland since they were isolated by rising sea levels at the end of the last glacial period, around 10 000 years ago.
Fig. 7.1
Scientists have taken blood samples from the wallabies and compared the distribution of unique DNA sequences called microsatellites, which are scattered across the wallabies’ chromosomes. These microsatellites give a measure of the population’s genetic diversity, or lack of it. In this case, the microsatellite data showed that the Pearson Island population has low genetic diversity. The scientists concluded that the Pearson Island population of rock wallabies has been through a genetic bottleneck event.
(a) (i) Explain how a genetic bottleneck event may lead to a decrease in genetic diversity.
………...……………………………………………………………….…………………………… ……………...………………………………………………………………………………………. ……...………………………………………………………………………………………………. ………...………………………………………………………………………………………… [2]
(ii) The population of rock wallabies on Pearson Island is most closely related to small
populations of rock wallabies in southern Western Australia. Some scientists argue that some individuals from the southern Western Australian populations should be released onto Pearson Island. Explain the rationale for such a suggestion.
………...……………………………………………………………….…………………………… ……………...………………………………………………………………………………………. ……...………………………………………………………………………………………………. ………...………………………………………………………………………………………… [2]
RI P2 1315
18
© RI 2016 Preliminary Examination 9648/02
For Examiner’s
Use
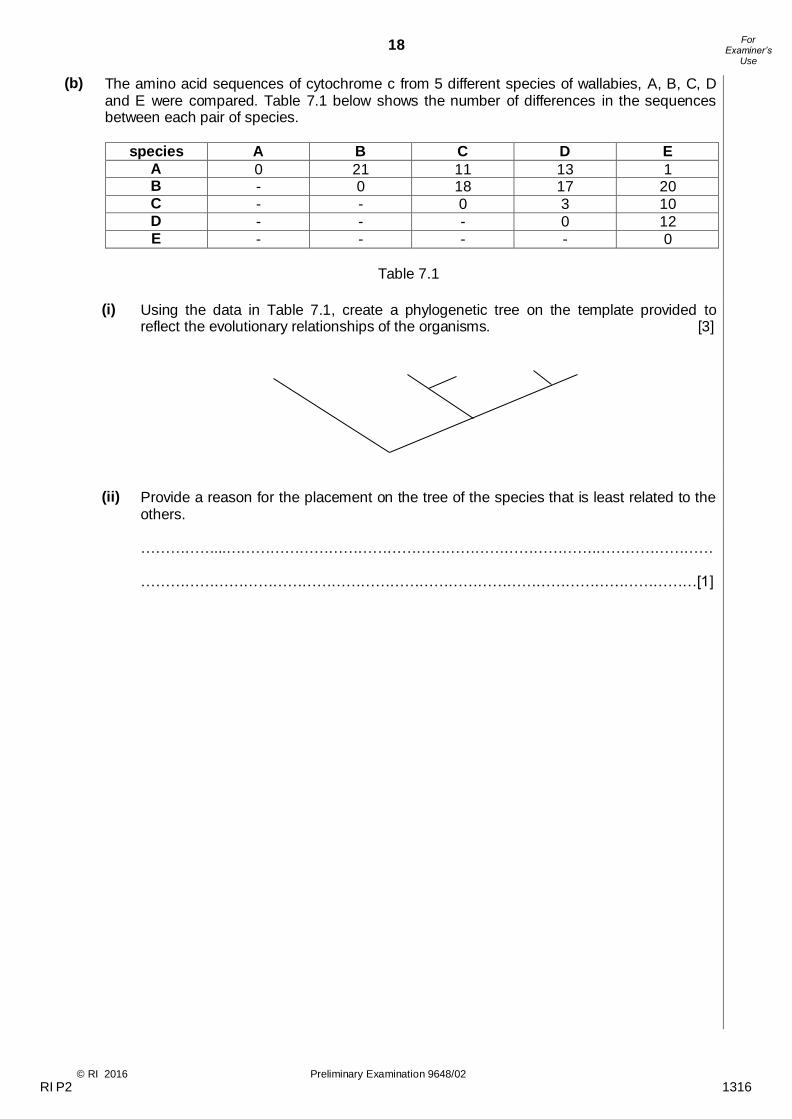
(b) The amino acid sequences of cytochrome c from 5 different species of wallabies, A, B, C, D and E were compared. Table 7.1 below shows the number of differences in the sequences between each pair of species.
species A B C D E
A 0 21 11 13 1 B - 0 18 17 20 C - - 0 3 10 D - - - 0 12 E - - - - 0
Table 7.1
(i) Using the data in Table 7.1, create a phylogenetic tree on the template provided to
reflect the evolutionary relationships of the organisms. [3]
(ii) Provide a reason for the placement on the tree of the species that is least related to the
others.
……………...………………………………………………………………….…………………… ……………………………………………………………………………………………………[1]
RI P2 1316
19
© RI 2016 Preliminary Examination 9648/02 [Turn over
For Examiner’s
Use
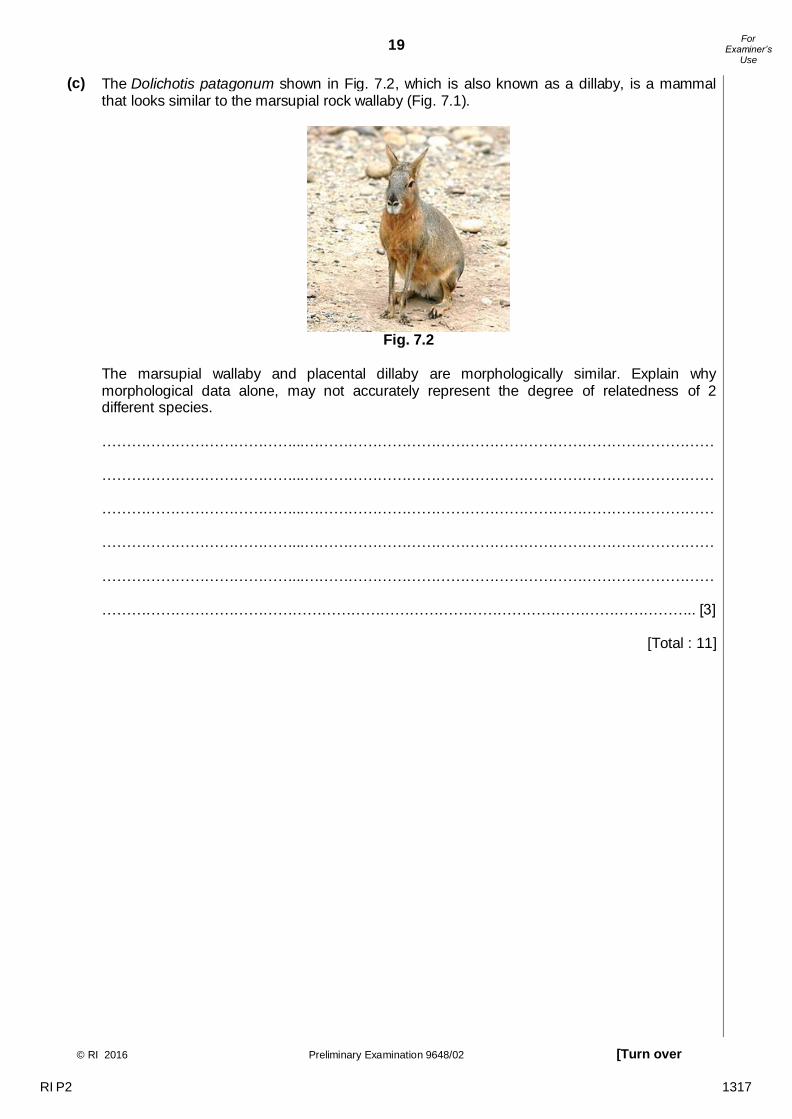
(c) The Dolichotis patagonum shown in Fig. 7.2, which is also known as a dillaby, is a mammal that looks similar to the marsupial rock wallaby (Fig. 7.1).
Fig. 7.2
The marsupial wallaby and placental dillaby are morphologically similar. Explain why morphological data alone, may not accurately represent the degree of relatedness of 2 different species.
…………………………………...………………………………………………………………………… …………………………………...………………………………………………………………………… …………………………………...………………………………………………………………………… …………………………………...………………………………………………………………………… …………………………………...………………………………………………………………………… ………………………………………………………………………………………………………….. [3]
[Total : 11]
RI P2 1317
20
© RI 2016 Preliminary Examination 9648/02
For Examiner’s
Use
Section B Answer EITHER 8 OR 9.
Write your answers on the separate answer paper provided.
Your answers should be illustrated by large, clearly labeled diagrams, where appropriate.
Your answers must be in continuous prose, where appropriate.
Your answers must be set out in sections (a), (b) etc., as indicated in the question.
8 (a) Compare the structure of cellulose with that of collagen. [6]
(b) Explain how enzymes speed up reactions. [6]
(c) Discuss the role of proteins in insulin signalling. [8]
[Total: 20]
9 (a) Describe how genetic variation can arise in a population of bacteria. [6]
(b) Outline the advantages of using mitochondrial DNA in creating phylogenetic trees.
[6]
(c) With reference to the structure of ribosome, describe the role of the ribosome in translation.
[8]
[Total: 20]
End of Paper
RI P2 1318
21
© RI 2016 Preliminary Examination 9648/02 [Turn over
For Examiner’s
Use
Phage D
Phage A Phage B
Phage C
RI P2 1319
© RI 2016 Preliminary Examination 9648/03 [Turn over
2016 Year 6 Preliminary Examination Higher 2
BIOLOGY 9648/03
Paper 3 20th September 2016
2 hours
Additional materials: Answer paper
READ THESE INSTRUCTIONS FIRST
Write your index number, CT group & name on all the work you hand in. Write in dark blue or black pen on both sides of the paper. You may use a soft pencil for any diagrams, graphs or rough working. Do not use staples, paper clips, highlighters, glue or correction fluid.
Answer all questions.
At the end of the examination, hand in your planning question (question 4) and essay question (question 5) SEPARATELY.
The number of marks is given in brackets [ ] at the end of each question or part question.
This document consists of 12 printed pages.
CIVICS GROUP
CANDIDATE NAME
INDEX NUMBER
6 S 0 3 1
Raffles Institution Internal Examination
For Examiner’s Use
Section A
1 /14
2 /13
3 /13
4 /12
5 /20
Total /72
RI P3 1320
2
© RI 2016 Preliminary Examination 9648/03
For Examiner’s
Use
Section A
Answer all the questions in this section.
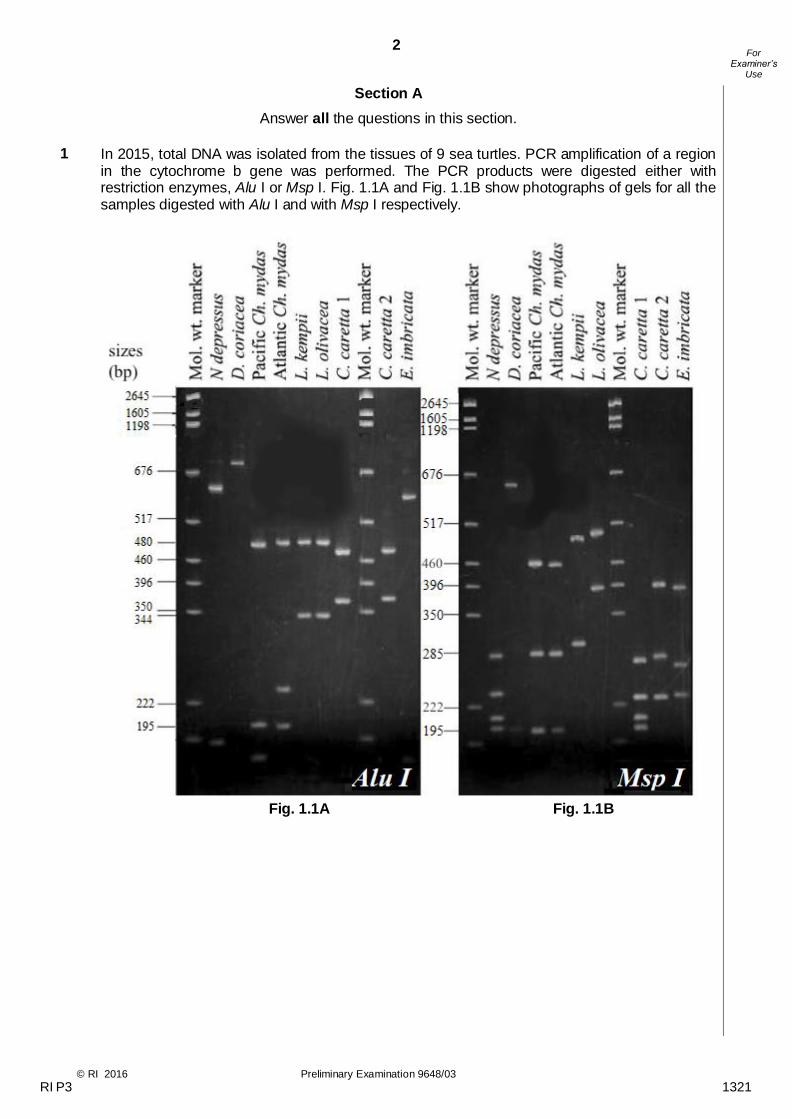
1 In 2015, total DNA was isolated from the tissues of 9 sea turtles. PCR amplification of a region
in the cytochrome b gene was performed. The PCR products were digested either with restriction enzymes, Alu I or Msp I. Fig. 1.1A and Fig. 1.1B show photographs of gels for all the samples digested with Alu I and with Msp I respectively.
Fig. 1.1A Fig. 1.1B
RI P3 1321
3
© RI 2016 Preliminary Examination 9648/03 [Turn over
For Examiner’s
Use
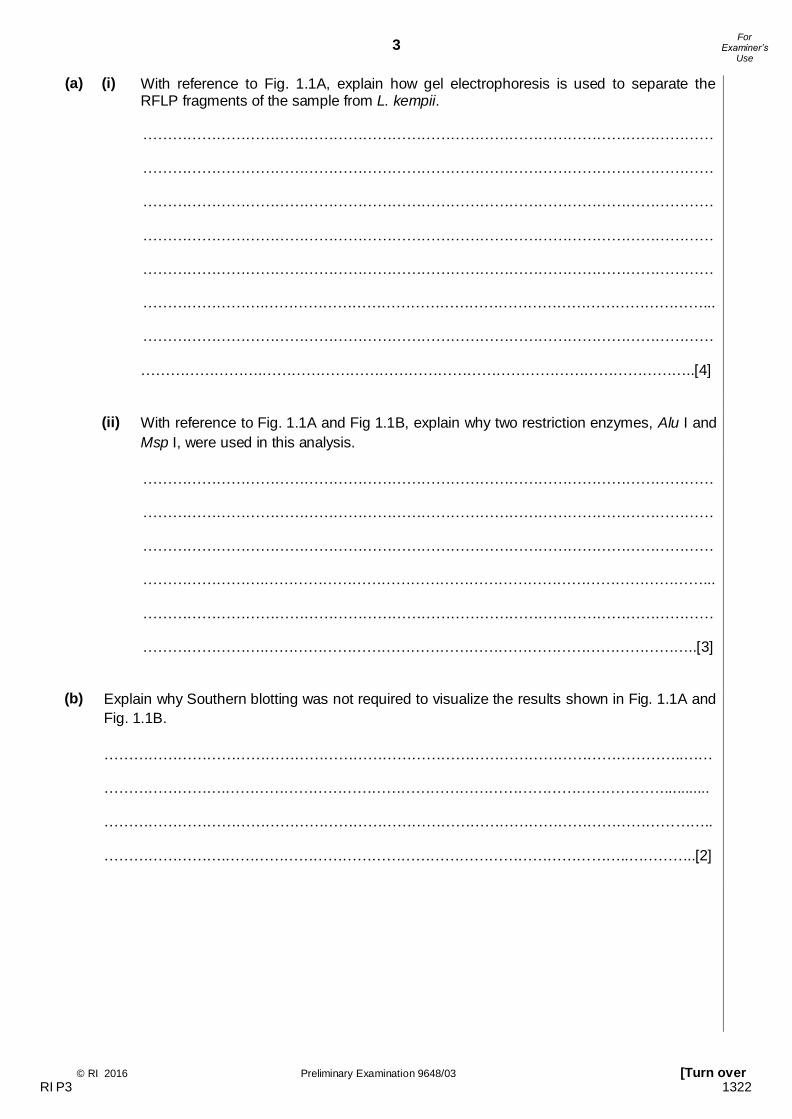
(a) (i) With reference to Fig. 1.1A, explain how gel electrophoresis is used to separate the RFLP fragments of the sample from L. kempii.
……………………………………………………………………………………………………… ……………………………………………………………………………………………………… ……………………………………………………………………………………………………… ……………………………………………………………………………………………………… ……………………………………………………………………………………………………… …………………….………………………………………………………………………………... ……………………………………………………………………………………………………… …………………….……………………………………………………………………………..[4]
(ii) With reference to Fig. 1.1A and Fig 1.1B, explain why two restriction enzymes, Alu I and
Msp I, were used in this analysis.
……………………………………………………………………………………………………… ……………………………………………………………………………………………………… ……………………………………………………………………………………………………… …………………….………………………………………………………………………………... ……………………………………………………………………………………………………… …………………….……………………………………………………………………………..[3]
(b) Explain why Southern blotting was not required to visualize the results shown in Fig. 1.1A and
Fig. 1.1B.
………………………………………………………………………………………………………..…… …………………….………………………………………………………………………………........... …………………………………………………………………………………………………………….. …………………….………………………………………………………………………..…………..[2]
RI P3 1322
4
© RI 2016 Preliminary Examination 9648/03
For Examiner’s
Use
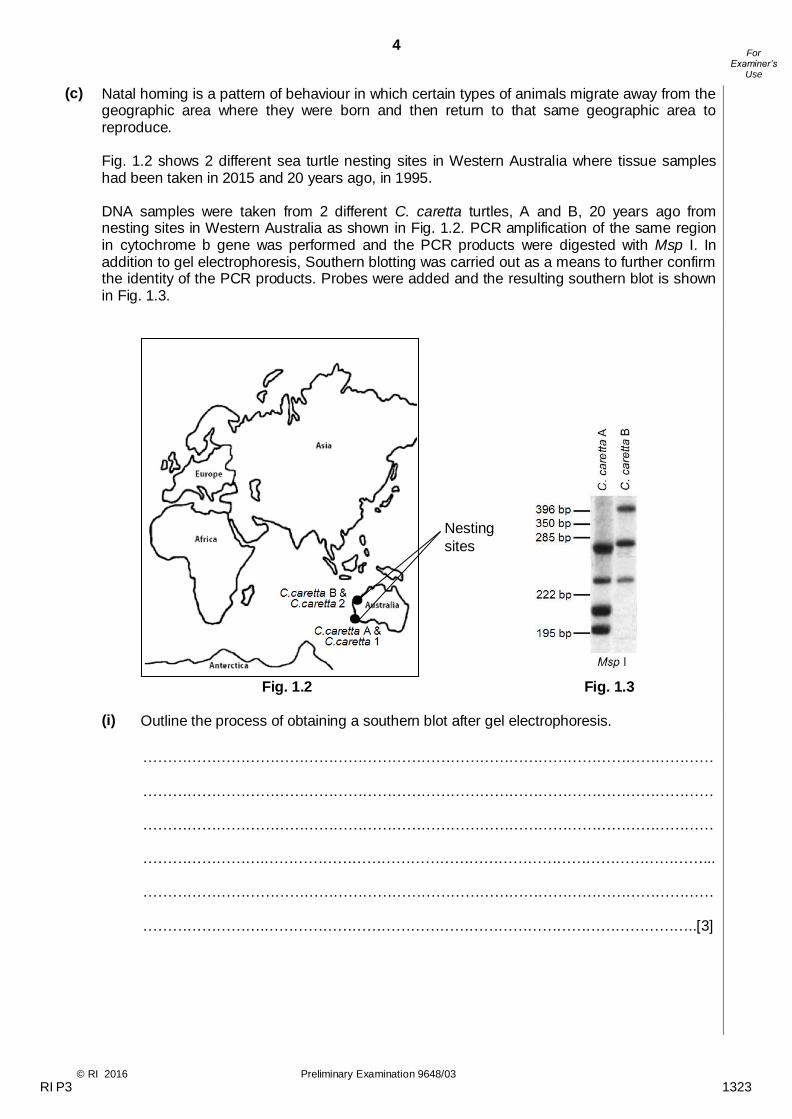
(c) Natal homing is a pattern of behaviour in which certain types of animals migrate away from the geographic area where they were born and then return to that same geographic area to reproduce. Fig. 1.2 shows 2 different sea turtle nesting sites in Western Australia where tissue samples had been taken in 2015 and 20 years ago, in 1995. DNA samples were taken from 2 different C. caretta turtles, A and B, 20 years ago from nesting sites in Western Australia as shown in Fig. 1.2. PCR amplification of the same region in cytochrome b gene was performed and the PCR products were digested with Msp I. In addition to gel electrophoresis, Southern blotting was carried out as a means to further confirm the identity of the PCR products. Probes were added and the resulting southern blot is shown in Fig. 1.3.
Fig. 1.2 Fig. 1.3
(i) Outline the process of obtaining a southern blot after gel electrophoresis.
……………………………………………………………………………………………………… ……………………………………………………………………………………………………… ……………………………………………………………………………………………………… …………………….………………………………………………………………………………... ……………………………………………………………………………………………………… …………………….……………………………………………………………………………..[3]
Nesting
sites
RI P3 1323
5
© RI 2016 Preliminary Examination 9648/03 [Turn over
For Examiner’s
Use
(ii) DNA samples of C. caretta A and C. caretta B were extracted 20 years ago in 1995, while DNA samples of C. caretta 1 and C. caretta 2 were extracted in 2015. These DNA samples were digested with Msp I (as shown in Fig. 1.3).
Suggest how the information provided in Fig. 1.1B, 1.2 and 1.3 could prove the hypothesis of natal homing in sea turtles.
……………………………………………………………………………………………………… …………………….………………………………………………………………………………... ……………………………………………………………………………………………………… …………………….……………………………………………………………………………..[2]
[Total: 14]
2 (a) In a person with cystic fibrosis (CF), the decline in lung function and the likelihood of
chronic infections are a result of thickened mucus.
Explain why the lungs of a person with CF can become choked with thick mucus.
……………………………………………………………………………………………………… ……………………………………………………………………………………………………… ……………………………………………………………………………………………………… …………………….………………………………………………………………………………... ……………………………………………………………………………………………………… …………………….……………………………………………………………………………..[3]
(b) The use of a viral-mediated gene delivery system to treat CF showed an increase in
chloride ion (Cl-) transport across the membrane. However, the transport of Cl- across the membrane in the treated cells was significantly lower than that observed in the normal cells. Suggest three reasons for the significantly lower transport of Cl- across the membrane in the treated cells.
……………………………………………………………………………………………………… …………………….………………………………………………………………………………... ……………………………………………………………………………………………………… …………………….………………………………………………………………………………... ……………………………………………………………………………………………………… …………………….……………………………………………………………………………..[3]
RI P3 1324
6
© RI 2016 Preliminary Examination 9648/03
For Examiner’s
Use
(c) In another attempt at gene therapy, the CFTR mRNA was found to be translated only by free ribosomes. In these cells, there was no increase in the transport of Cl- across the membrane. Suggest an explanation for the failure of this attempt at gene therapy.
…………………………………………………………………………………………………………….. …………………….………………………………………………………………………..…………..[1]
(d) Discuss the limitations of the use of liposomes as vectors for gene therapy for CF.
………………………………………………………………………………………………………..…… …………………….………………………………………………………………………………........... …………………………………………………………………………………………………………….. …………………….………………………………………………………………………..…………..[2]
RI P3 1325
7
© RI 2016 Preliminary Examination 9648/03 [Turn over
For Examiner’s
Use
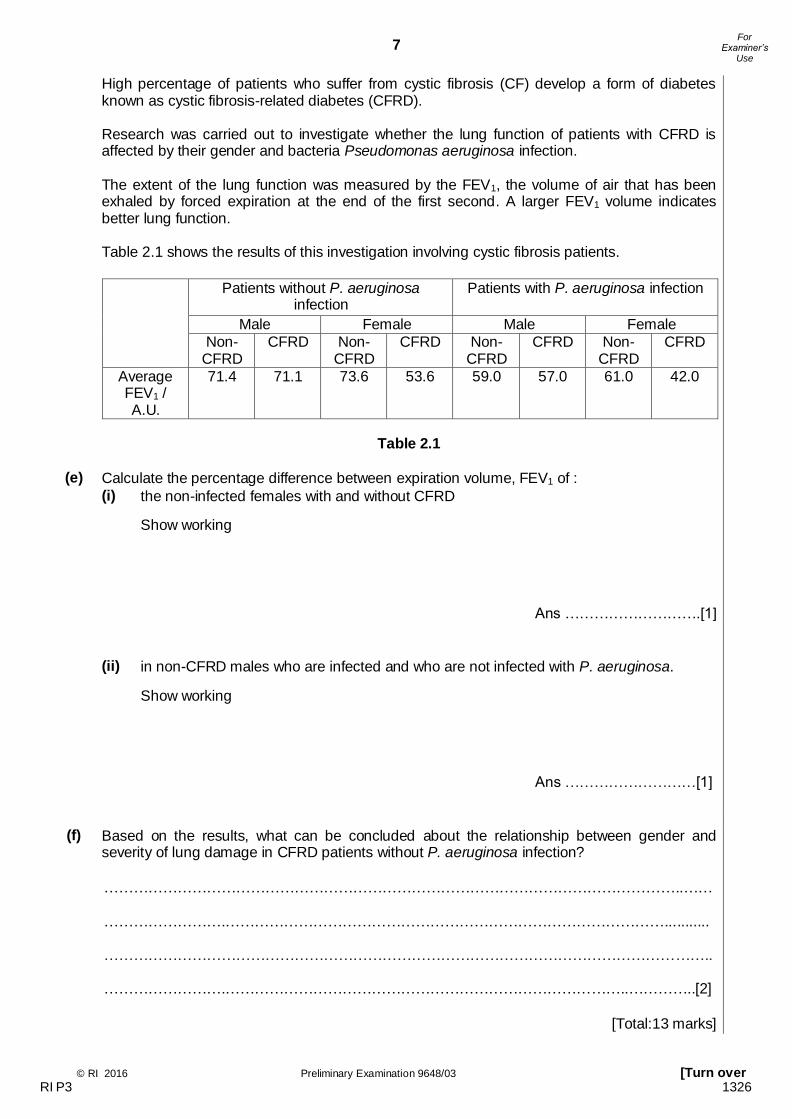
High percentage of patients who suffer from cystic fibrosis (CF) develop a form of diabetes known as cystic fibrosis-related diabetes (CFRD). Research was carried out to investigate whether the lung function of patients with CFRD is affected by their gender and bacteria Pseudomonas aeruginosa infection. The extent of the lung function was measured by the FEV1, the volume of air that has been exhaled by forced expiration at the end of the first second. A larger FEV1 volume indicates better lung function. Table 2.1 shows the results of this investigation involving cystic fibrosis patients.
Patients without P. aeruginosa
infection Patients with P. aeruginosa infection
Male Female Male Female
Non- CFRD
CFRD Non- CFRD
CFRD Non- CFRD
CFRD Non-CFRD
CFRD
Average FEV1 / A.U.
71.4 71.1 73.6 53.6 59.0 57.0 61.0 42.0
Table 2.1
(e) Calculate the percentage difference between expiration volume, FEV1 of : (i) the non-infected females with and without CFRD
Show working
Ans ……………………….[1]
(ii) in non-CFRD males who are infected and who are not infected with P. aeruginosa.
Show working
Ans ………………………[1]
(f) Based on the results, what can be concluded about the relationship between gender and
severity of lung damage in CFRD patients without P. aeruginosa infection?
………………………………………………………………………………………………………..…… …………………….………………………………………………………………………………........... …………………………………………………………………………………………………………….. …………………….………………………………………………………………………..…………..[2]
[Total:13 marks]
RI P3 1326
8
© RI 2016 Preliminary Examination 9648/03
For Examiner’s
Use
3 The lack of vitamin A in the diet is a major problem in the rice-based societies of South-East Asia. Rice seeds lack the enzymes involved in two steps of the pathway for β-carotene
production. The genes coding for these two enzymes were inserted into rice embryos by genetic engineering, giving rise to the Golden Rice prototype. This rice produces seeds containing β -carotene. The inserted genes were: • the psy gene from daffodil plants, • the crt 1 gene from the bacterium Erwinia uredovora.
(a) The following steps were carried out to produce Golden Rice:
step 1: A DNA construct consisting of a rice endosperm-specific promoter and the coding regions of the psy gene and the crt 1 gene was made.
step 2: Copies of this DNA construct were inserted into plasmids isolated from the bacterium, Agrobacterium tumefaciens.
step 3: Agrobacterium tumefaciens transformed with the recombinant plasmids were mixed with rice embryos in tissue culture.
step 4: The embryos were induced to form callus which were grown into plantlets and then plants.
(i) Explain why the endosperm-specific promoter was added to psy and crt 1 in step 1.
……………………………………………………………………………………………………… …………………….………………………………………………………………………………... ……………………………………………………………………………………………………… …………………….……………………………………………………………………………..[2]
(ii) Besides using Agrobacterium-mediated transfer, state one other way that is commonly
used to insert DNA into plant cells.
…………………….……………………………………………………………………………..[1]
(b) Two rice crop farmers have farms adjacent to each other in which they grow rice crop.
• Farmer X wishes to grow GM rice crops that are resistant to a herbicide. • Farmer Y wishes to continue to grow non-GM rice. Farmer Y was concerned, and suggested to farmer X that pollen from the GM rice crop could fertilise the non-GM rice crop.
(i) Suggest why farmer Y might be concerned about the possibility of his crop being fertilised by pollen from farmer X’s crop.
……………………………………………………………………………………………………… …………………….……………………………………………….……………………………..[1]
RI P3 1327
9
© RI 2016 Preliminary Examination 9648/03 [Turn over
For Examiner’s
Use
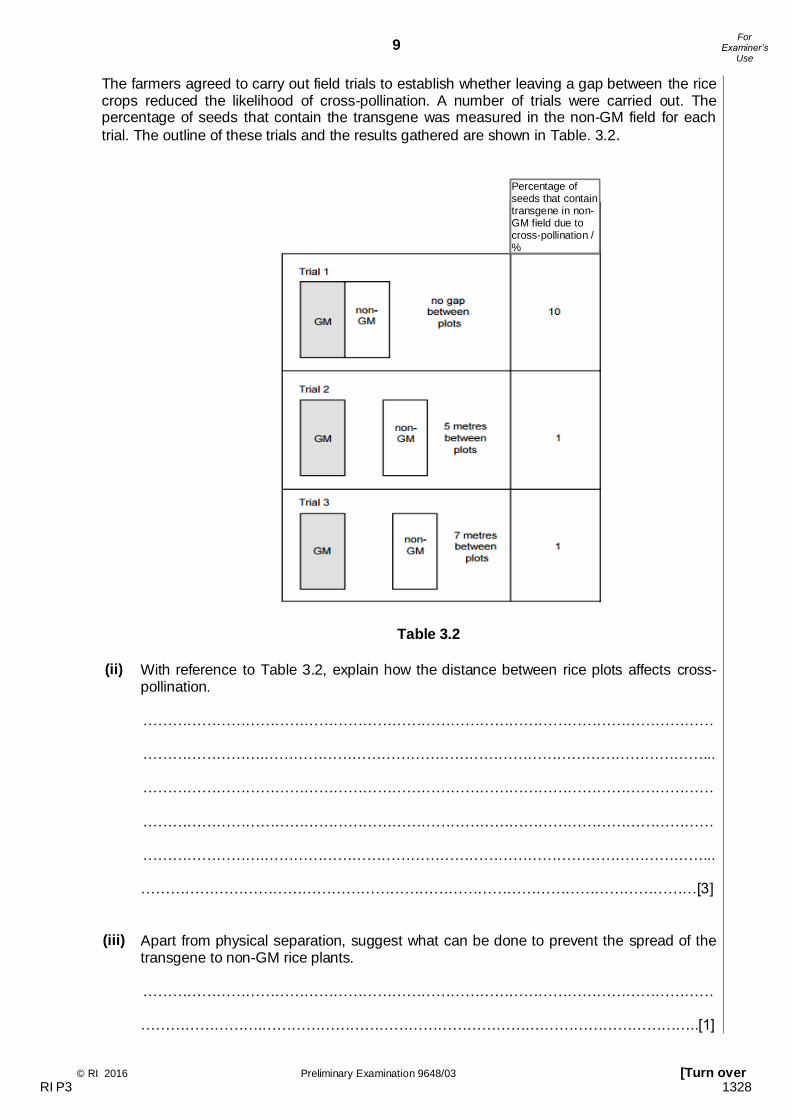
The farmers agreed to carry out field trials to establish whether leaving a gap between the rice crops reduced the likelihood of cross-pollination. A number of trials were carried out. The percentage of seeds that contain the transgene was measured in the non-GM field for each
trial. The outline of these trials and the results gathered are shown in Table. 3.2.
Table 3.2
(ii) With reference to Table 3.2, explain how the distance between rice plots affects cross-
pollination.
……………………………………………………………………………………………………… …………………….………………………………………………………………………………... ……………………………………………………………………………………………………… ……………………………………………………………………………………………………… …………………….………………………………………………………………………………... ……………………………………………………………………………………………………[3]
(iii) Apart from physical separation, suggest what can be done to prevent the spread of the
transgene to non-GM rice plants.
……………………………………………………………………………………………………… …………………….……………………………………………….……………………………..[1]
Percentage of seeds that contain transgene in non-GM field due to cross-pollination / %
RI P3 1328
10
© RI 2016 Preliminary Examination 9648/03
For Examiner’s
Use
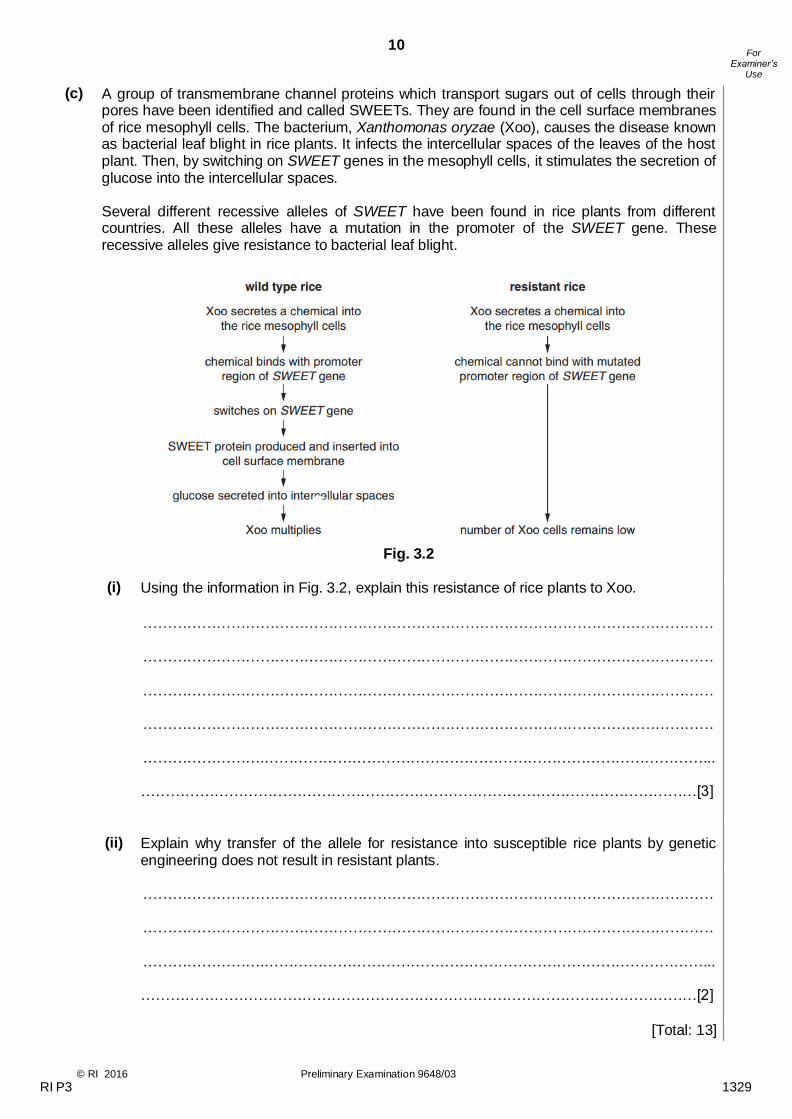
(c) A group of transmembrane channel proteins which transport sugars out of cells through their pores have been identified and called SWEETs. They are found in the cell surface membranes of rice mesophyll cells. The bacterium, Xanthomonas oryzae (Xoo), causes the disease known as bacterial leaf blight in rice plants. It infects the intercellular spaces of the leaves of the host plant. Then, by switching on SWEET genes in the mesophyll cells, it stimulates the secretion of glucose into the intercellular spaces. Several different recessive alleles of SWEET have been found in rice plants from different countries. All these alleles have a mutation in the promoter of the SWEET gene. These recessive alleles give resistance to bacterial leaf blight.
Fig. 3.2
(i) Using the information in Fig. 3.2, explain this resistance of rice plants to Xoo.
……………………………………………………………………………………………………… ……………………………………………………………………………………………………… ……………………………………………………………………………………………………… ……………………………………………………………………………………………………… …………………….………………………………………………………………………………... ……………………………………………………………………………………………………[3]
(ii) Explain why transfer of the allele for resistance into susceptible rice plants by genetic
engineering does not result in resistant plants.
……………………………………………………………………………………………………… ……………………………………………………………………………………………………… …………………….………………………………………………………………………………... ……………………………………………………………………………………………………[2]
[Total: 13]
RI P3 1329

11
© RI 2016 Preliminary Examination 9648/03 [Turn over
For Examiner’s
Use
4 Planning question
Murashige and Skoog (MS) medium is a plant growth medium used in laboratories for plant tissue culture. MS medium is frequently used in combination with different plant growth regulator to stimulate callus, root and shoot formation. This involves adding 1 cm3 of each plant growth regulators, auxin and cytokinin to 10cm3 of molten MS agar medium and poured into petri dishes. You have been given a supply of Ananas comosus callus and molten MS agar medium containing 0.2 mgdm-3 auxin. Using your own knowledge and the given information, design an experiment to investigate the optimum concentration of cytokinin in MS agar medium that can be used to induce shoot formation from Ananas comosus callus. You may select from the following apparatus and chemicals:
callus from Ananas comosus
10 mgdm-3 cytokinin solution
distilled water,
molten MS agar medium containing 0.2 mgdm-3 auxin
80% ethanol
hypochlorite/bleach solution
sterile petri dishes
sterile forceps
sterile scapel
sterile weighing boat
weighing balance
laminar flow cabinet
sterile syringe (1cm3)
sterile syringe (10cm3)
sterile measuring cylinder (10cm3)
ruler
bunsen burner
incubator
normal laboratory glassware (e.g. beakers, measuring cylinders) Your plan should:
have a clear and helpful structure such that the method you use is able to be repeated by anyone reading it,
be illustrated by relevant diagrams, if necessary,
identify the independent and dependent variables,
describe the method with the scientific reasoning used to decide the method so that the results are as accurate and reliable as possible,
show how you will record your results and the proposed layout of results tables and graphs,
use the correct technical and scientific terms,
include reference to safety measures to minimise any risks associated with the proposed experiment.
[Total: 12]
RI P3 1330
12
© RI 2016 Preliminary Examination 9648/03
For Examiner’s
Use
5 Free-response question
Write your answers to this question on the separate answer paper provided. Your answers:
should be illustrated by large, clearly labelled diagrams, where appropriate,
must be in continuous prose, where appropriate,
must be set out in sections (a), (b) etc. as indicated in the question.
(a) Discuss the goals of the human genome project.
[5]
(b) Explain the limitations of the polymerase chain reaction (PCR).
[6]
(c) Describe how stem cells and gene therapy can be used to treat Severe Combined
Immunodeficiency (SCID) due to an autosomal mutation. Include in your answer the
significance of using stem cells for the treatment.
[9]
[Total: 20]
End of Paper
RI P3 1331


![BIOLOGY 9648 / 02 - Papers · 5 . 9648 H2 Biology / Preliminary Exam / Paper 2 (iii) account for your answer in (a)(ii). [3] The movement of chromatids is dependent on spindle fibres,](https://img.pdfslide.us/doc/110x75/5e66f2655393b461541909fe/biology-9648-02-5-9648-h2-biology-preliminary-exam-paper-2-iii-account.jpg)